
芳子 FangZi888
3.3k Posts

芳子 FangZi888
Report
Block User
從小白到大白的路上, 讓我們一起學習成長, 分享的文章都是在幣圈的經驗
BP-363BD654D236
Open Trade

BTC Holder
Frequent Trader
5 Years
3.6K+ Following
2.8K+ Followers
1.2K+ Liked
Posts
Portfolio
All
Quotes
Live
·
--
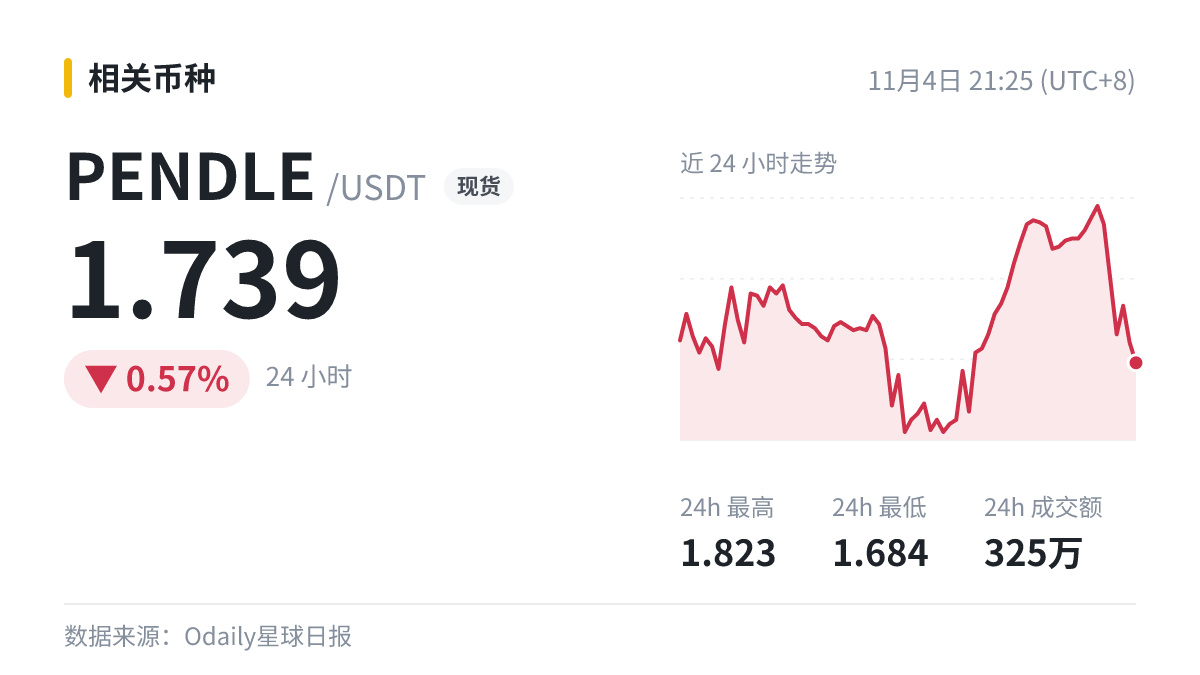
The Mercado Bitcoin hacker is swapping PENDLE for ETH through DeFi platforms such as CowSwap.
My first reaction after reading this: the outlook is bearish. If you’re thinking of buying, wait for the selling pressure to ease.
Here’s my usual approach: don’t rush to chase good news or flee at bad news. Wait and see what the market does first.
$PENDLE
The Mercado Bitcoin hacker is swapping PENDLE for ETH through DeFi platforms such as CowSwap.
My first reaction after reading this: the outlook is bearish. If you’re thinking of buying, wait for the selling pressure to ease.
Here’s my usual approach: don’t rush to chase good news or flee at bad news. Wait and see what the market does first.
$PENDLE
My first reaction after reading this: the outlook is bearish. If you’re thinking of buying, wait for the selling pressure to ease.
Here’s my usual approach: don’t rush to chase good news or flee at bad news. Wait and see what the market does first.
$PENDLE
193
·
--
A note to yourself:
① Wanting to win back your losses immediately is one of the most dangerous thoughts.
② After a loss, wait half an hour before deciding what to do next.
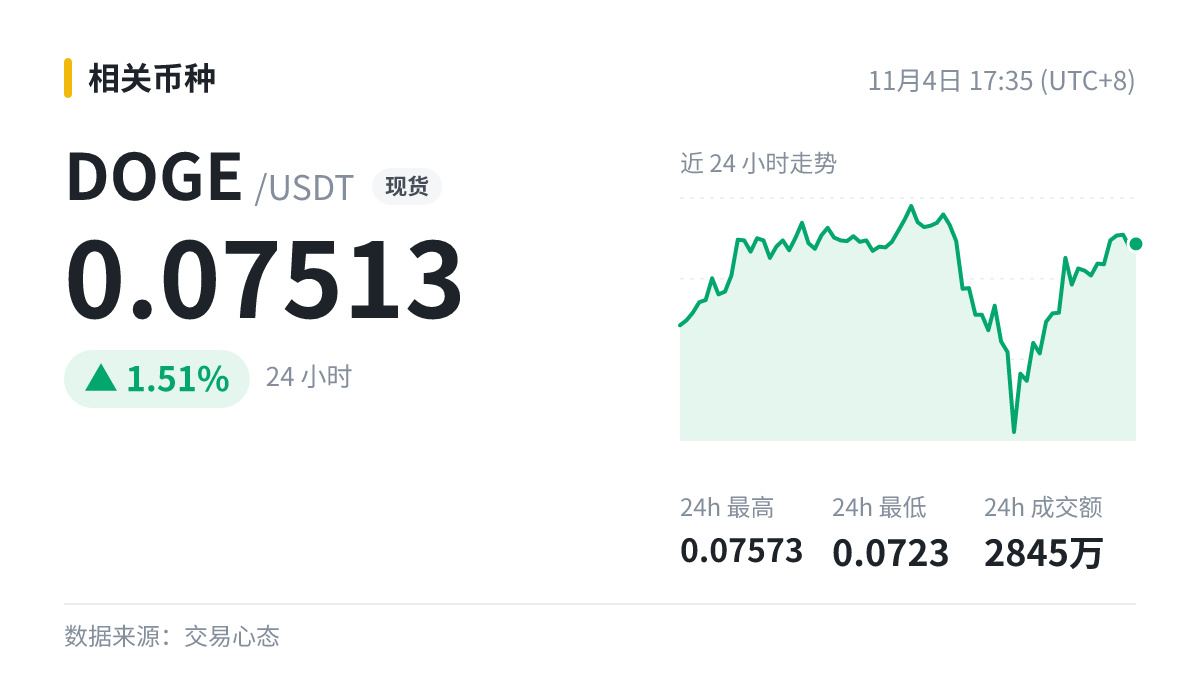
$DOGE now 0.07513 (24h +1.51%)
#DOGE
A note to yourself:
① Wanting to win back your losses immediately is one of the most dangerous thoughts.
② After a loss, wait half an hour before deciding what to do next.
$DOGE now 0.07513 (24h +1.51%)
#DOGE
① Wanting to win back your losses immediately is one of the most dangerous thoughts.
② After a loss, wait half an hour before deciding what to do next.
$DOGE now 0.07513 (24h +1.51%)
#DOGE
1
43
·
--
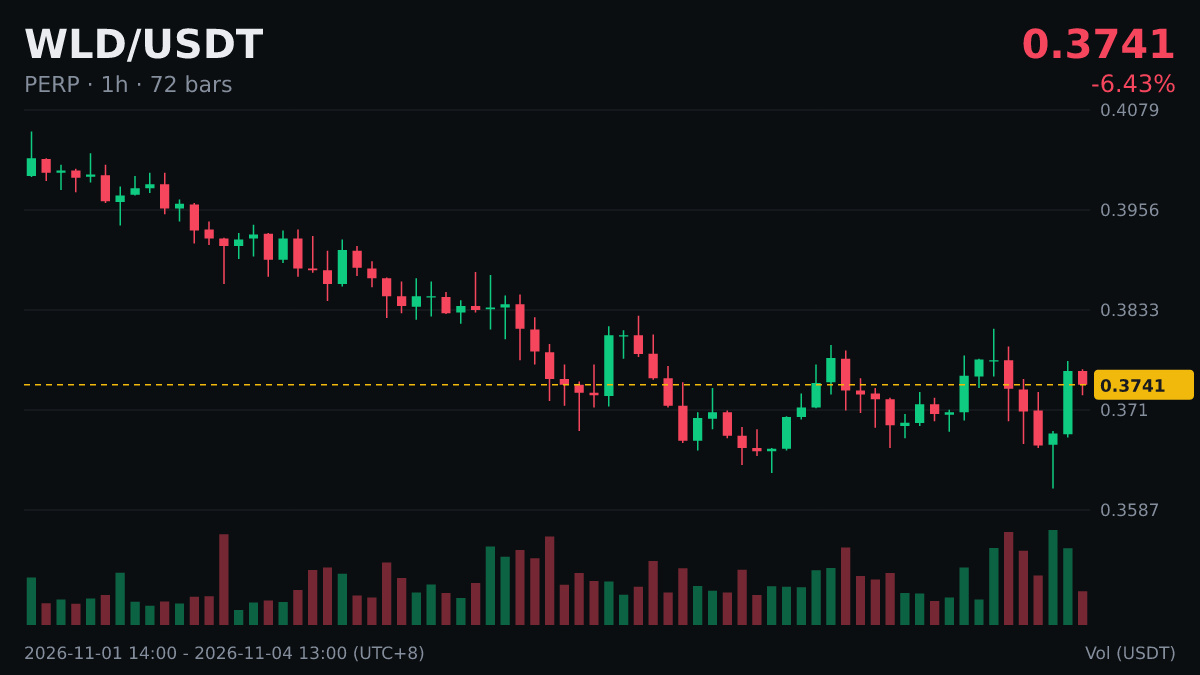
“OpenAI tested 4,000 questions, and AI got 91% of them wrong” has been trending.
$WLD , in the AI concept sector, has drawn attention with this topic—but attention doesn't necessarily mean money is flowing in. What matters is whether trading volume follows.
The thing to watch is whether prices hold on to their gains after the buzz dies down.
“OpenAI tested 4,000 questions, and AI got 91% of them wrong” has been trending.
$WLD , in the AI concept sector, has drawn attention with this topic—but attention doesn't necessarily mean money is flowing in. What matters is whether trading volume follows.
The thing to watch is whether prices hold on to their gains after the buzz dies down.
$WLD , in the AI concept sector, has drawn attention with this topic—but attention doesn't necessarily mean money is flowing in. What matters is whether trading volume follows.
The thing to watch is whether prices hold on to their gains after the buzz dies down.
162
·
--
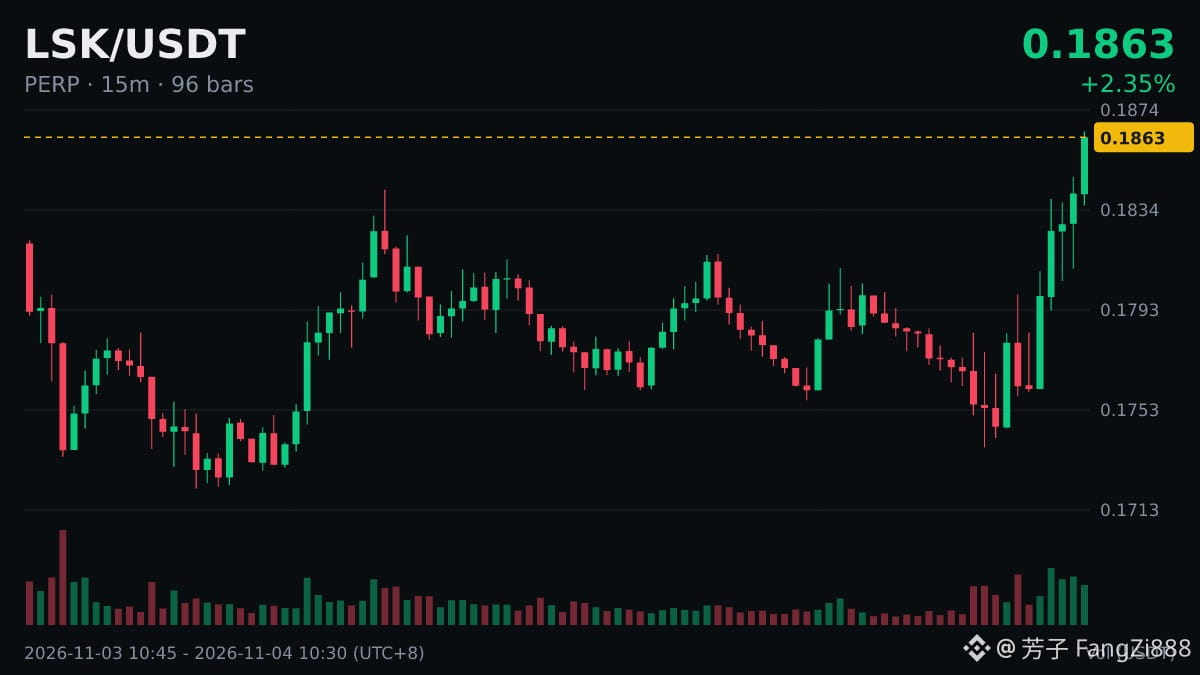
$LSK 24-hour new high, current price 0.188, previous high 0.1842.
After a new high, there are three common patterns:
① Pull back to the previous high without breaking below it, then move up another step: the healthiest pattern
② Repeated back-and-forth near the previous high: consolidation while waiting for direction
③ Quickly fall back below the previous high and fail to reclaim it: a bull trap
Currently above the previous high; watch whether it follows ① or ②.
$LSK 24-hour new high, current price 0.188, previous high 0.1842.
After a new high, there are three common patterns:
① Pull back to the previous high without breaking below it, then move up another step: the healthiest pattern
② Repeated back-and-forth near the previous high: consolidation while waiting for direction
③ Quickly fall back below the previous high and fail to reclaim it: a bull trap
Currently above the previous high; watch whether it follows ① or ②.
After a new high, there are three common patterns:
① Pull back to the previous high without breaking below it, then move up another step: the healthiest pattern
② Repeated back-and-forth near the previous high: consolidation while waiting for direction
③ Quickly fall back below the previous high and fail to reclaim it: a bull trap
Currently above the previous high; watch whether it follows ① or ②.
363
·
--
#BinancePick Binance prediction guru, don't tell me you haven't joined yet
I've already made it into the rewards circle—I'm so happy!
Come join too; the first 20,000 people will get rewards!
[傳送門](https://app.binance.com/uni-qr/prophet?from=share&seasonId=prophet_1019_s1&ref=PQV0WZTQ)
#BinancePick Binance prediction guru, don't tell me you haven't joined yet
I've already made it into the rewards circle—I'm so happy!
Come join too; the first 20,000 people will get rewards!
傳送門
I've already made it into the rewards circle—I'm so happy!
Come join too; the first 20,000 people will get rewards!
傳送門
6
·
--
The US 10-year Treasury yield continues to fluctuate at elevated levels around 4.90%, with high yields continuing to weigh on valuations across major US stock indexes. The S&P 500 recently pulled back, closing at 7,541 points, while technology growth stocks face greater discount-rate pressure. Meanwhile, Brent crude prices remain elevated near $104 per barrel, with supply-side and geopolitical risks heightening market concerns about imported inflation. From a technical perspective, upward momentum in the 20-day moving averages (MAs) of major indexes has slowed, while the daily relative strength index (RSI) has slipped into the neutral-to-weak range around 50, reflecting a wait-and-see mood amid mixed macroeconomic forces.
The US 10-year Treasury yield continues to fluctuate at elevated levels around 4.90%, with high yields continuing to weigh on valuations across major US stock indexes. The S&P 500 recently pulled back, closing at 7,541 points, while technology growth stocks face greater discount-rate pressure. Meanwhile, Brent crude prices remain elevated near $104 per barrel, with supply-side and geopolitical risks heightening market concerns about imported inflation. From a technical perspective, upward momentum in the 20-day moving averages (MAs) of major indexes has slowed, while the daily relative strength index (RSI) has slipped into the neutral-to-weak range around 50, reflecting a wait-and-see mood amid mixed macroeconomic forces.
49
·
--
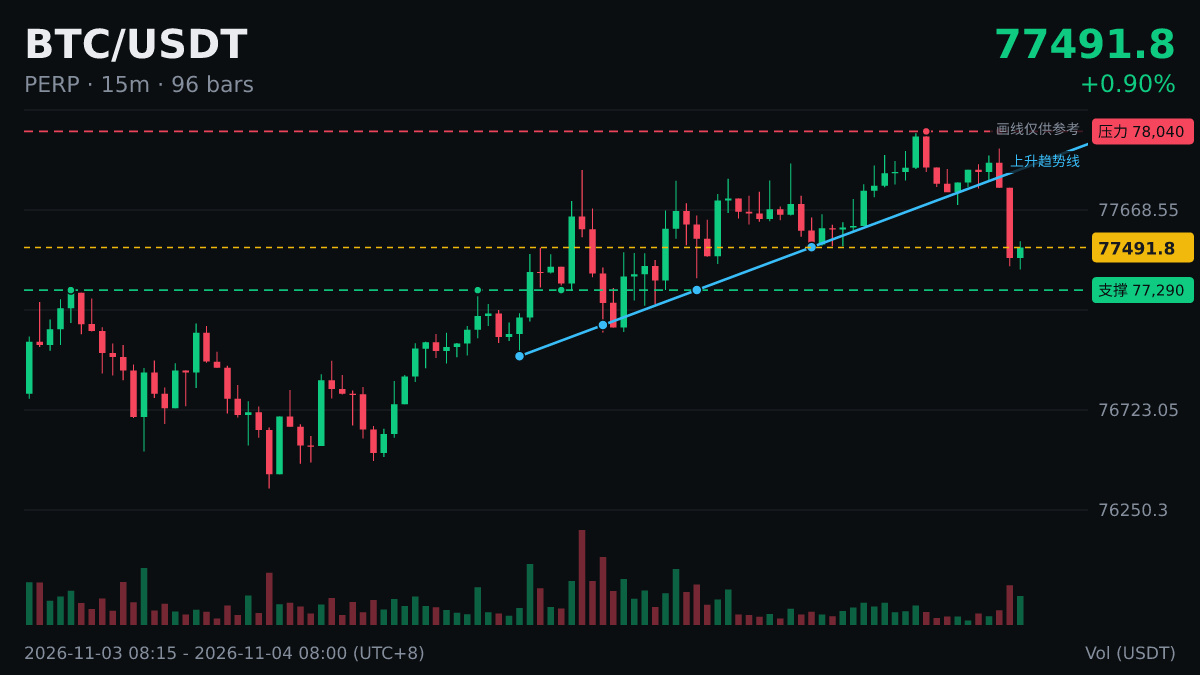
$BTC 1 5-minute volume surged 6.8x, down 0.32%, current price 77476.
Coins with unusual volume surges often become more volatile, so keep leverage light.
The candlestick body matters more than the wick: a steady close shows the strength is real.
$BTC 1 5-minute volume surged 6.8x, down 0.32%, current price 77476.
Coins with unusual volume surges often become more volatile, so keep leverage light.
The candlestick body matters more than the wick: a steady close shows the strength is real.
Coins with unusual volume surges often become more volatile, so keep leverage light.
The candlestick body matters more than the wick: a steady close shows the strength is real.
221
·
--
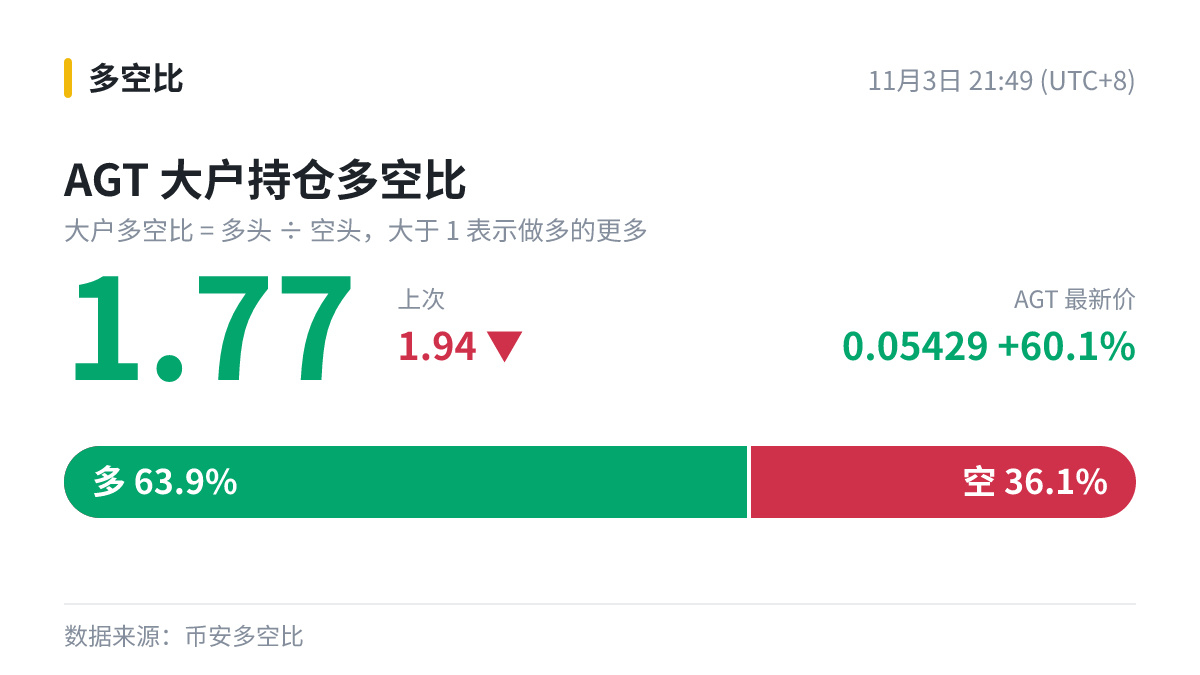
Follow the money: $AGT whale long/short position ratio 1.77, 24h +60.1%, 24h trading volume $212 million.
The long/short ratio should be considered alongside trading volume: if the ratio changes but volume doesn’t pick up, it’s probably just existing positions shifting around; if the ratio changes while volume surges, that indicates new capital is betting on a direction.
Follow the money: $AGT whale long/short position ratio 1.77, 24h +60.1%, 24h trading volume $212 million.
The long/short ratio should be considered alongside trading volume: if the ratio changes but volume doesn’t pick up, it’s probably just existing positions shifting around; if the ratio changes while volume surges, that indicates new capital is betting on a direction.
The long/short ratio should be considered alongside trading volume: if the ratio changes but volume doesn’t pick up, it’s probably just existing positions shifting around; if the ratio changes while volume surges, that indicates new capital is betting on a direction.
7
·
--
Things have heated up quickly 🔥—set your stop-loss before chasing the rally!
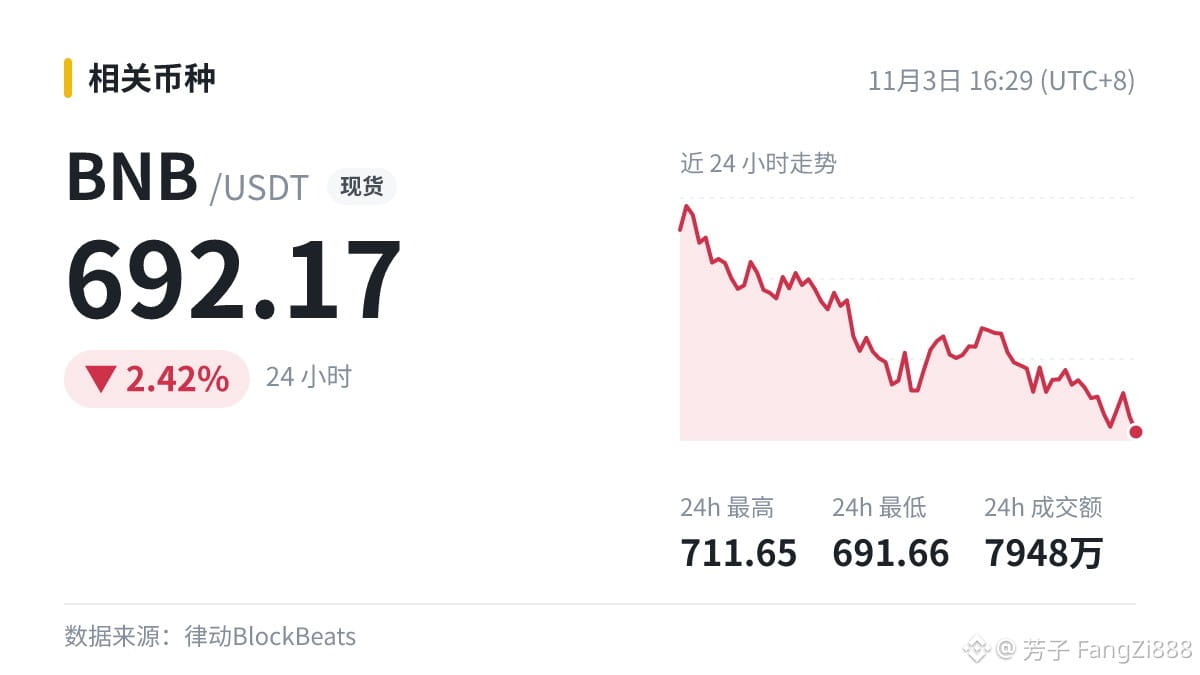
👉 Binance’s 24-hour fund flow has turned positive, with net inflows of around $1.6 billion, a marked improvement from before.
This should give everyone a boost, but how far it goes depends on whether trading volume follows through.
Will $BNB move along with it?
Things have heated up quickly 🔥—set your stop-loss before chasing the rally!
👉 Binance’s 24-hour fund flow has turned positive, with net inflows of around $1.6 billion, a marked improvement from before.
This should give everyone a boost, but how far it goes depends on whether trading volume follows through.
Will $BNB move along with it?
👉 Binance’s 24-hour fund flow has turned positive, with net inflows of around $1.6 billion, a marked improvement from before.
This should give everyone a boost, but how far it goes depends on whether trading volume follows through.
Will $BNB move along with it?
43
·
--
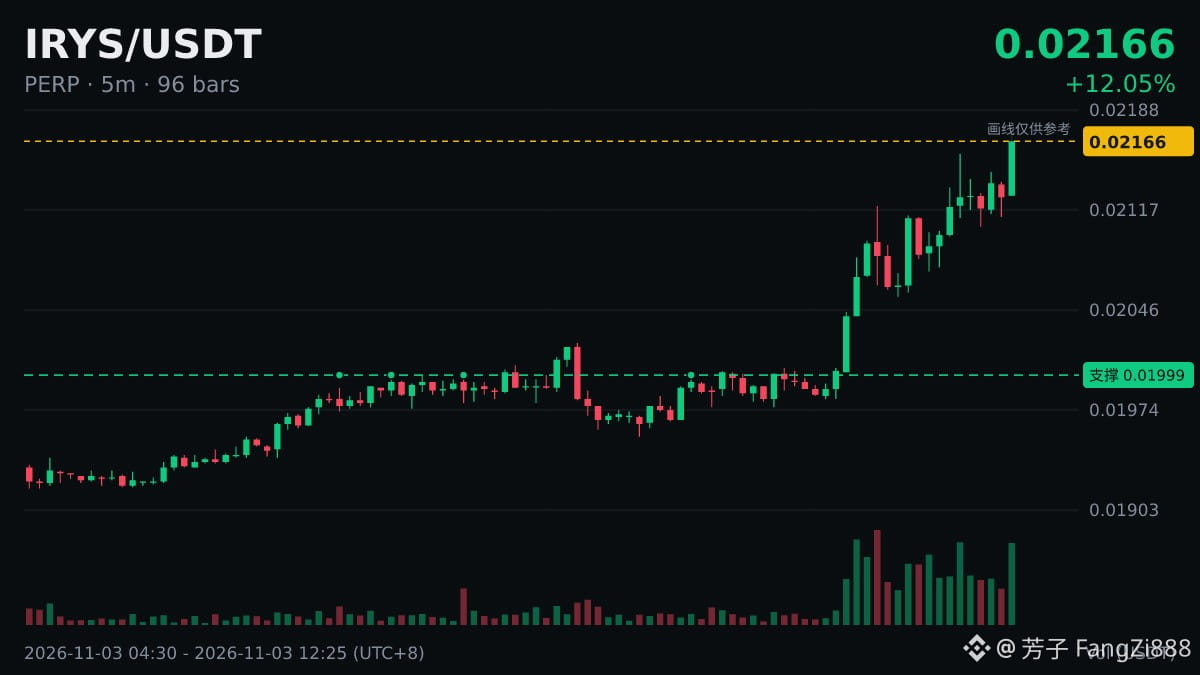
Real-time | $IRYS 5-minute surge +2.18%
· Current price 0.02166
· 24h high 0.02176
· 24h change +8.52%
A sharp rise doesn't mean it will go far; a healthy structure is what matters. Noted—I'll pull this up in a few days and compare.
#IRYS
Real-time | $IRYS 5-minute surge +2.18%
· Current price 0.02166
· 24h high 0.02176
· 24h change +8.52%
A sharp rise doesn't mean it will go far; a healthy structure is what matters. Noted—I'll pull this up in a few days and compare.
#IRYS
· Current price 0.02166
· 24h high 0.02176
· 24h change +8.52%
A sharp rise doesn't mean it will go far; a healthy structure is what matters. Noted—I'll pull this up in a few days and compare.
#IRYS
194
·
--
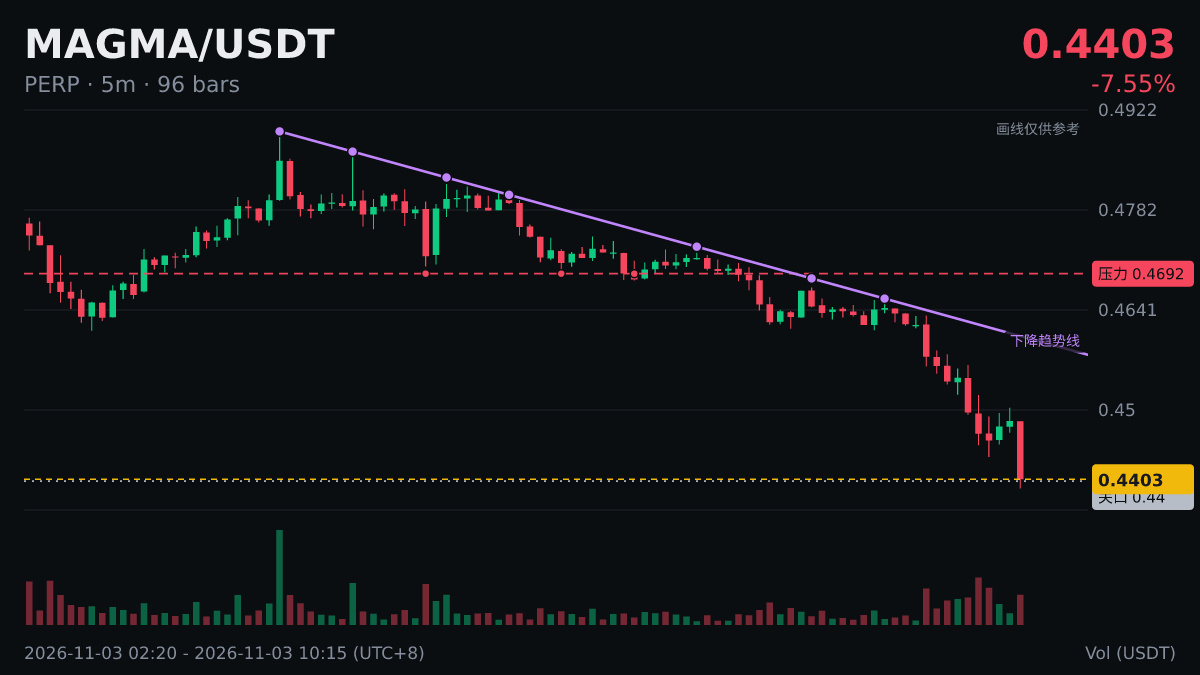
$MAGMA 5 minutes, down 2.15%—what's going on? 😰
Current price: 0.4386, 24h: -4.68%.
The drop is relatively mild; let's see if support holds.
Do you think it's just sentiment, or is there really bad news?
$MAGMA 5 minutes, down 2.15%—what's going on? 😰
Current price: 0.4386, 24h: -4.68%.
The drop is relatively mild; let's see if support holds.
Do you think it's just sentiment, or is there really bad news?
Current price: 0.4386, 24h: -4.68%.
The drop is relatively mild; let's see if support holds.
Do you think it's just sentiment, or is there really bad news?
45
·
--
#BinancePick Binance Oracle Season 1
Total prize pool: 1,000,000 USDC
Only 12 days left—have you joined yet?
Work hard to earn money—don't miss out!
[傳送門](https://app.binance.com/uni-qr/prophet?from=share&seasonId=prophet_1019_s1&ref=PQV0WZTQ)
#BinancePick Binance Oracle Season 1
Total prize pool: 1,000,000 USDC
Only 12 days left—have you joined yet?
Work hard to earn money—don't miss out!
傳送門
Total prize pool: 1,000,000 USDC
Only 12 days left—have you joined yet?
Work hard to earn money—don't miss out!
傳送門
2
·
--
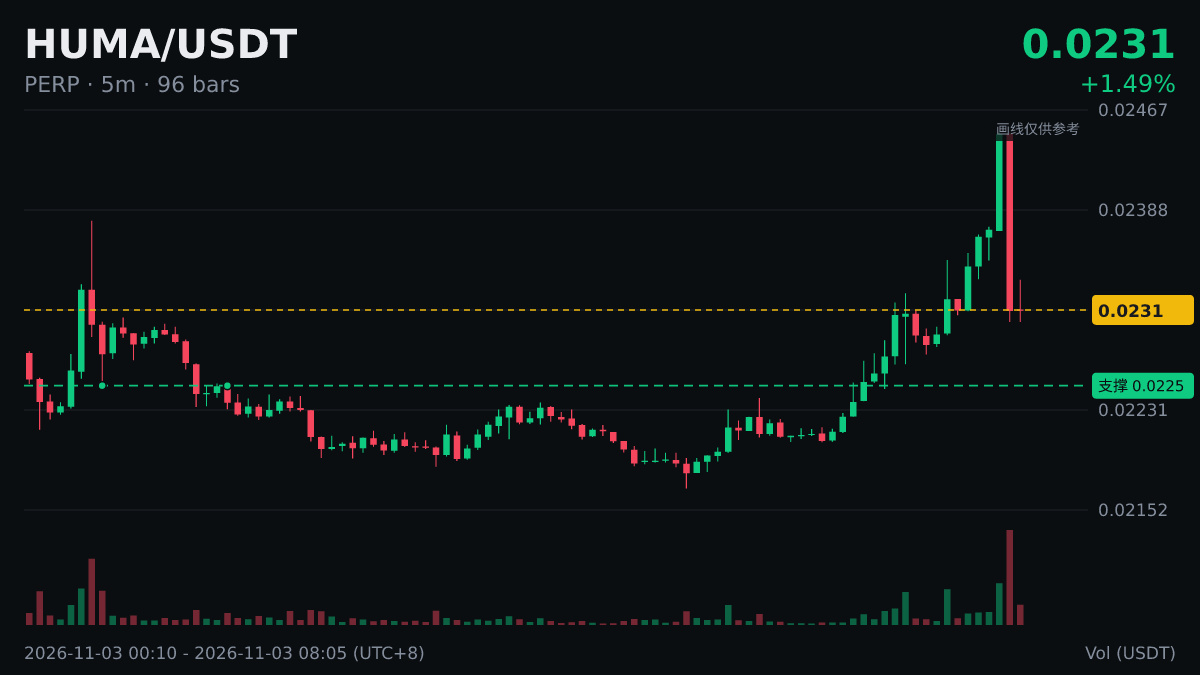
Down 5.6% in $HUMA 5 minutes, with the current price at 0.02313. Next, there are two possible scenarios:
① It holds sideways on lower volume and gets back above the breakdown level → this move looks more like a sentiment-driven selloff
② The rebound fails to reclaim that level and it loses the 24h low of 0.02179 → the decline may continue
I’d personally wait to see how the first rebound plays out before drawing a conclusion. How would you respond?
Down 5.6% in $HUMA 5 minutes, with the current price at 0.02313. Next, there are two possible scenarios:
① It holds sideways on lower volume and gets back above the breakdown level → this move looks more like a sentiment-driven selloff
② The rebound fails to reclaim that level and it loses the 24h low of 0.02179 → the decline may continue
I’d personally wait to see how the first rebound plays out before drawing a conclusion. How would you respond?
① It holds sideways on lower volume and gets back above the breakdown level → this move looks more like a sentiment-driven selloff
② The rebound fails to reclaim that level and it loses the 24h low of 0.02179 → the decline may continue
I’d personally wait to see how the first rebound plays out before drawing a conclusion. How would you respond?
217
·
--
The U.S. 10-year Treasury yield continues to fluctuate at elevated levels near 4.94%, with the high-interest-rate environment continuing to put substantial pressure on U.S. equity valuations. The S&P 500 has recently pulled back to around 7,575 points, while technology growth stocks face greater discount-rate pressure. Meanwhile, Brent crude has fallen to $105.91 per barrel, though continued volatility at elevated levels is still shaping market expectations for imported inflation. Technically, the upward momentum of the major indices’ 20-day moving averages (MA) has eased, while the daily relative strength index (RSI) has slipped into a neutral-to-weak range, reflecting a cautious wait-and-see mood amid mixed macroeconomic signals.
The U.S. 10-year Treasury yield continues to fluctuate at elevated levels near 4.94%, with the high-interest-rate environment continuing to put substantial pressure on U.S. equity valuations. The S&P 500 has recently pulled back to around 7,575 points, while technology growth stocks face greater discount-rate pressure. Meanwhile, Brent crude has fallen to $105.91 per barrel, though continued volatility at elevated levels is still shaping market expectations for imported inflation. Technically, the upward momentum of the major indices’ 20-day moving averages (MA) has eased, while the daily relative strength index (RSI) has slipped into a neutral-to-weak range, reflecting a cautious wait-and-see mood amid mixed macroeconomic signals.
82
·
--
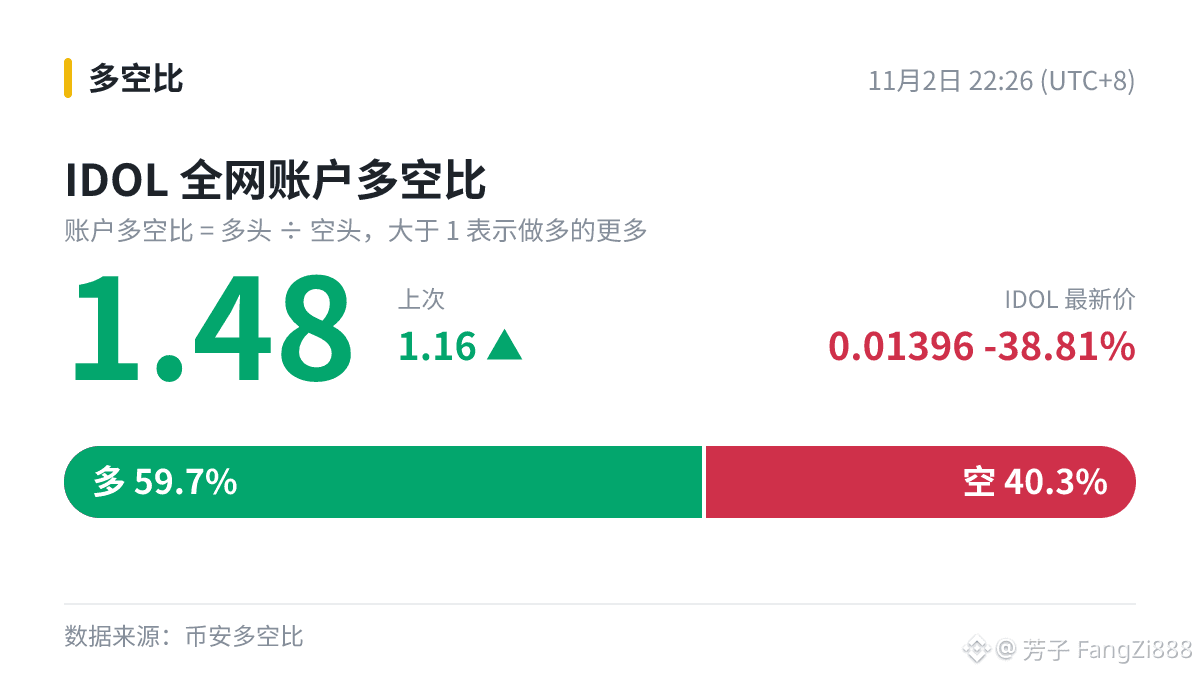
A quick aside: a friend asked me how to read the long/short ratio. Let’s use $IDOL as an example:
The overall long/short ratio across all accounts is 1.48, meaning 59.7% are long and 40.3% are short.
A ratio above 1 means a higher proportion of traders are going long; below 1 means a higher proportion are going short. But most importantly, the more one-sided the numbers are, the more cautious you should be about a move in the opposite direction.
A quick aside: a friend asked me how to read the long/short ratio. Let’s use $IDOL as an example:
The overall long/short ratio across all accounts is 1.48, meaning 59.7% are long and 40.3% are short.
A ratio above 1 means a higher proportion of traders are going long; below 1 means a higher proportion are going short. But most importantly, the more one-sided the numbers are, the more cautious you should be about a move in the opposite direction.
The overall long/short ratio across all accounts is 1.48, meaning 59.7% are long and 40.3% are short.
A ratio above 1 means a higher proportion of traders are going long; below 1 means a higher proportion are going short. But most importantly, the more one-sided the numbers are, the more cautious you should be about a move in the opposite direction.
11
·
--
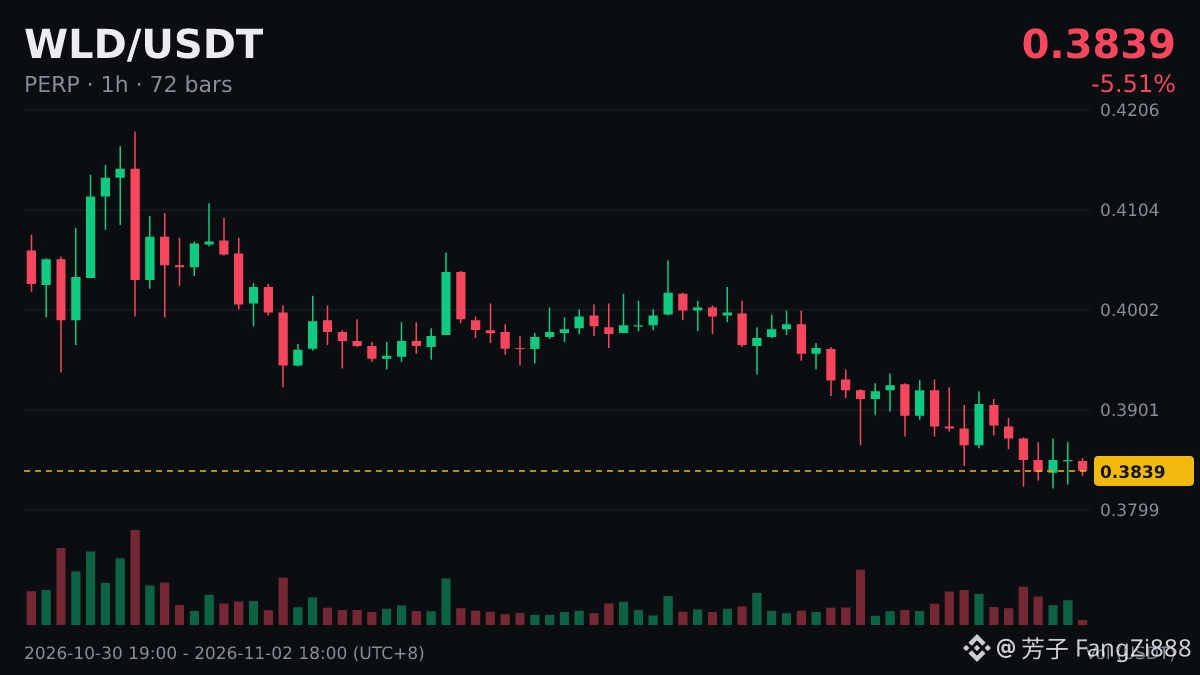
🐋 A note for those watching large orders: $WLD × Trending topic: “Spring Festival Gala-lookalike Unitree robot appears at the Mount Tai competition”
It’s getting a boost from the AI hype, and the buzz is here. Whether buyers follow is something we’ll see from trading over the next few hours.
#WLD
🐋 A note for those watching large orders: $WLD × Trending topic: “Spring Festival Gala-lookalike Unitree robot appears at the Mount Tai competition”
It’s getting a boost from the AI hype, and the buzz is here. Whether buyers follow is something we’ll see from trading over the next few hours.
#WLD
It’s getting a boost from the AI hype, and the buzz is here. Whether buyers follow is something we’ll see from trading over the next few hours.
#WLD
176
·
--
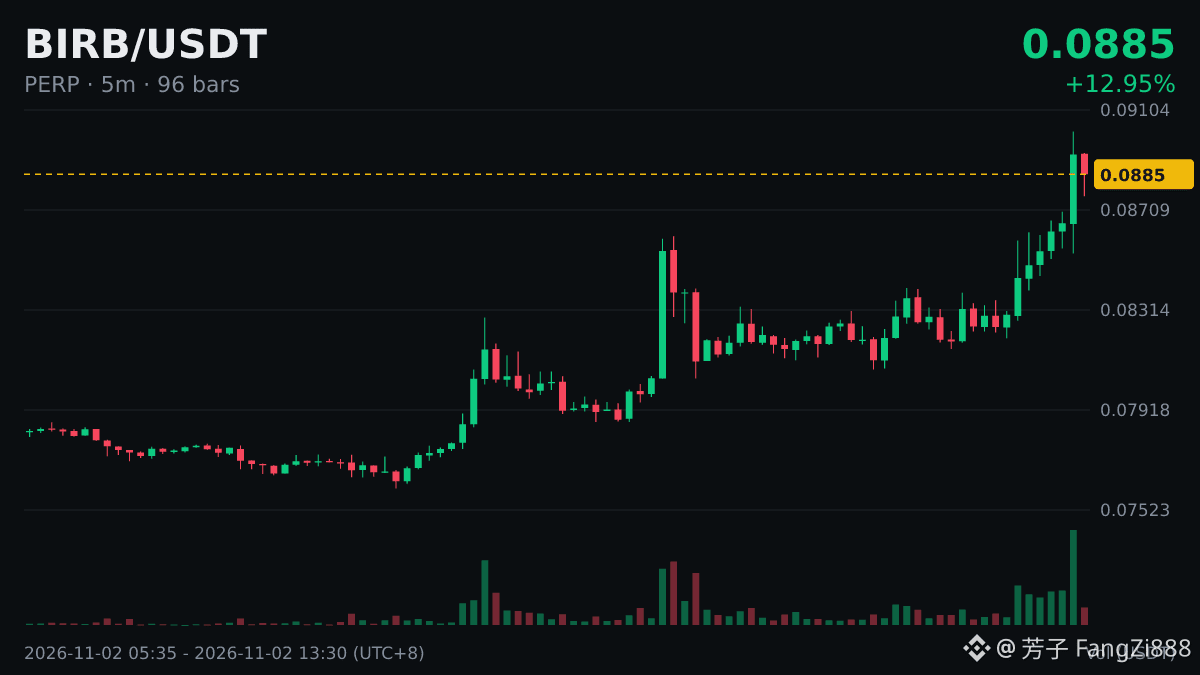
This surge turned me from a bystander into a spectator—front row, no less.
($BIRB 1 hour +8.52%, at 0.08828)
Anyone been watching it all along? Come out and tell us.
This surge turned me from a bystander into a spectator—front row, no less.
($BIRB 1 hour +8.52%, at 0.08828)
Anyone been watching it all along? Come out and tell us.
($BIRB 1 hour +8.52%, at 0.08828)
Anyone been watching it all along? Come out and tell us.
214
·
--
#BinancePick The Binance Oracle event has been going on for several days now. Has everyone remembered to check in every day? Check in and post for a chance to make the leaderboard and share in the huge, huge, huge rewards!
When the market is bad, of course you’ve got to farm freebies!
[傳送門](https://app.binance.com/uni-qr/prophet?from=share&seasonId=prophet_1019_s1&ref=PQV0WZTQ)
#BinancePick The Binance Oracle event has been going on for several days now. Has everyone remembered to check in every day? Check in and post for a chance to make the leaderboard and share in the huge, huge, huge rewards!
When the market is bad, of course you’ve got to farm freebies!
傳送門
When the market is bad, of course you’ve got to farm freebies!
傳送門
63
·
--
The U.S. 10-year Treasury yield remains volatile at elevated levels around 4.93%, with high yields continuing to exert significant downward pressure on equity valuation models. The S&P 500 has recently pulled back to around 7,580, while technology growth stocks face greater discount-rate pressure. Meanwhile, Brent crude has climbed to a high of 117.55 per barrel, as supply-side and geopolitical risks have heightened market concerns about imported inflation. Technically, the upward momentum in the 20-day moving averages (MA) of major indices has eased, and the relative strength index (RSI) on daily charts has slipped into a neutral-to-weak range, reflecting a cautious, wait-and-see mood amid mixed macroeconomic forces.
The U.S. 10-year Treasury yield remains volatile at elevated levels around 4.93%, with high yields continuing to exert significant downward pressure on equity valuation models. The S&P 500 has recently pulled back to around 7,580, while technology growth stocks face greater discount-rate pressure. Meanwhile, Brent crude has climbed to a high of 117.55 per barrel, as supply-side and geopolitical risks have heightened market concerns about imported inflation. Technically, the upward momentum in the 20-day moving averages (MA) of major indices has eased, and the relative strength index (RSI) on daily charts has slipped into a neutral-to-weak range, reflecting a cautious, wait-and-see mood amid mixed macroeconomic forces.
46
·
--
FN Exclusive 🌄👀
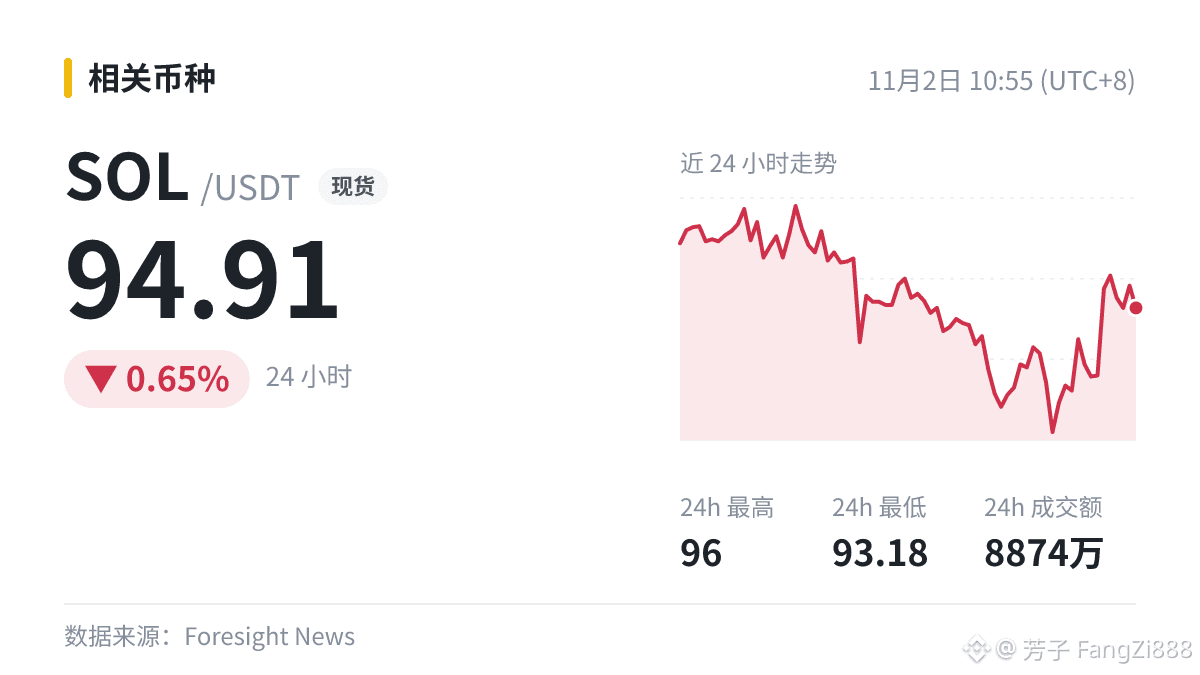
$SOL Current price 94.91, 24h -0.65%.
There’s quite a bit of news today, and this one deserves its own discussion! What do you think? Bullish or bearish?
FN Exclusive 🌄👀
$SOL Current price 94.91, 24h -0.65%.
There’s quite a bit of news today, and this one deserves its own discussion! What do you think? Bullish or bearish?
$SOL Current price 94.91, 24h -0.65%.
There’s quite a bit of news today, and this one deserves its own discussion! What do you think? Bullish or bearish?
154
Log in to explore more content
Join global crypto users on Binance Square
⚡️ Get latest and useful information about crypto.
💬 Trusted by the world’s largest crypto exchange.
👍 Discover real insights from verified creators.
Email / Phone number
Trending Topics
BTCRebounds80K
29,667 views
552 Discussing
BITCOIN UPDATE I’M STILL BEARISH, AND HERE’S WHY! 🚨⚠️
As you all witnessed, BTC bounced back from the $75,700 area and touched $81K. First, the market trapped long traders, and then it trapped short traders.
I’m still bearish. First of all, as everyone knows, Democrats won today’s US midterm elections, and in my view, this outcome is bearish for the market.
The market can remain volatile in the short term and trap as many traders as it wants, but that doesn’t change the overall market outlook.
There are several important upcoming events, including US Non Farm Payrolls (November 6), US CPI Inflation (November 10), US PPI (November 13), US Retail Sales (November 17), FOMC Meeting Minutes (November 18), US PCE Inflation (November 25), Federal Reserve interest rate expectations, the US Dollar Index (DXY), Treasury Yields, Nasdaq performance, Bitcoin ETF flows, and ongoing( Iran ) Israel geopolitical developments. All of these could have a significant impact on Bitcoin and the overall crypto market.
But don’t get too carried away by Bitcoin’s recent movement. Technically speaking, there hasn’t been any major bullish move yet. Yesterday, BTC was trading between $80K and $82K, and even today, it’s still around the same range.
If you want to turn bullish, that’s entirely your choice.
In my previous post, I clearly explained that BTC had technical support in the $75K / $76K zone, and the price bounced from that support and made its way back towards $80K. But this wasn’t something I had failed to mention before. In fact, I repeatedly mentioned in my posts that BTC could move towards $80K, $81K, or even $82K.
Despite that, I’m still bearish.
And I don’t have just one reason to support my bearish outlook. I have several reasons, which I’ve already explained in my previous posts.
For now, I’ll continue to wait for BTC to drop below $74K, which I believe could happen very soon. In my view, such a correction is also necessary for the market.
Anyone looking for crypto guidance just let me know.
#BTCRebounds80K
Strategic Adviser
·5 Likes
·2k views
Binance98PercentReplenished
26,286 views
481 Discussing
USMidterms-WhatAreMarketsExpecting?
299,744 views
1,973 Discussing