

ARTHUR 0
19.2k Posts

ARTHUR 0
 Square Verified+
Report
Block User
Content Creator | Crypto Market Analysis | My Own Trading Ideas | Follow Me & Join The Journey | 100K Followers Is My Dream
Open Trade
Frequent Trader
1.8 Years
292 Following
40.8K+ Followers
22.9K+ Liked
Posts
Portfolio
All
Quotes
Live
·
--
See translation
Happy Halloween 🎃👻
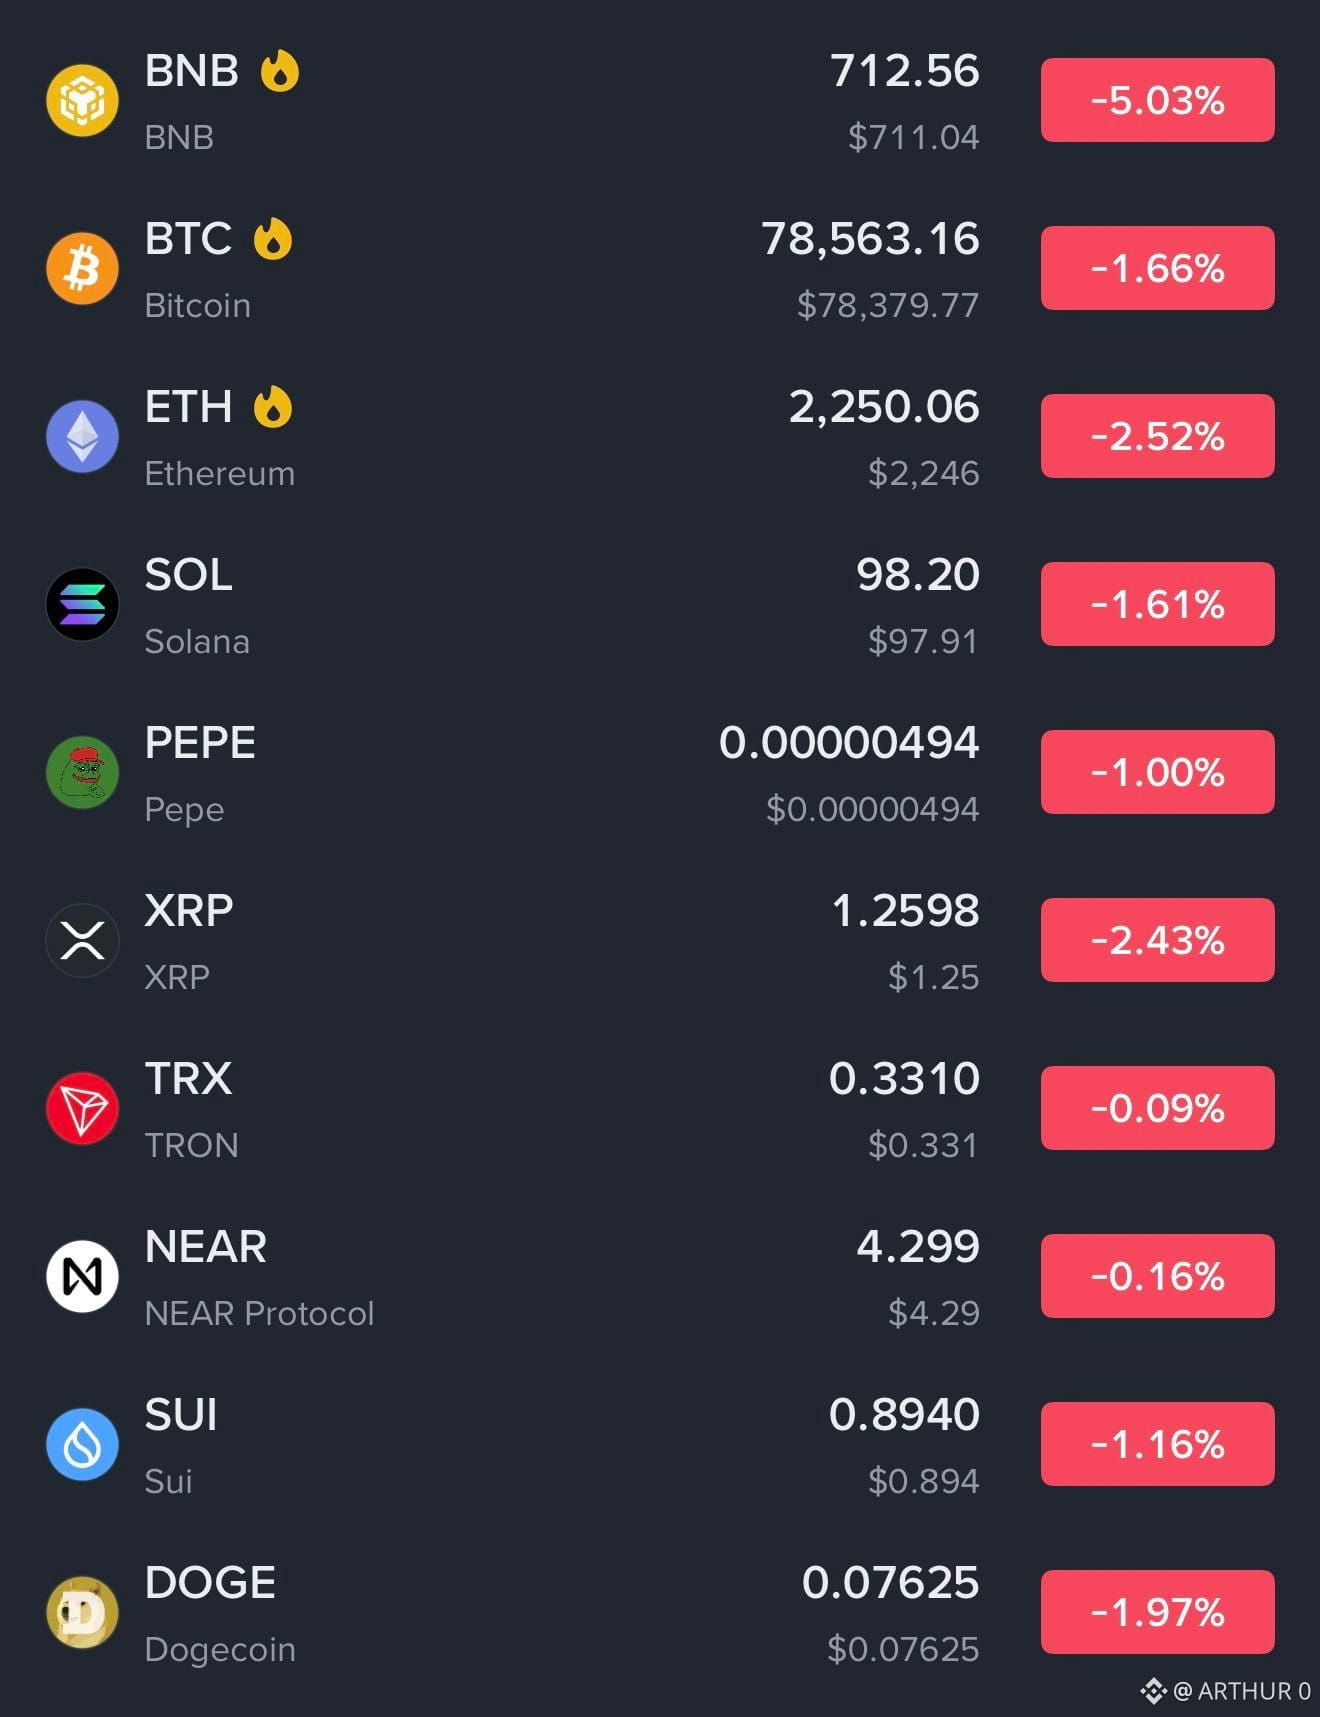
Red everywhere, the market bleeding, and chaos hitting from every direction. Feels like everything is going wrong at once.
At this point, what else could possibly happen? 💀
How are you guys holding up in this market? Still fighting or taking a break? 👀
Happy Halloween 🎃👻
Red everywhere, the market bleeding, and chaos hitting from every direction. Feels like everything is going wrong at once.
At this point, what else could possibly happen? 💀
How are you guys holding up in this market? Still fighting or taking a break? 👀
Red everywhere, the market bleeding, and chaos hitting from every direction. Feels like everything is going wrong at once.
At this point, what else could possibly happen? 💀
How are you guys holding up in this market? Still fighting or taking a break? 👀

60
·
--
Bullish
See translation
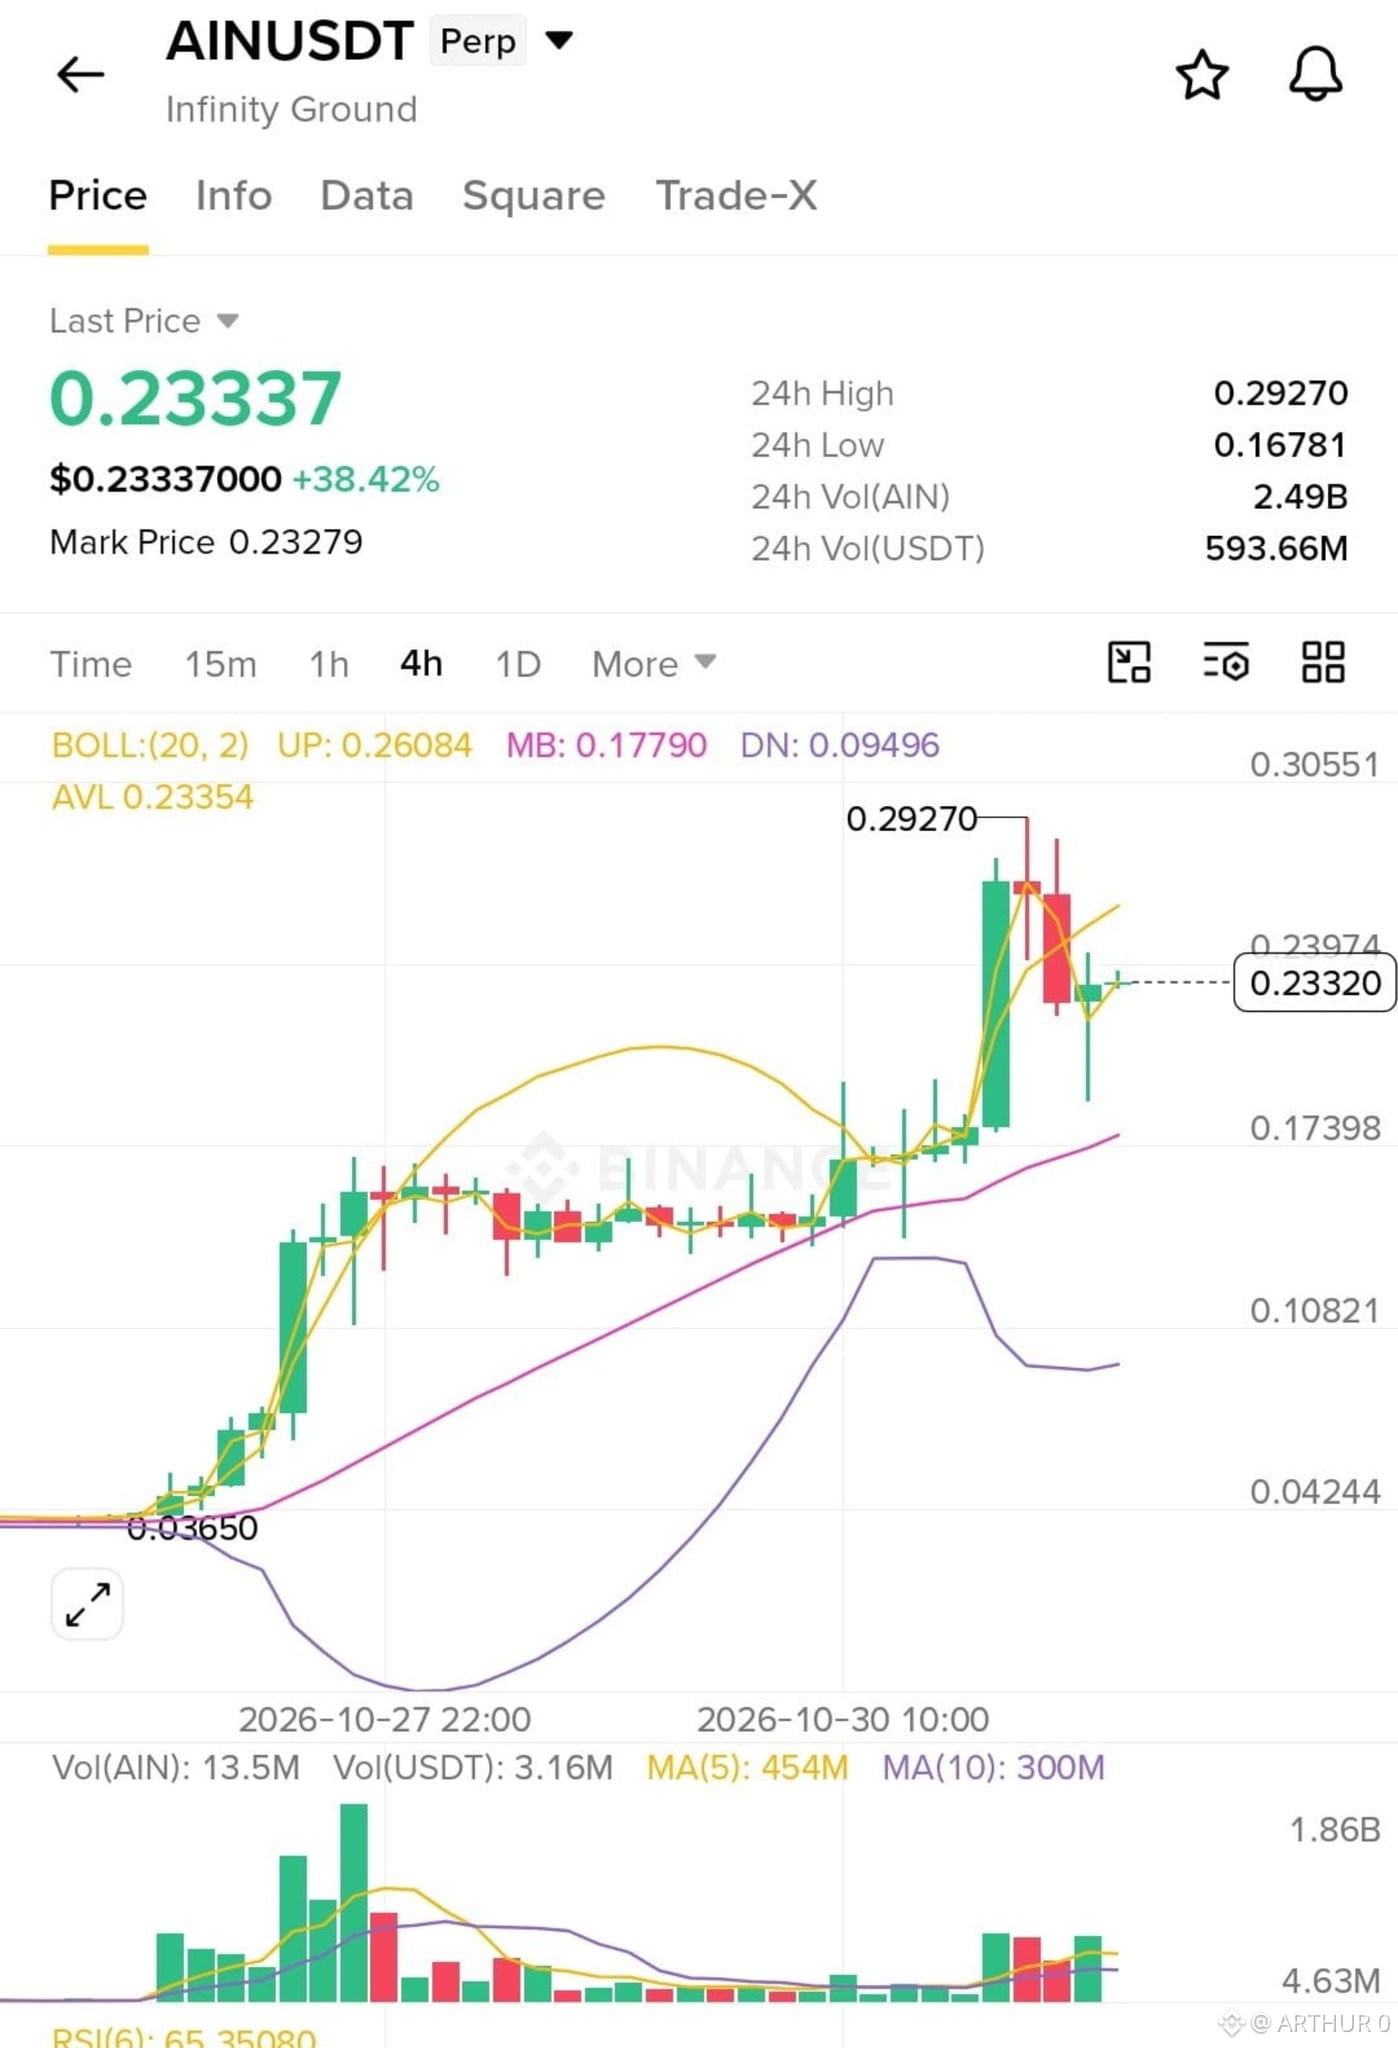
🚨 Don't rush into a long or short on $AIN just yet!
$AIN has already made a strong move, and the next direction isn't clear. Chasing the price here could be a costly mistake.
👀 Keep these levels on your radar:
$0.17 — Watch how price reacts around this zone. $0.29 — A retest of this level could reveal whether bullish momentum is returning.
No guessing, no FOMO. Let price confirm the move first, then look for an entry.
Patience is the play right now. 🙏🏼
$AIN
{future}(AINUSDT)
🚨 Don't rush into a long or short on $AIN just yet!
$AIN has already made a strong move, and the next direction isn't clear. Chasing the price here could be a costly mistake.
👀 Keep these levels on your radar:
$0.17 — Watch how price reacts around this zone. $0.29 — A retest of this level could reveal whether bullish momentum is returning.
No guessing, no FOMO. Let price confirm the move first, then look for an entry.
Patience is the play right now. 🙏🏼
$AIN
59
·
--
See translation
Am I understanding this correctly?
Binance bought nearly $2 BILLION worth of Bitcoin from the market.
Yet Bitcoin is STILL trading at only $77,000?
Am I understanding this correctly?
Binance bought nearly $2 BILLION worth of Bitcoin from the market.
Yet Bitcoin is STILL trading at only $77,000?
Binance bought nearly $2 BILLION worth of Bitcoin from the market.
Yet Bitcoin is STILL trading at only $77,000?
48
·
--
Bullish
See translation
$BIRB / USDT — SHORT 🔻
Entry Zone: 0.08650 – 0.08800
TP1: 0.08350
TP2: 0.08100
TP3: 0.07800
Stop Loss: 0.09000
Longs were wiped out for $1.4K at 0.08577, signaling clear bearish pressure. Looking for a breakdown continuation as the support gives way.
❗ Do not over-leverage.
$BIRB / USDT — SHORT 🔻
Entry Zone: 0.08650 – 0.08800
TP1: 0.08350
TP2: 0.08100
TP3: 0.07800
Stop Loss: 0.09000
Longs were wiped out for $1.4K at 0.08577, signaling clear bearish pressure. Looking for a breakdown continuation as the support gives way.
❗ Do not over-leverage.
Entry Zone: 0.08650 – 0.08800
TP1: 0.08350
TP2: 0.08100
TP3: 0.07800
Stop Loss: 0.09000
Longs were wiped out for $1.4K at 0.08577, signaling clear bearish pressure. Looking for a breakdown continuation as the support gives way.
❗ Do not over-leverage.
111
·
--
Bearish
See translation
$SNDK / USDT — SHORT 📉
Entry Zone: 1165.00 – 1180.00
TP1: 1130.00
TP2: 1100.00
TP3: 1060.00
Stop Loss: 1205.00
{future}(SNDKUSDT)
A $2.1K long liquidation at 1151.94 confirms heavy bearish pressure. The breakdown structure is clear, targeting lower levels on the continuation.
⁉️ Wait for the price to reach the entry zone.
$SNDK / USDT — SHORT 📉
Entry Zone: 1165.00 – 1180.00
TP1: 1130.00
TP2: 1100.00
TP3: 1060.00
Stop Loss: 1205.00
A $2.1K long liquidation at 1151.94 confirms heavy bearish pressure. The breakdown structure is clear, targeting lower levels on the continuation.
⁉️ Wait for the price to reach the entry zone.
Entry Zone: 1165.00 – 1180.00
TP1: 1130.00
TP2: 1100.00
TP3: 1060.00
Stop Loss: 1205.00
A $2.1K long liquidation at 1151.94 confirms heavy bearish pressure. The breakdown structure is clear, targeting lower levels on the continuation.
⁉️ Wait for the price to reach the entry zone.
1
81
·
--
Bearish
See translation
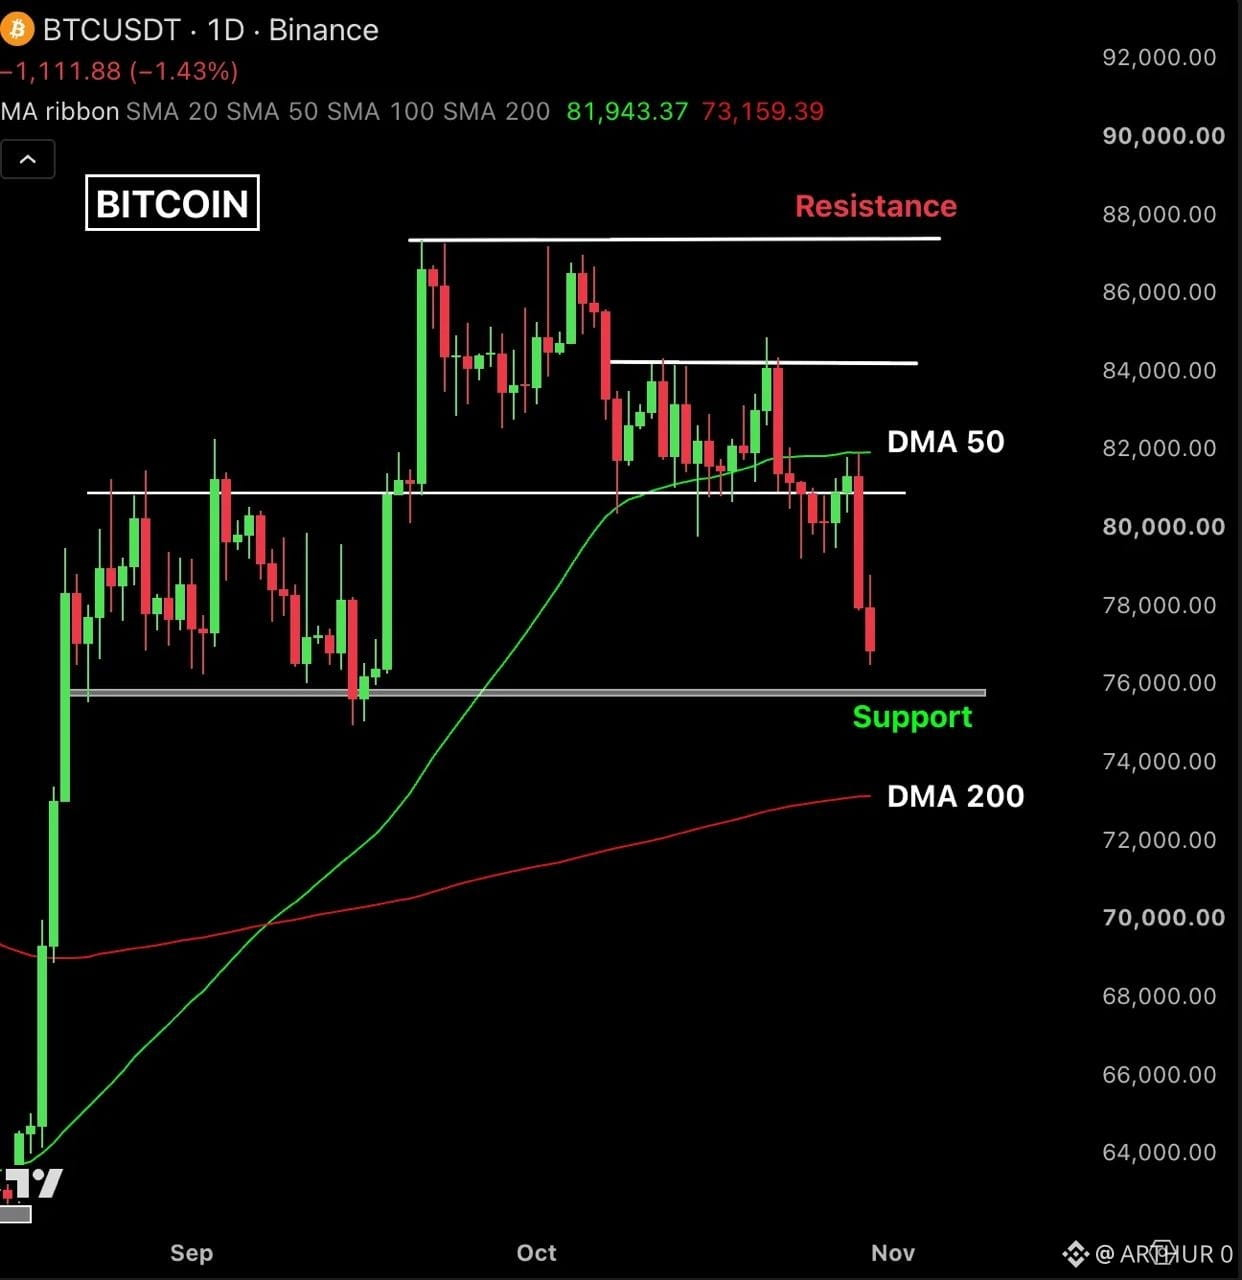
🚨 Bitcoin’s next major test could be near $75,800.
BTC has fallen below the daily 50 MA around $82,000 and is now trading under $77K. The reported Binance hack and heavy long liquidations have added more pressure to an already weak market.
And it’s not just crypto. Rising oil prices above $100 and disappointing big tech earnings are weighing on risk assets.
👀 These are the levels I’m watching:
📍 $75,800 — Weekly MA 50 📍 $73,150 — Daily MA 200
I wouldn’t be surprised to see $BTC test these levels before a meaningful recovery begins.
For those who missed the July opportunity, this pullback could offer another chance to find entries — but confirmation matters.
📅 The November 3 U.S. midterms are another event to watch, with political expectations potentially influencing market sentiment.
The key question now: will buyers defend support, or is another leg down coming? 👇
$BTC
{future}(BTCUSDT)
🚨 Bitcoin’s next major test could be near $75,800.
BTC has fallen below the daily 50 MA around $82,000 and is now trading under $77K. The reported Binance hack and heavy long liquidations have added more pressure to an already weak market.
And it’s not just crypto. Rising oil prices above $100 and disappointing big tech earnings are weighing on risk assets.
👀 These are the levels I’m watching:
📍 $75,800 — Weekly MA 50 📍 $73,150 — Daily MA 200
I wouldn’t be surprised to see $BTC test these levels before a meaningful recovery begins.
For those who missed the July opportunity, this pullback could offer another chance to find entries — but confirmation matters.
📅 The November 3 U.S. midterms are another event to watch, with political expectations potentially influencing market sentiment.
The key question now: will buyers defend support, or is another leg down coming? 👇
$BTC
89
·
--
Bearish
See translation
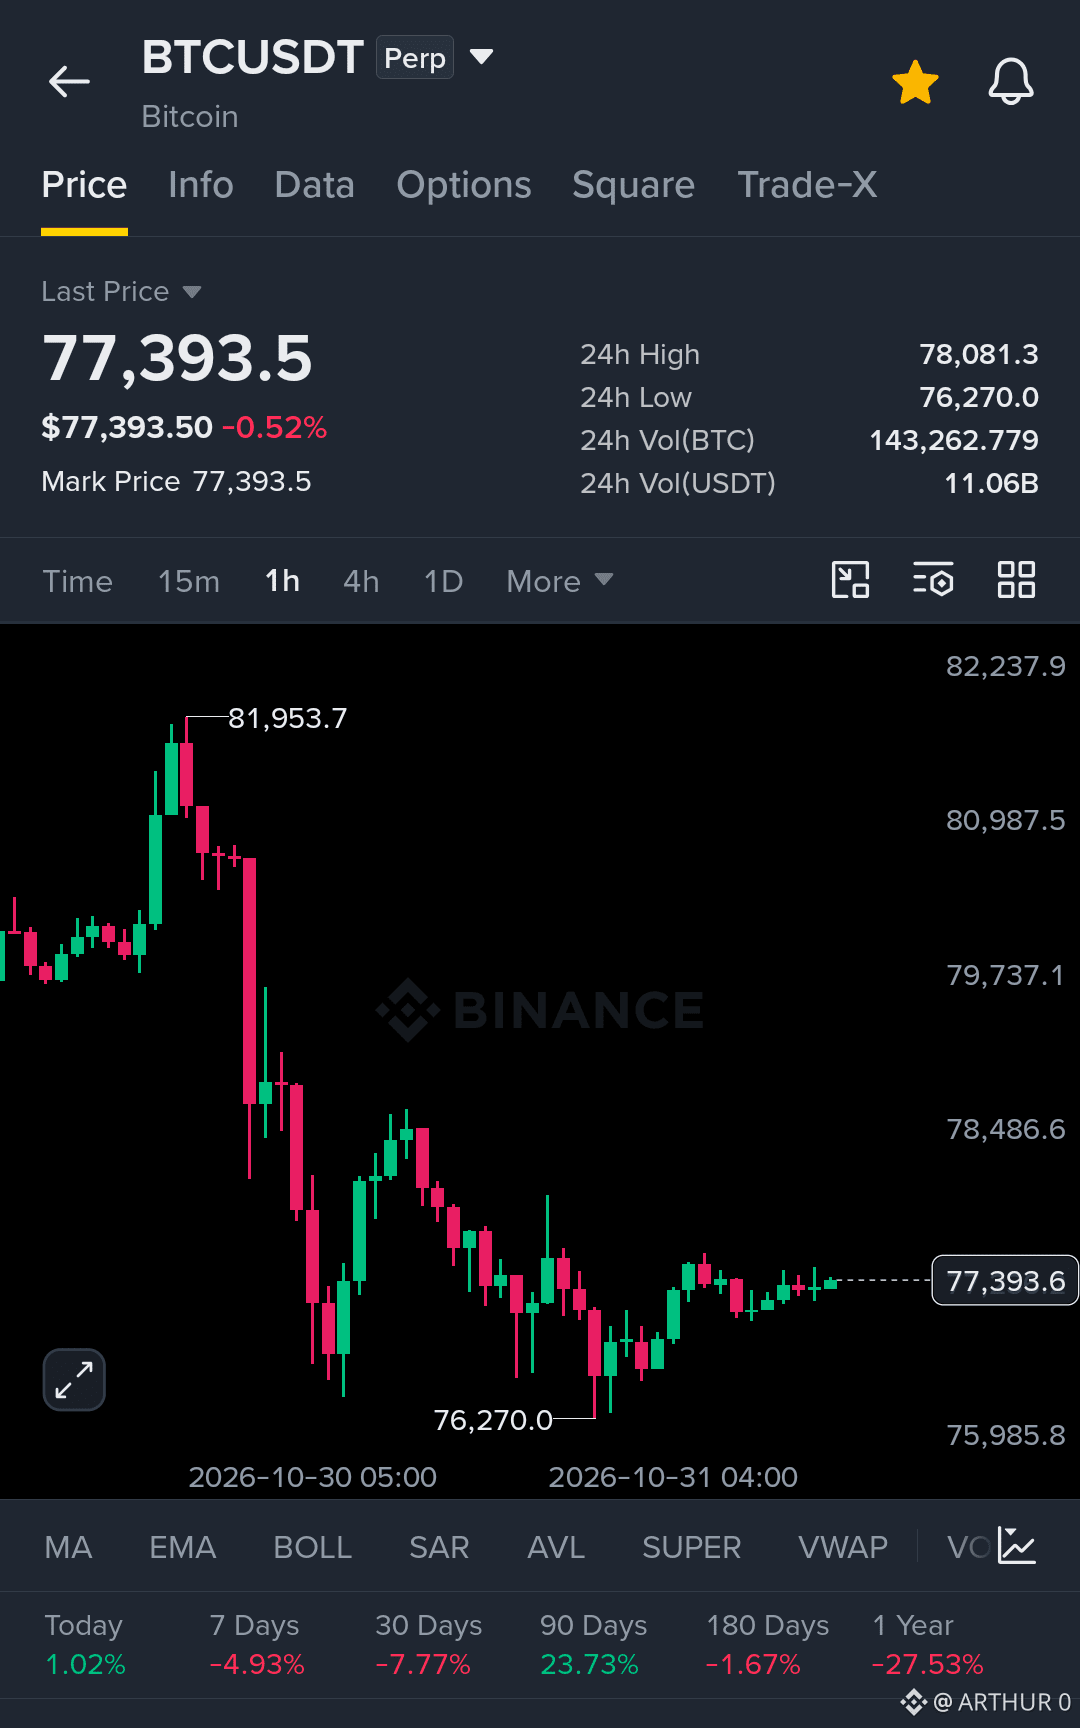
🚨 Bitcoin is trying to stabilize, but the recovery still looks weak.
$BTC is trading around $77,393 after a sharp drop from the $81,953 high. Buyers stepped in near $76,270, but price is still struggling to build strong upward momentum.
👀 Here are the levels I’m watching:
📍 Support: $76,270 📍 Resistance: $78,500 📍 Major resistance: $80,000–$82,000
If BTC breaks above $78,500 with strength, we could see a recovery toward $80K. But if $76,270 fails, another move lower could follow.
For now, the market is showing hesitation. The next breakout could decide the short-term direction. 🎯
{future}(BTCUSDT)
🚨 Bitcoin is trying to stabilize, but the recovery still looks weak.
$BTC is trading around $77,393 after a sharp drop from the $81,953 high. Buyers stepped in near $76,270, but price is still struggling to build strong upward momentum.
👀 Here are the levels I’m watching:
📍 Support: $76,270 📍 Resistance: $78,500 📍 Major resistance: $80,000–$82,000
If BTC breaks above $78,500 with strength, we could see a recovery toward $80K. But if $76,270 fails, another move lower could follow.
For now, the market is showing hesitation. The next breakout could decide the short-term direction. 🎯
66
·
--
Bearish
See translation
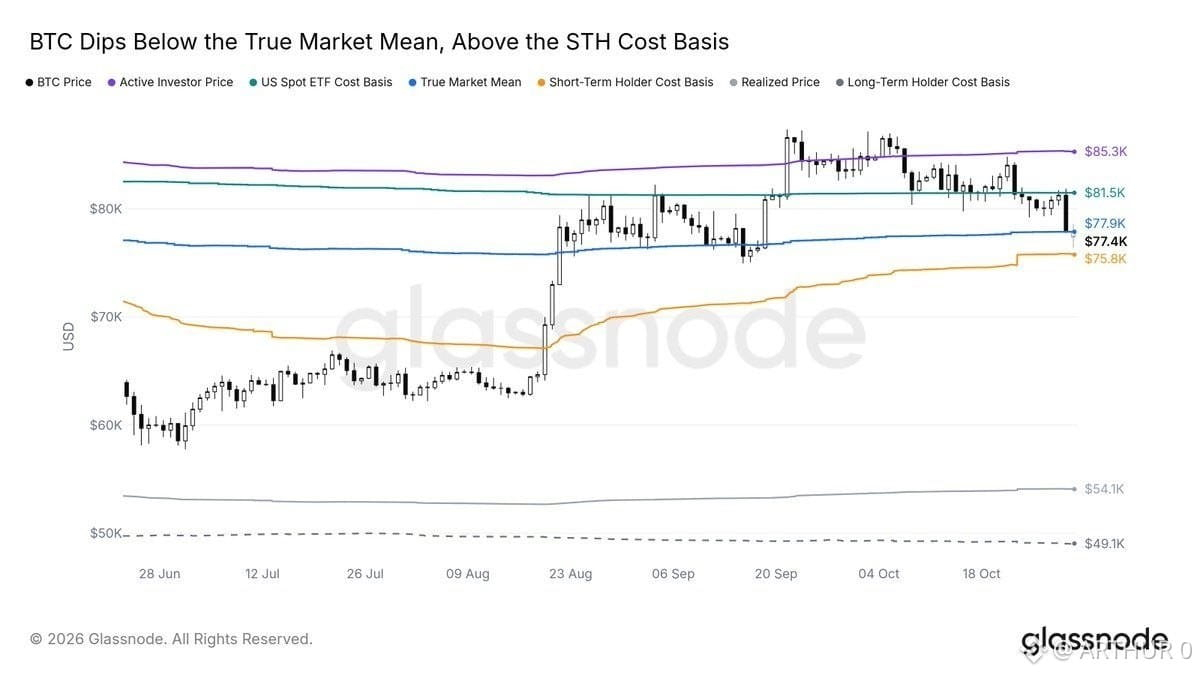
💰 Bitcoin is still holding above the $75,800 short-term holder cost basis.
That’s an important level to watch. Even with market weakness and U.S. stocks near their highs, BTC is trading above the average break-even price for short-term holders.
If this level holds, it could signal resilience. But a clean break below it may put more pressure on recent buyers.
For now, $75.8K is the level I’m watching closely. 👀
$BTC
{future}(BTCUSDT)
💰 Bitcoin is still holding above the $75,800 short-term holder cost basis.
That’s an important level to watch. Even with market weakness and U.S. stocks near their highs, BTC is trading above the average break-even price for short-term holders.
If this level holds, it could signal resilience. But a clean break below it may put more pressure on recent buyers.
For now, $75.8K is the level I’m watching closely. 👀
$BTC
73
·
--
Bullish
See translation
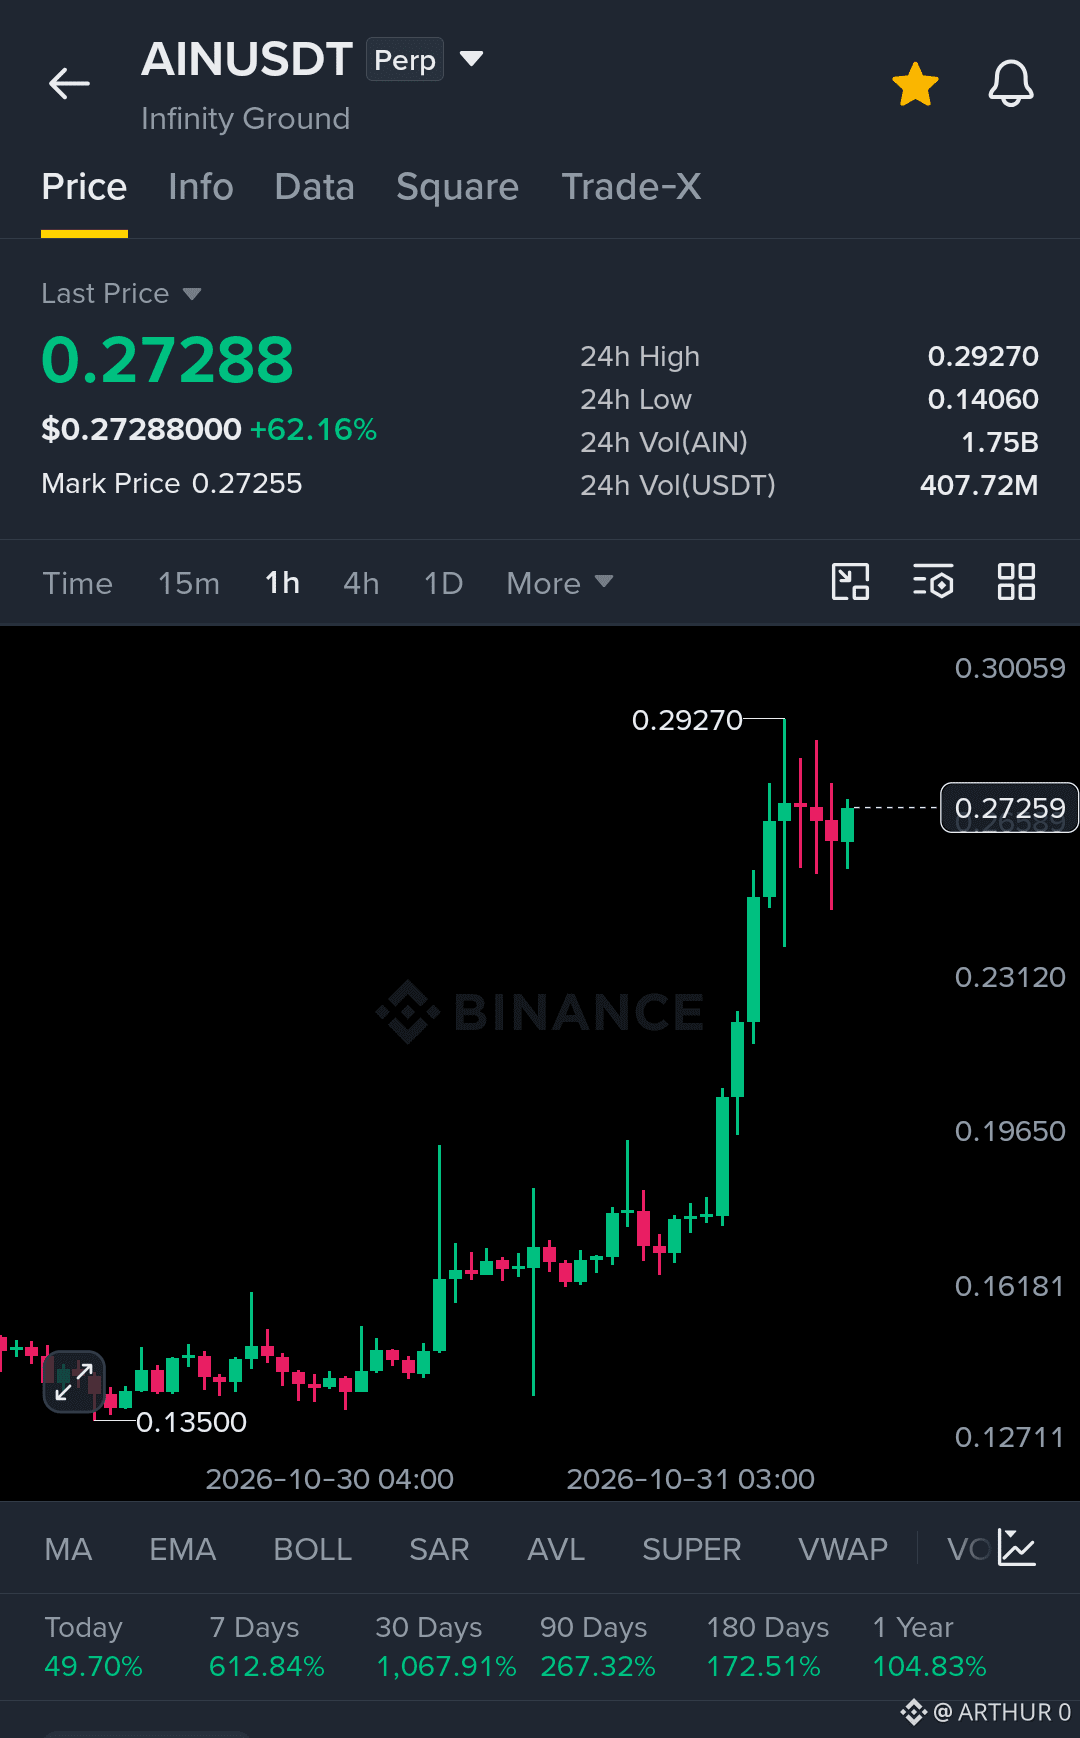
🚀 Guys $AIN — LONG NOW! ‼️🔥
📍 Entry: 0.255 — 0.272
🎯 Take Profit: $0.295
🎯 Take Profit: $0.320
🛑 Stop Loss: $0.230
{future}(AINUSDT)
Manage your risk and trade responsibly. 🚀
🚀 Guys $AIN — LONG NOW! ‼️🔥
📍 Entry: 0.255 — 0.272
🎯 Take Profit: $0.295
🎯 Take Profit: $0.320
🛑 Stop Loss: $0.230
Manage your risk and trade responsibly. 🚀
📍 Entry: 0.255 — 0.272
🎯 Take Profit: $0.295
🎯 Take Profit: $0.320
🛑 Stop Loss: $0.230
Manage your risk and trade responsibly. 🚀
52
·
--
Bearish
See translation
☕️ Market Analysis
💸 $BTC USDT – Current Price: $77,200
🚩 Key Liquidity Levels: $84,800, $76,000 & $74,900
⚠️ Major Resistance: $86,000
Bitcoin has dropped sharply below $80,000, showing continued weakness in the market. The next area to watch is the $76,000–$74,900 liquidity zone. If BTC reaches this range and buyers step in, it could offer a potential long opportunity, with $80,000 as the initial upside target.
🕯 Altcoin Market
Altcoins have also faced heavy selling pressure following reports of a Binance exchange hack, although several coins are showing relative strength.
💰 ETH is approaching a key support zone around $2,150. If buyers defend this level, a potential reversal could develop. Keep an eye on price action before expecting a recovery.
Stay alert. The next move depends on how buyers react at these key levels. 🎯
{future}(BTCUSDT)
☕️ Market Analysis
💸 $BTC USDT – Current Price: $77,200
🚩 Key Liquidity Levels: $84,800, $76,000 & $74,900
⚠️ Major Resistance: $86,000
Bitcoin has dropped sharply below $80,000, showing continued weakness in the market. The next area to watch is the $76,000–$74,900 liquidity zone. If BTC reaches this range and buyers step in, it could offer a potential long opportunity, with $80,000 as the initial upside target.
🕯 Altcoin Market
Altcoins have also faced heavy selling pressure following reports of a Binance exchange hack, although several coins are showing relative strength.
💰 ETH is approaching a key support zone around $2,150. If buyers defend this level, a potential reversal could develop. Keep an eye on price action before expecting a recovery.
Stay alert. The next move depends on how buyers react at these key levels. 🎯
43
·
--
Bearish
See translation
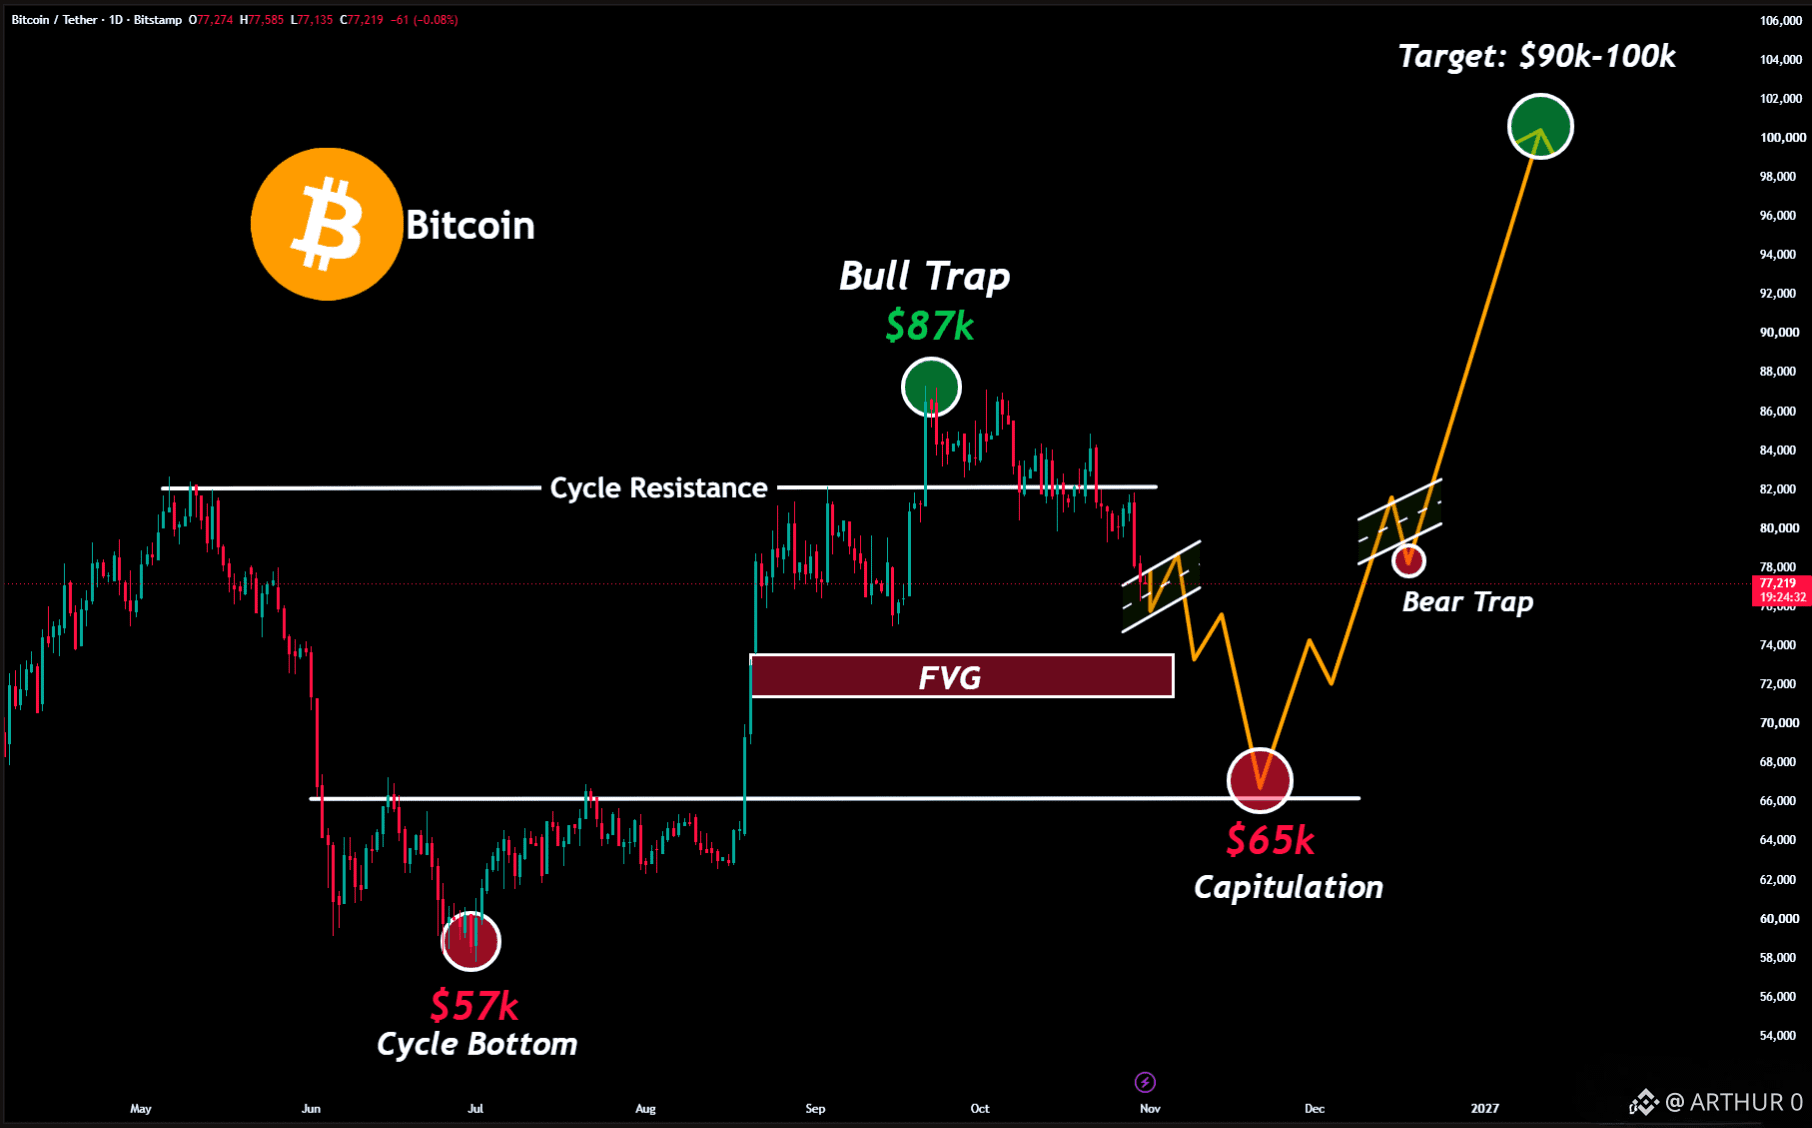
🚨 Bitcoin Could Be Setting Up for Another Brutal Leg Down
I called the bull trap near $87K. Now, I’m watching the market closely because I don’t think the downside is over yet.
$BTC could revisit $76.3K and potentially break below it if selling pressure returns.
Here’s the downside path I’m watching:
$77K → $73K → $70K → $65K
One final wave of capitulation could still shake out weak hands before the next major cycle begins.
Stay alert. Keep your eyes on the levels, and turn on notifications so you don’t miss my next update.
The next move could change everything. 👀
$BTC
{future}(BTCUSDT)
🚨 Bitcoin Could Be Setting Up for Another Brutal Leg Down
I called the bull trap near $87K. Now, I’m watching the market closely because I don’t think the downside is over yet.
$BTC could revisit $76.3K and potentially break below it if selling pressure returns.
Here’s the downside path I’m watching:
$77K → $73K → $70K → $65K
One final wave of capitulation could still shake out weak hands before the next major cycle begins.
Stay alert. Keep your eyes on the levels, and turn on notifications so you don’t miss my next update.
The next move could change everything. 👀
$BTC
201
·
--
Article
See translation
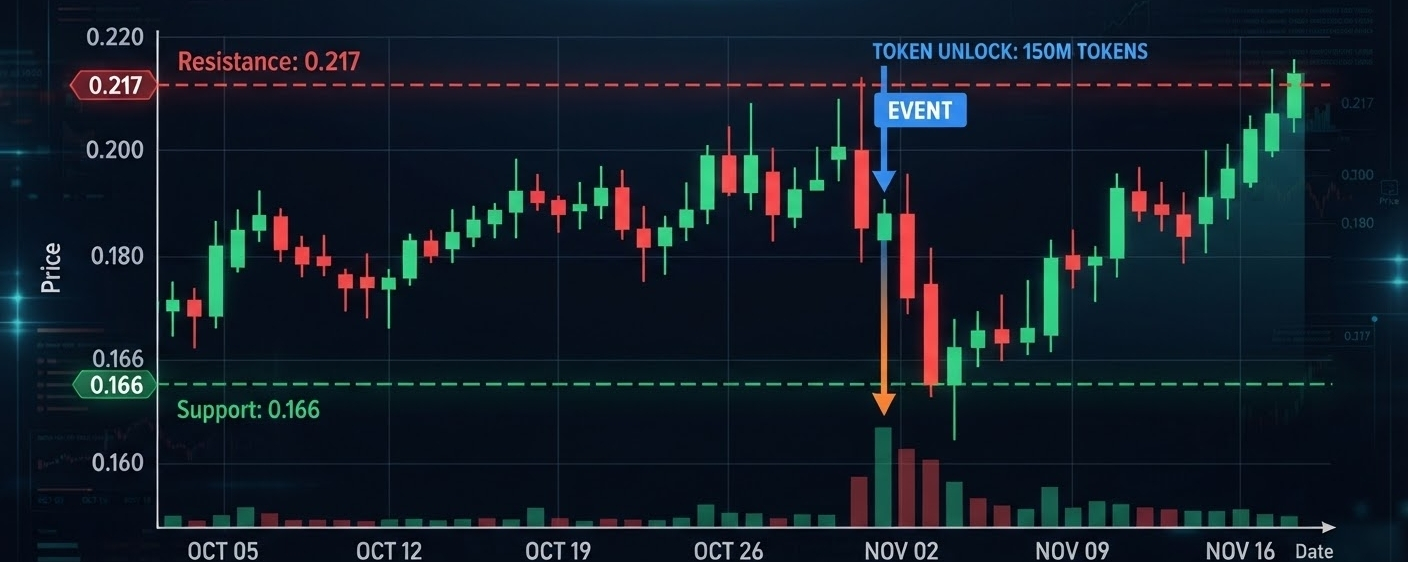
$ENAENA moved sharply across the $0.166–$0.217 range over the past week, with price still struggling to establish a stable direction. Ethena’s governance token does not pay Ethereum validators directly, so ENA transfer activity and Ethereum’s security budget are separate things. The token’s security-related economics are not equivalent to miner fees and block rewards.
So the protocol’s usage is real, but it barely translates into direct security revenue for ENA holders.
ENA is cheap to transfer when Ethereum network fees are low, and that is the point. But ENA itself does not secure the network through mining or staking. Ethereum’s validator economics secure the underlying blockchain, while ENA’s value depends on governance, token supply and demand for the Ethena ecosystem.
The date I keep circling is November 1. Current unlock schedules put it around that date, releasing roughly 275 million ENA, worth about $49 million at recent prices. This is a token supply event, not a halving. At current demand levels, ecosystem activity has to absorb that additional supply if the market is to avoid further pressure.
I don’t think that’s a design flaw. When someone quotes the transaction count, the number that pays for security is a different one. ENAUSDT has fallen roughly 4% over the past week and remains inside a box: swing low near $0.166, high near $0.217.
Underneath is the November 1 token unlock, which adds a clear supply catalyst to the picture. It still depends on how recipients handle those tokens, so it explains the attention, not a guaranteed direction.
No directional call from the middle of a box after a move this size. Levels instead:
Above $0.217: a daily close over it turns the old ceiling into a support test. Prior supply sits around $0.210–$0.217.
Below $0.166: a daily close under it says the recovery is failing. Former trading support around $0.150–$0.160 is the next area.
$0.166–$0.217: chop, roughly 27% wide.
Window: the next several daily closes. ENA tends to amplify broader crypto-market moves, so a BTC range break can reset this read early. The breakout case is invalid on acceptance below $0.160
$ENA
ENA moved sharply across the $0.166–$0.217 range over the past week, with price still struggling to establish a stable direction. Ethena’s governance token does not pay Ethereum validators directly, so ENA transfer activity and Ethereum’s security budget are separate things. The token’s security-related economics are not equivalent to miner fees and block rewards.
So the protocol’s usage is real, but it barely translates into direct security revenue for ENA holders.
ENA is cheap to transfer when Ethereum network fees are low, and that is the point. But ENA itself does not secure the network through mining or staking. Ethereum’s validator economics secure the underlying blockchain, while ENA’s value depends on governance, token supply and demand for the Ethena ecosystem.
The date I keep circling is November 1. Current unlock schedules put it around that date, releasing roughly 275 million ENA, worth about $49 million at recent prices. This is a token supply event, not a halving. At current demand levels, ecosystem activity has to absorb that additional supply if the market is to avoid further pressure.
I don’t think that’s a design flaw. When someone quotes the transaction count, the number that pays for security is a different one. ENAUSDT has fallen roughly 4% over the past week and remains inside a box: swing low near $0.166, high near $0.217.
Underneath is the November 1 token unlock, which adds a clear supply catalyst to the picture. It still depends on how recipients handle those tokens, so it explains the attention, not a guaranteed direction.
No directional call from the middle of a box after a move this size. Levels instead:
Above $0.217: a daily close over it turns the old ceiling into a support test. Prior supply sits around $0.210–$0.217.
Below $0.166: a daily close under it says the recovery is failing. Former trading support around $0.150–$0.160 is the next area.
$0.166–$0.217: chop, roughly 27% wide.
Window: the next several daily closes. ENA tends to amplify broader crypto-market moves, so a BTC range break can reset this read early. The breakout case is invalid on acceptance below $0.160
82
·
--
See translation
Bitcoin Cash moved about 13,682 transactions in the last 24 hours, with a median size near $13.50. Miners earned roughly 0.323 BCH in fees that day against about 437.5 BCH in block rewards. Fees were 0.07% of their revenue. Price, Blocks Count, Difficulty, Hashrate, Value
So the payments usage is real, and it barely touches the security budget.
BCH is cheap to use, with an average fee around $0.0044, and that is the point. But it also means the people running the network are paid almost entirely by issuance. Hashrate sits around 4.09 EH/s now, against a peak near 12.8 EH/s. Price, Blocks Count, Difficulty, Hashrate, Value +1
The date I keep circling is the next halving. Current estimates put it around April 2028, cutting the reward from 3.125 BCH to 1.5625 BCH. At current fee levels, payments can’t replace that reduction. Price, fees or mining efficiency has to. terminal.tokensmarketcap.com
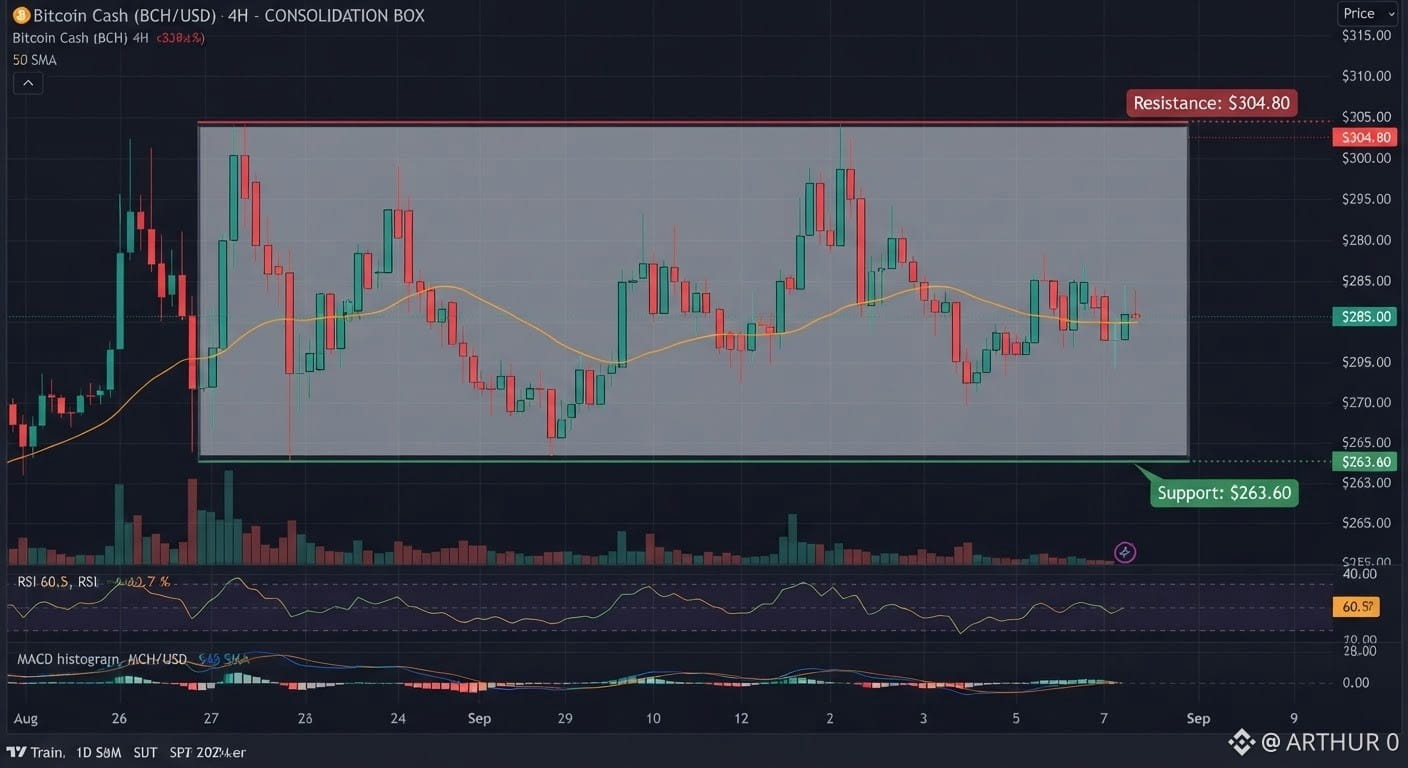
I don’t think that’s a design flaw. When someone quotes the transaction count, the number that pays for security is a different one. BCHUSDT is up roughly 4.7% in a week and has stalled inside a box: swing low near $263.60, high near $304.80. Kodexius +1
Underneath is CME Group’s BCH futures launch on October 19, which expanded regulated derivatives access. The initial announcement drove a sharp rally, but that catalyst has largely played out, so it explains the attention, not a dated trigger. CME Group +1
No directional call from the middle of a box after a move this size. Levels instead:
Above $304.80: a daily close over it turns the old ceiling into a support test. Prior supply sits around $322–$349.
Below $263.60: a daily close under it says the breakout is failing. Former resistance at $250–$260 is the next area.
$263.60–$304.80: chop, roughly 13.5% wide.
Window: the next several daily closes. BCH tends to amplify BTC, so a BTC range break can reset this read early. The breakout case is invalid on acceptance below $263.60.
92
·
--
Bearish
See translation
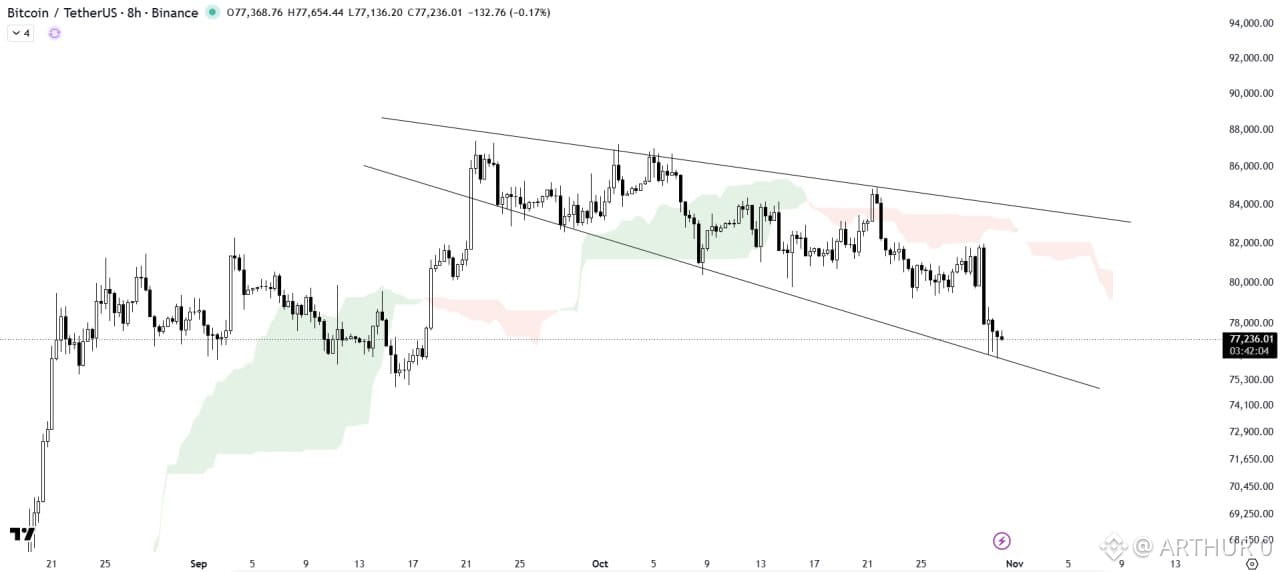
#BTC/USDT ANALYSIS
Despite the reported $6.3 billion hack, Bitcoin is still holding above the support trendline of the descending broadening wedge, showing notable resilience with no major downside reaction.
A sustained hold above this key support could set the stage for a potential rebound and recovery.
Keep a close eye on upcoming price action to see whether BTC can maintain this support and regain bullish momentum. $BTC
{future}(BTCUSDT)
#BTC/USDT ANALYSIS
Despite the reported $6.3 billion hack, Bitcoin is still holding above the support trendline of the descending broadening wedge, showing notable resilience with no major downside reaction.
A sustained hold above this key support could set the stage for a potential rebound and recovery.
Keep a close eye on upcoming price action to see whether BTC can maintain this support and regain bullish momentum. $BTC
67
·
--
See translation
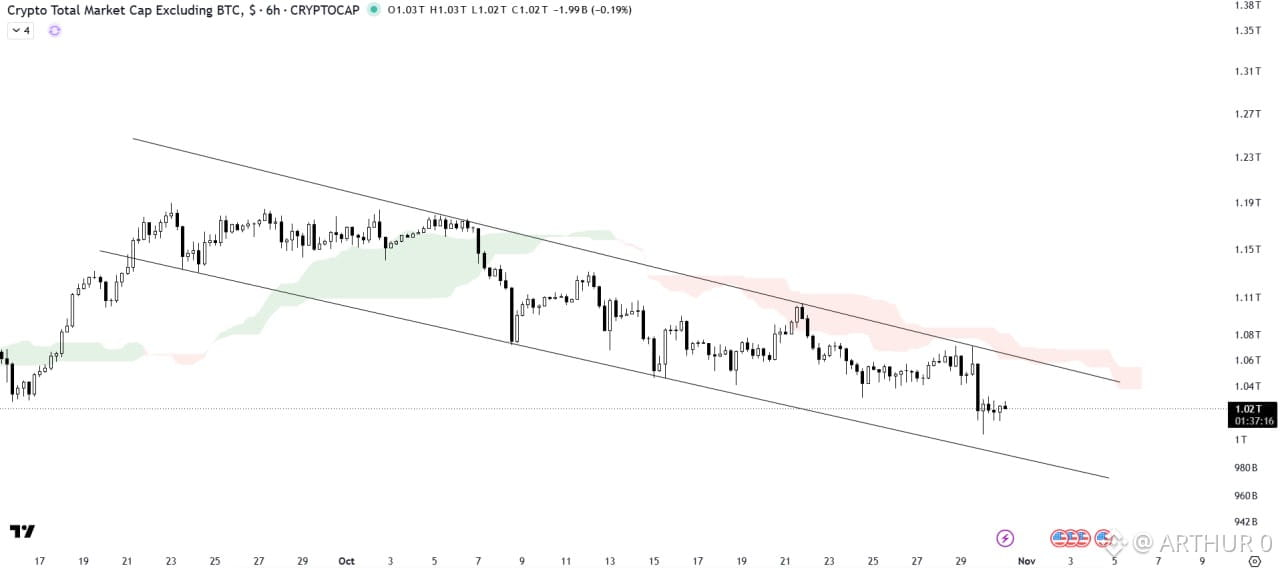
#ALTS MARKET CAP ANALYSIS
The ALTS Market Cap is consolidating within the descending channel and is currently facing rejection from the resistance trendline while holding above the channel’s support.
The Ichimoku cloud is acting as a key resistance barrier, limiting the upside momentum.
A rebound from the channel’s support trendline could trigger a short-term recovery across the altcoin market.
However, a breakdown below this support could lead to further downside. Keep a close eye on upcoming price action for confirmation.
85
·
--
See translation
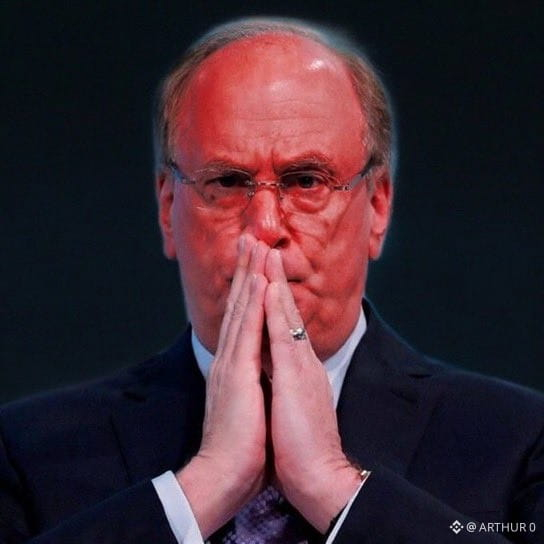
BlackRock ETF sells $233,000,000 worth of Bitcoin...
BlackRock ETF sells $233,000,000 worth of Bitcoin...

BTC+1.47%
BLKUS-1.78%
141
·
--
Bullish
See translation
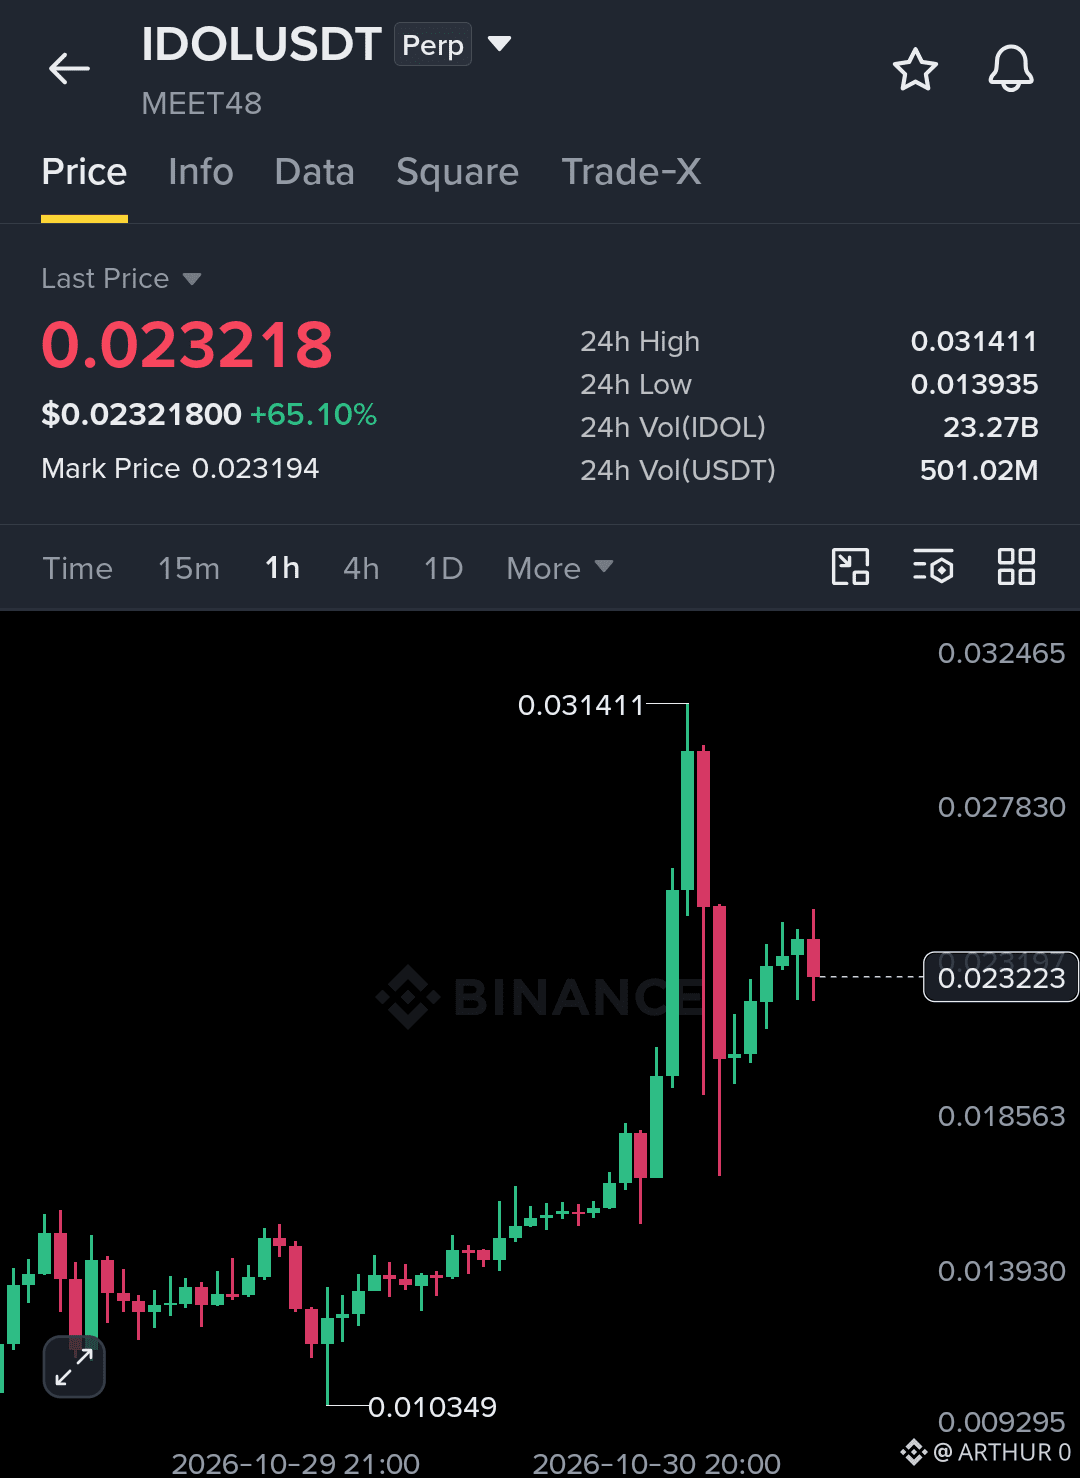
🚀 Guys $IDOL — LONG NOW! ‼️🔥
📍 Entry: 0.0225 — 0.0232
🎯 Take Profit: $0.0250
🎯 Take Profit: $0.0280
🛑 Stop Loss: $0.0200
{future}(IDOLUSDT)
Manage your risk and trade responsibly. 🚀
🚀 Guys $IDOL — LONG NOW! ‼️🔥
📍 Entry: 0.0225 — 0.0232
🎯 Take Profit: $0.0250
🎯 Take Profit: $0.0280
🛑 Stop Loss: $0.0200
Manage your risk and trade responsibly. 🚀
📍 Entry: 0.0225 — 0.0232
🎯 Take Profit: $0.0250
🎯 Take Profit: $0.0280
🛑 Stop Loss: $0.0200
Manage your risk and trade responsibly. 🚀
1
145
·
--
Bullish
See translation
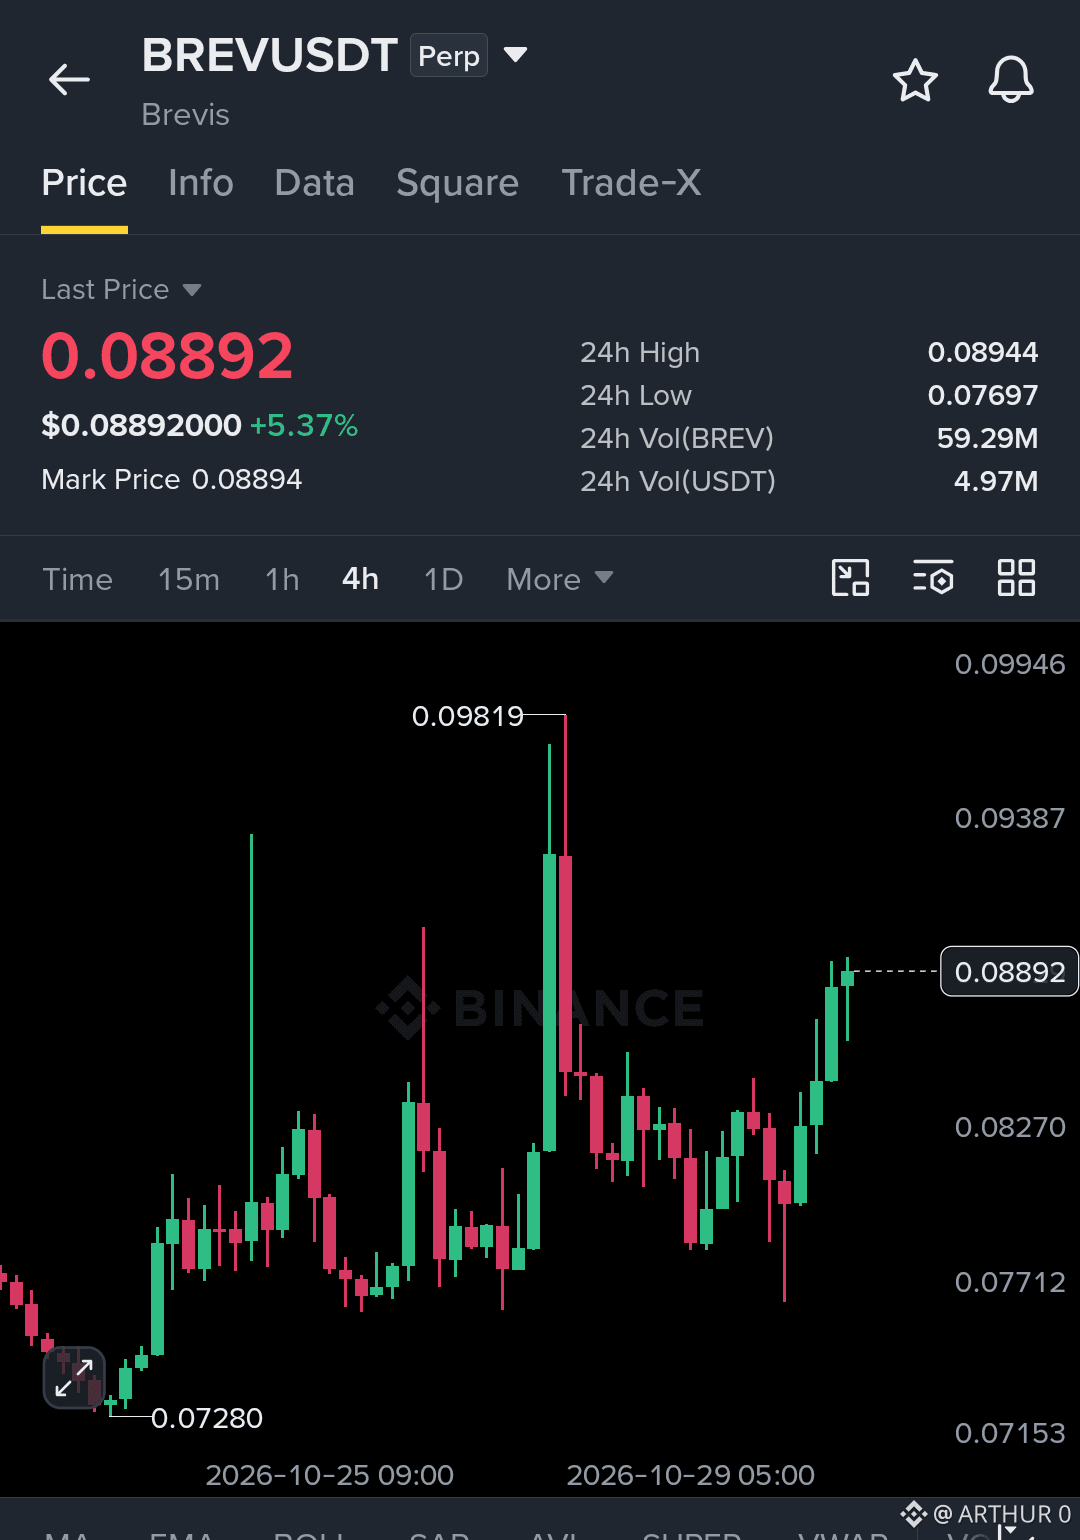
$BREV is pushing toward $0.09 with strong buying pressure. I’m eyeing a long after a confirmed 1H close above $0.0902 and a successful retest.
{future}(BREVUSDT)
entry: $0.0898 – $0.0903
targets: $0.0915 / $0.0930 / $0.0950
sl: $0.0875
$BREV is pushing toward $0.09 with strong buying pressure. I’m eyeing a long after a confirmed 1H close above $0.0902 and a successful retest.
entry: $0.0898 – $0.0903
targets: $0.0915 / $0.0930 / $0.0950
sl: $0.0875
entry: $0.0898 – $0.0903
targets: $0.0915 / $0.0930 / $0.0950
sl: $0.0875
54
·
--
Bearish
See translation
$DOGE /USDT — LONG
$DOGE is experiencing a notable upside squeeze as short sellers got liquidated at $0.07612. Retail-driven momentum often accelerates once local resistance is cleared.
Entry Zone: 0.07450 – 0.07550
TP1: 0.07800
TP2: 0.08050
TP3: 0.08400
Stop Loss: 0.07280
{future}(DOGEUSDT)
The market is absorbing forced buy orders efficiently. As long as price holds above the entry block, the bullish structure remains intact.
$DOGE /USDT — LONG
$DOGE is experiencing a notable upside squeeze as short sellers got liquidated at $0.07612. Retail-driven momentum often accelerates once local resistance is cleared.
Entry Zone: 0.07450 – 0.07550
TP1: 0.07800
TP2: 0.08050
TP3: 0.08400
Stop Loss: 0.07280
The market is absorbing forced buy orders efficiently. As long as price holds above the entry block, the bullish structure remains intact.
117
·
--
Bearish
See translation
$ETH /USDT — LONG
A massive short liquidation on $ETH near $2250.47 signals a significant shift in order flow. Bears are folding, leaving the door open for a trend reversal.
Entry Zone: 2220.00 – 2240.00
TP1: 2300.00
TP2: 2360.00
TP3: 2440.00
Stop Loss: 2185.00
{future}(ETHUSDT)
Momentum has clearly flipped to the upside. A continuation setup remains valid provided the price does not break back below the entry.
$ETH /USDT — LONG
A massive short liquidation on $ETH near $2250.47 signals a significant shift in order flow. Bears are folding, leaving the door open for a trend reversal.
Entry Zone: 2220.00 – 2240.00
TP1: 2300.00
TP2: 2360.00
TP3: 2440.00
Stop Loss: 2185.00
Momentum has clearly flipped to the upside. A continuation setup remains valid provided the price does not break back below the entry.
87
Log in to explore more content
Join global crypto users on Binance Square
⚡️ Get latest and useful information about crypto.
💬 Trusted by the world’s largest crypto exchange.
👍 Discover real insights from verified creators.
Email / Phone number
Trending Topics
BinanceSAFUFundTransferCompleted7499BTC
13,212 views
410 Discussing
BREAKING: Binance Recovers 90% of $6.3B - My Take
Guys, biggest recovery in crypto history just happened.
Binance just confirmed in its 3rd security update on Oct 31:
90% of the stolen assets have been replenished - up from 80% yesterday.
What happened?
Total breach: ∼$6.3B on Oct 29 (hot wallets)Binance set aside $6.34B from company funds to cover itSources used: Corporate Treasury + SAFU Fund ($1B fund) + Futures Insurance FundResult: 10 major tokens now 100% backed: $BTC, $ETH, $USDT, $BNB, $SOL, $USDC, $XRP, $USD1, $RLUSD, $ZECRemaining 10% are less liquid tokens, will take more time to sourceWithdrawals expected to resume Nov 1
My analysis: This is why Binance is still #1. No other exchange could cover $6.3B from its own pocket in 2 days. This shows SAFU actually works.
Is this enough to bring back trust? Or you are still worried?
Drop your opinion below - I will read all comments.
Binance #SAFU #CryptoRecovery #BinanceSecurity #BTC#binancesafufundtransfercompleted7499btc
True News
·23 Likes
·10.7k views
BinanceRecovery90% of stolen assets
58,107 views
117 Discussing
YiHe:ProofOfReserves:10TokensAt100%Backing
88,074 views
542 Discussing