
Roaib_Bn
1k Posts

Roaib_Bn
Report
Block User
HOLDER | SELF BELIEVER | NOT A PERSONAL ADVISER | JUST AN EDUCATOR 📚 | Learning. Growing. Sharing Knowledge.Future in progress.
33 Following
9.9K+ Followers
13.8K+ Liked
Posts
All
Quotes
Videos
Live
·
--
See translation
🔥 $NEAR Technical Update: Key Levels & Momentum Breakdown
📊 1. Market Snapshot
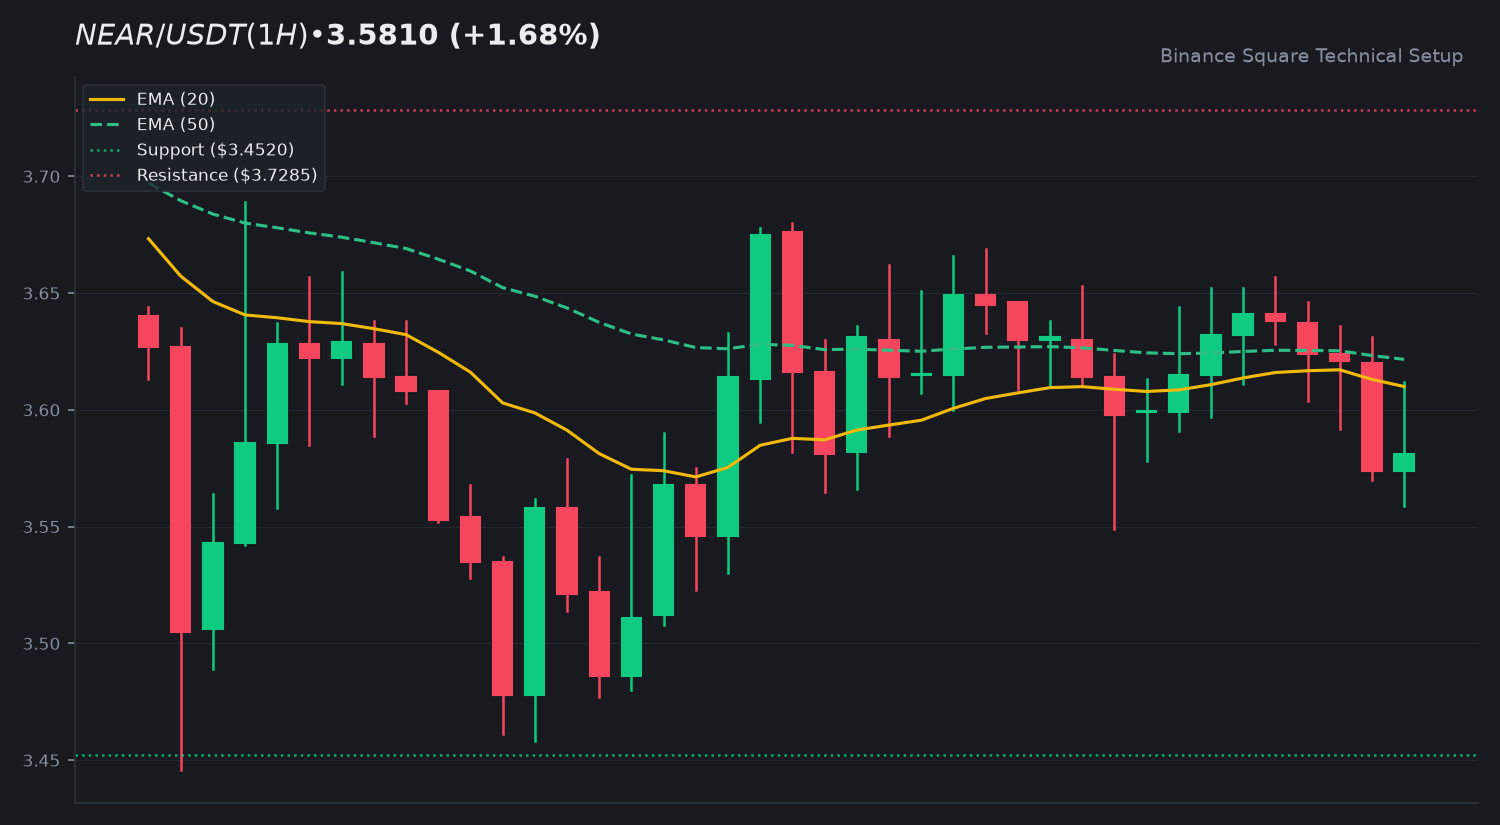
$NEAR is currently trading at 3.5810 USDT, reflecting a modest 1.68 percent increase over the last 24 hours. The asset shows a total 24-hour quote volume of 53,680,520 USDT, indicating neutral market participation with a volume ratio of 0.79x relative to the 20-day simple moving average.
📈 2. Technical Momentum & Indicator Bias
The price action remains within a broader downtrend, currently trading below both the 20-day EMA at 3.6100 and the 50-day EMA at 3.6216. This positioning suggests a persistent bearish bias in the short term. The RSI at 44.61 indicates a lack of strong directional momentum, hovering in neutral territory. Furthermore, the MACD histogram is printing at -0.0040, confirming that the MACD line remains slightly below the signal line, reinforcing the current consolidation phase.
🎯 3. Key Technical Levels to Watch
• 🟢 Resistance Zone: 3.7285 is the immediate level to watch. A break above this would require increased volume to challenge the EMA confluence.
• 🔴 Support Zone: 3.4520 serves as the primary support floor.
• 🛡️ Pivot Confluence: The 3.6200 region acts as a critical pivot where the EMA 20 and 50 converge.
💡 4. Technical Takeaway & Risk Management
Market participants are monitoring the interaction between the current price and the EMA cluster. A sustained move above the 3.6200 pivot would be required to shift the short-term technical outlook. Conversely, failing to hold the 3.4520 level may invite further testing of lower liquidity zones.
💬 5. Community Discussion
What is your technical outlook for $NEAR this week? Are you accumulating or waiting for confirmation? Drop your thoughts below! 👇
⚠️ 6. Disclaimer
Educational technical analysis only. Not financial advice (NFA). Crypto markets involve risk. Always DYOR.
$NEAR #NEAR #BinanceSquare
🔥 $NEAR Technical Update: Key Levels & Momentum Breakdown
📊 1. Market Snapshot
$NEAR is currently trading at 3.5810 USDT, reflecting a modest 1.68 percent increase over the last 24 hours. The asset shows a total 24-hour quote volume of 53,680,520 USDT, indicating neutral market participation with a volume ratio of 0.79x relative to the 20-day simple moving average.
📈 2. Technical Momentum & Indicator Bias
The price action remains within a broader downtrend, currently trading below both the 20-day EMA at 3.6100 and the 50-day EMA at 3.6216. This positioning suggests a persistent bearish bias in the short term. The RSI at 44.61 indicates a lack of strong directional momentum, hovering in neutral territory. Furthermore, the MACD histogram is printing at -0.0040, confirming that the MACD line remains slightly below the signal line, reinforcing the current consolidation phase.
🎯 3. Key Technical Levels to Watch
• 🟢 Resistance Zone: 3.7285 is the immediate level to watch. A break above this would require increased volume to challenge the EMA confluence.
• 🔴 Support Zone: 3.4520 serves as the primary support floor.
• 🛡️ Pivot Confluence: The 3.6200 region acts as a critical pivot where the EMA 20 and 50 converge.
💡 4. Technical Takeaway & Risk Management
Market participants are monitoring the interaction between the current price and the EMA cluster. A sustained move above the 3.6200 pivot would be required to shift the short-term technical outlook. Conversely, failing to hold the 3.4520 level may invite further testing of lower liquidity zones.
💬 5. Community Discussion
What is your technical outlook for $NEAR this week? Are you accumulating or waiting for confirmation? Drop your thoughts below! 👇
⚠️ 6. Disclaimer
Educational technical analysis only. Not financial advice (NFA). Crypto markets involve risk. Always DYOR.
$NEAR #NEAR #BinanceSquare
📊 1. Market Snapshot
$NEAR is currently trading at 3.5810 USDT, reflecting a modest 1.68 percent increase over the last 24 hours. The asset shows a total 24-hour quote volume of 53,680,520 USDT, indicating neutral market participation with a volume ratio of 0.79x relative to the 20-day simple moving average.
📈 2. Technical Momentum & Indicator Bias
The price action remains within a broader downtrend, currently trading below both the 20-day EMA at 3.6100 and the 50-day EMA at 3.6216. This positioning suggests a persistent bearish bias in the short term. The RSI at 44.61 indicates a lack of strong directional momentum, hovering in neutral territory. Furthermore, the MACD histogram is printing at -0.0040, confirming that the MACD line remains slightly below the signal line, reinforcing the current consolidation phase.
🎯 3. Key Technical Levels to Watch
• 🟢 Resistance Zone: 3.7285 is the immediate level to watch. A break above this would require increased volume to challenge the EMA confluence.
• 🔴 Support Zone: 3.4520 serves as the primary support floor.
• 🛡️ Pivot Confluence: The 3.6200 region acts as a critical pivot where the EMA 20 and 50 converge.
💡 4. Technical Takeaway & Risk Management
Market participants are monitoring the interaction between the current price and the EMA cluster. A sustained move above the 3.6200 pivot would be required to shift the short-term technical outlook. Conversely, failing to hold the 3.4520 level may invite further testing of lower liquidity zones.
💬 5. Community Discussion
What is your technical outlook for $NEAR this week? Are you accumulating or waiting for confirmation? Drop your thoughts below! 👇
⚠️ 6. Disclaimer
Educational technical analysis only. Not financial advice (NFA). Crypto markets involve risk. Always DYOR.
$NEAR #NEAR #BinanceSquare
2
·
--
See translation
🔥 $AVAX Technical Update: Key Levels & Momentum Breakdown
📊 1. Market Snapshot
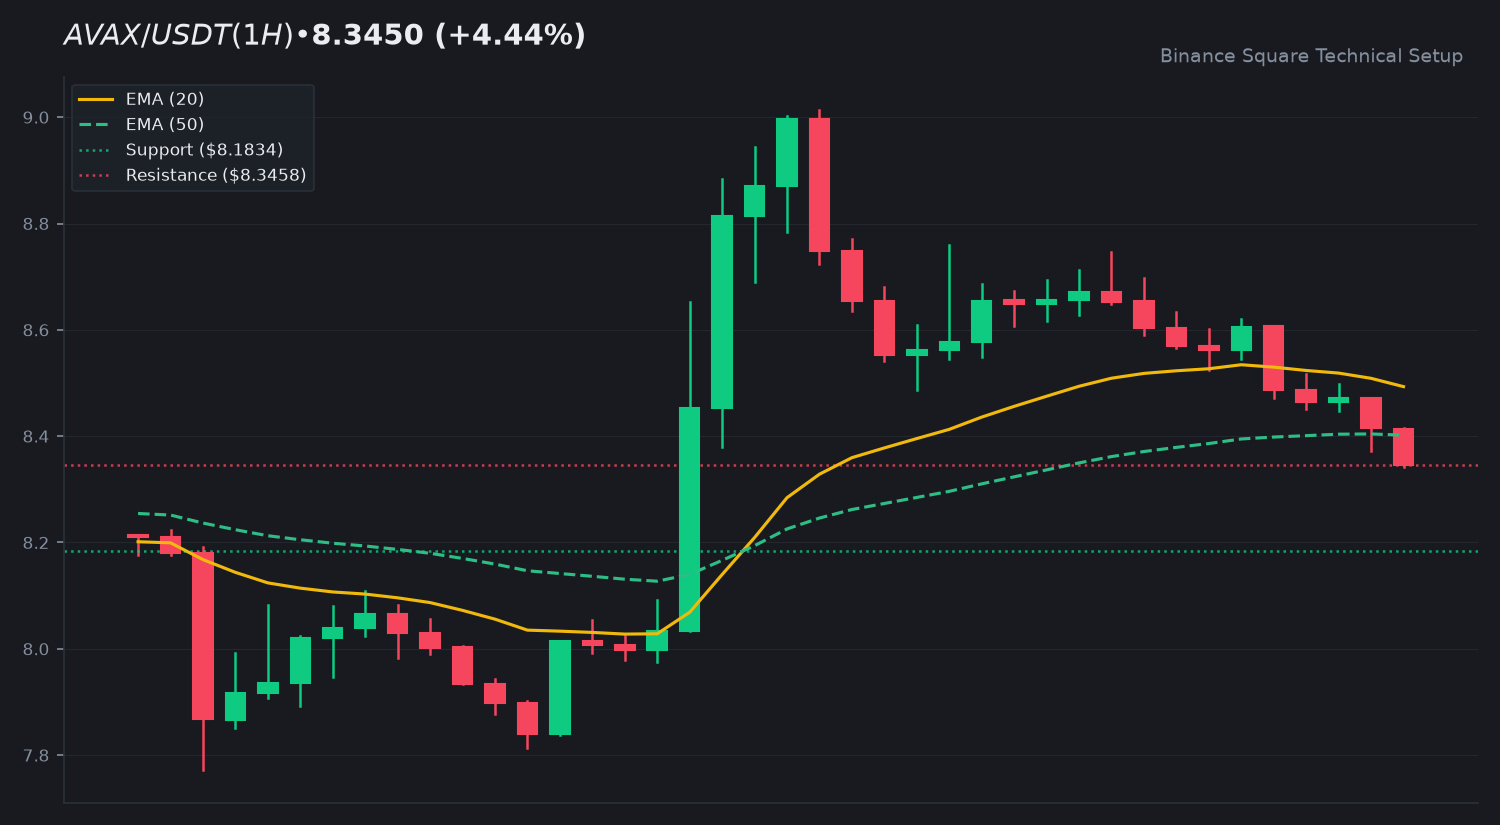
The asset $AVAX is currently trading at 8.3450 USDT, reflecting a 24h change of +4.44 percent. Trading activity remains subdued, with a 24h quote volume of 62,155,026 USDT. The current volume-to-SMA ratio of 0.3x indicates low market conviction as the asset navigates a period of consolidation.
📈 2. Technical Momentum & Indicator Bias
Current price action for $AVAX is positioned below both the EMA 20 (8.4932) and the EMA 50 (8.4019), suggesting a bearish posture in the short term. The RSI at 41.91 reflects a neutral-to-weak momentum state, lacking clear directional strength. Furthermore, the MACD histogram remains at -0.0475, indicating that selling pressure has not yet fully exhausted, though the convergence suggests a potential stabilization phase.
🎯 3. Key Technical Levels to Watch
• 🟢 Resistance Zone: Immediate resistance is located at 8.3458, with a secondary potential extension at 8.7470.
• 🔴 Support Zone: Initial support is established at 8.1834, followed by a deeper floor at 7.7935.
• 🛡️ Pivot Confluence: The 8.40-8.50 zone serves as a critical pivot confluence; reclaiming this area is essential for a shift in trend.
💡 4. Technical Takeaway & Risk Management
The current consolidation phase highlights the importance of monitoring the EMA dynamic levels. Traders often watch for a clean break above the EMA 50 to confirm a shift in market sentiment. Until volume increases, price action may remain range-bound between the established support and resistance levels.
💬 5. Community Discussion
What is your technical outlook for $AVAX this week? Are you accumulating or waiting for confirmation? Drop your thoughts below! 👇
⚠️ 6. Disclaimer
Educational technical analysis only. Not financial advice (NFA). Crypto markets involve risk. Always DYOR.
$AVAX #AVAX #BinanceSquare
🔥 $AVAX Technical Update: Key Levels & Momentum Breakdown
📊 1. Market Snapshot
The asset $AVAX is currently trading at 8.3450 USDT, reflecting a 24h change of +4.44 percent. Trading activity remains subdued, with a 24h quote volume of 62,155,026 USDT. The current volume-to-SMA ratio of 0.3x indicates low market conviction as the asset navigates a period of consolidation.
📈 2. Technical Momentum & Indicator Bias
Current price action for $AVAX is positioned below both the EMA 20 (8.4932) and the EMA 50 (8.4019), suggesting a bearish posture in the short term. The RSI at 41.91 reflects a neutral-to-weak momentum state, lacking clear directional strength. Furthermore, the MACD histogram remains at -0.0475, indicating that selling pressure has not yet fully exhausted, though the convergence suggests a potential stabilization phase.
🎯 3. Key Technical Levels to Watch
• 🟢 Resistance Zone: Immediate resistance is located at 8.3458, with a secondary potential extension at 8.7470.
• 🔴 Support Zone: Initial support is established at 8.1834, followed by a deeper floor at 7.7935.
• 🛡️ Pivot Confluence: The 8.40-8.50 zone serves as a critical pivot confluence; reclaiming this area is essential for a shift in trend.
💡 4. Technical Takeaway & Risk Management
The current consolidation phase highlights the importance of monitoring the EMA dynamic levels. Traders often watch for a clean break above the EMA 50 to confirm a shift in market sentiment. Until volume increases, price action may remain range-bound between the established support and resistance levels.
💬 5. Community Discussion
What is your technical outlook for $AVAX this week? Are you accumulating or waiting for confirmation? Drop your thoughts below! 👇
⚠️ 6. Disclaimer
Educational technical analysis only. Not financial advice (NFA). Crypto markets involve risk. Always DYOR.
$AVAX #AVAX #BinanceSquare
📊 1. Market Snapshot
The asset $AVAX is currently trading at 8.3450 USDT, reflecting a 24h change of +4.44 percent. Trading activity remains subdued, with a 24h quote volume of 62,155,026 USDT. The current volume-to-SMA ratio of 0.3x indicates low market conviction as the asset navigates a period of consolidation.
📈 2. Technical Momentum & Indicator Bias
Current price action for $AVAX is positioned below both the EMA 20 (8.4932) and the EMA 50 (8.4019), suggesting a bearish posture in the short term. The RSI at 41.91 reflects a neutral-to-weak momentum state, lacking clear directional strength. Furthermore, the MACD histogram remains at -0.0475, indicating that selling pressure has not yet fully exhausted, though the convergence suggests a potential stabilization phase.
🎯 3. Key Technical Levels to Watch
• 🟢 Resistance Zone: Immediate resistance is located at 8.3458, with a secondary potential extension at 8.7470.
• 🔴 Support Zone: Initial support is established at 8.1834, followed by a deeper floor at 7.7935.
• 🛡️ Pivot Confluence: The 8.40-8.50 zone serves as a critical pivot confluence; reclaiming this area is essential for a shift in trend.
💡 4. Technical Takeaway & Risk Management
The current consolidation phase highlights the importance of monitoring the EMA dynamic levels. Traders often watch for a clean break above the EMA 50 to confirm a shift in market sentiment. Until volume increases, price action may remain range-bound between the established support and resistance levels.
💬 5. Community Discussion
What is your technical outlook for $AVAX this week? Are you accumulating or waiting for confirmation? Drop your thoughts below! 👇
⚠️ 6. Disclaimer
Educational technical analysis only. Not financial advice (NFA). Crypto markets involve risk. Always DYOR.
$AVAX #AVAX #BinanceSquare
30
·
--
Article
See translation
🚨 PIVOT SIGNALS: 4 CANDLESTICKS THAT WARN A BIG MOVE IS COMING 👇🚨 PIVOT SIGNALS: 4 CANDLESTICKS THAT WARN A BIG MOVE IS COMING 👇
Understand price action at an institutional level. Here is your definitive masterclass on the most reliable candlestick formations every crypto trader must master to navigate $BTC and $ETH market volatility.
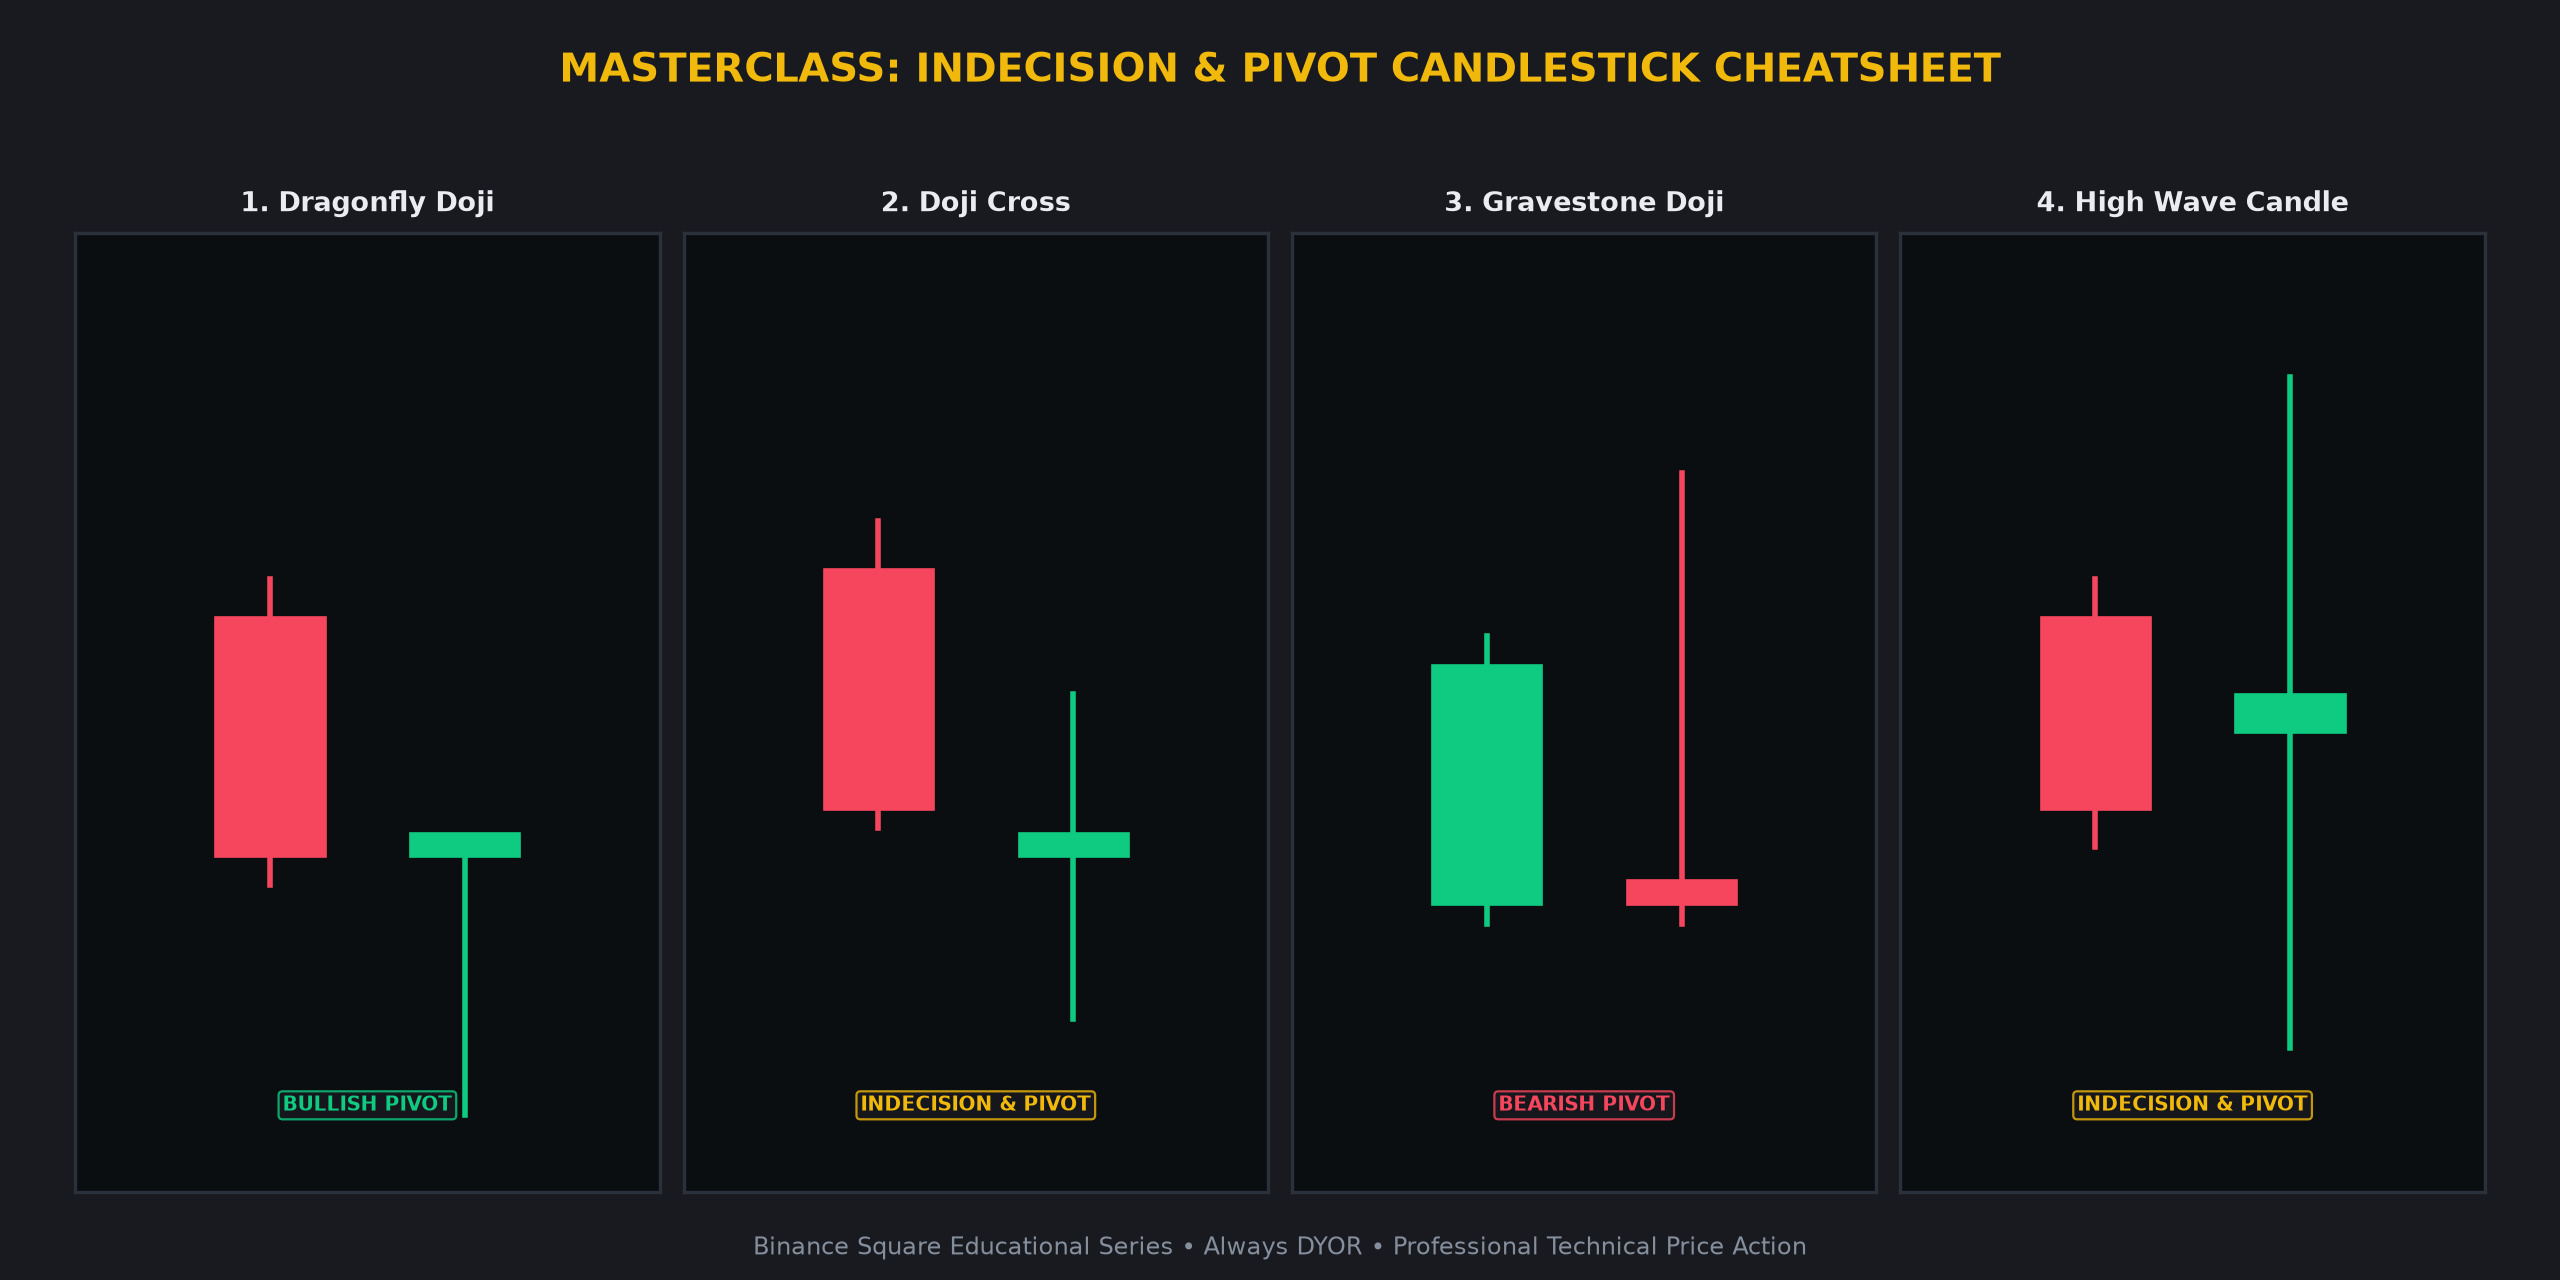
1 🐉 Dragonfly Doji 🐉
• Candlestick Anatomy: T-shaped candle where open, high, and close are at the top, accompanied by a long lower shadow.
• Market Psychology: Sellers pushed the price to deep lows, but buyers aggressively stepped in to reclaim the open level.
• High-Confidence Confirmation: Look for this at support floors. A break above the high of the Dragonfly candle often signals a shift in momentum.
2 ⚖️ Doji Cross ⚖️
• Candlestick Anatomy: Virtually identical open and close prices, creating a cross or plus shape.
• Market Psychology: Total equilibrium between buyers and sellers. It signals that the current trend is pausing, preparing the stage for violent expansion.
• High-Confidence Confirmation: Wait for a breakout from the high or low of the Doji range. Volume expansion during the breakout is key.
3 🪦 Gravestone Doji 🪦
• Candlestick Anatomy: Inverted T-shaped candle with open, low, and close at the bottom and a long upper shadow.
• Market Psychology: Bulls staged an aggressive rally, but the move was completely rejected by the end of the period, showing exhaustion.
• High-Confidence Confirmation: Look for this at resistance zones. A close below the low of the Gravestone is the primary technical trigger.
4 🌊 High Wave Candle 🌊
• Candlestick Anatomy: Extremely long upper and lower shadows with a tiny real body in the middle.
• Market Psychology: A violent tug of war between bulls and bears resulting in complete market exhaustion and uncertainty.
• High-Confidence Confirmation: Often appears at the end of a long trend. The break of the extreme shadow indicates the direction of the next move.
💡 Why Master These Candlestick Formations?
• Spot high-probability reversals and continuation phases before the retail crowd.
• Define exact risk-to-reward boundaries with clear invalidation levels.
• Combine with volume confirmation and dynamic moving averages like the EMA 20 or 50.
💬 Community Masterclass Discussion:
Which of these 4 candlestick setups has yielded the highest win-rate in your crypto journey? Share your thoughts below! 👇
⚠️ Educational Masterclass Disclaimer:
This content is for educational purposes only and does not constitute financial advice (NFA). Cryptocurrency markets carry inherent volatility. Always manage risk prudently and conduct your own research (DYOR).
$BTC $ETH SOL #BinanceSquare #CryptoTrading TechnicalAnalysis
🚨 PIVOT SIGNALS: 4 CANDLESTICKS THAT WARN A BIG MOVE IS COMING 👇
🚨 PIVOT SIGNALS: 4 CANDLESTICKS THAT WARN A BIG MOVE IS COMING 👇
Understand price action at an institutional level. Here is your definitive masterclass on the most reliable candlestick formations every crypto trader must master to navigate $BTC and $ETH market volatility.
1 🐉 Dragonfly Doji 🐉
• Candlestick Anatomy: T-shaped candle where open, high, and close are at the top, accompanied by a long lower shadow.
• Market Psychology: Sellers pushed the price to deep lows, but buyers aggressively stepped in to reclaim the open level.
• High-Confidence Confirmation: Look for this at support floors. A break above the high of the Dragonfly candle often signals a shift in momentum.
2 ⚖️ Doji Cross ⚖️
• Candlestick Anatomy: Virtually identical open and close prices, creating a cross or plus shape.
• Market Psychology: Total equilibrium between buyers and sellers. It signals that the current trend is pausing, preparing the stage for violent expansion.
• High-Confidence Confirmation: Wait for a breakout from the high or low of the Doji range. Volume expansion during the breakout is key.
3 🪦 Gravestone Doji 🪦
• Candlestick Anatomy: Inverted T-shaped candle with open, low, and close at the bottom and a long upper shadow.
• Market Psychology: Bulls staged an aggressive rally, but the move was completely rejected by the end of the period, showing exhaustion.
• High-Confidence Confirmation: Look for this at resistance zones. A close below the low of the Gravestone is the primary technical trigger.
4 🌊 High Wave Candle 🌊
• Candlestick Anatomy: Extremely long upper and lower shadows with a tiny real body in the middle.
• Market Psychology: A violent tug of war between bulls and bears resulting in complete market exhaustion and uncertainty.
• High-Confidence Confirmation: Often appears at the end of a long trend. The break of the extreme shadow indicates the direction of the next move.
💡 Why Master These Candlestick Formations?
• Spot high-probability reversals and continuation phases before the retail crowd.
• Define exact risk-to-reward boundaries with clear invalidation levels.
• Combine with volume confirmation and dynamic moving averages like the EMA 20 or 50.
💬 Community Masterclass Discussion:
Which of these 4 candlestick setups has yielded the highest win-rate in your crypto journey? Share your thoughts below! 👇
⚠️ Educational Masterclass Disclaimer:
This content is for educational purposes only and does not constitute financial advice (NFA). Cryptocurrency markets carry inherent volatility. Always manage risk prudently and conduct your own research (DYOR).
$BTC $ETH SOL #BinanceSquare #CryptoTrading TechnicalAnalysis
Understand price action at an institutional level. Here is your definitive masterclass on the most reliable candlestick formations every crypto trader must master to navigate $BTC and $ETH market volatility.
1 🐉 Dragonfly Doji 🐉
• Candlestick Anatomy: T-shaped candle where open, high, and close are at the top, accompanied by a long lower shadow.
• Market Psychology: Sellers pushed the price to deep lows, but buyers aggressively stepped in to reclaim the open level.
• High-Confidence Confirmation: Look for this at support floors. A break above the high of the Dragonfly candle often signals a shift in momentum.
2 ⚖️ Doji Cross ⚖️
• Candlestick Anatomy: Virtually identical open and close prices, creating a cross or plus shape.
• Market Psychology: Total equilibrium between buyers and sellers. It signals that the current trend is pausing, preparing the stage for violent expansion.
• High-Confidence Confirmation: Wait for a breakout from the high or low of the Doji range. Volume expansion during the breakout is key.
3 🪦 Gravestone Doji 🪦
• Candlestick Anatomy: Inverted T-shaped candle with open, low, and close at the bottom and a long upper shadow.
• Market Psychology: Bulls staged an aggressive rally, but the move was completely rejected by the end of the period, showing exhaustion.
• High-Confidence Confirmation: Look for this at resistance zones. A close below the low of the Gravestone is the primary technical trigger.
4 🌊 High Wave Candle 🌊
• Candlestick Anatomy: Extremely long upper and lower shadows with a tiny real body in the middle.
• Market Psychology: A violent tug of war between bulls and bears resulting in complete market exhaustion and uncertainty.
• High-Confidence Confirmation: Often appears at the end of a long trend. The break of the extreme shadow indicates the direction of the next move.
💡 Why Master These Candlestick Formations?
• Spot high-probability reversals and continuation phases before the retail crowd.
• Define exact risk-to-reward boundaries with clear invalidation levels.
• Combine with volume confirmation and dynamic moving averages like the EMA 20 or 50.
💬 Community Masterclass Discussion:
Which of these 4 candlestick setups has yielded the highest win-rate in your crypto journey? Share your thoughts below! 👇
⚠️ Educational Masterclass Disclaimer:
This content is for educational purposes only and does not constitute financial advice (NFA). Cryptocurrency markets carry inherent volatility. Always manage risk prudently and conduct your own research (DYOR).
$BTC $ETH SOL #BinanceSquare #CryptoTrading TechnicalAnalysis
1
·
--
See translation
🔥 $PEPE Technical Update: Key Levels & Momentum Breakdown
📊 1. Market Snapshot
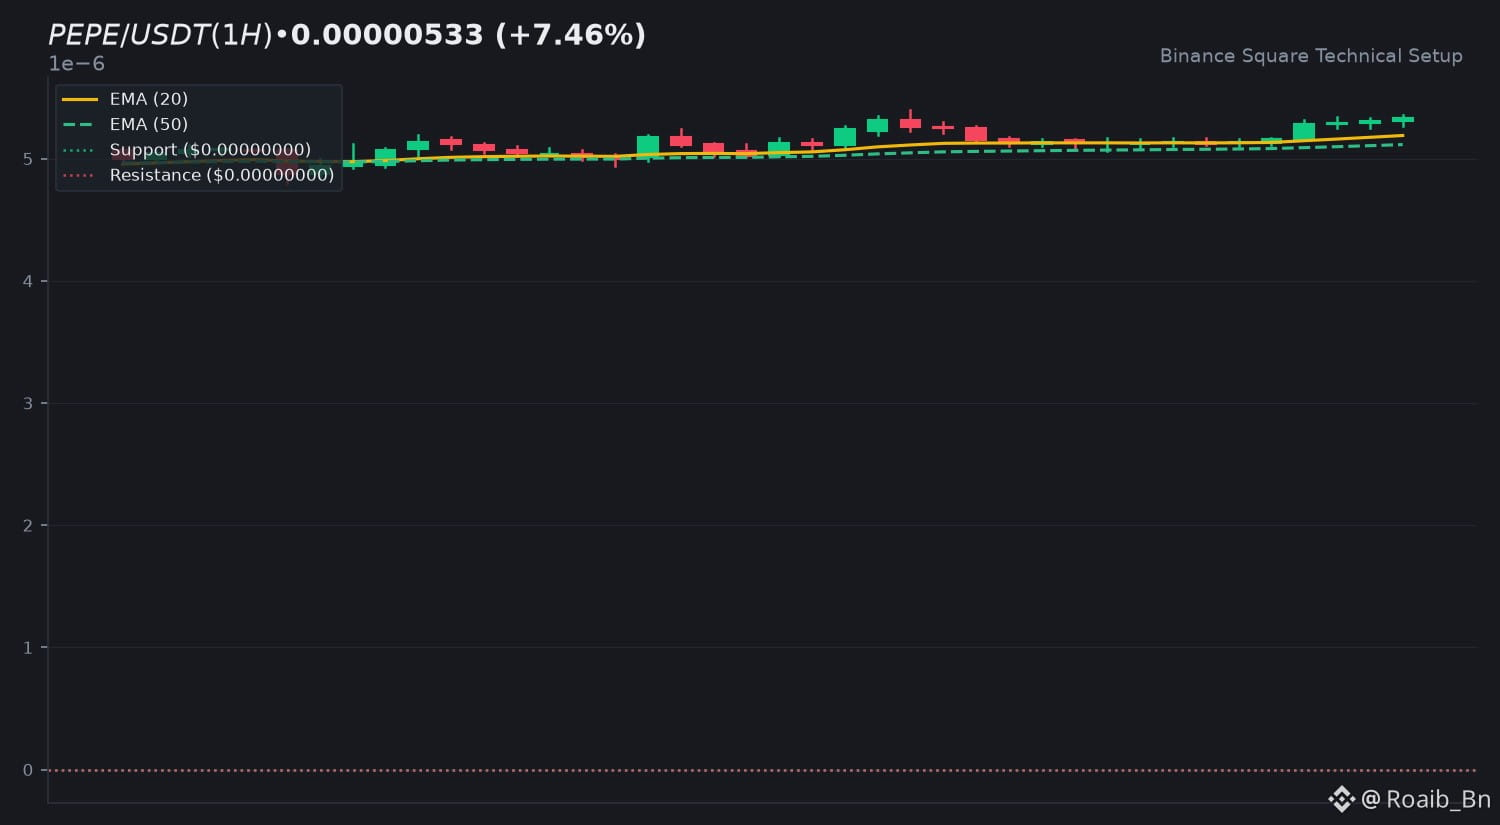
The $PEPE token is displaying a positive intraday recovery, posting a 24h gain of +7.46%. Trading activity remains moderately active with a 24h quote volume of $73,535,318 USDT, reflecting steady participation across spot order books.
📈 2. Technical Momentum & Indicator Bias
Price action is attempting a bullish trend reversal above key moving averages. The 14-period RSI sits at 66.67, indicating rising bullish momentum while remaining safely below overbought territory. The MACD histogram prints a positive reading of +0.0000 alongside a supportive crossover alignment, suggesting buyers maintain near-term structural control. Volume is tracking at a neutral 1.11x ratio relative to the 20-period SMA.
🎯 3. Key Technical Levels to Watch
• 🟢 Resistance Zone: Immediate overhead supply lies near the 24h high boundary, with secondary extension targets waiting higher up.
• 🔴 Support Zone: First structural support rests near the EMA 20 value area, backed by the deeper EMA 50 floor.
• 🛡️ Pivot Confluence: The dynamic midpoint between the short-term averages serves as the primary pivot for intraday directional bias.
💡 4. Technical Takeaway & Risk Management
Traders should observe how price reacts when testing the EMA dynamic levels. Sustained acceptance above the current moving average stack supports continuation scenarios, whereas a loss of immediate support could signal a retest of lower liquidity zones.
💬 5. Community Discussion
What is your technical outlook for $PEPE this week? Are you accumulating near support or waiting for confirmation above resistance? Drop your thoughts below! 👇
⚠️ 6. Disclaimer
Educational technical analysis only. Not financial advice (NFA). Crypto markets involve risk. Always DYOR.
$PEPE #PEPE #BinanceSquare
🔥 $PEPE Technical Update: Key Levels & Momentum Breakdown
📊 1. Market Snapshot
The $PEPE token is displaying a positive intraday recovery, posting a 24h gain of +7.46%. Trading activity remains moderately active with a 24h quote volume of $73,535,318 USDT, reflecting steady participation across spot order books.
📈 2. Technical Momentum & Indicator Bias
Price action is attempting a bullish trend reversal above key moving averages. The 14-period RSI sits at 66.67, indicating rising bullish momentum while remaining safely below overbought territory. The MACD histogram prints a positive reading of +0.0000 alongside a supportive crossover alignment, suggesting buyers maintain near-term structural control. Volume is tracking at a neutral 1.11x ratio relative to the 20-period SMA.
🎯 3. Key Technical Levels to Watch
• 🟢 Resistance Zone: Immediate overhead supply lies near the 24h high boundary, with secondary extension targets waiting higher up.
• 🔴 Support Zone: First structural support rests near the EMA 20 value area, backed by the deeper EMA 50 floor.
• 🛡️ Pivot Confluence: The dynamic midpoint between the short-term averages serves as the primary pivot for intraday directional bias.
💡 4. Technical Takeaway & Risk Management
Traders should observe how price reacts when testing the EMA dynamic levels. Sustained acceptance above the current moving average stack supports continuation scenarios, whereas a loss of immediate support could signal a retest of lower liquidity zones.
💬 5. Community Discussion
What is your technical outlook for $PEPE this week? Are you accumulating near support or waiting for confirmation above resistance? Drop your thoughts below! 👇
⚠️ 6. Disclaimer
Educational technical analysis only. Not financial advice (NFA). Crypto markets involve risk. Always DYOR.
$PEPE #PEPE #BinanceSquare
📊 1. Market Snapshot
The $PEPE token is displaying a positive intraday recovery, posting a 24h gain of +7.46%. Trading activity remains moderately active with a 24h quote volume of $73,535,318 USDT, reflecting steady participation across spot order books.
📈 2. Technical Momentum & Indicator Bias
Price action is attempting a bullish trend reversal above key moving averages. The 14-period RSI sits at 66.67, indicating rising bullish momentum while remaining safely below overbought territory. The MACD histogram prints a positive reading of +0.0000 alongside a supportive crossover alignment, suggesting buyers maintain near-term structural control. Volume is tracking at a neutral 1.11x ratio relative to the 20-period SMA.
🎯 3. Key Technical Levels to Watch
• 🟢 Resistance Zone: Immediate overhead supply lies near the 24h high boundary, with secondary extension targets waiting higher up.
• 🔴 Support Zone: First structural support rests near the EMA 20 value area, backed by the deeper EMA 50 floor.
• 🛡️ Pivot Confluence: The dynamic midpoint between the short-term averages serves as the primary pivot for intraday directional bias.
💡 4. Technical Takeaway & Risk Management
Traders should observe how price reacts when testing the EMA dynamic levels. Sustained acceptance above the current moving average stack supports continuation scenarios, whereas a loss of immediate support could signal a retest of lower liquidity zones.
💬 5. Community Discussion
What is your technical outlook for $PEPE this week? Are you accumulating near support or waiting for confirmation above resistance? Drop your thoughts below! 👇
⚠️ 6. Disclaimer
Educational technical analysis only. Not financial advice (NFA). Crypto markets involve risk. Always DYOR.
$PEPE #PEPE #BinanceSquare
50
·
--
See translation
🔥 $BNB Technical Update: Key Levels & Momentum Breakdown
📊 1. Market Snapshot
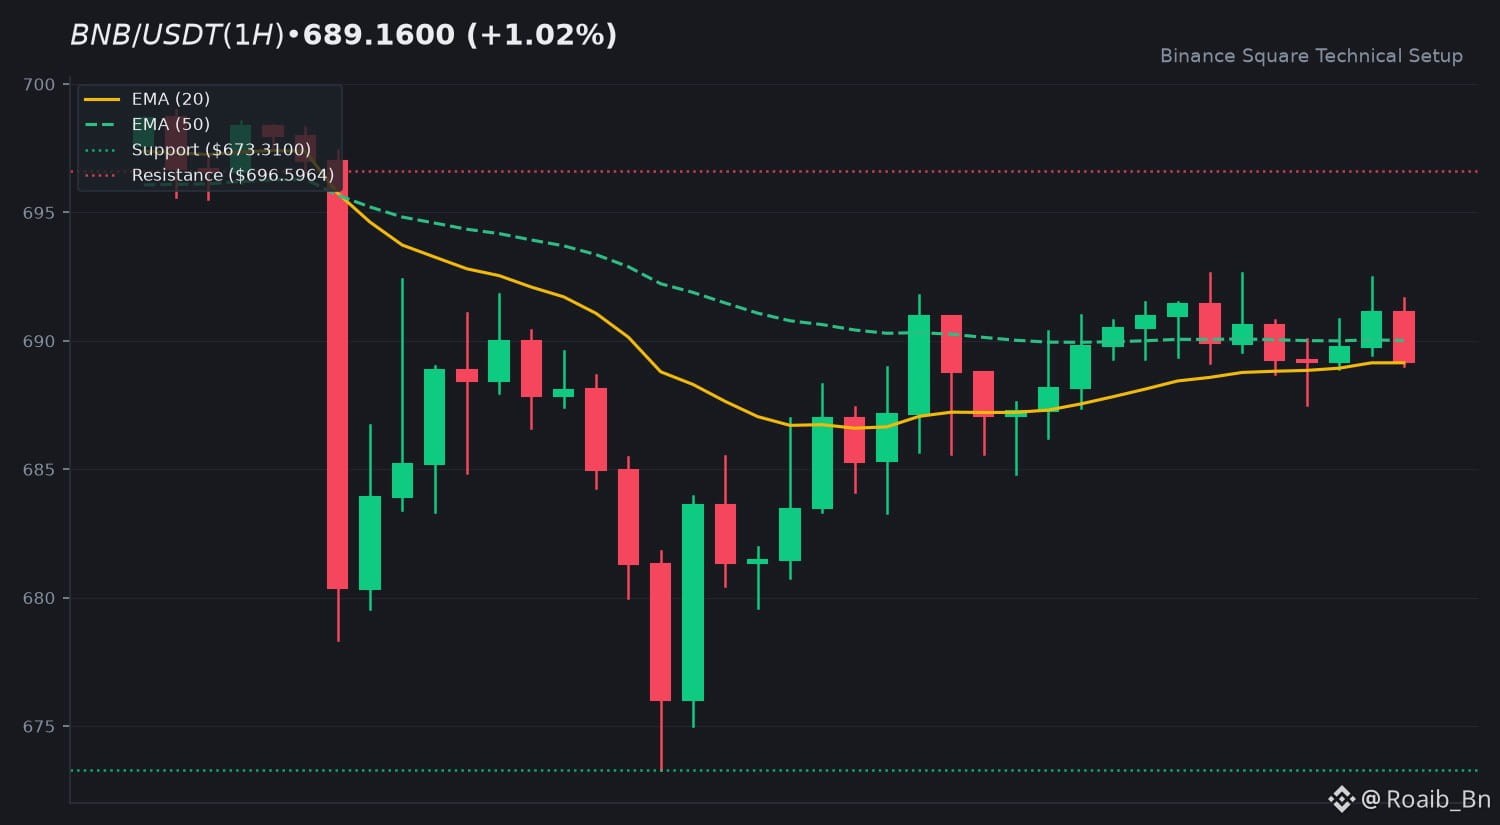
$BNB is currently trading at $689.16, registering a modest 24-hour gain of +1.02 percent. The asset recorded a daily trading high of 692.64 alongside a low of 673.31, backed by a 24-hour quote volume of approximately 75.35 million USDT.
📈 2. Technical Momentum & Indicator Bias
Price action hovers closely around the EMA 20 sitting at $689.15 and the EMA 50 positioned at 690.01, indicating short-term equilibrium. The 14-period RSI prints precisely at 50.01, signaling a completely neutral market bias without directional overextension. Meanwhile, the MACD histogram shows a minor positive reading of +0.2759 with the MACD line crossing slightly above the signal line. Volume remains subdued at 0.41x relative to the 20-period SMA, pointing to consolidation.
🎯 3. Key Technical Levels to Watch
• 🟢 Resistance Zone: Immediate overhead resistance stands near 696.60, aligning with the upper boundary of the current range.
• 🔴 Support Zone: Immediate structural support rests at the 24-hour low of 673.31.
• 🛡️ Pivot Confluence: The 690.00 region serves as a crucial inflection point defined by the converging EMA 50.
💡 4. Technical Takeaway & Risk Management
Price action compression near key moving averages suggests market participants are awaiting volume expansion. Prudent chart monitoring involves observing how candles close relative to the EMA cluster before anticipating any persistent directional movement.
💬 5. Community Discussion
What is your technical outlook for $BNB this week? Are you accumulating near support or waiting for volume confirmation? Drop your thoughts below! 👇
⚠️ 6. Disclaimer
Educational technical analysis only. Not financial advice (NFA). Crypto markets involve risk. Always DYOR.
$BNB #BNB #BinanceSquare
🔥 $BNB Technical Update: Key Levels & Momentum Breakdown
📊 1. Market Snapshot
$BNB is currently trading at $689.16, registering a modest 24-hour gain of +1.02 percent. The asset recorded a daily trading high of 692.64 alongside a low of 673.31, backed by a 24-hour quote volume of approximately 75.35 million USDT.
📈 2. Technical Momentum & Indicator Bias
Price action hovers closely around the EMA 20 sitting at $689.15 and the EMA 50 positioned at 690.01, indicating short-term equilibrium. The 14-period RSI prints precisely at 50.01, signaling a completely neutral market bias without directional overextension. Meanwhile, the MACD histogram shows a minor positive reading of +0.2759 with the MACD line crossing slightly above the signal line. Volume remains subdued at 0.41x relative to the 20-period SMA, pointing to consolidation.
🎯 3. Key Technical Levels to Watch
• 🟢 Resistance Zone: Immediate overhead resistance stands near 696.60, aligning with the upper boundary of the current range.
• 🔴 Support Zone: Immediate structural support rests at the 24-hour low of 673.31.
• 🛡️ Pivot Confluence: The 690.00 region serves as a crucial inflection point defined by the converging EMA 50.
💡 4. Technical Takeaway & Risk Management
Price action compression near key moving averages suggests market participants are awaiting volume expansion. Prudent chart monitoring involves observing how candles close relative to the EMA cluster before anticipating any persistent directional movement.
💬 5. Community Discussion
What is your technical outlook for $BNB this week? Are you accumulating near support or waiting for volume confirmation? Drop your thoughts below! 👇
⚠️ 6. Disclaimer
Educational technical analysis only. Not financial advice (NFA). Crypto markets involve risk. Always DYOR.
$BNB #BNB #BinanceSquare
📊 1. Market Snapshot
$BNB is currently trading at $689.16, registering a modest 24-hour gain of +1.02 percent. The asset recorded a daily trading high of 692.64 alongside a low of 673.31, backed by a 24-hour quote volume of approximately 75.35 million USDT.
📈 2. Technical Momentum & Indicator Bias
Price action hovers closely around the EMA 20 sitting at $689.15 and the EMA 50 positioned at 690.01, indicating short-term equilibrium. The 14-period RSI prints precisely at 50.01, signaling a completely neutral market bias without directional overextension. Meanwhile, the MACD histogram shows a minor positive reading of +0.2759 with the MACD line crossing slightly above the signal line. Volume remains subdued at 0.41x relative to the 20-period SMA, pointing to consolidation.
🎯 3. Key Technical Levels to Watch
• 🟢 Resistance Zone: Immediate overhead resistance stands near 696.60, aligning with the upper boundary of the current range.
• 🔴 Support Zone: Immediate structural support rests at the 24-hour low of 673.31.
• 🛡️ Pivot Confluence: The 690.00 region serves as a crucial inflection point defined by the converging EMA 50.
💡 4. Technical Takeaway & Risk Management
Price action compression near key moving averages suggests market participants are awaiting volume expansion. Prudent chart monitoring involves observing how candles close relative to the EMA cluster before anticipating any persistent directional movement.
💬 5. Community Discussion
What is your technical outlook for $BNB this week? Are you accumulating near support or waiting for volume confirmation? Drop your thoughts below! 👇
⚠️ 6. Disclaimer
Educational technical analysis only. Not financial advice (NFA). Crypto markets involve risk. Always DYOR.
$BNB #BNB #BinanceSquare
15
·
--
Article
See translation
🚨 5 ESSENTIAL CANDLESTICK PATTERNS TO READ CRYPTO CHARTS LIKE A PRO 👇🚨 5 ESSENTIAL CANDLESTICK PATTERNS TO READ CRYPTO CHARTS LIKE A PRO 👇
Understand price action at an institutional level. Here is your definitive masterclass on the most reliable candlestick formations every crypto market participant must master across $BTC and $ETH charts.
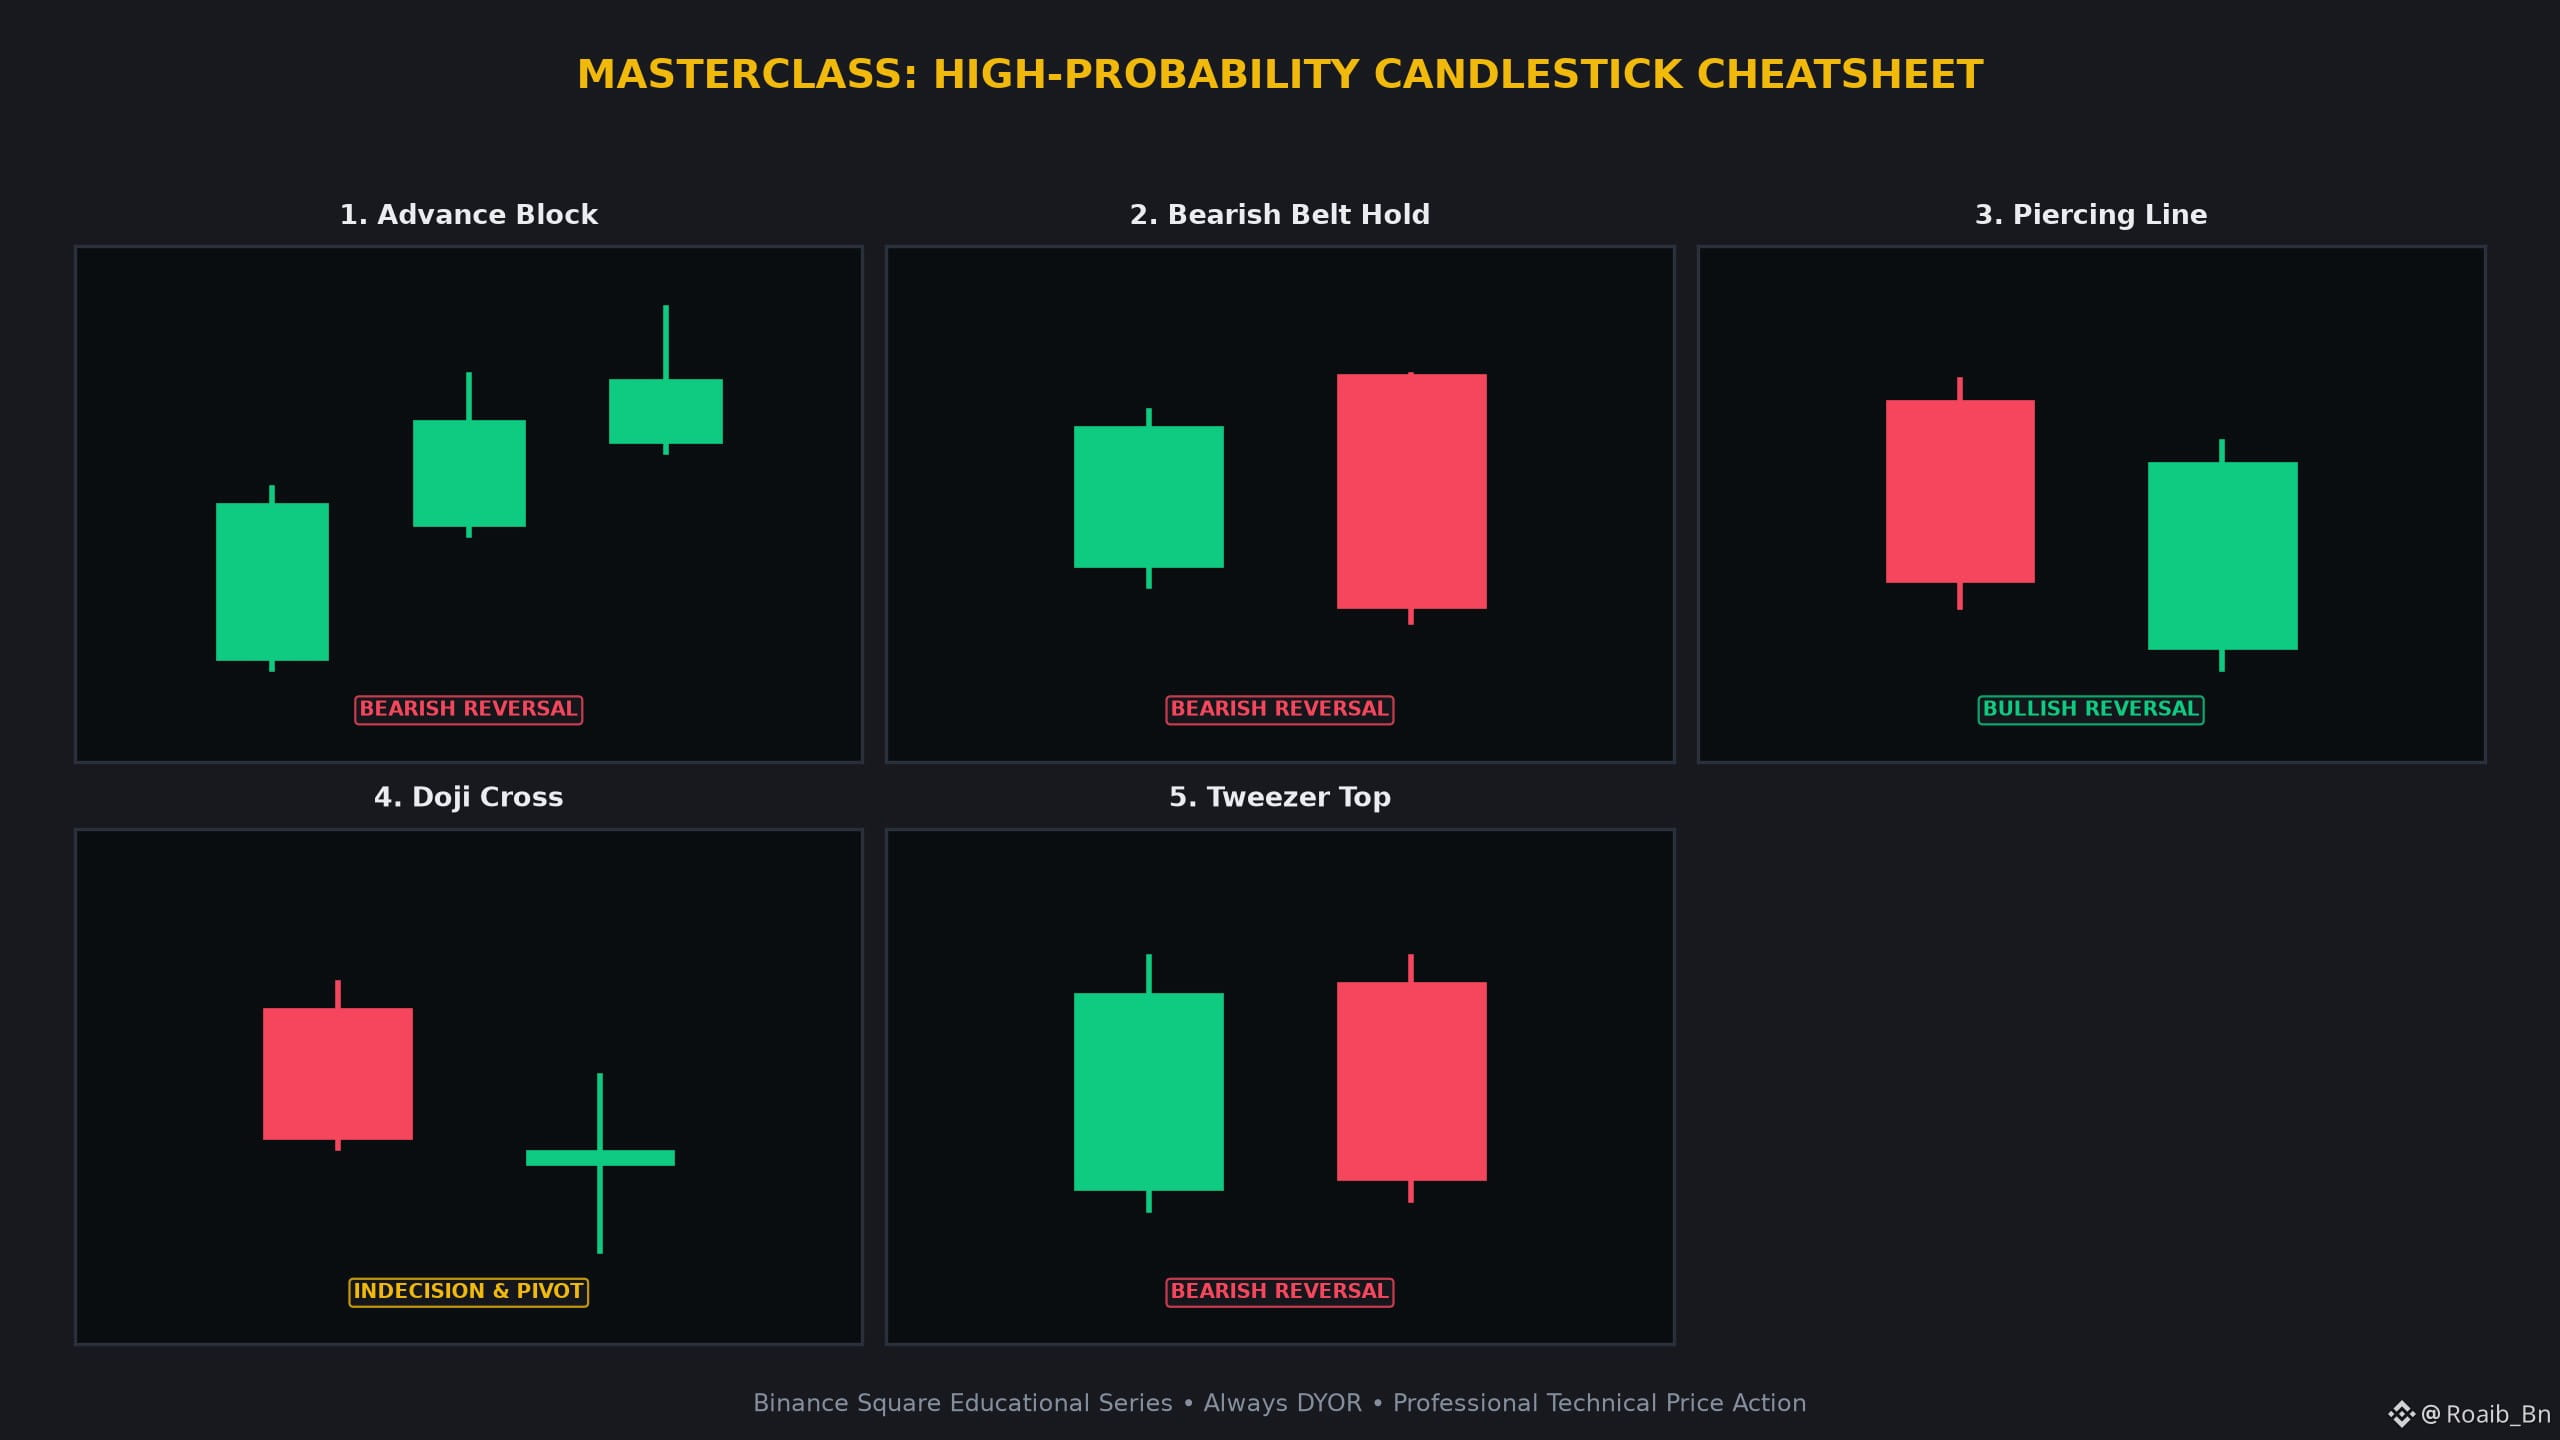
1. Advance Block 🚧
• Candlestick Anatomy: Three consecutive green candles showing progressively smaller bodies and lengthening upper wicks.
• Market Psychology: Upward momentum is steadily exhausting as price encounters heavy overhead institutional supply.
• High-Confidence Confirmation: Look for a subsequent red candle closing below the midpoint of the second body to confirm exhaustion.
2. Bearish Belt Hold 🛑
• Candlestick Anatomy: A single session opening at the absolute high of the period with zero upper wick and closing near the low.
• Market Psychology: Sellers seize total control from the opening bell, aggressively dumping inventory throughout the period.
• High-Confidence Confirmation: Price breaking beneath the low of the belt hold candle validates the continuation of downward pressure.
3. Piercing Line ⚡
• Candlestick Anatomy: A large red candle followed by a green candle opening below the prior low and closing past the 50 percent midpoint.
• Market Psychology: Bears fail to sustain downside follow-through on a gap down, allowing bulls to aggressively reclaim key value areas.
• High-Confidence Confirmation: Watch for rising volume on the recovery green candle alongside confirmation on lower timeframes.
4. Doji Cross ⚖️
• Candlestick Anatomy: Virtually identical open and close prices featuring balanced upper and lower wicks, creating a classic cross shape.
• Market Psychology: Total equilibrium between aggressive buyers and sellers, preparing the stage for subsequent volatility expansion.
• High-Confidence Confirmation: Trade the breakout of the high or low range established by the Doji candle rather than guessing direction.
5. Tweezer Top 📌
• Candlestick Anatomy: Consecutive green and red candles touching the exact same high resistance point before pulling back.
• Market Psychology: A double rejection at a major overhead resistance level confirming a stubborn ceiling and fading buyer demand.
• High-Confidence Confirmation: A breakdown below the internal swing low separating the two matching peaks confirms the bearish reversal.
---
💡 Why Master These Candlestick Formations?
• Spot high-probability reversals and continuation phases before the broader retail crowd enters.
• Define exact risk-to-reward boundaries with clear structural invalidation levels.
• Combine with volume confirmation and dynamic moving averages like the EMA 20 and 50.
💬 Community Masterclass Discussion:
Which of these 5 candlestick setups has yielded the highest accuracy in your chart analysis journey? Share your perspective below! 👇
⚠️ Educational Masterclass Disclaimer:
This content is for educational purposes only and does not constitute financial advice (NFA). Cryptocurrency markets carry inherent volatility. Always manage risk prudently and conduct your own research (DYOR).
$BTC $ETH SOL #BinanceSquare #CryptoTrading TechnicalAnalysis
🚨 5 ESSENTIAL CANDLESTICK PATTERNS TO READ CRYPTO CHARTS LIKE A PRO 👇
🚨 5 ESSENTIAL CANDLESTICK PATTERNS TO READ CRYPTO CHARTS LIKE A PRO 👇
Understand price action at an institutional level. Here is your definitive masterclass on the most reliable candlestick formations every crypto market participant must master across $BTC and $ETH charts.
1. Advance Block 🚧
• Candlestick Anatomy: Three consecutive green candles showing progressively smaller bodies and lengthening upper wicks.
• Market Psychology: Upward momentum is steadily exhausting as price encounters heavy overhead institutional supply.
• High-Confidence Confirmation: Look for a subsequent red candle closing below the midpoint of the second body to confirm exhaustion.
2. Bearish Belt Hold 🛑
• Candlestick Anatomy: A single session opening at the absolute high of the period with zero upper wick and closing near the low.
• Market Psychology: Sellers seize total control from the opening bell, aggressively dumping inventory throughout the period.
• High-Confidence Confirmation: Price breaking beneath the low of the belt hold candle validates the continuation of downward pressure.
3. Piercing Line ⚡
• Candlestick Anatomy: A large red candle followed by a green candle opening below the prior low and closing past the 50 percent midpoint.
• Market Psychology: Bears fail to sustain downside follow-through on a gap down, allowing bulls to aggressively reclaim key value areas.
• High-Confidence Confirmation: Watch for rising volume on the recovery green candle alongside confirmation on lower timeframes.
4. Doji Cross ⚖️
• Candlestick Anatomy: Virtually identical open and close prices featuring balanced upper and lower wicks, creating a classic cross shape.
• Market Psychology: Total equilibrium between aggressive buyers and sellers, preparing the stage for subsequent volatility expansion.
• High-Confidence Confirmation: Trade the breakout of the high or low range established by the Doji candle rather than guessing direction.
5. Tweezer Top 📌
• Candlestick Anatomy: Consecutive green and red candles touching the exact same high resistance point before pulling back.
• Market Psychology: A double rejection at a major overhead resistance level confirming a stubborn ceiling and fading buyer demand.
• High-Confidence Confirmation: A breakdown below the internal swing low separating the two matching peaks confirms the bearish reversal.
---
💡 Why Master These Candlestick Formations?
• Spot high-probability reversals and continuation phases before the broader retail crowd enters.
• Define exact risk-to-reward boundaries with clear structural invalidation levels.
• Combine with volume confirmation and dynamic moving averages like the EMA 20 and 50.
💬 Community Masterclass Discussion:
Which of these 5 candlestick setups has yielded the highest accuracy in your chart analysis journey? Share your perspective below! 👇
⚠️ Educational Masterclass Disclaimer:
This content is for educational purposes only and does not constitute financial advice (NFA). Cryptocurrency markets carry inherent volatility. Always manage risk prudently and conduct your own research (DYOR).
$BTC $ETH SOL #BinanceSquare #CryptoTrading TechnicalAnalysis
Understand price action at an institutional level. Here is your definitive masterclass on the most reliable candlestick formations every crypto market participant must master across $BTC and $ETH charts.
1. Advance Block 🚧
• Candlestick Anatomy: Three consecutive green candles showing progressively smaller bodies and lengthening upper wicks.
• Market Psychology: Upward momentum is steadily exhausting as price encounters heavy overhead institutional supply.
• High-Confidence Confirmation: Look for a subsequent red candle closing below the midpoint of the second body to confirm exhaustion.
2. Bearish Belt Hold 🛑
• Candlestick Anatomy: A single session opening at the absolute high of the period with zero upper wick and closing near the low.
• Market Psychology: Sellers seize total control from the opening bell, aggressively dumping inventory throughout the period.
• High-Confidence Confirmation: Price breaking beneath the low of the belt hold candle validates the continuation of downward pressure.
3. Piercing Line ⚡
• Candlestick Anatomy: A large red candle followed by a green candle opening below the prior low and closing past the 50 percent midpoint.
• Market Psychology: Bears fail to sustain downside follow-through on a gap down, allowing bulls to aggressively reclaim key value areas.
• High-Confidence Confirmation: Watch for rising volume on the recovery green candle alongside confirmation on lower timeframes.
4. Doji Cross ⚖️
• Candlestick Anatomy: Virtually identical open and close prices featuring balanced upper and lower wicks, creating a classic cross shape.
• Market Psychology: Total equilibrium between aggressive buyers and sellers, preparing the stage for subsequent volatility expansion.
• High-Confidence Confirmation: Trade the breakout of the high or low range established by the Doji candle rather than guessing direction.
5. Tweezer Top 📌
• Candlestick Anatomy: Consecutive green and red candles touching the exact same high resistance point before pulling back.
• Market Psychology: A double rejection at a major overhead resistance level confirming a stubborn ceiling and fading buyer demand.
• High-Confidence Confirmation: A breakdown below the internal swing low separating the two matching peaks confirms the bearish reversal.
---
💡 Why Master These Candlestick Formations?
• Spot high-probability reversals and continuation phases before the broader retail crowd enters.
• Define exact risk-to-reward boundaries with clear structural invalidation levels.
• Combine with volume confirmation and dynamic moving averages like the EMA 20 and 50.
💬 Community Masterclass Discussion:
Which of these 5 candlestick setups has yielded the highest accuracy in your chart analysis journey? Share your perspective below! 👇
⚠️ Educational Masterclass Disclaimer:
This content is for educational purposes only and does not constitute financial advice (NFA). Cryptocurrency markets carry inherent volatility. Always manage risk prudently and conduct your own research (DYOR).
$BTC $ETH SOL #BinanceSquare #CryptoTrading TechnicalAnalysis
47
·
--
See translation
🔥 $XRP Technical Update: Key Levels & Momentum Breakdown
📊 1. Market Snapshot
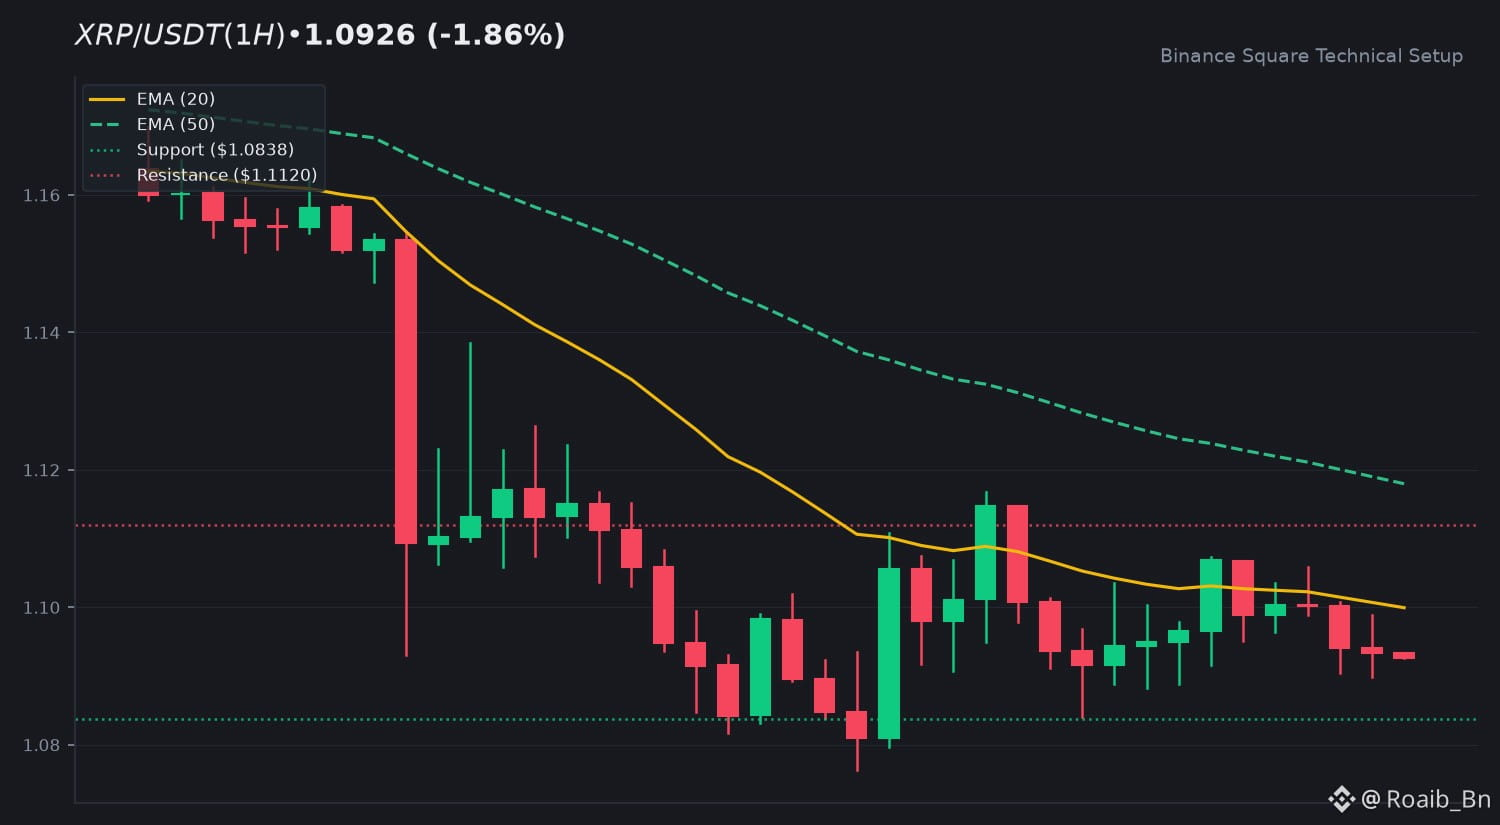
$XRP is currently trading at $1.0926, reflecting a 24-hour minor contraction of -1.86%. Price action has moved within a daily high of $1.1168 and a daily low of $1.0764, backed by a steady 24-hour quote volume of $150,300,374 USDT under low volume consolidation conditions.
📈 2. Technical Momentum & Indicator Bias
The overarching trend context remains in a structural slowdown. Price is trading below the EMA 20 at $1.0999 and the EMA 50 at $1.1180, signaling a short-term bearish bias. The RSI sits at 41.65, reflecting neutral-to-bearish momentum without entering oversold territory. Meanwhile, the MACD histogram prints a slight positive value of +0.0014 while the MACD line hovers near the signal line, suggesting compressed volatility.
🎯 3. Key Technical Levels to Watch
• 🟢 Resistance Zone: Immediate overhead resistance stands at $1.1120, aligning closely with the EMA 50, with a secondary target at $1.1785.
• 🔴 Support Zone: The primary support floor rests at $1.0838, which has acted as a localized defense line during recent intraday dips.
• 🛡️ Pivot Confluence: The EMA 20 at $1.0999 acts as the primary dynamic pivot for short-term trend evaluation.
💡 4. Technical Takeaway & Risk Management
Participants are closely monitoring whether price can reclaim the EMA 20 dynamic band or if low-volume conditions will encourage a retest of lower support floors. Risk mitigation and patience remain paramount in choppy market ranges.
💬 5. Community Discussion
What is your technical outlook for $XRP this week? Are you accumulating or waiting for confirmation? Drop your thoughts below! 👇
⚠️ 6. Disclaimer
Educational technical analysis only. Not financial advice (NFA). Crypto markets involve risk. Always DYOR.
$XRP #XRP #BinanceSquare
🔥 $XRP Technical Update: Key Levels & Momentum Breakdown
📊 1. Market Snapshot
$XRP is currently trading at $1.0926, reflecting a 24-hour minor contraction of -1.86%. Price action has moved within a daily high of $1.1168 and a daily low of $1.0764, backed by a steady 24-hour quote volume of $150,300,374 USDT under low volume consolidation conditions.
📈 2. Technical Momentum & Indicator Bias
The overarching trend context remains in a structural slowdown. Price is trading below the EMA 20 at $1.0999 and the EMA 50 at $1.1180, signaling a short-term bearish bias. The RSI sits at 41.65, reflecting neutral-to-bearish momentum without entering oversold territory. Meanwhile, the MACD histogram prints a slight positive value of +0.0014 while the MACD line hovers near the signal line, suggesting compressed volatility.
🎯 3. Key Technical Levels to Watch
• 🟢 Resistance Zone: Immediate overhead resistance stands at $1.1120, aligning closely with the EMA 50, with a secondary target at $1.1785.
• 🔴 Support Zone: The primary support floor rests at $1.0838, which has acted as a localized defense line during recent intraday dips.
• 🛡️ Pivot Confluence: The EMA 20 at $1.0999 acts as the primary dynamic pivot for short-term trend evaluation.
💡 4. Technical Takeaway & Risk Management
Participants are closely monitoring whether price can reclaim the EMA 20 dynamic band or if low-volume conditions will encourage a retest of lower support floors. Risk mitigation and patience remain paramount in choppy market ranges.
💬 5. Community Discussion
What is your technical outlook for $XRP this week? Are you accumulating or waiting for confirmation? Drop your thoughts below! 👇
⚠️ 6. Disclaimer
Educational technical analysis only. Not financial advice (NFA). Crypto markets involve risk. Always DYOR.
$XRP #XRP #BinanceSquare
📊 1. Market Snapshot
$XRP is currently trading at $1.0926, reflecting a 24-hour minor contraction of -1.86%. Price action has moved within a daily high of $1.1168 and a daily low of $1.0764, backed by a steady 24-hour quote volume of $150,300,374 USDT under low volume consolidation conditions.
📈 2. Technical Momentum & Indicator Bias
The overarching trend context remains in a structural slowdown. Price is trading below the EMA 20 at $1.0999 and the EMA 50 at $1.1180, signaling a short-term bearish bias. The RSI sits at 41.65, reflecting neutral-to-bearish momentum without entering oversold territory. Meanwhile, the MACD histogram prints a slight positive value of +0.0014 while the MACD line hovers near the signal line, suggesting compressed volatility.
🎯 3. Key Technical Levels to Watch
• 🟢 Resistance Zone: Immediate overhead resistance stands at $1.1120, aligning closely with the EMA 50, with a secondary target at $1.1785.
• 🔴 Support Zone: The primary support floor rests at $1.0838, which has acted as a localized defense line during recent intraday dips.
• 🛡️ Pivot Confluence: The EMA 20 at $1.0999 acts as the primary dynamic pivot for short-term trend evaluation.
💡 4. Technical Takeaway & Risk Management
Participants are closely monitoring whether price can reclaim the EMA 20 dynamic band or if low-volume conditions will encourage a retest of lower support floors. Risk mitigation and patience remain paramount in choppy market ranges.
💬 5. Community Discussion
What is your technical outlook for $XRP this week? Are you accumulating or waiting for confirmation? Drop your thoughts below! 👇
⚠️ 6. Disclaimer
Educational technical analysis only. Not financial advice (NFA). Crypto markets involve risk. Always DYOR.
$XRP #XRP #BinanceSquare
66
·
--
See translation
🔥 $SOL Technical Update: Key Levels & Momentum Breakdown 🔴 📉
🕒 UTC: 2026-11-10 02:50 UTC | Asset: $SOL (SOLUSDT)
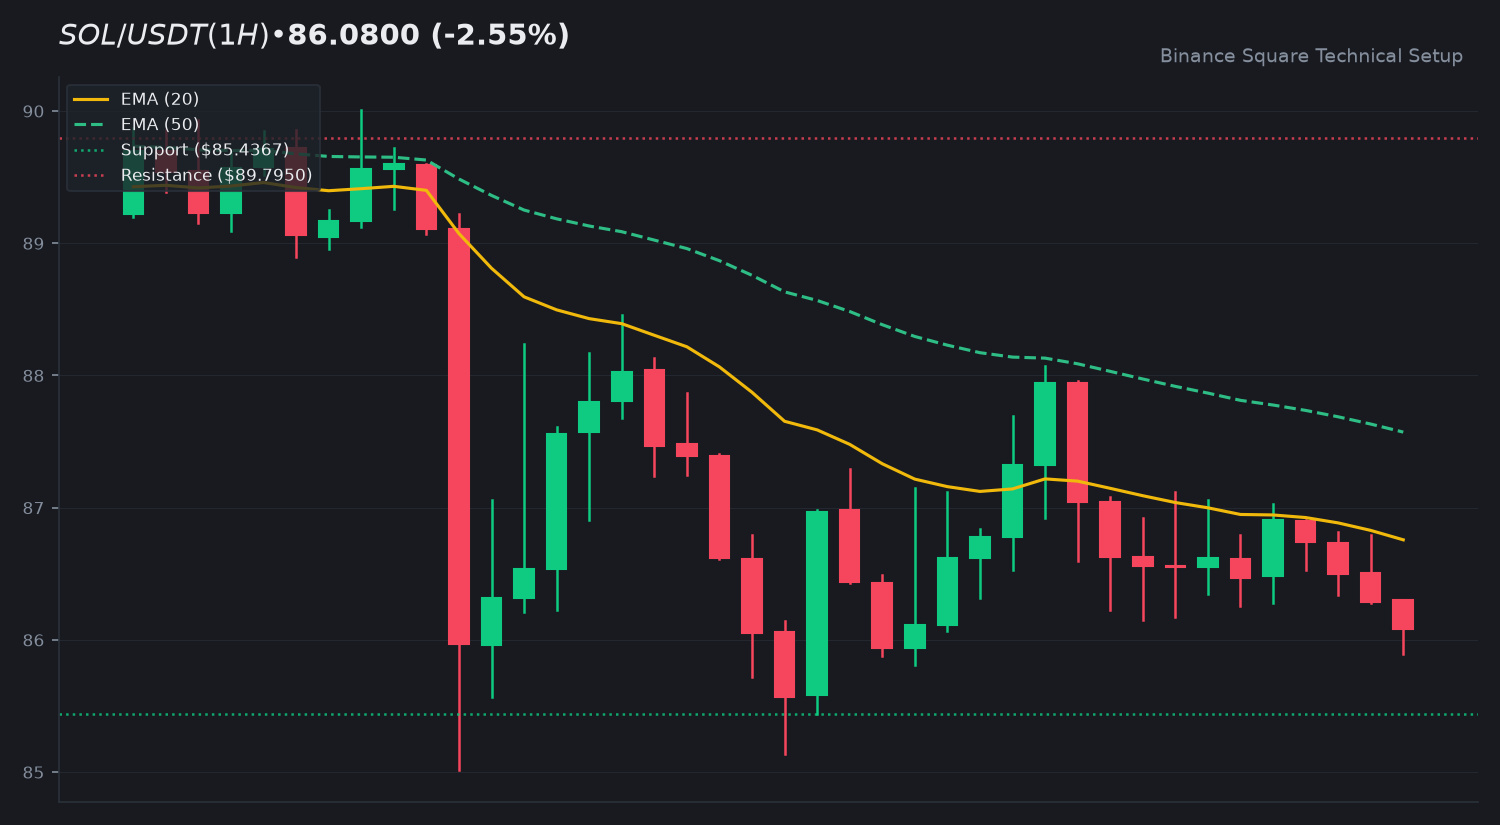
💰 Live Price: $86.0800 (-2.55%)
📊 24h Volume: 167,166,913 USDT
📈 1. Technical Momentum & Indicator Bias
Current technical posture indicates Consolidation / Pullback Pressure. The EMA 20 sits at $86.7572 with EMA 50 at 87.5719. RSI (14) is at 40.53, and MACD histogram stands at +0.0228. Structure reflects Strong Downtrend.
🎯 2. Key Technical Levels to Watch
• 🟢 Resistance Zone: 89.7950
• 🔴 Support Zone: 85.4367
• 🛡️ Dynamic Pivot: EMA 20 level at $86.7572
💡 3. Technical Takeaway & Risk Management
Monitor price action reaction near the EMA 20 dynamic confluence. Sustained trading above confirms stability, while rejection suggests continuation within the support floor.
💬 4. Community Discussion: What is your outlook for $SOL this week? Are you accumulating or waiting for confirmation? Drop your thoughts below! 👇
⚠️ 5. Disclaimer: Educational technical analysis only. Not financial advice (NFA). Always do your own research (DYOR).
$SOL #SOL #BinanceSquare
🔥 $SOL Technical Update: Key Levels & Momentum Breakdown 🔴 📉
🕒 UTC: 2026-11-10 02:50 UTC | Asset: $SOL (SOLUSDT)
💰 Live Price: $86.0800 (-2.55%)
📊 24h Volume: 167,166,913 USDT
📈 1. Technical Momentum & Indicator Bias
Current technical posture indicates Consolidation / Pullback Pressure. The EMA 20 sits at $86.7572 with EMA 50 at 87.5719. RSI (14) is at 40.53, and MACD histogram stands at +0.0228. Structure reflects Strong Downtrend.
🎯 2. Key Technical Levels to Watch
• 🟢 Resistance Zone: 89.7950
• 🔴 Support Zone: 85.4367
• 🛡️ Dynamic Pivot: EMA 20 level at $86.7572
💡 3. Technical Takeaway & Risk Management
Monitor price action reaction near the EMA 20 dynamic confluence. Sustained trading above confirms stability, while rejection suggests continuation within the support floor.
💬 4. Community Discussion: What is your outlook for $SOL this week? Are you accumulating or waiting for confirmation? Drop your thoughts below! 👇
⚠️ 5. Disclaimer: Educational technical analysis only. Not financial advice (NFA). Always do your own research (DYOR).
$SOL #SOL #BinanceSquare
🕒 UTC: 2026-11-10 02:50 UTC | Asset: $SOL (SOLUSDT)
💰 Live Price: $86.0800 (-2.55%)
📊 24h Volume: 167,166,913 USDT
📈 1. Technical Momentum & Indicator Bias
Current technical posture indicates Consolidation / Pullback Pressure. The EMA 20 sits at $86.7572 with EMA 50 at 87.5719. RSI (14) is at 40.53, and MACD histogram stands at +0.0228. Structure reflects Strong Downtrend.
🎯 2. Key Technical Levels to Watch
• 🟢 Resistance Zone: 89.7950
• 🔴 Support Zone: 85.4367
• 🛡️ Dynamic Pivot: EMA 20 level at $86.7572
💡 3. Technical Takeaway & Risk Management
Monitor price action reaction near the EMA 20 dynamic confluence. Sustained trading above confirms stability, while rejection suggests continuation within the support floor.
💬 4. Community Discussion: What is your outlook for $SOL this week? Are you accumulating or waiting for confirmation? Drop your thoughts below! 👇
⚠️ 5. Disclaimer: Educational technical analysis only. Not financial advice (NFA). Always do your own research (DYOR).
$SOL #SOL #BinanceSquare
90
·
--
Article
See translation
🚨 MASTER THESE 4 BULLISH CANDLESTICK REVERSALS TO ELEVATE YOUR TRADES 👇🚨 MASTER THESE 4 BULLISH CANDLESTICK REVERSALS TO ELEVATE YOUR TRADES 👇
Understand price action at an institutional level. Here is your definitive masterclass on the most reliable candlestick formations every crypto trader must master to identify potential shifts in market bias.
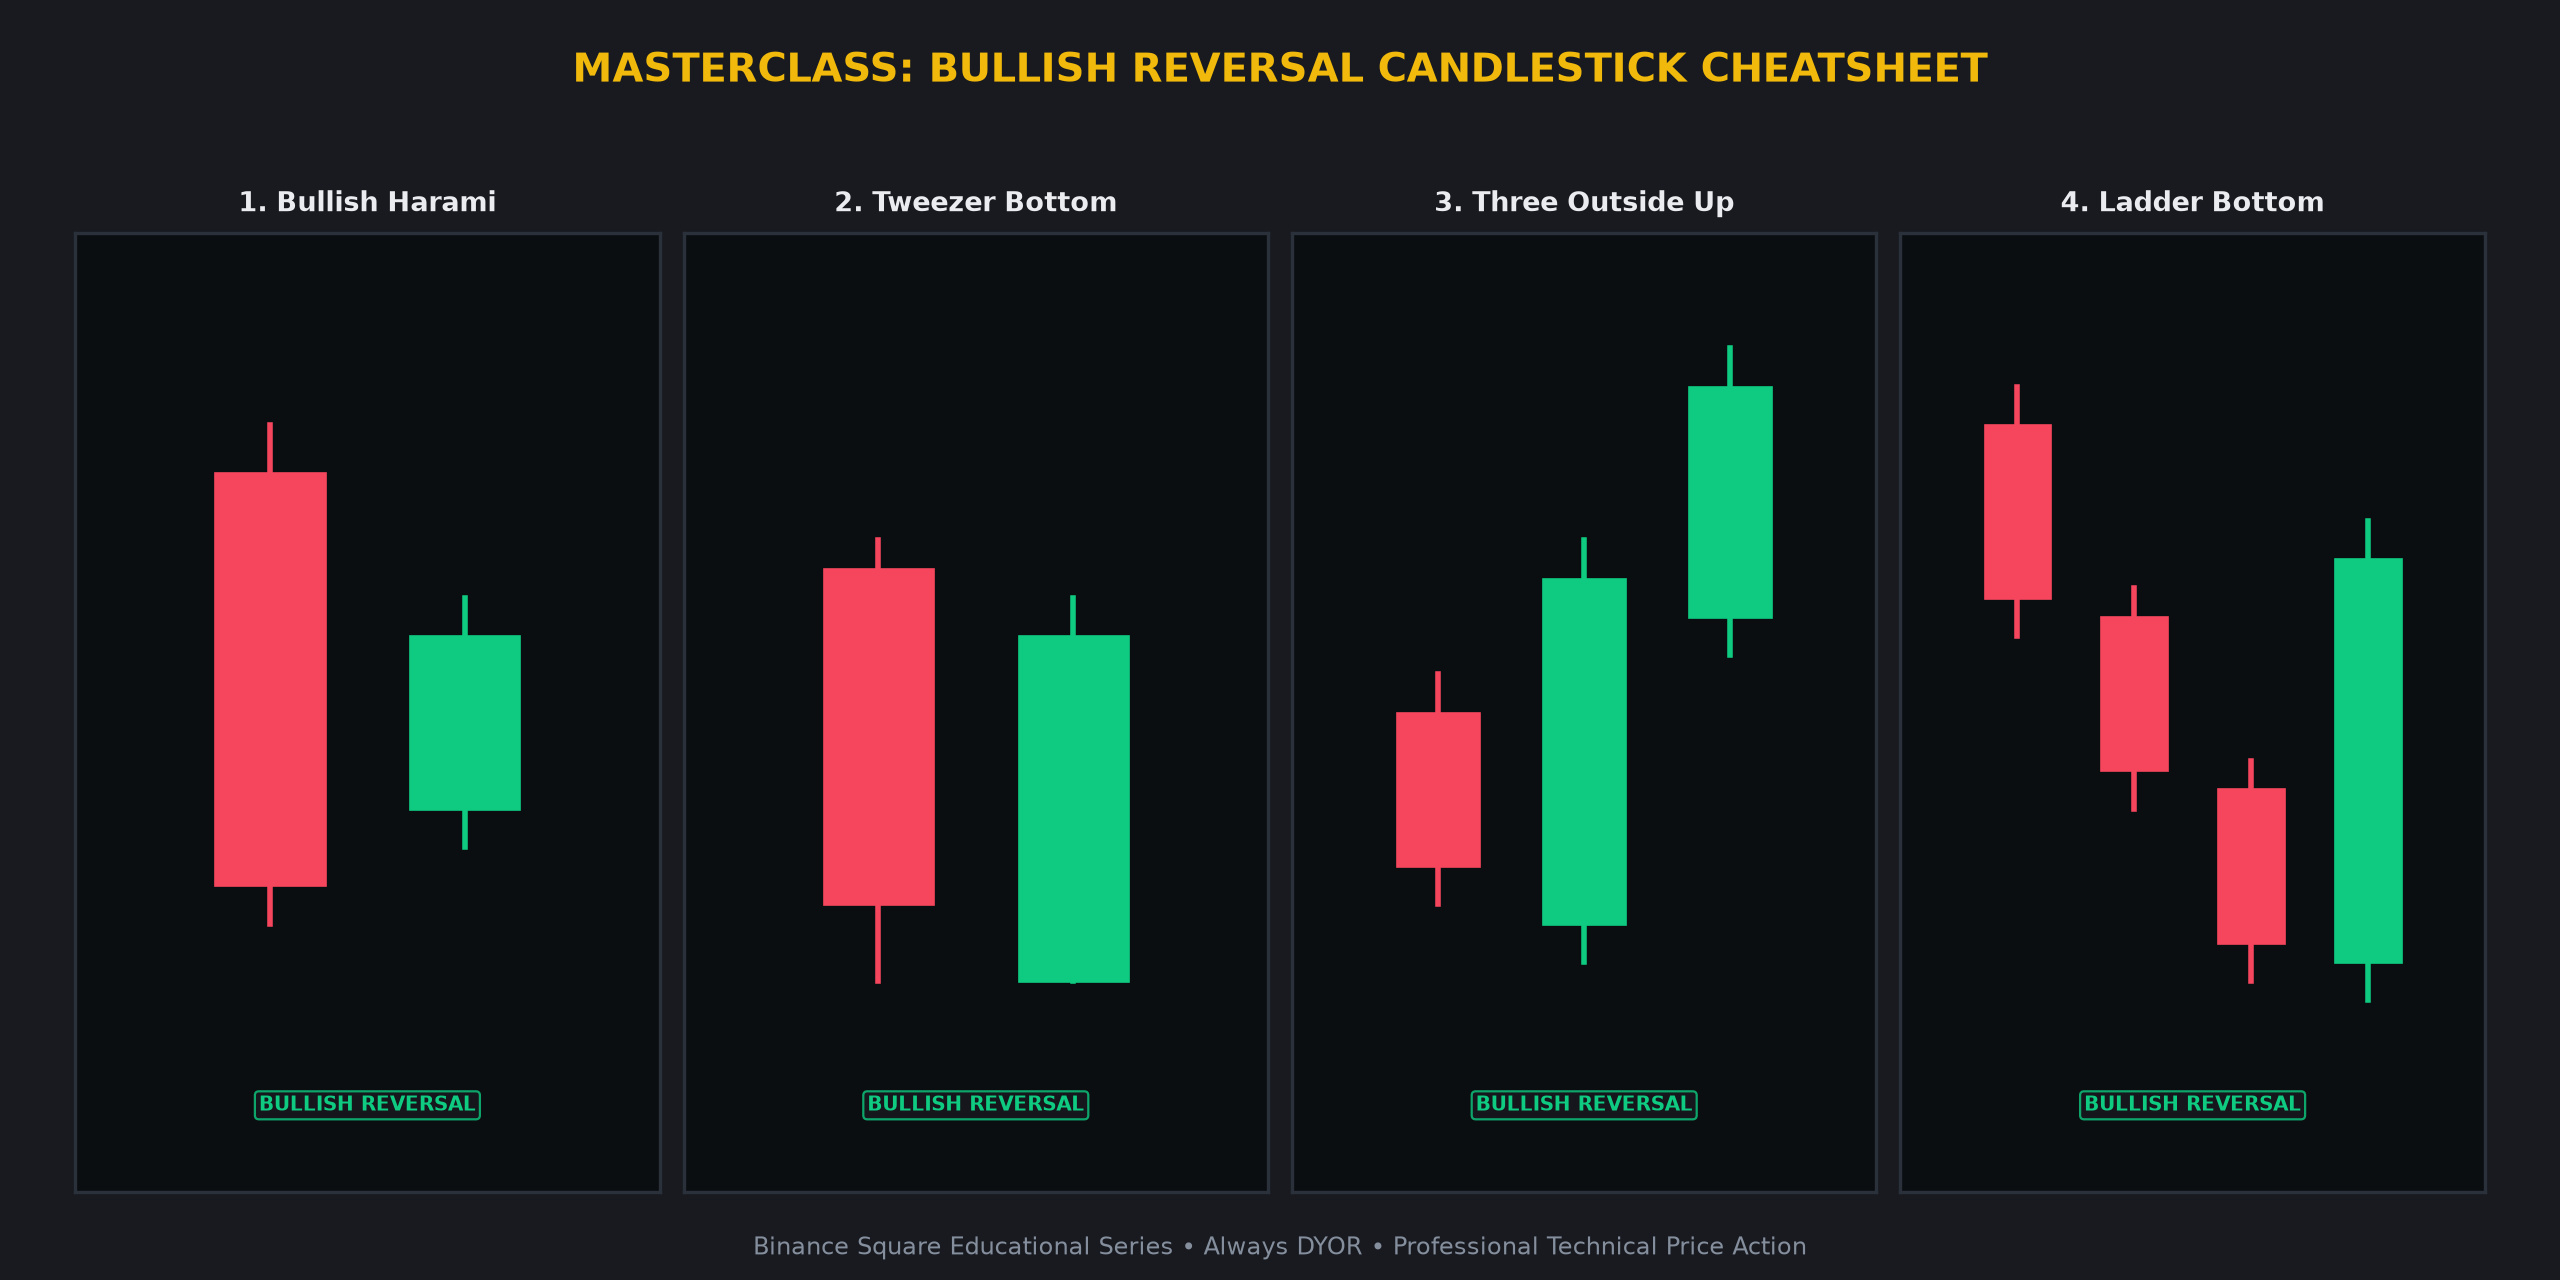
1 🐣 Bullish Harami 🐣
• Candlestick Anatomy: A large red candle followed by a smaller green candle that is completely contained within the vertical range of the prior candle body.
• Market Psychology: This indicates that aggressive selling momentum has hit a significant wall of buy orders. It signals seller hesitation and a potential pause in the prevailing downtrend.
• High-Confidence Confirmation: Monitor for a breakout above the high of the first red candle, ideally accompanied by an uptick in buy volume.
2 🧲 Tweezer Bottom 🧲
• Candlestick Anatomy: Two consecutive candles (typically red then green) that reach the exact same low price level before the second candle bounces.
• Market Psychology: This represents a firm institutional support floor. The market tried twice to push lower and was rejected at the same price point, showing strong demand.
• High-Confidence Confirmation: A bullish close above the highs of the Tweezer pair suggests the support floor is validated for a potential local trend reversal.
3 ⬆️ Three Outside Up ⬆️
• Candlestick Anatomy: A small red candle followed by a large green engulfing candle, which is then followed by a third green candle closing at a higher price.
• Market Psychology: This formation validates the initial engulfing candle with immediate follow-through momentum. It shows buyers have successfully seized control of the order book.
• High-Confidence Confirmation: The close of the third candle serves as the primary technical signal to monitor for sustained upside momentum.
4 🪜 Ladder Bottom 🪜
• Candlestick Anatomy: Three successive red candles with lower closes, followed by a fourth candle (inverted hammer), and finalized by a strong green reversal candle.
• Market Psychology: This represents a final capitulation flush where the last sellers are exhausted, followed by institutional bottom discovery and aggressive accumulation.
• High-Confidence Confirmation: Look for the final green candle to close significantly above the body of the previous two candles to confirm the trend shift.
💡 Why Master These Candlestick Formations?
• Spot high-probability reversals and continuation phases before the retail crowd reacts.
• Define exact
🚨 MASTER THESE 4 BULLISH CANDLESTICK REVERSALS TO ELEVATE YOUR TRADES 👇
🚨 MASTER THESE 4 BULLISH CANDLESTICK REVERSALS TO ELEVATE YOUR TRADES 👇
Understand price action at an institutional level. Here is your definitive masterclass on the most reliable candlestick formations every crypto trader must master to identify potential shifts in market bias.
1 🐣 Bullish Harami 🐣
• Candlestick Anatomy: A large red candle followed by a smaller green candle that is completely contained within the vertical range of the prior candle body.
• Market Psychology: This indicates that aggressive selling momentum has hit a significant wall of buy orders. It signals seller hesitation and a potential pause in the prevailing downtrend.
• High-Confidence Confirmation: Monitor for a breakout above the high of the first red candle, ideally accompanied by an uptick in buy volume.
2 🧲 Tweezer Bottom 🧲
• Candlestick Anatomy: Two consecutive candles (typically red then green) that reach the exact same low price level before the second candle bounces.
• Market Psychology: This represents a firm institutional support floor. The market tried twice to push lower and was rejected at the same price point, showing strong demand.
• High-Confidence Confirmation: A bullish close above the highs of the Tweezer pair suggests the support floor is validated for a potential local trend reversal.
3 ⬆️ Three Outside Up ⬆️
• Candlestick Anatomy: A small red candle followed by a large green engulfing candle, which is then followed by a third green candle closing at a higher price.
• Market Psychology: This formation validates the initial engulfing candle with immediate follow-through momentum. It shows buyers have successfully seized control of the order book.
• High-Confidence Confirmation: The close of the third candle serves as the primary technical signal to monitor for sustained upside momentum.
4 🪜 Ladder Bottom 🪜
• Candlestick Anatomy: Three successive red candles with lower closes, followed by a fourth candle (inverted hammer), and finalized by a strong green reversal candle.
• Market Psychology: This represents a final capitulation flush where the last sellers are exhausted, followed by institutional bottom discovery and aggressive accumulation.
• High-Confidence Confirmation: Look for the final green candle to close significantly above the body of the previous two candles to confirm the trend shift.
💡 Why Master These Candlestick Formations?
• Spot high-probability reversals and continuation phases before the retail crowd reacts.
• Define exact
Understand price action at an institutional level. Here is your definitive masterclass on the most reliable candlestick formations every crypto trader must master to identify potential shifts in market bias.
1 🐣 Bullish Harami 🐣
• Candlestick Anatomy: A large red candle followed by a smaller green candle that is completely contained within the vertical range of the prior candle body.
• Market Psychology: This indicates that aggressive selling momentum has hit a significant wall of buy orders. It signals seller hesitation and a potential pause in the prevailing downtrend.
• High-Confidence Confirmation: Monitor for a breakout above the high of the first red candle, ideally accompanied by an uptick in buy volume.
2 🧲 Tweezer Bottom 🧲
• Candlestick Anatomy: Two consecutive candles (typically red then green) that reach the exact same low price level before the second candle bounces.
• Market Psychology: This represents a firm institutional support floor. The market tried twice to push lower and was rejected at the same price point, showing strong demand.
• High-Confidence Confirmation: A bullish close above the highs of the Tweezer pair suggests the support floor is validated for a potential local trend reversal.
3 ⬆️ Three Outside Up ⬆️
• Candlestick Anatomy: A small red candle followed by a large green engulfing candle, which is then followed by a third green candle closing at a higher price.
• Market Psychology: This formation validates the initial engulfing candle with immediate follow-through momentum. It shows buyers have successfully seized control of the order book.
• High-Confidence Confirmation: The close of the third candle serves as the primary technical signal to monitor for sustained upside momentum.
4 🪜 Ladder Bottom 🪜
• Candlestick Anatomy: Three successive red candles with lower closes, followed by a fourth candle (inverted hammer), and finalized by a strong green reversal candle.
• Market Psychology: This represents a final capitulation flush where the last sellers are exhausted, followed by institutional bottom discovery and aggressive accumulation.
• High-Confidence Confirmation: Look for the final green candle to close significantly above the body of the previous two candles to confirm the trend shift.
💡 Why Master These Candlestick Formations?
• Spot high-probability reversals and continuation phases before the retail crowd reacts.
• Define exact
65
·
--
See translation
🔥 $ZEC Technical Update: Key Levels & Momentum Breakdown
📊 1. Market Snapshot
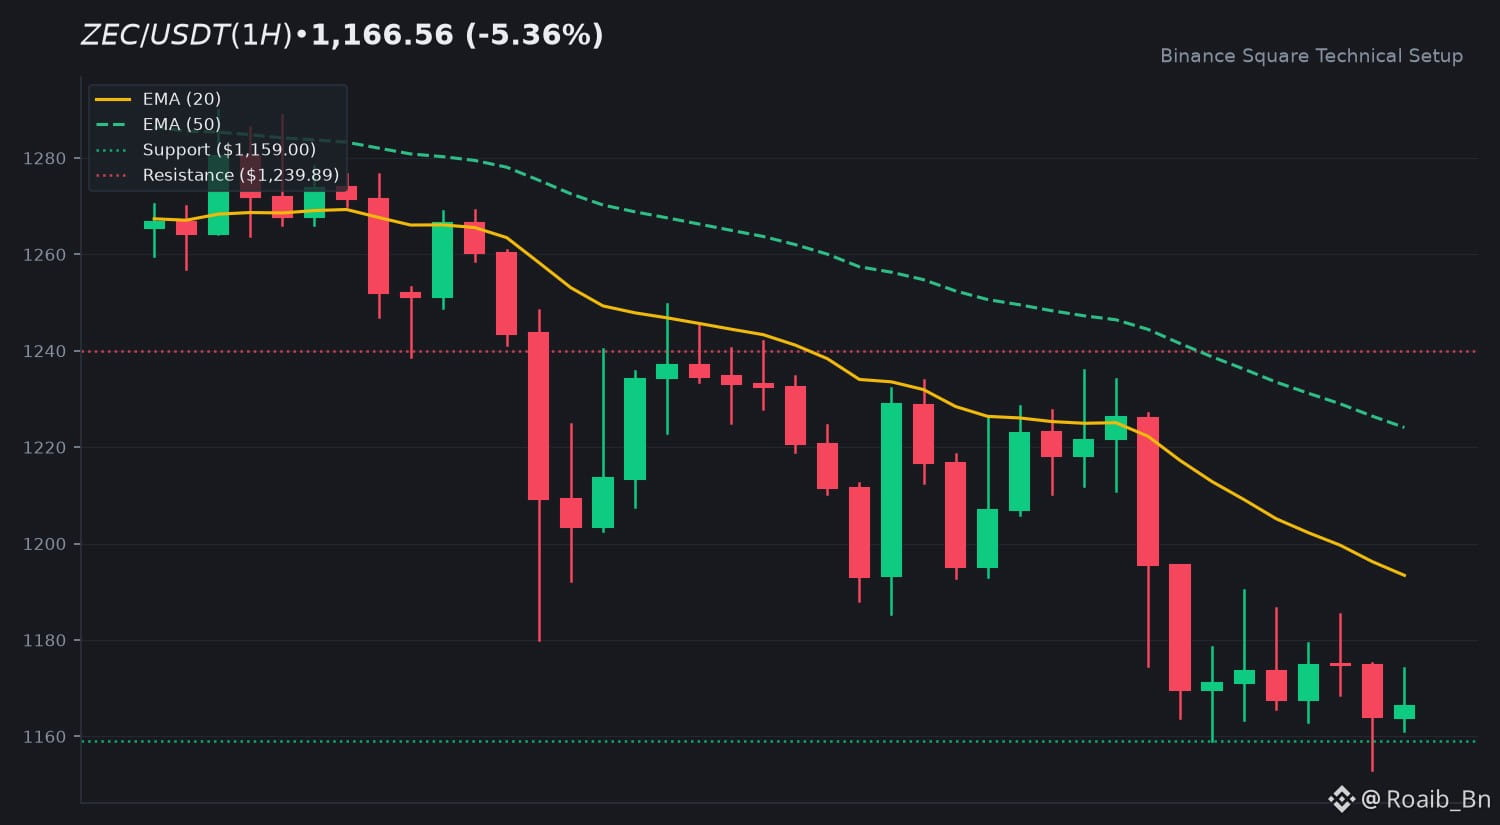
The current market price for $ZEC is 1,166.56 USDT, reflecting a 24h change of -5.36%. Trading activity remains quiet with a 24h volume of 196,738,011 USDT. The volume-to-20-SMA ratio of 0.27x indicates weak conviction and current consolidation patterns within the broader structure.
📈 2. Technical Momentum & Indicator Bias
$ZEC is exhibiting a clear downtrend posture as price action remains below the EMA 20 at 1,193.40 and the EMA 50 at 1,224.07. The RSI at 35.82 suggests the asset is approaching oversold territory but lacks immediate bullish divergence. The MACD histogram sits at -1.9889 with the MACD line positioned below the signal line, confirming a lack of upward momentum at this stage.
🎯 3. Key Technical Levels to Watch
• 🟢 Resistance Zone: Initial resistance is identified at 1,239.89, followed by a secondary ceiling near 1,278.95.
• 🔴 Support Zone: The immediate support floor is established at 1,159.00. A breach here could shift the outlook toward lower liquidity zones.
• 🛡️ Pivot Confluence: The 1,193.40 EMA 20 level serves as the primary pivot for any potential trend reversal attempts.
💡 4. Technical Takeaway & Risk Management
Price action is currently testing the lower bounds of recent ranges. Traders are monitoring whether the 1,159.00 support level can hold to prevent further downside extension. Without an increase in volume to reclaim the EMA 20, the bias remains cautious. Focus on how the asset interacts with these specific levels during the upcoming sessions.
💬 5. Community Discussion
What is your technical outlook for $ZEC this week? Are you accumulating or waiting for confirmation? Drop your thoughts below! 👇
⚠️ 6. Disclaimer
Educational technical analysis only. Not financial advice (NFA). Crypto markets involve risk. Always DYOR.
$ZEC #ZEC #BinanceSquare
🔥 $ZEC Technical Update: Key Levels & Momentum Breakdown
📊 1. Market Snapshot
The current market price for $ZEC is 1,166.56 USDT, reflecting a 24h change of -5.36%. Trading activity remains quiet with a 24h volume of 196,738,011 USDT. The volume-to-20-SMA ratio of 0.27x indicates weak conviction and current consolidation patterns within the broader structure.
📈 2. Technical Momentum & Indicator Bias
$ZEC is exhibiting a clear downtrend posture as price action remains below the EMA 20 at 1,193.40 and the EMA 50 at 1,224.07. The RSI at 35.82 suggests the asset is approaching oversold territory but lacks immediate bullish divergence. The MACD histogram sits at -1.9889 with the MACD line positioned below the signal line, confirming a lack of upward momentum at this stage.
🎯 3. Key Technical Levels to Watch
• 🟢 Resistance Zone: Initial resistance is identified at 1,239.89, followed by a secondary ceiling near 1,278.95.
• 🔴 Support Zone: The immediate support floor is established at 1,159.00. A breach here could shift the outlook toward lower liquidity zones.
• 🛡️ Pivot Confluence: The 1,193.40 EMA 20 level serves as the primary pivot for any potential trend reversal attempts.
💡 4. Technical Takeaway & Risk Management
Price action is currently testing the lower bounds of recent ranges. Traders are monitoring whether the 1,159.00 support level can hold to prevent further downside extension. Without an increase in volume to reclaim the EMA 20, the bias remains cautious. Focus on how the asset interacts with these specific levels during the upcoming sessions.
💬 5. Community Discussion
What is your technical outlook for $ZEC this week? Are you accumulating or waiting for confirmation? Drop your thoughts below! 👇
⚠️ 6. Disclaimer
Educational technical analysis only. Not financial advice (NFA). Crypto markets involve risk. Always DYOR.
$ZEC #ZEC #BinanceSquare
📊 1. Market Snapshot
The current market price for $ZEC is 1,166.56 USDT, reflecting a 24h change of -5.36%. Trading activity remains quiet with a 24h volume of 196,738,011 USDT. The volume-to-20-SMA ratio of 0.27x indicates weak conviction and current consolidation patterns within the broader structure.
📈 2. Technical Momentum & Indicator Bias
$ZEC is exhibiting a clear downtrend posture as price action remains below the EMA 20 at 1,193.40 and the EMA 50 at 1,224.07. The RSI at 35.82 suggests the asset is approaching oversold territory but lacks immediate bullish divergence. The MACD histogram sits at -1.9889 with the MACD line positioned below the signal line, confirming a lack of upward momentum at this stage.
🎯 3. Key Technical Levels to Watch
• 🟢 Resistance Zone: Initial resistance is identified at 1,239.89, followed by a secondary ceiling near 1,278.95.
• 🔴 Support Zone: The immediate support floor is established at 1,159.00. A breach here could shift the outlook toward lower liquidity zones.
• 🛡️ Pivot Confluence: The 1,193.40 EMA 20 level serves as the primary pivot for any potential trend reversal attempts.
💡 4. Technical Takeaway & Risk Management
Price action is currently testing the lower bounds of recent ranges. Traders are monitoring whether the 1,159.00 support level can hold to prevent further downside extension. Without an increase in volume to reclaim the EMA 20, the bias remains cautious. Focus on how the asset interacts with these specific levels during the upcoming sessions.
💬 5. Community Discussion
What is your technical outlook for $ZEC this week? Are you accumulating or waiting for confirmation? Drop your thoughts below! 👇
⚠️ 6. Disclaimer
Educational technical analysis only. Not financial advice (NFA). Crypto markets involve risk. Always DYOR.
$ZEC #ZEC #BinanceSquare
123
·
--
See translation
🔥 $ETH Technical Update: Key Levels & Momentum Breakdown
📊 1. Market Snapshot
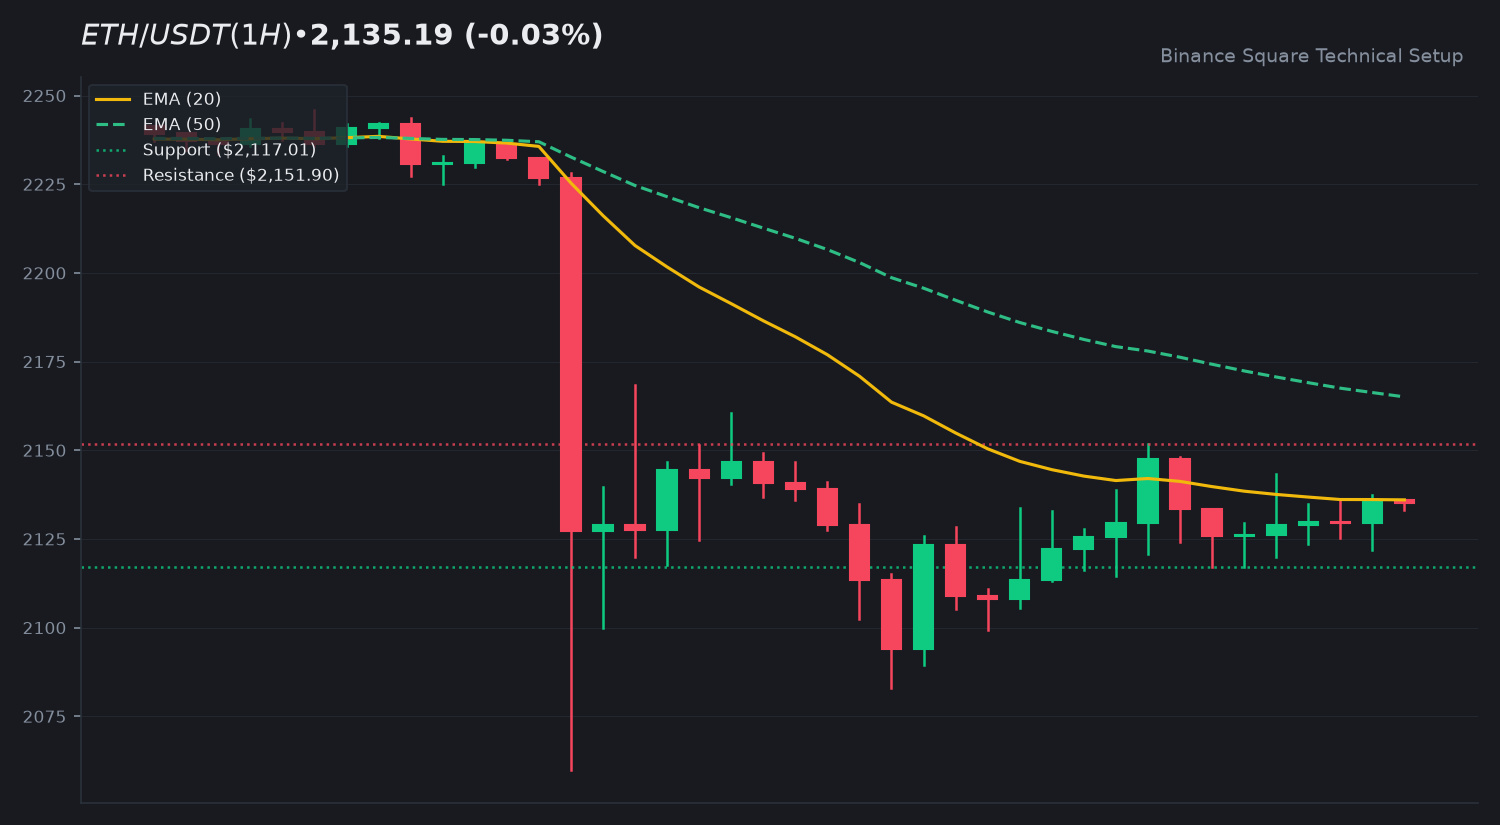
The current price of $ETH is $2,135.19. Over the last 24 hours, the asset has shown minimal volatility with a change of -0.03%. Trading volume remains subdued at $697,860,614 USDT, reflecting a period of low market conviction and consolidation.
📈 2. Technical Momentum & Indicator Bias
$ETH is currently positioned below the EMA 50 at $2,165.05 and is hovering near the EMA 20 at $2,136.01, indicating a prevailing downtrend bias. The RSI at 45.72 suggests a neutral environment, lacking strong directional momentum. While the MACD histogram shows a positive value of +5.0682, the MACD line remains below the signal line, suggesting that sellers still maintain structural control over the current timeframe.
🎯 3. Key Technical Levels to Watch
• 🟢 Resistance Zone: The immediate overhead resistance is at $2,151.90, with a secondary ceiling observed at $2,248.20.
• 🔴 Support Zone: Downward pressure may find relief at the $2,117.01 level, followed by a deeper support floor near $2,071.55.
• 🛡️ Pivot Confluence: The EMA 20 at $2,136.01 serves as the primary pivot for intraday traders to gauge potential trend shifts.
💡 4. Technical Takeaway & Risk Management
Price action is currently trapped between key moving averages. Traders are monitoring the interaction with the $2,136 level, as a sustained breach could signal a transition in sentiment. Given the low volume ratio, caution is advised as price discovery in this range often lacks the necessary liquidity to sustain breakouts.
💬 5. Community Discussion
What is your technical outlook for $ETH this week? Are you accumulating or waiting for confirmation? Drop your thoughts below! 👇
⚠️ 6. Disclaimer
Educational technical analysis only. Not financial advice (NFA). Crypto markets involve risk. Always DYOR.
$ETH #ETH #BinanceSquare
🔥 $ETH Technical Update: Key Levels & Momentum Breakdown
📊 1. Market Snapshot
The current price of $ETH is $2,135.19. Over the last 24 hours, the asset has shown minimal volatility with a change of -0.03%. Trading volume remains subdued at $697,860,614 USDT, reflecting a period of low market conviction and consolidation.
📈 2. Technical Momentum & Indicator Bias
$ETH is currently positioned below the EMA 50 at $2,165.05 and is hovering near the EMA 20 at $2,136.01, indicating a prevailing downtrend bias. The RSI at 45.72 suggests a neutral environment, lacking strong directional momentum. While the MACD histogram shows a positive value of +5.0682, the MACD line remains below the signal line, suggesting that sellers still maintain structural control over the current timeframe.
🎯 3. Key Technical Levels to Watch
• 🟢 Resistance Zone: The immediate overhead resistance is at $2,151.90, with a secondary ceiling observed at $2,248.20.
• 🔴 Support Zone: Downward pressure may find relief at the $2,117.01 level, followed by a deeper support floor near $2,071.55.
• 🛡️ Pivot Confluence: The EMA 20 at $2,136.01 serves as the primary pivot for intraday traders to gauge potential trend shifts.
💡 4. Technical Takeaway & Risk Management
Price action is currently trapped between key moving averages. Traders are monitoring the interaction with the $2,136 level, as a sustained breach could signal a transition in sentiment. Given the low volume ratio, caution is advised as price discovery in this range often lacks the necessary liquidity to sustain breakouts.
💬 5. Community Discussion
What is your technical outlook for $ETH this week? Are you accumulating or waiting for confirmation? Drop your thoughts below! 👇
⚠️ 6. Disclaimer
Educational technical analysis only. Not financial advice (NFA). Crypto markets involve risk. Always DYOR.
$ETH #ETH #BinanceSquare
📊 1. Market Snapshot
The current price of $ETH is $2,135.19. Over the last 24 hours, the asset has shown minimal volatility with a change of -0.03%. Trading volume remains subdued at $697,860,614 USDT, reflecting a period of low market conviction and consolidation.
📈 2. Technical Momentum & Indicator Bias
$ETH is currently positioned below the EMA 50 at $2,165.05 and is hovering near the EMA 20 at $2,136.01, indicating a prevailing downtrend bias. The RSI at 45.72 suggests a neutral environment, lacking strong directional momentum. While the MACD histogram shows a positive value of +5.0682, the MACD line remains below the signal line, suggesting that sellers still maintain structural control over the current timeframe.
🎯 3. Key Technical Levels to Watch
• 🟢 Resistance Zone: The immediate overhead resistance is at $2,151.90, with a secondary ceiling observed at $2,248.20.
• 🔴 Support Zone: Downward pressure may find relief at the $2,117.01 level, followed by a deeper support floor near $2,071.55.
• 🛡️ Pivot Confluence: The EMA 20 at $2,136.01 serves as the primary pivot for intraday traders to gauge potential trend shifts.
💡 4. Technical Takeaway & Risk Management
Price action is currently trapped between key moving averages. Traders are monitoring the interaction with the $2,136 level, as a sustained breach could signal a transition in sentiment. Given the low volume ratio, caution is advised as price discovery in this range often lacks the necessary liquidity to sustain breakouts.
💬 5. Community Discussion
What is your technical outlook for $ETH this week? Are you accumulating or waiting for confirmation? Drop your thoughts below! 👇
⚠️ 6. Disclaimer
Educational technical analysis only. Not financial advice (NFA). Crypto markets involve risk. Always DYOR.
$ETH #ETH #BinanceSquare
21
·
--
Article
See translation
🚨 RIDE THE MOMENTUM: 4 BULLISH CONTINUATION CANDLESTICKS EVERY TRADER NEEDS 👇🚨 RIDE THE MOMENTUM: 4 BULLISH CONTINUATION CANDLESTICKS EVERY TRADER NEEDS 👇
Understand price action at an institutional level. Here is your definitive masterclass on the most reliable candlestick formations every crypto trader must master to identify trend strength.
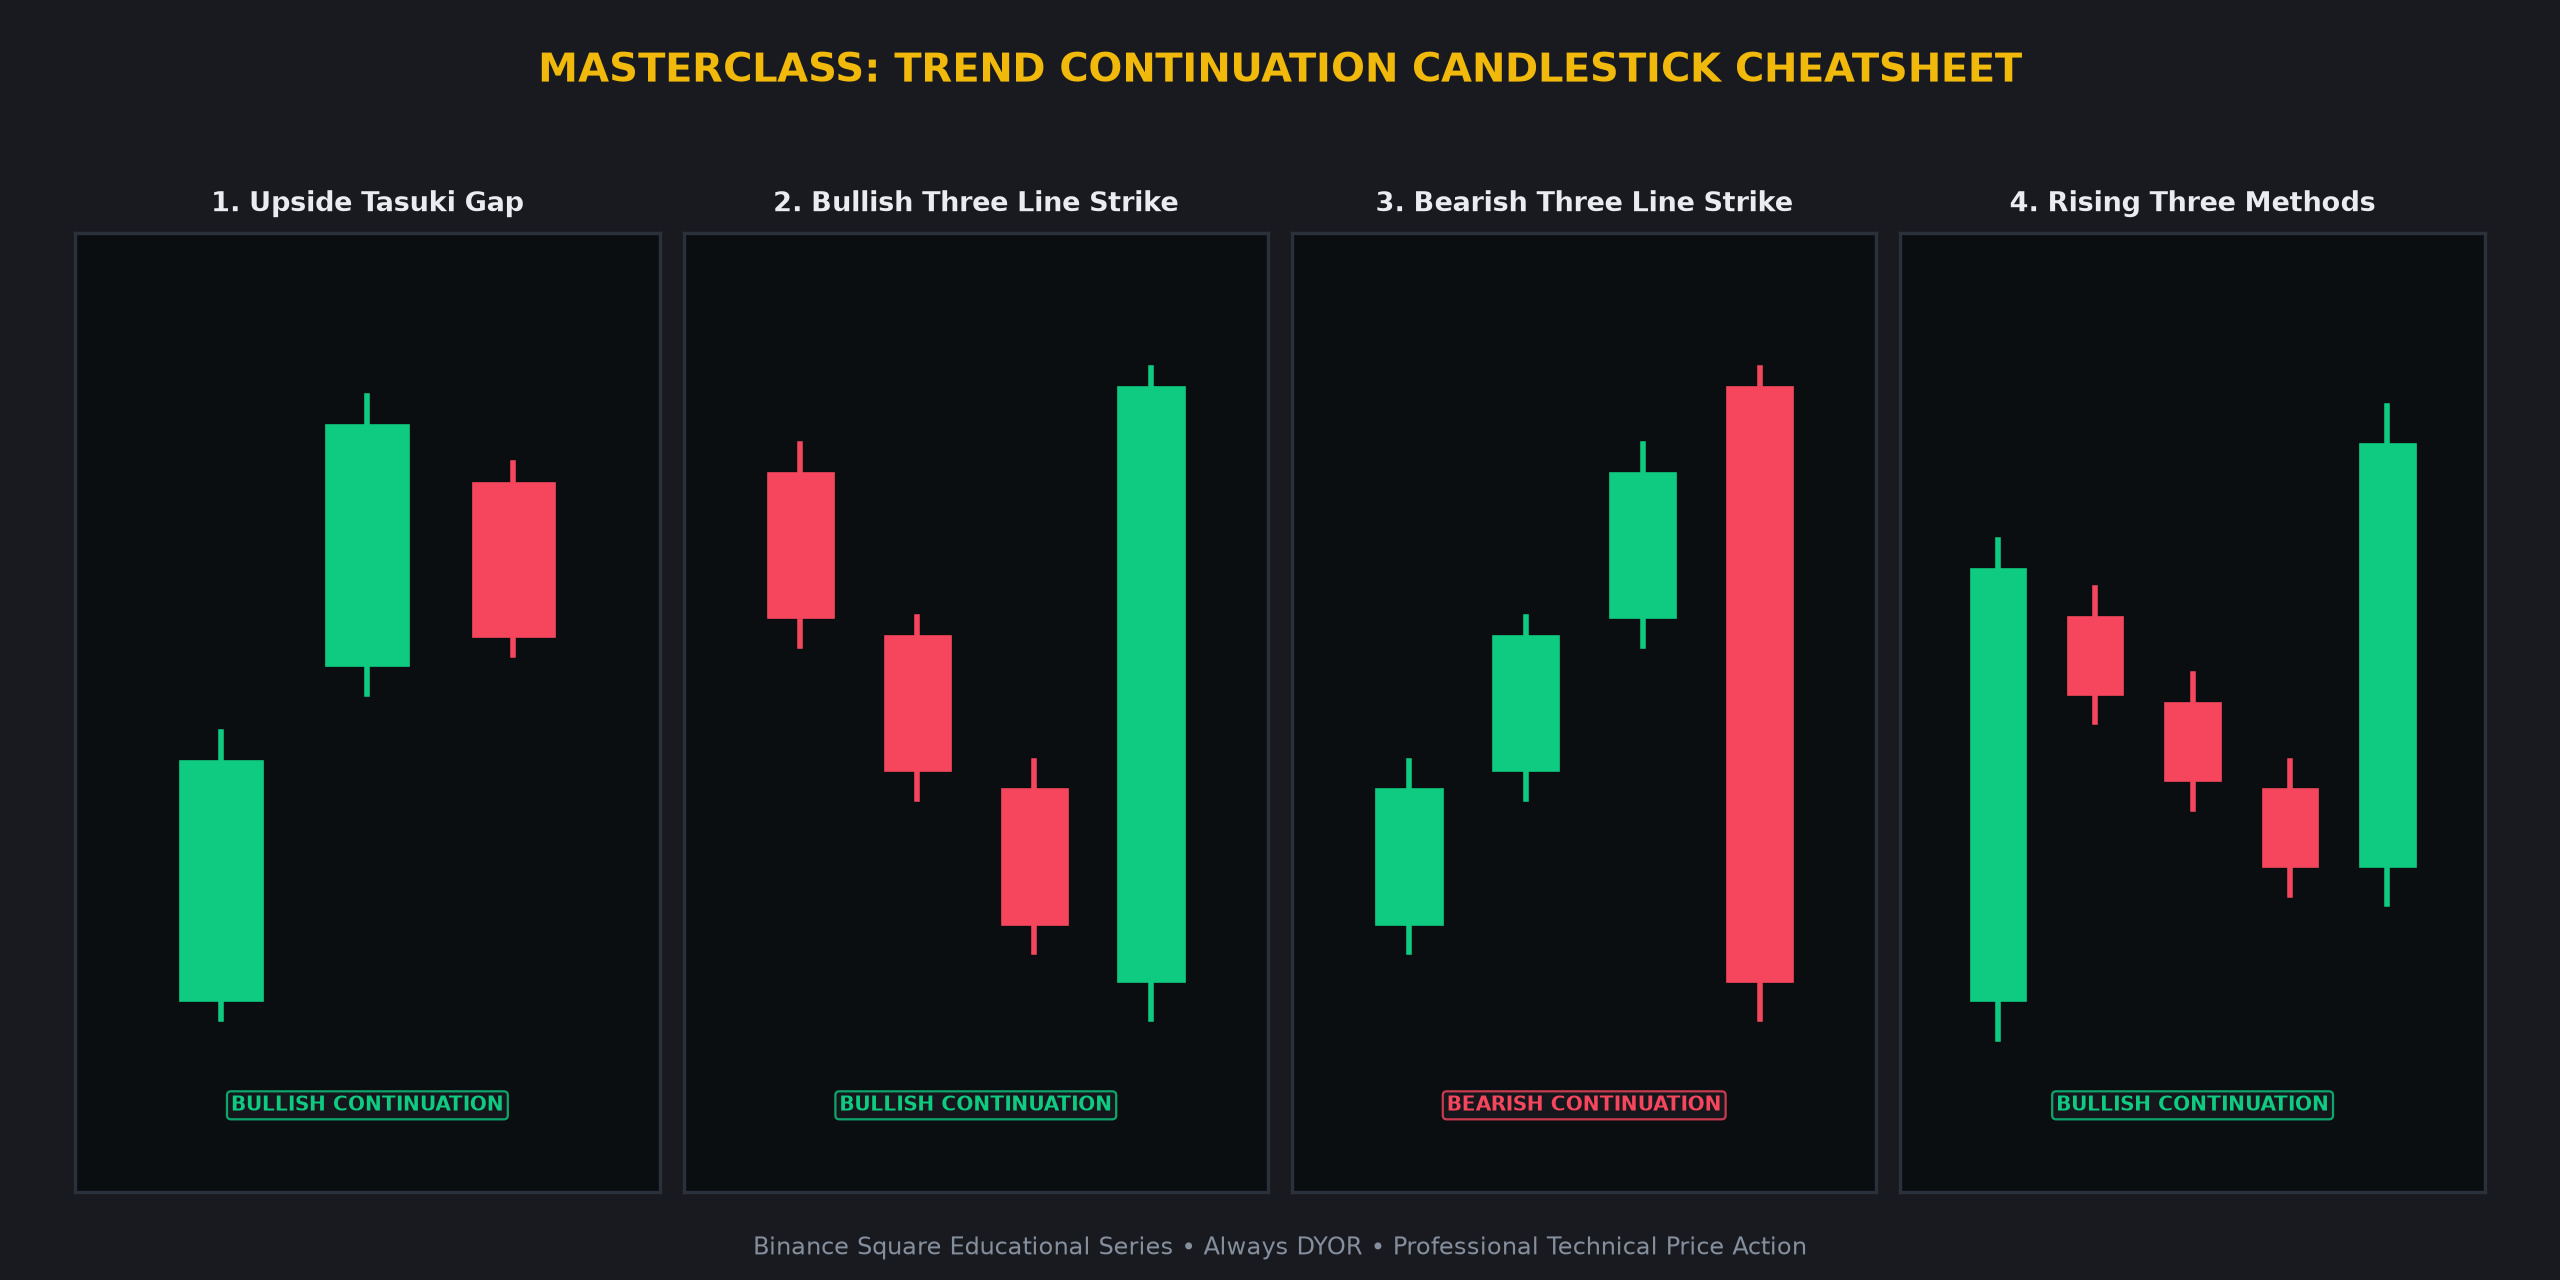
1 📈 UPSIDE TASUKI GAP 📈
• Candlestick Anatomy: A bullish gap occurs between two green candles. The third candle is red and opens within the second candle's body, closing slightly below the gap without filling it.
• Market Psychology: The gap represents aggressive momentum. The minor red candle shows brief profit-taking that fails to close the gap, confirming buyer appetite remains ferocious.
• High-Confidence Confirmation: Monitor for a break above the high of the second green candle. Structural invalidation occurs if price closes deep into the original gap.
2 ⚡ BULLISH THREE LINE STRIKE ⚡
• Candlestick Anatomy: Three small, consecutive red candles with lower lows are erased completely by one massive green candle that engulfs the entire range.
• Market Psychology: This represents a classic shakeout. Prolonged seller pressure is engulfed in a single violent short-covering spike as institutional liquidity enters the fray.
• High-Confidence Confirmation: Look for entry triggers above the strike candle's close. Invalidation is defined by a breach of the large green candle's low.
3 ⛈️ BEARISH THREE LINE STRIKE ⛈️
• Candlestick Anatomy: Three rising green candles are wiped out entirely by one massive red engulfing candle closing below the first candle's open.
• Market Psychology: Gradual retail buying is obliterated by institutional block selling. This indicates a high-probability bearish continuation phase
🚨 RIDE THE MOMENTUM: 4 BULLISH CONTINUATION CANDLESTICKS EVERY TRADER NEEDS 👇
🚨 RIDE THE MOMENTUM: 4 BULLISH CONTINUATION CANDLESTICKS EVERY TRADER NEEDS 👇
Understand price action at an institutional level. Here is your definitive masterclass on the most reliable candlestick formations every crypto trader must master to identify trend strength.
1 📈 UPSIDE TASUKI GAP 📈
• Candlestick Anatomy: A bullish gap occurs between two green candles. The third candle is red and opens within the second candle's body, closing slightly below the gap without filling it.
• Market Psychology: The gap represents aggressive momentum. The minor red candle shows brief profit-taking that fails to close the gap, confirming buyer appetite remains ferocious.
• High-Confidence Confirmation: Monitor for a break above the high of the second green candle. Structural invalidation occurs if price closes deep into the original gap.
2 ⚡ BULLISH THREE LINE STRIKE ⚡
• Candlestick Anatomy: Three small, consecutive red candles with lower lows are erased completely by one massive green candle that engulfs the entire range.
• Market Psychology: This represents a classic shakeout. Prolonged seller pressure is engulfed in a single violent short-covering spike as institutional liquidity enters the fray.
• High-Confidence Confirmation: Look for entry triggers above the strike candle's close. Invalidation is defined by a breach of the large green candle's low.
3 ⛈️ BEARISH THREE LINE STRIKE ⛈️
• Candlestick Anatomy: Three rising green candles are wiped out entirely by one massive red engulfing candle closing below the first candle's open.
• Market Psychology: Gradual retail buying is obliterated by institutional block selling. This indicates a high-probability bearish continuation phase
Understand price action at an institutional level. Here is your definitive masterclass on the most reliable candlestick formations every crypto trader must master to identify trend strength.
1 📈 UPSIDE TASUKI GAP 📈
• Candlestick Anatomy: A bullish gap occurs between two green candles. The third candle is red and opens within the second candle's body, closing slightly below the gap without filling it.
• Market Psychology: The gap represents aggressive momentum. The minor red candle shows brief profit-taking that fails to close the gap, confirming buyer appetite remains ferocious.
• High-Confidence Confirmation: Monitor for a break above the high of the second green candle. Structural invalidation occurs if price closes deep into the original gap.
2 ⚡ BULLISH THREE LINE STRIKE ⚡
• Candlestick Anatomy: Three small, consecutive red candles with lower lows are erased completely by one massive green candle that engulfs the entire range.
• Market Psychology: This represents a classic shakeout. Prolonged seller pressure is engulfed in a single violent short-covering spike as institutional liquidity enters the fray.
• High-Confidence Confirmation: Look for entry triggers above the strike candle's close. Invalidation is defined by a breach of the large green candle's low.
3 ⛈️ BEARISH THREE LINE STRIKE ⛈️
• Candlestick Anatomy: Three rising green candles are wiped out entirely by one massive red engulfing candle closing below the first candle's open.
• Market Psychology: Gradual retail buying is obliterated by institutional block selling. This indicates a high-probability bearish continuation phase
22
·
--
See translation
🌐 Crypto Market 24h Macro Pulse & Volume Overview
1. Overall Market Sentiment & Breadth
The current market environment reflects a neutral to mixed sentiment as liquidity shifts across the broader ecosystem. With a 24h volume of 4,307,948,963 USDT, the Advance/Decline ratio remains balanced at 26 gainers against 24 losers. Price action across the top 50 assets suggests a period of consolidation following recent volatility. Market participants are observing how current support levels hold under the weight of prevailing selling pressure.
2. Top Volume Leaders
• $BTC : 74,788.01 (-1.47%)
• $ETH : 2,128.74 (-4.57%)
• SOL : 86.8 (-3.08%)
• ZEC : 1,175.93 (-6.56%)
• XRP : 1.0913 (-5.35%)
3. Prudent Trader Notes
Technical momentum indicates that major assets are testing key support floors. A failure to maintain these zones could lead to a retest of lower liquidity pockets. Conversely, a stabilization in volume could signal a potential base-building phase. Traders are monitoring the RSI and MACD crossovers on the 4H charts to gauge if the current retracement is finding equilibrium or if further technical adjustments are required. Always monitor volume profiles to confirm the validity of any price movement.
4. Community Discussion
Given the current retracement across the top volume leaders, how are you adjusting your risk management parameters to account for the current volatility in $BTC and $ETH?
⚠️ Educational analysis only. Not financial advice (NFA). DYOR.
BinanceSquare #CryptoMarket
🌐 Crypto Market 24h Macro Pulse & Volume Overview
1. Overall Market Sentiment & Breadth
The current market environment reflects a neutral to mixed sentiment as liquidity shifts across the broader ecosystem. With a 24h volume of 4,307,948,963 USDT, the Advance/Decline ratio remains balanced at 26 gainers against 24 losers. Price action across the top 50 assets suggests a period of consolidation following recent volatility. Market participants are observing how current support levels hold under the weight of prevailing selling pressure.
2. Top Volume Leaders
• $BTC : 74,788.01 (-1.47%)
• $ETH : 2,128.74 (-4.57%)
• SOL : 86.8 (-3.08%)
• ZEC : 1,175.93 (-6.56%)
• XRP : 1.0913 (-5.35%)
3. Prudent Trader Notes
Technical momentum indicates that major assets are testing key support floors. A failure to maintain these zones could lead to a retest of lower liquidity pockets. Conversely, a stabilization in volume could signal a potential base-building phase. Traders are monitoring the RSI and MACD crossovers on the 4H charts to gauge if the current retracement is finding equilibrium or if further technical adjustments are required. Always monitor volume profiles to confirm the validity of any price movement.
4. Community Discussion
Given the current retracement across the top volume leaders, how are you adjusting your risk management parameters to account for the current volatility in $BTC and $ETH ?
⚠️ Educational analysis only. Not financial advice (NFA). DYOR.
BinanceSquare #CryptoMarket
1. Overall Market Sentiment & Breadth
The current market environment reflects a neutral to mixed sentiment as liquidity shifts across the broader ecosystem. With a 24h volume of 4,307,948,963 USDT, the Advance/Decline ratio remains balanced at 26 gainers against 24 losers. Price action across the top 50 assets suggests a period of consolidation following recent volatility. Market participants are observing how current support levels hold under the weight of prevailing selling pressure.
2. Top Volume Leaders
• $BTC : 74,788.01 (-1.47%)
• $ETH : 2,128.74 (-4.57%)
• SOL : 86.8 (-3.08%)
• ZEC : 1,175.93 (-6.56%)
• XRP : 1.0913 (-5.35%)
3. Prudent Trader Notes
Technical momentum indicates that major assets are testing key support floors. A failure to maintain these zones could lead to a retest of lower liquidity pockets. Conversely, a stabilization in volume could signal a potential base-building phase. Traders are monitoring the RSI and MACD crossovers on the 4H charts to gauge if the current retracement is finding equilibrium or if further technical adjustments are required. Always monitor volume profiles to confirm the validity of any price movement.
4. Community Discussion
Given the current retracement across the top volume leaders, how are you adjusting your risk management parameters to account for the current volatility in $BTC and $ETH ?
⚠️ Educational analysis only. Not financial advice (NFA). DYOR.
BinanceSquare #CryptoMarket
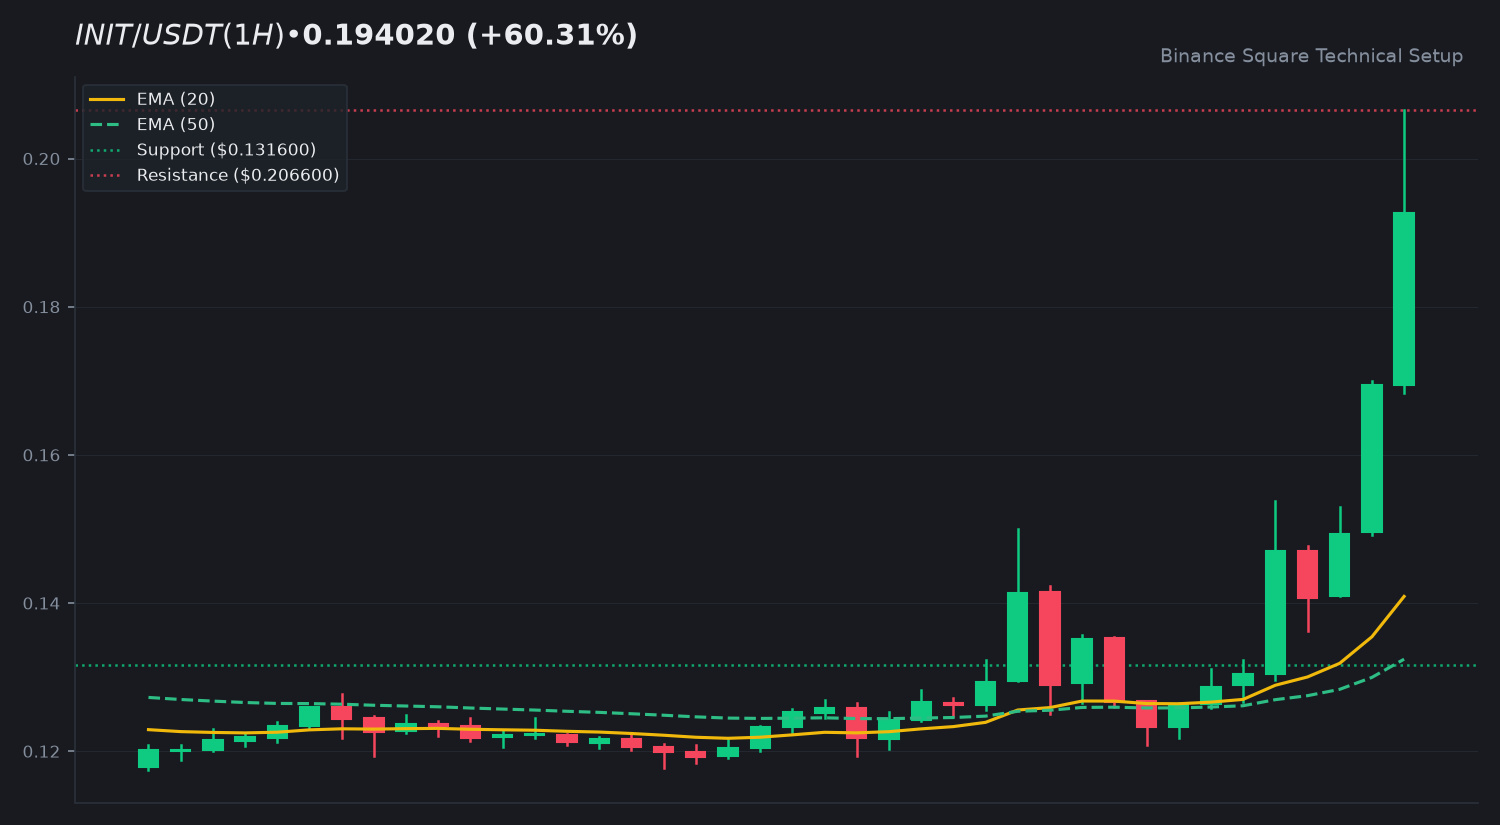
318
·
--
See translation
⚡ Market Titans Dual Analysis: Bitcoin $BTC vs Ethereum $ETH
1. Bitcoin $BTC Technical Outlook
The asset is currently trading at 74,657.08, reflecting a slight contraction of 1.58%. Price action remains positioned below both the EMA 20 (74,854.82) and EMA 50 (75,188.74), indicating a prevailing short-term bearish bias. With an RSI of 45.93, the asset is neither overbought nor oversold, suggesting a neutral momentum state. Key technical levels to monitor include the support floor at 73,630.00 and the overhead resistance zone at 76,119.72.
2. Ethereum $ETH Technical Outlook
Ethereum $ETH shows a more pronounced decline of 4.92%, currently priced at $2,123.08. The asset is trading beneath its EMA 20 ($2,137.00) and EMA 50 ($2,170.59). The RSI stands at 39.92, approaching the oversold threshold, which warrants close observation for potential consolidation. Primary resistance is identified at $2,151.90 and $2,248.20, while the immediate support floor is situated at $2,071.55.
3. Macro Confluence & Market Structure
Both assets are currently testing local support levels as they navigate a corrective phase. $BTC maintains relative strength compared to $ETH, which is currently experiencing higher volatility and a steeper percentage decline. The divergence in their respective RSI readings suggests that market participants are currently favoring the stability of the primary asset over the altcoin leader.
4. Community Discussion
Which asset do you expect to lead momentum this week: $BTC or $ETH? Share below! 👇
⚠️ Educational analysis only. Not financial advice (NFA). DYOR.
$BTC $ETH #BinanceSquare #CryptoMarket
⚡ Market Titans Dual Analysis: Bitcoin $BTC vs Ethereum $ETH
1. Bitcoin $BTC Technical Outlook
The asset is currently trading at 74,657.08, reflecting a slight contraction of 1.58%. Price action remains positioned below both the EMA 20 (74,854.82) and EMA 50 (75,188.74), indicating a prevailing short-term bearish bias. With an RSI of 45.93, the asset is neither overbought nor oversold, suggesting a neutral momentum state. Key technical levels to monitor include the support floor at 73,630.00 and the overhead resistance zone at 76,119.72.
2. Ethereum $ETH Technical Outlook
Ethereum $ETH shows a more pronounced decline of 4.92%, currently priced at $2,123.08. The asset is trading beneath its EMA 20 ($2,137.00) and EMA 50 ($2,170.59). The RSI stands at 39.92, approaching the oversold threshold, which warrants close observation for potential consolidation. Primary resistance is identified at $2,151.90 and $2,248.20, while the immediate support floor is situated at $2,071.55.
3. Macro Confluence & Market Structure
Both assets are currently testing local support levels as they navigate a corrective phase. $BTC maintains relative strength compared to $ETH , which is currently experiencing higher volatility and a steeper percentage decline. The divergence in their respective RSI readings suggests that market participants are currently favoring the stability of the primary asset over the altcoin leader.
4. Community Discussion
Which asset do you expect to lead momentum this week: $BTC or $ETH ? Share below! 👇
⚠️ Educational analysis only. Not financial advice (NFA). DYOR.
$BTC $ETH #BinanceSquare #CryptoMarket
1. Bitcoin $BTC Technical Outlook
The asset is currently trading at 74,657.08, reflecting a slight contraction of 1.58%. Price action remains positioned below both the EMA 20 (74,854.82) and EMA 50 (75,188.74), indicating a prevailing short-term bearish bias. With an RSI of 45.93, the asset is neither overbought nor oversold, suggesting a neutral momentum state. Key technical levels to monitor include the support floor at 73,630.00 and the overhead resistance zone at 76,119.72.
2. Ethereum $ETH Technical Outlook
Ethereum $ETH shows a more pronounced decline of 4.92%, currently priced at $2,123.08. The asset is trading beneath its EMA 20 ($2,137.00) and EMA 50 ($2,170.59). The RSI stands at 39.92, approaching the oversold threshold, which warrants close observation for potential consolidation. Primary resistance is identified at $2,151.90 and $2,248.20, while the immediate support floor is situated at $2,071.55.
3. Macro Confluence & Market Structure
Both assets are currently testing local support levels as they navigate a corrective phase. $BTC maintains relative strength compared to $ETH , which is currently experiencing higher volatility and a steeper percentage decline. The divergence in their respective RSI readings suggests that market participants are currently favoring the stability of the primary asset over the altcoin leader.
4. Community Discussion
Which asset do you expect to lead momentum this week: $BTC or $ETH ? Share below! 👇
⚠️ Educational analysis only. Not financial advice (NFA). DYOR.
$BTC $ETH #BinanceSquare #CryptoMarket
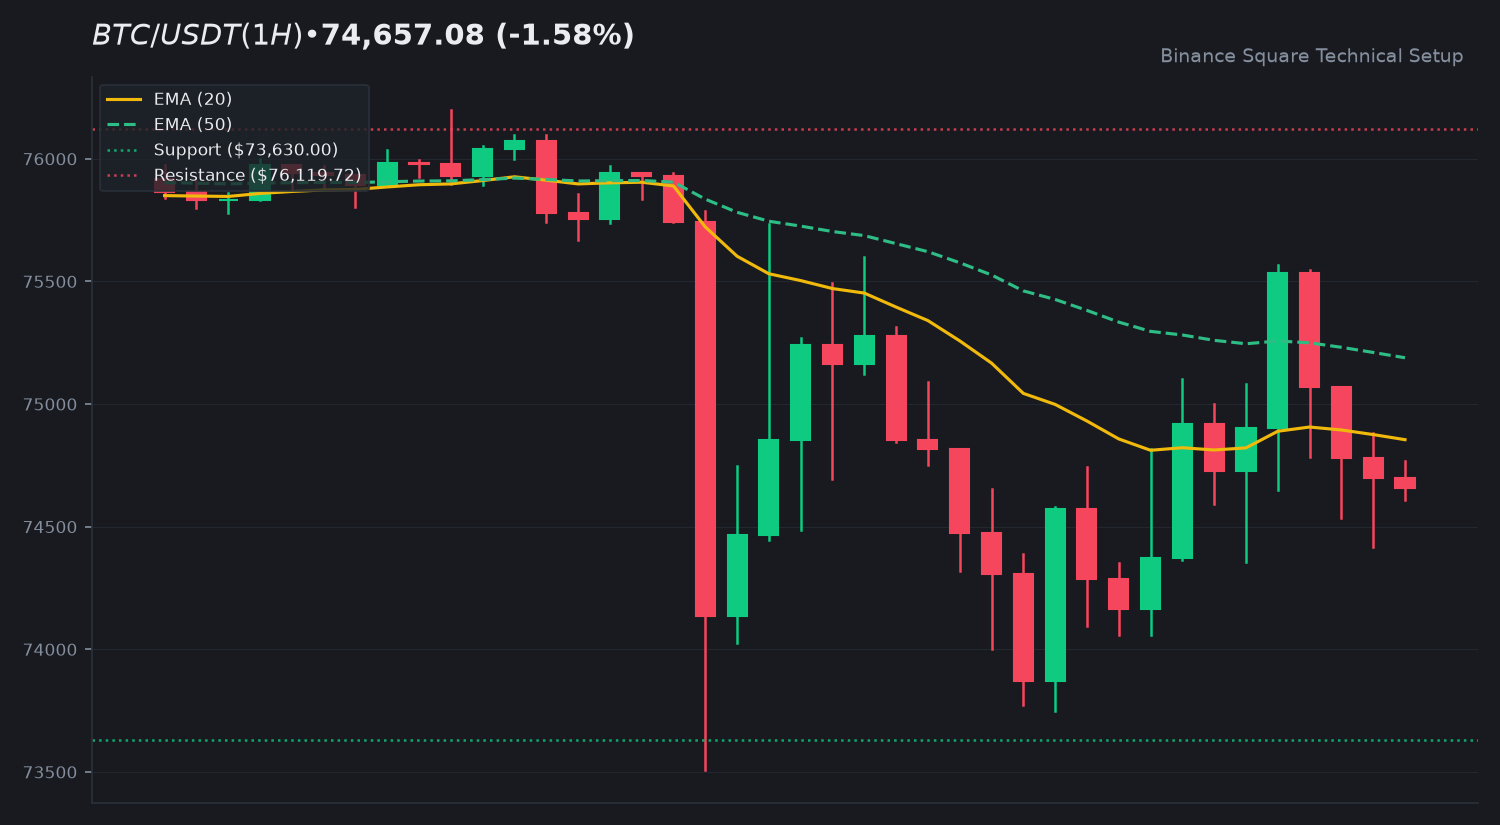
63
·
--
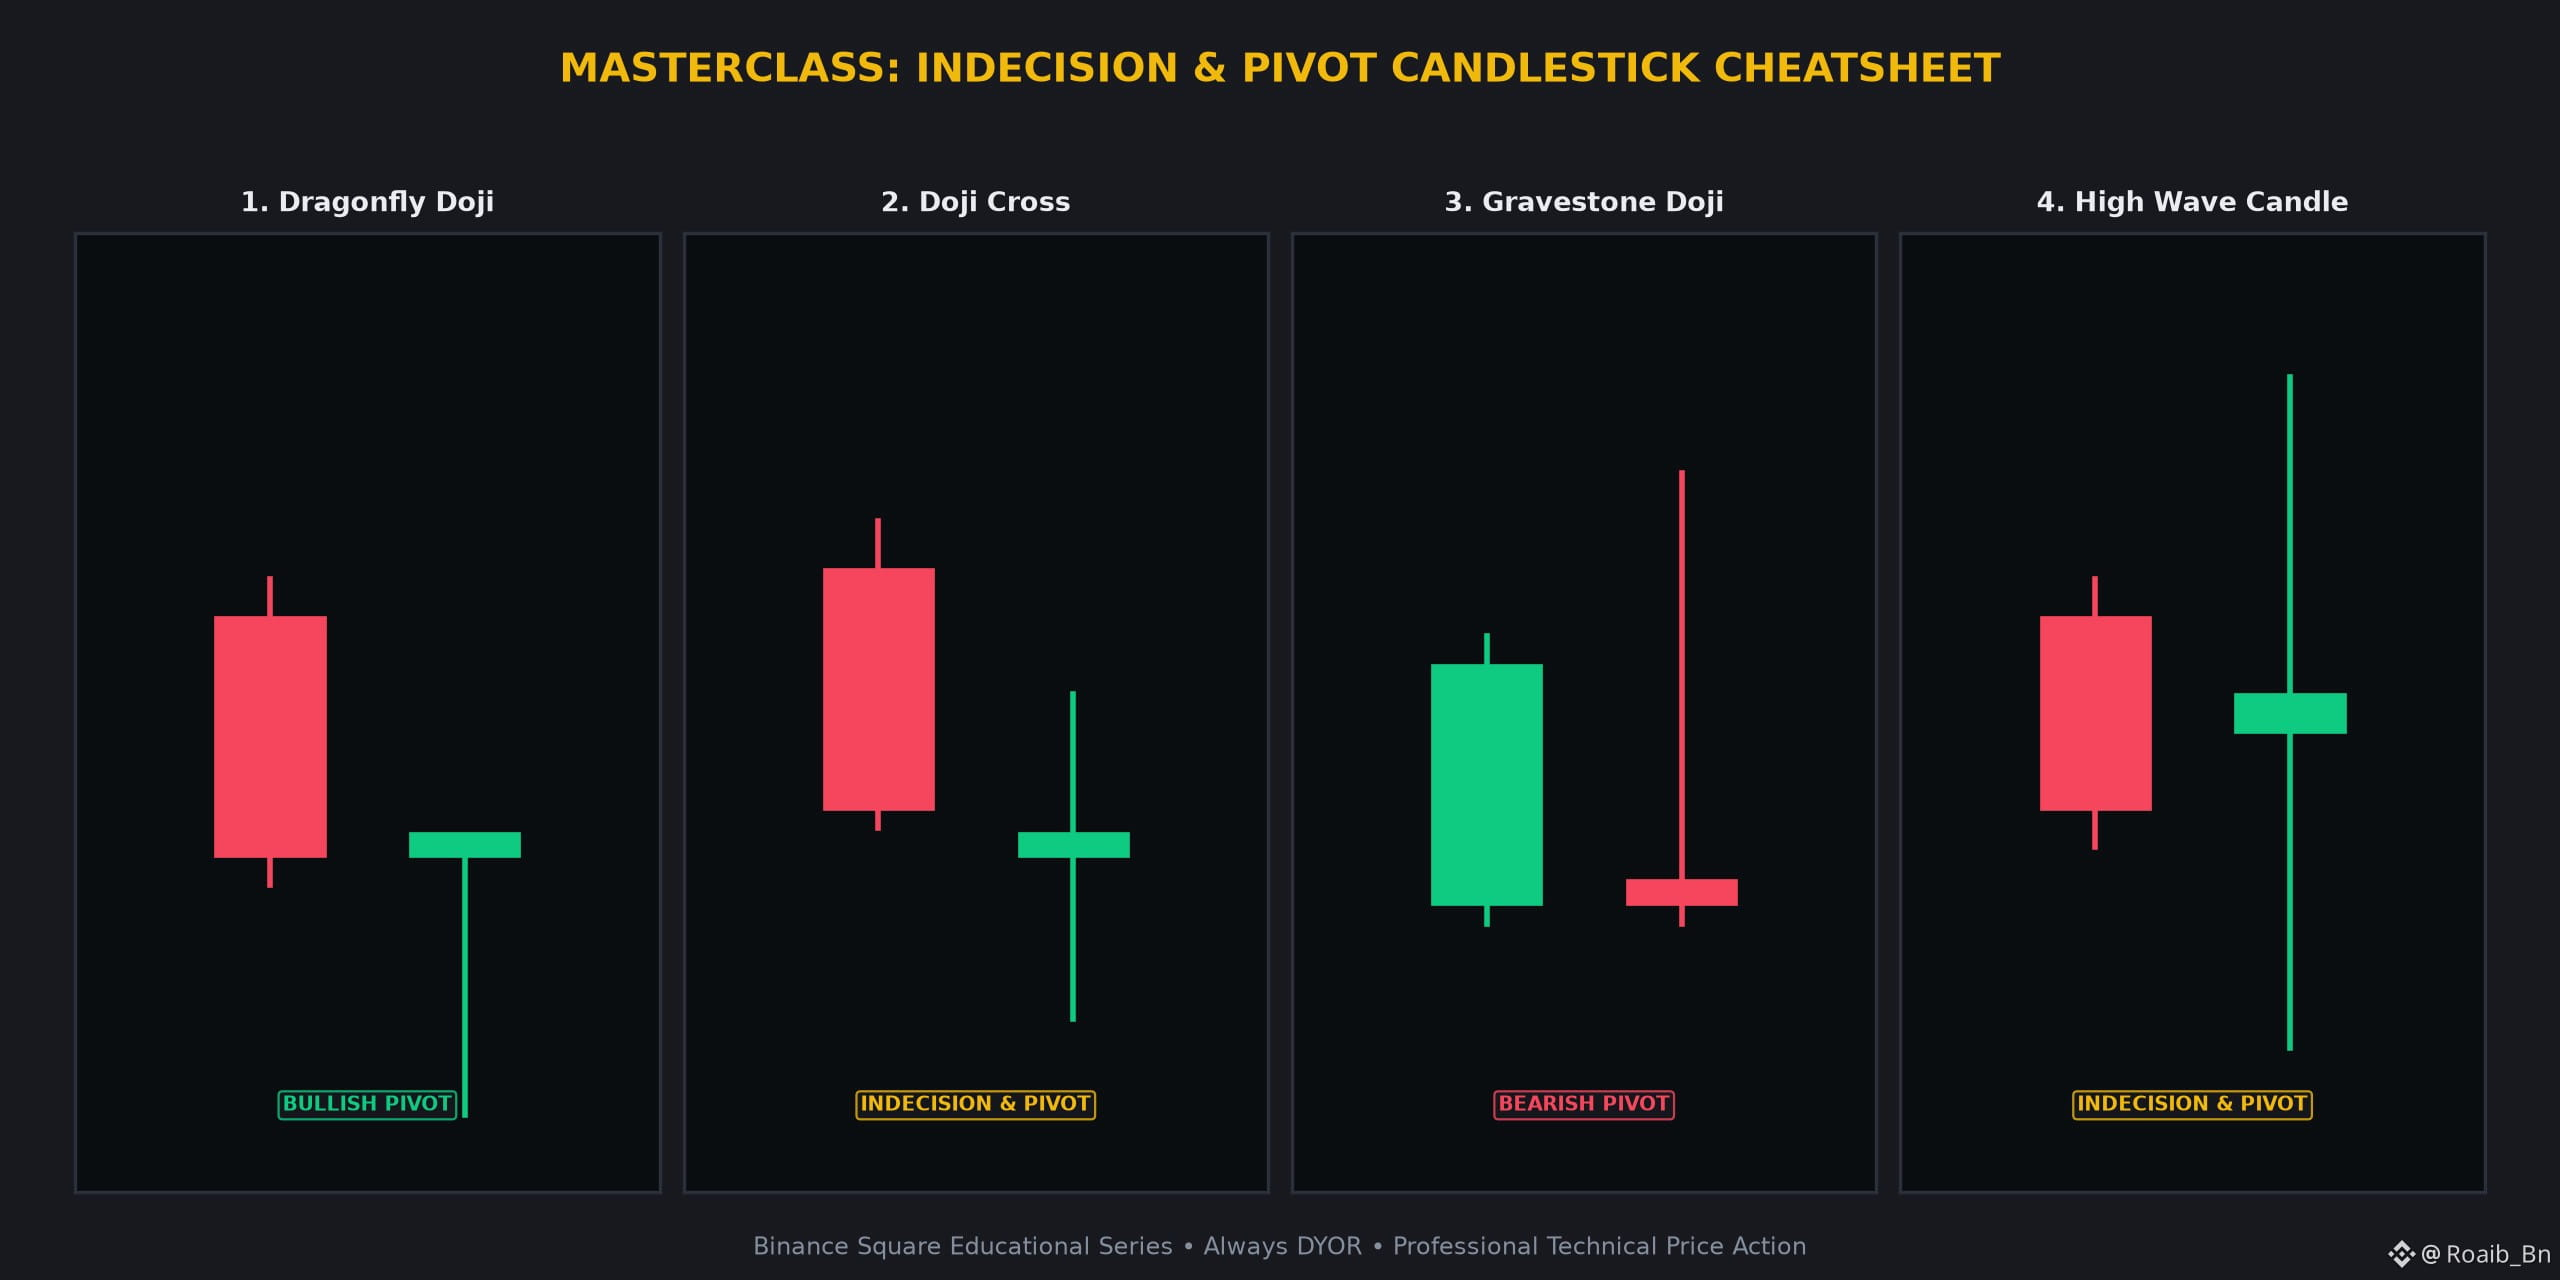
Article
See translation
🚨 PIVOT SIGNALS: 4 CANDLESTICKS THAT WARN A BIG MOVE IS COMING 👇🚨 PIVOT SIGNALS: 4 CANDLESTICKS THAT WARN A BIG MOVE IS COMING 👇
Understand price action at an institutional level. Here is your definitive masterclass on the most reliable candlestick formations every trader must master when analyzing $BTC $ETH SOL BNB.
1 🐉 Dragonfly Doji 🐉
• Candlestick Anatomy: T-shaped candle where open, high, and close are at the top, accompanied by a long lower shadow.
• Market Psychology: Sellers exhausted themselves pushing the price down, but buyers stepped in aggressively, erasing all losses by the close.
• High-Confidence Confirmation: Watch for this at support floors. A break above the high of the Dragonfly often serves as a pivot point.
2 ⚖️ Doji Cross ⚖️
• Candlestick Anatomy: Open and close are nearly identical, forming a cross shape.
• Market Psychology: Total equilibrium. Buyers and sellers are in a stalemate, signaling that the current trend is losing steam.
• High-Confidence Confirmation: Expect high volatility following this. Monitor volume spikes to determine the direction of the next expansion.
3 🪦 Gravestone Doji 🪦
• Candlestick Anatomy: Inverted T-shape with open, low, and close at the bottom and a long upper shadow.
• Market Psychology: Bulls attempted a breakout, but were rejected entirely, suggesting heavy sell-side liquidity at that level.
• High-Confidence Confirmation: Look for this at potential resistance zones. A close below the low of the Gravestone often signals a trend shift.
4 🌊 High Wave Candle 🌊
• Candlestick Anatomy: Extremely long upper and lower shadows with a tiny real body in the middle.
• Market Psychology: Violent tug of war between bulls and bears. This indicates total confusion and market exhaustion.
• High-Confidence Confirmation: This is a volatility warning. Wait for the next candle to close outside the range of the shadows to define the bias.
💡 Why Master These Candlestick Formations?
• Spot high-probability reversals and continuation phases before the retail crowd.
• Define exact risk-to-reward boundaries with clear invalidation levels.
• Combine with volume confirmation and dynamic moving averages (EMA 20/50).
💬 Community Masterclass Discussion:
Which of these 4 candlestick setups has yielded the highest win-rate in your crypto journey? Share your thoughts below! 👇
⚠️ Educational Masterclass Disclaimer:
This content is for educational purposes only and does not constitute financial advice (NFA). Cryptocurrency markets carry inherent volatility. Always manage risk prudently and conduct your own research (DYOR).
$BTC $ETH SOL BNB #BinanceSquare #CryptoTrading TechnicalAnalysis
🚨 PIVOT SIGNALS: 4 CANDLESTICKS THAT WARN A BIG MOVE IS COMING 👇
🚨 PIVOT SIGNALS: 4 CANDLESTICKS THAT WARN A BIG MOVE IS COMING 👇
Understand price action at an institutional level. Here is your definitive masterclass on the most reliable candlestick formations every trader must master when analyzing $BTC $ETH SOL BNB.
1 🐉 Dragonfly Doji 🐉
• Candlestick Anatomy: T-shaped candle where open, high, and close are at the top, accompanied by a long lower shadow.
• Market Psychology: Sellers exhausted themselves pushing the price down, but buyers stepped in aggressively, erasing all losses by the close.
• High-Confidence Confirmation: Watch for this at support floors. A break above the high of the Dragonfly often serves as a pivot point.
2 ⚖️ Doji Cross ⚖️
• Candlestick Anatomy: Open and close are nearly identical, forming a cross shape.
• Market Psychology: Total equilibrium. Buyers and sellers are in a stalemate, signaling that the current trend is losing steam.
• High-Confidence Confirmation: Expect high volatility following this. Monitor volume spikes to determine the direction of the next expansion.
3 🪦 Gravestone Doji 🪦
• Candlestick Anatomy: Inverted T-shape with open, low, and close at the bottom and a long upper shadow.
• Market Psychology: Bulls attempted a breakout, but were rejected entirely, suggesting heavy sell-side liquidity at that level.
• High-Confidence Confirmation: Look for this at potential resistance zones. A close below the low of the Gravestone often signals a trend shift.
4 🌊 High Wave Candle 🌊
• Candlestick Anatomy: Extremely long upper and lower shadows with a tiny real body in the middle.
• Market Psychology: Violent tug of war between bulls and bears. This indicates total confusion and market exhaustion.
• High-Confidence Confirmation: This is a volatility warning. Wait for the next candle to close outside the range of the shadows to define the bias.
💡 Why Master These Candlestick Formations?
• Spot high-probability reversals and continuation phases before the retail crowd.
• Define exact risk-to-reward boundaries with clear invalidation levels.
• Combine with volume confirmation and dynamic moving averages (EMA 20/50).
💬 Community Masterclass Discussion:
Which of these 4 candlestick setups has yielded the highest win-rate in your crypto journey? Share your thoughts below! 👇
⚠️ Educational Masterclass Disclaimer:
This content is for educational purposes only and does not constitute financial advice (NFA). Cryptocurrency markets carry inherent volatility. Always manage risk prudently and conduct your own research (DYOR).
$BTC $ETH SOL BNB #BinanceSquare #CryptoTrading TechnicalAnalysis
Understand price action at an institutional level. Here is your definitive masterclass on the most reliable candlestick formations every trader must master when analyzing $BTC $ETH SOL BNB.
1 🐉 Dragonfly Doji 🐉
• Candlestick Anatomy: T-shaped candle where open, high, and close are at the top, accompanied by a long lower shadow.
• Market Psychology: Sellers exhausted themselves pushing the price down, but buyers stepped in aggressively, erasing all losses by the close.
• High-Confidence Confirmation: Watch for this at support floors. A break above the high of the Dragonfly often serves as a pivot point.
2 ⚖️ Doji Cross ⚖️
• Candlestick Anatomy: Open and close are nearly identical, forming a cross shape.
• Market Psychology: Total equilibrium. Buyers and sellers are in a stalemate, signaling that the current trend is losing steam.
• High-Confidence Confirmation: Expect high volatility following this. Monitor volume spikes to determine the direction of the next expansion.
3 🪦 Gravestone Doji 🪦
• Candlestick Anatomy: Inverted T-shape with open, low, and close at the bottom and a long upper shadow.
• Market Psychology: Bulls attempted a breakout, but were rejected entirely, suggesting heavy sell-side liquidity at that level.
• High-Confidence Confirmation: Look for this at potential resistance zones. A close below the low of the Gravestone often signals a trend shift.
4 🌊 High Wave Candle 🌊
• Candlestick Anatomy: Extremely long upper and lower shadows with a tiny real body in the middle.
• Market Psychology: Violent tug of war between bulls and bears. This indicates total confusion and market exhaustion.
• High-Confidence Confirmation: This is a volatility warning. Wait for the next candle to close outside the range of the shadows to define the bias.
💡 Why Master These Candlestick Formations?
• Spot high-probability reversals and continuation phases before the retail crowd.
• Define exact risk-to-reward boundaries with clear invalidation levels.
• Combine with volume confirmation and dynamic moving averages (EMA 20/50).
💬 Community Masterclass Discussion:
Which of these 4 candlestick setups has yielded the highest win-rate in your crypto journey? Share your thoughts below! 👇
⚠️ Educational Masterclass Disclaimer:
This content is for educational purposes only and does not constitute financial advice (NFA). Cryptocurrency markets carry inherent volatility. Always manage risk prudently and conduct your own research (DYOR).
$BTC $ETH SOL BNB #BinanceSquare #CryptoTrading TechnicalAnalysis
65
·
--
See translation
🔥 $ZEC Technical Update: Key Levels & Momentum Breakdown
📊 1. Market Snapshot
The $ZEC asset is trading at $1,177.0000, registering a 24-hour decline of 6.42 percent. Price action moved between a daily high of $1,269.2700 and a low of $1,174.5800, backed by robust trading activity with a 24-hour quote volume reaching $213,212,844 USDT.
📈 2. Technical Momentum & Indicator Bias
The multi-timeframe trend reflects a sustained downward bias. Price sits below both the EMA 20 at $1,220.5464 and the EMA 50 at $1,241.5523, indicating continuing selling pressure. The 14-period RSI prints at 35.93, approaching oversold territory without a confirmed reversal signal. Meanwhile, the MACD histogram registers at -0.2494, confirming ongoing bearish momentum within the current structure.
🎯 3. Key Technical Levels to Watch
• 🟢 Resistance Zone: The immediate overhead hurdle rests near the EMA 50 region at $1,241.8450, with secondary resistance extending toward $1,278.9500.
• 🔴 Support Zone: The primary floor is established at the daily low of $1,174.5800.
• 🛡️ Pivot Confluence: The EMA 20 line around $1,220.5464 serves as the primary dynamic pivot to gauge any short-term trend shift.
💡 4. Technical Takeaway & Risk Management
Market participants are closely monitoring how price behaves near the immediate support floor. Sustained rejection below the EMA 20 dynamic barrier preserves the prevailing downward trajectory, making volume confirmation essential for identifying potential trend stabilization.
💬 5. Community Discussion
What is your technical outlook for $ZEC this week? Are you monitoring range accumulation or waiting for structural confirmation? Drop your thoughts below! 👇
⚠️ 6. Disclaimer
Educational technical analysis only. Not financial advice (NFA). Crypto markets involve risk. Always DYOR.
$ZEC #ZEC #BinanceSquare
🔥 $ZEC Technical Update: Key Levels & Momentum Breakdown
📊 1. Market Snapshot
The $ZEC asset is trading at $1,177.0000, registering a 24-hour decline of 6.42 percent. Price action moved between a daily high of $1,269.2700 and a low of $1,174.5800, backed by robust trading activity with a 24-hour quote volume reaching $213,212,844 USDT.
📈 2. Technical Momentum & Indicator Bias
The multi-timeframe trend reflects a sustained downward bias. Price sits below both the EMA 20 at $1,220.5464 and the EMA 50 at $1,241.5523, indicating continuing selling pressure. The 14-period RSI prints at 35.93, approaching oversold territory without a confirmed reversal signal. Meanwhile, the MACD histogram registers at -0.2494, confirming ongoing bearish momentum within the current structure.
🎯 3. Key Technical Levels to Watch
• 🟢 Resistance Zone: The immediate overhead hurdle rests near the EMA 50 region at $1,241.8450, with secondary resistance extending toward $1,278.9500.
• 🔴 Support Zone: The primary floor is established at the daily low of $1,174.5800.
• 🛡️ Pivot Confluence: The EMA 20 line around $1,220.5464 serves as the primary dynamic pivot to gauge any short-term trend shift.
💡 4. Technical Takeaway & Risk Management
Market participants are closely monitoring how price behaves near the immediate support floor. Sustained rejection below the EMA 20 dynamic barrier preserves the prevailing downward trajectory, making volume confirmation essential for identifying potential trend stabilization.
💬 5. Community Discussion
What is your technical outlook for $ZEC this week? Are you monitoring range accumulation or waiting for structural confirmation? Drop your thoughts below! 👇
⚠️ 6. Disclaimer
Educational technical analysis only. Not financial advice (NFA). Crypto markets involve risk. Always DYOR.
$ZEC #ZEC #BinanceSquare
📊 1. Market Snapshot
The $ZEC asset is trading at $1,177.0000, registering a 24-hour decline of 6.42 percent. Price action moved between a daily high of $1,269.2700 and a low of $1,174.5800, backed by robust trading activity with a 24-hour quote volume reaching $213,212,844 USDT.
📈 2. Technical Momentum & Indicator Bias
The multi-timeframe trend reflects a sustained downward bias. Price sits below both the EMA 20 at $1,220.5464 and the EMA 50 at $1,241.5523, indicating continuing selling pressure. The 14-period RSI prints at 35.93, approaching oversold territory without a confirmed reversal signal. Meanwhile, the MACD histogram registers at -0.2494, confirming ongoing bearish momentum within the current structure.
🎯 3. Key Technical Levels to Watch
• 🟢 Resistance Zone: The immediate overhead hurdle rests near the EMA 50 region at $1,241.8450, with secondary resistance extending toward $1,278.9500.
• 🔴 Support Zone: The primary floor is established at the daily low of $1,174.5800.
• 🛡️ Pivot Confluence: The EMA 20 line around $1,220.5464 serves as the primary dynamic pivot to gauge any short-term trend shift.
💡 4. Technical Takeaway & Risk Management
Market participants are closely monitoring how price behaves near the immediate support floor. Sustained rejection below the EMA 20 dynamic barrier preserves the prevailing downward trajectory, making volume confirmation essential for identifying potential trend stabilization.
💬 5. Community Discussion
What is your technical outlook for $ZEC this week? Are you monitoring range accumulation or waiting for structural confirmation? Drop your thoughts below! 👇
⚠️ 6. Disclaimer
Educational technical analysis only. Not financial advice (NFA). Crypto markets involve risk. Always DYOR.
$ZEC #ZEC #BinanceSquare
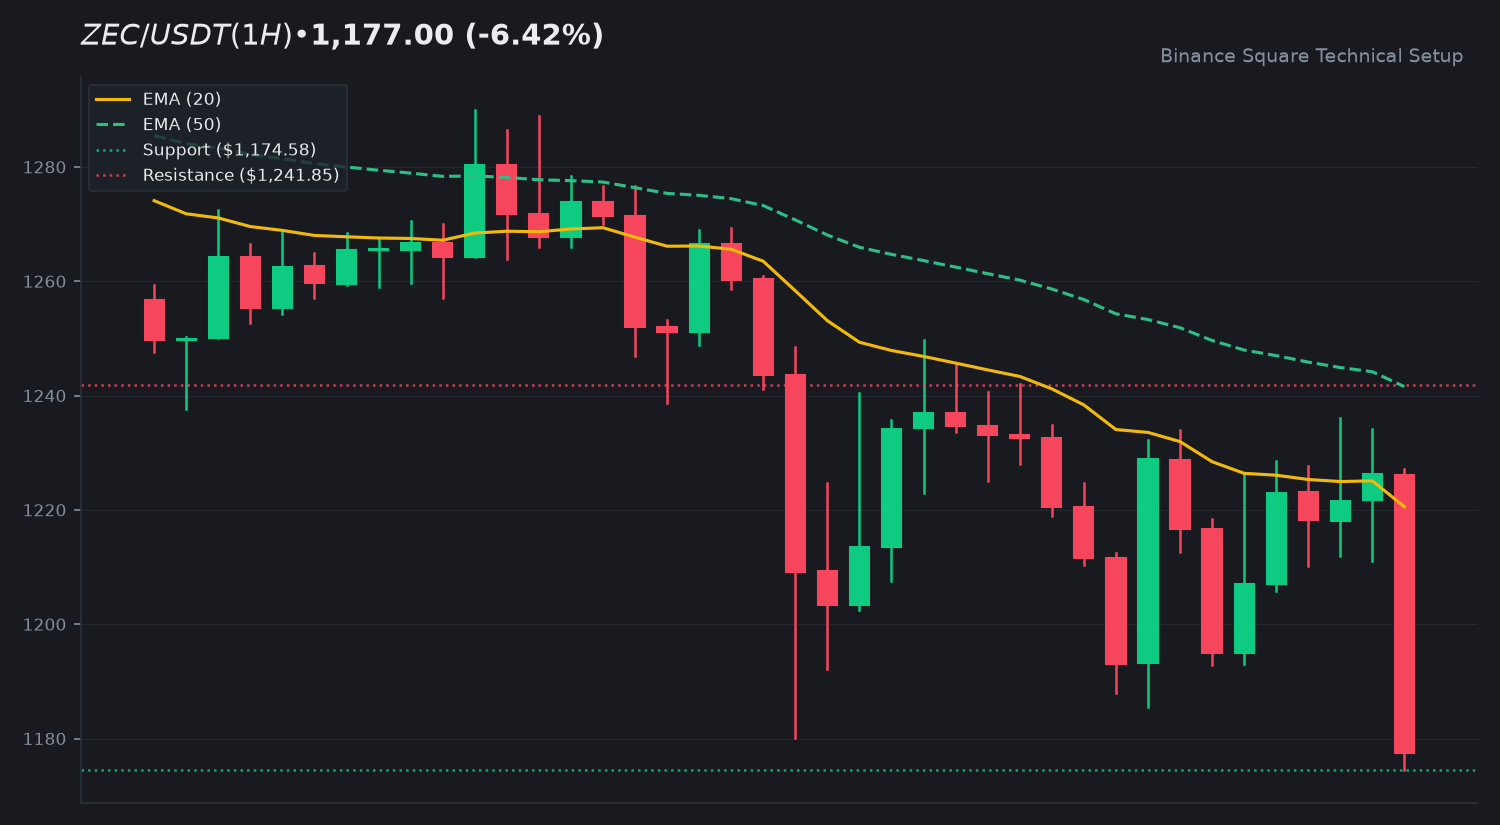
37
·
--
See translation
🔥 $ARB Technical Update: Key Levels & Momentum Breakdown
📊 1. Market Snapshot
$ARB is currently trading at $0.1803, recording a solid 24-hour gain of +6.31%. Price action reached a 24-hour high of $0.1880 after bouncing from a daily low of $0.1598, backed by a steady 24-hour quote volume of $27.6M USDT.
📈 2. Technical Momentum & Indicator Bias
The trend structure shows sustained upward momentum, with the fast EMA 20 sitting at $0.1755 above the EMA 50 at $0.1715. The Relative Strength Index (RSI 14) prints at 64.01, reflecting active buyer control without entering overbought extremes. Furthermore, the MACD histogram registers a positive value of +0.0009 with the MACD line crossing above the signal line, confirming ongoing bullish continuation characteristics.
🎯 3. Key Technical Levels to Watch
• 🟢 Resistance Zone: The immediate ceiling rests at the $0.1880 24-hour high.
• 🔴 Support Zone: Initial support is located around the $0.1662 mark, with secondary defense near the $0.1598 low.
• 🛡️ Pivot Confluence: The EMA 20 at $0.1755 acts as a crucial dynamic pivot for short-term trend health.
💡 4. Technical Takeaway & Risk Management
Price action remains constructive as long as candles close above the key moving averages. Traders often monitor whether volume expands during tests of overhead resistance or if a consolidation phase develops near current structural boundaries.
💬 5. Community Discussion
What is your technical outlook for $ARB this week? Are you tracking the EMA levels or waiting for volume confirmation? Drop your thoughts below! 👇
⚠️ 6. Disclaimer
Educational technical analysis only. Not financial advice (NFA). Crypto markets involve risk. Always DYOR.
$ARB #ARB #BinanceSquare
🔥 $ARB Technical Update: Key Levels & Momentum Breakdown
📊 1. Market Snapshot
$ARB is currently trading at $0.1803, recording a solid 24-hour gain of +6.31%. Price action reached a 24-hour high of $0.1880 after bouncing from a daily low of $0.1598, backed by a steady 24-hour quote volume of $27.6M USDT.
📈 2. Technical Momentum & Indicator Bias
The trend structure shows sustained upward momentum, with the fast EMA 20 sitting at $0.1755 above the EMA 50 at $0.1715. The Relative Strength Index (RSI 14) prints at 64.01, reflecting active buyer control without entering overbought extremes. Furthermore, the MACD histogram registers a positive value of +0.0009 with the MACD line crossing above the signal line, confirming ongoing bullish continuation characteristics.
🎯 3. Key Technical Levels to Watch
• 🟢 Resistance Zone: The immediate ceiling rests at the $0.1880 24-hour high.
• 🔴 Support Zone: Initial support is located around the $0.1662 mark, with secondary defense near the $0.1598 low.
• 🛡️ Pivot Confluence: The EMA 20 at $0.1755 acts as a crucial dynamic pivot for short-term trend health.
💡 4. Technical Takeaway & Risk Management
Price action remains constructive as long as candles close above the key moving averages. Traders often monitor whether volume expands during tests of overhead resistance or if a consolidation phase develops near current structural boundaries.
💬 5. Community Discussion
What is your technical outlook for $ARB this week? Are you tracking the EMA levels or waiting for volume confirmation? Drop your thoughts below! 👇
⚠️ 6. Disclaimer
Educational technical analysis only. Not financial advice (NFA). Crypto markets involve risk. Always DYOR.
$ARB #ARB #BinanceSquare
📊 1. Market Snapshot
$ARB is currently trading at $0.1803, recording a solid 24-hour gain of +6.31%. Price action reached a 24-hour high of $0.1880 after bouncing from a daily low of $0.1598, backed by a steady 24-hour quote volume of $27.6M USDT.
📈 2. Technical Momentum & Indicator Bias
The trend structure shows sustained upward momentum, with the fast EMA 20 sitting at $0.1755 above the EMA 50 at $0.1715. The Relative Strength Index (RSI 14) prints at 64.01, reflecting active buyer control without entering overbought extremes. Furthermore, the MACD histogram registers a positive value of +0.0009 with the MACD line crossing above the signal line, confirming ongoing bullish continuation characteristics.
🎯 3. Key Technical Levels to Watch
• 🟢 Resistance Zone: The immediate ceiling rests at the $0.1880 24-hour high.
• 🔴 Support Zone: Initial support is located around the $0.1662 mark, with secondary defense near the $0.1598 low.
• 🛡️ Pivot Confluence: The EMA 20 at $0.1755 acts as a crucial dynamic pivot for short-term trend health.
💡 4. Technical Takeaway & Risk Management
Price action remains constructive as long as candles close above the key moving averages. Traders often monitor whether volume expands during tests of overhead resistance or if a consolidation phase develops near current structural boundaries.
💬 5. Community Discussion
What is your technical outlook for $ARB this week? Are you tracking the EMA levels or waiting for volume confirmation? Drop your thoughts below! 👇
⚠️ 6. Disclaimer
Educational technical analysis only. Not financial advice (NFA). Crypto markets involve risk. Always DYOR.
$ARB #ARB #BinanceSquare
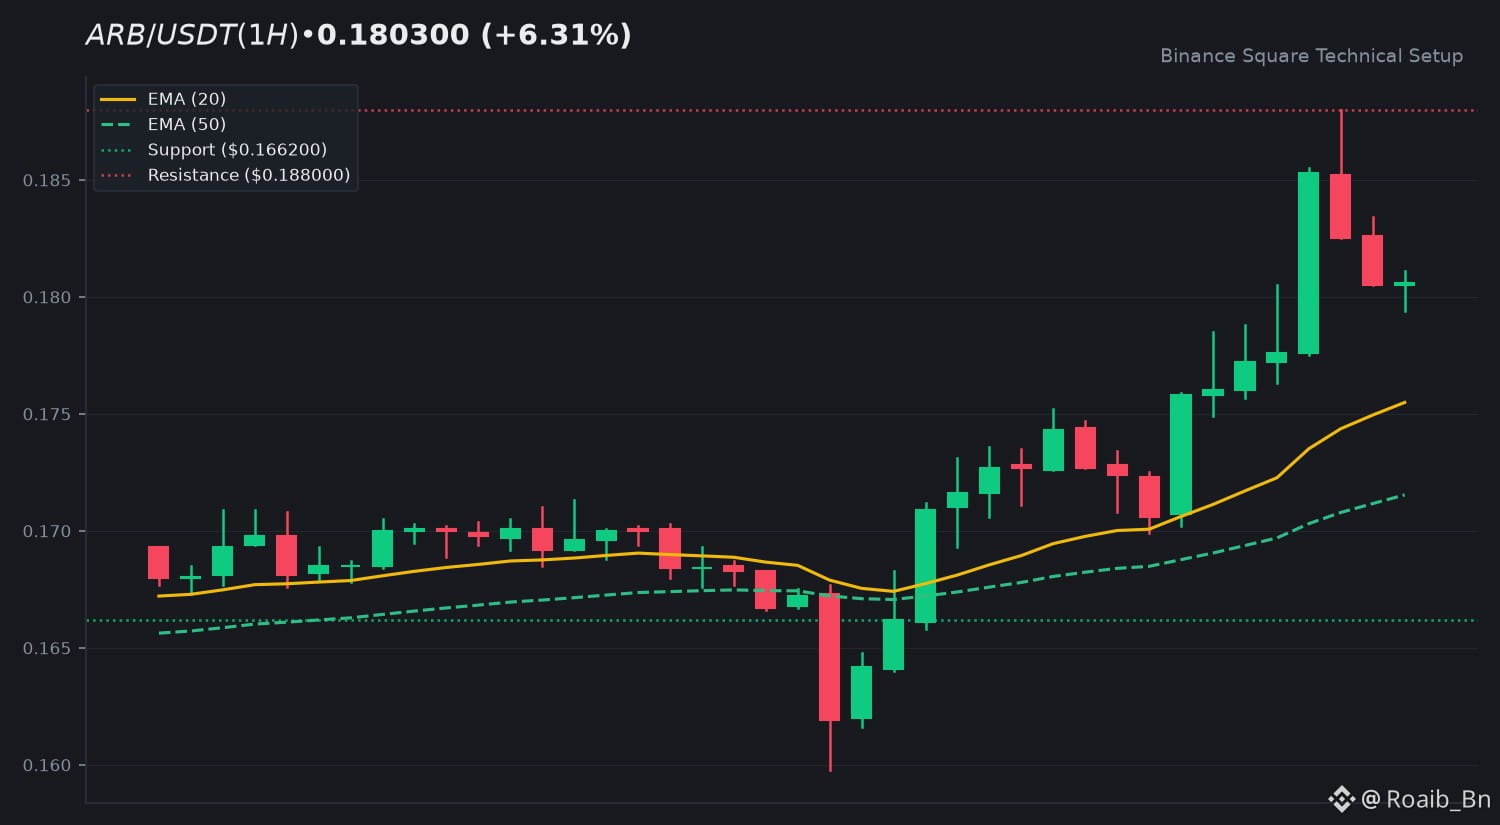
62
·
--
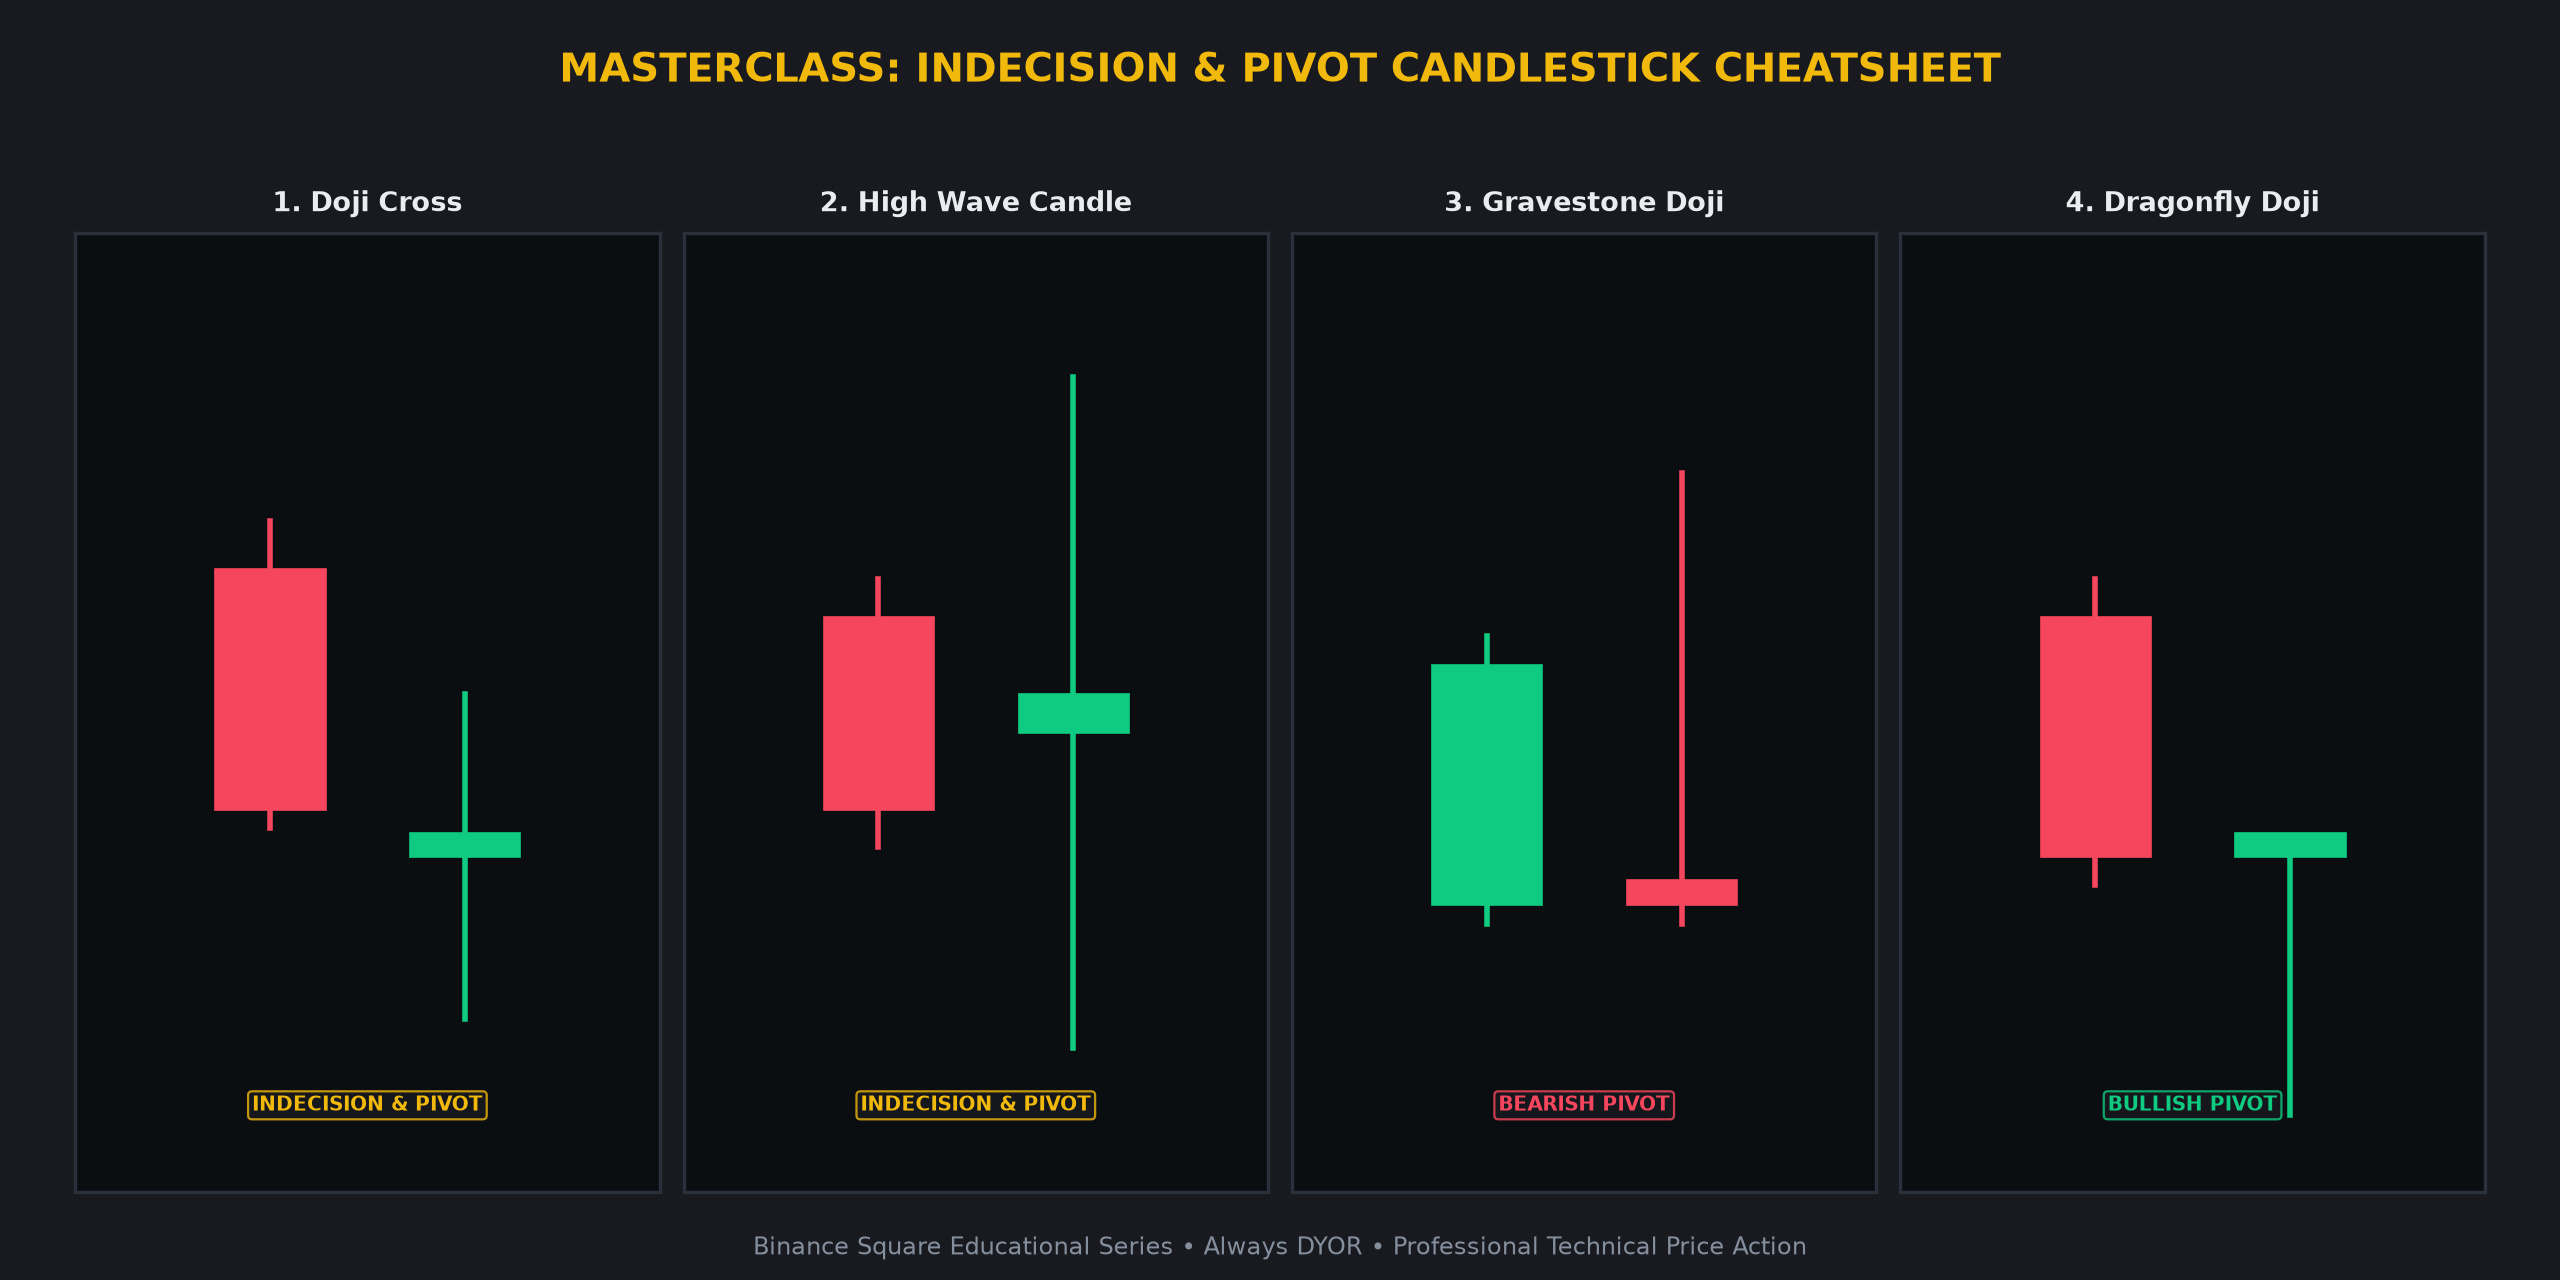
Article
See translation
🚨 PIVOT SIGNALS: 4 CANDLESTICKS THAT WARN A BIG MOVE IS COMING 👇🚨 PIVOT SIGNALS: 4 CANDLESTICKS THAT WARN A BIG MOVE IS COMING 👇
Understand price action at an institutional level. Here is your definitive masterclass on the most reliable candlestick formations every crypto trader must master when analyzing $BTC $ETH SOL.
1️⃣ Doji Cross ⚖️
• Candlestick Anatomy: Virtually identical open and close price creating a cross or plus shape.
• Market Psychology: Total equilibrium between buyers and sellers; prepares the stage for violent expansion.
• High-Confidence Confirmation: Watch for a breakout above the high or below the low of the candle with increased volume.
2️⃣ High Wave Candle 🌊
• Candlestick Anatomy: Extremely long upper and lower shadows with a tiny real body in the middle.
• Market Psychology: Violent tug of war between bulls and bears resulting in complete confusion and exhaustion.
• High-Confidence Confirmation: Often marks a local top or bottom. Wait for the subsequent candle to close outside the range of the shadows.
3️⃣ Gravestone Doji 🪦
• Candlestick Anatomy: Inverted T-shaped candle with open, low, and close at bottom and very long upper shadow.
• Market Psychology: Bulls staged an aggressive rally that was completely rejected by end of period.
• High-Confidence Confirmation: Look for this at resistance levels. Invalidation occurs if price closes above the upper wick.
4️⃣ Dragonfly Doji 🐉
• Candlestick Anatomy: T-shaped candle with open, high, and close at the top and very long lower shadow.
• Market Psychology: Sellers pushed price to deep lows, but buyers aggressively bought back up to the open.
• High-Confidence Confirmation: Often seen at support floors. Invalidation occurs if price drops below the lower wick.
💡 Why Master These Candlestick Formations?
• Spot high-probability reversals and continuation phases before the retail crowd.
• Define exact risk-to-reward boundaries with clear invalidation levels.
• Combine with volume confirmation and dynamic moving averages (EMA 20/50).
💬 Community Masterclass Discussion:
Which of these 4 candlestick setups has yielded the highest win-rate in your crypto journey? Share your thoughts below! 👇
⚠️ Educational Masterclass Disclaimer:
This content is for educational purposes only and does not constitute financial advice (NFA). Cryptocurrency markets carry inherent volatility. Always manage risk prudently and conduct your own research (DYOR).
$BTC $ETH SOL #BinanceSquare #CryptoTrading TechnicalAnalysis
🚨 PIVOT SIGNALS: 4 CANDLESTICKS THAT WARN A BIG MOVE IS COMING 👇
🚨 PIVOT SIGNALS: 4 CANDLESTICKS THAT WARN A BIG MOVE IS COMING 👇
Understand price action at an institutional level. Here is your definitive masterclass on the most reliable candlestick formations every crypto trader must master when analyzing $BTC $ETH SOL.
1️⃣ Doji Cross ⚖️
• Candlestick Anatomy: Virtually identical open and close price creating a cross or plus shape.
• Market Psychology: Total equilibrium between buyers and sellers; prepares the stage for violent expansion.
• High-Confidence Confirmation: Watch for a breakout above the high or below the low of the candle with increased volume.
2️⃣ High Wave Candle 🌊
• Candlestick Anatomy: Extremely long upper and lower shadows with a tiny real body in the middle.
• Market Psychology: Violent tug of war between bulls and bears resulting in complete confusion and exhaustion.
• High-Confidence Confirmation: Often marks a local top or bottom. Wait for the subsequent candle to close outside the range of the shadows.
3️⃣ Gravestone Doji 🪦
• Candlestick Anatomy: Inverted T-shaped candle with open, low, and close at bottom and very long upper shadow.
• Market Psychology: Bulls staged an aggressive rally that was completely rejected by end of period.
• High-Confidence Confirmation: Look for this at resistance levels. Invalidation occurs if price closes above the upper wick.
4️⃣ Dragonfly Doji 🐉
• Candlestick Anatomy: T-shaped candle with open, high, and close at the top and very long lower shadow.
• Market Psychology: Sellers pushed price to deep lows, but buyers aggressively bought back up to the open.
• High-Confidence Confirmation: Often seen at support floors. Invalidation occurs if price drops below the lower wick.
💡 Why Master These Candlestick Formations?
• Spot high-probability reversals and continuation phases before the retail crowd.
• Define exact risk-to-reward boundaries with clear invalidation levels.
• Combine with volume confirmation and dynamic moving averages (EMA 20/50).
💬 Community Masterclass Discussion:
Which of these 4 candlestick setups has yielded the highest win-rate in your crypto journey? Share your thoughts below! 👇
⚠️ Educational Masterclass Disclaimer:
This content is for educational purposes only and does not constitute financial advice (NFA). Cryptocurrency markets carry inherent volatility. Always manage risk prudently and conduct your own research (DYOR).
$BTC $ETH SOL #BinanceSquare #CryptoTrading TechnicalAnalysis
Understand price action at an institutional level. Here is your definitive masterclass on the most reliable candlestick formations every crypto trader must master when analyzing $BTC $ETH SOL.
1️⃣ Doji Cross ⚖️
• Candlestick Anatomy: Virtually identical open and close price creating a cross or plus shape.
• Market Psychology: Total equilibrium between buyers and sellers; prepares the stage for violent expansion.
• High-Confidence Confirmation: Watch for a breakout above the high or below the low of the candle with increased volume.
2️⃣ High Wave Candle 🌊
• Candlestick Anatomy: Extremely long upper and lower shadows with a tiny real body in the middle.
• Market Psychology: Violent tug of war between bulls and bears resulting in complete confusion and exhaustion.
• High-Confidence Confirmation: Often marks a local top or bottom. Wait for the subsequent candle to close outside the range of the shadows.
3️⃣ Gravestone Doji 🪦
• Candlestick Anatomy: Inverted T-shaped candle with open, low, and close at bottom and very long upper shadow.
• Market Psychology: Bulls staged an aggressive rally that was completely rejected by end of period.
• High-Confidence Confirmation: Look for this at resistance levels. Invalidation occurs if price closes above the upper wick.
4️⃣ Dragonfly Doji 🐉
• Candlestick Anatomy: T-shaped candle with open, high, and close at the top and very long lower shadow.
• Market Psychology: Sellers pushed price to deep lows, but buyers aggressively bought back up to the open.
• High-Confidence Confirmation: Often seen at support floors. Invalidation occurs if price drops below the lower wick.
💡 Why Master These Candlestick Formations?
• Spot high-probability reversals and continuation phases before the retail crowd.
• Define exact risk-to-reward boundaries with clear invalidation levels.
• Combine with volume confirmation and dynamic moving averages (EMA 20/50).
💬 Community Masterclass Discussion:
Which of these 4 candlestick setups has yielded the highest win-rate in your crypto journey? Share your thoughts below! 👇
⚠️ Educational Masterclass Disclaimer:
This content is for educational purposes only and does not constitute financial advice (NFA). Cryptocurrency markets carry inherent volatility. Always manage risk prudently and conduct your own research (DYOR).
$BTC $ETH SOL #BinanceSquare #CryptoTrading TechnicalAnalysis
62
·
--
See translation
🔥 $DOGE Technical Update: Key Levels & Momentum Breakdown
📊 1. Market Snapshot
$DOGE is currently trading at $0.0697, reflecting a mild 24-hour decline of -2.49%. The asset has explored a 24-hour high of $0.0717 against a low of $0.0673, accompanied by a total 24-hour quote volume of over 50 million USDT on Binance. Volume activity remains muted, indicating a consolidation phase.
📈 2. Technical Momentum & Indicator Bias
Price action hovers closely around the EMA 20 sitting at $0.0696, while the EMA 50 stands just above at $0.0704, signaling a tight structural compression. The Relative Strength Index sits neutrally at 48.7, reflecting a balanced momentum state devoid of overbought or oversold extremes. Meanwhile, the MACD histogram prints a fractional positive reading of +0.0001 with converging lines, highlighting indecision in current trend direction.
🎯 3. Key Technical Levels to Watch
• 🟢 Resistance Zone: $0.0724 serves as the primary technical ceiling for short-term retracement attempts.
• 🔴 Support Zone: $0.0676 provides the immediate floor acting as a historical defensive barrier.
• 🛡️ Pivot Confluence: The $0.0696 EMA 20 level functions as the critical pivot for intraday direction.
💡 4. Technical Takeaway & Risk Management
Current indicators suggest a phase of low-conviction consolidation. Traders are monitoring whether volume expands above the moving averages or if price action retests local support floors. Prudent risk management involves tracking price reactions at key zones rather than anticipating breakouts.
💬 5. Community Discussion
What is your technical outlook for $DOGE this week? Are you accumulating near support or waiting for volume confirmation? Drop your thoughts below! 👇
⚠️ 6. Disclaimer
Educational technical analysis only. Not financial advice (NFA). Crypto markets involve risk. Always DYOR.
$DOGE #DOGE #BinanceSquare
🔥 $DOGE Technical Update: Key Levels & Momentum Breakdown
📊 1. Market Snapshot
$DOGE is currently trading at $0.0697, reflecting a mild 24-hour decline of -2.49%. The asset has explored a 24-hour high of $0.0717 against a low of $0.0673, accompanied by a total 24-hour quote volume of over 50 million USDT on Binance. Volume activity remains muted, indicating a consolidation phase.
📈 2. Technical Momentum & Indicator Bias
Price action hovers closely around the EMA 20 sitting at $0.0696, while the EMA 50 stands just above at $0.0704, signaling a tight structural compression. The Relative Strength Index sits neutrally at 48.7, reflecting a balanced momentum state devoid of overbought or oversold extremes. Meanwhile, the MACD histogram prints a fractional positive reading of +0.0001 with converging lines, highlighting indecision in current trend direction.
🎯 3. Key Technical Levels to Watch
• 🟢 Resistance Zone: $0.0724 serves as the primary technical ceiling for short-term retracement attempts.
• 🔴 Support Zone: $0.0676 provides the immediate floor acting as a historical defensive barrier.
• 🛡️ Pivot Confluence: The $0.0696 EMA 20 level functions as the critical pivot for intraday direction.
💡 4. Technical Takeaway & Risk Management
Current indicators suggest a phase of low-conviction consolidation. Traders are monitoring whether volume expands above the moving averages or if price action retests local support floors. Prudent risk management involves tracking price reactions at key zones rather than anticipating breakouts.
💬 5. Community Discussion
What is your technical outlook for $DOGE this week? Are you accumulating near support or waiting for volume confirmation? Drop your thoughts below! 👇
⚠️ 6. Disclaimer
Educational technical analysis only. Not financial advice (NFA). Crypto markets involve risk. Always DYOR.
$DOGE #DOGE #BinanceSquare
📊 1. Market Snapshot
$DOGE is currently trading at $0.0697, reflecting a mild 24-hour decline of -2.49%. The asset has explored a 24-hour high of $0.0717 against a low of $0.0673, accompanied by a total 24-hour quote volume of over 50 million USDT on Binance. Volume activity remains muted, indicating a consolidation phase.
📈 2. Technical Momentum & Indicator Bias
Price action hovers closely around the EMA 20 sitting at $0.0696, while the EMA 50 stands just above at $0.0704, signaling a tight structural compression. The Relative Strength Index sits neutrally at 48.7, reflecting a balanced momentum state devoid of overbought or oversold extremes. Meanwhile, the MACD histogram prints a fractional positive reading of +0.0001 with converging lines, highlighting indecision in current trend direction.
🎯 3. Key Technical Levels to Watch
• 🟢 Resistance Zone: $0.0724 serves as the primary technical ceiling for short-term retracement attempts.
• 🔴 Support Zone: $0.0676 provides the immediate floor acting as a historical defensive barrier.
• 🛡️ Pivot Confluence: The $0.0696 EMA 20 level functions as the critical pivot for intraday direction.
💡 4. Technical Takeaway & Risk Management
Current indicators suggest a phase of low-conviction consolidation. Traders are monitoring whether volume expands above the moving averages or if price action retests local support floors. Prudent risk management involves tracking price reactions at key zones rather than anticipating breakouts.
💬 5. Community Discussion
What is your technical outlook for $DOGE this week? Are you accumulating near support or waiting for volume confirmation? Drop your thoughts below! 👇
⚠️ 6. Disclaimer
Educational technical analysis only. Not financial advice (NFA). Crypto markets involve risk. Always DYOR.
$DOGE #DOGE #BinanceSquare
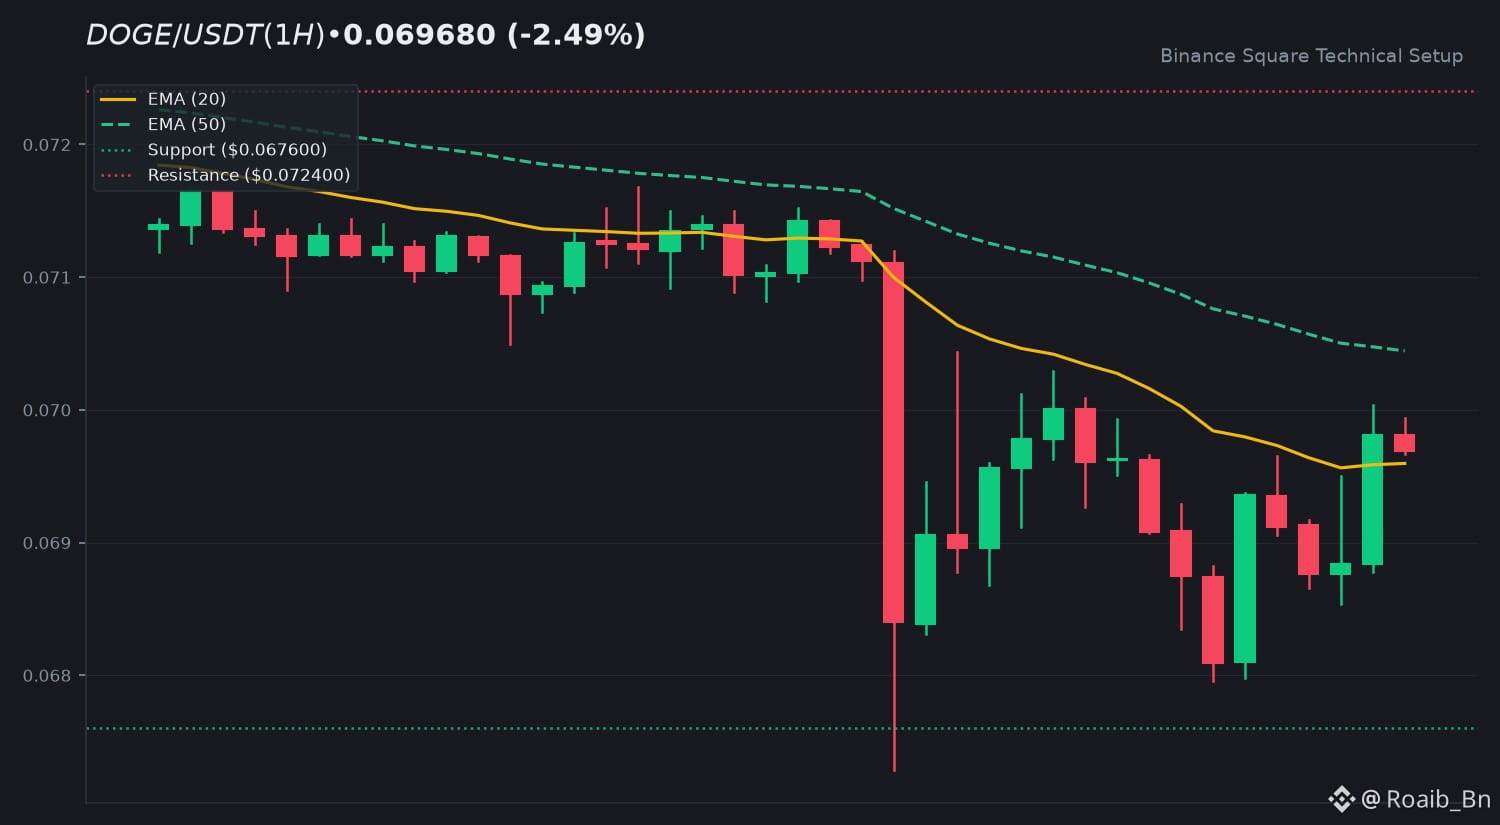
74
·
--
See translation
🔥 $PEPE Technical Update: Key Levels & Momentum Breakdown
📊 1. Market Snapshot
$PEPE is trading at $0.0000, registering a mild 24-hour gain of +0.80%. Daily trading volume remains subdued at $73.18 million USDT, pointing toward ongoing range-bound behavior and limited market participation during this consolidation phase.
📈 2. Technical Momentum & Indicator Bias
Technical Momentum & Market Bias shows a neutral-to-cautious stance. The RSI (14) prints precisely at 50.95, indicating complete equilibrium between buying and selling pressure. Meanwhile, the MACD histogram registers near flat at -0.0000, signaling a lack of directional impulse. Price action continues to test the EMA 20 and EMA 50 zones, acting as immediate reference points for trend continuity or further sideways rotation.
🎯 3. Key Technical Levels to Watch
• 🟢 Resistance Zone: The primary overhead ceiling sits near $0.0000, where previous selling interest has historically capped upward momentum.
• 🔴 Support Zone: Immediate support floor is established at $0.0000, with a secondary cushion resting deeper down.
• 🛡️ Pivot Confluence: The moving average cluster acts as the critical inflection zone determining short-term directional bias.
💡 4. Technical Takeaway & Risk Management
Prudent traders are monitoring volume expansion before committing to directional entries. Given the low volume ratio, breakout confirmations require heavy participation rather than low-liquidity wicks. Risk management protocols remain essential around these tight technical boundaries.
💬 5. Community Discussion
What is your technical outlook for $PEPE this week? Are you accumulating near support or waiting for volume confirmation? Drop your thoughts below! 👇
⚠️ 6. Disclaimer
Educational technical analysis only. Not financial advice (NFA). Crypto markets involve risk. Always DYOR.
$PEPE #PEPE #BinanceSquare
🔥 $PEPE Technical Update: Key Levels & Momentum Breakdown
📊 1. Market Snapshot
$PEPE is trading at $0.0000, registering a mild 24-hour gain of +0.80%. Daily trading volume remains subdued at $73.18 million USDT, pointing toward ongoing range-bound behavior and limited market participation during this consolidation phase.
📈 2. Technical Momentum & Indicator Bias
Technical Momentum & Market Bias shows a neutral-to-cautious stance. The RSI (14) prints precisely at 50.95, indicating complete equilibrium between buying and selling pressure. Meanwhile, the MACD histogram registers near flat at -0.0000, signaling a lack of directional impulse. Price action continues to test the EMA 20 and EMA 50 zones, acting as immediate reference points for trend continuity or further sideways rotation.
🎯 3. Key Technical Levels to Watch
• 🟢 Resistance Zone: The primary overhead ceiling sits near $0.0000, where previous selling interest has historically capped upward momentum.
• 🔴 Support Zone: Immediate support floor is established at $0.0000, with a secondary cushion resting deeper down.
• 🛡️ Pivot Confluence: The moving average cluster acts as the critical inflection zone determining short-term directional bias.
💡 4. Technical Takeaway & Risk Management
Prudent traders are monitoring volume expansion before committing to directional entries. Given the low volume ratio, breakout confirmations require heavy participation rather than low-liquidity wicks. Risk management protocols remain essential around these tight technical boundaries.
💬 5. Community Discussion
What is your technical outlook for $PEPE this week? Are you accumulating near support or waiting for volume confirmation? Drop your thoughts below! 👇
⚠️ 6. Disclaimer
Educational technical analysis only. Not financial advice (NFA). Crypto markets involve risk. Always DYOR.
$PEPE #PEPE #BinanceSquare
📊 1. Market Snapshot
$PEPE is trading at $0.0000, registering a mild 24-hour gain of +0.80%. Daily trading volume remains subdued at $73.18 million USDT, pointing toward ongoing range-bound behavior and limited market participation during this consolidation phase.
📈 2. Technical Momentum & Indicator Bias
Technical Momentum & Market Bias shows a neutral-to-cautious stance. The RSI (14) prints precisely at 50.95, indicating complete equilibrium between buying and selling pressure. Meanwhile, the MACD histogram registers near flat at -0.0000, signaling a lack of directional impulse. Price action continues to test the EMA 20 and EMA 50 zones, acting as immediate reference points for trend continuity or further sideways rotation.
🎯 3. Key Technical Levels to Watch
• 🟢 Resistance Zone: The primary overhead ceiling sits near $0.0000, where previous selling interest has historically capped upward momentum.
• 🔴 Support Zone: Immediate support floor is established at $0.0000, with a secondary cushion resting deeper down.
• 🛡️ Pivot Confluence: The moving average cluster acts as the critical inflection zone determining short-term directional bias.
💡 4. Technical Takeaway & Risk Management
Prudent traders are monitoring volume expansion before committing to directional entries. Given the low volume ratio, breakout confirmations require heavy participation rather than low-liquidity wicks. Risk management protocols remain essential around these tight technical boundaries.
💬 5. Community Discussion
What is your technical outlook for $PEPE this week? Are you accumulating near support or waiting for volume confirmation? Drop your thoughts below! 👇
⚠️ 6. Disclaimer
Educational technical analysis only. Not financial advice (NFA). Crypto markets involve risk. Always DYOR.
$PEPE #PEPE #BinanceSquare
38
Log in to explore more content
Join global crypto users on Binance Square
⚡️ Get latest and useful information about crypto.
💬 Trusted by the world’s largest crypto exchange.
👍 Discover real insights from verified creators.
Email / Phone number
Trending Topics
CPITestsDecemberRateOutlook
773,417 views
3,853 Discussing
October CPI Seen Up 0.3%, Keeping Fed on Course for December Rate Increase
Binance News
·9 Likes
·12.3k views
AnthropicRejectsIPODelayValuationinQuestion
95,435 views
879 Discussing
NvidiaInvestigatesAfterHuang’sAffairApology
327,003 views
2,415 Discussing