
MistralAK
326 Posts

MistralAK
Report
Block User
MistralAK - Systematic Market Insights. Technical trade setups, liquidity zones and macro shifts. Focus: High-probability L1 and Major token targets
Open Trade
Frequent Trader
6.5 Years
154 Following
47 Followers
126 Liked
Posts
Portfolio
All
Quotes
Videos
Live
PINNED
·
--

Article
See translation
Senate Sets Jan 4 Deadline for Binance, Tether, and Trump-Linked Crypto Firms - Stable Coins at Risk#CryptoRegulation
Washington’s regulatory pressure cooker just turned up the heat.
U.S. Senator Richard Blumenthal has formally drawn a hard line in the sand, issuing a strict ultimatum to four of the most influential names in the digital asset space: produce requested records or face the full enforcement weight of the Senate.
With deadlines ticking down to November 30, 2026, for initial document rolling, and a final compliance cutoff of January 4, 2027, the crypto market is staring down a high-stakes political showdown.
🎯 Who’s in the Crosshairs?
The letters targeted four specific entities, each facing unique lines of congressional inquiry:
Binance ($BNB ): Facing extended scrutiny over compliance history and allegations concerning transactions tied to Iranian entities.Tether ($USDT ): Under the microscope regarding stablecoin activity linked to Iran’s shadow banking networks and advisory relationships.World Liberty Financial: Investigated over business operations, potential conflicts of interest, and political affiliations.Fight Fight Fight LLC: The corporate entity behind the $TRUMP memecoin, tied directly to political finance inquiries.
⚡ Why January 4, 2027, Changes the Game
If you are wondering why these specific dates matter, look at the political calendar.
The January 4 deadline lands squarely when leadership dynamics shift in the Senate, with Blumenthal positioned to take over as chair of the Senate Permanent Subcommittee on Investigations (PSI).
The Subpoena Power Factor: As committee chair, Blumenthal would wield direct subpoena authority.The Alternative Measures Threat: The current letters are voluntary requests for information, but lawmakers have warned that failure to comply by January will force the subcommittee to pursue compulsory enforcement actions.
⚠️ Fact Check: Investigation vs. Indictment
In the rush for sensationalized crypto headlines, it is vital to separate noise from reality:
No Subpoenas Issued Yet: These letters are ongoing inquiries and requests for information.Zero Charges Filed: No regulatory body, court, or criminal prosecutor has filed formal charges or established legal wrongdoing against these firms regarding these specific requests.Industry Pushback: Major targeted firms have previously defended their compliance frameworks, noting robust cooperation with law enforcement and active asset freezes to combat illicit finance.
📊 The Market Takeaway for Traders
Crypto markets hate uncertainty, and regulatory headwinds always introduce short-term volatility. While immediate price action for BNB and broader risk assets remains driven by macro liquidity and options expiries, headline risks out of Washington can trigger sudden sentiment shifts.
Smart traders aren't panicking—they are monitoring compliance updates, tracking institutional wallet movements, and watching how liquidity reacts as the January 4 deadline approaches.
💬 Join the Discussion: Do you think these Senate inquiries will introduce lasting regulatory pressure on $BNB and stablecoin liquidity, or is this just standard political theater ahead of a leadership shift?
Drop your take in the comments below! 👇
Sources: U.S. Senate Committee Releases, Cointelegraph, Benzinga, Cointribune.
Not financial advice. Always DYOR.
Like My Work Consider Tipping.
Like & Follow for Daily Trade Analytics & Insider News. @MistralAK
#Tether #SenateInvestigation #StablecoinSafety #TRUMP
Senate Sets Jan 4 Deadline for Binance, Tether, and Trump-Linked Crypto Firms - Stable Coins at Risk
#CryptoRegulation
Washington’s regulatory pressure cooker just turned up the heat.
U.S. Senator Richard Blumenthal has formally drawn a hard line in the sand, issuing a strict ultimatum to four of the most influential names in the digital asset space: produce requested records or face the full enforcement weight of the Senate.
With deadlines ticking down to November 30, 2026, for initial document rolling, and a final compliance cutoff of January 4, 2027, the crypto market is staring down a high-stakes political showdown.
🎯 Who’s in the Crosshairs?
The letters targeted four specific entities, each facing unique lines of congressional inquiry:
Binance ($BNB ): Facing extended scrutiny over compliance history and allegations concerning transactions tied to Iranian entities.Tether ($USDT ): Under the microscope regarding stablecoin activity linked to Iran’s shadow banking networks and advisory relationships.World Liberty Financial: Investigated over business operations, potential conflicts of interest, and political affiliations.Fight Fight Fight LLC: The corporate entity behind the $TRUMP memecoin, tied directly to political finance inquiries.
⚡ Why January 4, 2027, Changes the Game
If you are wondering why these specific dates matter, look at the political calendar.
The January 4 deadline lands squarely when leadership dynamics shift in the Senate, with Blumenthal positioned to take over as chair of the Senate Permanent Subcommittee on Investigations (PSI).
The Subpoena Power Factor: As committee chair, Blumenthal would wield direct subpoena authority.The Alternative Measures Threat: The current letters are voluntary requests for information, but lawmakers have warned that failure to comply by January will force the subcommittee to pursue compulsory enforcement actions.
⚠️ Fact Check: Investigation vs. Indictment
In the rush for sensationalized crypto headlines, it is vital to separate noise from reality:
No Subpoenas Issued Yet: These letters are ongoing inquiries and requests for information.Zero Charges Filed: No regulatory body, court, or criminal prosecutor has filed formal charges or established legal wrongdoing against these firms regarding these specific requests.Industry Pushback: Major targeted firms have previously defended their compliance frameworks, noting robust cooperation with law enforcement and active asset freezes to combat illicit finance.
📊 The Market Takeaway for Traders
Crypto markets hate uncertainty, and regulatory headwinds always introduce short-term volatility. While immediate price action for BNB and broader risk assets remains driven by macro liquidity and options expiries, headline risks out of Washington can trigger sudden sentiment shifts.
Smart traders aren't panicking—they are monitoring compliance updates, tracking institutional wallet movements, and watching how liquidity reacts as the January 4 deadline approaches.
💬 Join the Discussion: Do you think these Senate inquiries will introduce lasting regulatory pressure on $BNB and stablecoin liquidity, or is this just standard political theater ahead of a leadership shift?
Drop your take in the comments below! 👇
Sources: U.S. Senate Committee Releases, Cointelegraph, Benzinga, Cointribune.
Not financial advice. Always DYOR.
Like My Work Consider Tipping.
Like & Follow for Daily Trade Analytics & Insider News. @MistralAK
#Tether #SenateInvestigation #StablecoinSafety #TRUMP
Washington’s regulatory pressure cooker just turned up the heat.
U.S. Senator Richard Blumenthal has formally drawn a hard line in the sand, issuing a strict ultimatum to four of the most influential names in the digital asset space: produce requested records or face the full enforcement weight of the Senate.
With deadlines ticking down to November 30, 2026, for initial document rolling, and a final compliance cutoff of January 4, 2027, the crypto market is staring down a high-stakes political showdown.
🎯 Who’s in the Crosshairs?
The letters targeted four specific entities, each facing unique lines of congressional inquiry:
Binance ($BNB ): Facing extended scrutiny over compliance history and allegations concerning transactions tied to Iranian entities.Tether ($USDT ): Under the microscope regarding stablecoin activity linked to Iran’s shadow banking networks and advisory relationships.World Liberty Financial: Investigated over business operations, potential conflicts of interest, and political affiliations.Fight Fight Fight LLC: The corporate entity behind the $TRUMP memecoin, tied directly to political finance inquiries.
⚡ Why January 4, 2027, Changes the Game
If you are wondering why these specific dates matter, look at the political calendar.
The January 4 deadline lands squarely when leadership dynamics shift in the Senate, with Blumenthal positioned to take over as chair of the Senate Permanent Subcommittee on Investigations (PSI).
The Subpoena Power Factor: As committee chair, Blumenthal would wield direct subpoena authority.The Alternative Measures Threat: The current letters are voluntary requests for information, but lawmakers have warned that failure to comply by January will force the subcommittee to pursue compulsory enforcement actions.
⚠️ Fact Check: Investigation vs. Indictment
In the rush for sensationalized crypto headlines, it is vital to separate noise from reality:
No Subpoenas Issued Yet: These letters are ongoing inquiries and requests for information.Zero Charges Filed: No regulatory body, court, or criminal prosecutor has filed formal charges or established legal wrongdoing against these firms regarding these specific requests.Industry Pushback: Major targeted firms have previously defended their compliance frameworks, noting robust cooperation with law enforcement and active asset freezes to combat illicit finance.
📊 The Market Takeaway for Traders
Crypto markets hate uncertainty, and regulatory headwinds always introduce short-term volatility. While immediate price action for BNB and broader risk assets remains driven by macro liquidity and options expiries, headline risks out of Washington can trigger sudden sentiment shifts.
Smart traders aren't panicking—they are monitoring compliance updates, tracking institutional wallet movements, and watching how liquidity reacts as the January 4 deadline approaches.
💬 Join the Discussion: Do you think these Senate inquiries will introduce lasting regulatory pressure on $BNB and stablecoin liquidity, or is this just standard political theater ahead of a leadership shift?
Drop your take in the comments below! 👇
Sources: U.S. Senate Committee Releases, Cointelegraph, Benzinga, Cointribune.
Not financial advice. Always DYOR.
Like My Work Consider Tipping.
Like & Follow for Daily Trade Analytics & Insider News. @MistralAK
#Tether #SenateInvestigation #StablecoinSafety #TRUMP
2
306
·
--
See translation
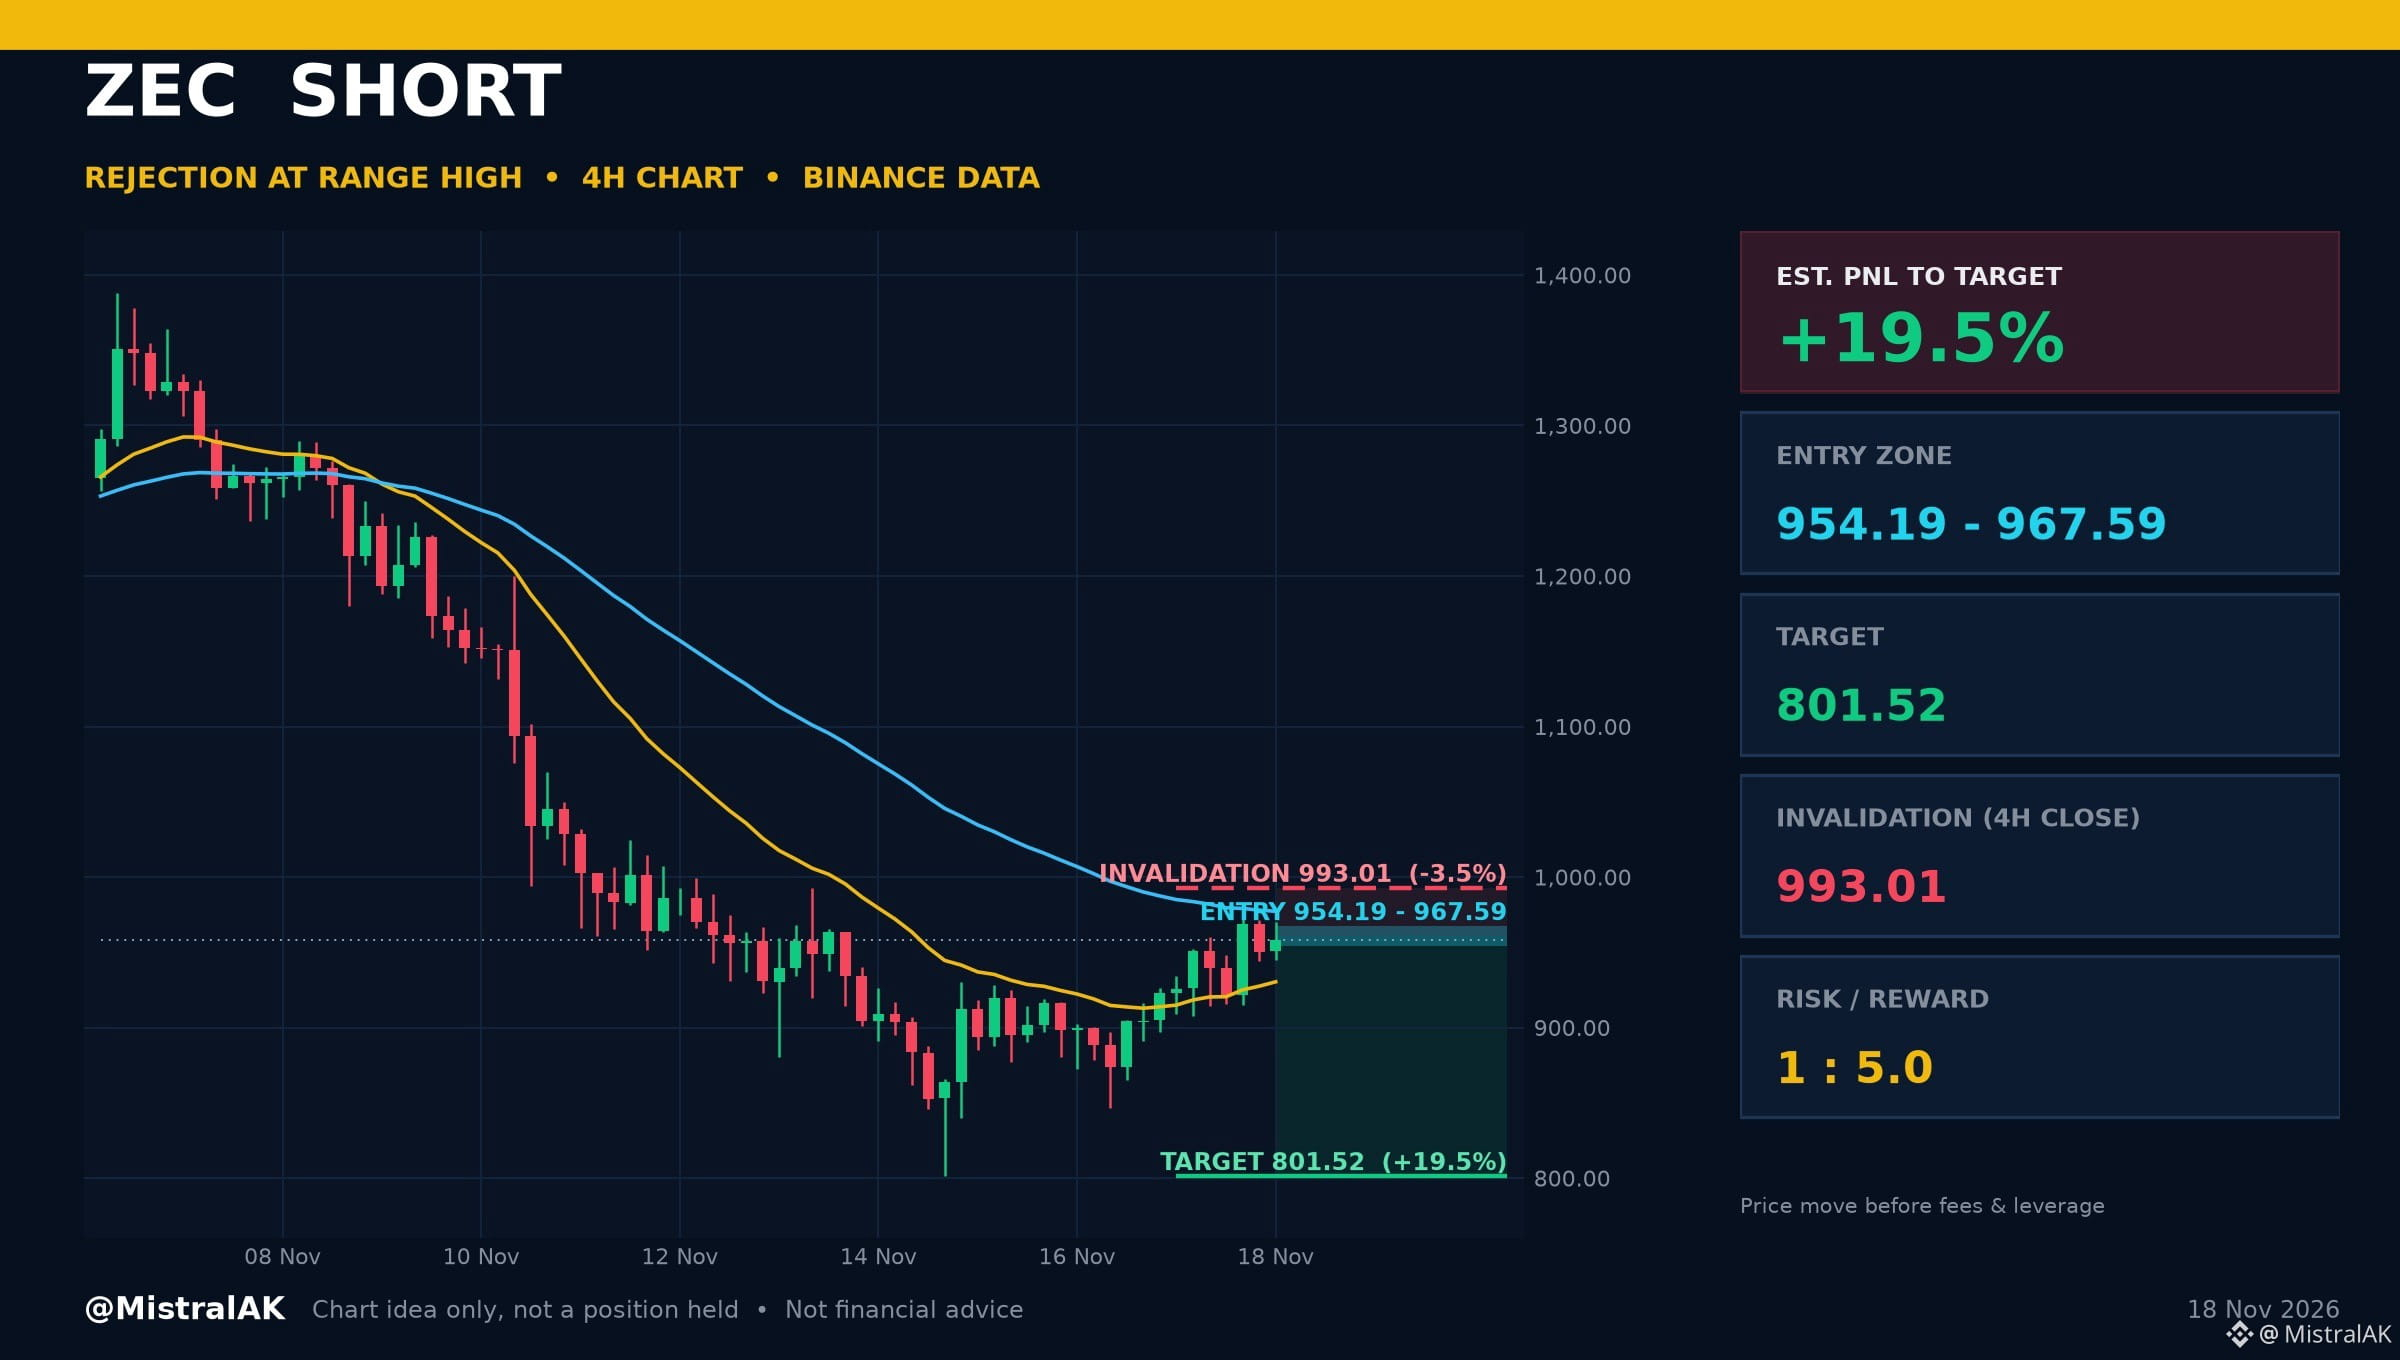
$ZEC Short Idea: Rejection At Range High | Est. PNL +19.5%
What the 4H chart shows: price is testing the 20-candle swing high. Momentum check: 4H RSI 54.8 (neutral).
Where it gets interesting
▪️ Entry zone: 954.19 - 967.59 USD
▪️ Target: 801.52 USD (range low)
▪️ Invalidation: 4H close above 993.01 USD
▪️ Risk/Reward: 1 : 5.0
Est. PNL to target: +19.5% | to invalidation: -3.5% (price move from 958.02 USD, before fees and leverage)
A 4H close above 993.01 USD cancels the idea. Chart idea only, not a position I hold.
Would you take this one, wait for more, or stay out? Tell us why below.
Not financial advice. Always DYOR.
Like & Follow for Daily Trade Analytics & Insider News. @MistralAK
#ZEC #Breakout #TechnicalAnalysis
$ZEC Short Idea: Rejection At Range High | Est. PNL +19.5%
What the 4H chart shows: price is testing the 20-candle swing high. Momentum check: 4H RSI 54.8 (neutral).
Where it gets interesting
▪️ Entry zone: 954.19 - 967.59 USD
▪️ Target: 801.52 USD (range low)
▪️ Invalidation: 4H close above 993.01 USD
▪️ Risk/Reward: 1 : 5.0
Est. PNL to target: +19.5% | to invalidation: -3.5% (price move from 958.02 USD, before fees and leverage)
A 4H close above 993.01 USD cancels the idea. Chart idea only, not a position I hold.
Would you take this one, wait for more, or stay out? Tell us why below.
Not financial advice. Always DYOR.
Like & Follow for Daily Trade Analytics & Insider News. @MistralAK
#ZEC #Breakout #TechnicalAnalysis
What the 4H chart shows: price is testing the 20-candle swing high. Momentum check: 4H RSI 54.8 (neutral).
Where it gets interesting
▪️ Entry zone: 954.19 - 967.59 USD
▪️ Target: 801.52 USD (range low)
▪️ Invalidation: 4H close above 993.01 USD
▪️ Risk/Reward: 1 : 5.0
Est. PNL to target: +19.5% | to invalidation: -3.5% (price move from 958.02 USD, before fees and leverage)
A 4H close above 993.01 USD cancels the idea. Chart idea only, not a position I hold.
Would you take this one, wait for more, or stay out? Tell us why below.
Not financial advice. Always DYOR.
Like & Follow for Daily Trade Analytics & Insider News. @MistralAK
#ZEC #Breakout #TechnicalAnalysis
175
·
--
See translation
$BREV Four Hour RSI Enters Overbought Territory After Upward Move
$BREV Giving Away You Black Friday Profit - Enter Trade Now
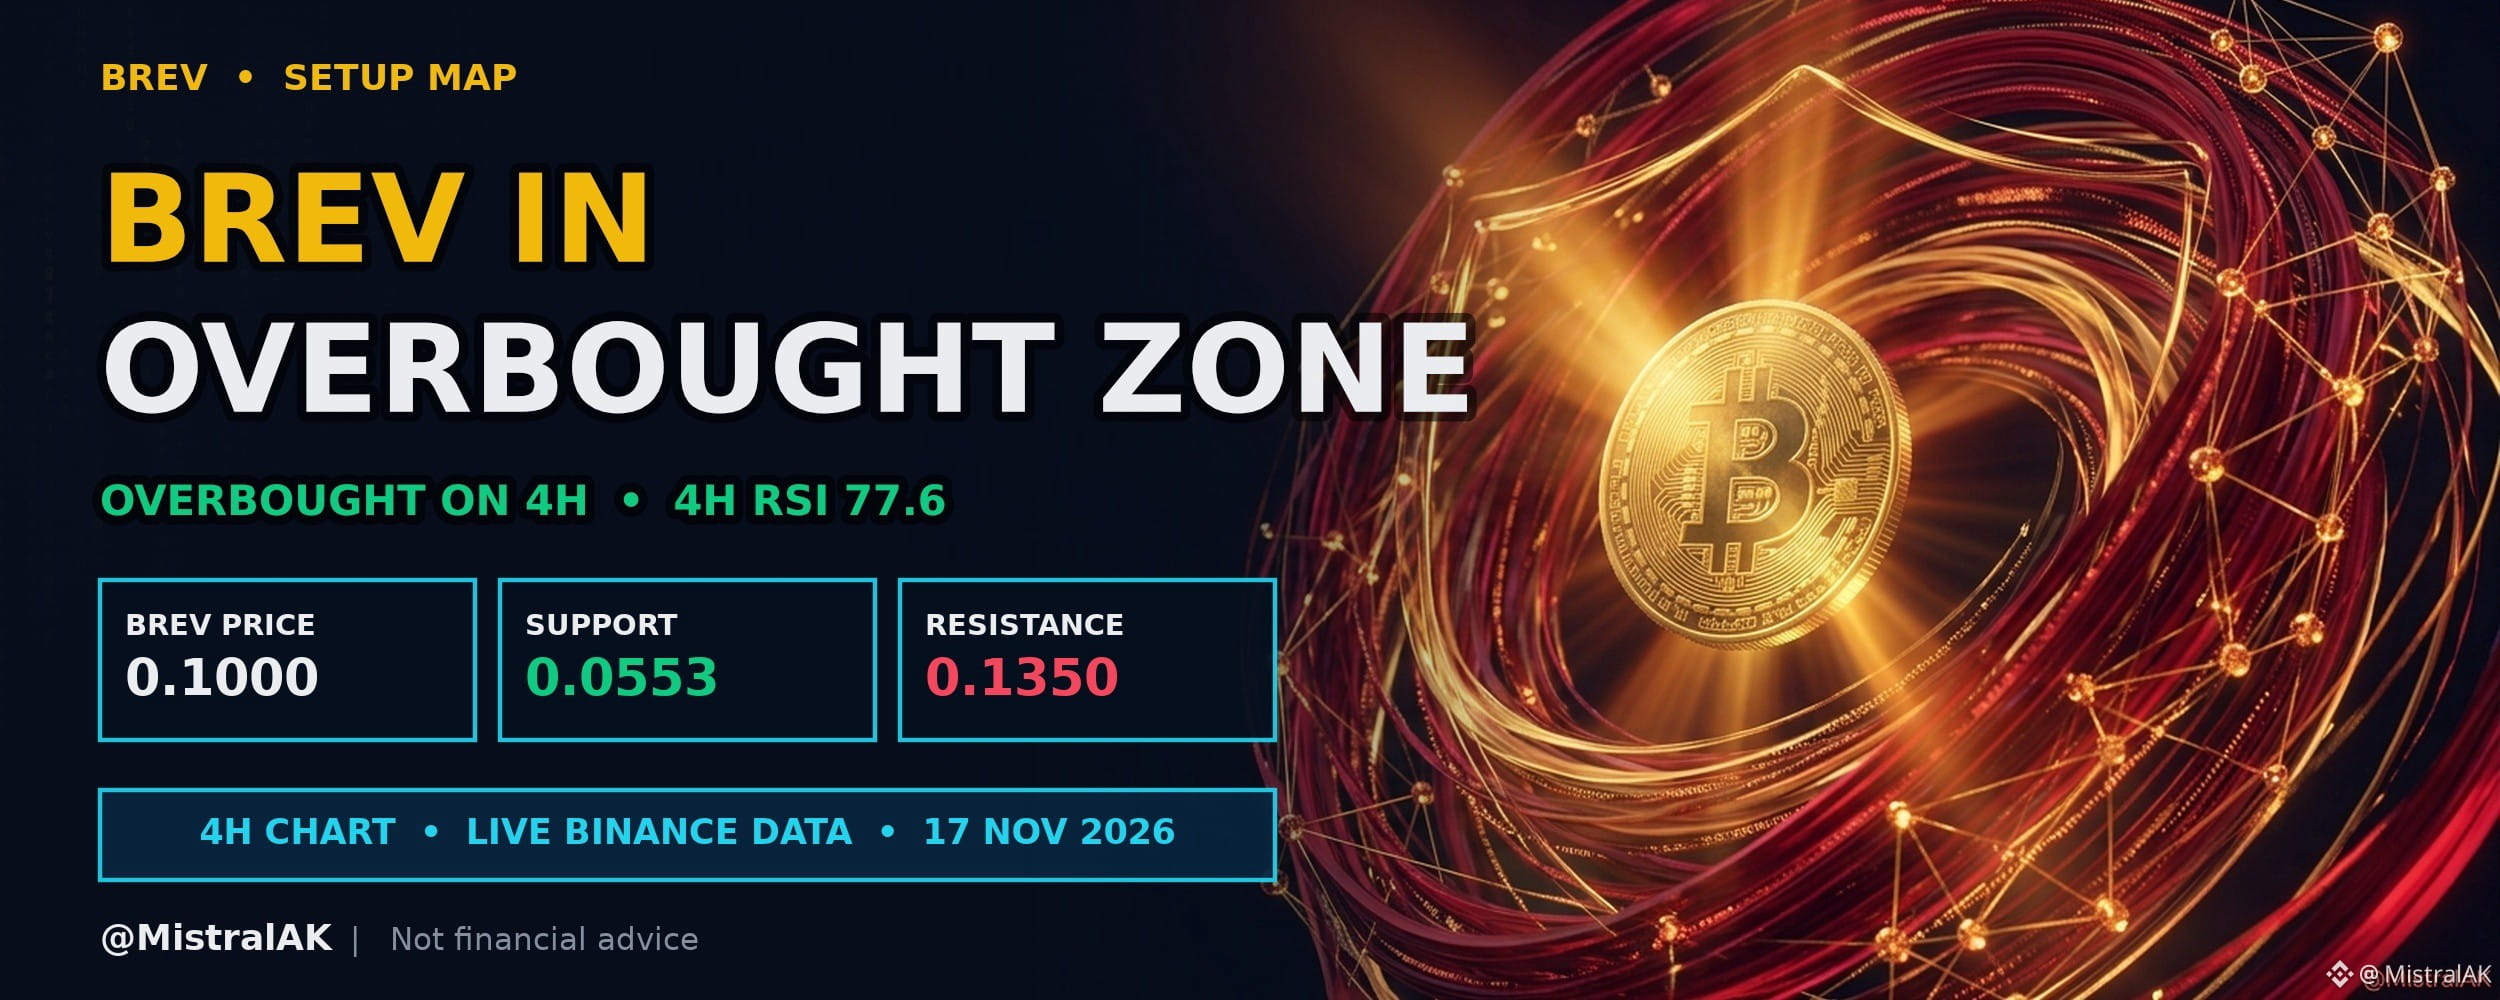
$BREV trades at 0.1000 USD, up 75.7% over the past 24 hours, with 4H RSI at 77.6 (overbought).
The price has moved upward over the past twenty-four hours, pushing the four-hour RSI into overbought territory. Momentum remains firm, though an elevated reading often leads traders to watch for potential consolidation.
KEY LEVELS
▪️ Resistance: 0.1350 USD (20-candle 4H swing high)
▪️ Support: 0.0553 USD (20-candle 4H swing low)
▪️ EMA 20 / EMA 50: 0.0676 / 0.0667 USD (short-term trend filter)
WHAT WOULD CONFIRM CONTINUATION
▪️ RSI holding in the upper zone while price keeps printing higher 4H closes
▪️ Pullbacks holding above EMA 20 (0.0676 USD)
WHAT WOULD SIGNAL COOLING
▪️ A 4H close below EMA 20 (0.0676 USD)
▪️ RSI rolling over while price stalls below 0.1350 USD
Do you expect upward momentum to continue, or will the overbought four-hour RSI lead to consolidation?
Not financial advice. Always DYOR.
Like & Follow for Daily Trade Analytics & Insider News. @MistralAK
#BREV #Overbought #TradingSignals
{spot}(BREVUSDT)
$BREV Four Hour RSI Enters Overbought Territory After Upward Move
$BREV Giving Away You Black Friday Profit - Enter Trade Now
$BREV trades at 0.1000 USD, up 75.7% over the past 24 hours, with 4H RSI at 77.6 (overbought).
The price has moved upward over the past twenty-four hours, pushing the four-hour RSI into overbought territory. Momentum remains firm, though an elevated reading often leads traders to watch for potential consolidation.
KEY LEVELS
▪️ Resistance: 0.1350 USD (20-candle 4H swing high)
▪️ Support: 0.0553 USD (20-candle 4H swing low)
▪️ EMA 20 / EMA 50: 0.0676 / 0.0667 USD (short-term trend filter)
WHAT WOULD CONFIRM CONTINUATION
▪️ RSI holding in the upper zone while price keeps printing higher 4H closes
▪️ Pullbacks holding above EMA 20 (0.0676 USD)
WHAT WOULD SIGNAL COOLING
▪️ A 4H close below EMA 20 (0.0676 USD)
▪️ RSI rolling over while price stalls below 0.1350 USD
Do you expect upward momentum to continue, or will the overbought four-hour RSI lead to consolidation?
Not financial advice. Always DYOR.
Like & Follow for Daily Trade Analytics & Insider News. @MistralAK
#BREV #Overbought #TradingSignals
$BREV Giving Away You Black Friday Profit - Enter Trade Now
$BREV trades at 0.1000 USD, up 75.7% over the past 24 hours, with 4H RSI at 77.6 (overbought).
The price has moved upward over the past twenty-four hours, pushing the four-hour RSI into overbought territory. Momentum remains firm, though an elevated reading often leads traders to watch for potential consolidation.
KEY LEVELS
▪️ Resistance: 0.1350 USD (20-candle 4H swing high)
▪️ Support: 0.0553 USD (20-candle 4H swing low)
▪️ EMA 20 / EMA 50: 0.0676 / 0.0667 USD (short-term trend filter)
WHAT WOULD CONFIRM CONTINUATION
▪️ RSI holding in the upper zone while price keeps printing higher 4H closes
▪️ Pullbacks holding above EMA 20 (0.0676 USD)
WHAT WOULD SIGNAL COOLING
▪️ A 4H close below EMA 20 (0.0676 USD)
▪️ RSI rolling over while price stalls below 0.1350 USD
Do you expect upward momentum to continue, or will the overbought four-hour RSI lead to consolidation?
Not financial advice. Always DYOR.
Like & Follow for Daily Trade Analytics & Insider News. @MistralAK
#BREV #Overbought #TradingSignals
223
·
--
Verified
See translation
$SOL Foundation Acquires Majority Stake in Crypto Data Firm CoinGecko
WHAT HAPPENED
▪️ The Solana Foundation has acquired a majority interest in data platform CoinGecko, according to its product chief.
▪️ CoinGecko is currently exploring the integration of new trading features.
WHY IT MATTERS FOR TRADERS
Integrations between data platforms and trading features can influence user workflows and DEX volume routing. Market participants typically monitor structural shifts in ecosystem analytics for potential changes in liquidity patterns.
MARKET SNAPSHOT
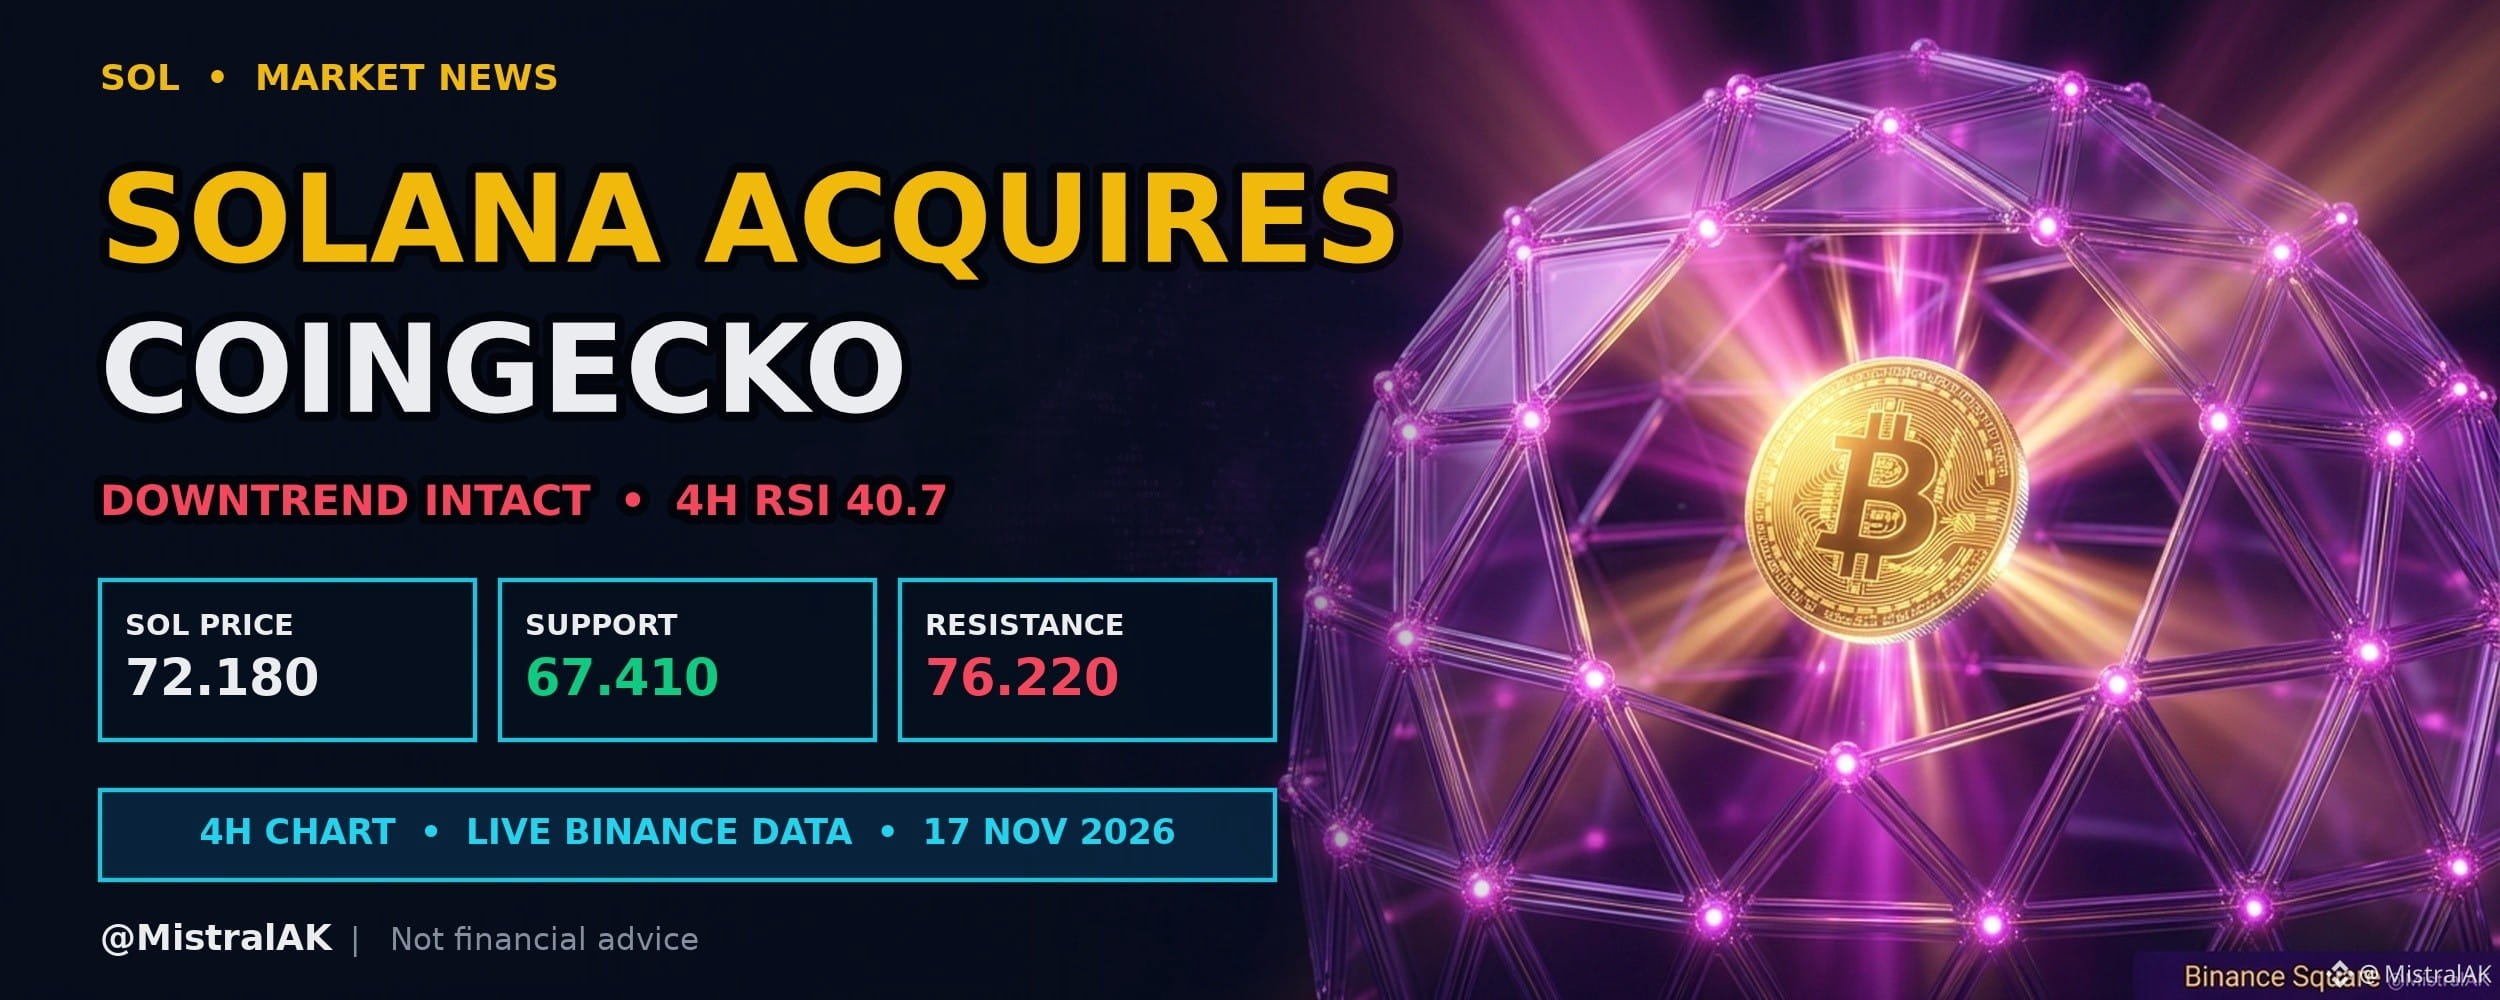
▪️ $SOL: 72.180 USD, up 1.5% (24h), 4H RSI 40.7
▪️ Range to watch: 67.410 support / 76.220 resistance
How might data platform trading features influence liquidity distribution across decentralized exchanges?
Source: Cointelegraph
Not financial advice. Always DYOR.
Like & Follow for Daily Trade Analytics & Insider News. @MistralAK
#sol #TrendingTopic #HotTrends #BlackFriday2026
{spot}(SOLUSDT)
$SOL Foundation Acquires Majority Stake in Crypto Data Firm CoinGecko
WHAT HAPPENED
▪️ The Solana Foundation has acquired a majority interest in data platform CoinGecko, according to its product chief.
▪️ CoinGecko is currently exploring the integration of new trading features.
WHY IT MATTERS FOR TRADERS
Integrations between data platforms and trading features can influence user workflows and DEX volume routing. Market participants typically monitor structural shifts in ecosystem analytics for potential changes in liquidity patterns.
MARKET SNAPSHOT
▪️ $SOL : 72.180 USD, up 1.5% (24h), 4H RSI 40.7
▪️ Range to watch: 67.410 support / 76.220 resistance
How might data platform trading features influence liquidity distribution across decentralized exchanges?
Source: Cointelegraph
Not financial advice. Always DYOR.
Like & Follow for Daily Trade Analytics & Insider News. @MistralAK
#sol #TrendingTopic #HotTrends #BlackFriday2026
WHAT HAPPENED
▪️ The Solana Foundation has acquired a majority interest in data platform CoinGecko, according to its product chief.
▪️ CoinGecko is currently exploring the integration of new trading features.
WHY IT MATTERS FOR TRADERS
Integrations between data platforms and trading features can influence user workflows and DEX volume routing. Market participants typically monitor structural shifts in ecosystem analytics for potential changes in liquidity patterns.
MARKET SNAPSHOT
▪️ $SOL : 72.180 USD, up 1.5% (24h), 4H RSI 40.7
▪️ Range to watch: 67.410 support / 76.220 resistance
How might data platform trading features influence liquidity distribution across decentralized exchanges?
Source: Cointelegraph
Not financial advice. Always DYOR.
Like & Follow for Daily Trade Analytics & Insider News. @MistralAK
#sol #TrendingTopic #HotTrends #BlackFriday2026
4
·
--
See translation
$UNI Price Holds Below Two Moving Averages
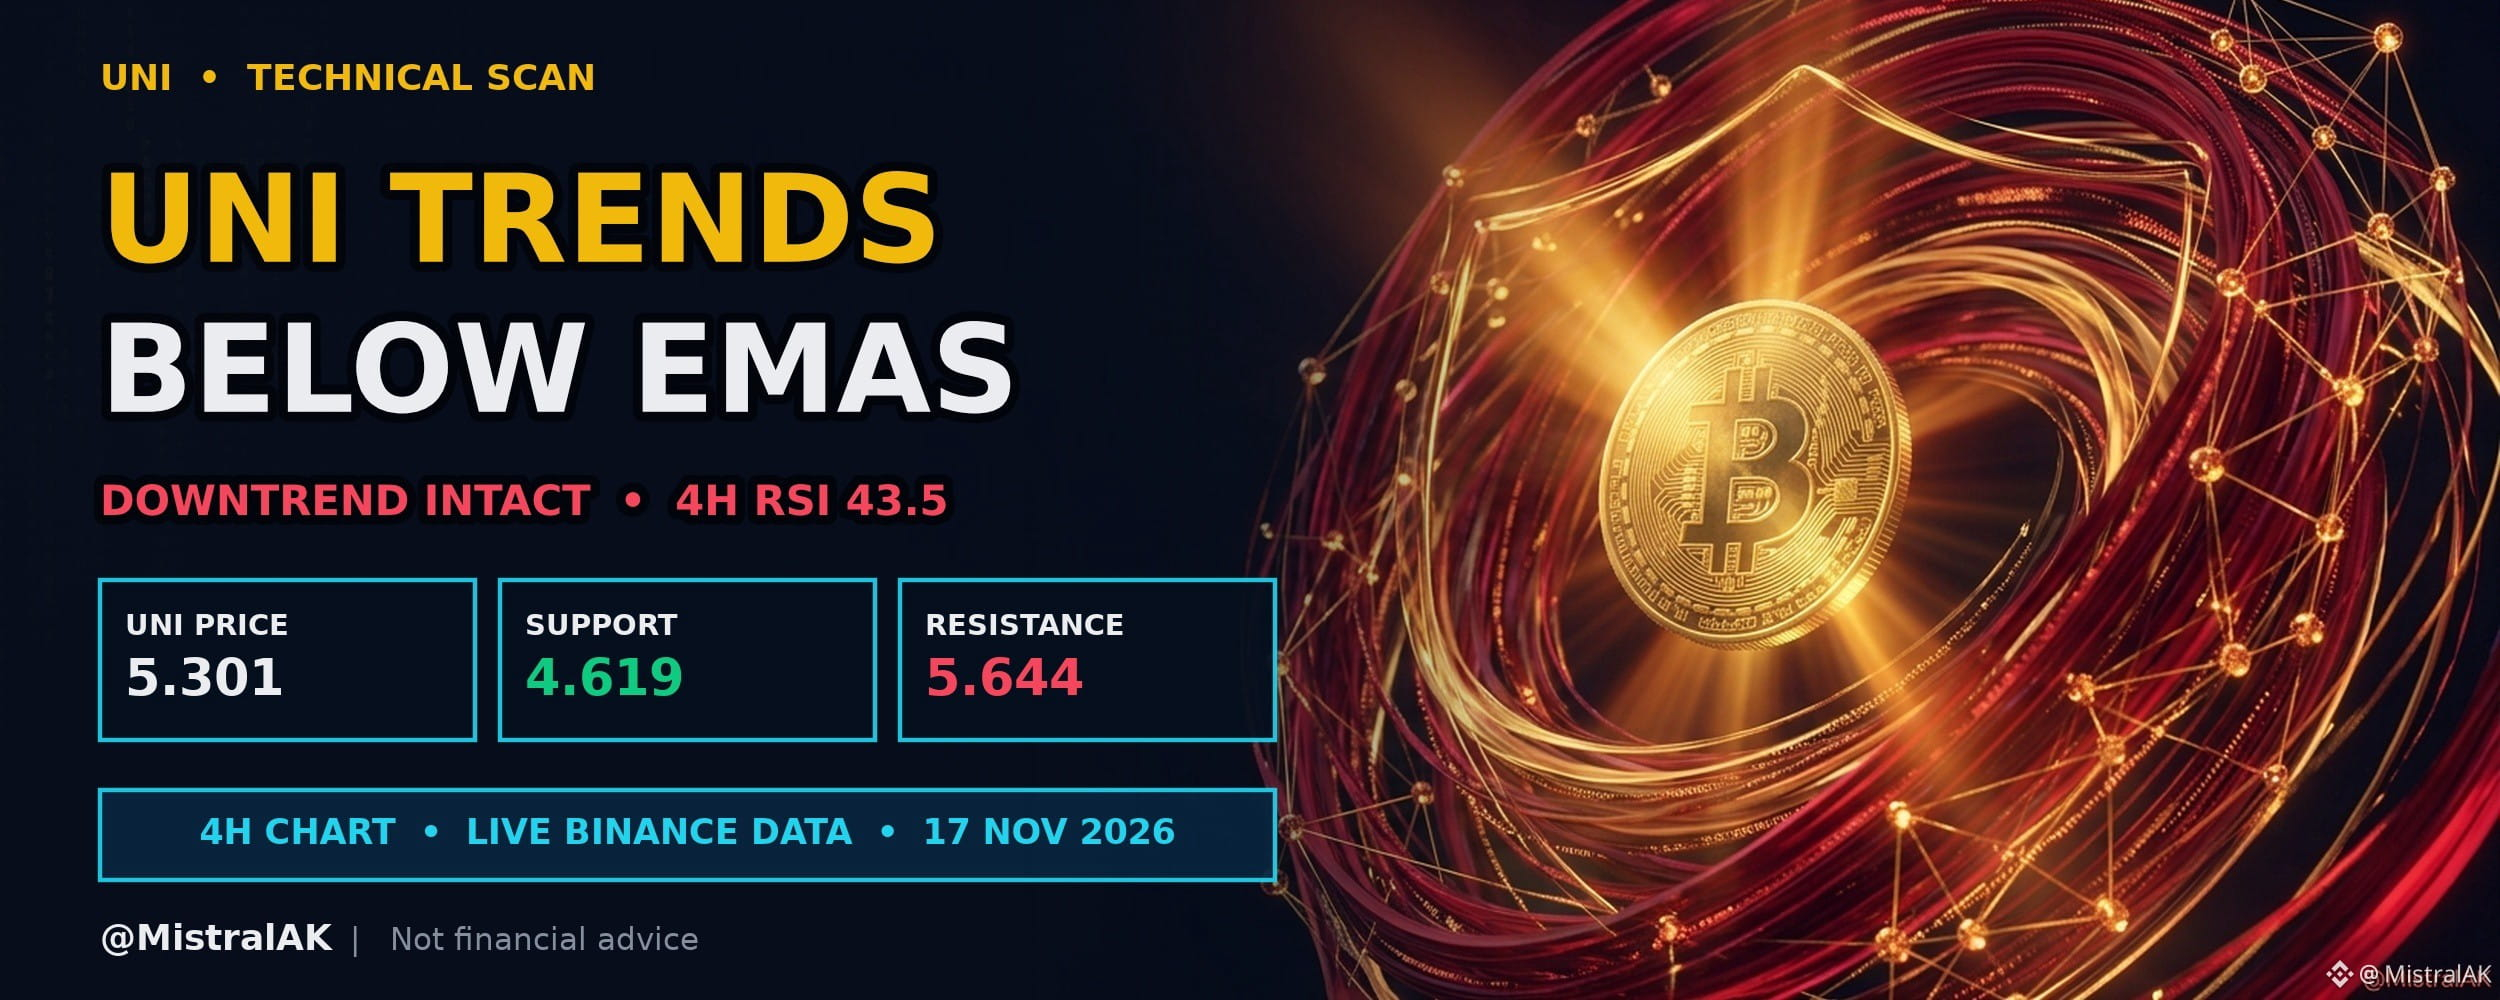
$UNI trades at 5.301 USD, up 3.4% over the past 24 hours, with 4H RSI at 43.5 (neutral).
The market is trading beneath the short-term exponential average, which itself sits under the longer average, indicating a bearish bias on the four-hour chart. Yet the upward move in the past day shows buying pressure that could challenge the nearest support.
TECHNICAL READ
▪️ Momentum: 4H RSI 43.5 sits in the neutral zone
▪️ Trend filter: EMA 20 is below EMA 50, and price is below EMA 20
▪️ Range: price is 6.5% below the range high and 14.8% above the range low
WHAT WOULD CONFIRM WEAKNESS
▪️ Rallies rejected near EMA 20 (5.318 USD)
▪️ A 4H close below 4.619 USD
WHAT WOULD INVALIDATE IT
▪️ A 4H close above EMA 50 (5.754 USD)
▪️ A move through 5.644 USD would break the lower-high structure
Do you think the price will break back above the short-term average soon?
Not financial advice. Always DYOR.
Like & Follow for Daily Trade Analytics & Insider News. @MistralAK
#UNI #HotTrends #TechnicalAnalysis
{spot}(UNIUSDT)
$UNI Price Holds Below Two Moving Averages
$UNI trades at 5.301 USD, up 3.4% over the past 24 hours, with 4H RSI at 43.5 (neutral).
The market is trading beneath the short-term exponential average, which itself sits under the longer average, indicating a bearish bias on the four-hour chart. Yet the upward move in the past day shows buying pressure that could challenge the nearest support.
TECHNICAL READ
▪️ Momentum: 4H RSI 43.5 sits in the neutral zone
▪️ Trend filter: EMA 20 is below EMA 50, and price is below EMA 20
▪️ Range: price is 6.5% below the range high and 14.8% above the range low
WHAT WOULD CONFIRM WEAKNESS
▪️ Rallies rejected near EMA 20 (5.318 USD)
▪️ A 4H close below 4.619 USD
WHAT WOULD INVALIDATE IT
▪️ A 4H close above EMA 50 (5.754 USD)
▪️ A move through 5.644 USD would break the lower-high structure
Do you think the price will break back above the short-term average soon?
Not financial advice. Always DYOR.
Like & Follow for Daily Trade Analytics & Insider News. @MistralAK
#UNI #HotTrends #TechnicalAnalysis
$UNI trades at 5.301 USD, up 3.4% over the past 24 hours, with 4H RSI at 43.5 (neutral).
The market is trading beneath the short-term exponential average, which itself sits under the longer average, indicating a bearish bias on the four-hour chart. Yet the upward move in the past day shows buying pressure that could challenge the nearest support.
TECHNICAL READ
▪️ Momentum: 4H RSI 43.5 sits in the neutral zone
▪️ Trend filter: EMA 20 is below EMA 50, and price is below EMA 20
▪️ Range: price is 6.5% below the range high and 14.8% above the range low
WHAT WOULD CONFIRM WEAKNESS
▪️ Rallies rejected near EMA 20 (5.318 USD)
▪️ A 4H close below 4.619 USD
WHAT WOULD INVALIDATE IT
▪️ A 4H close above EMA 50 (5.754 USD)
▪️ A move through 5.644 USD would break the lower-high structure
Do you think the price will break back above the short-term average soon?
Not financial advice. Always DYOR.
Like & Follow for Daily Trade Analytics & Insider News. @MistralAK
#UNI #HotTrends #TechnicalAnalysis
55
·
--
Bearish
See translation
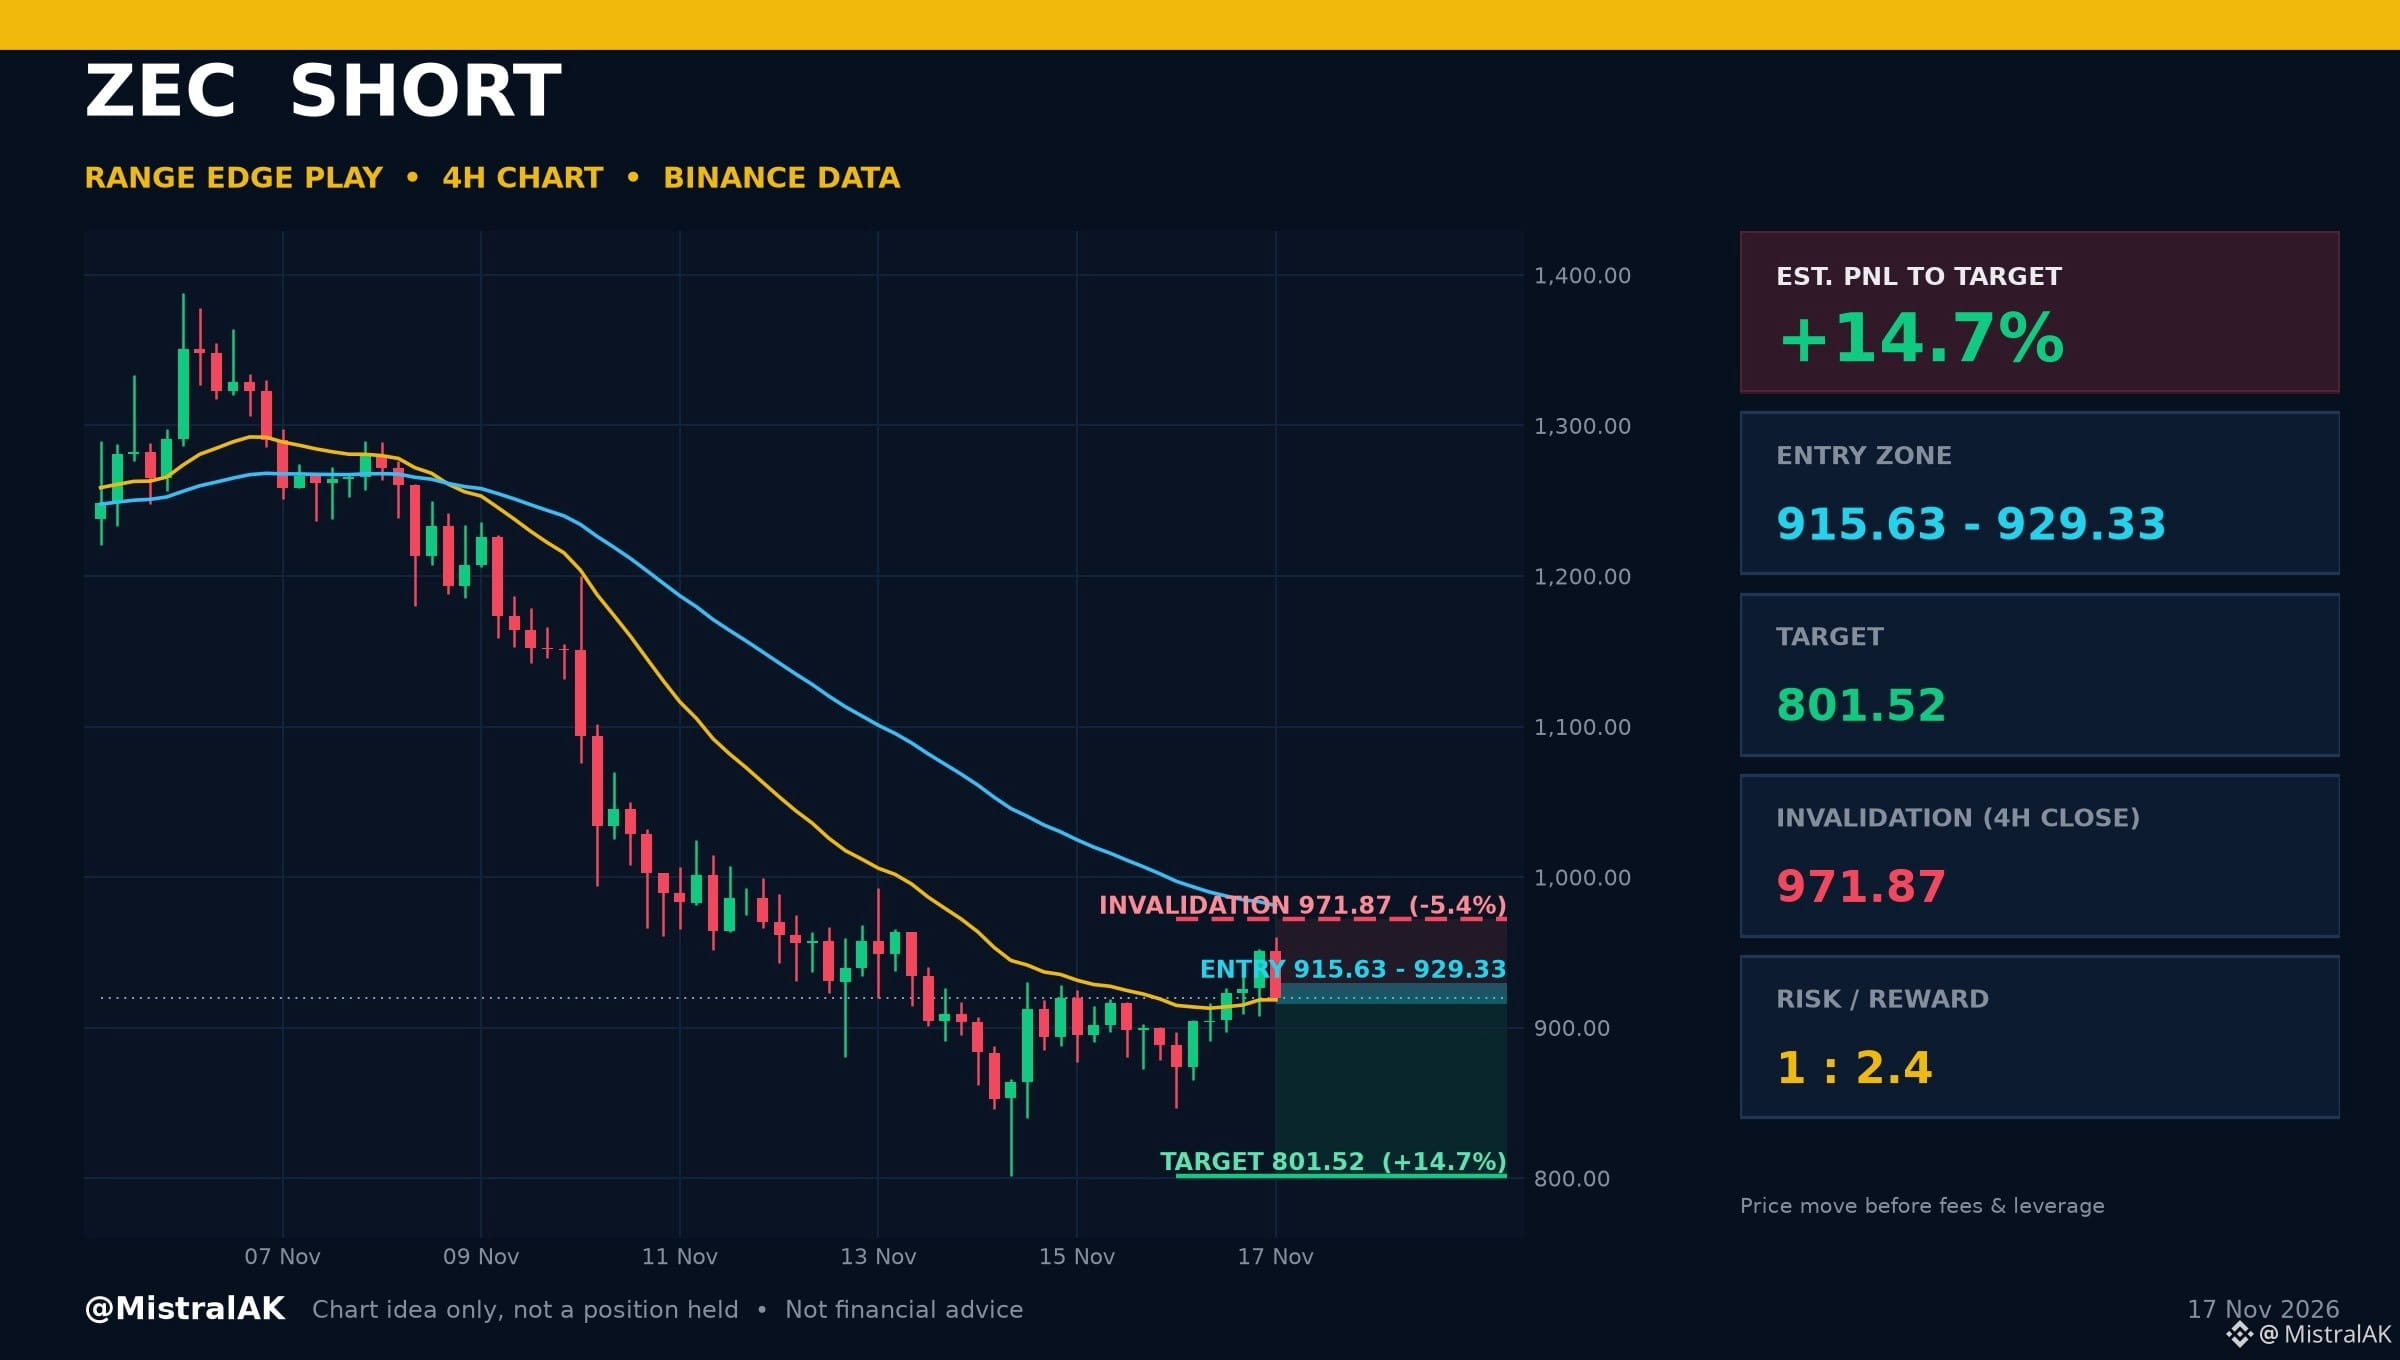
$ZEC Short | Est. PNL +14.7%: Range Edge Play
$ZEC Giving Away You Black Friday Profit - Enter Trade Now
Entry zone: 915.63 - 929.33 USD
Target: 801.52 USD (range low)
Invalidation: 4H close above 971.87 USD
Risk/Reward: 1 : 2.4
Est. PNL to target: +14.7% | to invalidation: -5.4% (price move from 919.54 USD, before fees and leverage)
WHY THIS LEVEL
▪️ Price is moving between support and resistance with mixed EMA signals
▪️ 4H RSI 47.8 (neutral)
A 4H close above 971.87 USD cancels the idea. Chart idea only, not a position I hold.
Would you take this one, wait for more, or stay out? Tell us why below.
Not financial advice. Always DYOR.
Like & Follow for Daily Trade Analytics & Insider News. @MistralAK
#ZEC #NvidiaEarningsTonight:AIStocks’NextMove? #A Packed Week of Earnings and Data Tests Markets #AnthropicIPOTestsInvestorAppetiteForAI #BlackFriday2026
{spot}(ZECUSDT)
$ZEC Short | Est. PNL +14.7%: Range Edge Play
$ZEC Giving Away You Black Friday Profit - Enter Trade Now
Entry zone: 915.63 - 929.33 USD
Target: 801.52 USD (range low)
Invalidation: 4H close above 971.87 USD
Risk/Reward: 1 : 2.4
Est. PNL to target: +14.7% | to invalidation: -5.4% (price move from 919.54 USD, before fees and leverage)
WHY THIS LEVEL
▪️ Price is moving between support and resistance with mixed EMA signals
▪️ 4H RSI 47.8 (neutral)
A 4H close above 971.87 USD cancels the idea. Chart idea only, not a position I hold.
Would you take this one, wait for more, or stay out? Tell us why below.
Not financial advice. Always DYOR.
Like & Follow for Daily Trade Analytics & Insider News. @MistralAK
#ZEC #NvidiaEarningsTonight:AIStocks’NextMove? #A Packed Week of Earnings and Data Tests Markets #AnthropicIPOTestsInvestorAppetiteForAI #BlackFriday2026
$ZEC Giving Away You Black Friday Profit - Enter Trade Now
Entry zone: 915.63 - 929.33 USD
Target: 801.52 USD (range low)
Invalidation: 4H close above 971.87 USD
Risk/Reward: 1 : 2.4
Est. PNL to target: +14.7% | to invalidation: -5.4% (price move from 919.54 USD, before fees and leverage)
WHY THIS LEVEL
▪️ Price is moving between support and resistance with mixed EMA signals
▪️ 4H RSI 47.8 (neutral)
A 4H close above 971.87 USD cancels the idea. Chart idea only, not a position I hold.
Would you take this one, wait for more, or stay out? Tell us why below.
Not financial advice. Always DYOR.
Like & Follow for Daily Trade Analytics & Insider News. @MistralAK
#ZEC #NvidiaEarningsTonight:AIStocks’NextMove? #A Packed Week of Earnings and Data Tests Markets #AnthropicIPOTestsInvestorAppetiteForAI #BlackFriday2026
32
·
--
See translation
$SOL Price Tests Range as Upward Momentum Persists
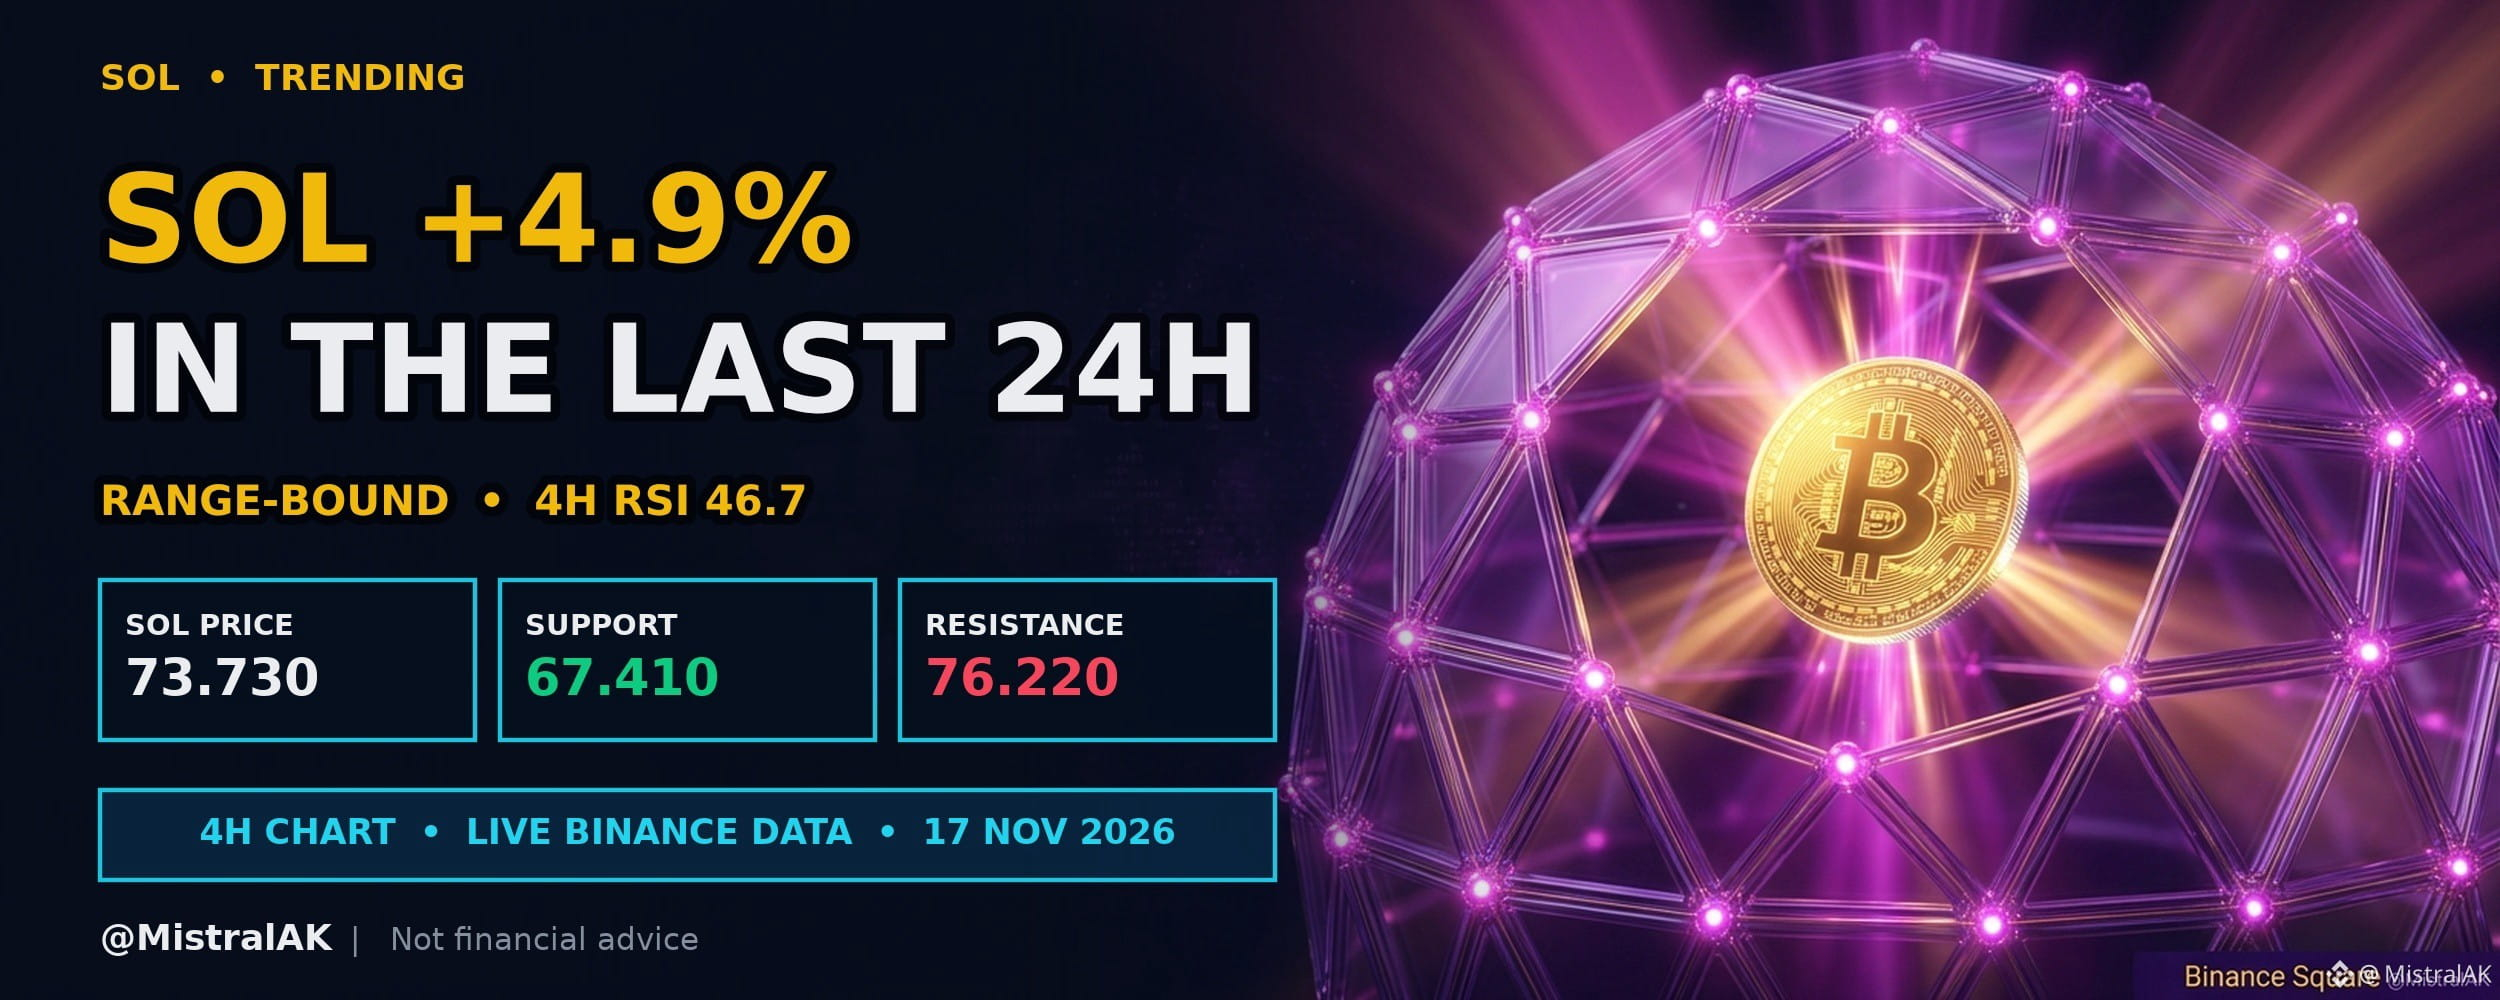
$SOL trades at 73.730 USD, up 4.9% over the past 24 hours, with 4H RSI at 46.7 (neutral).
The market is oscillating between a defined support and resistance while the short-term trend remains upward. With the RSI sitting in the middle range, price action may continue to respect the range until a clear break emerges.
WHY IT IS ON THE RADAR
▪️ 24h move: +4.9%
▪️ 24h volume: 212M USDT (#3 among liquid USDT pairs)
KEY LEVELS
▪️ Resistance: 76.220 USD (20-candle 4H swing high)
▪️ Support: 67.410 USD (20-candle 4H swing low)
WHAT WOULD SHIFT THE BIAS
▪️ A 4H close above 76.220 USD (bullish shift)
WHAT KEEPS IT RANGE-BOUND
▪️ Closes continuing to rotate between 67.410 and 76.220 USD
Do you expect the price to break above resistance or slip back toward support?
Not financial advice. Always DYOR.
Like & Follow for Daily Trade Analytics & Insider News. @MistralAK
#sol #HotTrends #BlackFriday2026 #A Packed Week of Earnings and Data Tests Markets
$SOL Price Tests Range as Upward Momentum Persists
$SOL trades at 73.730 USD, up 4.9% over the past 24 hours, with 4H RSI at 46.7 (neutral).
The market is oscillating between a defined support and resistance while the short-term trend remains upward. With the RSI sitting in the middle range, price action may continue to respect the range until a clear break emerges.
WHY IT IS ON THE RADAR
▪️ 24h move: +4.9%
▪️ 24h volume: 212M USDT (#3 among liquid USDT pairs)
KEY LEVELS
▪️ Resistance: 76.220 USD (20-candle 4H swing high)
▪️ Support: 67.410 USD (20-candle 4H swing low)
WHAT WOULD SHIFT THE BIAS
▪️ A 4H close above 76.220 USD (bullish shift)
WHAT KEEPS IT RANGE-BOUND
▪️ Closes continuing to rotate between 67.410 and 76.220 USD
Do you expect the price to break above resistance or slip back toward support?
Not financial advice. Always DYOR.
Like & Follow for Daily Trade Analytics & Insider News. @MistralAK
#sol #HotTrends #BlackFriday2026 #A Packed Week of Earnings and Data Tests Markets
$SOL trades at 73.730 USD, up 4.9% over the past 24 hours, with 4H RSI at 46.7 (neutral).
The market is oscillating between a defined support and resistance while the short-term trend remains upward. With the RSI sitting in the middle range, price action may continue to respect the range until a clear break emerges.
WHY IT IS ON THE RADAR
▪️ 24h move: +4.9%
▪️ 24h volume: 212M USDT (#3 among liquid USDT pairs)
KEY LEVELS
▪️ Resistance: 76.220 USD (20-candle 4H swing high)
▪️ Support: 67.410 USD (20-candle 4H swing low)
WHAT WOULD SHIFT THE BIAS
▪️ A 4H close above 76.220 USD (bullish shift)
WHAT KEEPS IT RANGE-BOUND
▪️ Closes continuing to rotate between 67.410 and 76.220 USD
Do you expect the price to break above resistance or slip back toward support?
Not financial advice. Always DYOR.
Like & Follow for Daily Trade Analytics & Insider News. @MistralAK
#sol #HotTrends #BlackFriday2026 #A Packed Week of Earnings and Data Tests Markets
24
·
--
See translation
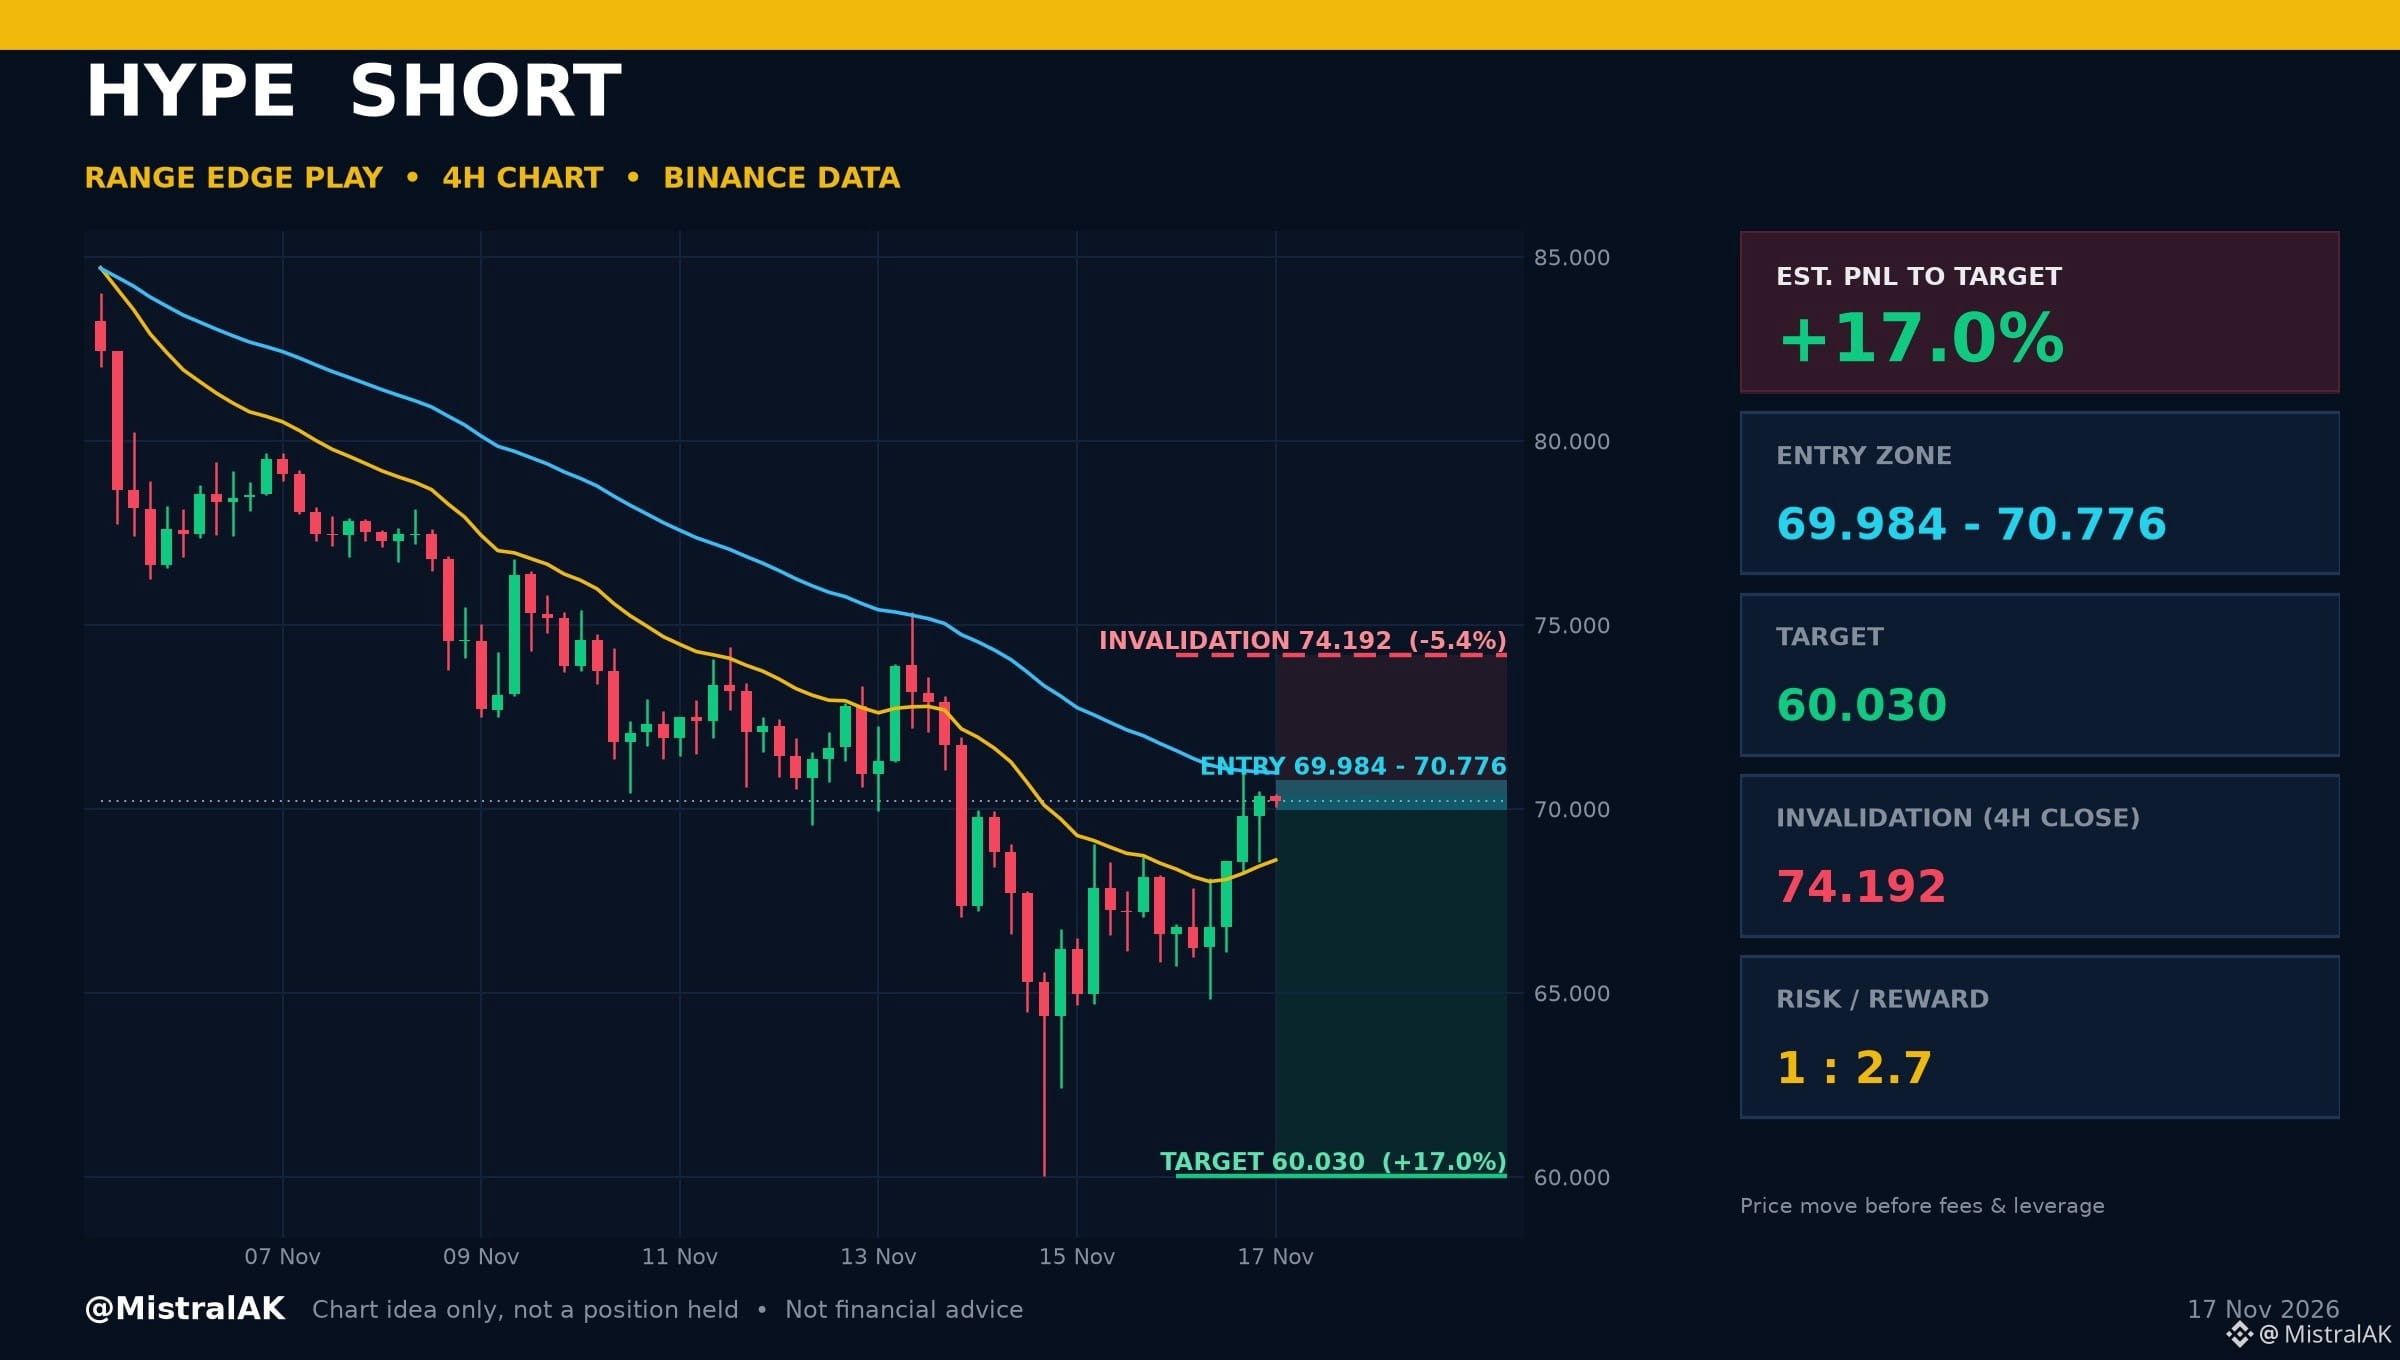
$HYPE Short | Est. PNL +17.0%: Range Edge Play
Entry zone: 69.984 - 70.776 USD
Target: 60.030 USD (range low)
Invalidation: 4H close above 74.192 USD
Risk/Reward: 1 : 2.7
Est. PNL to target: +17.0% | to invalidation: -5.4% (price move from 70.210 USD, before fees and leverage)
WHY THIS LEVEL
▪️ Price is moving between support and resistance with mixed EMA signals
▪️ 4H RSI 54.3 (neutral)
A 4H close above 74.192 USD cancels the idea. Chart idea only, not a position I hold.
Would you take this one, wait for more, or stay out? Tell us why below.
Not financial advice. Always DYOR.
Like & Follow for Daily Trade Analytics & Insider News. @MistralAK
#HYPE #TechnicalAnalysis #TradingSignals
$HYPE Short | Est. PNL +17.0%: Range Edge Play
Entry zone: 69.984 - 70.776 USD
Target: 60.030 USD (range low)
Invalidation: 4H close above 74.192 USD
Risk/Reward: 1 : 2.7
Est. PNL to target: +17.0% | to invalidation: -5.4% (price move from 70.210 USD, before fees and leverage)
WHY THIS LEVEL
▪️ Price is moving between support and resistance with mixed EMA signals
▪️ 4H RSI 54.3 (neutral)
A 4H close above 74.192 USD cancels the idea. Chart idea only, not a position I hold.
Would you take this one, wait for more, or stay out? Tell us why below.
Not financial advice. Always DYOR.
Like & Follow for Daily Trade Analytics & Insider News. @MistralAK
#HYPE #TechnicalAnalysis #TradingSignals
Entry zone: 69.984 - 70.776 USD
Target: 60.030 USD (range low)
Invalidation: 4H close above 74.192 USD
Risk/Reward: 1 : 2.7
Est. PNL to target: +17.0% | to invalidation: -5.4% (price move from 70.210 USD, before fees and leverage)
WHY THIS LEVEL
▪️ Price is moving between support and resistance with mixed EMA signals
▪️ 4H RSI 54.3 (neutral)
A 4H close above 74.192 USD cancels the idea. Chart idea only, not a position I hold.
Would you take this one, wait for more, or stay out? Tell us why below.
Not financial advice. Always DYOR.
Like & Follow for Daily Trade Analytics & Insider News. @MistralAK
#HYPE #TechnicalAnalysis #TradingSignals
78
·
--
See translation
$ICP Price Pushes Upward Within Defined Boundaries
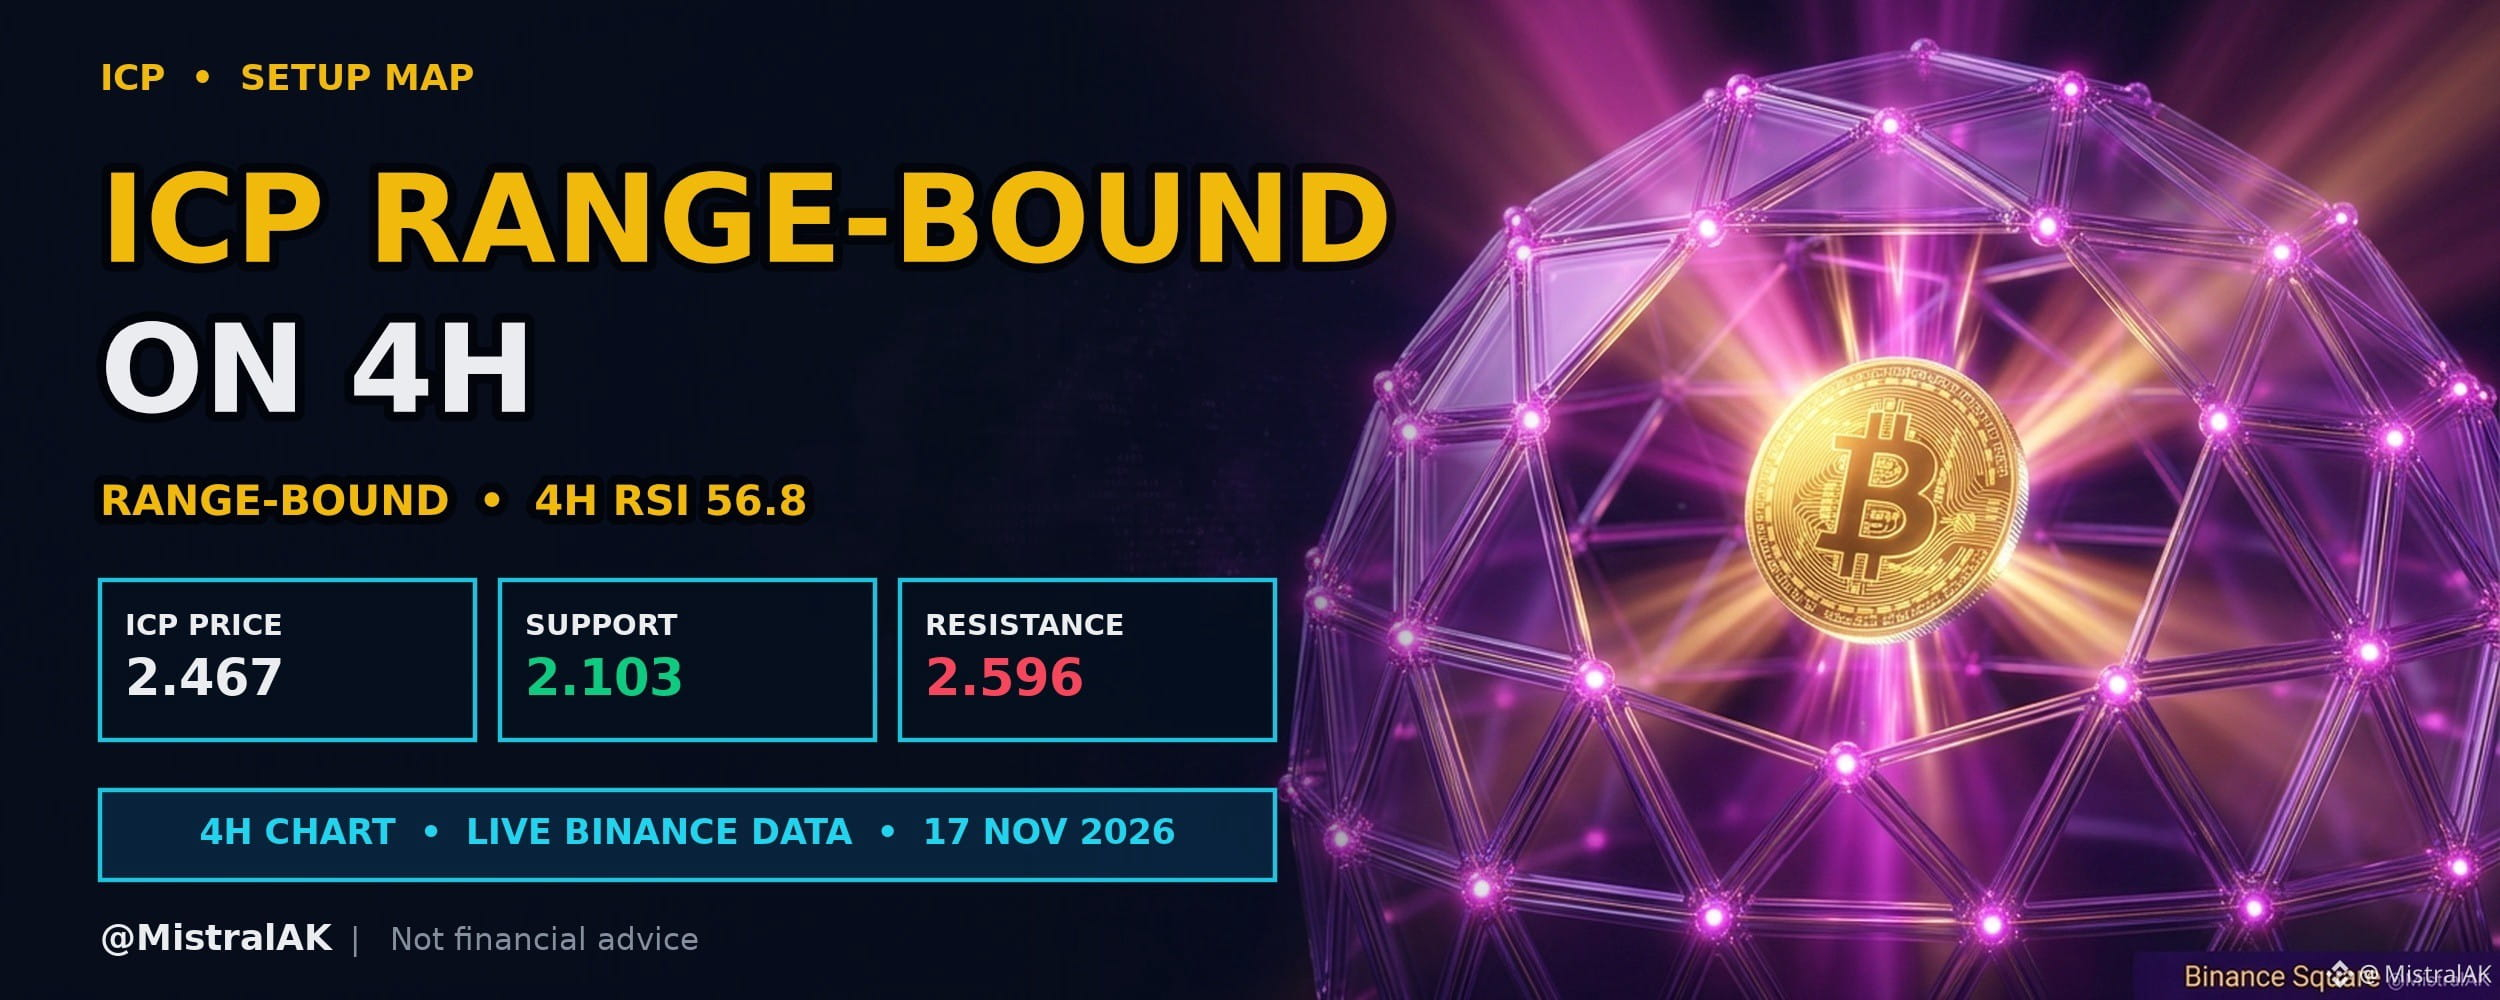
$ICP trades at 2.467 USD, up 9.8% over the past 24 hours, with 4H RSI at 56.8 (neutral).
Over the past twenty-four hours, price moved higher while remaining bound between key support and resistance. The four-hour RSI sits in the neutral zone alongside conflicting exponential moving averages.
KEY LEVELS
▪️ Resistance: 2.596 USD (20-candle 4H swing high)
▪️ Support: 2.103 USD (20-candle 4H swing low)
▪️ EMA 20 / EMA 50: 2.380 / 2.412 USD (short-term trend filter)
WHAT WOULD SHIFT THE BIAS
▪️ A 4H close above 2.596 USD (bullish shift)
▪️ A 4H close below 2.103 USD (bearish shift)
WHAT KEEPS IT RANGE-BOUND
▪️ Closes continuing to rotate between 2.103 and 2.596 USD
▪️ No decisive 4H close outside either edge
Will price break above resistance or retest support next?
Not financial advice. Always DYOR.
Like & Follow for Daily Trade Analytics & Insider News. @MistralAK
#ICP #TrendingTopic #TradingSignals
$ICP Price Pushes Upward Within Defined Boundaries
$ICP trades at 2.467 USD, up 9.8% over the past 24 hours, with 4H RSI at 56.8 (neutral).
Over the past twenty-four hours, price moved higher while remaining bound between key support and resistance. The four-hour RSI sits in the neutral zone alongside conflicting exponential moving averages.
KEY LEVELS
▪️ Resistance: 2.596 USD (20-candle 4H swing high)
▪️ Support: 2.103 USD (20-candle 4H swing low)
▪️ EMA 20 / EMA 50: 2.380 / 2.412 USD (short-term trend filter)
WHAT WOULD SHIFT THE BIAS
▪️ A 4H close above 2.596 USD (bullish shift)
▪️ A 4H close below 2.103 USD (bearish shift)
WHAT KEEPS IT RANGE-BOUND
▪️ Closes continuing to rotate between 2.103 and 2.596 USD
▪️ No decisive 4H close outside either edge
Will price break above resistance or retest support next?
Not financial advice. Always DYOR.
Like & Follow for Daily Trade Analytics & Insider News. @MistralAK
#ICP #TrendingTopic #TradingSignals
$ICP trades at 2.467 USD, up 9.8% over the past 24 hours, with 4H RSI at 56.8 (neutral).
Over the past twenty-four hours, price moved higher while remaining bound between key support and resistance. The four-hour RSI sits in the neutral zone alongside conflicting exponential moving averages.
KEY LEVELS
▪️ Resistance: 2.596 USD (20-candle 4H swing high)
▪️ Support: 2.103 USD (20-candle 4H swing low)
▪️ EMA 20 / EMA 50: 2.380 / 2.412 USD (short-term trend filter)
WHAT WOULD SHIFT THE BIAS
▪️ A 4H close above 2.596 USD (bullish shift)
▪️ A 4H close below 2.103 USD (bearish shift)
WHAT KEEPS IT RANGE-BOUND
▪️ Closes continuing to rotate between 2.103 and 2.596 USD
▪️ No decisive 4H close outside either edge
Will price break above resistance or retest support next?
Not financial advice. Always DYOR.
Like & Follow for Daily Trade Analytics & Insider News. @MistralAK
#ICP #TrendingTopic #TradingSignals
136
·
--
See translation
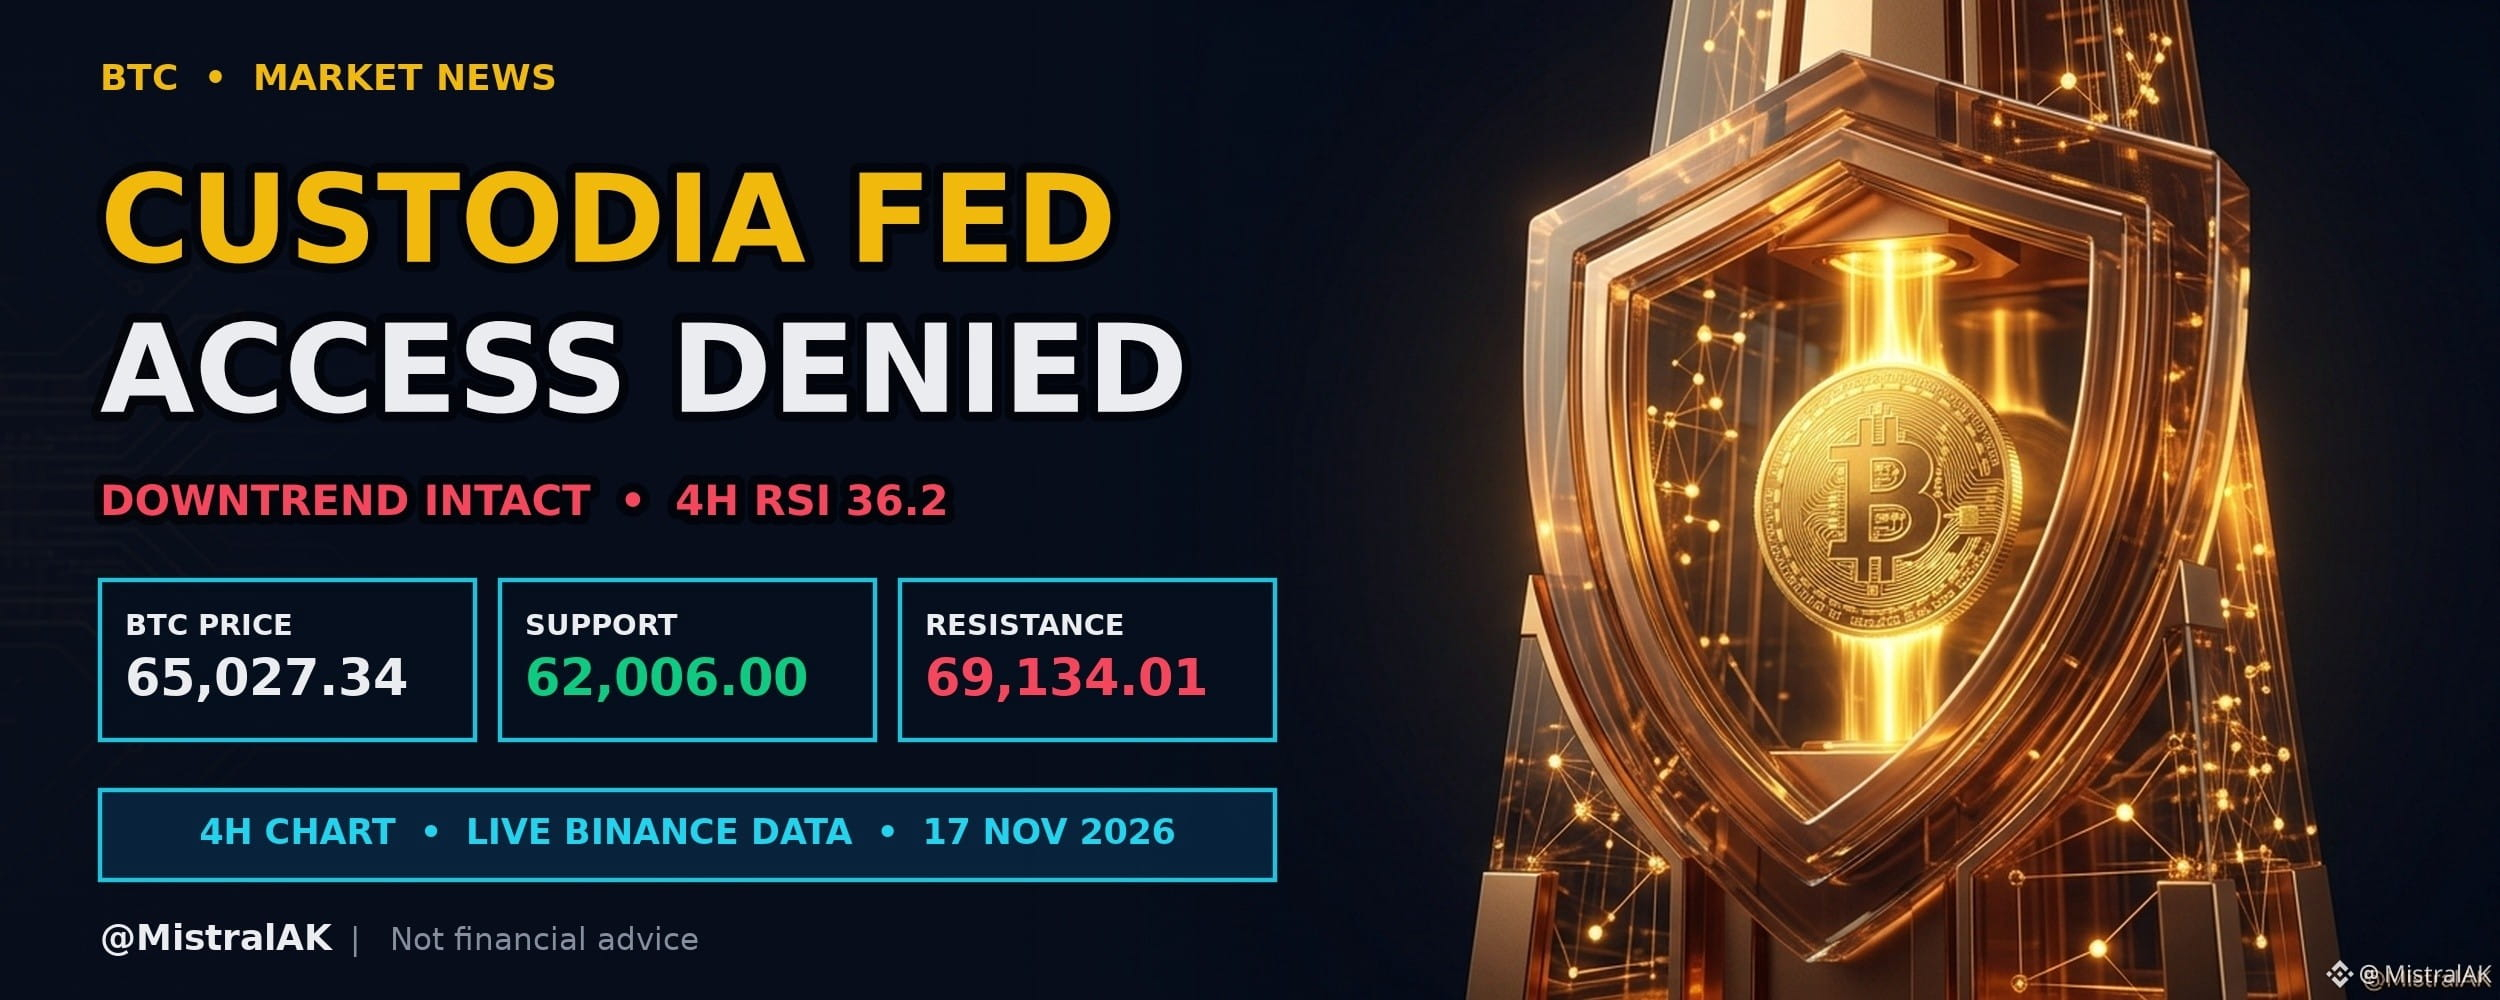
Custodia Bank Loses Supreme Court Appeal for Direct FED Payment Access
WHAT HAPPENED
▪️ The Supreme Court declined to hear Custodia Bank’s appeal regarding direct access to Federal Reserve payment systems.
▪️ This decision leaves intact a lower court ruling that permits the Fed to reject master account applications.
WHY IT MATTERS FOR TRADERS
Restricting direct central bank access for specialized institutions may influence institutional sentiment around fiat-to-crypto banking rails. Consequently, market participants might monitor whether alternative payment channels can sustain market liquidity.
MARKET SNAPSHOT
▪️ $BTC: 65,027.34 USD, up 0.1% (24h), 4H RSI 36.2
▪️ Range to watch: 62,006.00 support / 69,134.01 resistance
How might limited direct Fed access for specialized banks affect broader crypto market liquidity?
Source: Cointelegraph
Not financial advice. Always DYOR.
Like & Follow for Daily Trade Analytics & Insider News. @MistralAK
#TrendingTopic #Bitcoin #HotTrends
Custodia Bank Loses Supreme Court Appeal for Direct FED Payment Access
WHAT HAPPENED
▪️ The Supreme Court declined to hear Custodia Bank’s appeal regarding direct access to Federal Reserve payment systems.
▪️ This decision leaves intact a lower court ruling that permits the Fed to reject master account applications.
WHY IT MATTERS FOR TRADERS
Restricting direct central bank access for specialized institutions may influence institutional sentiment around fiat-to-crypto banking rails. Consequently, market participants might monitor whether alternative payment channels can sustain market liquidity.
MARKET SNAPSHOT
▪️ $BTC : 65,027.34 USD, up 0.1% (24h), 4H RSI 36.2
▪️ Range to watch: 62,006.00 support / 69,134.01 resistance
How might limited direct Fed access for specialized banks affect broader crypto market liquidity?
Source: Cointelegraph
Not financial advice. Always DYOR.
Like & Follow for Daily Trade Analytics & Insider News. @MistralAK
#TrendingTopic #Bitcoin #HotTrends
WHAT HAPPENED
▪️ The Supreme Court declined to hear Custodia Bank’s appeal regarding direct access to Federal Reserve payment systems.
▪️ This decision leaves intact a lower court ruling that permits the Fed to reject master account applications.
WHY IT MATTERS FOR TRADERS
Restricting direct central bank access for specialized institutions may influence institutional sentiment around fiat-to-crypto banking rails. Consequently, market participants might monitor whether alternative payment channels can sustain market liquidity.
MARKET SNAPSHOT
▪️ $BTC : 65,027.34 USD, up 0.1% (24h), 4H RSI 36.2
▪️ Range to watch: 62,006.00 support / 69,134.01 resistance
How might limited direct Fed access for specialized banks affect broader crypto market liquidity?
Source: Cointelegraph
Not financial advice. Always DYOR.
Like & Follow for Daily Trade Analytics & Insider News. @MistralAK
#TrendingTopic #Bitcoin #HotTrends
21
·
--
See translation
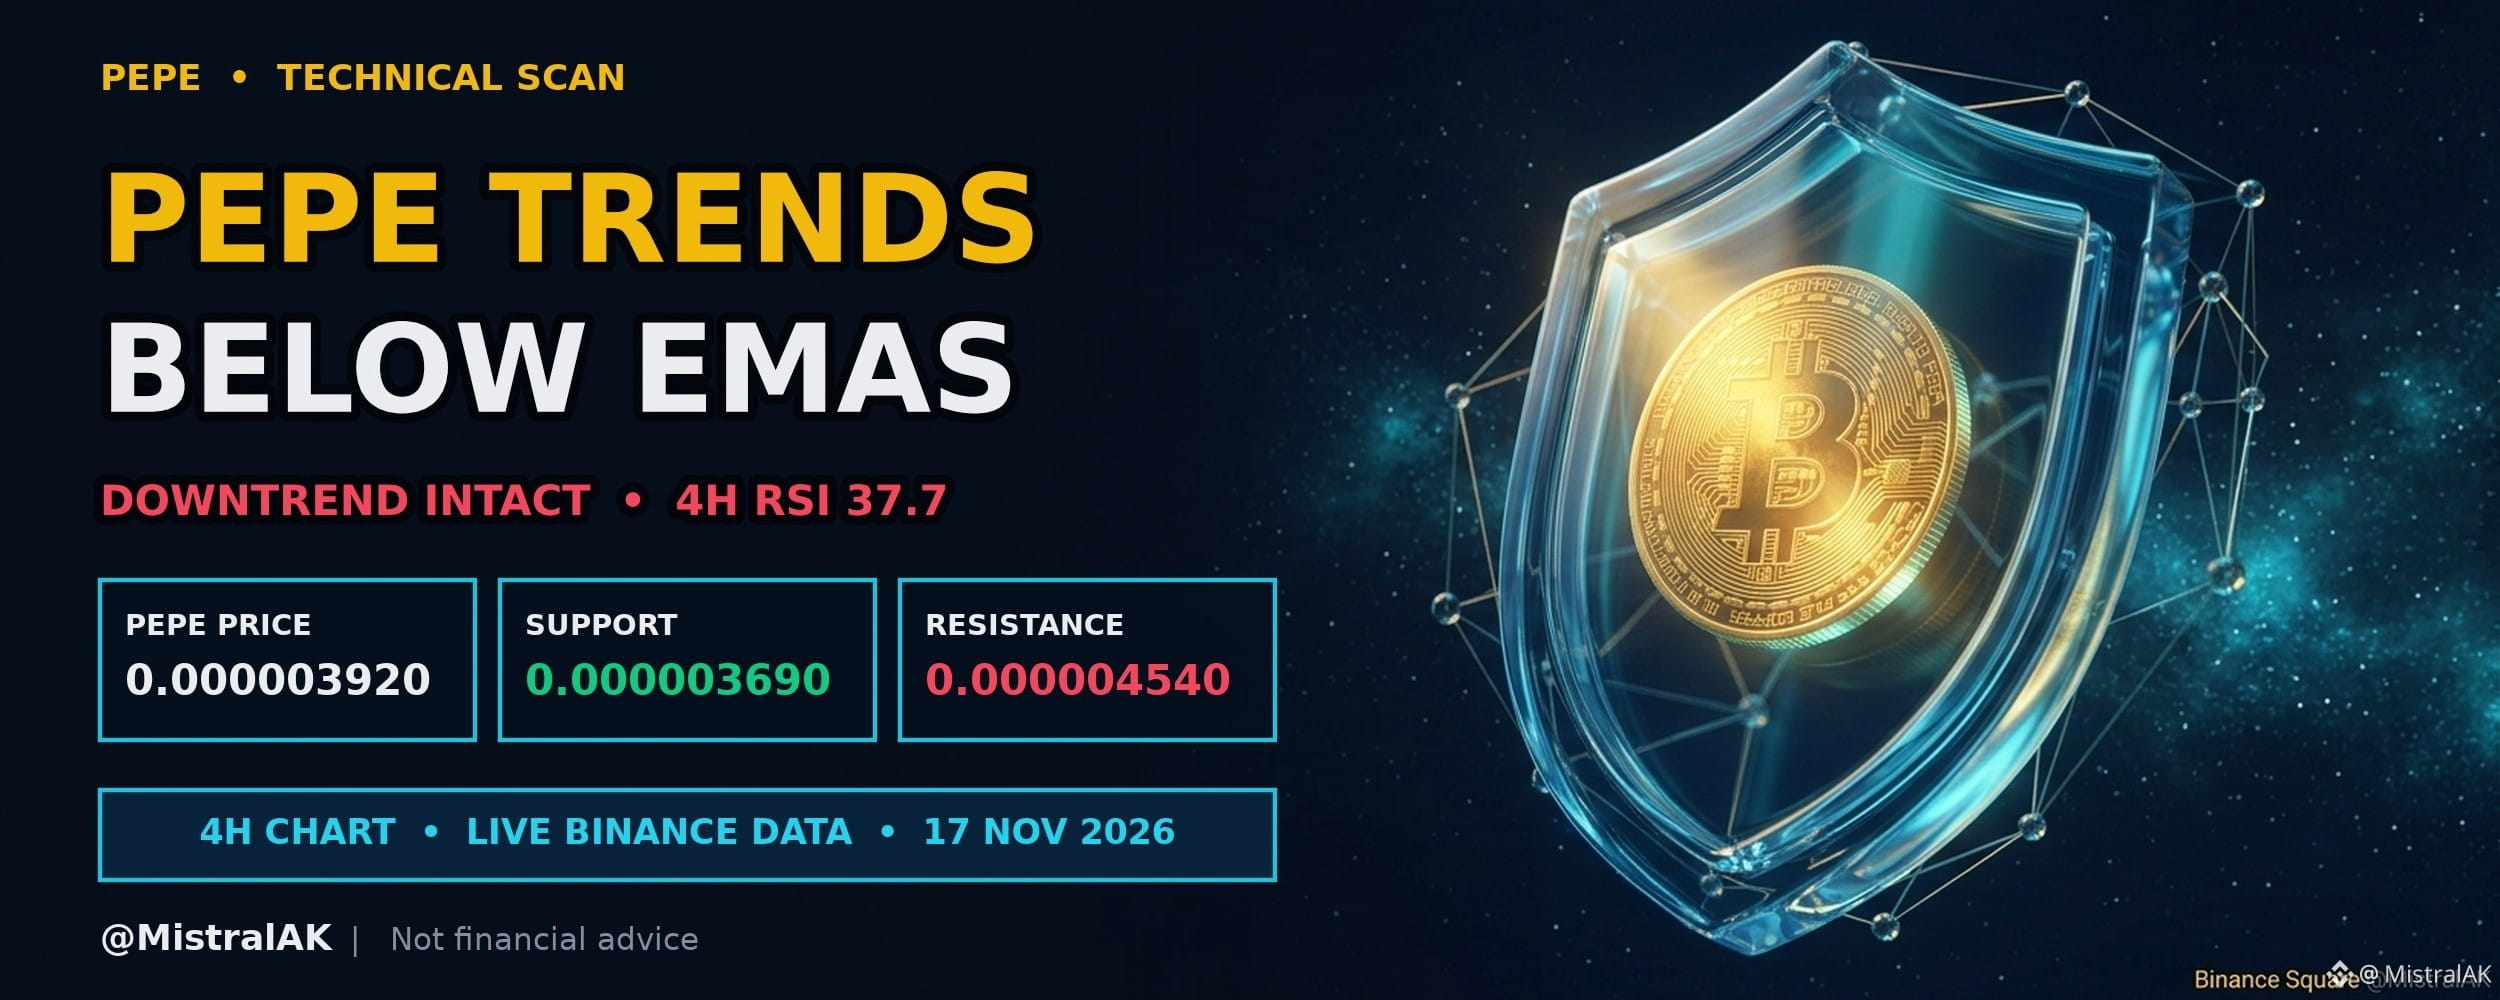
$PEPE Short Term Rebound Meets Moving Average Resistance
$PEPE trades at 0.000003920 USD, up 2.1% over the past 24 hours, with 4H RSI at 37.7 (neutral).
Despite a positive move over the past twenty-four hours, price remains constrained beneath both short and medium exponential moving averages. The relative strength index on the four-hour chart reflects balanced momentum, leaving room for price action in either direction.
TECHNICAL READ
▪️ Momentum: 4H RSI 37.7 sits in the neutral zone
▪️ Trend filter: EMA 20 is below EMA 50, and price is below EMA 20
▪️ Range: price is 15.8% below the range high and 6.2% above the range low
WHAT WOULD CONFIRM WEAKNESS
▪️ Rallies rejected near EMA 20 (0.000004022 USD)
▪️ A 4H close below 0.000003690 USD
WHAT WOULD INVALIDATE IT
▪️ A 4H close above EMA 50 (0.000004346 USD)
▪️ A move through 0.000004540 USD would break the lower-high structure
Do you expect price to overcome moving average resistance, or will the broader downtrend resume?
Not financial advice. Always DYOR.
Like & Follow for Daily Trade Analytics & Insider News. @MistralAK
#PEPE #TrendingTopic #TechnicalAnalysis
$PEPE Short Term Rebound Meets Moving Average Resistance
$PEPE trades at 0.000003920 USD, up 2.1% over the past 24 hours, with 4H RSI at 37.7 (neutral).
Despite a positive move over the past twenty-four hours, price remains constrained beneath both short and medium exponential moving averages. The relative strength index on the four-hour chart reflects balanced momentum, leaving room for price action in either direction.
TECHNICAL READ
▪️ Momentum: 4H RSI 37.7 sits in the neutral zone
▪️ Trend filter: EMA 20 is below EMA 50, and price is below EMA 20
▪️ Range: price is 15.8% below the range high and 6.2% above the range low
WHAT WOULD CONFIRM WEAKNESS
▪️ Rallies rejected near EMA 20 (0.000004022 USD)
▪️ A 4H close below 0.000003690 USD
WHAT WOULD INVALIDATE IT
▪️ A 4H close above EMA 50 (0.000004346 USD)
▪️ A move through 0.000004540 USD would break the lower-high structure
Do you expect price to overcome moving average resistance, or will the broader downtrend resume?
Not financial advice. Always DYOR.
Like & Follow for Daily Trade Analytics & Insider News. @MistralAK
#PEPE #TrendingTopic #TechnicalAnalysis
$PEPE trades at 0.000003920 USD, up 2.1% over the past 24 hours, with 4H RSI at 37.7 (neutral).
Despite a positive move over the past twenty-four hours, price remains constrained beneath both short and medium exponential moving averages. The relative strength index on the four-hour chart reflects balanced momentum, leaving room for price action in either direction.
TECHNICAL READ
▪️ Momentum: 4H RSI 37.7 sits in the neutral zone
▪️ Trend filter: EMA 20 is below EMA 50, and price is below EMA 20
▪️ Range: price is 15.8% below the range high and 6.2% above the range low
WHAT WOULD CONFIRM WEAKNESS
▪️ Rallies rejected near EMA 20 (0.000004022 USD)
▪️ A 4H close below 0.000003690 USD
WHAT WOULD INVALIDATE IT
▪️ A 4H close above EMA 50 (0.000004346 USD)
▪️ A move through 0.000004540 USD would break the lower-high structure
Do you expect price to overcome moving average resistance, or will the broader downtrend resume?
Not financial advice. Always DYOR.
Like & Follow for Daily Trade Analytics & Insider News. @MistralAK
#PEPE #TrendingTopic #TechnicalAnalysis
82
·
--
See translation
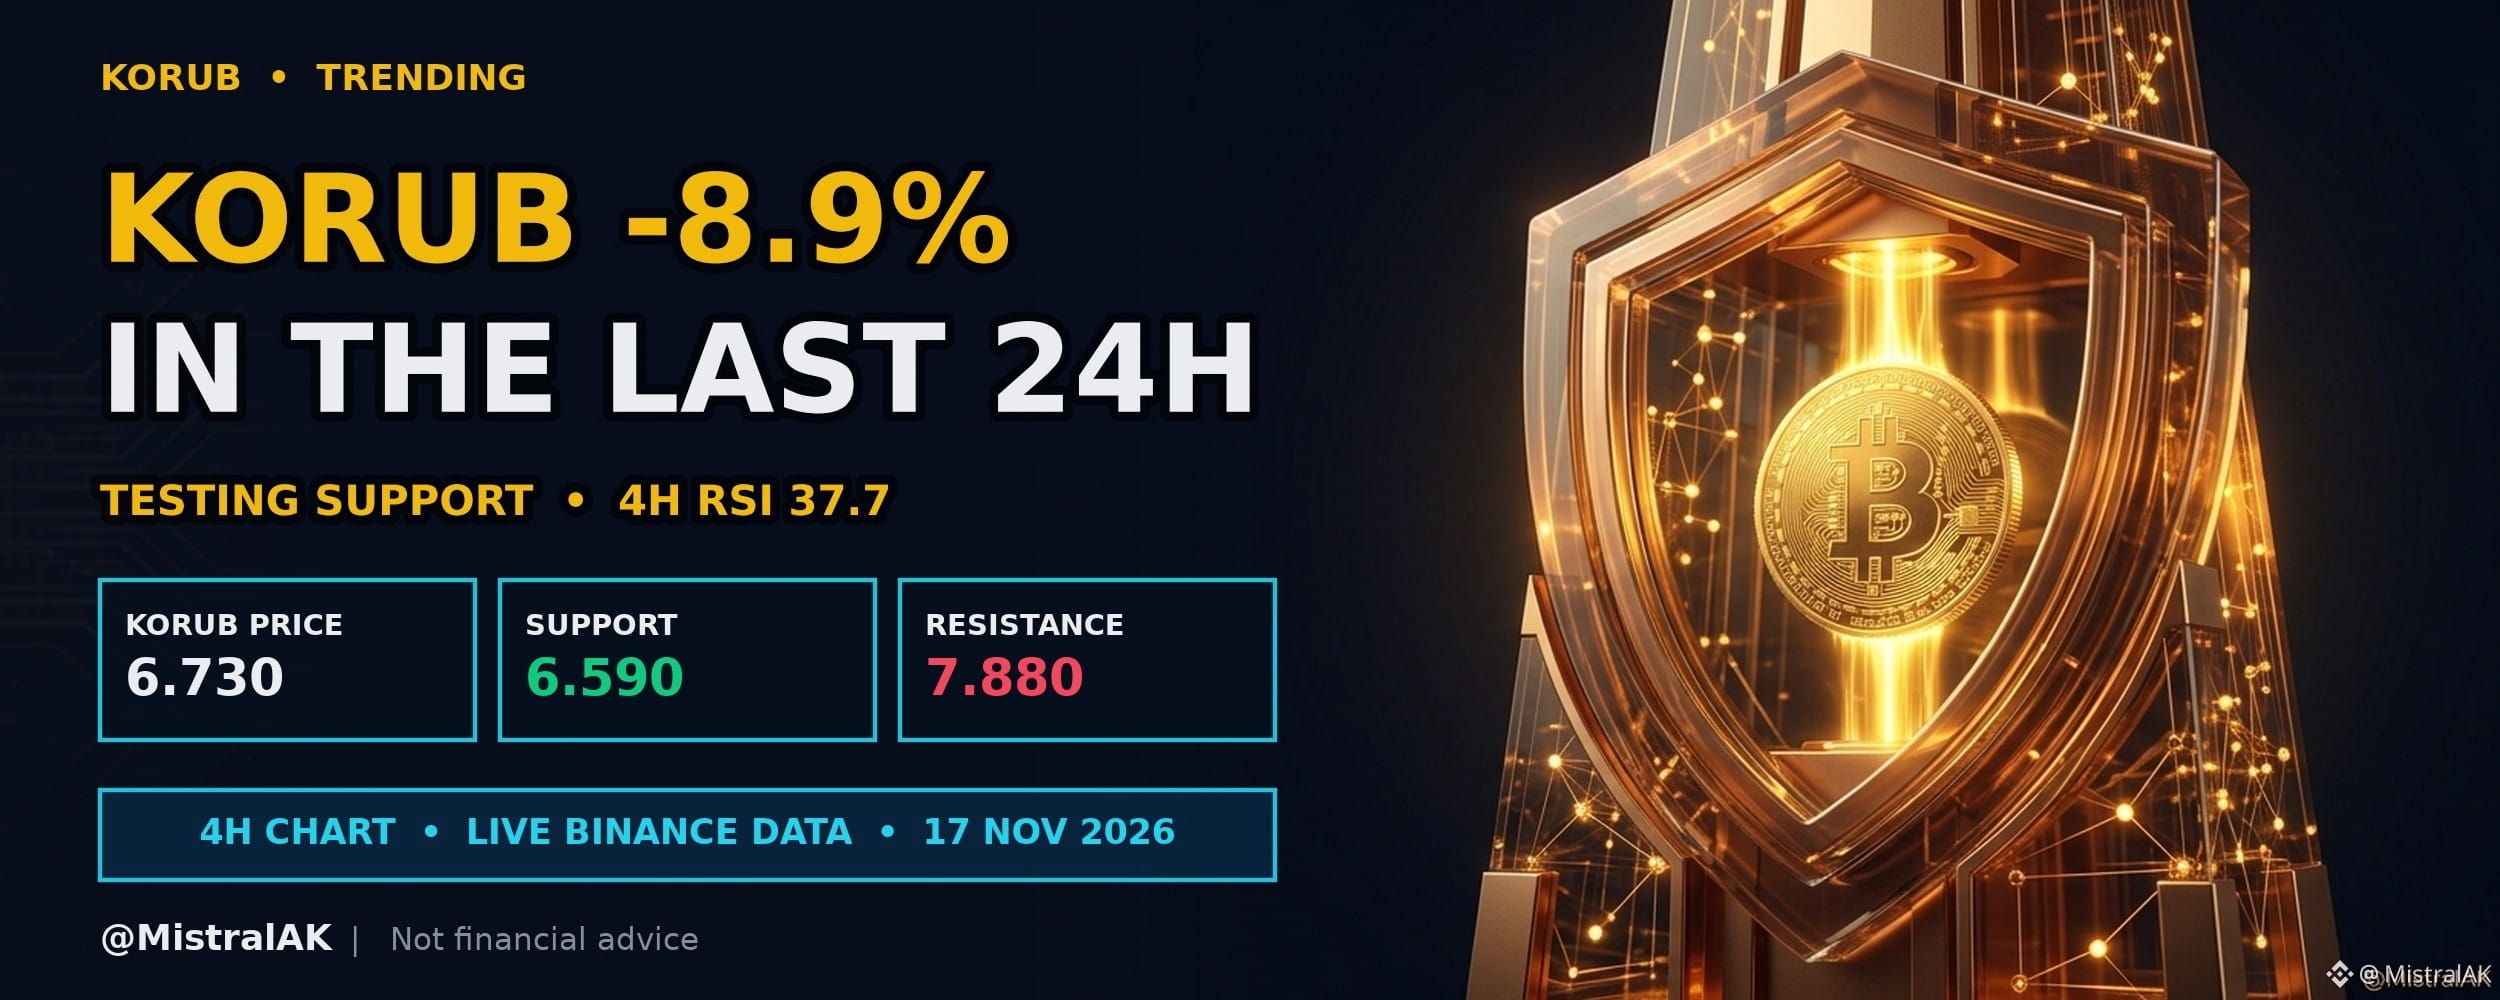
$KORUB Price Tests Swing Low After Recent Downward Move
$KORUB trades at 6.730 USD, down 8.9% over the past 24 hours, with 4H RSI at 37.7 (neutral).
Downward movement over the past twenty-four hours has pushed price to test its recent swing low on the four-hour chart. With the four-hour relative strength index in a balanced zone, traders are watching for confirmation at this level.
WHY IT IS ON THE RADAR
▪️ 24h move: -8.9%
▪️ 24h volume: 14M USDT (#26 among liquid USDT pairs)
KEY LEVELS
▪️ Resistance: 7.880 USD (20-candle 4H swing high)
▪️ Support: 6.590 USD (20-candle 4H swing low)
WHAT WOULD CONFIRM A HOLD
▪️ 4H candles defending 6.590 USD with a recovery above EMA 20 (7.188 USD)
WHAT WOULD INVALIDATE IT
▪️ A 4H close below 6.590 USD
Do you expect this swing low support to hold, or will downward movement continue?
Not financial advice. Always DYOR.
Like & Follow for Daily Trade Analytics & Insider News. @MistralAK
#KORUB #TradingSignals #TrendingTopic
$KORUB Price Tests Swing Low After Recent Downward Move
$KORUB trades at 6.730 USD, down 8.9% over the past 24 hours, with 4H RSI at 37.7 (neutral).
Downward movement over the past twenty-four hours has pushed price to test its recent swing low on the four-hour chart. With the four-hour relative strength index in a balanced zone, traders are watching for confirmation at this level.
WHY IT IS ON THE RADAR
▪️ 24h move: -8.9%
▪️ 24h volume: 14M USDT (#26 among liquid USDT pairs)
KEY LEVELS
▪️ Resistance: 7.880 USD (20-candle 4H swing high)
▪️ Support: 6.590 USD (20-candle 4H swing low)
WHAT WOULD CONFIRM A HOLD
▪️ 4H candles defending 6.590 USD with a recovery above EMA 20 (7.188 USD)
WHAT WOULD INVALIDATE IT
▪️ A 4H close below 6.590 USD
Do you expect this swing low support to hold, or will downward movement continue?
Not financial advice. Always DYOR.
Like & Follow for Daily Trade Analytics & Insider News. @MistralAK
#KORUB #TradingSignals #TrendingTopic
$KORUB trades at 6.730 USD, down 8.9% over the past 24 hours, with 4H RSI at 37.7 (neutral).
Downward movement over the past twenty-four hours has pushed price to test its recent swing low on the four-hour chart. With the four-hour relative strength index in a balanced zone, traders are watching for confirmation at this level.
WHY IT IS ON THE RADAR
▪️ 24h move: -8.9%
▪️ 24h volume: 14M USDT (#26 among liquid USDT pairs)
KEY LEVELS
▪️ Resistance: 7.880 USD (20-candle 4H swing high)
▪️ Support: 6.590 USD (20-candle 4H swing low)
WHAT WOULD CONFIRM A HOLD
▪️ 4H candles defending 6.590 USD with a recovery above EMA 20 (7.188 USD)
WHAT WOULD INVALIDATE IT
▪️ A 4H close below 6.590 USD
Do you expect this swing low support to hold, or will downward movement continue?
Not financial advice. Always DYOR.
Like & Follow for Daily Trade Analytics & Insider News. @MistralAK
#KORUB #TradingSignals #TrendingTopic
317
·
--
See translation
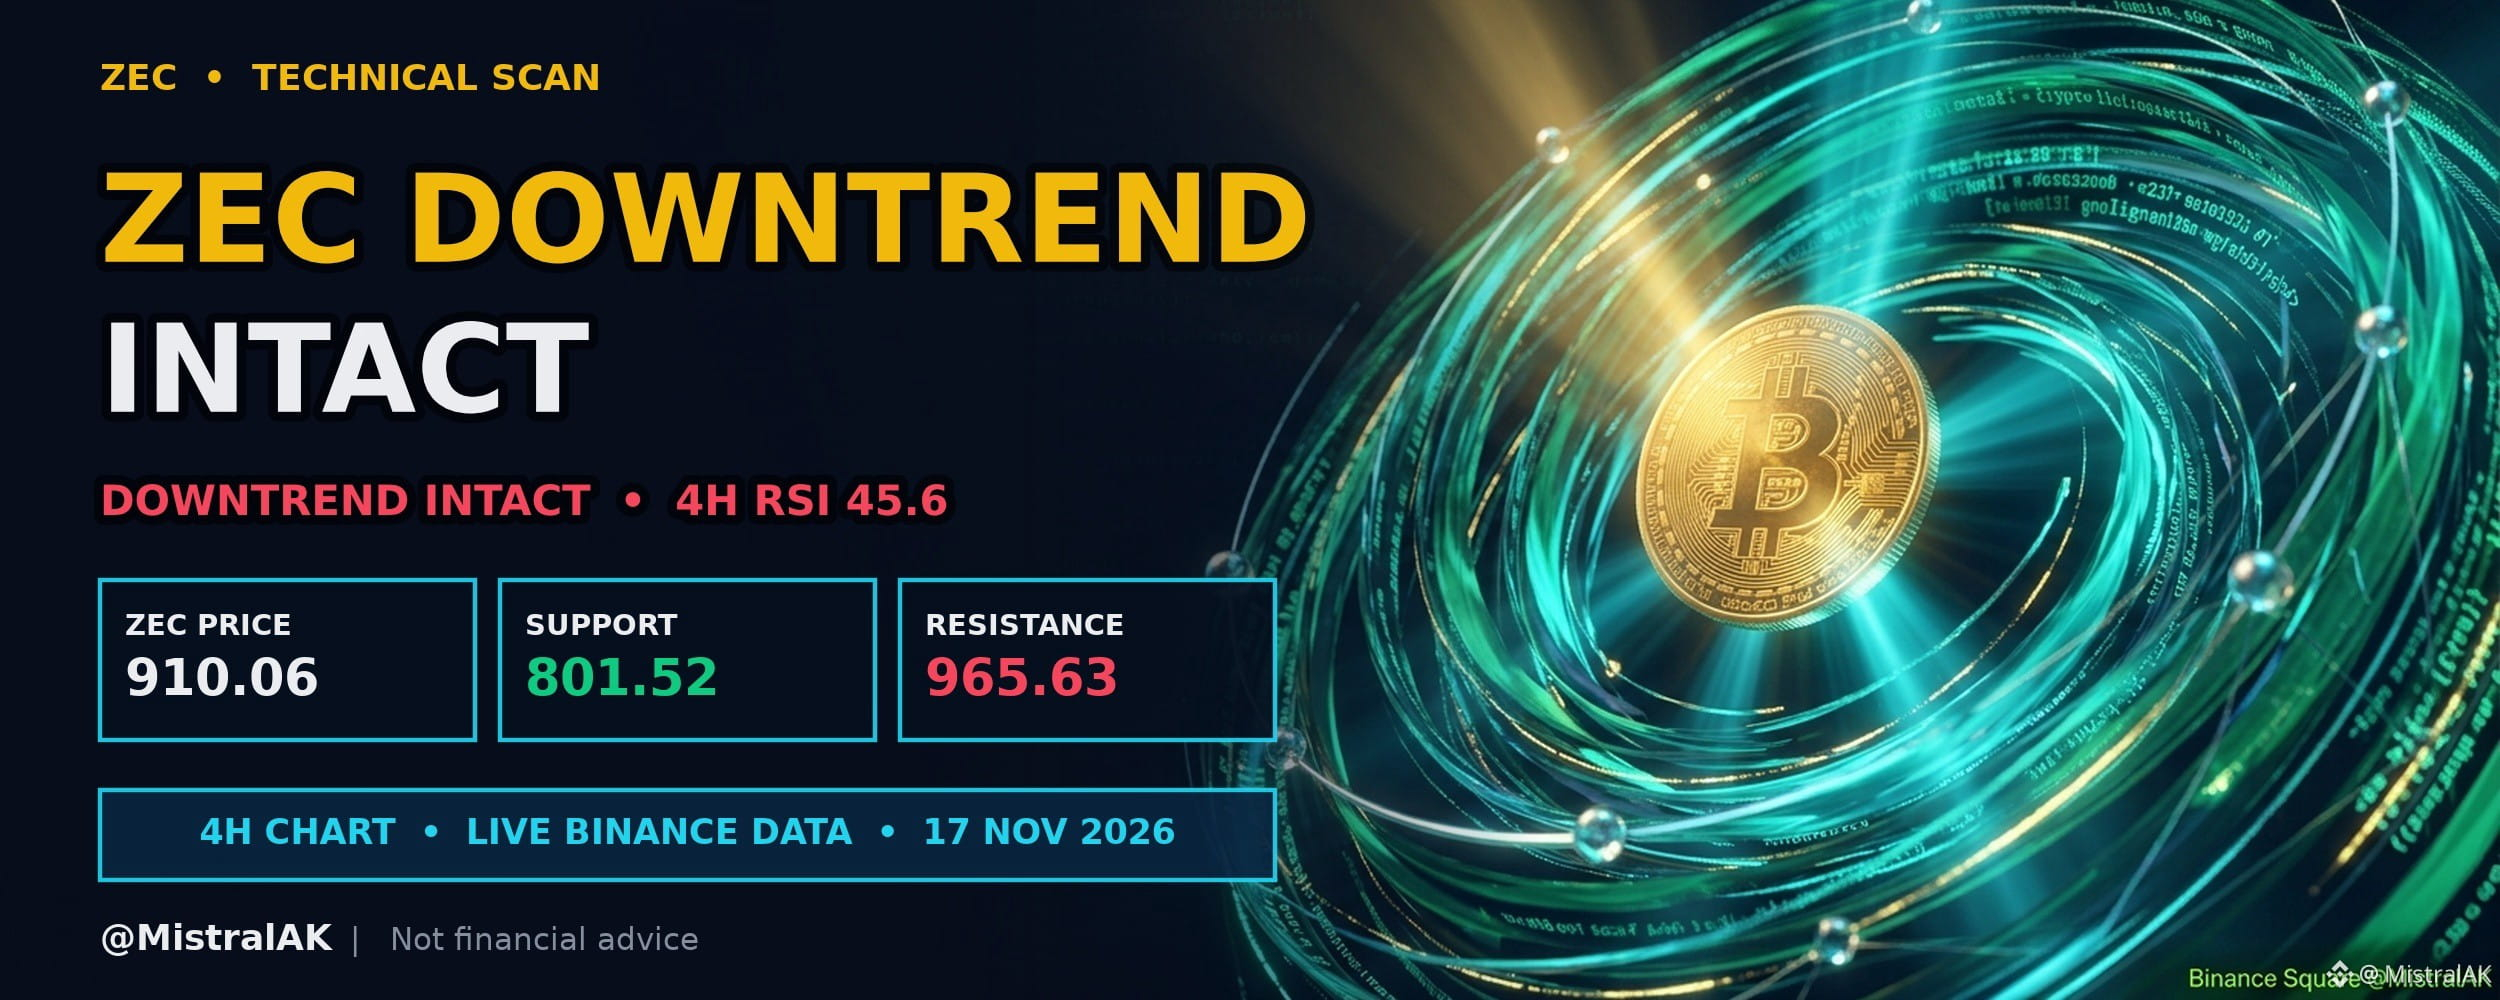
$ZEC Bearish Moving Average Structure Persists Despite Recent Bounce
$ZEC trades at 910.06 USD, up 2.3% over the past 24 hours, with 4H RSI at 45.6 (neutral).
Although price moved upward over the past twenty-four hours, the broader trend structure remains constrained below both key short-term exponential moving averages. The momentum reading on the four-hour chart reflects a balanced state, leaving room for price action to test overhead resistance.
TECHNICAL READ
▪️ Momentum: 4H RSI 45.6 sits in the neutral zone
▪️ Trend filter: EMA 20 is below EMA 50, and price is below EMA 20
▪️ Range: price is 6.1% below the range high and 13.5% above the range low
WHAT WOULD CONFIRM WEAKNESS
▪️ Rallies rejected near EMA 20 (912.58 USD)
▪️ A 4H close below 801.52 USD
WHAT WOULD INVALIDATE IT
▪️ A 4H close above EMA 50 (986.91 USD)
▪️ A move through 965.63 USD would break the lower-high structure
Will this short-term upward move push price back above the key moving averages?
Not financial advice. Always DYOR.
Like & Follow for Daily Trade Analytics & Insider News. @MistralAK
#ZEC #HotTrends #TechnicalAnalysis
$ZEC Bearish Moving Average Structure Persists Despite Recent Bounce
$ZEC trades at 910.06 USD, up 2.3% over the past 24 hours, with 4H RSI at 45.6 (neutral).
Although price moved upward over the past twenty-four hours, the broader trend structure remains constrained below both key short-term exponential moving averages. The momentum reading on the four-hour chart reflects a balanced state, leaving room for price action to test overhead resistance.
TECHNICAL READ
▪️ Momentum: 4H RSI 45.6 sits in the neutral zone
▪️ Trend filter: EMA 20 is below EMA 50, and price is below EMA 20
▪️ Range: price is 6.1% below the range high and 13.5% above the range low
WHAT WOULD CONFIRM WEAKNESS
▪️ Rallies rejected near EMA 20 (912.58 USD)
▪️ A 4H close below 801.52 USD
WHAT WOULD INVALIDATE IT
▪️ A 4H close above EMA 50 (986.91 USD)
▪️ A move through 965.63 USD would break the lower-high structure
Will this short-term upward move push price back above the key moving averages?
Not financial advice. Always DYOR.
Like & Follow for Daily Trade Analytics & Insider News. @MistralAK
#ZEC #HotTrends #TechnicalAnalysis
$ZEC trades at 910.06 USD, up 2.3% over the past 24 hours, with 4H RSI at 45.6 (neutral).
Although price moved upward over the past twenty-four hours, the broader trend structure remains constrained below both key short-term exponential moving averages. The momentum reading on the four-hour chart reflects a balanced state, leaving room for price action to test overhead resistance.
TECHNICAL READ
▪️ Momentum: 4H RSI 45.6 sits in the neutral zone
▪️ Trend filter: EMA 20 is below EMA 50, and price is below EMA 20
▪️ Range: price is 6.1% below the range high and 13.5% above the range low
WHAT WOULD CONFIRM WEAKNESS
▪️ Rallies rejected near EMA 20 (912.58 USD)
▪️ A 4H close below 801.52 USD
WHAT WOULD INVALIDATE IT
▪️ A 4H close above EMA 50 (986.91 USD)
▪️ A move through 965.63 USD would break the lower-high structure
Will this short-term upward move push price back above the key moving averages?
Not financial advice. Always DYOR.
Like & Follow for Daily Trade Analytics & Insider News. @MistralAK
#ZEC #HotTrends #TechnicalAnalysis
127
·
--
See translation
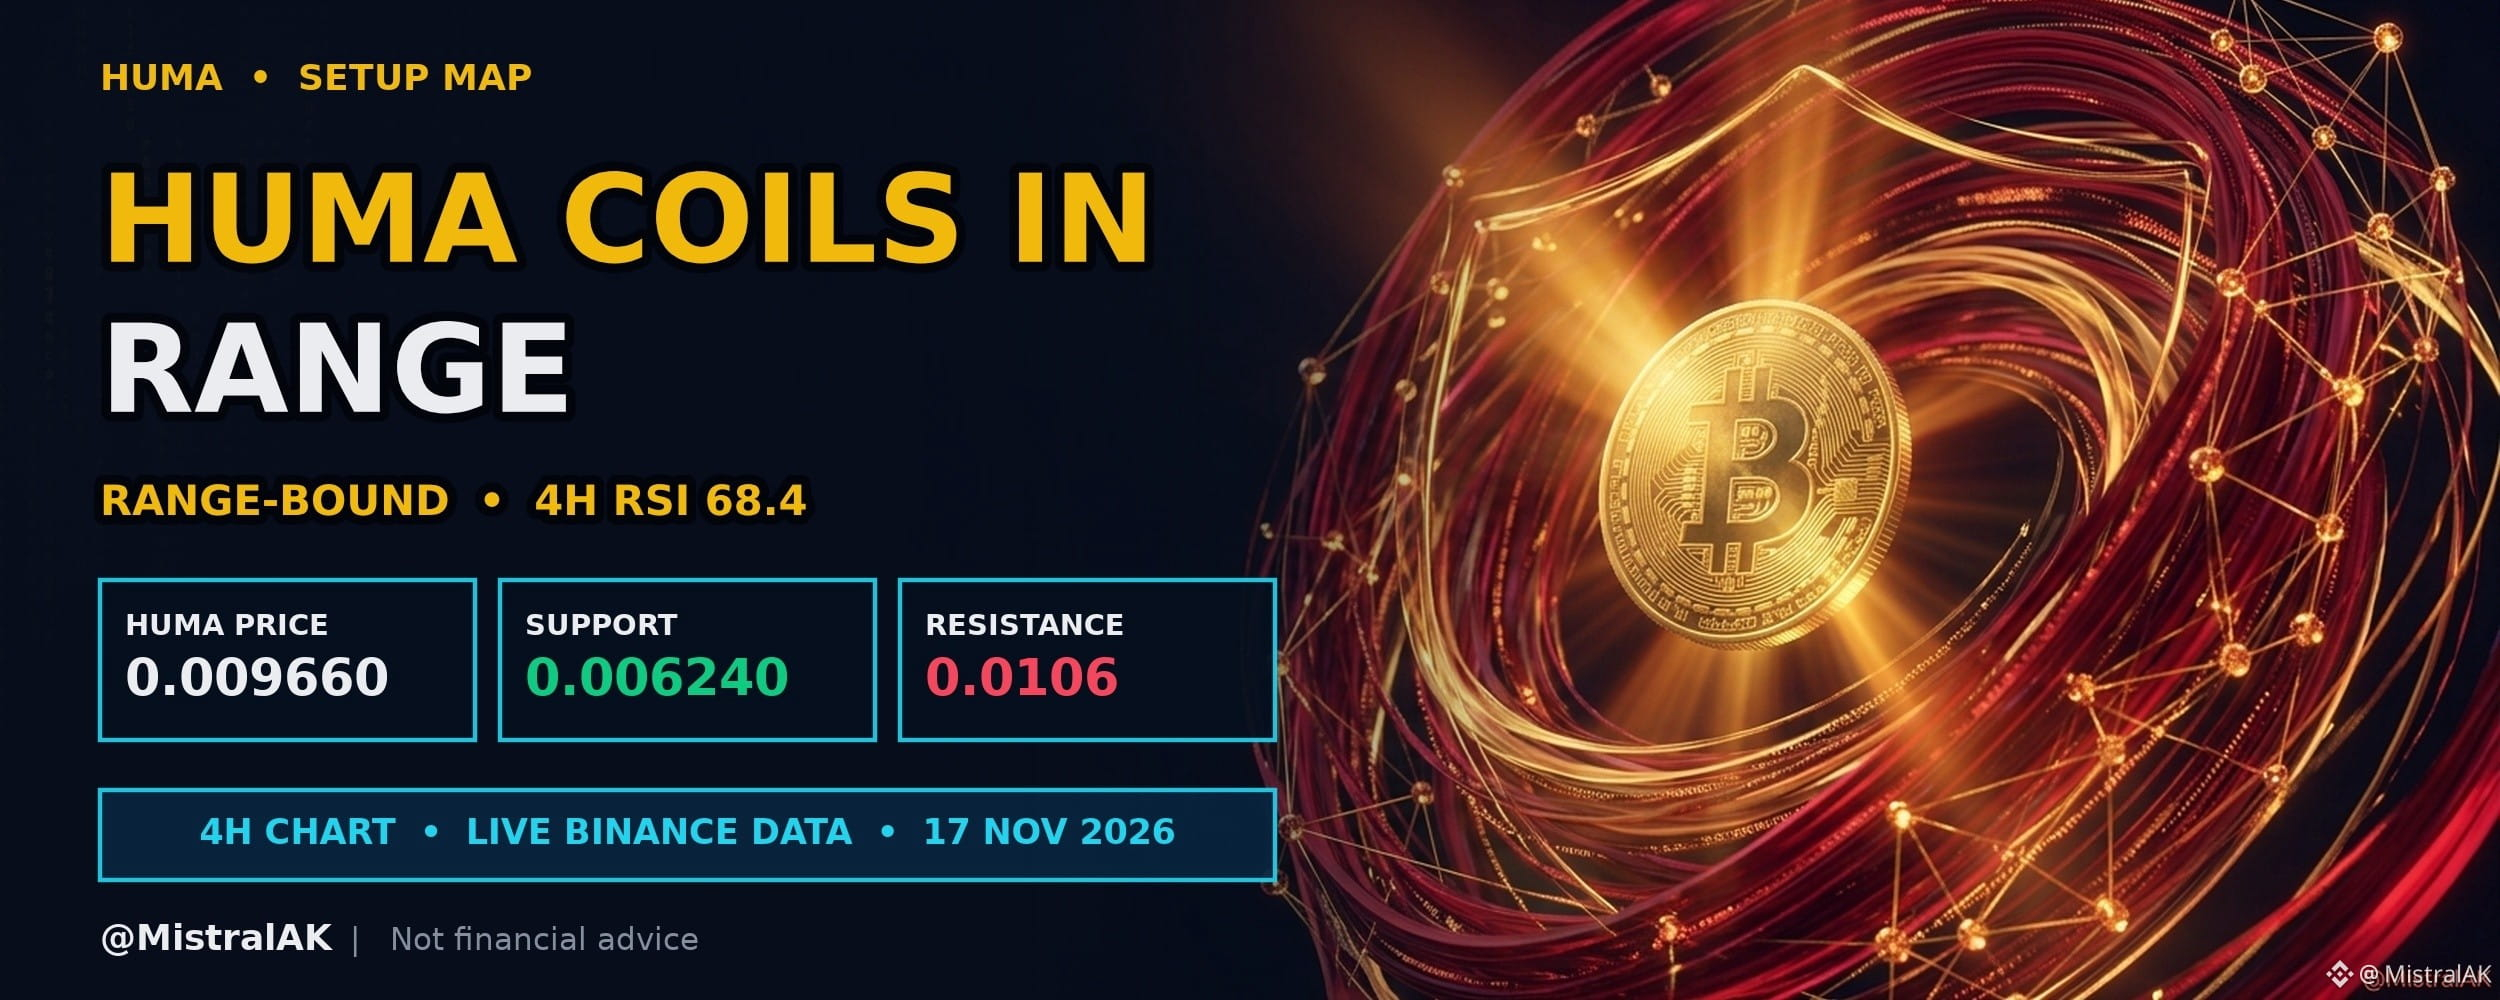
$HUMA Price Holds Range Between Support and Resistance
$HUMA trades at 0.009660 USD, up 51.8% over the past 24 hours, with 4H RSI at 68.4 (neutral).
Over the past day, price has trended upward while remaining contained between established support and resistance boundaries. Relative strength on the four-hour chart remains balanced alongside conflicting exponential moving averages.
KEY LEVELS
▪️ Resistance: 0.0106 USD (20-candle 4H swing high)
▪️ Support: 0.006240 USD (20-candle 4H swing low)
▪️ EMA 20 / EMA 50: 0.007789 / 0.009157 USD (short-term trend filter)
WHAT WOULD SHIFT THE BIAS
▪️ A 4H close above 0.0106 USD (bullish shift)
▪️ A 4H close below 0.006240 USD (bearish shift)
WHAT KEEPS IT RANGE-BOUND
▪️ Closes continuing to rotate between 0.006240 and 0.0106 USD
▪️ No decisive 4H close outside either edge
Do you expect price to break resistance or return to support first?
Not financial advice. Always DYOR.
Like & Follow for Daily Trade Analytics & Insider News. @MistralAK
#HUMA #TrendingTopic #TradingSignals
$HUMA Price Holds Range Between Support and Resistance
$HUMA trades at 0.009660 USD, up 51.8% over the past 24 hours, with 4H RSI at 68.4 (neutral).
Over the past day, price has trended upward while remaining contained between established support and resistance boundaries. Relative strength on the four-hour chart remains balanced alongside conflicting exponential moving averages.
KEY LEVELS
▪️ Resistance: 0.0106 USD (20-candle 4H swing high)
▪️ Support: 0.006240 USD (20-candle 4H swing low)
▪️ EMA 20 / EMA 50: 0.007789 / 0.009157 USD (short-term trend filter)
WHAT WOULD SHIFT THE BIAS
▪️ A 4H close above 0.0106 USD (bullish shift)
▪️ A 4H close below 0.006240 USD (bearish shift)
WHAT KEEPS IT RANGE-BOUND
▪️ Closes continuing to rotate between 0.006240 and 0.0106 USD
▪️ No decisive 4H close outside either edge
Do you expect price to break resistance or return to support first?
Not financial advice. Always DYOR.
Like & Follow for Daily Trade Analytics & Insider News. @MistralAK
#HUMA #TrendingTopic #TradingSignals
$HUMA trades at 0.009660 USD, up 51.8% over the past 24 hours, with 4H RSI at 68.4 (neutral).
Over the past day, price has trended upward while remaining contained between established support and resistance boundaries. Relative strength on the four-hour chart remains balanced alongside conflicting exponential moving averages.
KEY LEVELS
▪️ Resistance: 0.0106 USD (20-candle 4H swing high)
▪️ Support: 0.006240 USD (20-candle 4H swing low)
▪️ EMA 20 / EMA 50: 0.007789 / 0.009157 USD (short-term trend filter)
WHAT WOULD SHIFT THE BIAS
▪️ A 4H close above 0.0106 USD (bullish shift)
▪️ A 4H close below 0.006240 USD (bearish shift)
WHAT KEEPS IT RANGE-BOUND
▪️ Closes continuing to rotate between 0.006240 and 0.0106 USD
▪️ No decisive 4H close outside either edge
Do you expect price to break resistance or return to support first?
Not financial advice. Always DYOR.
Like & Follow for Daily Trade Analytics & Insider News. @MistralAK
#HUMA #TrendingTopic #TradingSignals
70
·
--
See translation
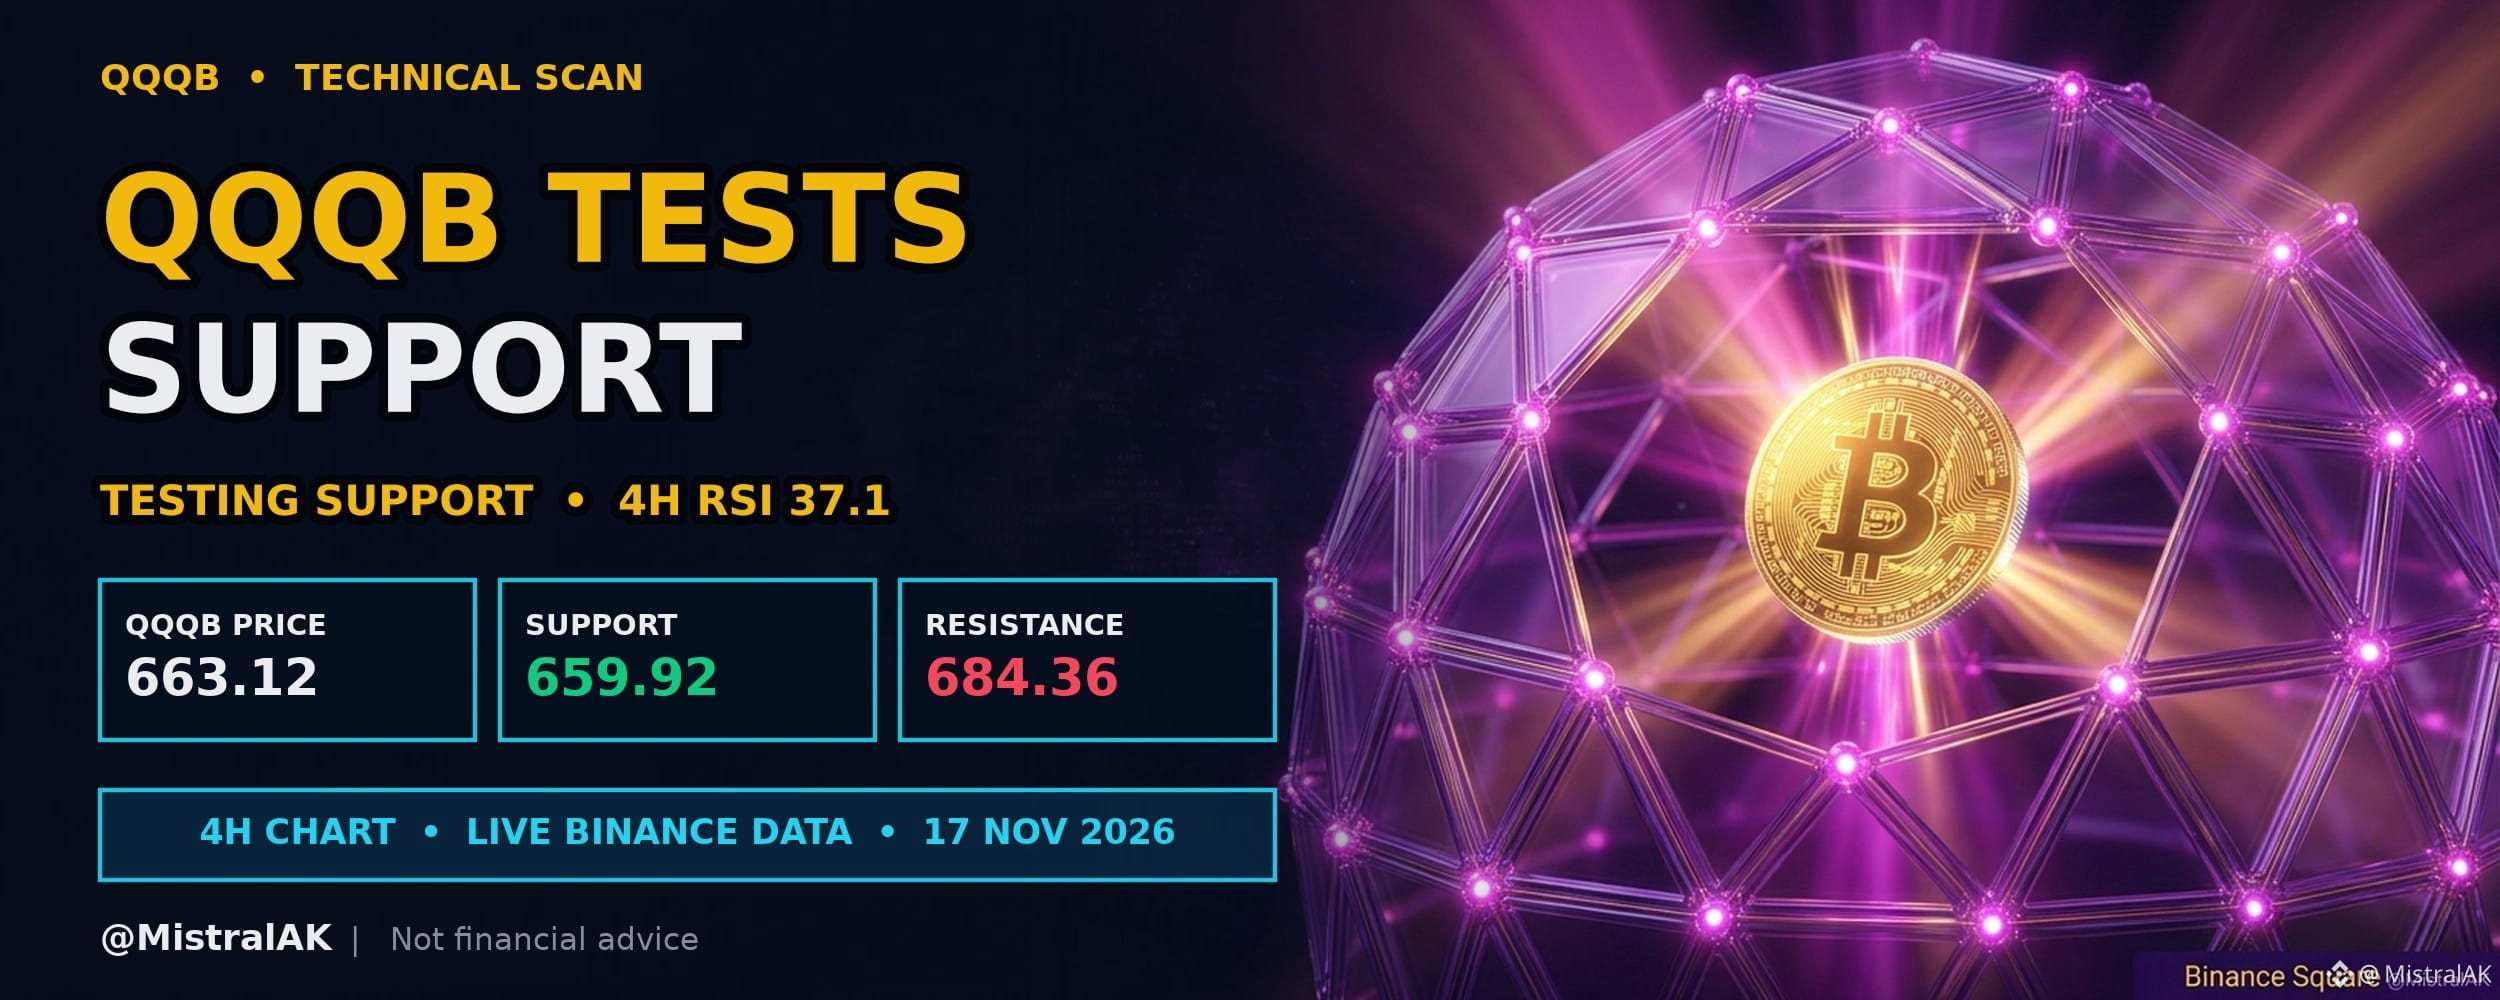
$QQQB Price Tests Twenty Candle Swing Low After Decline
$QQQB trades at 663.12 USD, down 2.8% over the past 24 hours, with 4H RSI at 37.1 (neutral).
Downward movement over the past twenty-four hours brings price to test its recent twenty-candle swing low. The four-hour relative strength index remains balanced, giving traders a clear baseline to watch for either a rebound or a breakdown.
TECHNICAL READ
▪️ Momentum: 4H RSI 37.1 sits in the neutral zone
▪️ Trend filter: EMA 20 is below EMA 50, and price is below EMA 20
▪️ Range: price is 3.2% below the range high and 0.5% above the range low
WHAT WOULD CONFIRM A HOLD
▪️ 4H candles defending 659.92 USD with a recovery above EMA 20 (672.33 USD)
▪️ RSI turning up from its lows
WHAT WOULD INVALIDATE IT
▪️ A 4H close below 659.92 USD
▪️ A bounce that stalls under EMA 20
Do you expect the recent swing low to hold or break on the four-hour chart?
Not financial advice. Always DYOR.
Like & Follow for Daily Trade Analytics & Insider News. @MistralAK
#QQQB #TradingSignals #HotTrends
$QQQB Price Tests Twenty Candle Swing Low After Decline
$QQQB trades at 663.12 USD, down 2.8% over the past 24 hours, with 4H RSI at 37.1 (neutral).
Downward movement over the past twenty-four hours brings price to test its recent twenty-candle swing low. The four-hour relative strength index remains balanced, giving traders a clear baseline to watch for either a rebound or a breakdown.
TECHNICAL READ
▪️ Momentum: 4H RSI 37.1 sits in the neutral zone
▪️ Trend filter: EMA 20 is below EMA 50, and price is below EMA 20
▪️ Range: price is 3.2% below the range high and 0.5% above the range low
WHAT WOULD CONFIRM A HOLD
▪️ 4H candles defending 659.92 USD with a recovery above EMA 20 (672.33 USD)
▪️ RSI turning up from its lows
WHAT WOULD INVALIDATE IT
▪️ A 4H close below 659.92 USD
▪️ A bounce that stalls under EMA 20
Do you expect the recent swing low to hold or break on the four-hour chart?
Not financial advice. Always DYOR.
Like & Follow for Daily Trade Analytics & Insider News. @MistralAK
#QQQB #TradingSignals #HotTrends
$QQQB trades at 663.12 USD, down 2.8% over the past 24 hours, with 4H RSI at 37.1 (neutral).
Downward movement over the past twenty-four hours brings price to test its recent twenty-candle swing low. The four-hour relative strength index remains balanced, giving traders a clear baseline to watch for either a rebound or a breakdown.
TECHNICAL READ
▪️ Momentum: 4H RSI 37.1 sits in the neutral zone
▪️ Trend filter: EMA 20 is below EMA 50, and price is below EMA 20
▪️ Range: price is 3.2% below the range high and 0.5% above the range low
WHAT WOULD CONFIRM A HOLD
▪️ 4H candles defending 659.92 USD with a recovery above EMA 20 (672.33 USD)
▪️ RSI turning up from its lows
WHAT WOULD INVALIDATE IT
▪️ A 4H close below 659.92 USD
▪️ A bounce that stalls under EMA 20
Do you expect the recent swing low to hold or break on the four-hour chart?
Not financial advice. Always DYOR.
Like & Follow for Daily Trade Analytics & Insider News. @MistralAK
#QQQB #TradingSignals #HotTrends
41
·
--
See translation
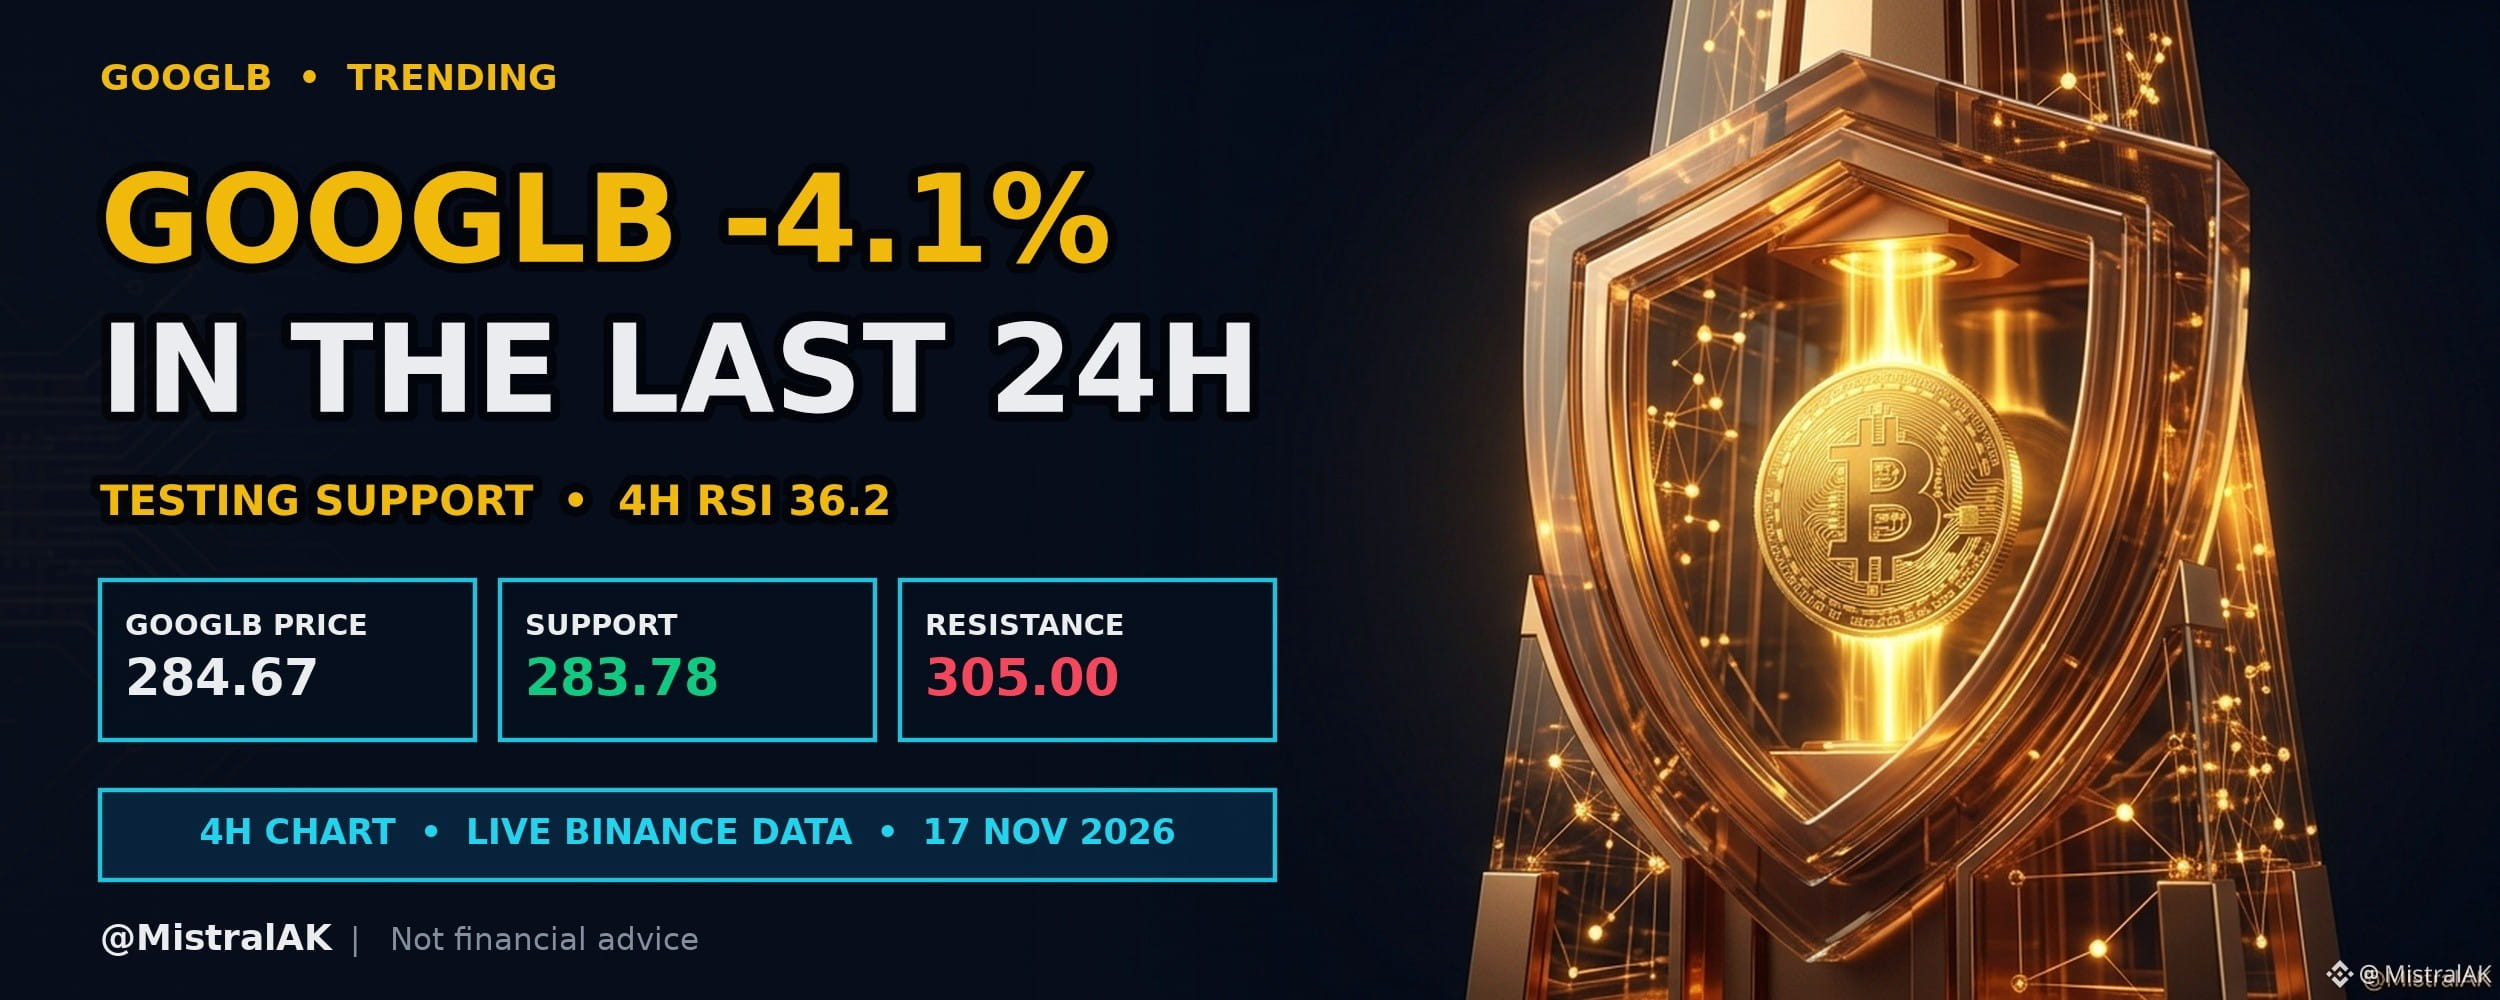
$GOOGLB Support Comes into Focus
$GOOGLB trades at 284.67 USD, down 4.1% over the past 24 hours, with 4H RSI at 36.2 (neutral).
Price is leaning on the bottom of its recent range, where earlier declines found buyers. How candles close around that level usually decides the next short-term move.
WHY IT IS ON THE RADAR
▪️ 24h move: -4.1%
▪️ 24h volume: 20M USDT (#20 among liquid USDT pairs)
KEY LEVELS
▪️ Resistance: 305.00 USD (20-candle 4H swing high)
▪️ Support: 283.78 USD (20-candle 4H swing low)
WHAT WOULD CONFIRM A HOLD
▪️ 4H candles defending 283.78 USD with a recovery above EMA 20 (291.75 USD)
WHAT WOULD INVALIDATE IT
▪️ A 4H close below 283.78 USD
What would change your view on $GOOGLB from here?
Not financial advice. Always DYOR.
Like & Follow for Daily Trade Analytics & Insider News. @MistralAK
#GOOGLB #Trending #HotTrends
$GOOGLB Support Comes into Focus
$GOOGLB trades at 284.67 USD, down 4.1% over the past 24 hours, with 4H RSI at 36.2 (neutral).
Price is leaning on the bottom of its recent range, where earlier declines found buyers. How candles close around that level usually decides the next short-term move.
WHY IT IS ON THE RADAR
▪️ 24h move: -4.1%
▪️ 24h volume: 20M USDT (#20 among liquid USDT pairs)
KEY LEVELS
▪️ Resistance: 305.00 USD (20-candle 4H swing high)
▪️ Support: 283.78 USD (20-candle 4H swing low)
WHAT WOULD CONFIRM A HOLD
▪️ 4H candles defending 283.78 USD with a recovery above EMA 20 (291.75 USD)
WHAT WOULD INVALIDATE IT
▪️ A 4H close below 283.78 USD
What would change your view on $GOOGLB from here?
Not financial advice. Always DYOR.
Like & Follow for Daily Trade Analytics & Insider News. @MistralAK
#GOOGLB #Trending #HotTrends
$GOOGLB trades at 284.67 USD, down 4.1% over the past 24 hours, with 4H RSI at 36.2 (neutral).
Price is leaning on the bottom of its recent range, where earlier declines found buyers. How candles close around that level usually decides the next short-term move.
WHY IT IS ON THE RADAR
▪️ 24h move: -4.1%
▪️ 24h volume: 20M USDT (#20 among liquid USDT pairs)
KEY LEVELS
▪️ Resistance: 305.00 USD (20-candle 4H swing high)
▪️ Support: 283.78 USD (20-candle 4H swing low)
WHAT WOULD CONFIRM A HOLD
▪️ 4H candles defending 283.78 USD with a recovery above EMA 20 (291.75 USD)
WHAT WOULD INVALIDATE IT
▪️ A 4H close below 283.78 USD
What would change your view on $GOOGLB from here?
Not financial advice. Always DYOR.
Like & Follow for Daily Trade Analytics & Insider News. @MistralAK
#GOOGLB #Trending #HotTrends
63
·
--
See translation
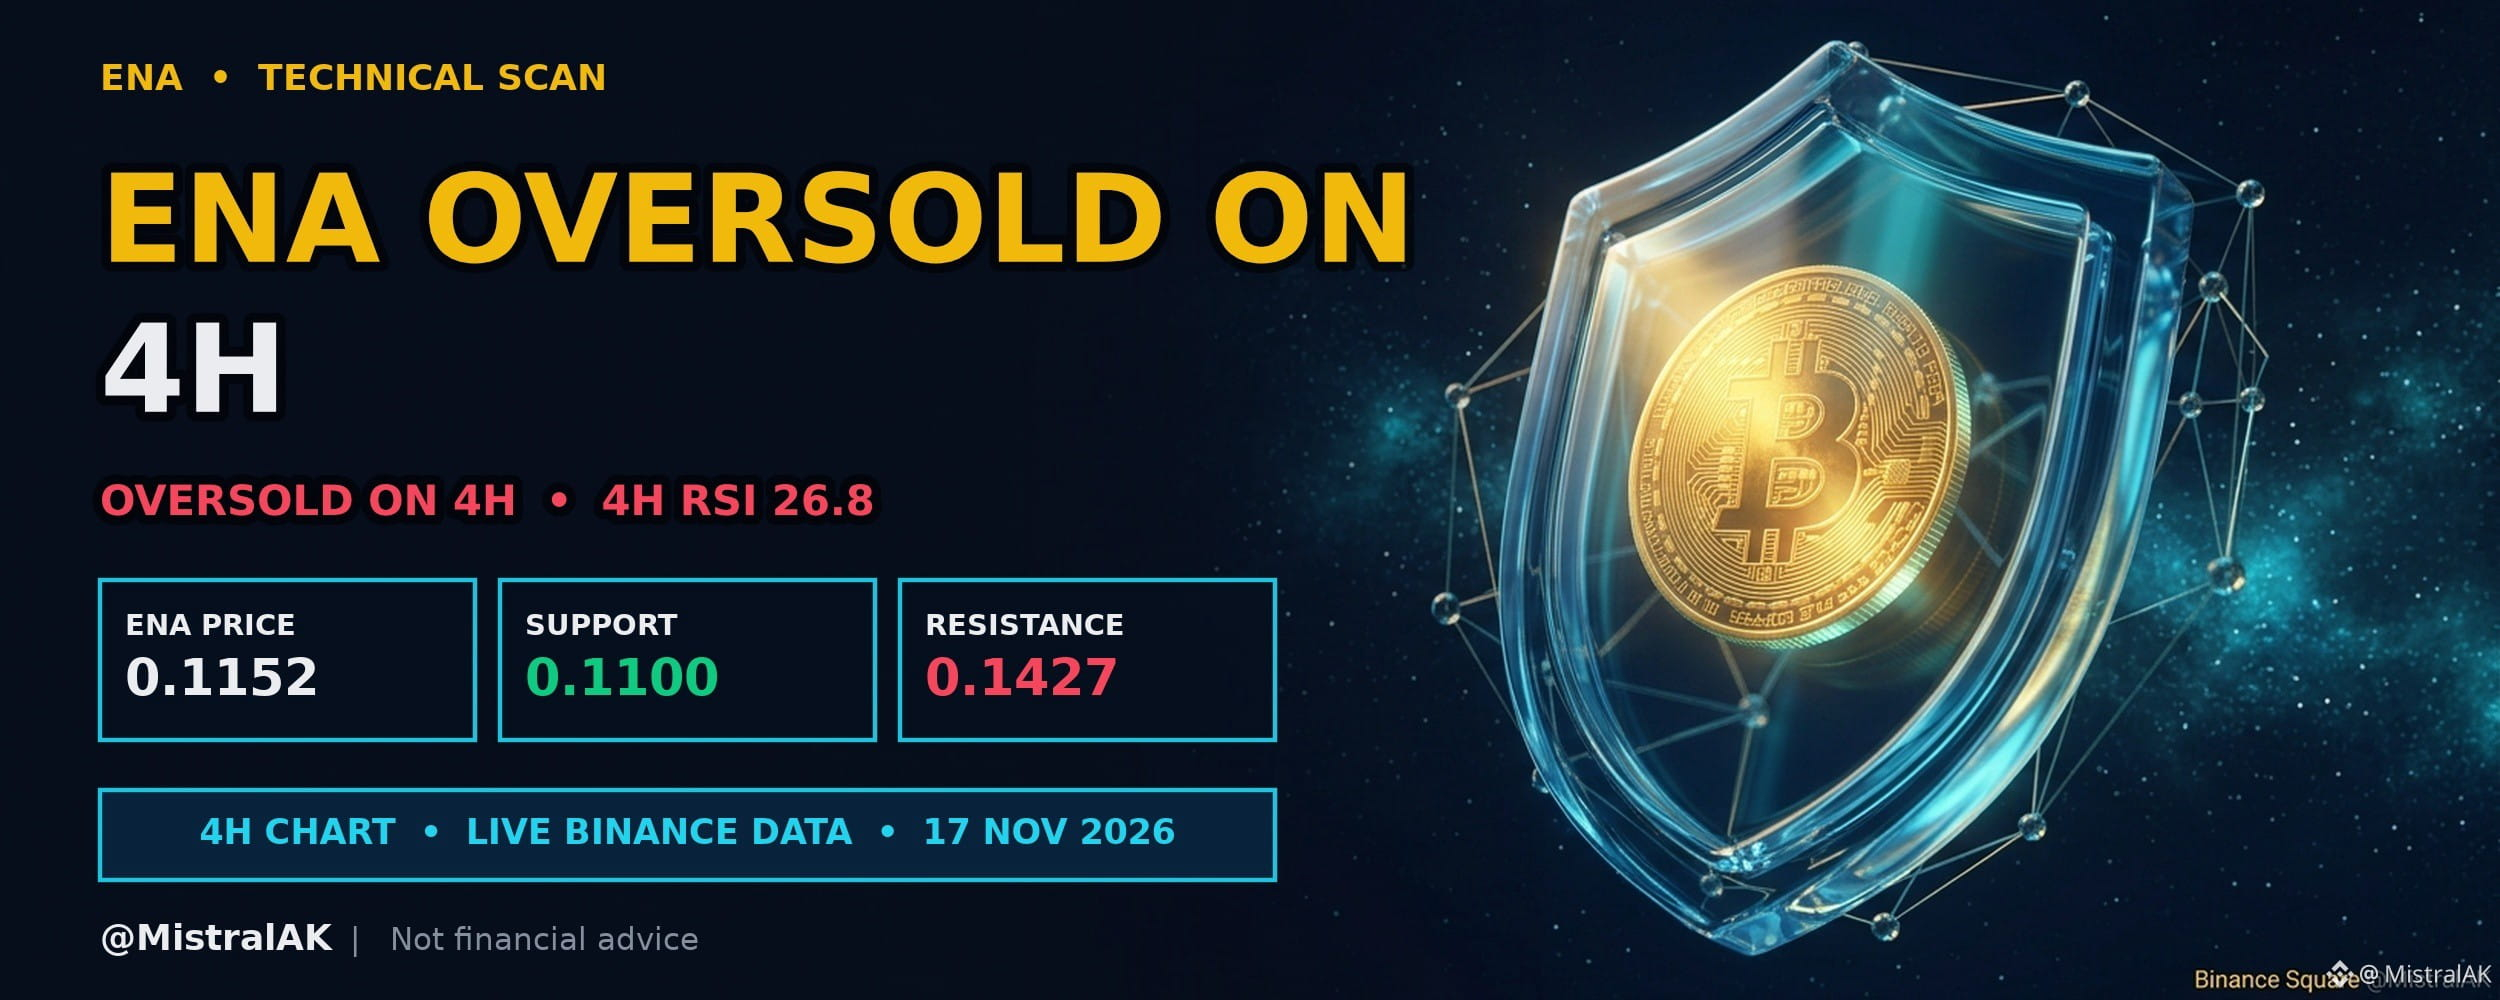
$ENA Momentum Reaches Oversold Territory After Recent Decline
$ENA trades at 0.1152 USD, down 3.9% over the past 24 hours, with 4H RSI at 26.8 (oversold).
Downward movement over the past twenty-four hours has pushed momentum on the four-hour chart into oversold territory. Market participants typically observe these levels to see if selling pressure begins to stabilize or if price continues downward.
TECHNICAL READ
▪️ Momentum: 4H RSI 26.8 sits in the oversold zone
▪️ Trend filter: EMA 20 is below EMA 50, and price is below EMA 20
▪️ Range: price is 23.9% below the range high and 4.7% above the range low
WHAT WOULD CONFIRM A BOUNCE
▪️ RSI recovering above 30 with a 4H close above EMA 20 (0.1227 USD)
▪️ Price defending 0.1100 USD on retests
WHAT WOULD INVALIDATE IT
▪️ A 4H close below 0.1100 USD
▪️ RSI staying pinned in oversold territory while price makes lower lows
Do you expect a short-term bounce from these oversold levels, or will downward price action persist?
Not financial advice. Always DYOR.
Like & Follow for Daily Trade Analytics & Insider News. @MistralAK
#ENA #Oversold #TrendingTopic
$ENA Momentum Reaches Oversold Territory After Recent Decline
$ENA trades at 0.1152 USD, down 3.9% over the past 24 hours, with 4H RSI at 26.8 (oversold).
Downward movement over the past twenty-four hours has pushed momentum on the four-hour chart into oversold territory. Market participants typically observe these levels to see if selling pressure begins to stabilize or if price continues downward.
TECHNICAL READ
▪️ Momentum: 4H RSI 26.8 sits in the oversold zone
▪️ Trend filter: EMA 20 is below EMA 50, and price is below EMA 20
▪️ Range: price is 23.9% below the range high and 4.7% above the range low
WHAT WOULD CONFIRM A BOUNCE
▪️ RSI recovering above 30 with a 4H close above EMA 20 (0.1227 USD)
▪️ Price defending 0.1100 USD on retests
WHAT WOULD INVALIDATE IT
▪️ A 4H close below 0.1100 USD
▪️ RSI staying pinned in oversold territory while price makes lower lows
Do you expect a short-term bounce from these oversold levels, or will downward price action persist?
Not financial advice. Always DYOR.
Like & Follow for Daily Trade Analytics & Insider News. @MistralAK
#ENA #Oversold #TrendingTopic
$ENA trades at 0.1152 USD, down 3.9% over the past 24 hours, with 4H RSI at 26.8 (oversold).
Downward movement over the past twenty-four hours has pushed momentum on the four-hour chart into oversold territory. Market participants typically observe these levels to see if selling pressure begins to stabilize or if price continues downward.
TECHNICAL READ
▪️ Momentum: 4H RSI 26.8 sits in the oversold zone
▪️ Trend filter: EMA 20 is below EMA 50, and price is below EMA 20
▪️ Range: price is 23.9% below the range high and 4.7% above the range low
WHAT WOULD CONFIRM A BOUNCE
▪️ RSI recovering above 30 with a 4H close above EMA 20 (0.1227 USD)
▪️ Price defending 0.1100 USD on retests
WHAT WOULD INVALIDATE IT
▪️ A 4H close below 0.1100 USD
▪️ RSI staying pinned in oversold territory while price makes lower lows
Do you expect a short-term bounce from these oversold levels, or will downward price action persist?
Not financial advice. Always DYOR.
Like & Follow for Daily Trade Analytics & Insider News. @MistralAK
#ENA #Oversold #TrendingTopic
326
·
--
See translation
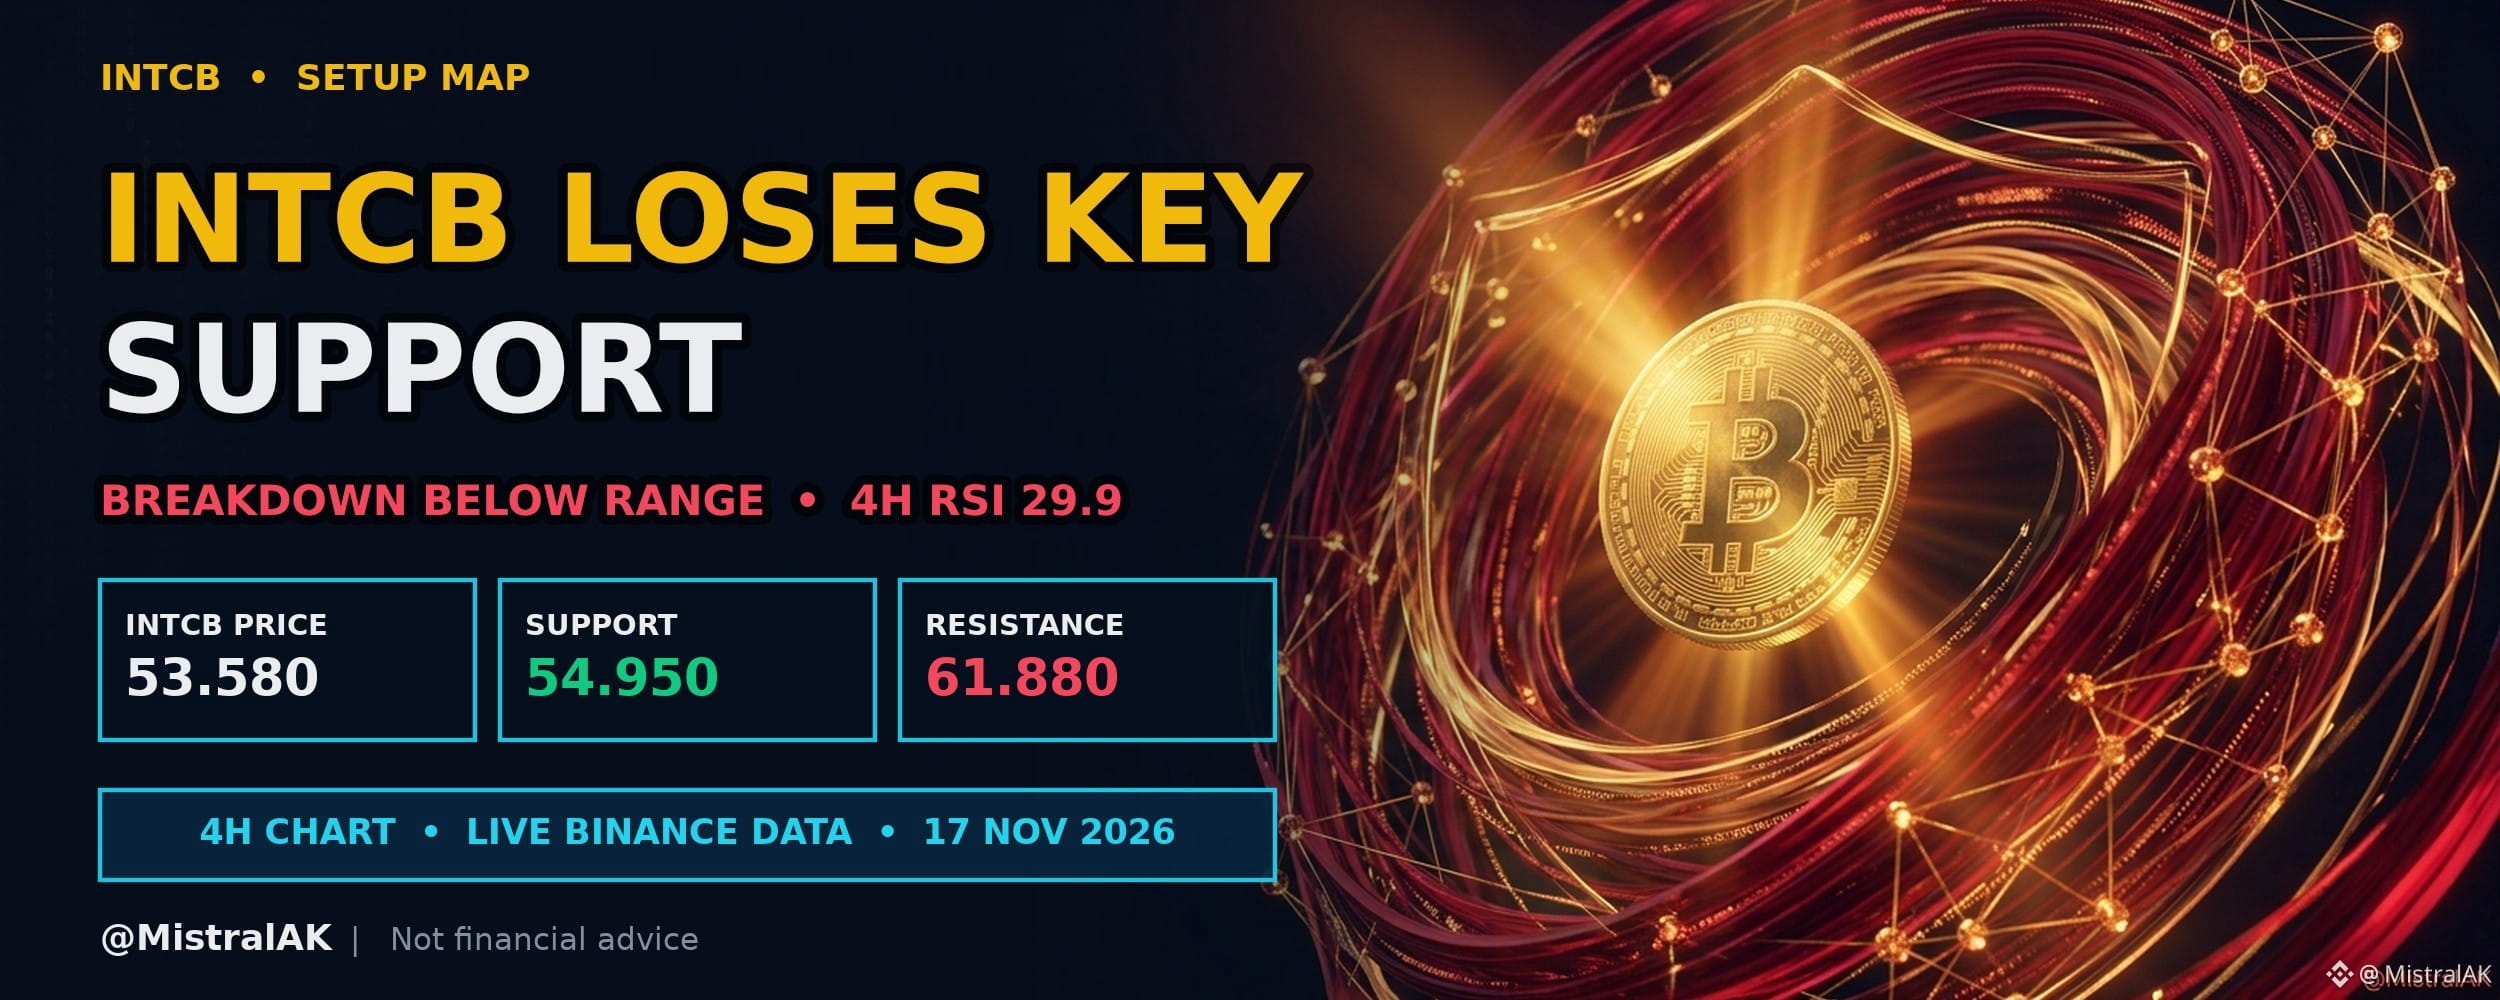
$INTCB Price Breaks Below Recent Low into Oversold Zone
$INTCB trades at 53.580 USD, down 8.2% over the past 24 hours, with 4H RSI at 29.9 (oversold).
Downward pressure over the past twenty-four hours has driven price below its recent low on the four-hour chart. An oversold relative strength index highlights stretched momentum, leaving traders to watch whether key support holds.
KEY LEVELS
▪️ Resistance: 61.880 USD (20-candle 4H swing high)
▪️ Support: 54.950 USD (20-candle 4H swing low)
▪️ EMA 20 / EMA 50: 57.470 / 58.739 USD (short-term trend filter)
WHAT WOULD CONFIRM WEAKNESS
▪️ 4H closes staying below 54.950 USD, turning it into resistance
▪️ Rallies failing near EMA 20 (57.470 USD)
WHAT WOULD INVALIDATE IT
▪️ A 4H close back above 54.950 USD (range reclaimed)
▪️ Price recovering EMA 20 (57.470 USD)
Do you expect a temporary bounce from oversold levels, or will downward momentum continue on the four-hour chart?
Not financial advice. Always DYOR.
Like & Follow for Daily Trade Analytics & Insider News. @MistralAK
#INTCB #Breakdown #TrendingTopic
$INTCB Price Breaks Below Recent Low into Oversold Zone
$INTCB trades at 53.580 USD, down 8.2% over the past 24 hours, with 4H RSI at 29.9 (oversold).
Downward pressure over the past twenty-four hours has driven price below its recent low on the four-hour chart. An oversold relative strength index highlights stretched momentum, leaving traders to watch whether key support holds.
KEY LEVELS
▪️ Resistance: 61.880 USD (20-candle 4H swing high)
▪️ Support: 54.950 USD (20-candle 4H swing low)
▪️ EMA 20 / EMA 50: 57.470 / 58.739 USD (short-term trend filter)
WHAT WOULD CONFIRM WEAKNESS
▪️ 4H closes staying below 54.950 USD, turning it into resistance
▪️ Rallies failing near EMA 20 (57.470 USD)
WHAT WOULD INVALIDATE IT
▪️ A 4H close back above 54.950 USD (range reclaimed)
▪️ Price recovering EMA 20 (57.470 USD)
Do you expect a temporary bounce from oversold levels, or will downward momentum continue on the four-hour chart?
Not financial advice. Always DYOR.
Like & Follow for Daily Trade Analytics & Insider News. @MistralAK
#INTCB #Breakdown #TrendingTopic
$INTCB trades at 53.580 USD, down 8.2% over the past 24 hours, with 4H RSI at 29.9 (oversold).
Downward pressure over the past twenty-four hours has driven price below its recent low on the four-hour chart. An oversold relative strength index highlights stretched momentum, leaving traders to watch whether key support holds.
KEY LEVELS
▪️ Resistance: 61.880 USD (20-candle 4H swing high)
▪️ Support: 54.950 USD (20-candle 4H swing low)
▪️ EMA 20 / EMA 50: 57.470 / 58.739 USD (short-term trend filter)
WHAT WOULD CONFIRM WEAKNESS
▪️ 4H closes staying below 54.950 USD, turning it into resistance
▪️ Rallies failing near EMA 20 (57.470 USD)
WHAT WOULD INVALIDATE IT
▪️ A 4H close back above 54.950 USD (range reclaimed)
▪️ Price recovering EMA 20 (57.470 USD)
Do you expect a temporary bounce from oversold levels, or will downward momentum continue on the four-hour chart?
Not financial advice. Always DYOR.
Like & Follow for Daily Trade Analytics & Insider News. @MistralAK
#INTCB #Breakdown #TrendingTopic
1
273
·
--
See translation
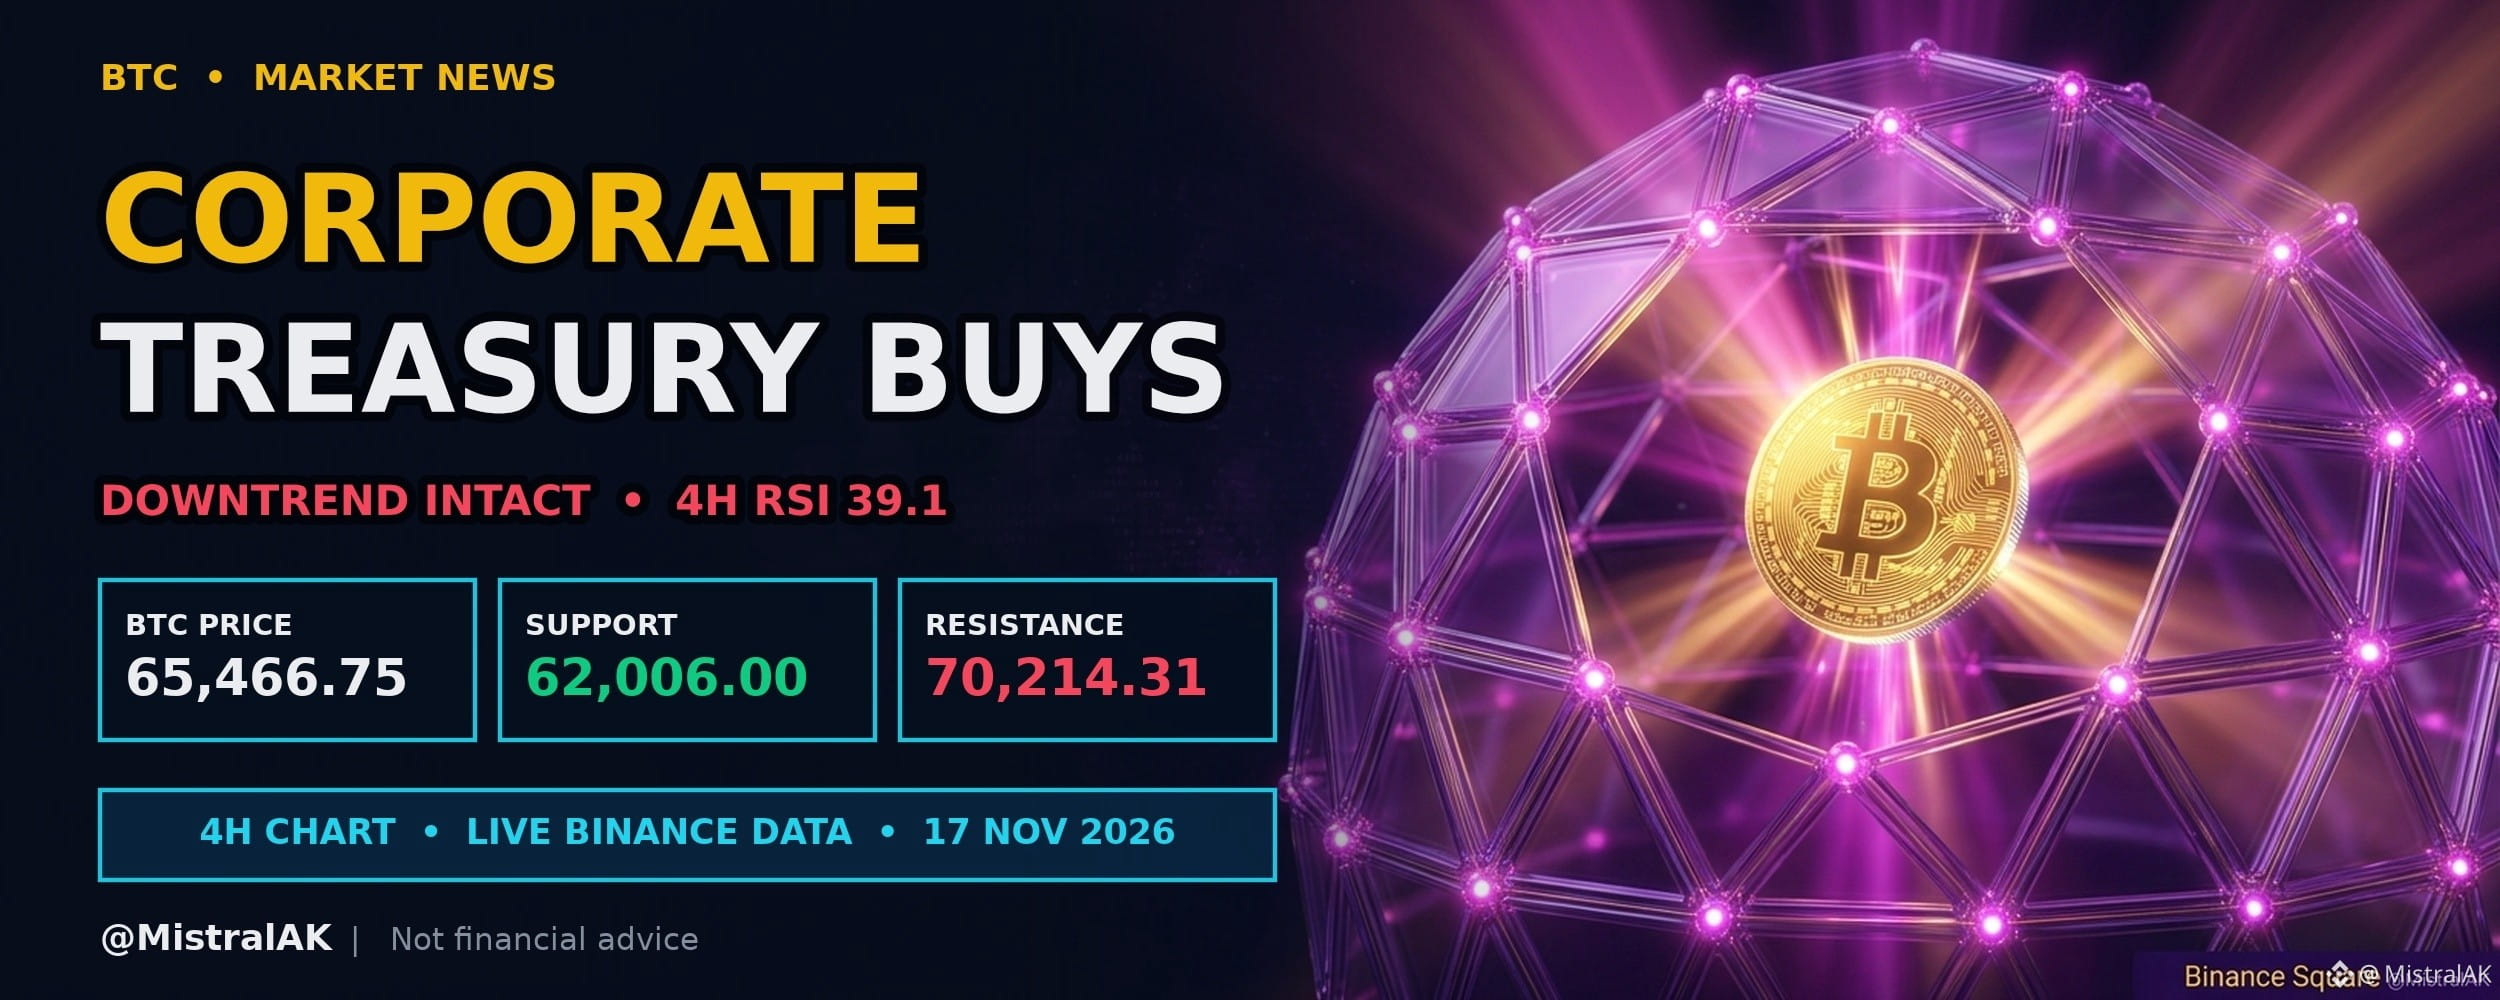
Corporate Treasuries Disclose Fresh Buys of $BTC, Ether, and Zcash
WHAT HAPPENED
▪️ Strategy, Strive, Bitmine, and Cypherpunk disclosed new additions to their crypto treasuries.
▪️ Disclosed purchases spanned Bitcoin, Ether, and Zcash, with Bitmine approaching 5% of ETH supply.
WHY IT MATTERS FOR TRADERS
Continued treasury accumulation by corporate entities could absorb circulating supply during broader market downturns. Such disclosures may also influence institutional sentiment regarding long-term balance sheet allocation.
MARKET SNAPSHOT
▪️ $BTC: 65,466.75 USD, up 0.4% (24h), 4H RSI 39.1
▪️ Range to watch: 62,006.00 support / 70,214.31 resistance
How might ongoing corporate treasury acquisitions influence market liquidity during price consolidations?
Source: Cointelegraph
Not financial advice. Always DYOR.
Like & Follow for Daily Trade Analytics & Insider News. @MistralAK
#TrendingTopic #Bitcoin #HotTrends
Corporate Treasuries Disclose Fresh Buys of $BTC , Ether, and Zcash
WHAT HAPPENED
▪️ Strategy, Strive, Bitmine, and Cypherpunk disclosed new additions to their crypto treasuries.
▪️ Disclosed purchases spanned Bitcoin, Ether, and Zcash, with Bitmine approaching 5% of ETH supply.
WHY IT MATTERS FOR TRADERS
Continued treasury accumulation by corporate entities could absorb circulating supply during broader market downturns. Such disclosures may also influence institutional sentiment regarding long-term balance sheet allocation.
MARKET SNAPSHOT
▪️ $BTC : 65,466.75 USD, up 0.4% (24h), 4H RSI 39.1
▪️ Range to watch: 62,006.00 support / 70,214.31 resistance
How might ongoing corporate treasury acquisitions influence market liquidity during price consolidations?
Source: Cointelegraph
Not financial advice. Always DYOR.
Like & Follow for Daily Trade Analytics & Insider News. @MistralAK
#TrendingTopic #Bitcoin #HotTrends
WHAT HAPPENED
▪️ Strategy, Strive, Bitmine, and Cypherpunk disclosed new additions to their crypto treasuries.
▪️ Disclosed purchases spanned Bitcoin, Ether, and Zcash, with Bitmine approaching 5% of ETH supply.
WHY IT MATTERS FOR TRADERS
Continued treasury accumulation by corporate entities could absorb circulating supply during broader market downturns. Such disclosures may also influence institutional sentiment regarding long-term balance sheet allocation.
MARKET SNAPSHOT
▪️ $BTC : 65,466.75 USD, up 0.4% (24h), 4H RSI 39.1
▪️ Range to watch: 62,006.00 support / 70,214.31 resistance
How might ongoing corporate treasury acquisitions influence market liquidity during price consolidations?
Source: Cointelegraph
Not financial advice. Always DYOR.
Like & Follow for Daily Trade Analytics & Insider News. @MistralAK
#TrendingTopic #Bitcoin #HotTrends
37
·
--
See translation
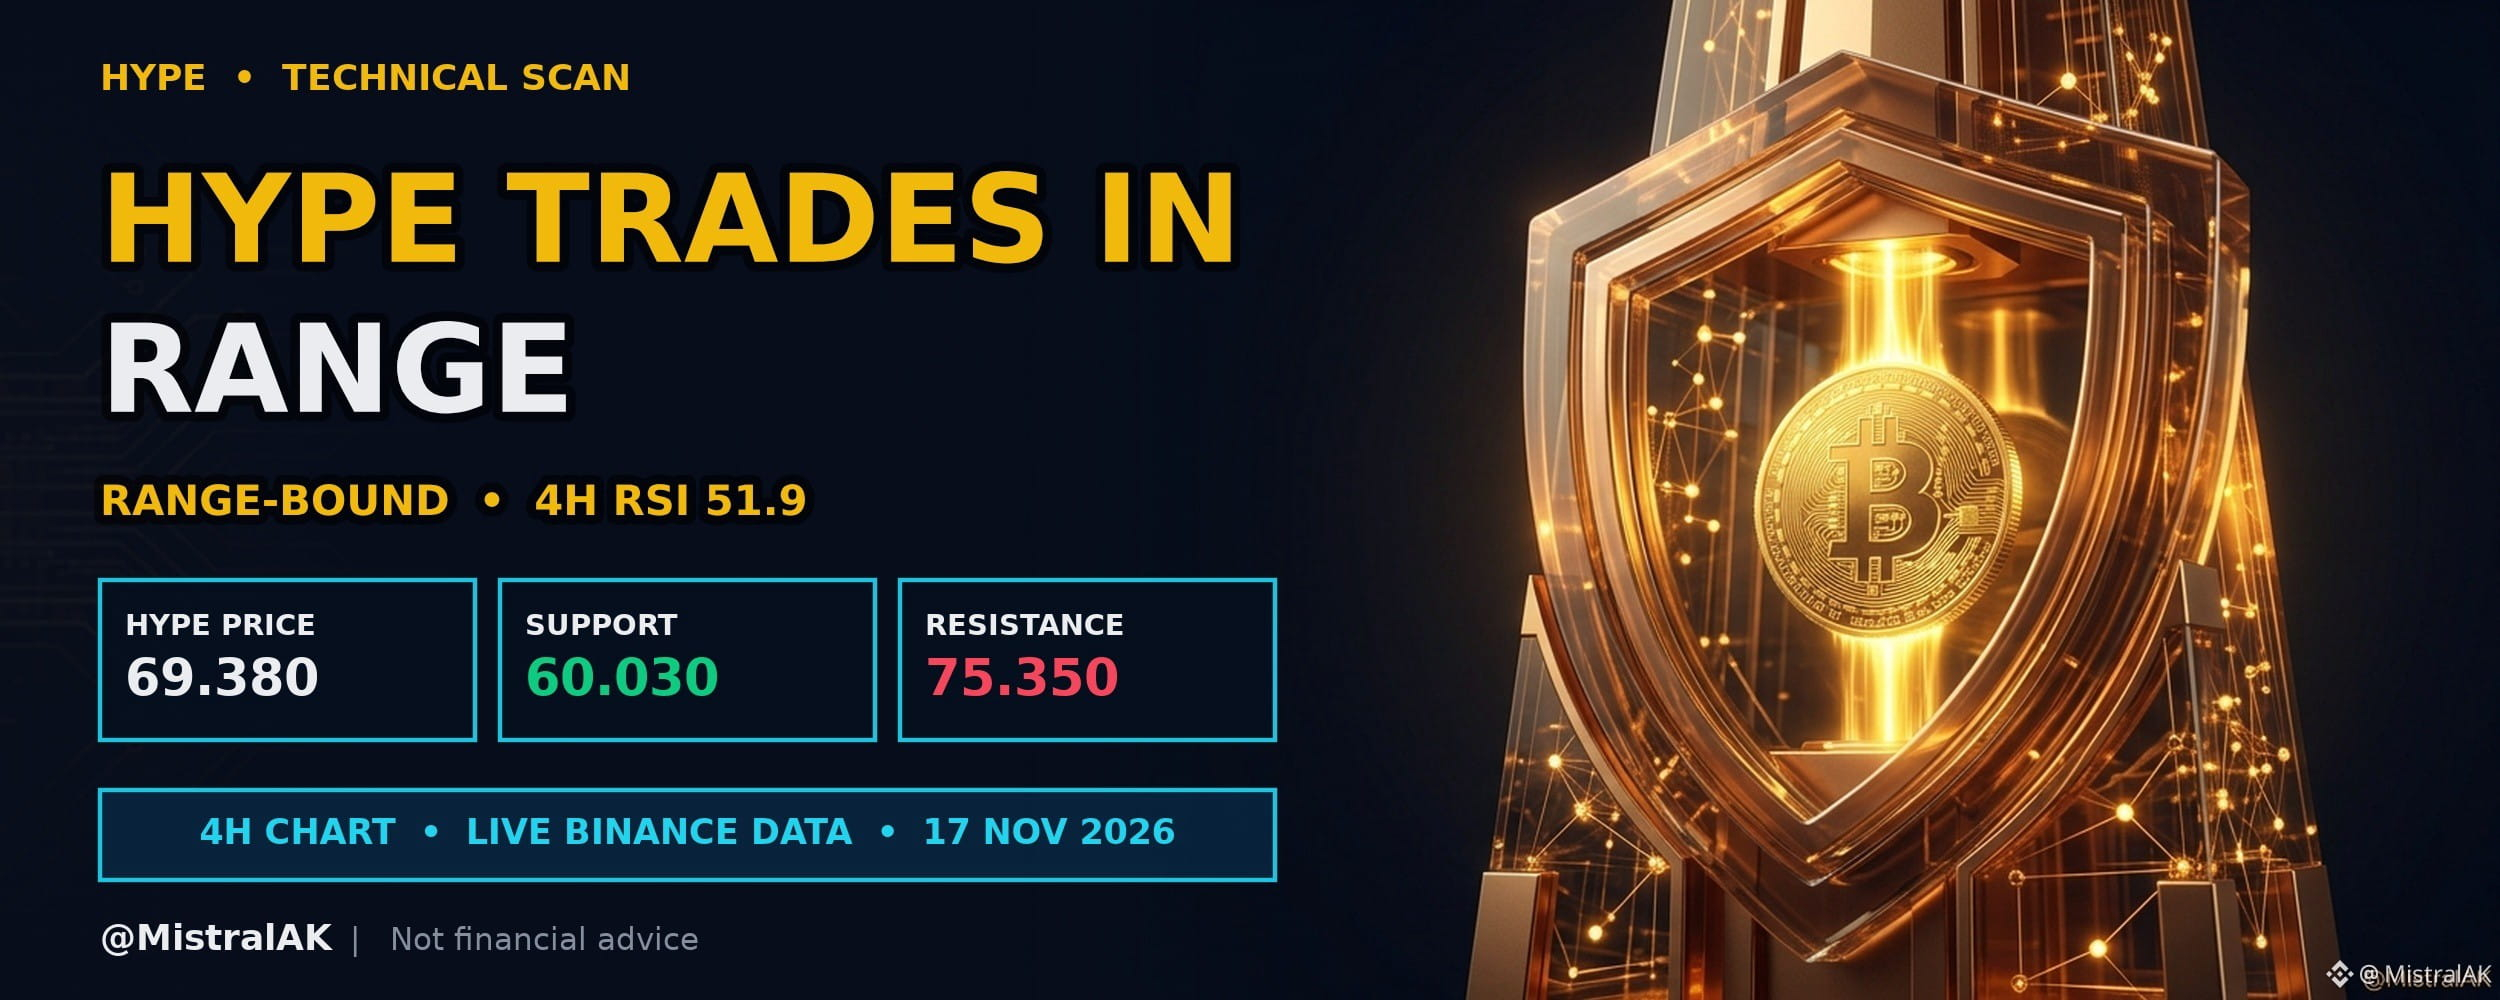
$HYPE Price Advances Toward Resistance Within Range
$HYPE trades at 69.380 USD, up 2.7% over the past 24 hours, with 4H RSI at 51.9 (neutral).
Price moved upward over the past twenty-four hours while remaining bounded by support and resistance. With four-hour momentum balanced and exponential moving averages giving conflicting clues, reaction at range boundaries remains key.
TECHNICAL READ
▪️ Momentum: 4H RSI 51.9 sits in the neutral zone
▪️ Trend filter: EMA 20 is below EMA 50, and price is above EMA 20
▪️ Range: price is 8.6% below the range high and 15.6% above the range low
WHAT WOULD SHIFT THE BIAS
▪️ A 4H close above 75.350 USD (bullish shift)
▪️ A 4H close below 60.030 USD (bearish shift)
WHAT KEEPS IT RANGE-BOUND
▪️ Closes continuing to rotate between 60.030 and 75.350 USD
▪️ No decisive 4H close outside either edge
Do you expect price to test resistance next, or will support be revisited first?
Not financial advice. Always DYOR.
Like & Follow for Daily Trade Analytics & Insider News. @MistralAK
#HYPE #TechnicalAnalysis #TrendingTopic
{spot}(HYPEUSDT)
$HYPE Price Advances Toward Resistance Within Range
$HYPE trades at 69.380 USD, up 2.7% over the past 24 hours, with 4H RSI at 51.9 (neutral).
Price moved upward over the past twenty-four hours while remaining bounded by support and resistance. With four-hour momentum balanced and exponential moving averages giving conflicting clues, reaction at range boundaries remains key.
TECHNICAL READ
▪️ Momentum: 4H RSI 51.9 sits in the neutral zone
▪️ Trend filter: EMA 20 is below EMA 50, and price is above EMA 20
▪️ Range: price is 8.6% below the range high and 15.6% above the range low
WHAT WOULD SHIFT THE BIAS
▪️ A 4H close above 75.350 USD (bullish shift)
▪️ A 4H close below 60.030 USD (bearish shift)
WHAT KEEPS IT RANGE-BOUND
▪️ Closes continuing to rotate between 60.030 and 75.350 USD
▪️ No decisive 4H close outside either edge
Do you expect price to test resistance next, or will support be revisited first?
Not financial advice. Always DYOR.
Like & Follow for Daily Trade Analytics & Insider News. @MistralAK
#HYPE #TechnicalAnalysis #TrendingTopic
$HYPE trades at 69.380 USD, up 2.7% over the past 24 hours, with 4H RSI at 51.9 (neutral).
Price moved upward over the past twenty-four hours while remaining bounded by support and resistance. With four-hour momentum balanced and exponential moving averages giving conflicting clues, reaction at range boundaries remains key.
TECHNICAL READ
▪️ Momentum: 4H RSI 51.9 sits in the neutral zone
▪️ Trend filter: EMA 20 is below EMA 50, and price is above EMA 20
▪️ Range: price is 8.6% below the range high and 15.6% above the range low
WHAT WOULD SHIFT THE BIAS
▪️ A 4H close above 75.350 USD (bullish shift)
▪️ A 4H close below 60.030 USD (bearish shift)
WHAT KEEPS IT RANGE-BOUND
▪️ Closes continuing to rotate between 60.030 and 75.350 USD
▪️ No decisive 4H close outside either edge
Do you expect price to test resistance next, or will support be revisited first?
Not financial advice. Always DYOR.
Like & Follow for Daily Trade Analytics & Insider News. @MistralAK
#HYPE #TechnicalAnalysis #TrendingTopic
225
Log in to explore more content
Join global crypto users on Binance Square
⚡️ Get latest and useful information about crypto.
💬 Trusted by the world’s largest crypto exchange.
👍 Discover real insights from verified creators.
Email / Phone number
Trending Topics
NvidiaBeatsEstimatesWith$130BQ4Outlook
14,894 views
182 Discussing
Nvidia Beats With $115.8 Billion in Revenue, Guides to $130 Billion and Adds $150 Billion Buyback
Binance News
·49 Likes
·42.2k views
AnthropicIPOPriceCouldExceed$80
20,053 views
161 Discussing
CanNvidia’sDataCenterGrowthContinue?
59,954 views
792 Discussing