

making money x official
862 Posts

making money x official
Dynamic crypto trader and digital asset analyst specializing in market trends and risk management. Dedicated to navigating complex market cycles and sharing act
Open Trade
Occasional Trader
24 Days
523 Following
73 Followers
50 Liked
Posts
Portfolio
All
Quotes
See translation

Mira小白桃
·
--
#SOL现货ETF周净流入1.88亿美元
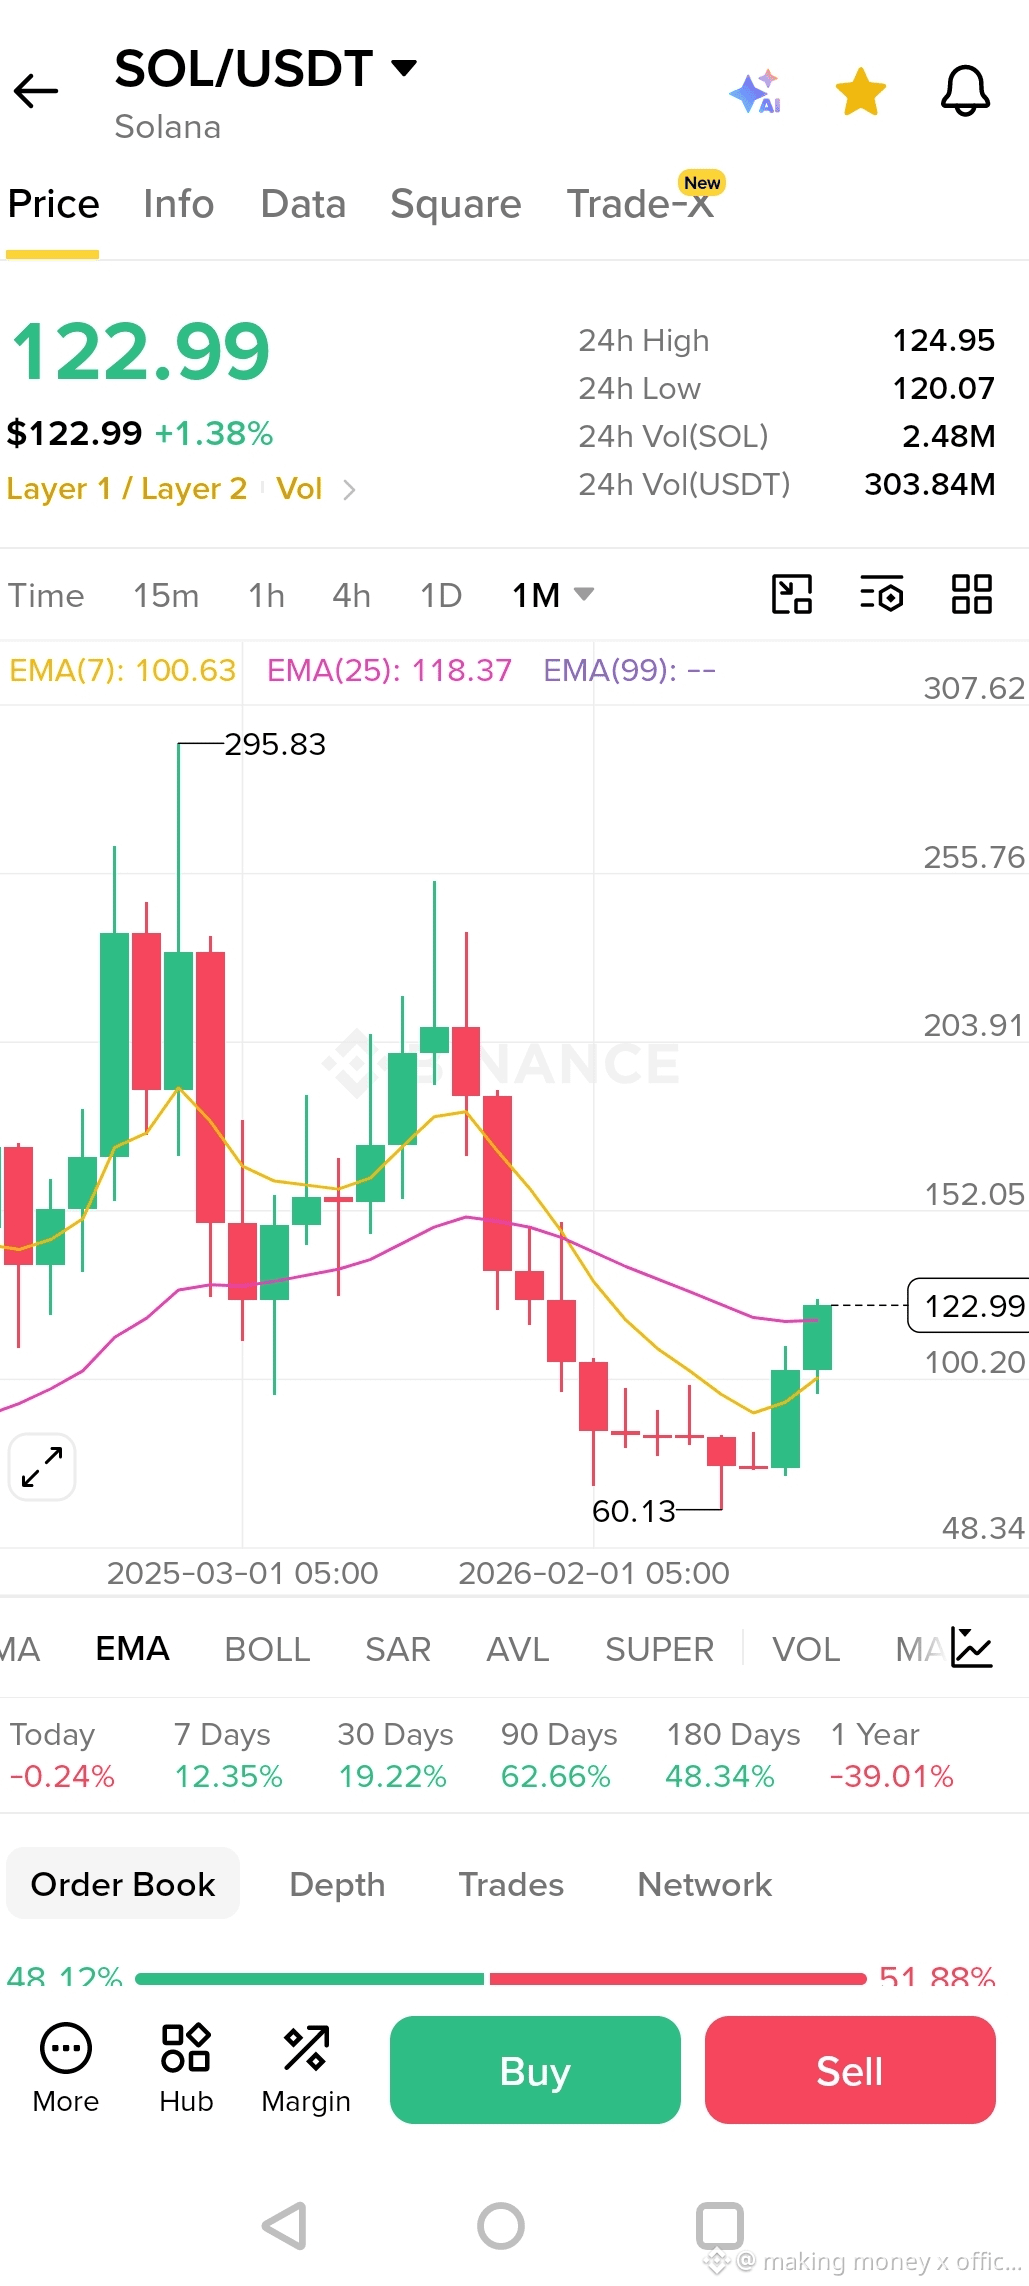
Latest data shows that last week, the U.S. spot SOL ETF saw net inflows of about $188 million.
How important is this number?
It’s the second-highest single-week net inflow since the spot SOL ETF launched, only behind the roughly $199 million net inflow in its first week.
Even more noteworthy is that on September 25, the single-day net inflow reached $86.7 million, setting a new current single-day high.
That means it’s not just retail investors paying attention to SOL anymore;
institutional capital is also increasing its SOL allocation via ETFs.
So what does this mean for SOL?
I think the most important thing isn’t:
“$188 million just came in—does SOL immediately about to surge?”
Instead, it’s whether these fund flows can be sustained.
Previously, the spot SOL ETF had already maintained net inflows for multiple consecutive weeks; the cumulative net inflows have now surpassed $1.6 billion, and the ETF’s total assets have risen to more than about $1.5 billion.
This points to a change:
institutional capital channels for SOL are becoming increasingly mature.
From a trading perspective, I’d interpret this as a relatively positive signal.
Especially if, now, you see:
ETF inflows continuing + on-chain activity staying active + SOL’s price breaking through resistance in tandem
Once these three start to resonate together, SOL’s upward trend is more likely to continue.
But conversely, if ETF inflows keep coming in while the price keeps failing to break higher,
then you need to be careful:
funds are entering, but there’s also heavy sell pressure overhead.
So ETF data can’t be used to judge buy or sell on its own.
Fund flows are supportive; price structure is the confirmation.
What I’m paying more attention to for SOL right now is:
Can ETF-related capital keep maintaining inflows consecutively?
If the next one or two weeks still show relatively clear net inflows, the market will pay even more attention to whether SOL can continue challenging the prior highs.
And if the capital suddenly flips into consistent outflows,
then we’ll need to reassess whether this leg of the rally is already entering a high-level profit-taking phase.
So for today’s data, I’d define it as:
Not a signal that “SOL will take off immediately,”
but rather:
Institutional capital is once again increasing its focus on SOL.
For SOL’s medium-term capital structure, this is a change worth continuing to monitor.
Look at the money first, then look at the price.
If the money really keeps coming in, the market will have more conviction behind the move.
Latest data shows that last week, the U.S. spot SOL ETF saw net inflows of about $188 million.
How important is this number?
It’s the second-highest single-week net inflow since the spot SOL ETF launched, only behind the roughly $199 million net inflow in its first week.
Even more noteworthy is that on September 25, the single-day net inflow reached $86.7 million, setting a new current single-day high.
That means it’s not just retail investors paying attention to SOL anymore;
institutional capital is also increasing its SOL allocation via ETFs.
So what does this mean for SOL?
I think the most important thing isn’t:
“$188 million just came in—does SOL immediately about to surge?”
Instead, it’s whether these fund flows can be sustained.
Previously, the spot SOL ETF had already maintained net inflows for multiple consecutive weeks; the cumulative net inflows have now surpassed $1.6 billion, and the ETF’s total assets have risen to more than about $1.5 billion.
This points to a change:
institutional capital channels for SOL are becoming increasingly mature.
From a trading perspective, I’d interpret this as a relatively positive signal.
Especially if, now, you see:
ETF inflows continuing + on-chain activity staying active + SOL’s price breaking through resistance in tandem
Once these three start to resonate together, SOL’s upward trend is more likely to continue.
But conversely, if ETF inflows keep coming in while the price keeps failing to break higher,
then you need to be careful:
funds are entering, but there’s also heavy sell pressure overhead.
So ETF data can’t be used to judge buy or sell on its own.
Fund flows are supportive; price structure is the confirmation.
What I’m paying more attention to for SOL right now is:
Can ETF-related capital keep maintaining inflows consecutively?
If the next one or two weeks still show relatively clear net inflows, the market will pay even more attention to whether SOL can continue challenging the prior highs.
And if the capital suddenly flips into consistent outflows,
then we’ll need to reassess whether this leg of the rally is already entering a high-level profit-taking phase.
So for today’s data, I’d define it as:
Not a signal that “SOL will take off immediately,”
but rather:
Institutional capital is once again increasing its focus on SOL.
For SOL’s medium-term capital structure, this is a change worth continuing to monitor.
Look at the money first, then look at the price.
If the money really keeps coming in, the market will have more conviction behind the move.

See translation

Anya_X
·
--
🚨🧧 RED PACKET DROP — RIGHT NOW! 🧧🚨
⏳ ONLY A FEW SPOTS LEFT — HURRY! 🔥
💰 CLAIM YOURS BEFORE IT’S TOO LATE! ⚡
👀 Don’t scroll past… this could be YOUR lucky moment! 🍀
Don’t be late — grab it before it disappears! 👀🔥
🚀 ACT NOW, SHARE & TAG A FRIEND! ❤️🔥
simple answer 2+6=8
⏳ ONLY A FEW SPOTS LEFT — HURRY! 🔥
💰 CLAIM YOURS BEFORE IT’S TOO LATE! ⚡
👀 Don’t scroll past… this could be YOUR lucky moment! 🍀
Don’t be late — grab it before it disappears! 👀🔥
🚀 ACT NOW, SHARE & TAG A FRIEND! ❤️🔥
simple answer 2+6=8


See translation


Bitroot铄鸿
·
--
Pine trees uphold simplicity, climbing no high fame; after rain fades and wind calms, sturdy bones stand eternal on green peaks!

See translation

长得帅不如跑的快1688
·
--
Handsome
See translation

入云观市
·
--
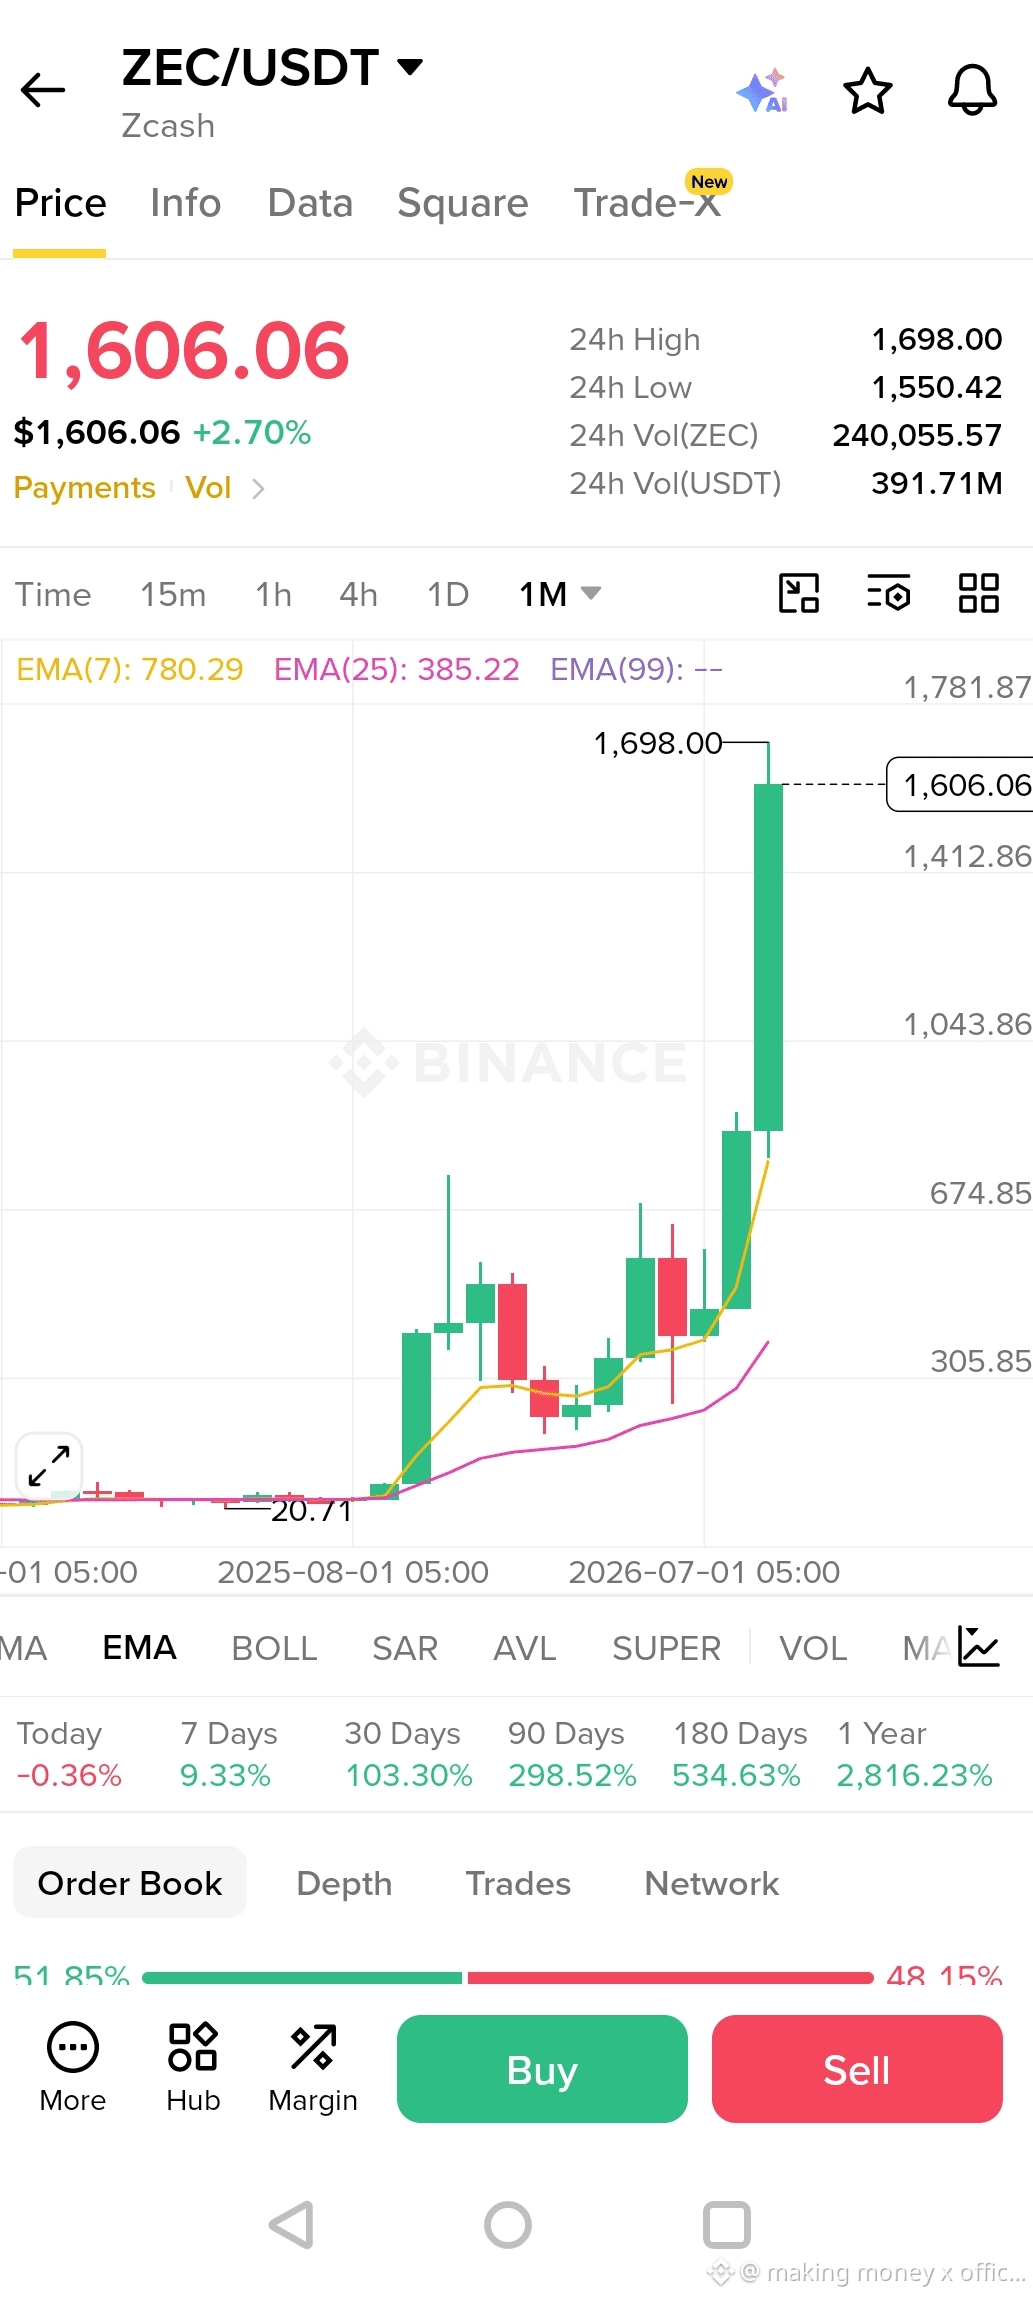
[Ended] 🎙️ What do everyone think about Zec? Come in and chat
163 listens
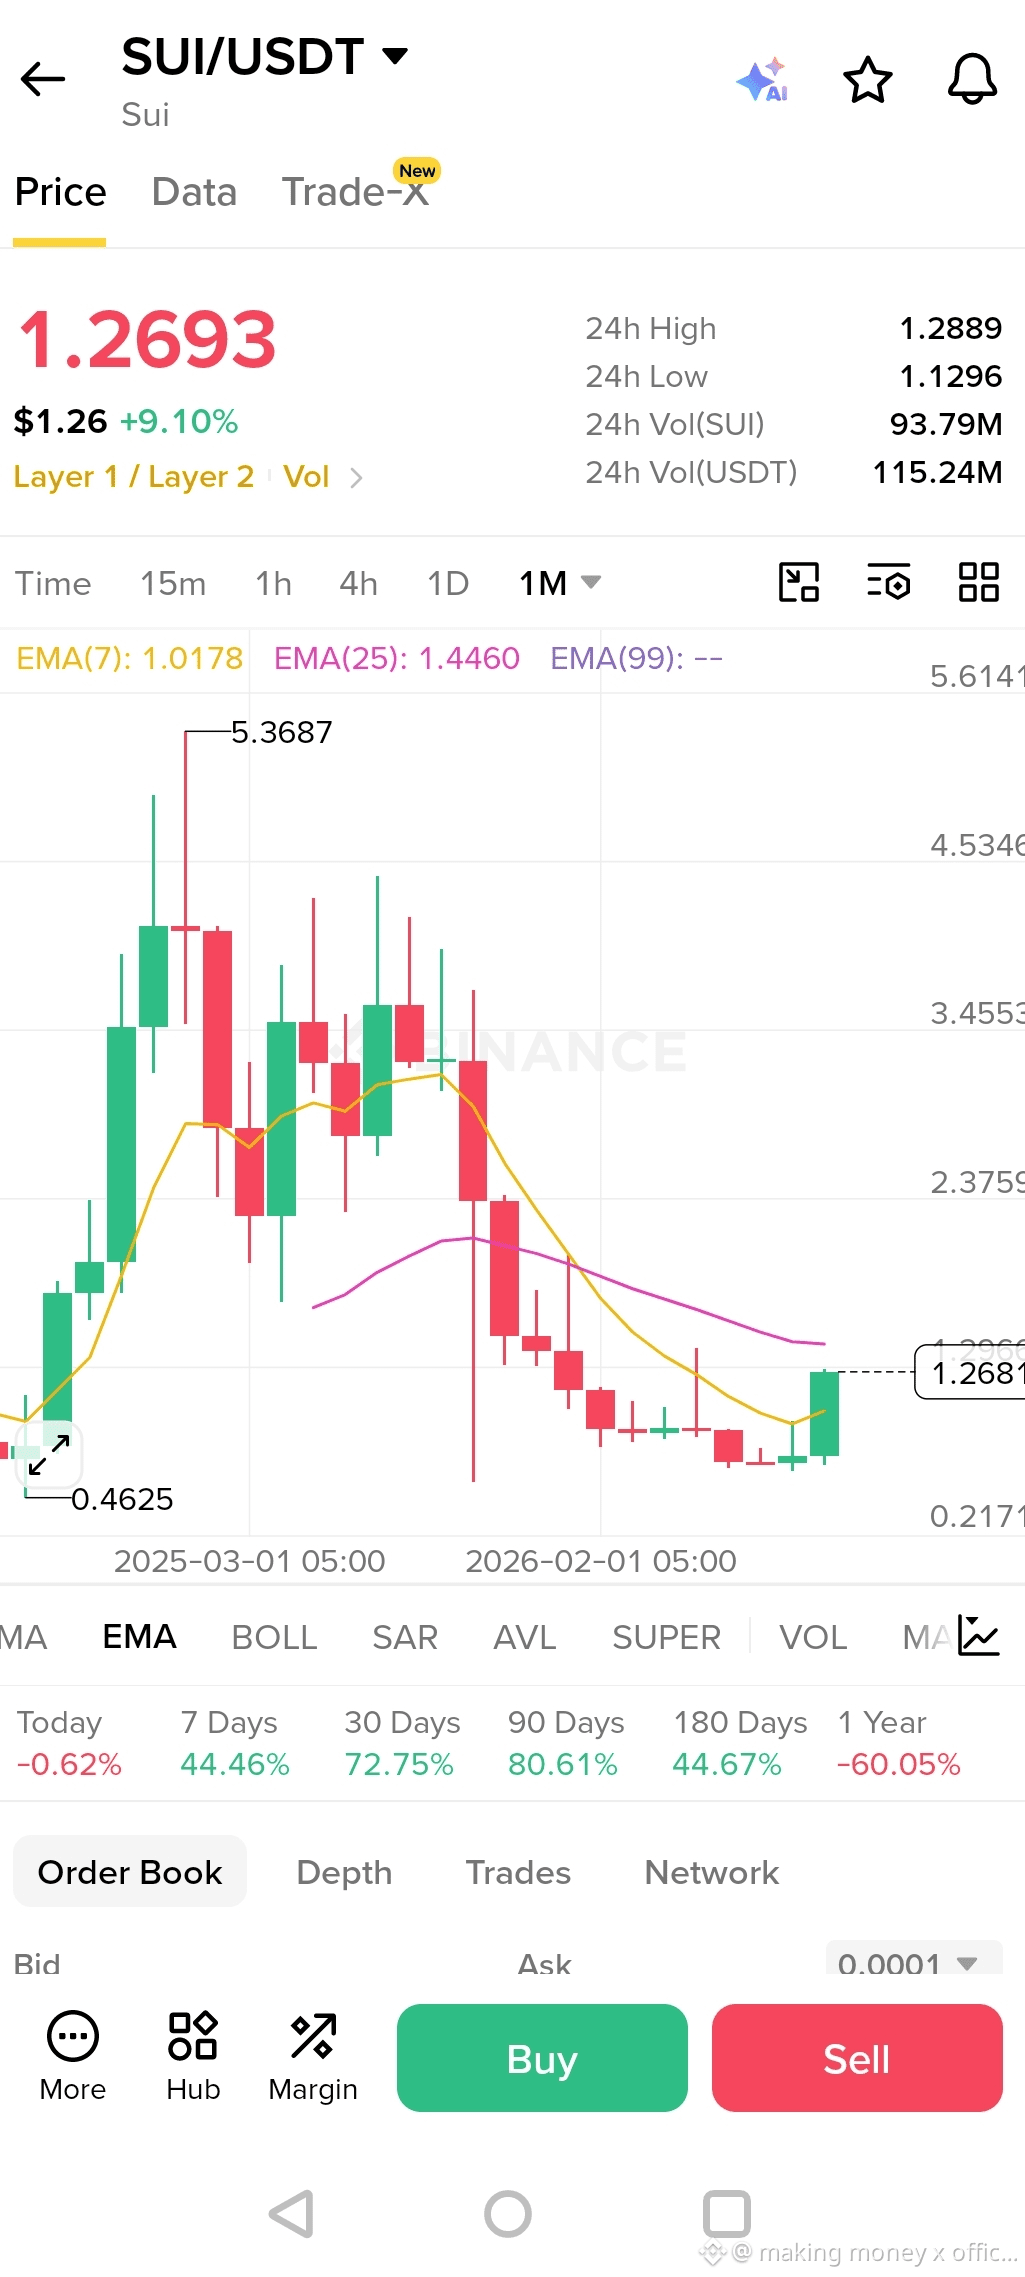
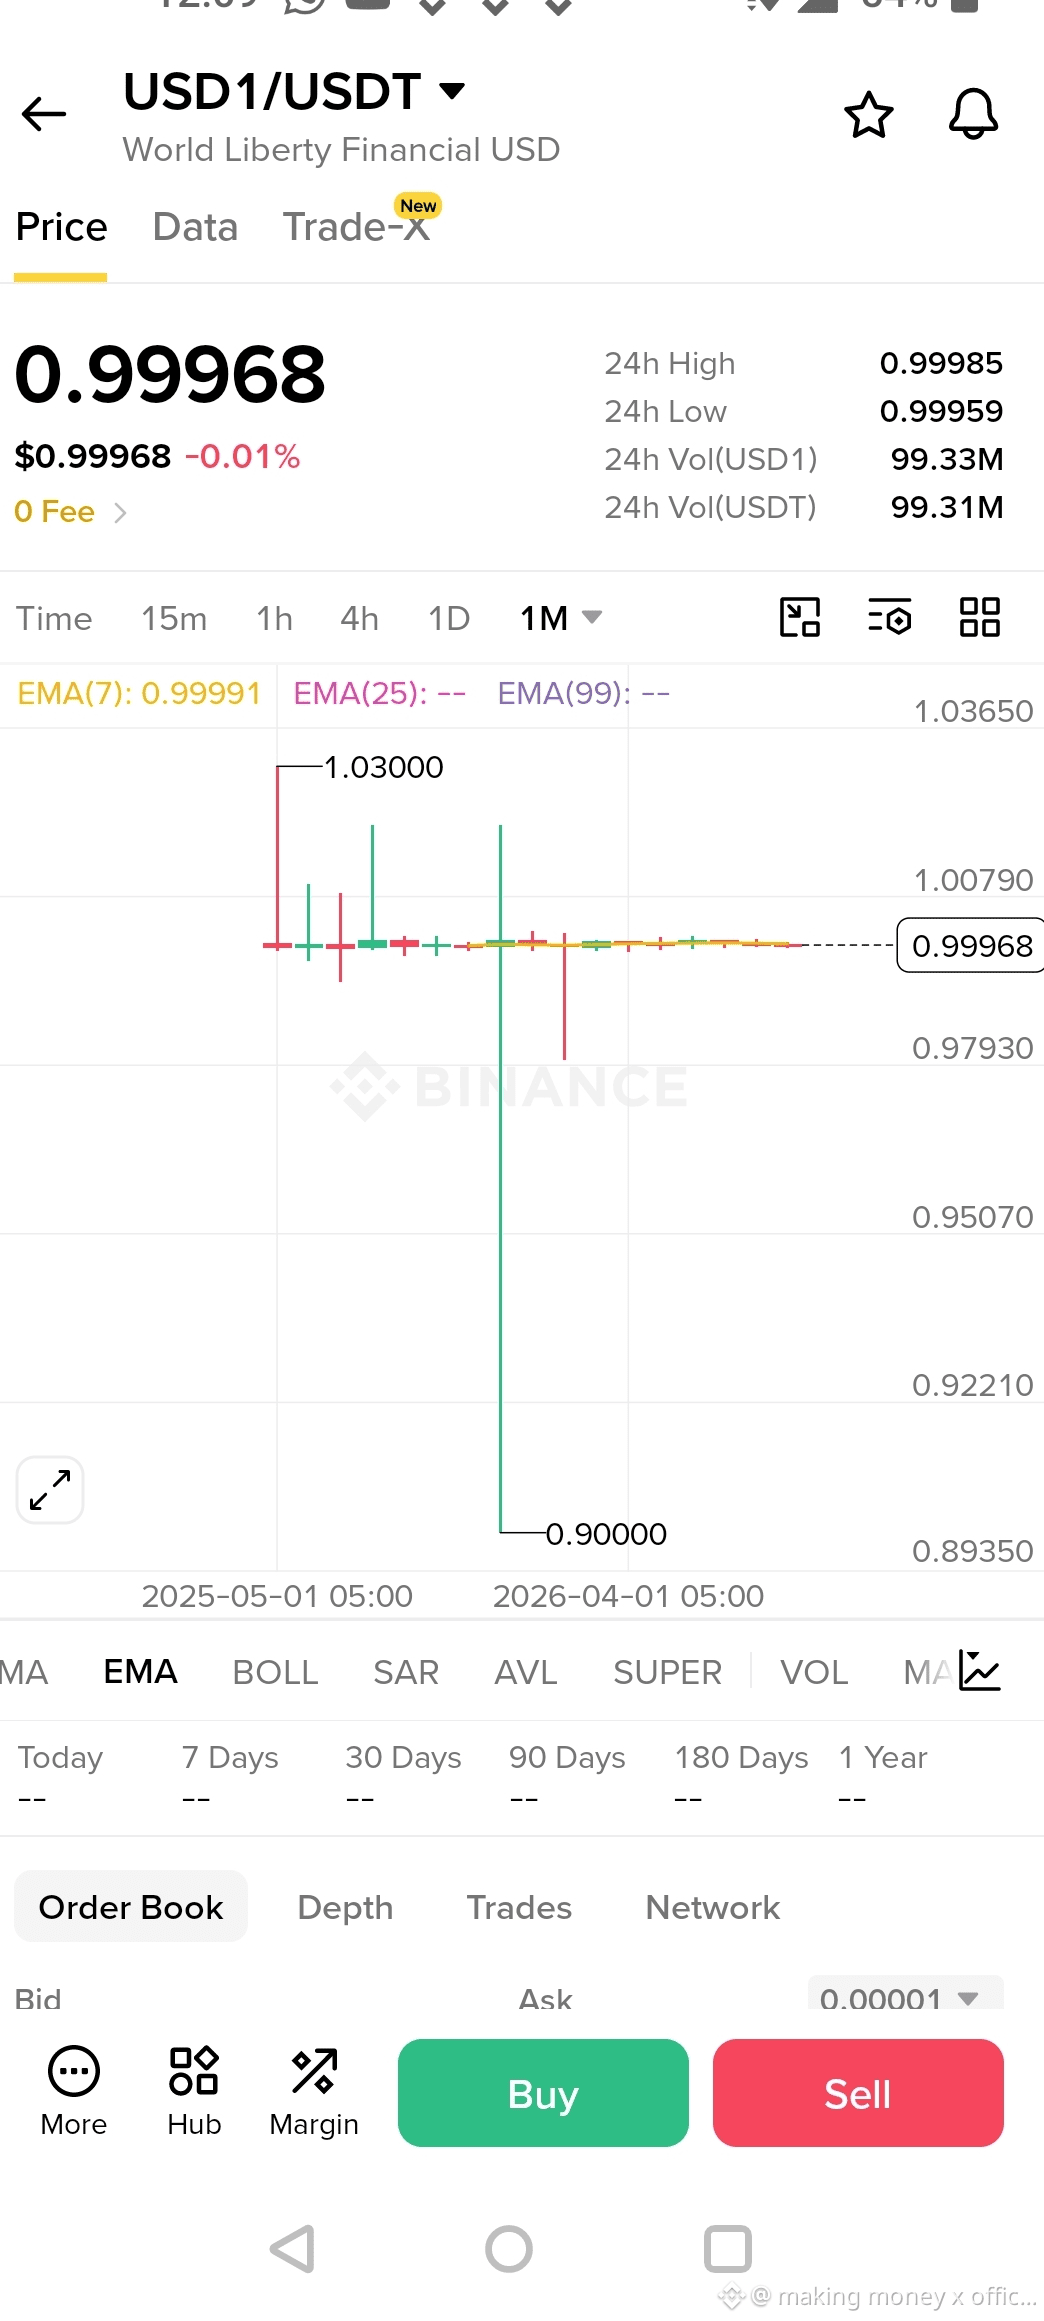
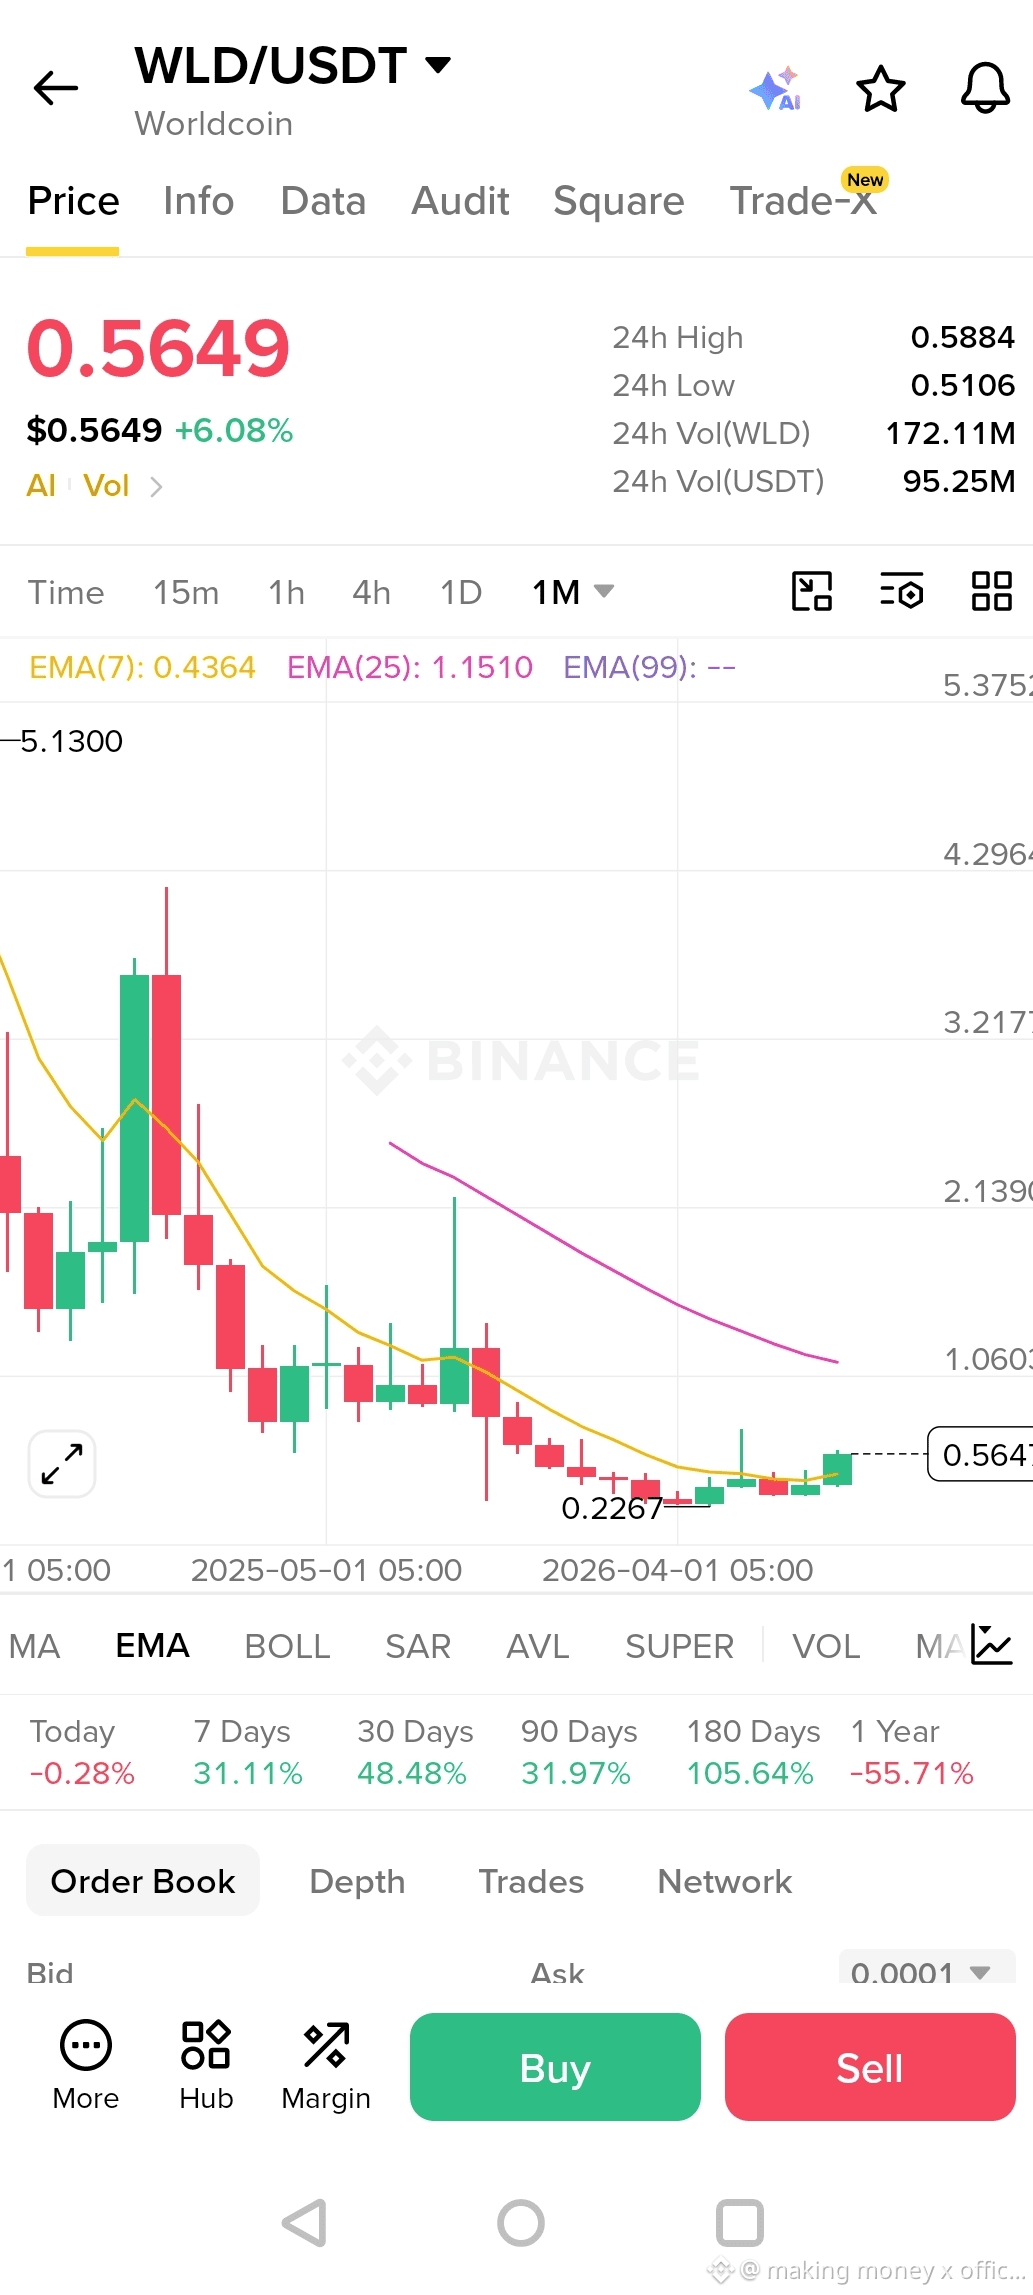
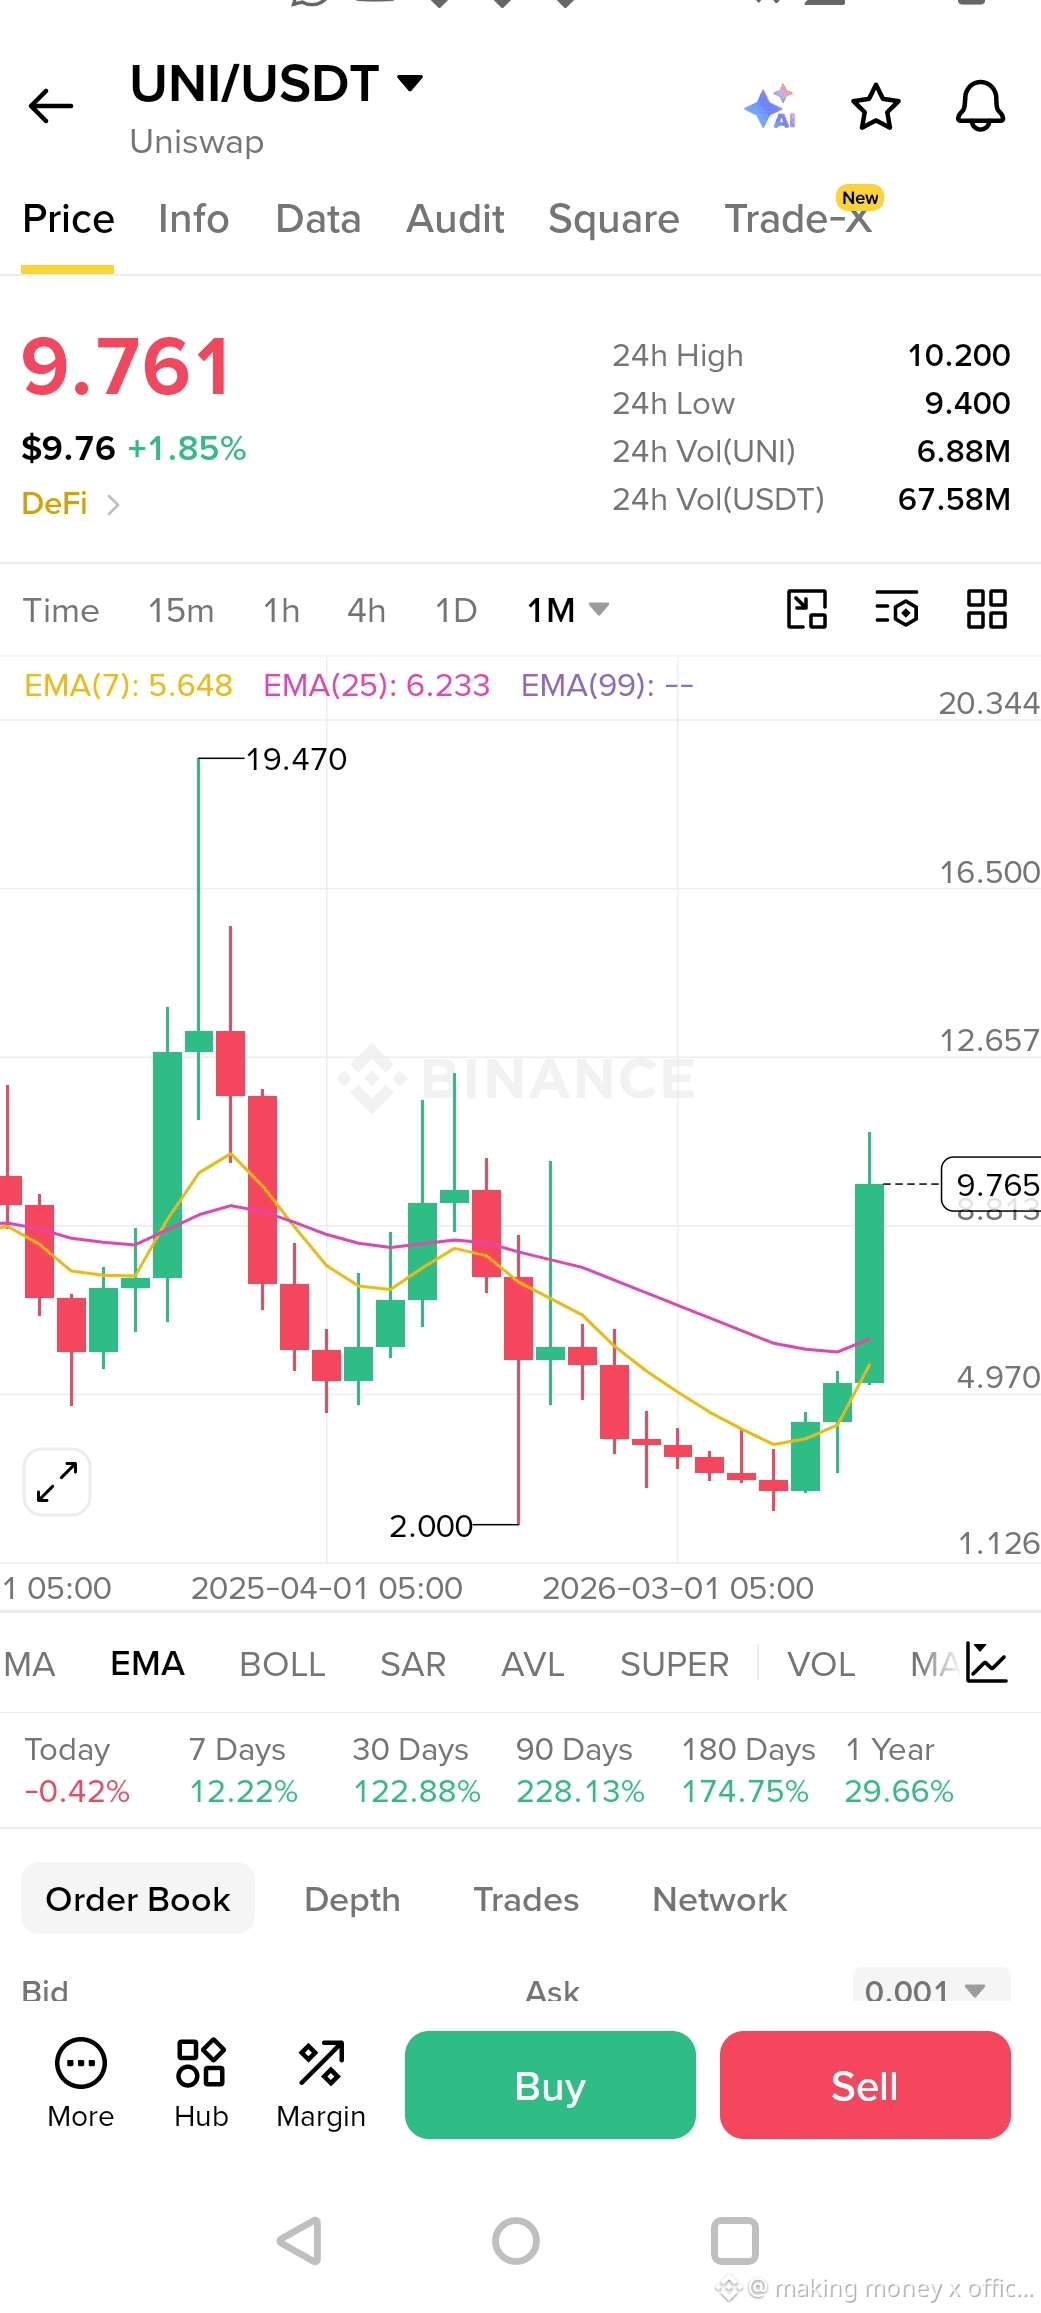
See translation

大嗯BNB
·
--
September 27, the Altcoin Season Index climbed above 62, up from 50 a week ago and 45 on September 23.
The threshold is 75. Only above 75 counts as an “altcoin season”—defined as 75% or more of the top 100 altcoins having outperformed BTC over the past 90 days.
62—down 13 points.
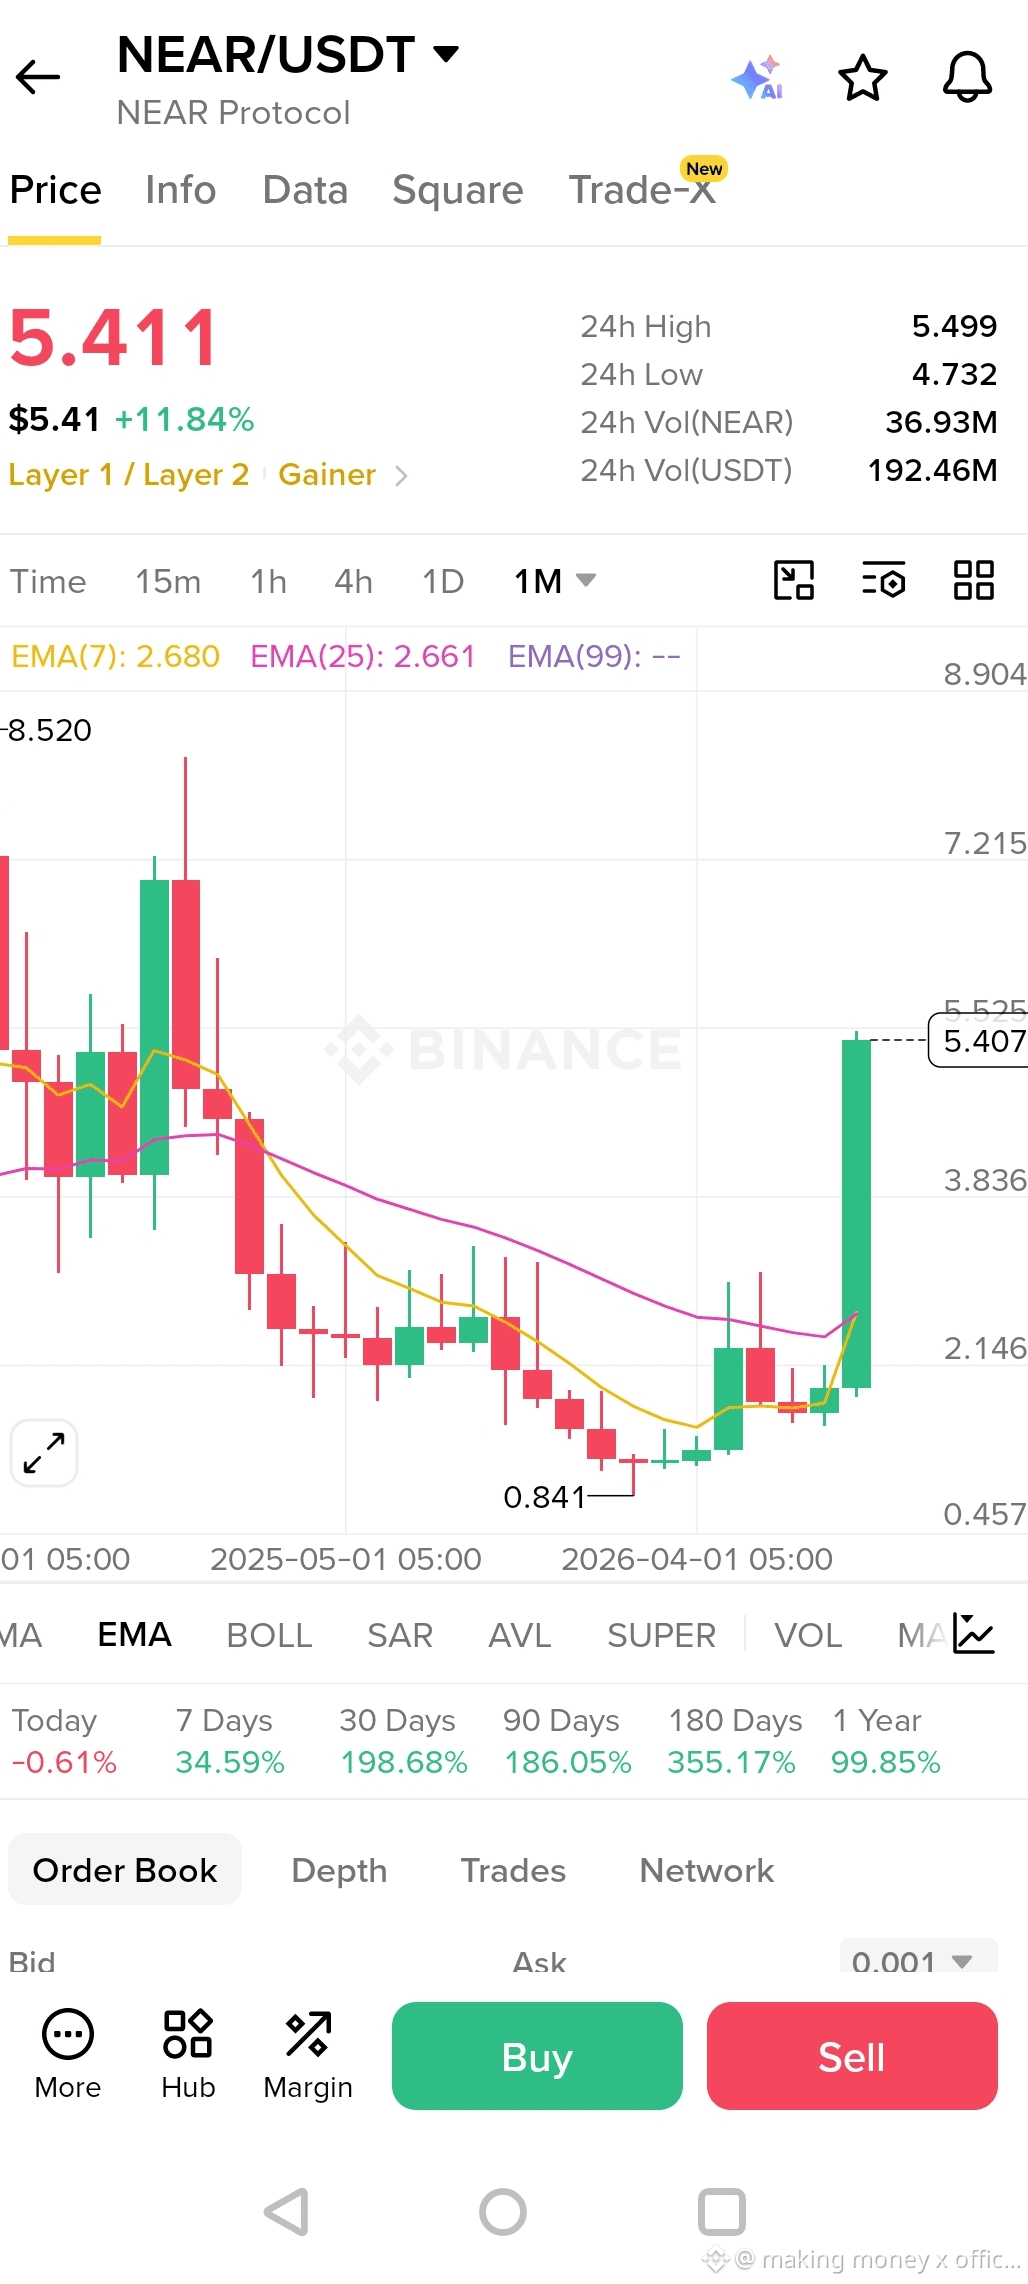
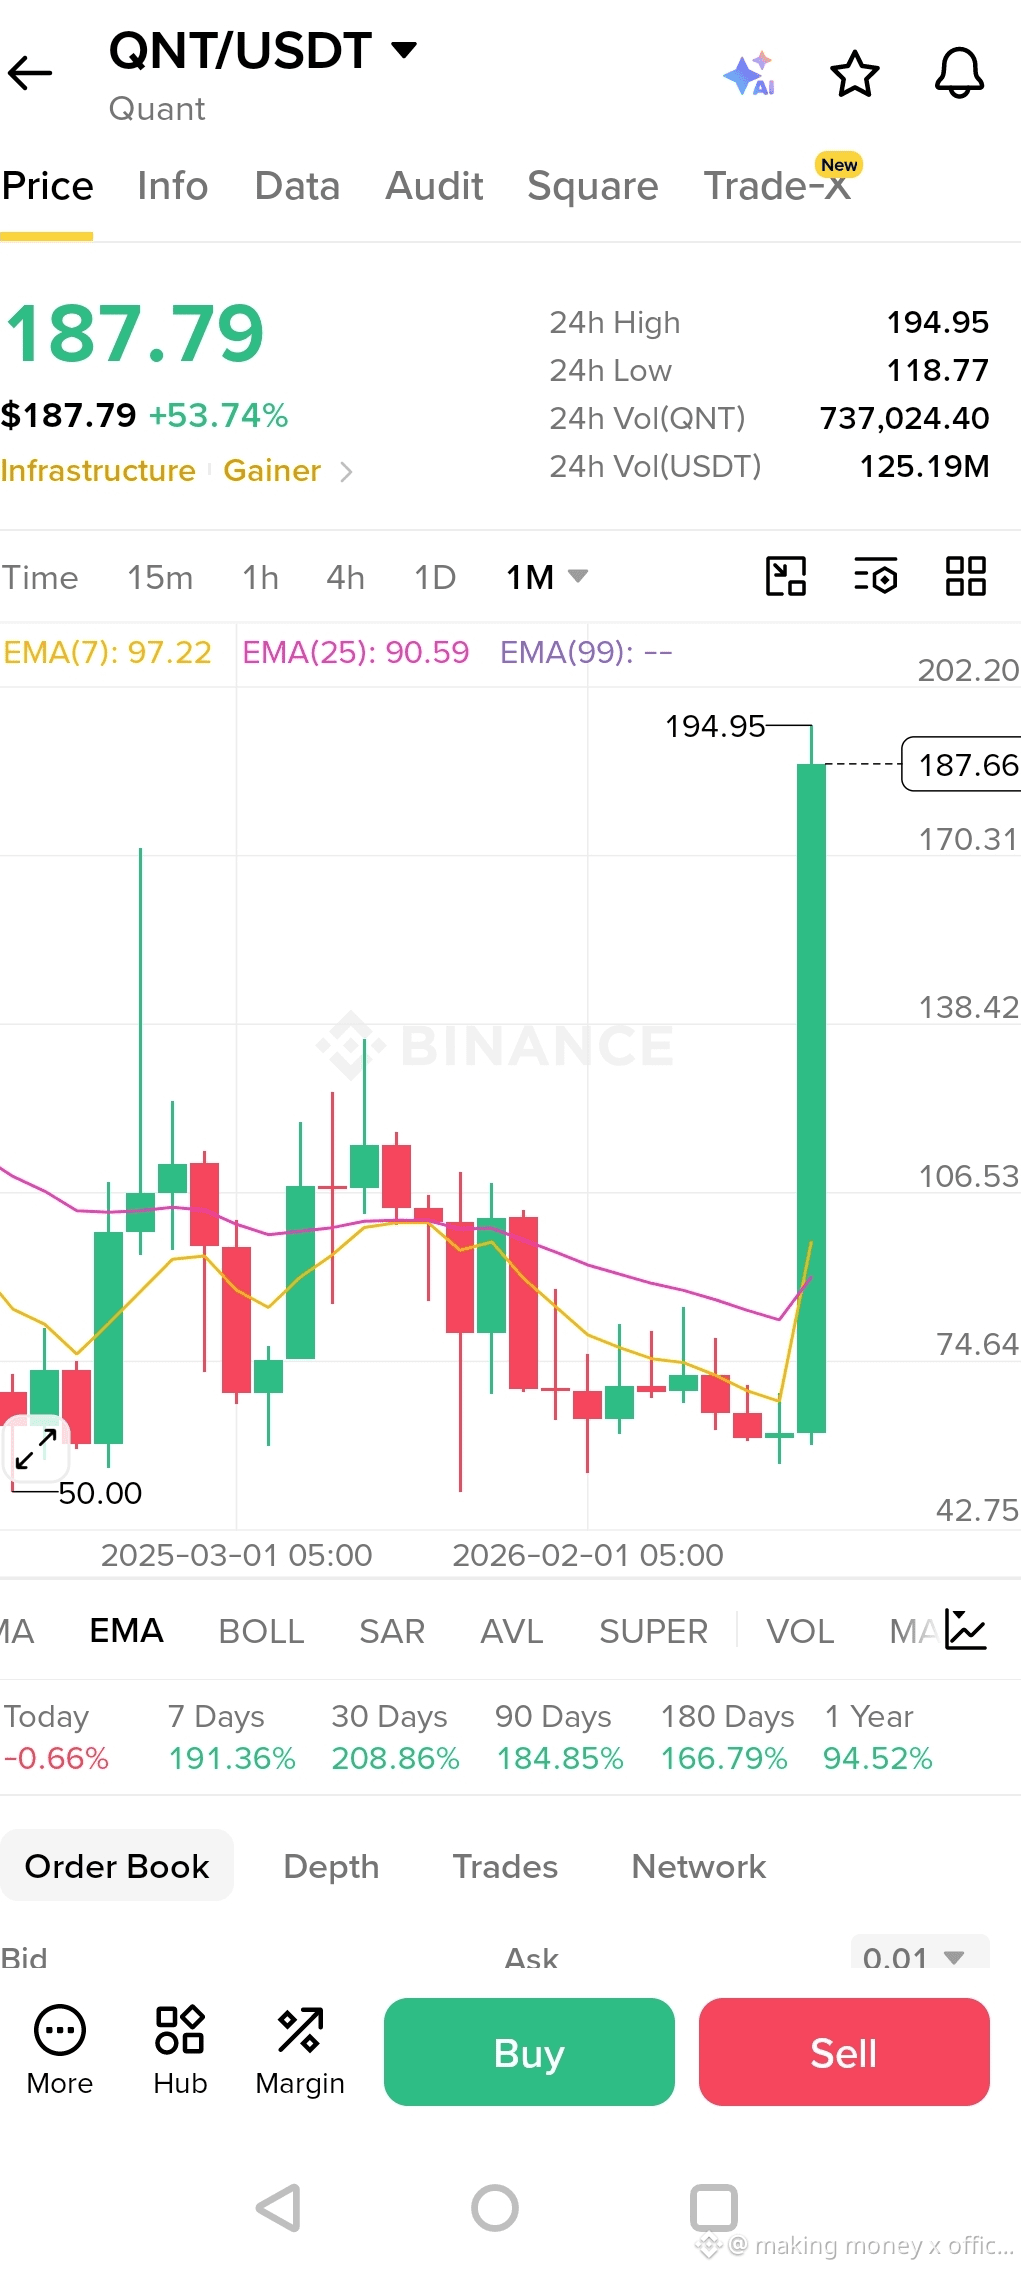
What happened this week? QNT was up 39% week-over-week, NEAR surged 56% week-over-week, and ADA, LINK, and Chainlink took turns leading. ENA jumped 24% in a single day. BTC dominance slid from 56.5% to 58.6%—capital is starting to spill from BTC into altcoins. This is the most classic prelude before every altcoin season begins.
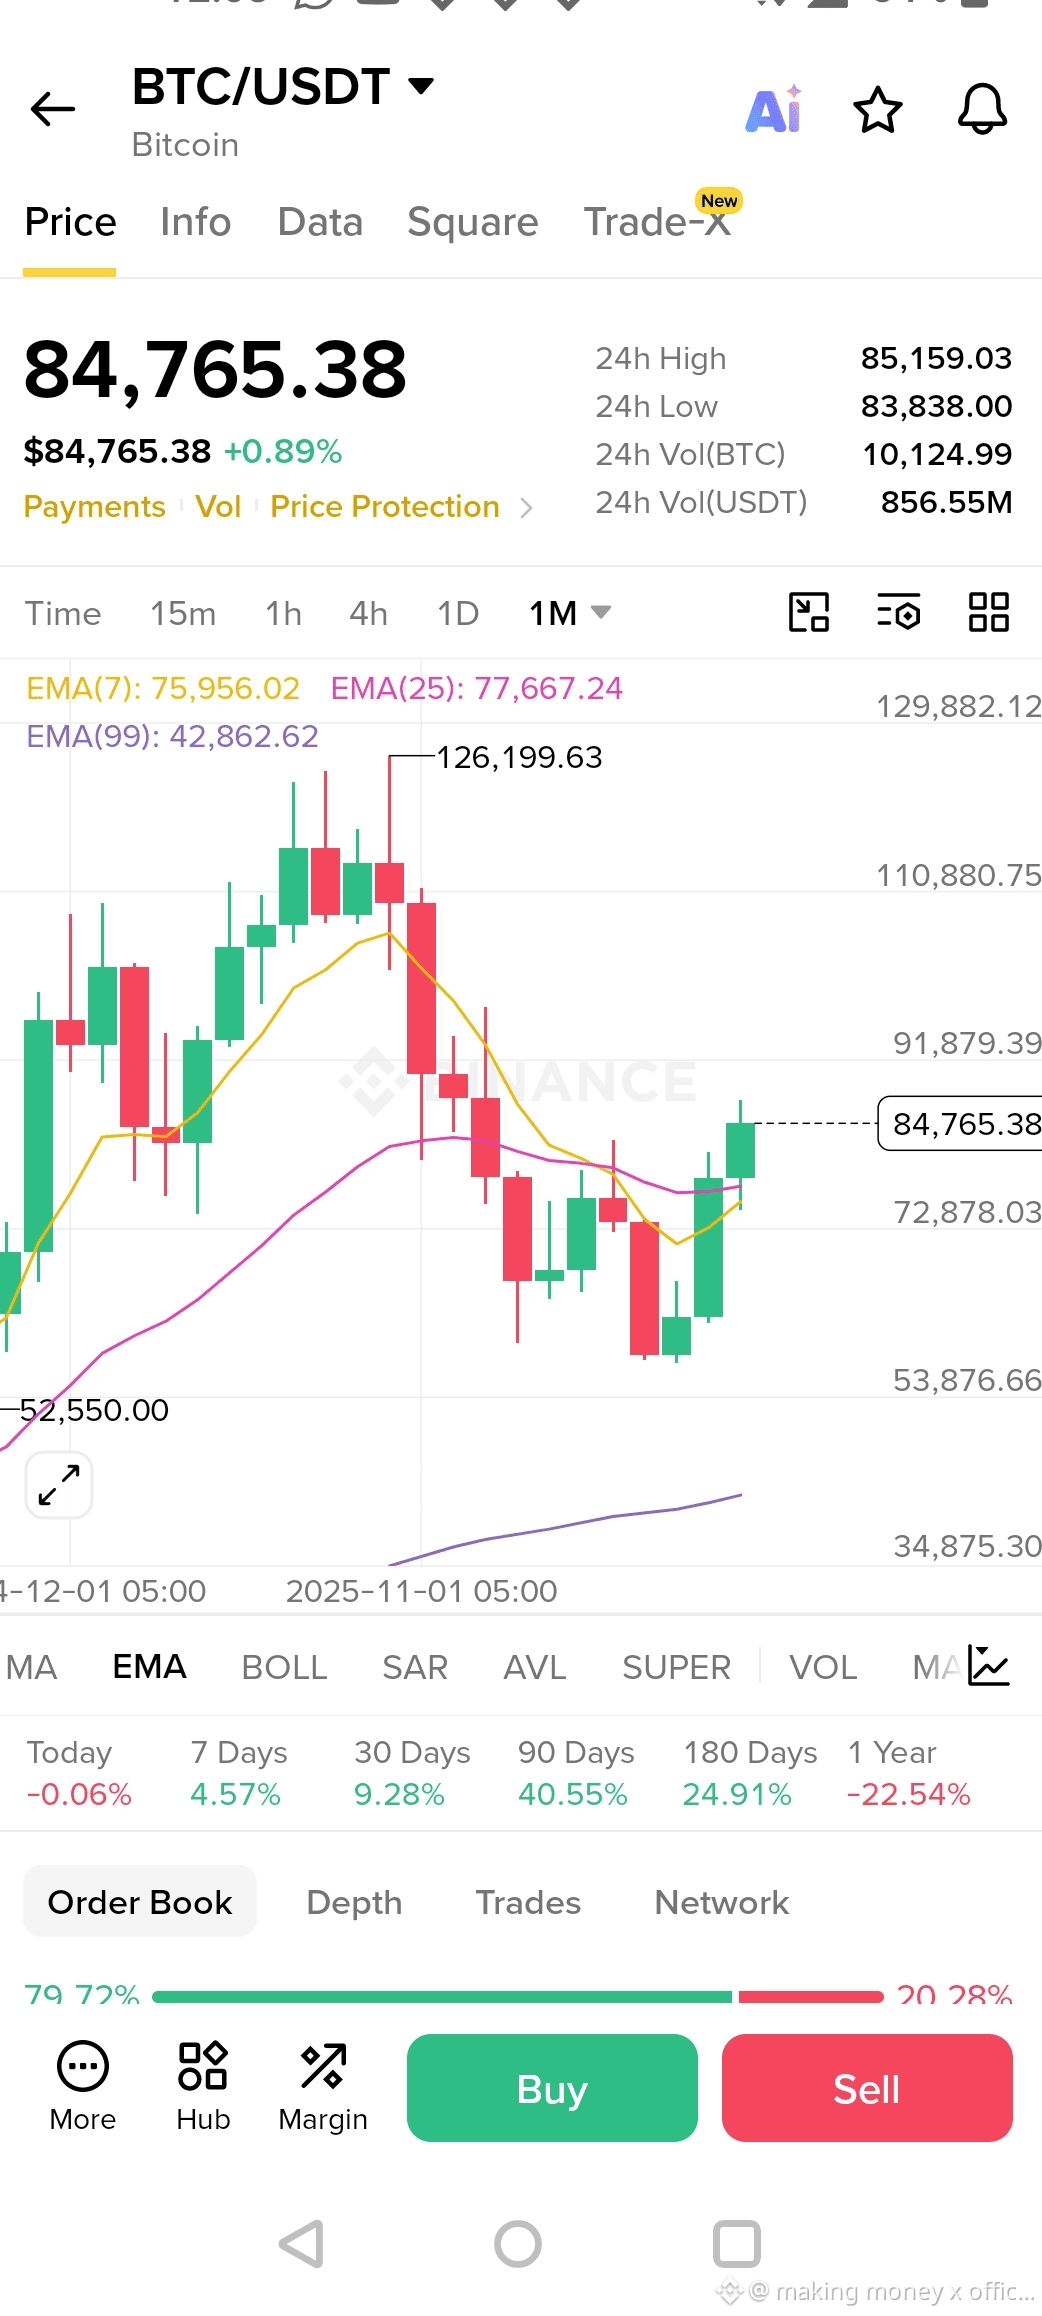
BTC is around 84,000 today. Q3’s cumulative gain is 43.5%, the second-strongest Q3 in history—only behind 2017.
Then I saw a piece of data that somewhat dampened my spirits.
Polymarket shows the probability of a Fed rate hike in October at 64% to 65%.
The next FOMC meeting is October 28–29, one month from now. If they really hike again by 25 bps, with the interest-rate range of 4.00%–4.25%, the opportunity cost for risk assets keeps rising—altcoins fear this most. Altcoins’ volatility is already high; in a high-rate environment, the motivation to chase altcoins gets suppressed.
Historically, altcoin seasons usually occur after BTC has stabilized and under conditions of looser macro liquidity. Right now, neither condition is fully met—BTC is digesting local highs, and macro is still hiking.
Put simply: a 62 altcoin season index tells you the direction is right, and a 64% odds of an October hike tells you there’s a hurdle ahead.
This isn’t to say altcoin season won’t come. After BTC confirmed a major bull run in November 2024, altcoin season arrived very powerfully. But before the FOMC on October 28–29, altcoins’ high volatility is a two-way street—not only upward.
Are you allocating to altcoins now? Do you think this time you’ll truly wait for altcoin season, or will you end up waiting in vain again? Share your mindset.
$BTC
#BTC
The threshold is 75. Only above 75 counts as an “altcoin season”—defined as 75% or more of the top 100 altcoins having outperformed BTC over the past 90 days.
62—down 13 points.
What happened this week? QNT was up 39% week-over-week, NEAR surged 56% week-over-week, and ADA, LINK, and Chainlink took turns leading. ENA jumped 24% in a single day. BTC dominance slid from 56.5% to 58.6%—capital is starting to spill from BTC into altcoins. This is the most classic prelude before every altcoin season begins.
BTC is around 84,000 today. Q3’s cumulative gain is 43.5%, the second-strongest Q3 in history—only behind 2017.
Then I saw a piece of data that somewhat dampened my spirits.
Polymarket shows the probability of a Fed rate hike in October at 64% to 65%.
The next FOMC meeting is October 28–29, one month from now. If they really hike again by 25 bps, with the interest-rate range of 4.00%–4.25%, the opportunity cost for risk assets keeps rising—altcoins fear this most. Altcoins’ volatility is already high; in a high-rate environment, the motivation to chase altcoins gets suppressed.
Historically, altcoin seasons usually occur after BTC has stabilized and under conditions of looser macro liquidity. Right now, neither condition is fully met—BTC is digesting local highs, and macro is still hiking.
Put simply: a 62 altcoin season index tells you the direction is right, and a 64% odds of an October hike tells you there’s a hurdle ahead.
This isn’t to say altcoin season won’t come. After BTC confirmed a major bull run in November 2024, altcoin season arrived very powerfully. But before the FOMC on October 28–29, altcoins’ high volatility is a two-way street—not only upward.
Are you allocating to altcoins now? Do you think this time you’ll truly wait for altcoin season, or will you end up waiting in vain again? Share your mindset.
$BTC
#BTC


Log in to explore more content