
桀-1688
3.6k Posts

桀-1688
 Square Verified
Report
Block User
盯盘不追高,数据说人话。关注我,用数据拆行情,用白话讲市场。
High-Frequency Trader
9 Years
106 Following
11.3K+ Followers
2.4K+ Liked
Posts
·
--
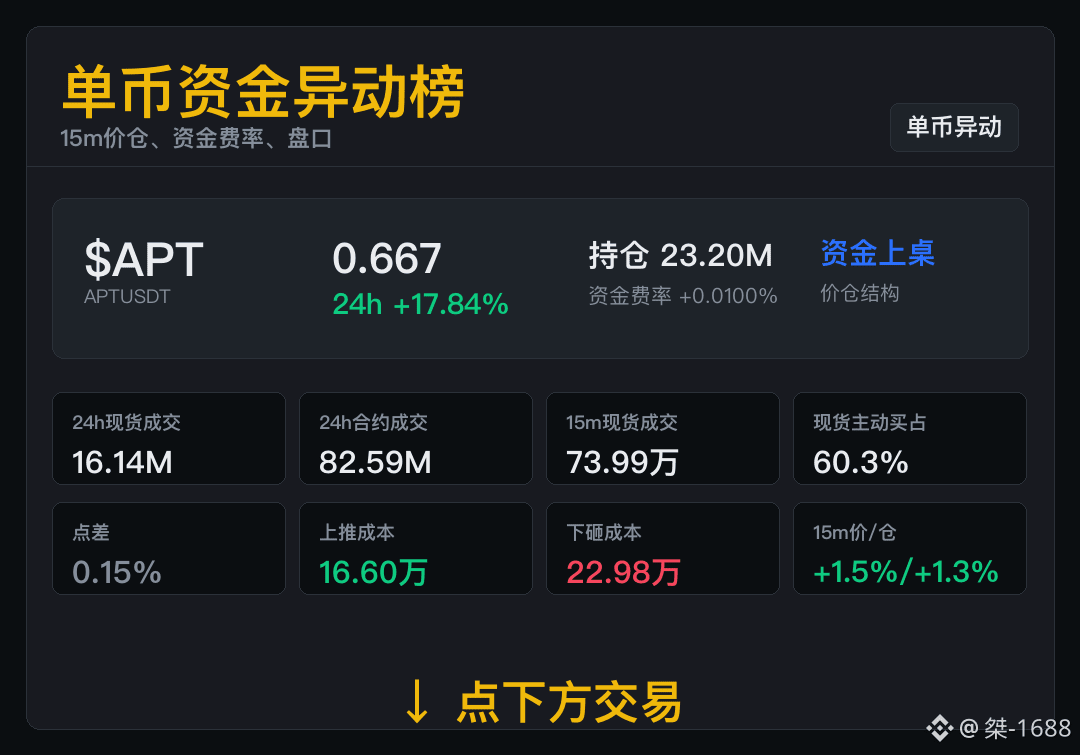
$APT 15m price warehouse positions move in the same direction and strengthen; first, we’ll see whether the increase in participation can continue.
Spot trading 16.14M, futures trading 82.59M, 15m price warehouse +1.52% / +1.30%.
Open interest and price rise together, indicating clearer intraday fund participation.
For the price to keep going, open interest and trading need to continue to coordinate.
$APT 15m price warehouse positions move in the same direction and strengthen; first, we’ll see whether the increase in participation can continue.
Spot trading 16.14M, futures trading 82.59M, 15m price warehouse +1.52% / +1.30%.
Open interest and price rise together, indicating clearer intraday fund participation.
For the price to keep going, open interest and trading need to continue to coordinate.
Spot trading 16.14M, futures trading 82.59M, 15m price warehouse +1.52% / +1.30%.
Open interest and price rise together, indicating clearer intraday fund participation.
For the price to keep going, open interest and trading need to continue to coordinate.
19
·
--
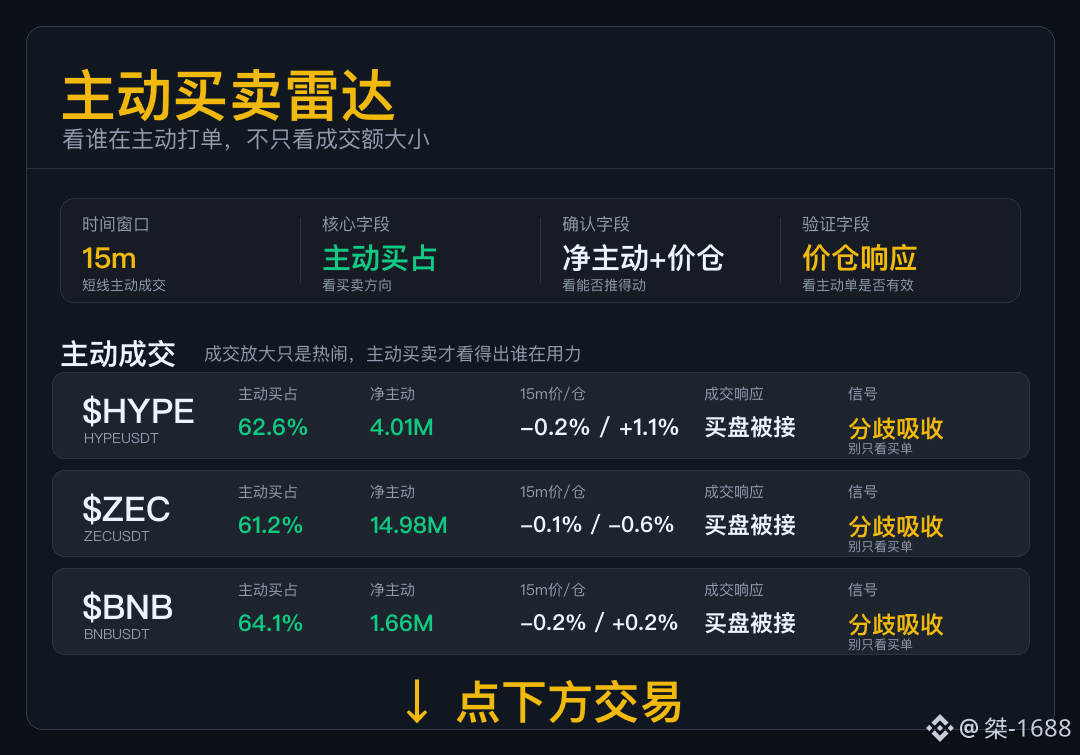
Active Buy/Sell Radar
Don’t just look at the traded amount; today this set mainly looks at whether the aggressive orders can push the order book.
$HYPE : Buy-side orders have come in, but the price hasn’t clearly opened up. Don’t treat absorbed orders as tailwind orders.
$ZEC : The data shows buy-side orders, but the price isn’t cooperating. For the short term, treat it as absorption.
$BNB : The buyer’s move is very aggressive, yet the price-pushing efficiency is weak. The order book hasn’t provided an equivalent level of feedback.
For this kind of market, the most useful information is price-pushing efficiency—if there are many buy orders but they can’t move the price, it’s being absorbed.
Active Buy/Sell Radar
Don’t just look at the traded amount; today this set mainly looks at whether the aggressive orders can push the order book.
$HYPE : Buy-side orders have come in, but the price hasn’t clearly opened up. Don’t treat absorbed orders as tailwind orders.
$ZEC : The data shows buy-side orders, but the price isn’t cooperating. For the short term, treat it as absorption.
$BNB : The buyer’s move is very aggressive, yet the price-pushing efficiency is weak. The order book hasn’t provided an equivalent level of feedback.
For this kind of market, the most useful information is price-pushing efficiency—if there are many buy orders but they can’t move the price, it’s being absorbed.
Don’t just look at the traded amount; today this set mainly looks at whether the aggressive orders can push the order book.
$HYPE : Buy-side orders have come in, but the price hasn’t clearly opened up. Don’t treat absorbed orders as tailwind orders.
$ZEC : The data shows buy-side orders, but the price isn’t cooperating. For the short term, treat it as absorption.
$BNB : The buyer’s move is very aggressive, yet the price-pushing efficiency is weak. The order book hasn’t provided an equivalent level of feedback.
For this kind of market, the most useful information is price-pushing efficiency—if there are many buy orders but they can’t move the price, it’s being absorbed.
594
·
--
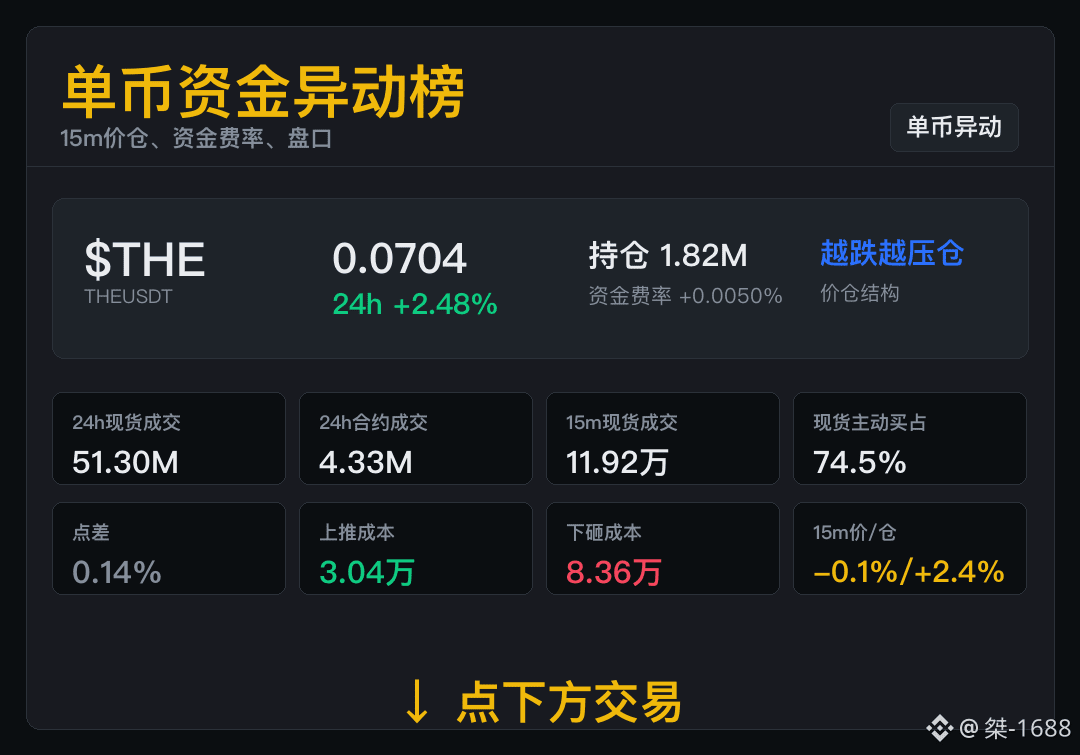
During the decline of $THE , open interest increased, indicating intensifying short-term speculation.
Current price: 0.0704, 24-hour change: +2.48%; 15-month open interest: -0.14% / +2.35%.
Price weakness accompanied by increased open interest suggests a continued expansion of short-term speculation.
The next move will depend on whether the price has bottomed out and whether the increase in open interest slows down.
During the decline of $THE , open interest increased, indicating intensifying short-term speculation.
Current price: 0.0704, 24-hour change: +2.48%; 15-month open interest: -0.14% / +2.35%.
Price weakness accompanied by increased open interest suggests a continued expansion of short-term speculation.
The next move will depend on whether the price has bottomed out and whether the increase in open interest slows down.
Current price: 0.0704, 24-hour change: +2.48%; 15-month open interest: -0.14% / +2.35%.
Price weakness accompanied by increased open interest suggests a continued expansion of short-term speculation.
The next move will depend on whether the price has bottomed out and whether the increase in open interest slows down.
187
·
--
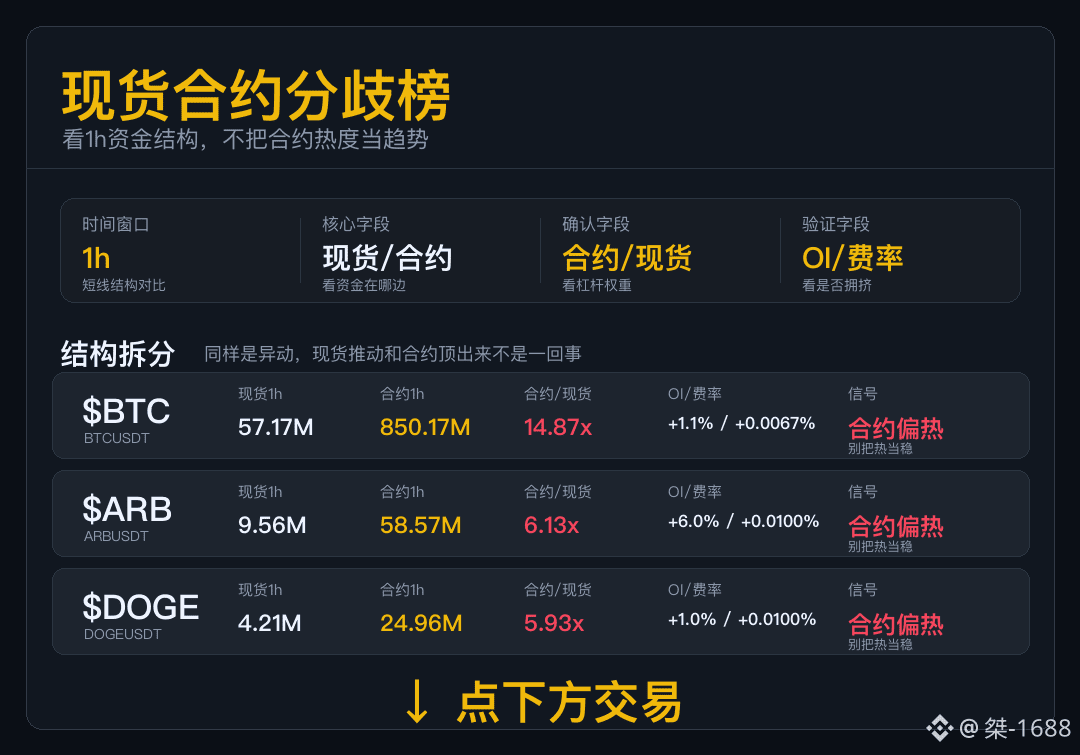
Spot Futures Contract Divergence Leaderboard
In the last 1 hour, first break down where the funds are coming from: are the spot markets following, or are the futures contracts driving the pace and competing for momentum?
$BTC The leveraged side got the atmosphere going first. Price will move faster, but if spot hasn’t picked up yet, don’t get carried away.
$ARB The futures side is hotter; the leverage vibe is heavier. This structure can surge, but it’s not suitable to chase only based on upside percentage—adding spot volume is more critical.
$DOGE Futures heat has surpassed the spot market. Short-term elasticity will be higher, but drawdowns will also be more sensitive.
When futures take the lead, it can move very quickly, but it can also rapidly lose momentum when open interest contracts.
Spot Futures Contract Divergence Leaderboard
In the last 1 hour, first break down where the funds are coming from: are the spot markets following, or are the futures contracts driving the pace and competing for momentum?
$BTC The leveraged side got the atmosphere going first. Price will move faster, but if spot hasn’t picked up yet, don’t get carried away.
$ARB The futures side is hotter; the leverage vibe is heavier. This structure can surge, but it’s not suitable to chase only based on upside percentage—adding spot volume is more critical.
$DOGE Futures heat has surpassed the spot market. Short-term elasticity will be higher, but drawdowns will also be more sensitive.
When futures take the lead, it can move very quickly, but it can also rapidly lose momentum when open interest contracts.
In the last 1 hour, first break down where the funds are coming from: are the spot markets following, or are the futures contracts driving the pace and competing for momentum?
$BTC The leveraged side got the atmosphere going first. Price will move faster, but if spot hasn’t picked up yet, don’t get carried away.
$ARB The futures side is hotter; the leverage vibe is heavier. This structure can surge, but it’s not suitable to chase only based on upside percentage—adding spot volume is more critical.
$DOGE Futures heat has surpassed the spot market. Short-term elasticity will be higher, but drawdowns will also be more sensitive.
When futures take the lead, it can move very quickly, but it can also rapidly lose momentum when open interest contracts.
312
·
--
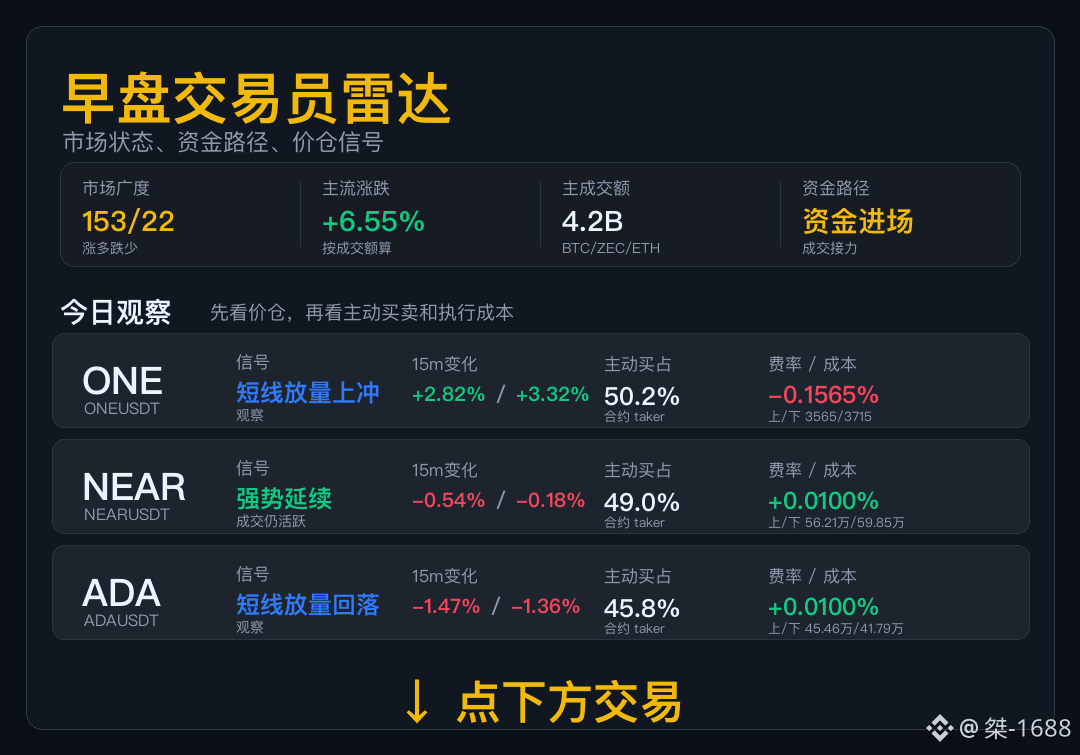
Morning Trader Radar
Today, don’t first pick the big gainers. First, check whether the number of advancing issues and the main volume are on the same side.
Market status: Binance USDT spot—153 up / 22 down. Main movers are +6.55%, with total trading volume around 4.2B. The number of gainers and the performance of main volume mutually confirm each other—broad-based strength is stronger than localized pumps.
Capital flow: This group has new money coming in. In the early session, focus on whether, on pullbacks, the volume still holds.
<t-2/>$ONE ’s structural signal isn’t hard enough yet. First, see whether the trading can continue—not just judge based on heat.
<t-1/>$NEAR remains strong and hasn’t dispersed yet, so it’s suitable to keep it on your screen. The real key is whether active buying that accounts for 49.0% can sustain.
$ADA isn’t a conclusive signal yet. First, see whether the following volume can hold the price up.
Morning Trader Radar
Today, don’t first pick the big gainers. First, check whether the number of advancing issues and the main volume are on the same side.
Market status: Binance USDT spot—153 up / 22 down. Main movers are +6.55%, with total trading volume around 4.2B. The number of gainers and the performance of main volume mutually confirm each other—broad-based strength is stronger than localized pumps.
Capital flow: This group has new money coming in. In the early session, focus on whether, on pullbacks, the volume still holds.
<t-2/>$ONE ’s structural signal isn’t hard enough yet. First, see whether the trading can continue—not just judge based on heat.
<t-1/>$NEAR remains strong and hasn’t dispersed yet, so it’s suitable to keep it on your screen. The real key is whether active buying that accounts for 49.0% can sustain.
$ADA isn’t a conclusive signal yet. First, see whether the following volume can hold the price up.
Today, don’t first pick the big gainers. First, check whether the number of advancing issues and the main volume are on the same side.
Market status: Binance USDT spot—153 up / 22 down. Main movers are +6.55%, with total trading volume around 4.2B. The number of gainers and the performance of main volume mutually confirm each other—broad-based strength is stronger than localized pumps.
Capital flow: This group has new money coming in. In the early session, focus on whether, on pullbacks, the volume still holds.
<t-2/>$ONE ’s structural signal isn’t hard enough yet. First, see whether the trading can continue—not just judge based on heat.
<t-1/>$NEAR remains strong and hasn’t dispersed yet, so it’s suitable to keep it on your screen. The real key is whether active buying that accounts for 49.0% can sustain.
$ADA isn’t a conclusive signal yet. First, see whether the following volume can hold the price up.
195
·
--
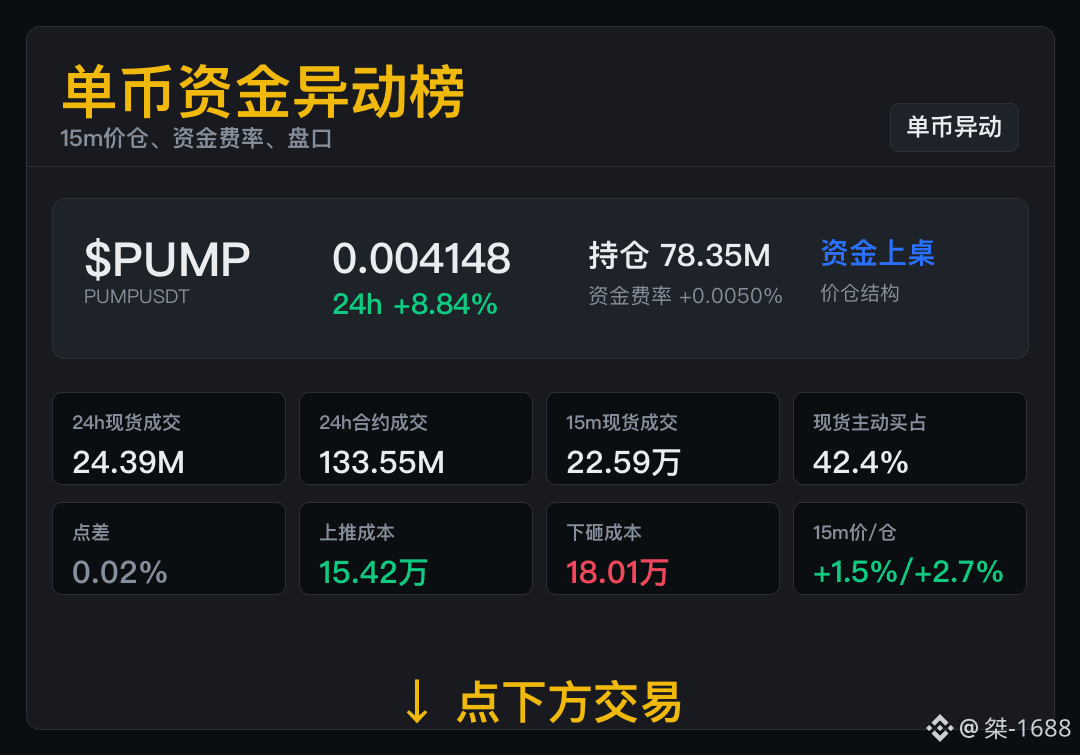
$PUMP 15m Price moving up, positions also increasing, and new participation synchronizing has appeared.
15m price +1.47%, 15m positions +2.69%; spot trading 24.39M, futures trading 133.55M.
Price rise and position expansion are happening at the same time, and there is new participation currently.
In the future, when comparing price positions and volume/energy, slow down tracking when the readings are not in sync.
$PUMP 15m Price moving up, positions also increasing, and new participation synchronizing has appeared.
15m price +1.47%, 15m positions +2.69%; spot trading 24.39M, futures trading 133.55M.
Price rise and position expansion are happening at the same time, and there is new participation currently.
In the future, when comparing price positions and volume/energy, slow down tracking when the readings are not in sync.
15m price +1.47%, 15m positions +2.69%; spot trading 24.39M, futures trading 133.55M.
Price rise and position expansion are happening at the same time, and there is new participation currently.
In the future, when comparing price positions and volume/energy, slow down tracking when the readings are not in sync.
80
·
--
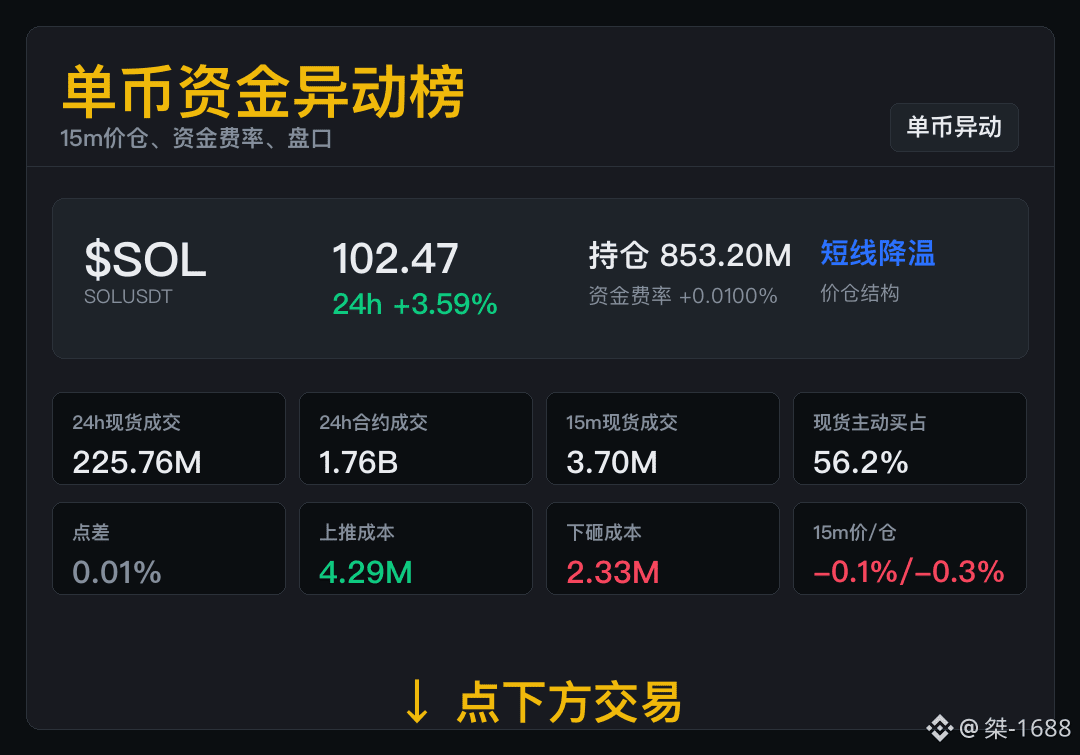
$SOL This segment shows both price and position weakening at the same time, and intraday participation is contracting.
24h change +3.59%, 15m price/cost -0.10% / -0.27%, funding rate +0.0100%.
The price/cost is moving down in sync. In the next phase, first wait for trading activity to recover.
In the next round, if price stabilizes and cost remains stable, then increase the tracking level.
$SOL This segment shows both price and position weakening at the same time, and intraday participation is contracting.
24h change +3.59%, 15m price/cost -0.10% / -0.27%, funding rate +0.0100%.
The price/cost is moving down in sync. In the next phase, first wait for trading activity to recover.
In the next round, if price stabilizes and cost remains stable, then increase the tracking level.
24h change +3.59%, 15m price/cost -0.10% / -0.27%, funding rate +0.0100%.
The price/cost is moving down in sync. In the next phase, first wait for trading activity to recover.
In the next round, if price stabilizes and cost remains stable, then increase the tracking level.
183
·
--
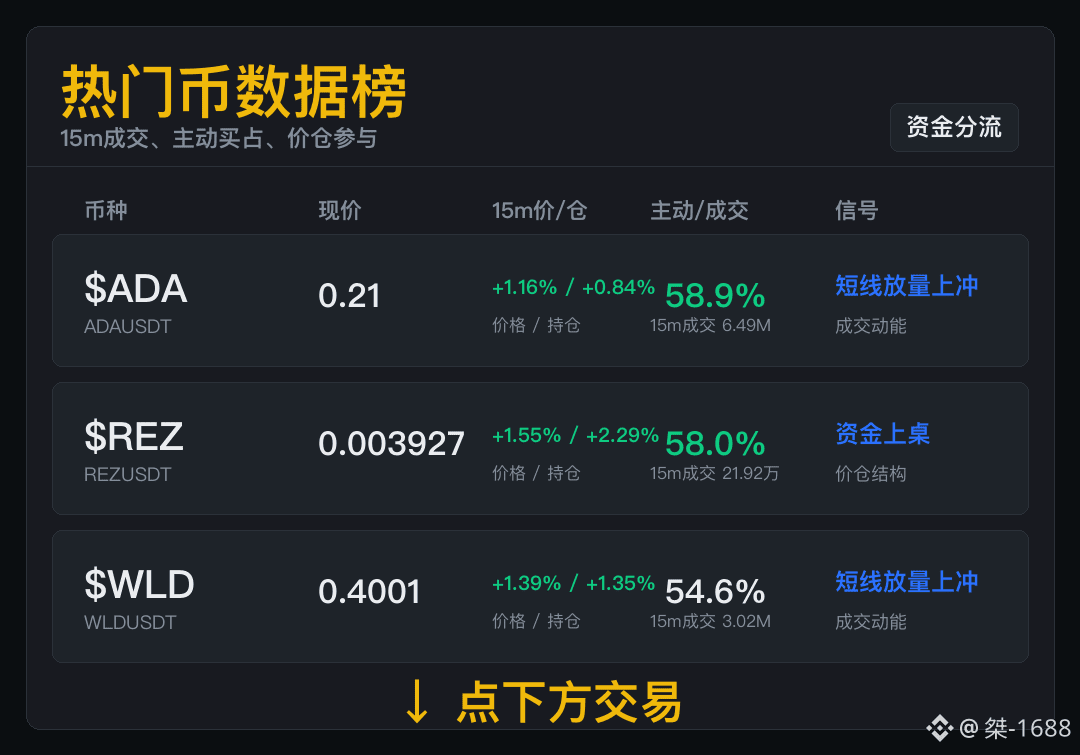
Put these out first. It’s not about calling strength or weakness; it’s about looking at trading value first.
$ADA For a short-term move, first look at the成交 6.49M: aggressive buys account for 58.9%. Then look at the price-and-position performance: +1.16% / +0.84%. The momentum is still there. Next, check whether the funds are willing to keep staying. Being popular isn’t the answer, but popular names bring traffic—and trading opportunities.
$REZ For a short-term move, first look at the成交 21.92万: aggressive buys account for 58.0%. Then look at the price-and-position performance: +1.55% / +2.29%. If you’re in cash, don’t rush—real money won’t only show you for a second. Watch how price and position move together; it’s more worth monitoring than a single K-line.
$WLD 15m成交 3.02M, aggressive buys account for 54.6%, and the price-and-position performance is +1.39% / +1.35%. The hottest coins are the easiest to get opportunities on, and also the easiest to learn hard lessons from. It has eyes on it now, but having many people watching doesn’t mean it’s easy to trade.
Put these out first. It’s not about calling strength or weakness; it’s about looking at trading value first.
$ADA For a short-term move, first look at the成交 6.49M: aggressive buys account for 58.9%. Then look at the price-and-position performance: +1.16% / +0.84%. The momentum is still there. Next, check whether the funds are willing to keep staying. Being popular isn’t the answer, but popular names bring traffic—and trading opportunities.
$REZ For a short-term move, first look at the成交 21.92万: aggressive buys account for 58.0%. Then look at the price-and-position performance: +1.55% / +2.29%. If you’re in cash, don’t rush—real money won’t only show you for a second. Watch how price and position move together; it’s more worth monitoring than a single K-line.
$WLD 15m成交 3.02M, aggressive buys account for 54.6%, and the price-and-position performance is +1.39% / +1.35%. The hottest coins are the easiest to get opportunities on, and also the easiest to learn hard lessons from. It has eyes on it now, but having many people watching doesn’t mean it’s easy to trade.
$ADA For a short-term move, first look at the成交 6.49M: aggressive buys account for 58.9%. Then look at the price-and-position performance: +1.16% / +0.84%. The momentum is still there. Next, check whether the funds are willing to keep staying. Being popular isn’t the answer, but popular names bring traffic—and trading opportunities.
$REZ For a short-term move, first look at the成交 21.92万: aggressive buys account for 58.0%. Then look at the price-and-position performance: +1.55% / +2.29%. If you’re in cash, don’t rush—real money won’t only show you for a second. Watch how price and position move together; it’s more worth monitoring than a single K-line.
$WLD 15m成交 3.02M, aggressive buys account for 54.6%, and the price-and-position performance is +1.39% / +1.35%. The hottest coins are the easiest to get opportunities on, and also the easiest to learn hard lessons from. It has eyes on it now, but having many people watching doesn’t mean it’s easy to trade.
579
·
--
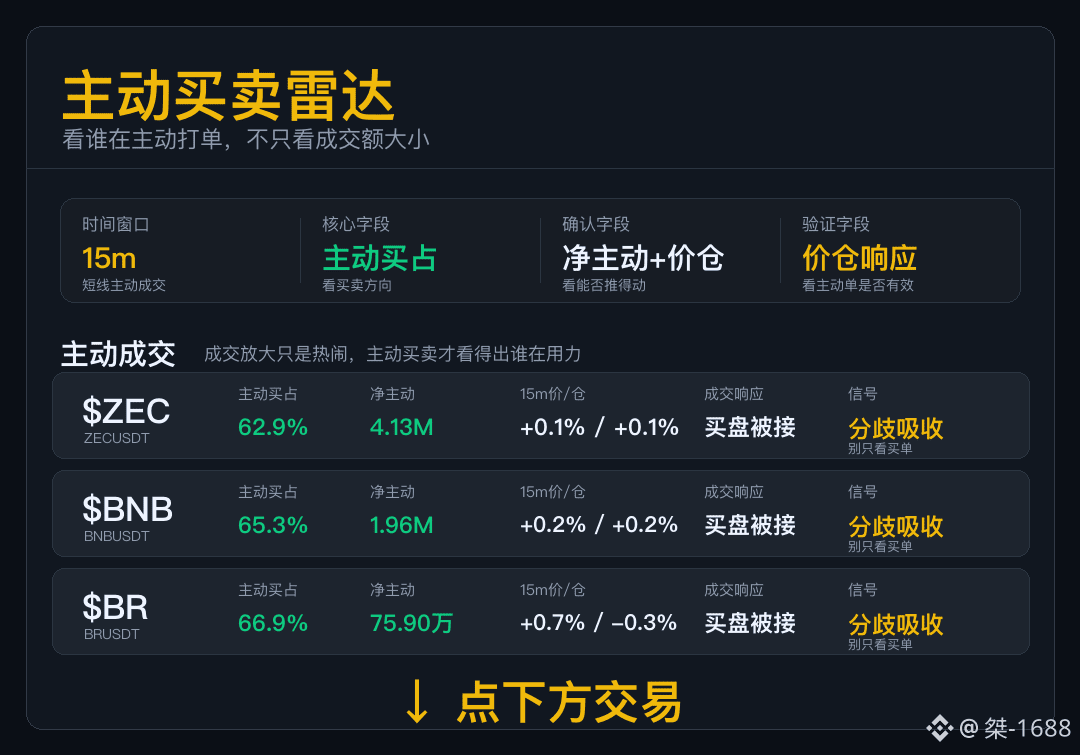
Actively Buying/Selling Radar
Don’t just look at trading volume. Today, focus on whether the aggressive orders can push the market.
$ZEC has buyer activity, but the price hasn’t immediately opened upside room, suggesting there is still overhead selling pressure.
$BNB is an active buyer, but the price-raising efficiency is average. Wait for the price to truly break out before increasing the weight.
$BR is an active buy with force, but the board hasn’t been pulled up—meaning the opposing side isn’t weak either. Next, watch who withdraws first.
If buy orders are placed but don’t push it far, the opposing order book is still there. For the next leg, pay even more attention to breakout efficiency.
Actively Buying/Selling Radar
Don’t just look at trading volume. Today, focus on whether the aggressive orders can push the market.
$ZEC has buyer activity, but the price hasn’t immediately opened upside room, suggesting there is still overhead selling pressure.
$BNB is an active buyer, but the price-raising efficiency is average. Wait for the price to truly break out before increasing the weight.
$BR is an active buy with force, but the board hasn’t been pulled up—meaning the opposing side isn’t weak either. Next, watch who withdraws first.
If buy orders are placed but don’t push it far, the opposing order book is still there. For the next leg, pay even more attention to breakout efficiency.
Don’t just look at trading volume. Today, focus on whether the aggressive orders can push the market.
$ZEC has buyer activity, but the price hasn’t immediately opened upside room, suggesting there is still overhead selling pressure.
$BNB is an active buyer, but the price-raising efficiency is average. Wait for the price to truly break out before increasing the weight.
$BR is an active buy with force, but the board hasn’t been pulled up—meaning the opposing side isn’t weak either. Next, watch who withdraws first.
If buy orders are placed but don’t push it far, the opposing order book is still there. For the next leg, pay even more attention to breakout efficiency.
191
·
--
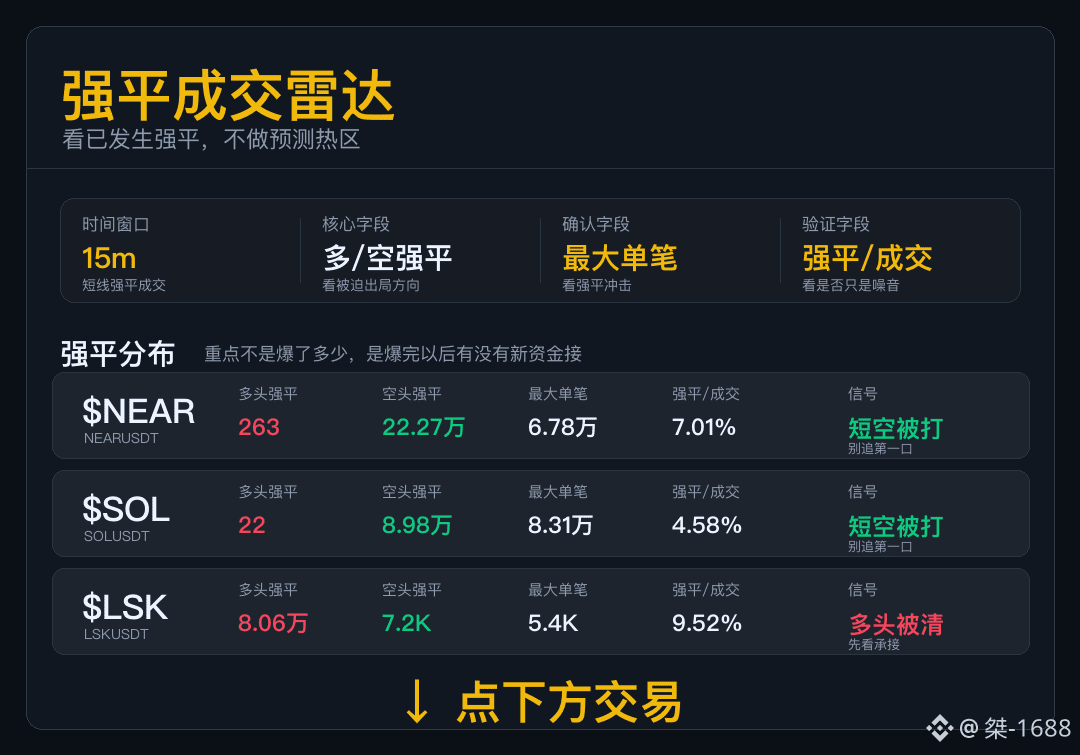
Strong Adjustment and Clearance Radar
For data like this, first look at who is being forced out.
$NEAR More shorts are forced to clear than longs; it’s more like short positions were hit and liquidated. Don’t rush to chase the first move—if the pullback can be held, it shows someone is continuing to step in.
$SOL The short forced-clearing amounts are dominant. Position buybacks have already become part of the trading volume for this segment.
$LSK More longs are passively exiting. To stabilize the market, you’ll need subsequent proactive buying to show up again.
When the forced-clearing structure diverges, what comes next should be judged by how their respective trades repair. It’s not suitable to summarize it in a single sentence.
Strong Adjustment and Clearance Radar
For data like this, first look at who is being forced out.
$NEAR More shorts are forced to clear than longs; it’s more like short positions were hit and liquidated. Don’t rush to chase the first move—if the pullback can be held, it shows someone is continuing to step in.
$SOL The short forced-clearing amounts are dominant. Position buybacks have already become part of the trading volume for this segment.
$LSK More longs are passively exiting. To stabilize the market, you’ll need subsequent proactive buying to show up again.
When the forced-clearing structure diverges, what comes next should be judged by how their respective trades repair. It’s not suitable to summarize it in a single sentence.
For data like this, first look at who is being forced out.
$NEAR More shorts are forced to clear than longs; it’s more like short positions were hit and liquidated. Don’t rush to chase the first move—if the pullback can be held, it shows someone is continuing to step in.
$SOL The short forced-clearing amounts are dominant. Position buybacks have already become part of the trading volume for this segment.
$LSK More longs are passively exiting. To stabilize the market, you’ll need subsequent proactive buying to show up again.
When the forced-clearing structure diverges, what comes next should be judged by how their respective trades repair. It’s not suitable to summarize it in a single sentence.
451
·
--
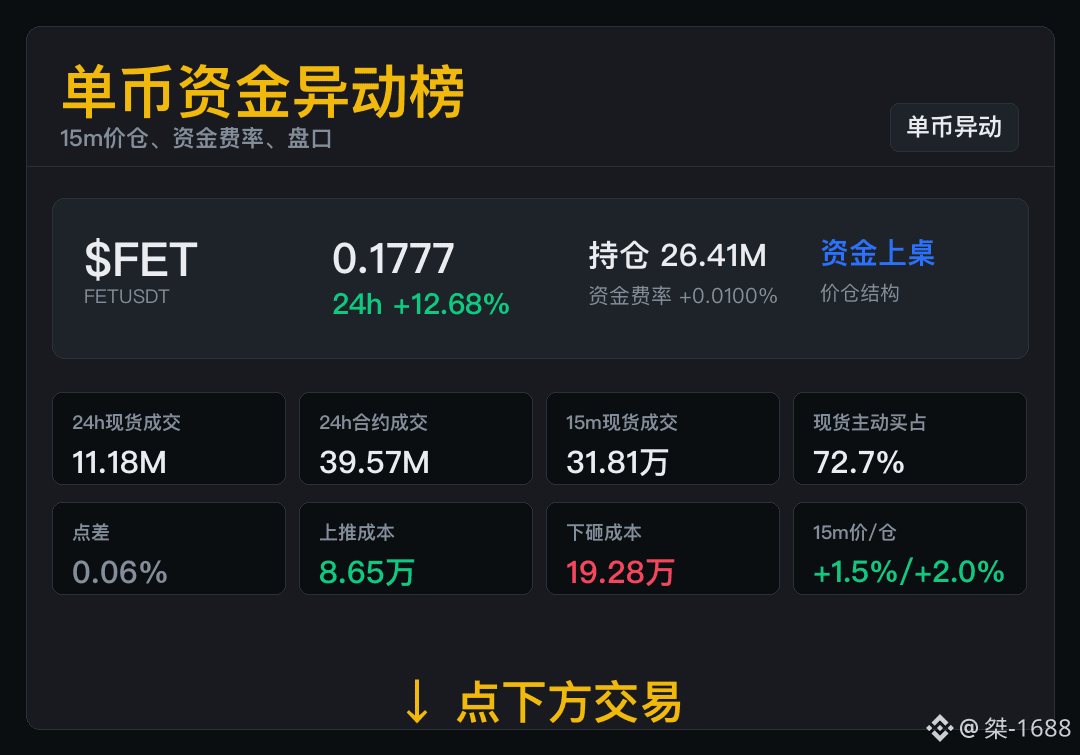
$FET price and positions are rising at the same time, and short-term participation is increasing.
15m price/position +1.54% / +2.02%, current position 26.41M, fee rate +0.0100%.
Price and positions are lifting in sync; the next step will be verified by trade continuity.
The key to watch next is whether newly added positions can continue. If volume weakens, downgrade first.
$FET price and positions are rising at the same time, and short-term participation is increasing.
15m price/position +1.54% / +2.02%, current position 26.41M, fee rate +0.0100%.
Price and positions are lifting in sync; the next step will be verified by trade continuity.
The key to watch next is whether newly added positions can continue. If volume weakens, downgrade first.
15m price/position +1.54% / +2.02%, current position 26.41M, fee rate +0.0100%.
Price and positions are lifting in sync; the next step will be verified by trade continuity.
The key to watch next is whether newly added positions can continue. If volume weakens, downgrade first.
267
·
--
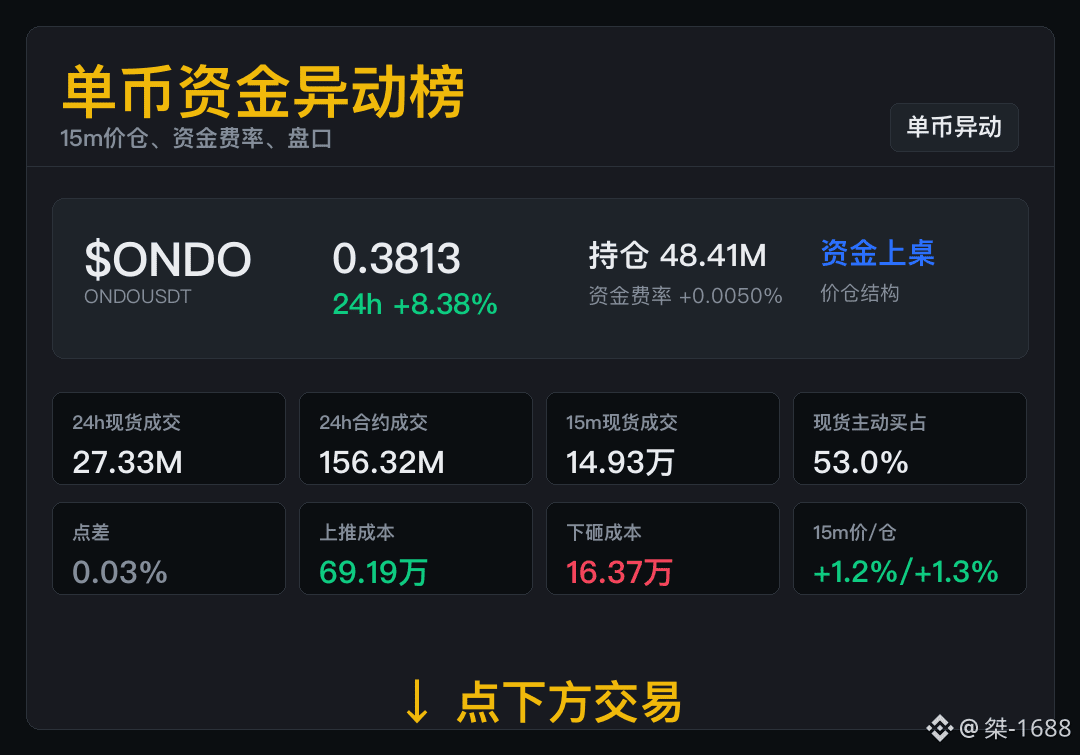
$ONDO This round of new participation lifts up, and prices rise in sync.
Current position: 48.41M. Funding rate: +0.0050%; 15m price/entry: +1.25% / +1.29%.
As price positions rise in sync, the current trend has new positioning support.
In the next round, verify the position increase and trading volume. Track again once both readings further strengthen.
$ONDO This round of new participation lifts up, and prices rise in sync.
Current position: 48.41M. Funding rate: +0.0050%; 15m price/entry: +1.25% / +1.29%.
As price positions rise in sync, the current trend has new positioning support.
In the next round, verify the position increase and trading volume. Track again once both readings further strengthen.
Current position: 48.41M. Funding rate: +0.0050%; 15m price/entry: +1.25% / +1.29%.
As price positions rise in sync, the current trend has new positioning support.
In the next round, verify the position increase and trading volume. Track again once both readings further strengthen.
201
·
--
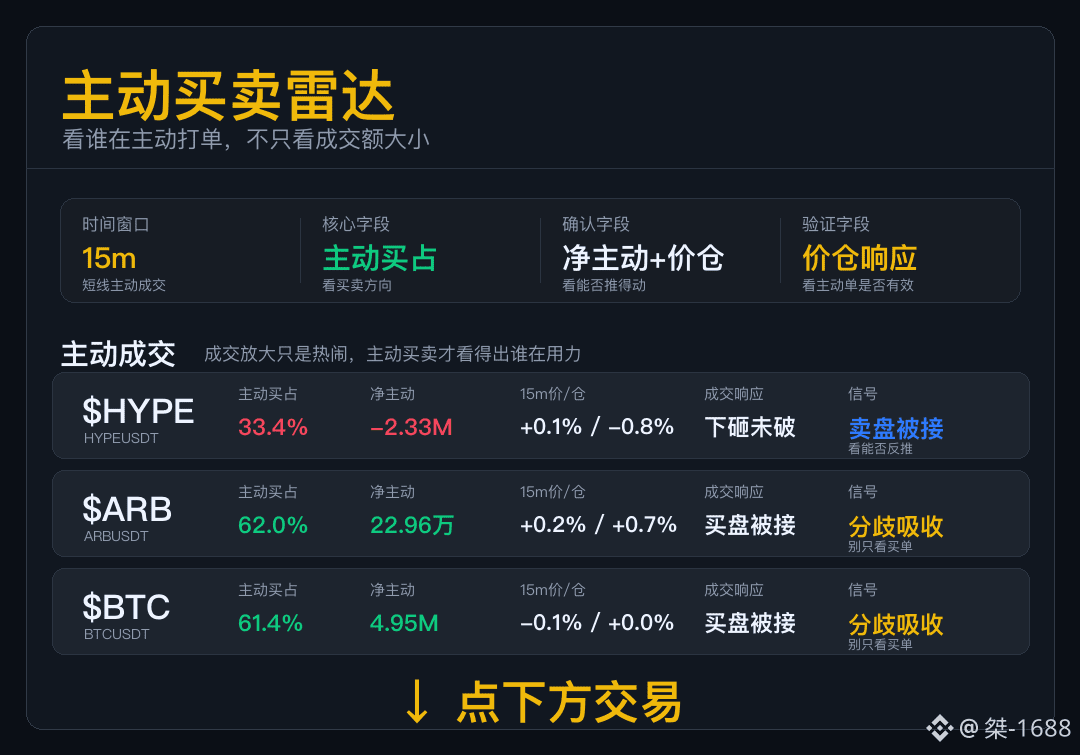
Active Buy/Sell Radar
Don’t just look at the trading volume. Today, this set mainly checks whether the aggressive orders can push the order book.
After $HYPE ’s sell order was placed, the market price could still hold steadily; it doesn’t look like a one-sided weakness in the short term. Next, watch whether the buy side can push back.
$ARB ’s aggressive buy is strong and forceful, but the price didn’t expand upward. That suggests the opposing side isn’t weak either—then we should see who backs off first.
$BTC ’s share of aggressive buys isn’t bad, but the price didn’t follow through. First, check whether the next leg can absorb the selling pressure.
The biggest concern here is mistaking it as a single unified direction at a glance. It’s more reliable to look at aggressive orders and how the price responds, coin by coin.
Active Buy/Sell Radar
Don’t just look at the trading volume. Today, this set mainly checks whether the aggressive orders can push the order book.
After $HYPE ’s sell order was placed, the market price could still hold steadily; it doesn’t look like a one-sided weakness in the short term. Next, watch whether the buy side can push back.
$ARB ’s aggressive buy is strong and forceful, but the price didn’t expand upward. That suggests the opposing side isn’t weak either—then we should see who backs off first.
$BTC ’s share of aggressive buys isn’t bad, but the price didn’t follow through. First, check whether the next leg can absorb the selling pressure.
The biggest concern here is mistaking it as a single unified direction at a glance. It’s more reliable to look at aggressive orders and how the price responds, coin by coin.
Don’t just look at the trading volume. Today, this set mainly checks whether the aggressive orders can push the order book.
After $HYPE ’s sell order was placed, the market price could still hold steadily; it doesn’t look like a one-sided weakness in the short term. Next, watch whether the buy side can push back.
$ARB ’s aggressive buy is strong and forceful, but the price didn’t expand upward. That suggests the opposing side isn’t weak either—then we should see who backs off first.
$BTC ’s share of aggressive buys isn’t bad, but the price didn’t follow through. First, check whether the next leg can absorb the selling pressure.
The biggest concern here is mistaking it as a single unified direction at a glance. It’s more reliable to look at aggressive orders and how the price responds, coin by coin.
316
·
--
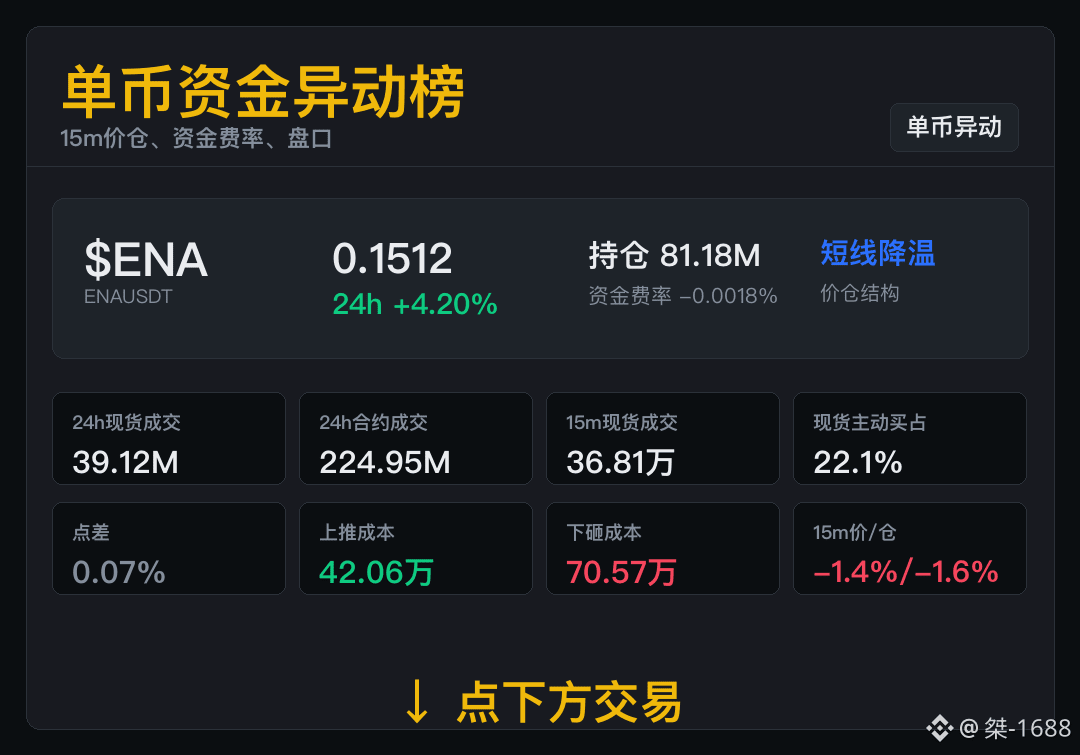
$ENA positions are being reduced amid the pullback; for now, track using a cooling-down structure.
Current price 0.1512, 15m price -1.37%, 15m positions -1.62%.
Price and positions are both pulling back; the next phase needs trades to recover in order to continue.
Next, first check whether positions have stopped declining, then verify whether trading has rebounded.
$ENA positions are being reduced amid the pullback; for now, track using a cooling-down structure.
Current price 0.1512, 15m price -1.37%, 15m positions -1.62%.
Price and positions are both pulling back; the next phase needs trades to recover in order to continue.
Next, first check whether positions have stopped declining, then verify whether trading has rebounded.
Current price 0.1512, 15m price -1.37%, 15m positions -1.62%.
Price and positions are both pulling back; the next phase needs trades to recover in order to continue.
Next, first check whether positions have stopped declining, then verify whether trading has rebounded.
330
·
--
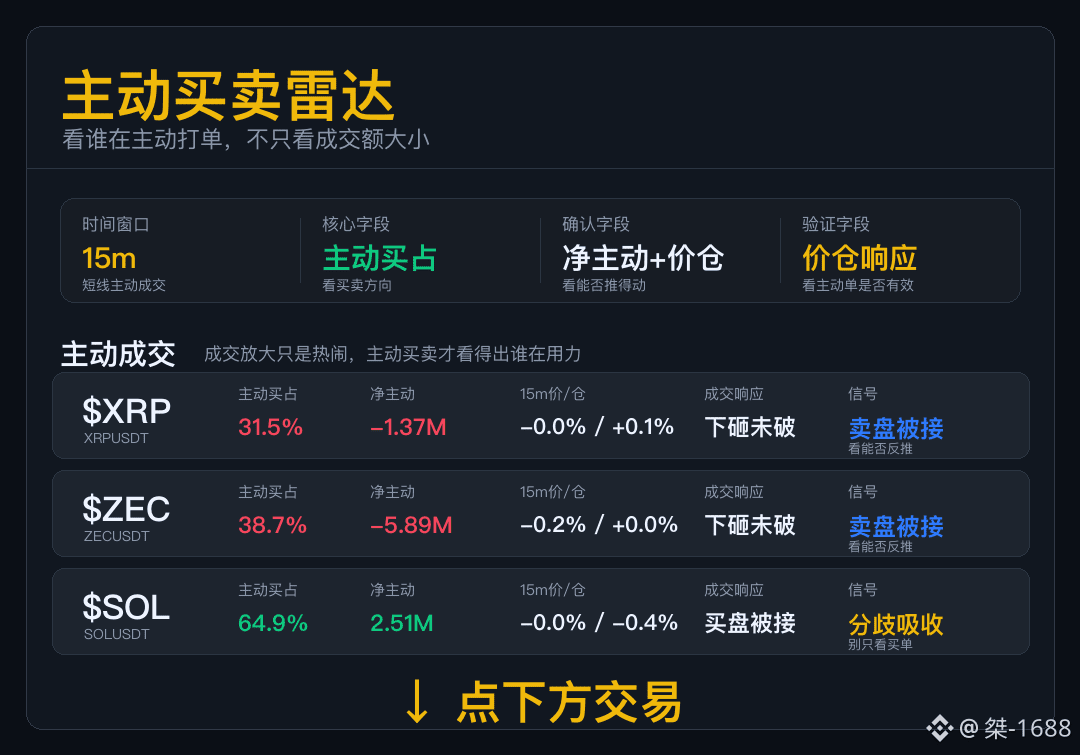
Active Buy/Sell Radar
Don’t just look at the trading value—today this set mainly checks whether aggressive orders can push the price action.
$XRP : The seller put in effort but didn’t manage to break through; the chart looks more like it’s absorbing sell pressure.
$ZEC : After the selling pressure was released, it didn’t break through again, which suggests support is still there. If you chase a short from here, be careful about getting a rebound.
$SOL : The buy side was pushed out, but the chart didn’t open up and rally as expected—this indicates someone above is still taking delivery or stacking orders.
This isn’t the same script—coin by coin, watch who can push the market, and who gets caught/supported.
Active Buy/Sell Radar
Don’t just look at the trading value—today this set mainly checks whether aggressive orders can push the price action.
$XRP : The seller put in effort but didn’t manage to break through; the chart looks more like it’s absorbing sell pressure.
$ZEC : After the selling pressure was released, it didn’t break through again, which suggests support is still there. If you chase a short from here, be careful about getting a rebound.
$SOL : The buy side was pushed out, but the chart didn’t open up and rally as expected—this indicates someone above is still taking delivery or stacking orders.
This isn’t the same script—coin by coin, watch who can push the market, and who gets caught/supported.
Don’t just look at the trading value—today this set mainly checks whether aggressive orders can push the price action.
$XRP : The seller put in effort but didn’t manage to break through; the chart looks more like it’s absorbing sell pressure.
$ZEC : After the selling pressure was released, it didn’t break through again, which suggests support is still there. If you chase a short from here, be careful about getting a rebound.
$SOL : The buy side was pushed out, but the chart didn’t open up and rally as expected—this indicates someone above is still taking delivery or stacking orders.
This isn’t the same script—coin by coin, watch who can push the market, and who gets caught/supported.
1
657
·
--
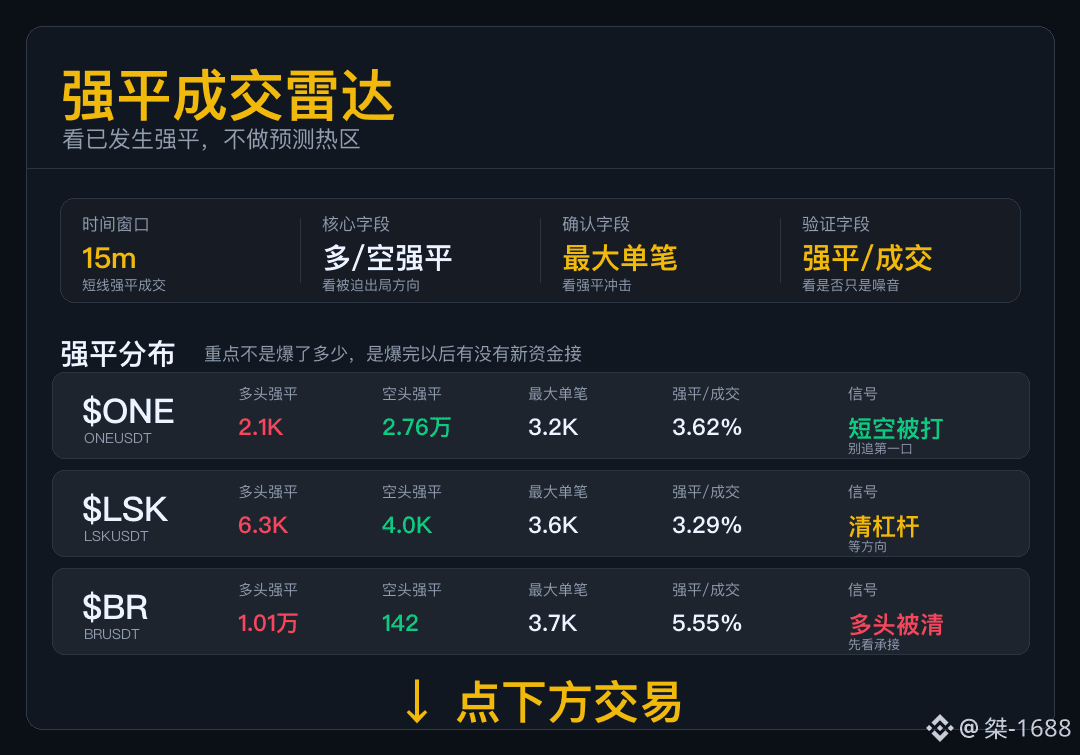
In a strong liquidation cross, the forced exits first
For data like this, first look at who is forced out.
$ONE The short liquidation amount is dominant, and covering orders have become part of the trades within this segment.
When $LSK long and short are both swept, the first segment looks more like wiping leverage; the direction needs to wait until the trades reposition themselves.
$BR 15m The long liquidations are clearly higher than the shorts—leveraged longs are being forced to withdraw.
When liquidation structure splits, what comes next depends on how each side’s trades repair itself; it’s not something you can summarize in a single sentence.
In a strong liquidation cross, the forced exits first
For data like this, first look at who is forced out.
$ONE The short liquidation amount is dominant, and covering orders have become part of the trades within this segment.
When $LSK long and short are both swept, the first segment looks more like wiping leverage; the direction needs to wait until the trades reposition themselves.
$BR 15m The long liquidations are clearly higher than the shorts—leveraged longs are being forced to withdraw.
When liquidation structure splits, what comes next depends on how each side’s trades repair itself; it’s not something you can summarize in a single sentence.
For data like this, first look at who is forced out.
$ONE The short liquidation amount is dominant, and covering orders have become part of the trades within this segment.
When $LSK long and short are both swept, the first segment looks more like wiping leverage; the direction needs to wait until the trades reposition themselves.
$BR 15m The long liquidations are clearly higher than the shorts—leveraged longs are being forced to withdraw.
When liquidation structure splits, what comes next depends on how each side’s trades repair itself; it’s not something you can summarize in a single sentence.
252
·
--
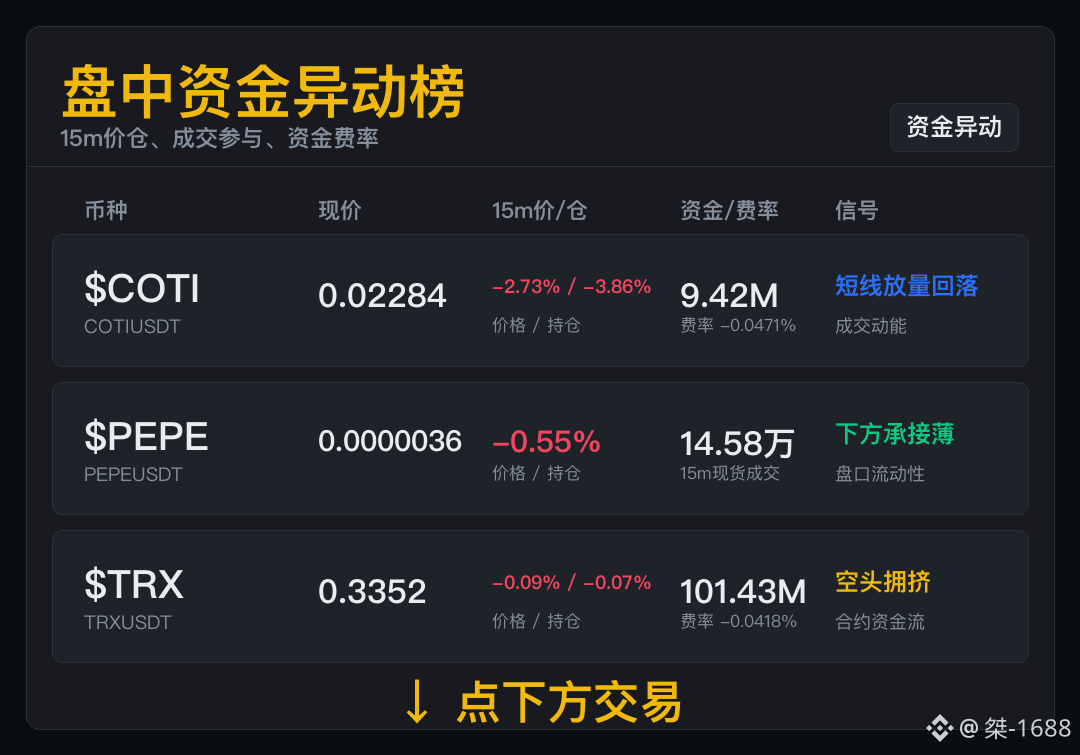
For this round, first look at the flow of funds—don’t focus on who’s best at grabbing the spotlight.
$COTI 15m spot trade: 447,300 (ten-thousands), spread 0.09%. First, look at spot follow-through. This kind of coin at least has people watching and trading it. The key is whether the next candle can continue. It now has a stage—whether it can “perform” further depends on what comes next.
$PEPE 15m spot trade: 145,800 (ten-thousands), spread 0.28%. First, look at spot follow-through. Screen-filling isn’t unusual. What’s rare is whether it can stay near the front row. Don’t treat screen-filling as a signal—what matters is whether trading volume can hold.
$TRX 15m price/position -0.09% / -0.07%, position size 101.43M, funding rate -0.0418%. If you’re chasing shorts, first see whether it can still break. If it can’t break, it’s no longer a “cheap short.” Once this kind of market gets a rebound, shorts will have a very hard time.
For this round, first look at the flow of funds—don’t focus on who’s best at grabbing the spotlight.
$COTI 15m spot trade: 447,300 (ten-thousands), spread 0.09%. First, look at spot follow-through. This kind of coin at least has people watching and trading it. The key is whether the next candle can continue. It now has a stage—whether it can “perform” further depends on what comes next.
$PEPE 15m spot trade: 145,800 (ten-thousands), spread 0.28%. First, look at spot follow-through. Screen-filling isn’t unusual. What’s rare is whether it can stay near the front row. Don’t treat screen-filling as a signal—what matters is whether trading volume can hold.
$TRX 15m price/position -0.09% / -0.07%, position size 101.43M, funding rate -0.0418%. If you’re chasing shorts, first see whether it can still break. If it can’t break, it’s no longer a “cheap short.” Once this kind of market gets a rebound, shorts will have a very hard time.
$COTI 15m spot trade: 447,300 (ten-thousands), spread 0.09%. First, look at spot follow-through. This kind of coin at least has people watching and trading it. The key is whether the next candle can continue. It now has a stage—whether it can “perform” further depends on what comes next.
$PEPE 15m spot trade: 145,800 (ten-thousands), spread 0.28%. First, look at spot follow-through. Screen-filling isn’t unusual. What’s rare is whether it can stay near the front row. Don’t treat screen-filling as a signal—what matters is whether trading volume can hold.
$TRX 15m price/position -0.09% / -0.07%, position size 101.43M, funding rate -0.0418%. If you’re chasing shorts, first see whether it can still break. If it can’t break, it’s no longer a “cheap short.” Once this kind of market gets a rebound, shorts will have a very hard time.
385
·
--
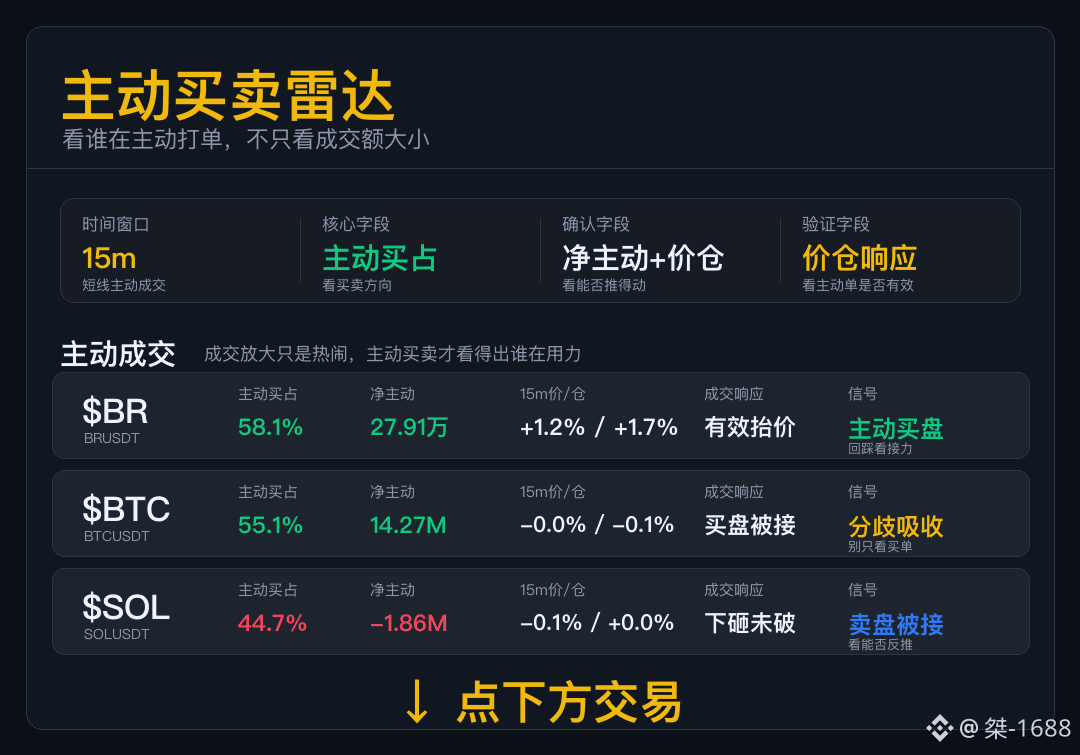
Active Buy/Sell Radar
Don’t just look at trading volume. Today, this set mainly checks whether aggressive orders can push the market.
After buy order $BR is sent in, the price moves with it. In the short term, the initiative is held by the buyers, but the continuation still requires fresh trades.
When buy order $BTC comes in, the order book doesn’t show a clear breakout—don’t treat an absorption (absorbing) order as a tailwind/propelling move.
Sell side $SOL makes the first move, but the price doesn’t collapse in trend. This indicates the support isn’t just for show.
This isn’t the same script. Watch coin by coin to see who can push it and who gets met by the other side.
Active Buy/Sell Radar
Don’t just look at trading volume. Today, this set mainly checks whether aggressive orders can push the market.
After buy order $BR is sent in, the price moves with it. In the short term, the initiative is held by the buyers, but the continuation still requires fresh trades.
When buy order $BTC comes in, the order book doesn’t show a clear breakout—don’t treat an absorption (absorbing) order as a tailwind/propelling move.
Sell side $SOL makes the first move, but the price doesn’t collapse in trend. This indicates the support isn’t just for show.
This isn’t the same script. Watch coin by coin to see who can push it and who gets met by the other side.
Don’t just look at trading volume. Today, this set mainly checks whether aggressive orders can push the market.
After buy order $BR is sent in, the price moves with it. In the short term, the initiative is held by the buyers, but the continuation still requires fresh trades.
When buy order $BTC comes in, the order book doesn’t show a clear breakout—don’t treat an absorption (absorbing) order as a tailwind/propelling move.
Sell side $SOL makes the first move, but the price doesn’t collapse in trend. This indicates the support isn’t just for show.
This isn’t the same script. Watch coin by coin to see who can push it and who gets met by the other side.
169
·
--
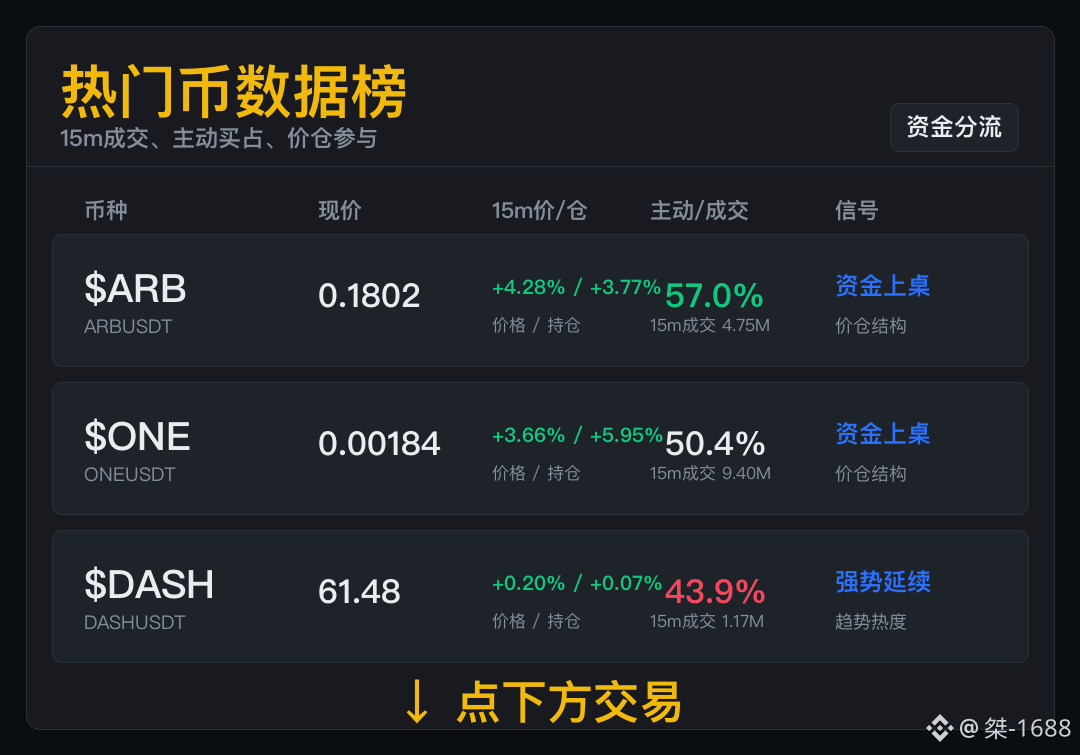
Market attention has gathered; now let’s break it down to look at each coin’s funding status.
$ARB —For the short term, first look at the trade volume: 4.75M, with active buy orders accounting for 57.0%. Then look at price-position change: +4.28% / +3.77%. If you already have a position, keep an eye on the pullback—only when it can be picked up (absorbed) does it count as this round of money not having left. This kind of setup can be brought to the table to watch, but don’t treat the first push as the finish line.
$ONE —For the short term, first look at trade volume: 9.40M, with active buy orders accounting for 50.4%. Then look at price-position change: +3.66% / +5.95%. If you’re currently out of the market, don’t rush—real money participation usually leaves more clues. This isn’t just “watching it run hot”; someone has started to push positions into the market.
$DASH 15m—Trade volume: 1.17M, active buy orders accounting for 43.9%, with price-position change: +0.20% / +0.07%. If you’re the one who missed the move (FOMO), don’t lose your rhythm by being too impatient—strong setups will also give you pullbacks. You can watch strength, but it’s the pullback’s ability to be supported that reveals the real vs. fake.
Market attention has gathered; now let’s break it down to look at each coin’s funding status.
$ARB —For the short term, first look at the trade volume: 4.75M, with active buy orders accounting for 57.0%. Then look at price-position change: +4.28% / +3.77%. If you already have a position, keep an eye on the pullback—only when it can be picked up (absorbed) does it count as this round of money not having left. This kind of setup can be brought to the table to watch, but don’t treat the first push as the finish line.
$ONE —For the short term, first look at trade volume: 9.40M, with active buy orders accounting for 50.4%. Then look at price-position change: +3.66% / +5.95%. If you’re currently out of the market, don’t rush—real money participation usually leaves more clues. This isn’t just “watching it run hot”; someone has started to push positions into the market.
$DASH 15m—Trade volume: 1.17M, active buy orders accounting for 43.9%, with price-position change: +0.20% / +0.07%. If you’re the one who missed the move (FOMO), don’t lose your rhythm by being too impatient—strong setups will also give you pullbacks. You can watch strength, but it’s the pullback’s ability to be supported that reveals the real vs. fake.
$ARB —For the short term, first look at the trade volume: 4.75M, with active buy orders accounting for 57.0%. Then look at price-position change: +4.28% / +3.77%. If you already have a position, keep an eye on the pullback—only when it can be picked up (absorbed) does it count as this round of money not having left. This kind of setup can be brought to the table to watch, but don’t treat the first push as the finish line.
$ONE —For the short term, first look at trade volume: 9.40M, with active buy orders accounting for 50.4%. Then look at price-position change: +3.66% / +5.95%. If you’re currently out of the market, don’t rush—real money participation usually leaves more clues. This isn’t just “watching it run hot”; someone has started to push positions into the market.
$DASH 15m—Trade volume: 1.17M, active buy orders accounting for 43.9%, with price-position change: +0.20% / +0.07%. If you’re the one who missed the move (FOMO), don’t lose your rhythm by being too impatient—strong setups will also give you pullbacks. You can watch strength, but it’s the pullback’s ability to be supported that reveals the real vs. fake.
552
·
--
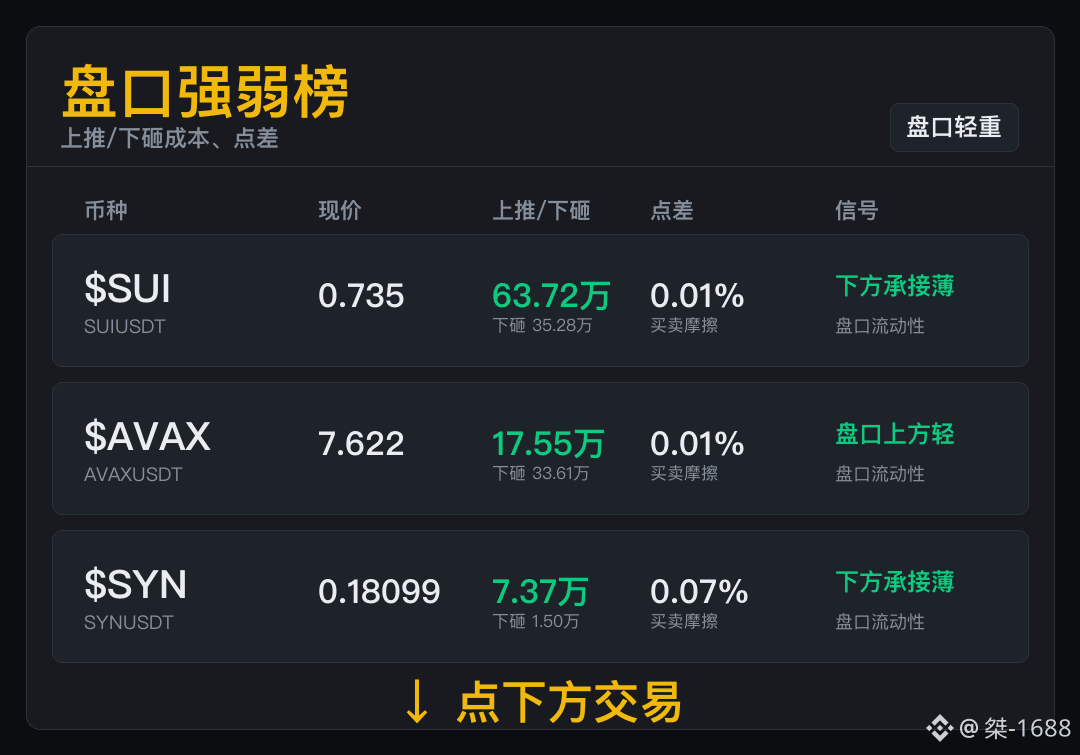
With the same amount of funds, pushing upward and smashing downward lead to very different results.
$SUI executes by first checking the top-and-bottom costs: pushing up costs 637,200, while smashing down costs 352,800, with a spread of 0.01%. The most frightening kind of market is one that looks stable—until you smash and find there’s nobody underneath. Until the support is replenished, “hotness” can’t be taken as a safety cushion.
$AVAX has a spread of 0.01%. The cost to push up is 175,500. First, see whether the executed trades can be taken over. Thin liquidity at the top is just the road conditions—whether you can drive through depends on whether there’s buy-side participation keeping up. The order book provides the road conditions; what really matters is whether there are people willing to drive price up.
$SYN checks three items from the order book: pushing up costs 73,700, smashing down costs 15,000, with a spread of 0.07%. Don’t stubbornly hold long positions. Thin support means the pullback will happen faster than you expect. The most dangerous thing about this kind of market is thinking only about making money, without figuring out clearly how to get out.
With the same amount of funds, pushing upward and smashing downward lead to very different results.
$SUI executes by first checking the top-and-bottom costs: pushing up costs 637,200, while smashing down costs 352,800, with a spread of 0.01%. The most frightening kind of market is one that looks stable—until you smash and find there’s nobody underneath. Until the support is replenished, “hotness” can’t be taken as a safety cushion.
$AVAX has a spread of 0.01%. The cost to push up is 175,500. First, see whether the executed trades can be taken over. Thin liquidity at the top is just the road conditions—whether you can drive through depends on whether there’s buy-side participation keeping up. The order book provides the road conditions; what really matters is whether there are people willing to drive price up.
$SYN checks three items from the order book: pushing up costs 73,700, smashing down costs 15,000, with a spread of 0.07%. Don’t stubbornly hold long positions. Thin support means the pullback will happen faster than you expect. The most dangerous thing about this kind of market is thinking only about making money, without figuring out clearly how to get out.
$SUI executes by first checking the top-and-bottom costs: pushing up costs 637,200, while smashing down costs 352,800, with a spread of 0.01%. The most frightening kind of market is one that looks stable—until you smash and find there’s nobody underneath. Until the support is replenished, “hotness” can’t be taken as a safety cushion.
$AVAX has a spread of 0.01%. The cost to push up is 175,500. First, see whether the executed trades can be taken over. Thin liquidity at the top is just the road conditions—whether you can drive through depends on whether there’s buy-side participation keeping up. The order book provides the road conditions; what really matters is whether there are people willing to drive price up.
$SYN checks three items from the order book: pushing up costs 73,700, smashing down costs 15,000, with a spread of 0.07%. Don’t stubbornly hold long positions. Thin support means the pullback will happen faster than you expect. The most dangerous thing about this kind of market is thinking only about making money, without figuring out clearly how to get out.
442
Log in to explore more content
Join global crypto users on Binance Square
⚡️ Get latest and useful information about crypto.
💬 Trusted by the world’s largest crypto exchange.
👍 Discover real insights from verified creators.
Email / Phone number
Trending Topics
BOJHikesRatesTo31YearHigh
592 views
57 Discussing
BOJ Hikes Rates to a 31-Year High
Article Body
The Bank of Japan (BOJ) has raised its policy interes
anwarali0
·0 Likes
·16 views
ChainlinkPowersBottomlinePaymentPlatform
4,909 views
162 Discussing
DtcpayCompletes$25MSeriesA
0 views
2 Discussing