

Leo524
706 Posts

Leo524
Report
Block User
👉Leo524 👈
Trade With Confidence ✔

XRP Holder
High-Frequency Trader
3.4 Years
1 Following
1.4K+ Followers
4.2K+ Liked
Posts
All
Quotes
Videos
PINNED
·
--
See translation
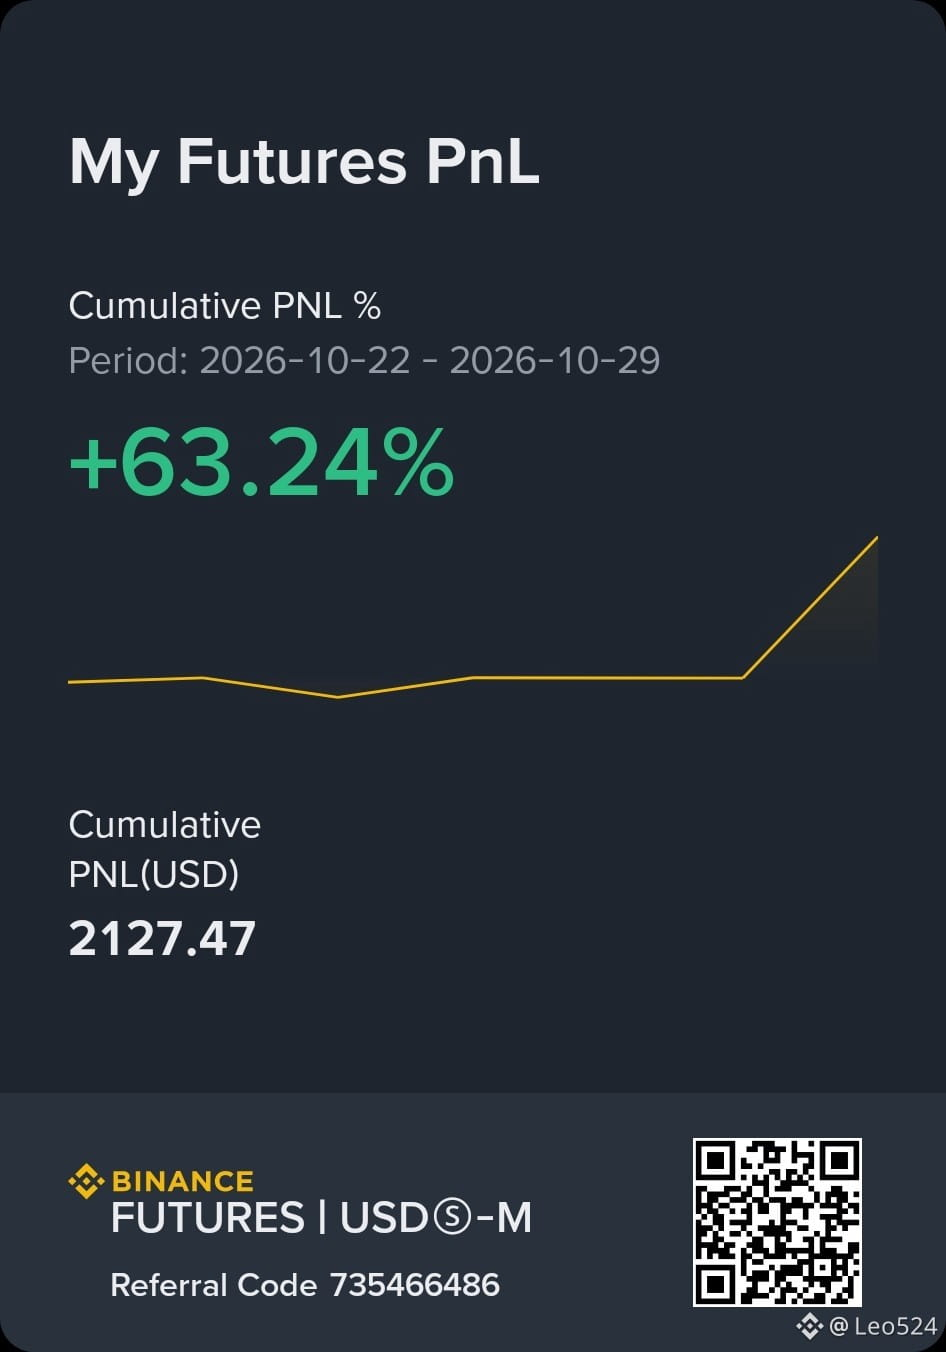
One week. One big milestone 📈💚
Proud of the progress we’ve made with LEO524. Seeing the account grow by 111%+ over the past week is a great feeling.
Every move comes with lessons, and every result reminds me why patience, discipline, and consistency matter.
Grateful for the journey. More work ahead, and we keep moving forward. 🚀
#CryptoTrading. g #tradingjourney #Leo524 #BinanceSquare #EarningsSeason
16
18
3.7k
·
--
See translation
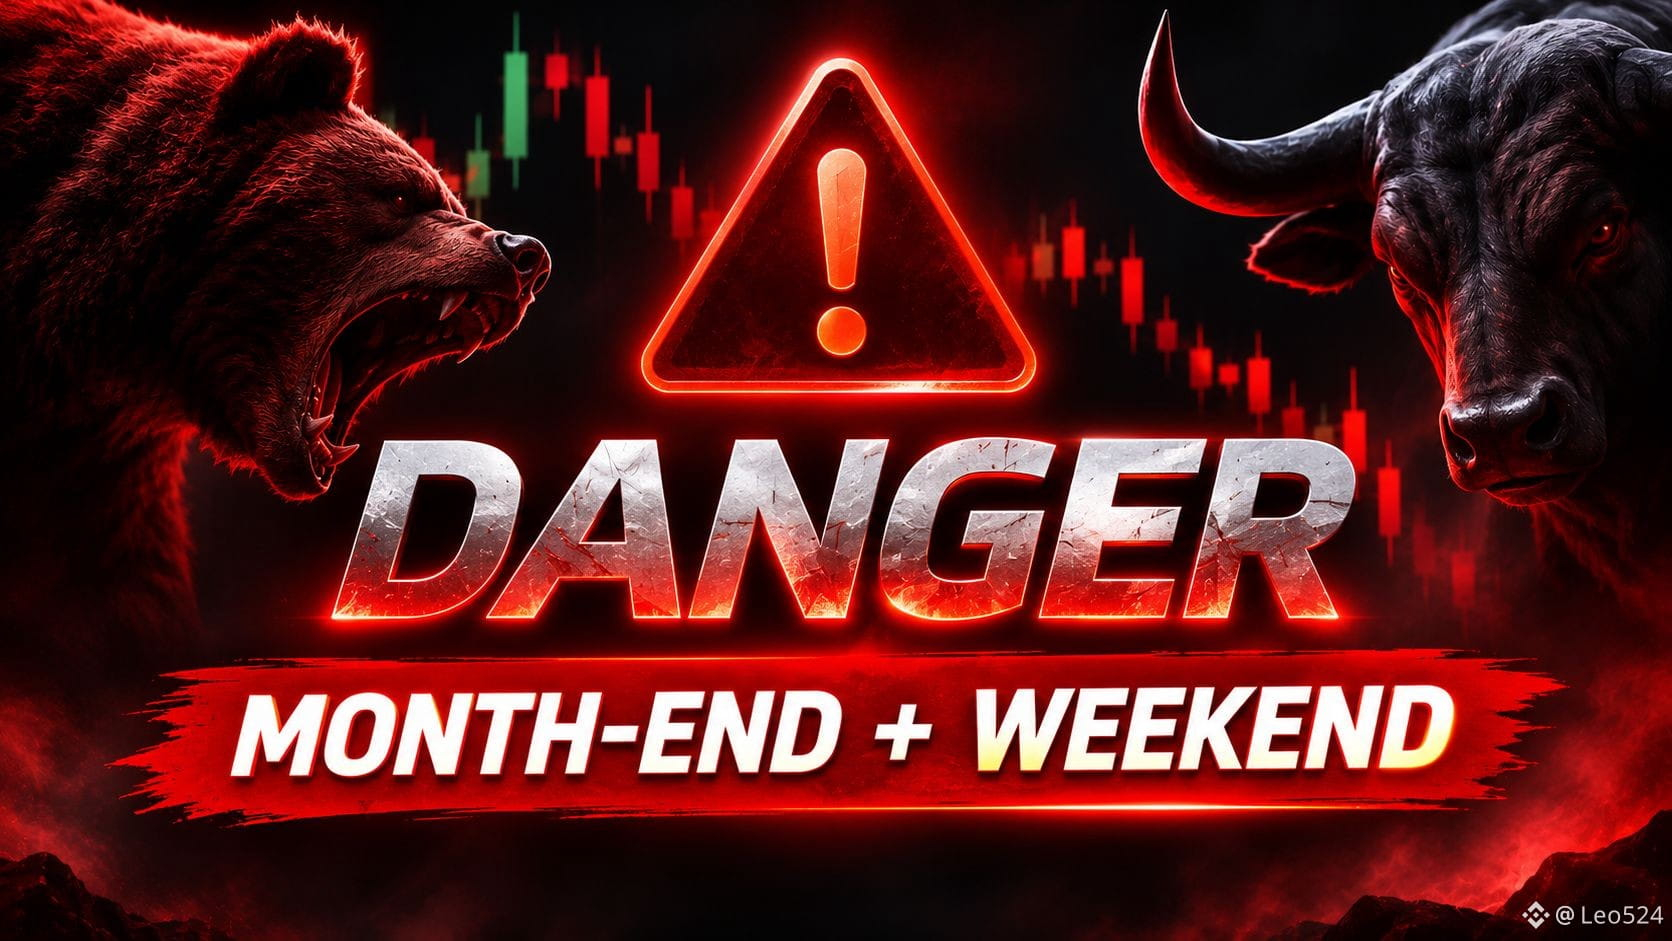
MONTH-END + WEEKEND — BE CAREFUL WITH THE MARKET!
Today marks the end of the month, and we are also heading into the weekend. This is a period where market movements can become unpredictable, and liquidity hunts are very possible.
Large players may take advantage of lower weekend liquidity to push prices in either direction, trigger stop losses, sweep liquidity levels, and create sudden moves that can trap both long and short traders.
Don't rush into trades just because you see a sudden breakout or breakdown. Some of these moves may look like real market direction but could simply be liquidity grabs before the market makes its actual move.
My advice : Stay away from unnecessary trades and focus on watching the market until Monday.
#Crypto #CryptoTrading #LEO524
1
3
405
·
--
Bearish
See translation
$FIL all tp
{spot}(FILUSDT)
$FIL all tp
Leo524
·
--
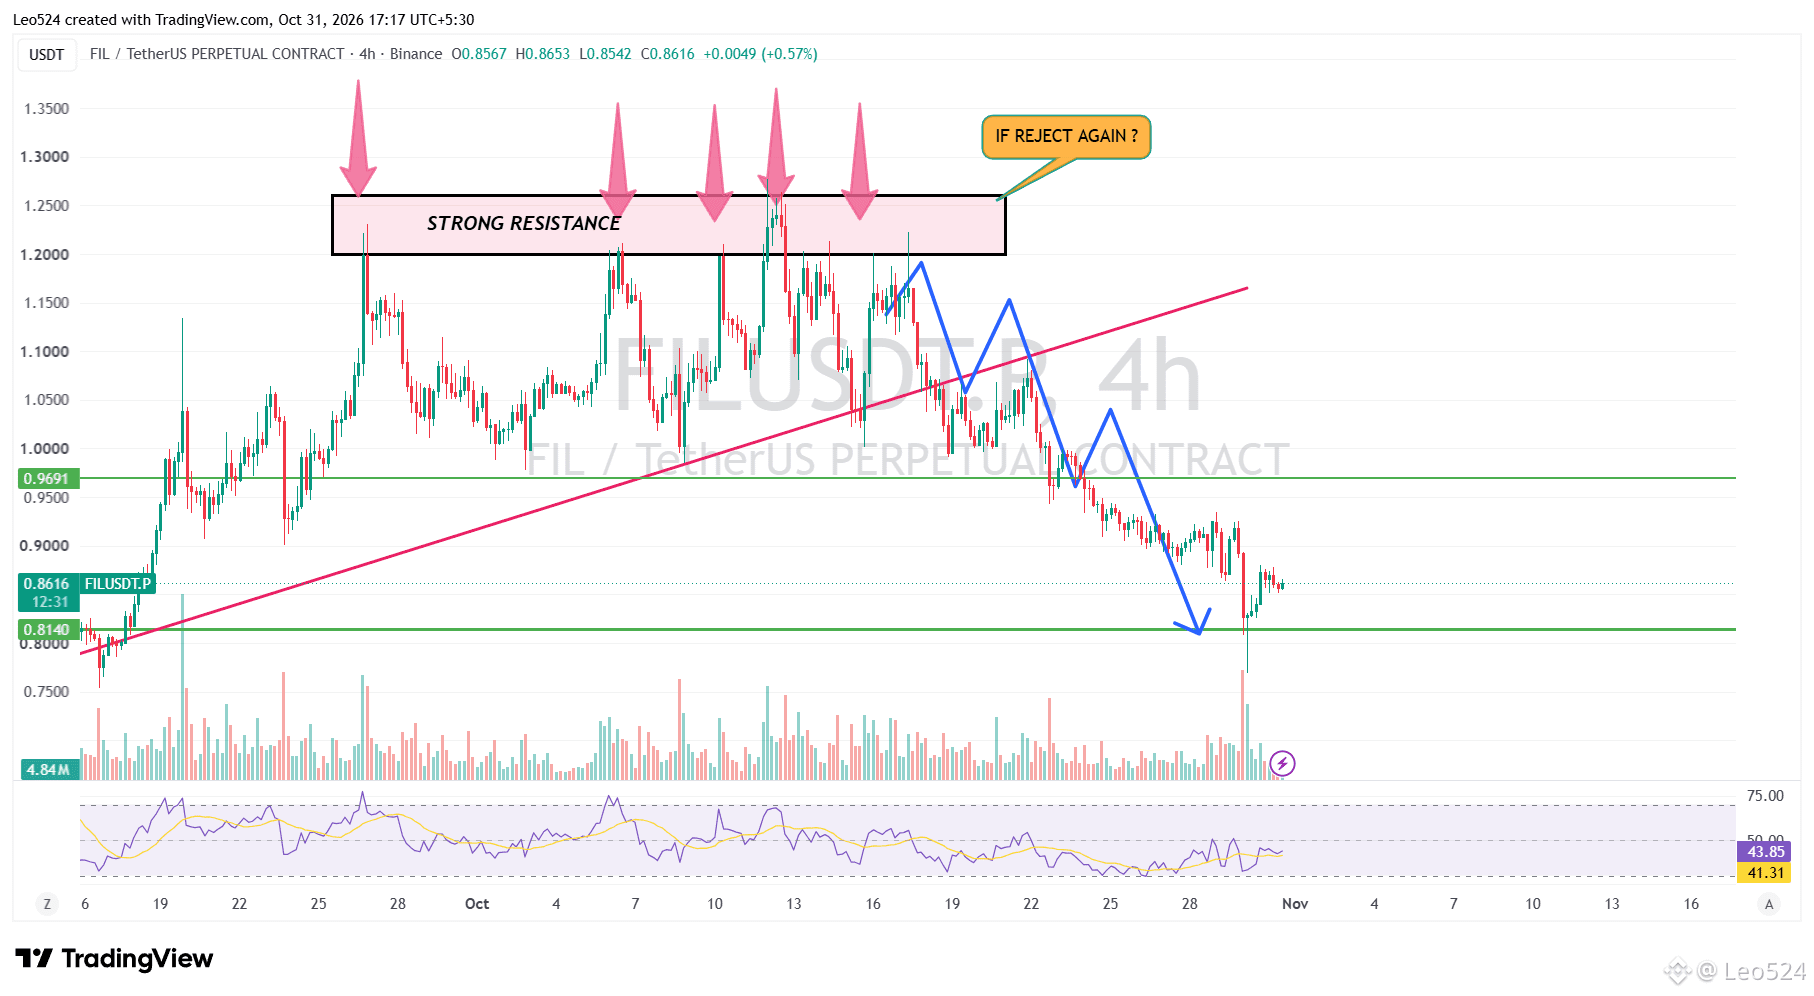
Bearish$FIL Another reject ?? Or Breakout ? 👀
3
560
·
--
Bullish
See translation
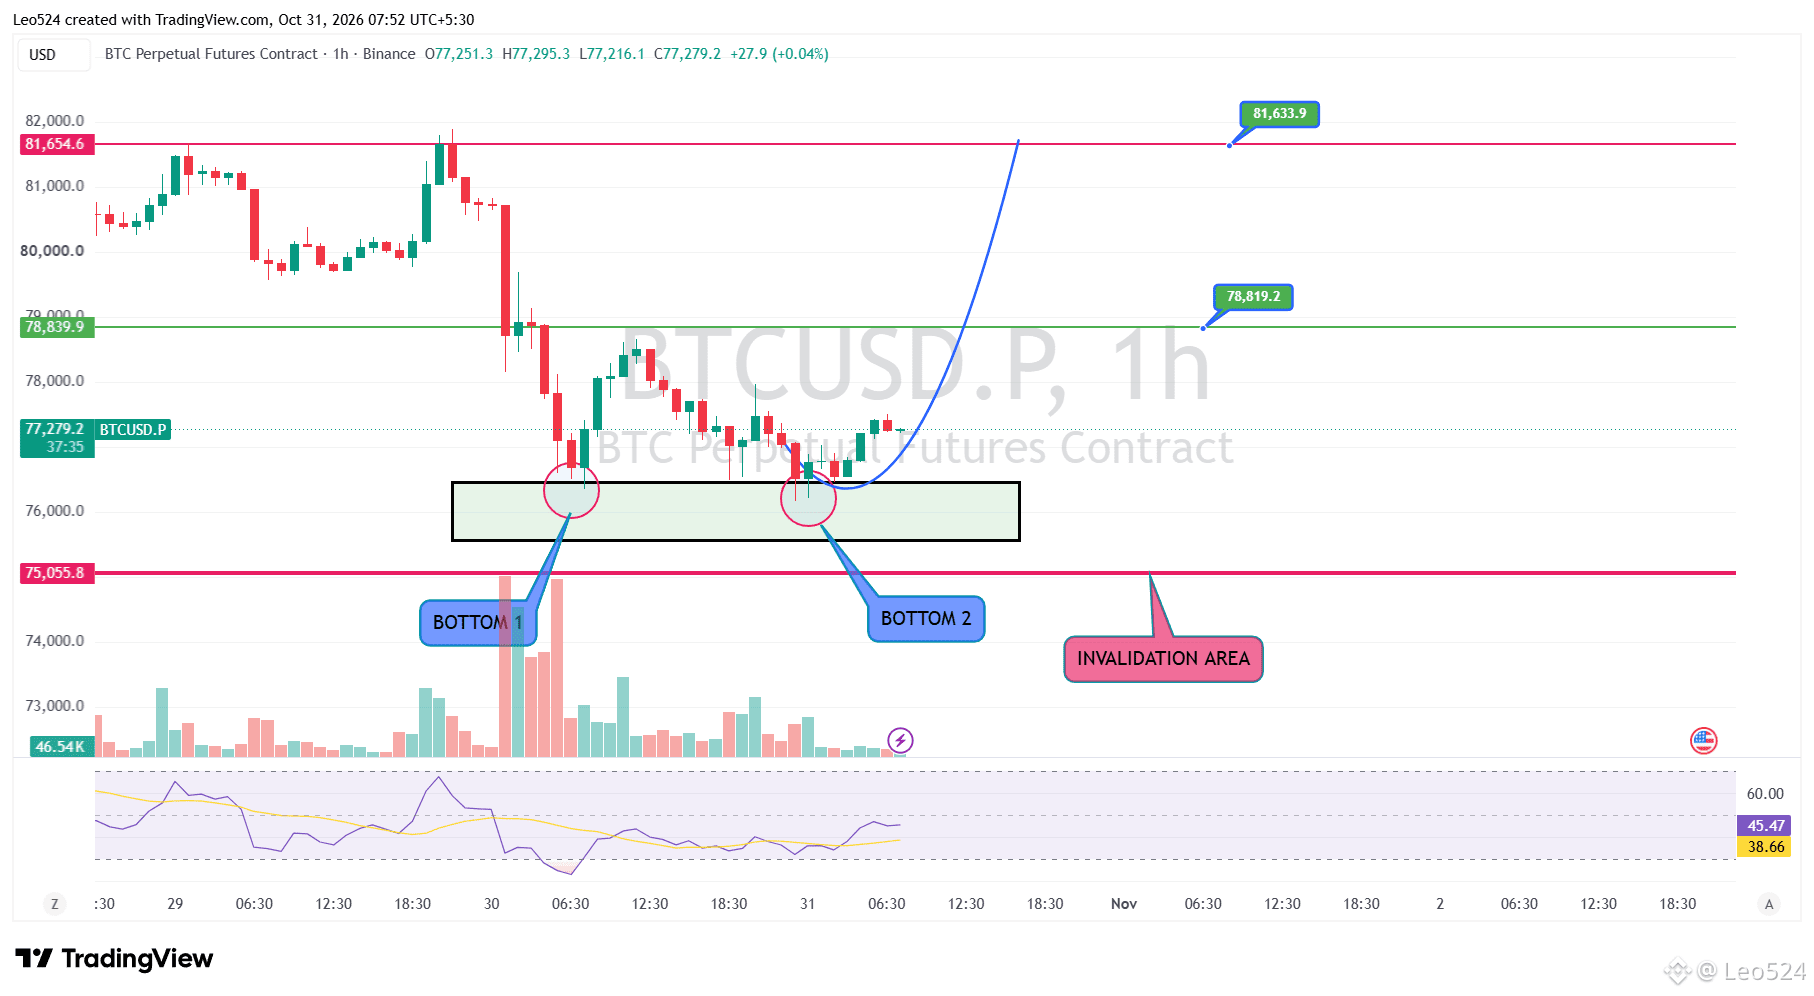
$BTC : ARE BUYERS FINALLY TAKING CONTROL ?
BTC has bounced from the $76K area twice now. Buyers are clearly trying to defend this zone, and we might be seeing a double bottom forming on the 1H chart. If selling pressure keeps slowing down and buyers manage to push higher, $78.8K and eventually $81.6K could be next.
But personally, I'm not looking to enter a LONG just yet. I want to see BTC get back above $80K and hold it with a proper 4H or daily candle close. Until then, I don't think there's enough confirmation to trust this recovery.
If the current support fails, the whole bullish idea could change, especially if BTC drops below $75K. For now, I'm just watching. Let's see if buyers can actually take control this time.
4
895
·
--
See translation
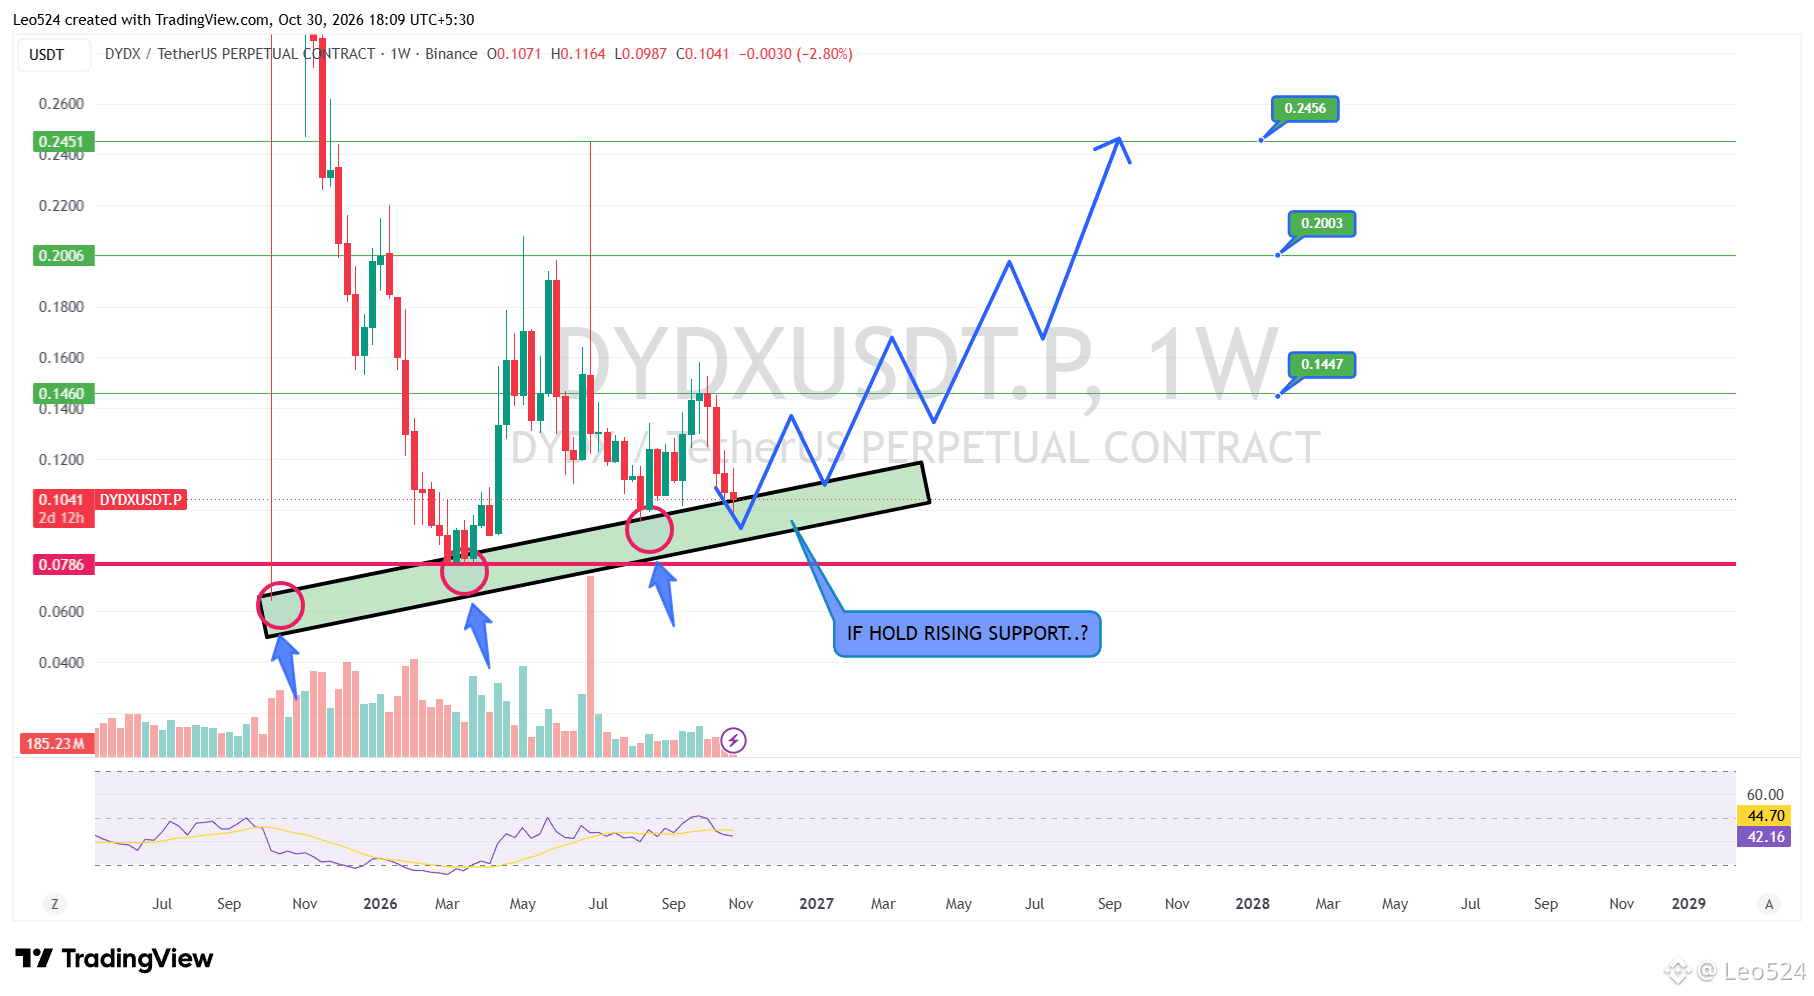
$DYDX: IS A BIG RECOVERY SETUP FORMING ..?
DYDX is testing a rising support zone that has held price several times. Buyers have stepped in around this trendline, making it a key area to watch. The weekly close will be important.
If support holds and momentum improves, the next resistance levels are $0.1447, $0.2003 and $0.2456. These are possible upside levels, not guaranteed targets.
A weekly breakdown below the trendline would weaken the setup, with $0.0786 as the next major support. RSI remains below 50, so bullish confirmation is still needed.
#Crypto #CryptoTrading #LEO524
$DYDX : IS A BIG RECOVERY SETUP FORMING ..?
DYDX is testing a rising support zone that has held price several times. Buyers have stepped in around this trendline, making it a key area to watch. The weekly close will be important.
If support holds and momentum improves, the next resistance levels are $0.1447, $0.2003 and $0.2456. These are possible upside levels, not guaranteed targets.
A weekly breakdown below the trendline would weaken the setup, with $0.0786 as the next major support. RSI remains below 50, so bullish confirmation is still needed.
#Crypto #CryptoTrading #LEO524
3
684
·
--
See translation
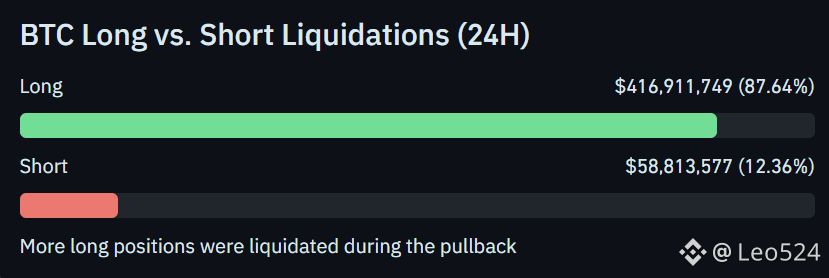
$BTC Traders Lose $475M in Liquidations Today
Bitcoin has seen a massive liquidation event, with over $475 million wiped out in a single day.
🔴 Long liquidations: $416.89M
🟢 Short liquidations: $58.81M
💰 Total: $475.70M
BTC volatility exceeded 6.47%, leaving 20,594 traders liquidated worldwide.
What's interesting is that almost 88% of the liquidations came from LONG positions.
Many buyers were caught on the wrong side of the market during today's volatility.
Events like this show how quickly leveraged positions can get wiped out. Keep an eye on market structure and avoid taking unnecessary risks.
#Bitcoin #BTC #CryptoMarket #LEO524
4
649
·
--
Bullish
See translation
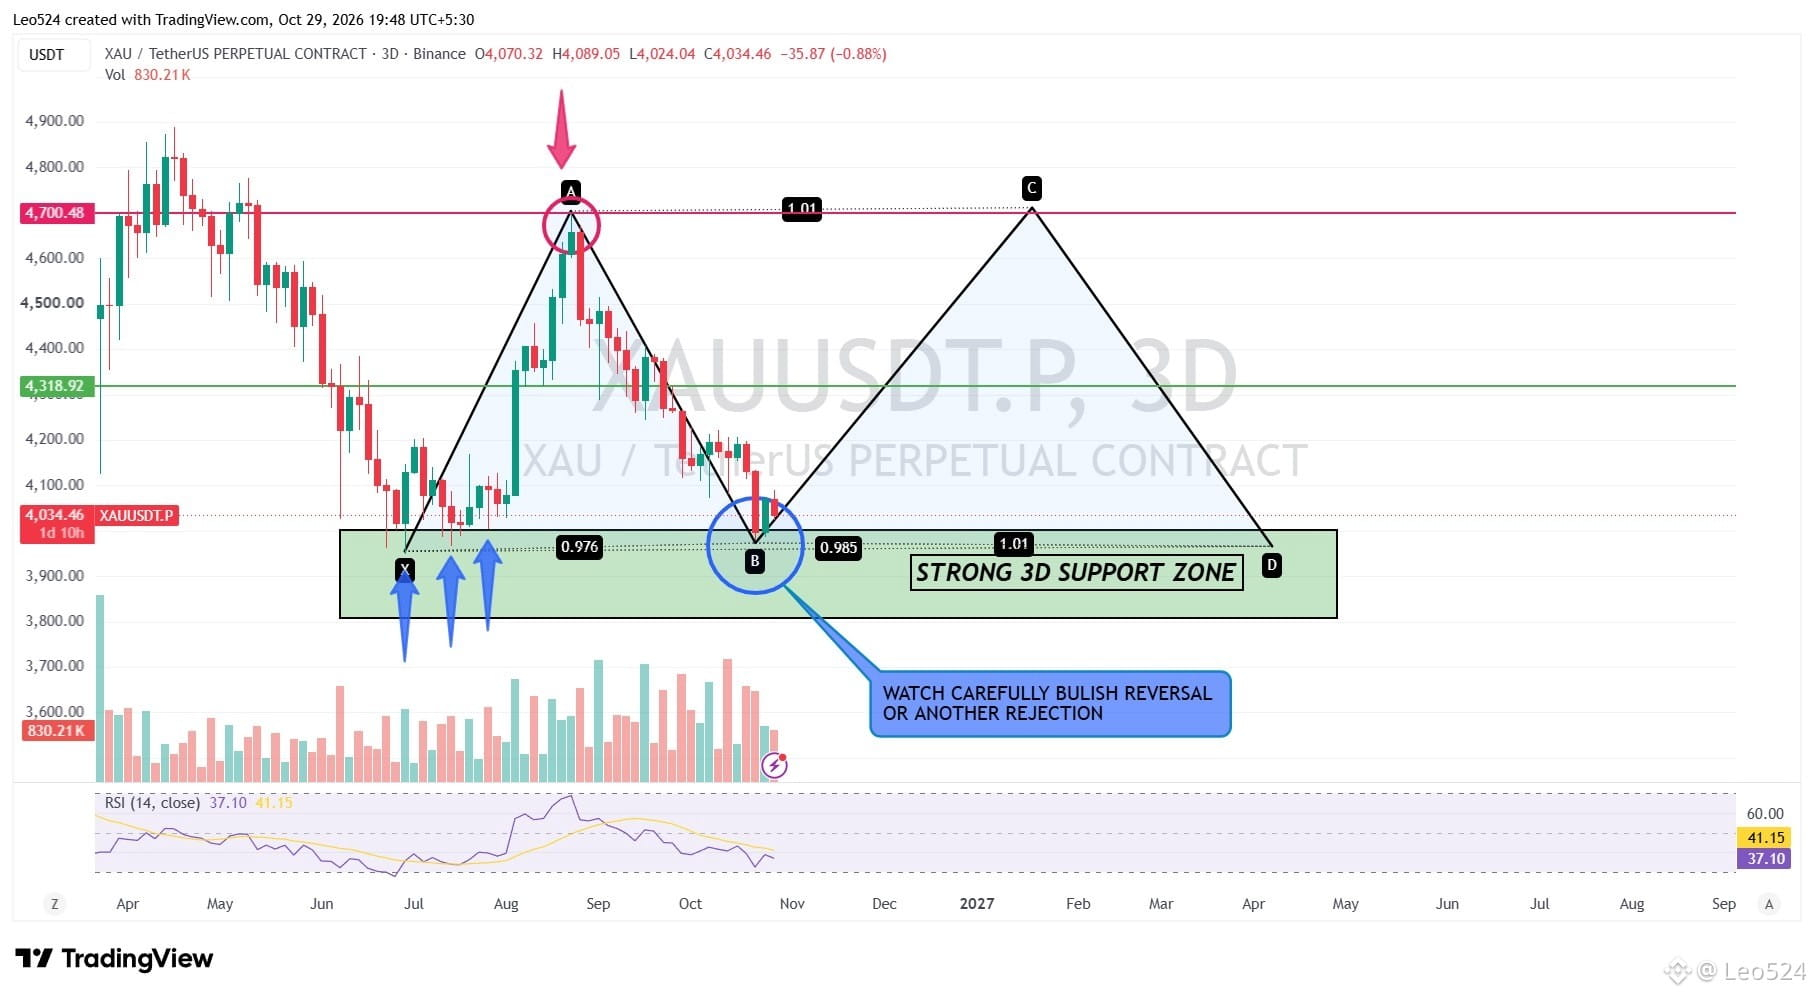
GOLD will hit 4700$ ..? A HARMONIC REVERSAL SETUP IS FORMING !
$XAU USD is approaching a strong 3D support zone around $3,800–$3,950. The chart shows a potential harmonic pattern, with price testing the key support area near point B. This zone could become an important area for a bullish reversal if buyers step in.
👀 If support holds and bullish confirmation appears, gold could recover toward $4,318 and potentially retest the $4,700 resistance zone. However, if support fails, further downside remains possible.
Watch price action carefully for a confirmed reversal, strong bullish candles, and a shift in market structure before drawing conclusions. The harmonic setup is still a possibility, not a confirmed reversal.
#xauusdtrader #GOLD_UPDATE #HarmonicPatterns #LEO524
{future}(XAUUSDT)
GOLD will hit 4700$ ..? A HARMONIC REVERSAL SETUP IS FORMING !
$XAU USD is approaching a strong 3D support zone around $3,800–$3,950. The chart shows a potential harmonic pattern, with price testing the key support area near point B. This zone could become an important area for a bullish reversal if buyers step in.
👀 If support holds and bullish confirmation appears, gold could recover toward $4,318 and potentially retest the $4,700 resistance zone. However, if support fails, further downside remains possible.
Watch price action carefully for a confirmed reversal, strong bullish candles, and a shift in market structure before drawing conclusions. The harmonic setup is still a possibility, not a confirmed reversal.
#xauusdtrader #GOLD_UPDATE #HarmonicPatterns #LEO524
1
385
·
--
See translation
QUALITY OVER QUANTITY — A LESSON EVERY TRADER SHOULD LEARN!
Some traders expect profits every day. If the market stays quiet for a day or two, they get impatient and start looking for quick money. 😂
But experienced traders know that more trades don’t always mean more profits. Opening 10+ trades every day without proper confirmation can lead to unnecessary losses.
The key is patience. Wait for the market to reach the right levels, look for strong confirmation, and enter when the setup makes sense. Sometimes, doing nothing is the smartest trading decision.
Remember, trading is not about how many trades you open. It’s about the quality of the decisions you make. 🎯
Quality > Quantity. Always trade with a plan. 📈
#CryptoTrends2024 o #TradingSignals #bitcoin.” n #TradingPsycholog y #Leo524
2
222
·
--
Bullish
See translation
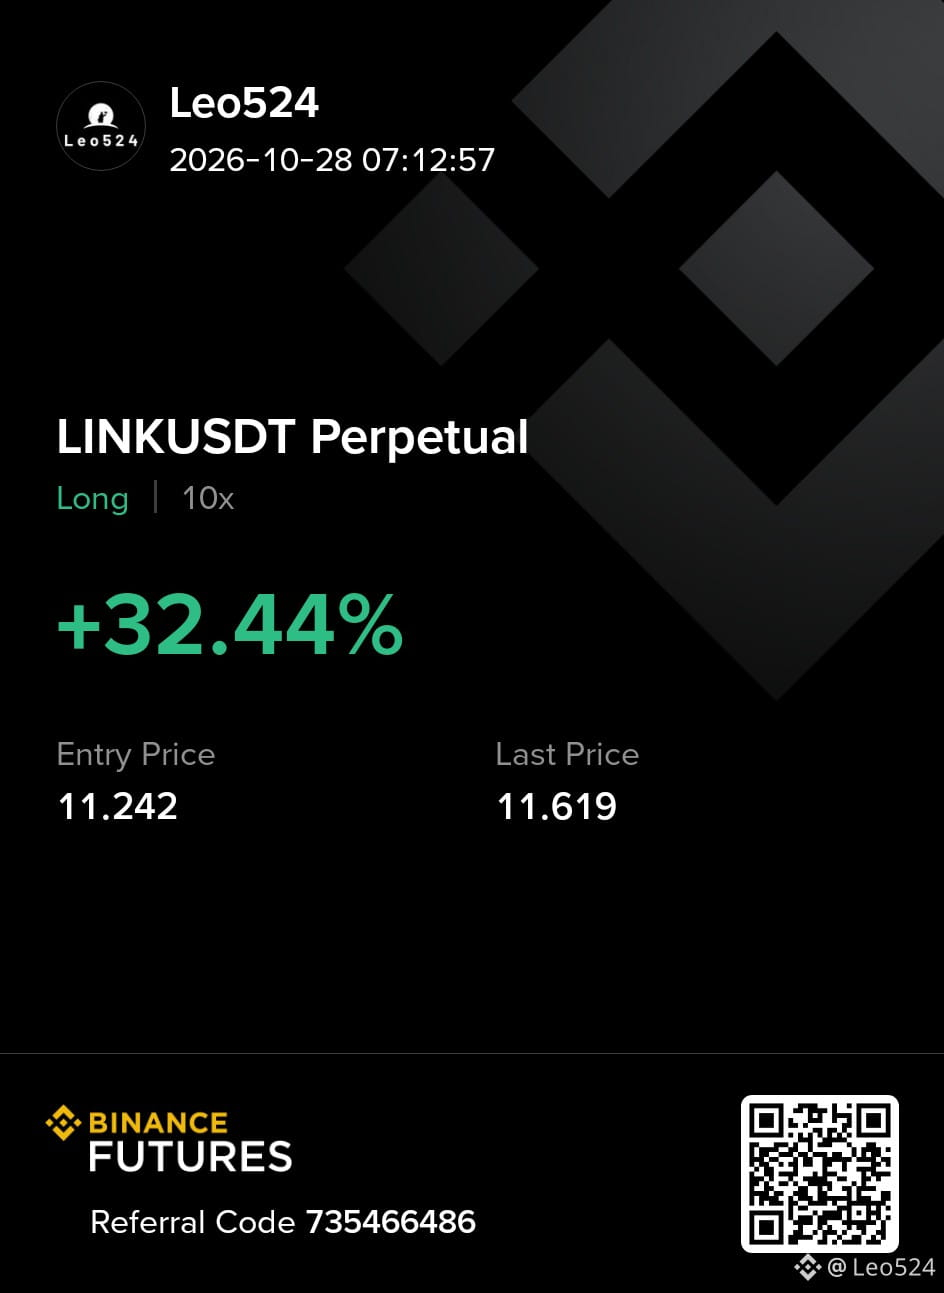
$LINK TP 7 🔥 No reacts ..?
$LINK TP 7 🔥 No reacts ..?
Leo524
·
--
Bullish$LINK USDT LONG ✅
ENTRY : 11.333 - 11.130 ✅
TARGETS ✅
11.345
11.359
11.370
11.410
11.502
11.625
11.683
11.742
11.838
11.945
12.035
12.120
12.154
12.195
12.270
12.348
STOP - 10.900 ✅
ENTRY : 11.333 - 11.130 ✅
TARGETS ✅
11.345
11.359
11.370
11.410
11.502
11.625
11.683
11.742
11.838
11.945
12.035
12.120
12.154
12.195
12.270
12.348
STOP - 10.900 ✅
2
363
·
--
See translation
$LINK has reached TP 1, 2, 3, and 4 ✅
However, buying pressure is still not strong enough to support a major pump !
$LINK has reached TP 1, 2, 3, and 4 ✅
However, buying pressure is still not strong enough to support a major pump !
However, buying pressure is still not strong enough to support a major pump !
Leo524
·
--
Bullish$LINK USDT LONG ✅
ENTRY : 11.333 - 11.130 ✅
TARGETS ✅
11.345
11.359
11.370
11.410
11.502
11.625
11.683
11.742
11.838
11.945
12.035
12.120
12.154
12.195
12.270
12.348
STOP - 10.900 ✅
ENTRY : 11.333 - 11.130 ✅
TARGETS ✅
11.345
11.359
11.370
11.410
11.502
11.625
11.683
11.742
11.838
11.945
12.035
12.120
12.154
12.195
12.270
12.348
STOP - 10.900 ✅
253
·
--
Bullish
See translation
$LINK USDT LONG ✅
ENTRY : 11.333 - 11.130 ✅
TARGETS ✅
11.345
11.359
11.370
11.410
11.502
11.625
11.683
11.742
11.838
11.945
12.035
12.120
12.154
12.195
12.270
12.348
STOP - 10.900 ✅
{future}(LINKUSDT)
$LINK USDT LONG ✅
ENTRY : 11.333 - 11.130 ✅
TARGETS ✅
11.345
11.359
11.370
11.410
11.502
11.625
11.683
11.742
11.838
11.945
12.035
12.120
12.154
12.195
12.270
12.348
STOP - 10.900 ✅
ENTRY : 11.333 - 11.130 ✅
TARGETS ✅
11.345
11.359
11.370
11.410
11.502
11.625
11.683
11.742
11.838
11.945
12.035
12.120
12.154
12.195
12.270
12.348
STOP - 10.900 ✅
2
1
406
·
--
See translation
$BTC : CAN BULLS PUSH TOWARD $83K? 📈
BTC is holding a rising support zone around $79K–$80K. If buyers continue defending this area, price could make another attempt to break the descending trendline, opening the door for a recovery.
⚠️ But the trendline is the key challenge. A rejection could send BTC back toward support. If buyers break through and confirm the breakout, BTC could move toward $81.5K and potentially $83K.
👀 Watch the support reaction
#BTC #Leo524
2
1
67
26.6k
·
--
Bearish
See translation
$FIL am i right ..?
{spot}(FILUSDT)
$FIL am i right ..?
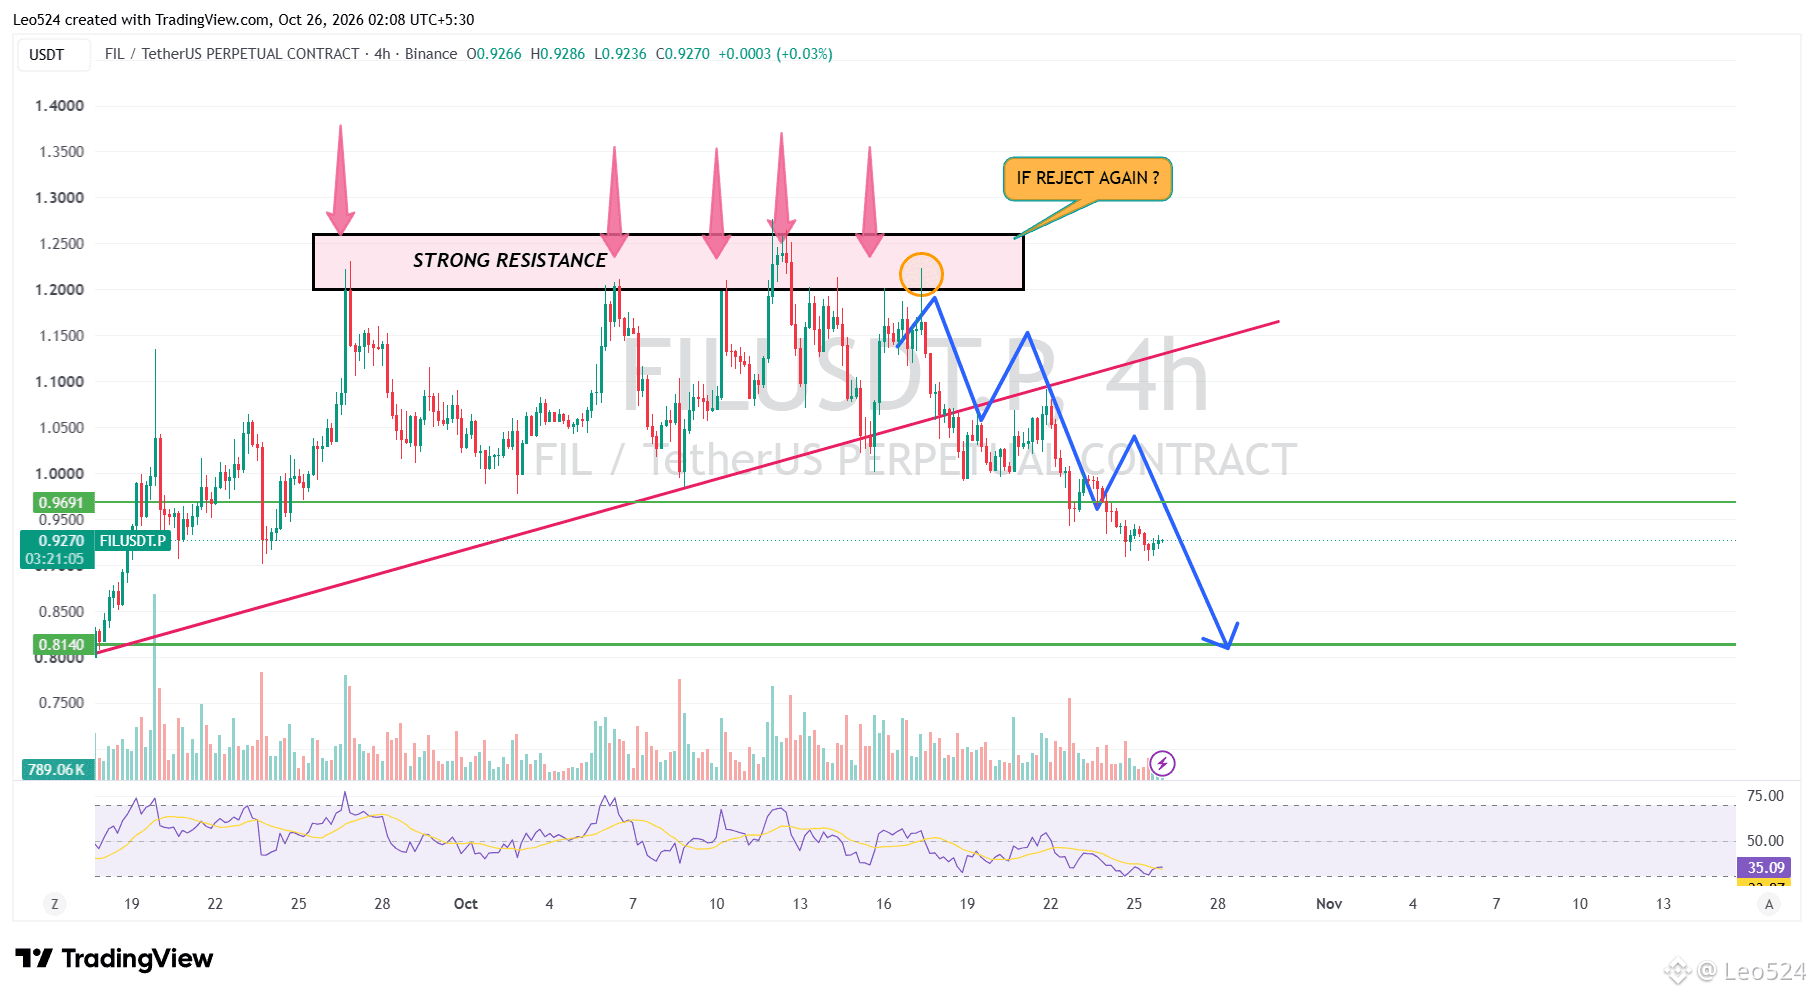
Leo524
·
--
Bearish$FIL Another reject ?? Or Breakout ? 👀
3
1
1.1k
·
--
See translation
$BTC : BOUNCE OR ANOTHER REJECTION? 📉📈
BTC is testing the $79K–$80K support zone. If buyers hold this area, price could recover toward $81.9K, where strong resistance and the descending trendline meet.
⚠️ A rejection there could push BTC lower again. But if BTC confirms a breakout above resistance, a move toward $84K could follow.
👀 Watch price action and wait for confirmation before deciding the next direction.
#BTC #bitcoin #Leo524 #BTC84K
3
516
·
--
Bullish
See translation
$UNI Am I Right ? 🔥
{spot}(UNIUSDT)
$UNI Am I Right ? 🔥
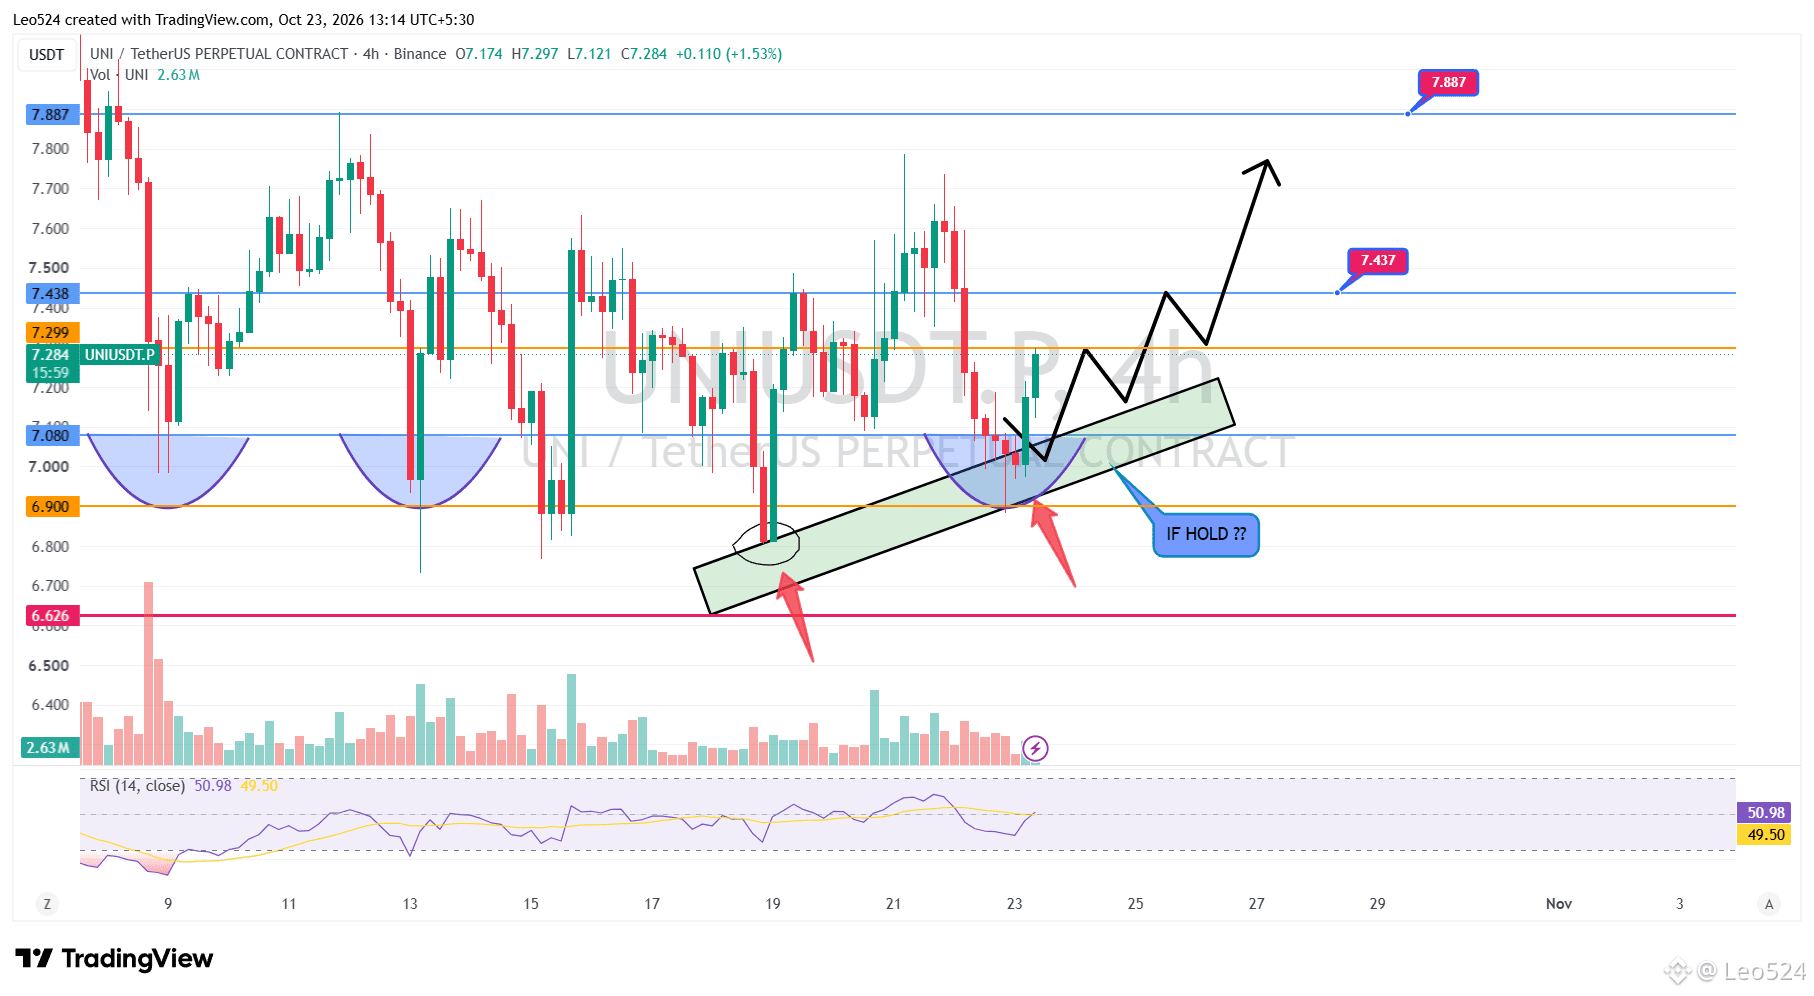
Leo524
·
--
$UNI AT A CRITICAL SUPPORT — BOUNCE OR BREAKDOWN?
UNI is testing an important support zone around $6.88–$7.08. Price has reacted from similar areas before, making this a key zone to watch. Buyers need to defend this area if the bullish structure is going to remain valid.
If support holds and buying pressure returns, UNI could attempt a recovery toward $7.437, with $7.887 as the next major resistance. However, RSI is still below 50, showing that bullish momentum has not fully returned yet.
For now, the reaction around $6.88–$7.08 is what matters most.
#UNI #cryptotrading #Leo524
4
4
391
·
--
See translation
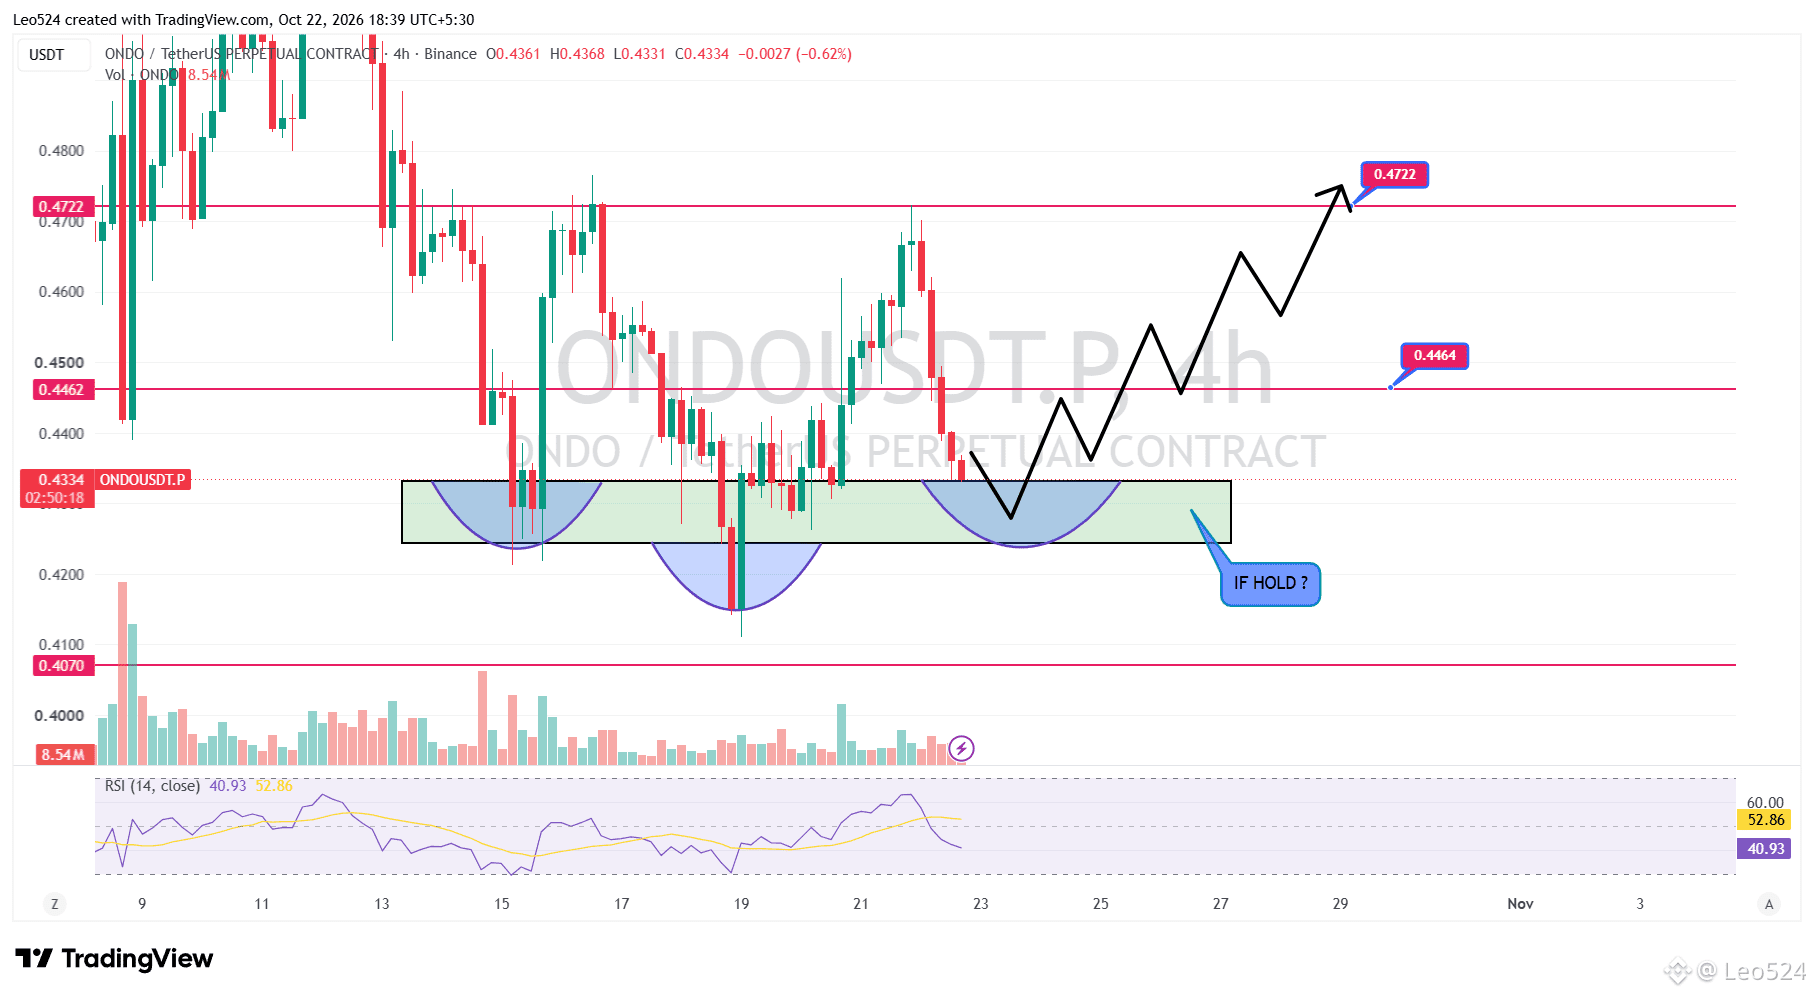
$ONDO: Is This the Start of a Strong Recovery?
ONDO is testing an important support zone around $0.424–$0.434 after several days of selling pressure. Buyers have stepped in around this area before, and the current structure suggests another possible recovery attempt.
If this zone holds, ONDO could move toward $0.4464 first. A clean break above that level could open the door toward $0.4722. However, price still needs to show strength before confirming the bullish move.
For now, all eyes are on support. Will buyers defend this zone again, or will ONDO break lower? 👀
#Crypto #CryptoTrading #LEO524
$ONDO : Is This the Start of a Strong Recovery?
ONDO is testing an important support zone around $0.424–$0.434 after several days of selling pressure. Buyers have stepped in around this area before, and the current structure suggests another possible recovery attempt.
If this zone holds, ONDO could move toward $0.4464 first. A clean break above that level could open the door toward $0.4722. However, price still needs to show strength before confirming the bullish move.
For now, all eyes are on support. Will buyers defend this zone again, or will ONDO break lower? 👀
#Crypto #CryptoTrading #LEO524
3
1
930
·
--
See translation
$UNI AT A CRITICAL SUPPORT — BOUNCE OR BREAKDOWN?
UNI is testing an important support zone around $6.88–$7.08. Price has reacted from similar areas before, making this a key zone to watch. Buyers need to defend this area if the bullish structure is going to remain valid.
If support holds and buying pressure returns, UNI could attempt a recovery toward $7.437, with $7.887 as the next major resistance. However, RSI is still below 50, showing that bullish momentum has not fully returned yet.
For now, the reaction around $6.88–$7.08 is what matters most.
#UNI #cryptotrading #Leo524
1
1
7
6k
·
--
See translation
15 TRADES A DAY… BUT HOW MANY ACTUALLY MAKE PROFIT? 😂
Some traders encourage people to open 10–15 trades a day, but only 1 or 2 end up in profit. 🤦♂️
The goal isn’t to open more trades. The goal is to find better opportunities with proper analysis and high-quality setups.
QUANTITY DOESN’T MATTER IF THE QUALITY ISN’T THERE.
One well-analyzed trade can be more valuable than 15 low-quality entries.
Trade smarter, not more 👋
#CryptoTrading. #tradingStrategy #tradingpsychology #Leo524
2
1
5
2.5k
·
--
Bullish
See translation
$XRP 🔥
$XRP 🔥
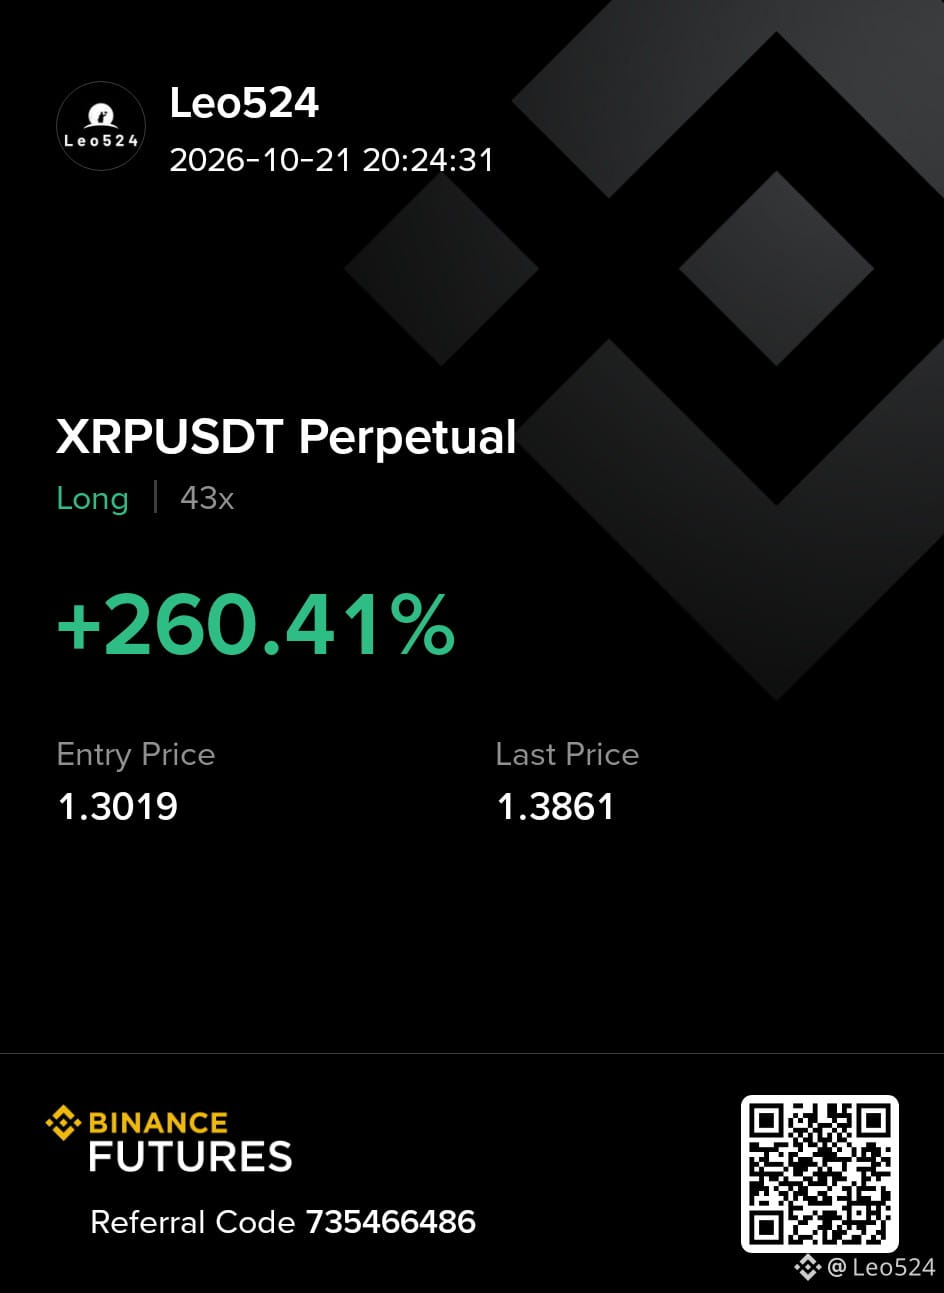
Leo524
·
--
Bullish$XRP IS FORMING A POTENTIAL HARMONIC PATTERN — WATCH THIS SUPPORT!
XRP is approaching the completion zone of a potential harmonic pattern on the daily chart. Price is now testing the $1.23–$1.28 support area, where the previous swing low formed. If this zone holds and buyers step in with bullish confirmation, we could see a recovery toward $1.41, $1.54, and potentially $1.70. However, the pattern alone doesn’t confirm a reversal. Support needs to hold first. 👀
If XRP loses this support zone, the bullish setup could become invalid, with $1.1550 being an important level to watch below. For now, I’m watching how price reacts around this area before making any bullish assumptions.
2
161
·
--
See translation
$IOST BREAKOUT OR BULLTRAP ???
WHAT NEXT ..? [JOIN LIVE](https://app.binance.com/uni-qr/cspa/47453450405345?l=en&r=ZGQW242B&source=host_share&uc=web_square_share_link&us=copylink)
$IOST BREAKOUT OR BULLTRAP ???
WHAT NEXT ..? JOIN LIVE
WHAT NEXT ..? JOIN LIVE
4
55
21.7k
Log in to explore more content
Join global crypto users on Binance Square
⚡️ Get latest and useful information about crypto.
💬 Trusted by the world’s largest crypto exchange.
👍 Discover real insights from verified creators.
Email / Phone number
Trending Topics
BinanceRestoresWithdrawalsForEthereumNetwork&BNBSmartChain
21 views
12 Discussing
Binance Restores Withdrawals for ETH and BSC Networks in Phased Rollout
Binance News
·11 Likes
·2.8k views
BinanceUpdatesProofofReservesAddresses
2,177 views
109 Discussing
BinanceToResumePhaseOneOfWithdrawals
15,976 views
455 Discussing