
KanT Crypto
4.6k Posts

KanT Crypto
Report
Block User
Decoding Politics. Tracking Crypto. Real-time news. 100% Signal with 0% Noise.
Open Trade

BNB Holder
Frequent Trader
1.3 Years
126 Following
1.7K+ Followers
8.5K+ Liked
Posts
Portfolio
All
Quotes
Videos
Live
PINNED
·
--
Bullish
Verified
See translation
🚨 BREAKING: 🇺🇸 Trump Reportedly Signs Order Letting Tax-Free Red Diesel Run on US Highways
The move would allow dyed off-road diesel, normally reserved for farms and heavy equipment, on public roads for the rest of 2026.
It's the same fuel. The red dye only marks that highway taxes weren't paid: 24.3 cents a gallon federal, plus about 35.5 cents in state taxes on average. Louisiana and Nebraska had already eased the rules on their own.
The catch: analysts say it won't lower the wholesale price. Refiners still get market rates, so the relief comes from skipped taxes, not more supply.
For markets, cheaper fuel at the pump cools inflation a little, and every bit helps the case for a Fed on hold.
Watch whether pump prices actually fall, and whether the diesel export-ban talk comes back.
Not financial advice.
$CL
{future}(CLUSDT)
$BZ
{future}(BZUSDT)
$NATGAS
{future}(NATGASUSDT)
🚨 BREAKING: 🇺🇸 Trump Reportedly Signs Order Letting Tax-Free Red Diesel Run on US Highways
The move would allow dyed off-road diesel, normally reserved for farms and heavy equipment, on public roads for the rest of 2026.
It's the same fuel. The red dye only marks that highway taxes weren't paid: 24.3 cents a gallon federal, plus about 35.5 cents in state taxes on average. Louisiana and Nebraska had already eased the rules on their own.
The catch: analysts say it won't lower the wholesale price. Refiners still get market rates, so the relief comes from skipped taxes, not more supply.
For markets, cheaper fuel at the pump cools inflation a little, and every bit helps the case for a Fed on hold.
Watch whether pump prices actually fall, and whether the diesel export-ban talk comes back.
Not financial advice.
$CL
$BZ
$NATGAS
The move would allow dyed off-road diesel, normally reserved for farms and heavy equipment, on public roads for the rest of 2026.
It's the same fuel. The red dye only marks that highway taxes weren't paid: 24.3 cents a gallon federal, plus about 35.5 cents in state taxes on average. Louisiana and Nebraska had already eased the rules on their own.
The catch: analysts say it won't lower the wholesale price. Refiners still get market rates, so the relief comes from skipped taxes, not more supply.
For markets, cheaper fuel at the pump cools inflation a little, and every bit helps the case for a Fed on hold.
Watch whether pump prices actually fall, and whether the diesel export-ban talk comes back.
Not financial advice.
$CL
$BZ
$NATGAS

1
1
28
31.8k
PINNED
·
--
Bearish
See translation
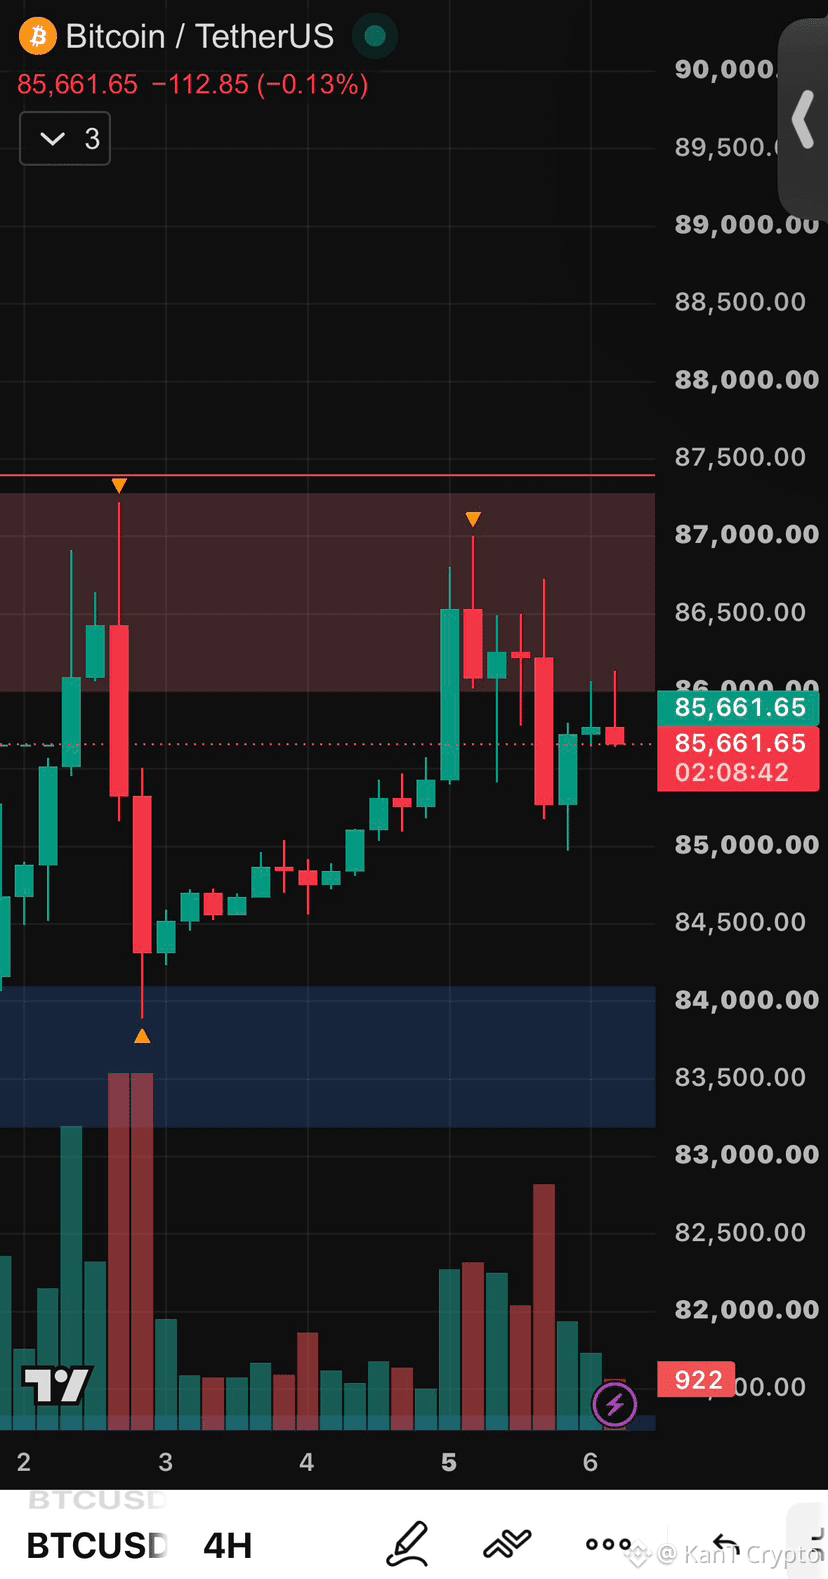
⚠️ The $87K Wall Just Blocked Bitcoin for the Third Time
Same wall. Same result.
Late September: rejected at $87.4K.
October 2: rejected at $87.2K.
October 5: rejected near $87K, then sold straight down to $85K.
Now BTC sits at $85,660 on the 4H, catching its breath. 👀
For the record, last time we said another rejection would make $85K the first stop. That's exactly where the selling paused, and the level is holding for now.
Look closer at those tops, though. Each push peaks a little lower: $87.4K, $87.2K, $87K, then $86.7K, and the latest bounce stalled near $86.1K. Buyers keep showing up, just with less force each time.
The lows tell the opposite story: $83.9K after the jobs-report flush, $85K this time. Higher lows under lower highs means the range is getting squeezed from both sides, and squeezes don't last forever.
The levels.
A 4H close above $87.4K finally breaks the wall, and the September highs turn into support.
Lose $85K, and the $83.2K to $84.1K demand zone is next, the same area that caught the last flush.
When a range tightens like this, the break usually comes fast. Let it pick a direction before you do.
Fourth try breaks the wall, or does $85K crack first? 🔥
Not financial advice.
$BTC
{future}(BTCUSDT)
$RLC
{future}(RLCUSDT)
$NEAR
{future}(NEARUSDT)
⚠️ The $87K Wall Just Blocked Bitcoin for the Third Time
Same wall. Same result.
Late September: rejected at $87.4K.
October 2: rejected at $87.2K.
October 5: rejected near $87K, then sold straight down to $85K.
Now BTC sits at $85,660 on the 4H, catching its breath. 👀
For the record, last time we said another rejection would make $85K the first stop. That's exactly where the selling paused, and the level is holding for now.
Look closer at those tops, though. Each push peaks a little lower: $87.4K, $87.2K, $87K, then $86.7K, and the latest bounce stalled near $86.1K. Buyers keep showing up, just with less force each time.
The lows tell the opposite story: $83.9K after the jobs-report flush, $85K this time. Higher lows under lower highs means the range is getting squeezed from both sides, and squeezes don't last forever.
The levels.
A 4H close above $87.4K finally breaks the wall, and the September highs turn into support.
Lose $85K, and the $83.2K to $84.1K demand zone is next, the same area that caught the last flush.
When a range tightens like this, the break usually comes fast. Let it pick a direction before you do.
Fourth try breaks the wall, or does $85K crack first? 🔥
Not financial advice.
$BTC
$RLC
$NEAR
Same wall. Same result.
Late September: rejected at $87.4K.
October 2: rejected at $87.2K.
October 5: rejected near $87K, then sold straight down to $85K.
Now BTC sits at $85,660 on the 4H, catching its breath. 👀
For the record, last time we said another rejection would make $85K the first stop. That's exactly where the selling paused, and the level is holding for now.
Look closer at those tops, though. Each push peaks a little lower: $87.4K, $87.2K, $87K, then $86.7K, and the latest bounce stalled near $86.1K. Buyers keep showing up, just with less force each time.
The lows tell the opposite story: $83.9K after the jobs-report flush, $85K this time. Higher lows under lower highs means the range is getting squeezed from both sides, and squeezes don't last forever.
The levels.
A 4H close above $87.4K finally breaks the wall, and the September highs turn into support.
Lose $85K, and the $83.2K to $84.1K demand zone is next, the same area that caught the last flush.
When a range tightens like this, the break usually comes fast. Let it pick a direction before you do.
Fourth try breaks the wall, or does $85K crack first? 🔥
Not financial advice.
$BTC
$RLC
$NEAR
1
10
7.5k
·
--
Bearish
See translation
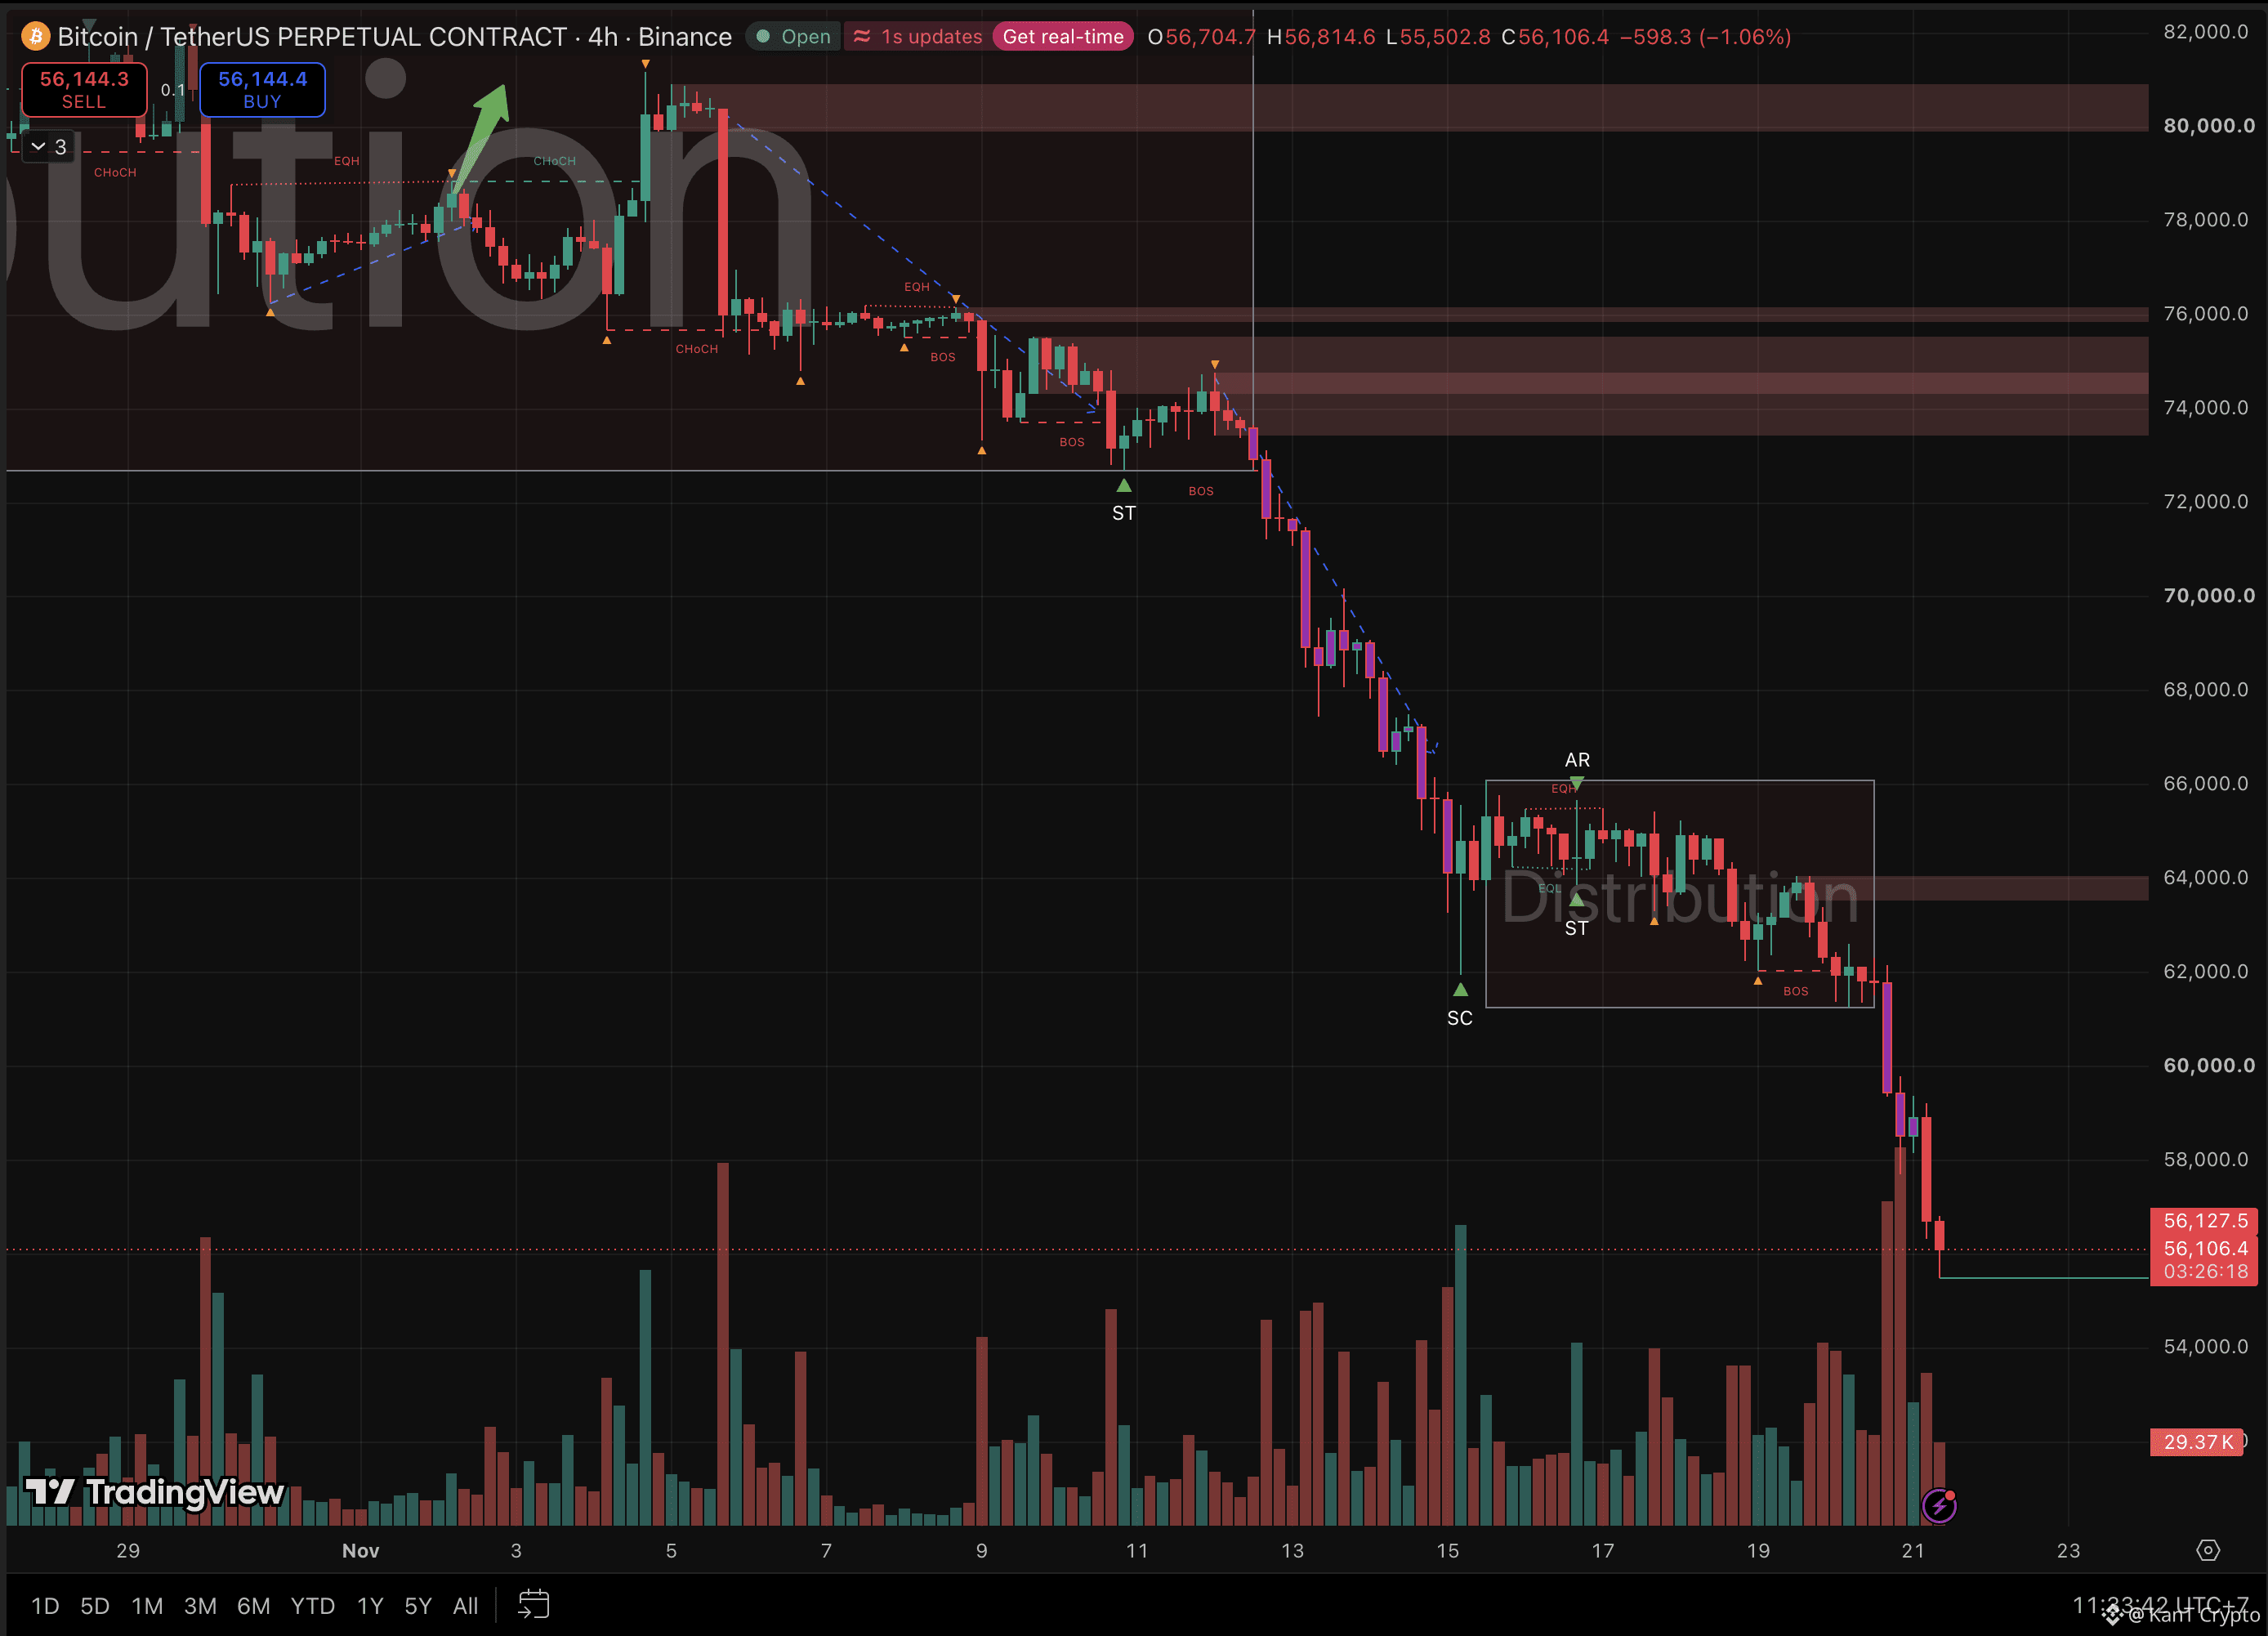
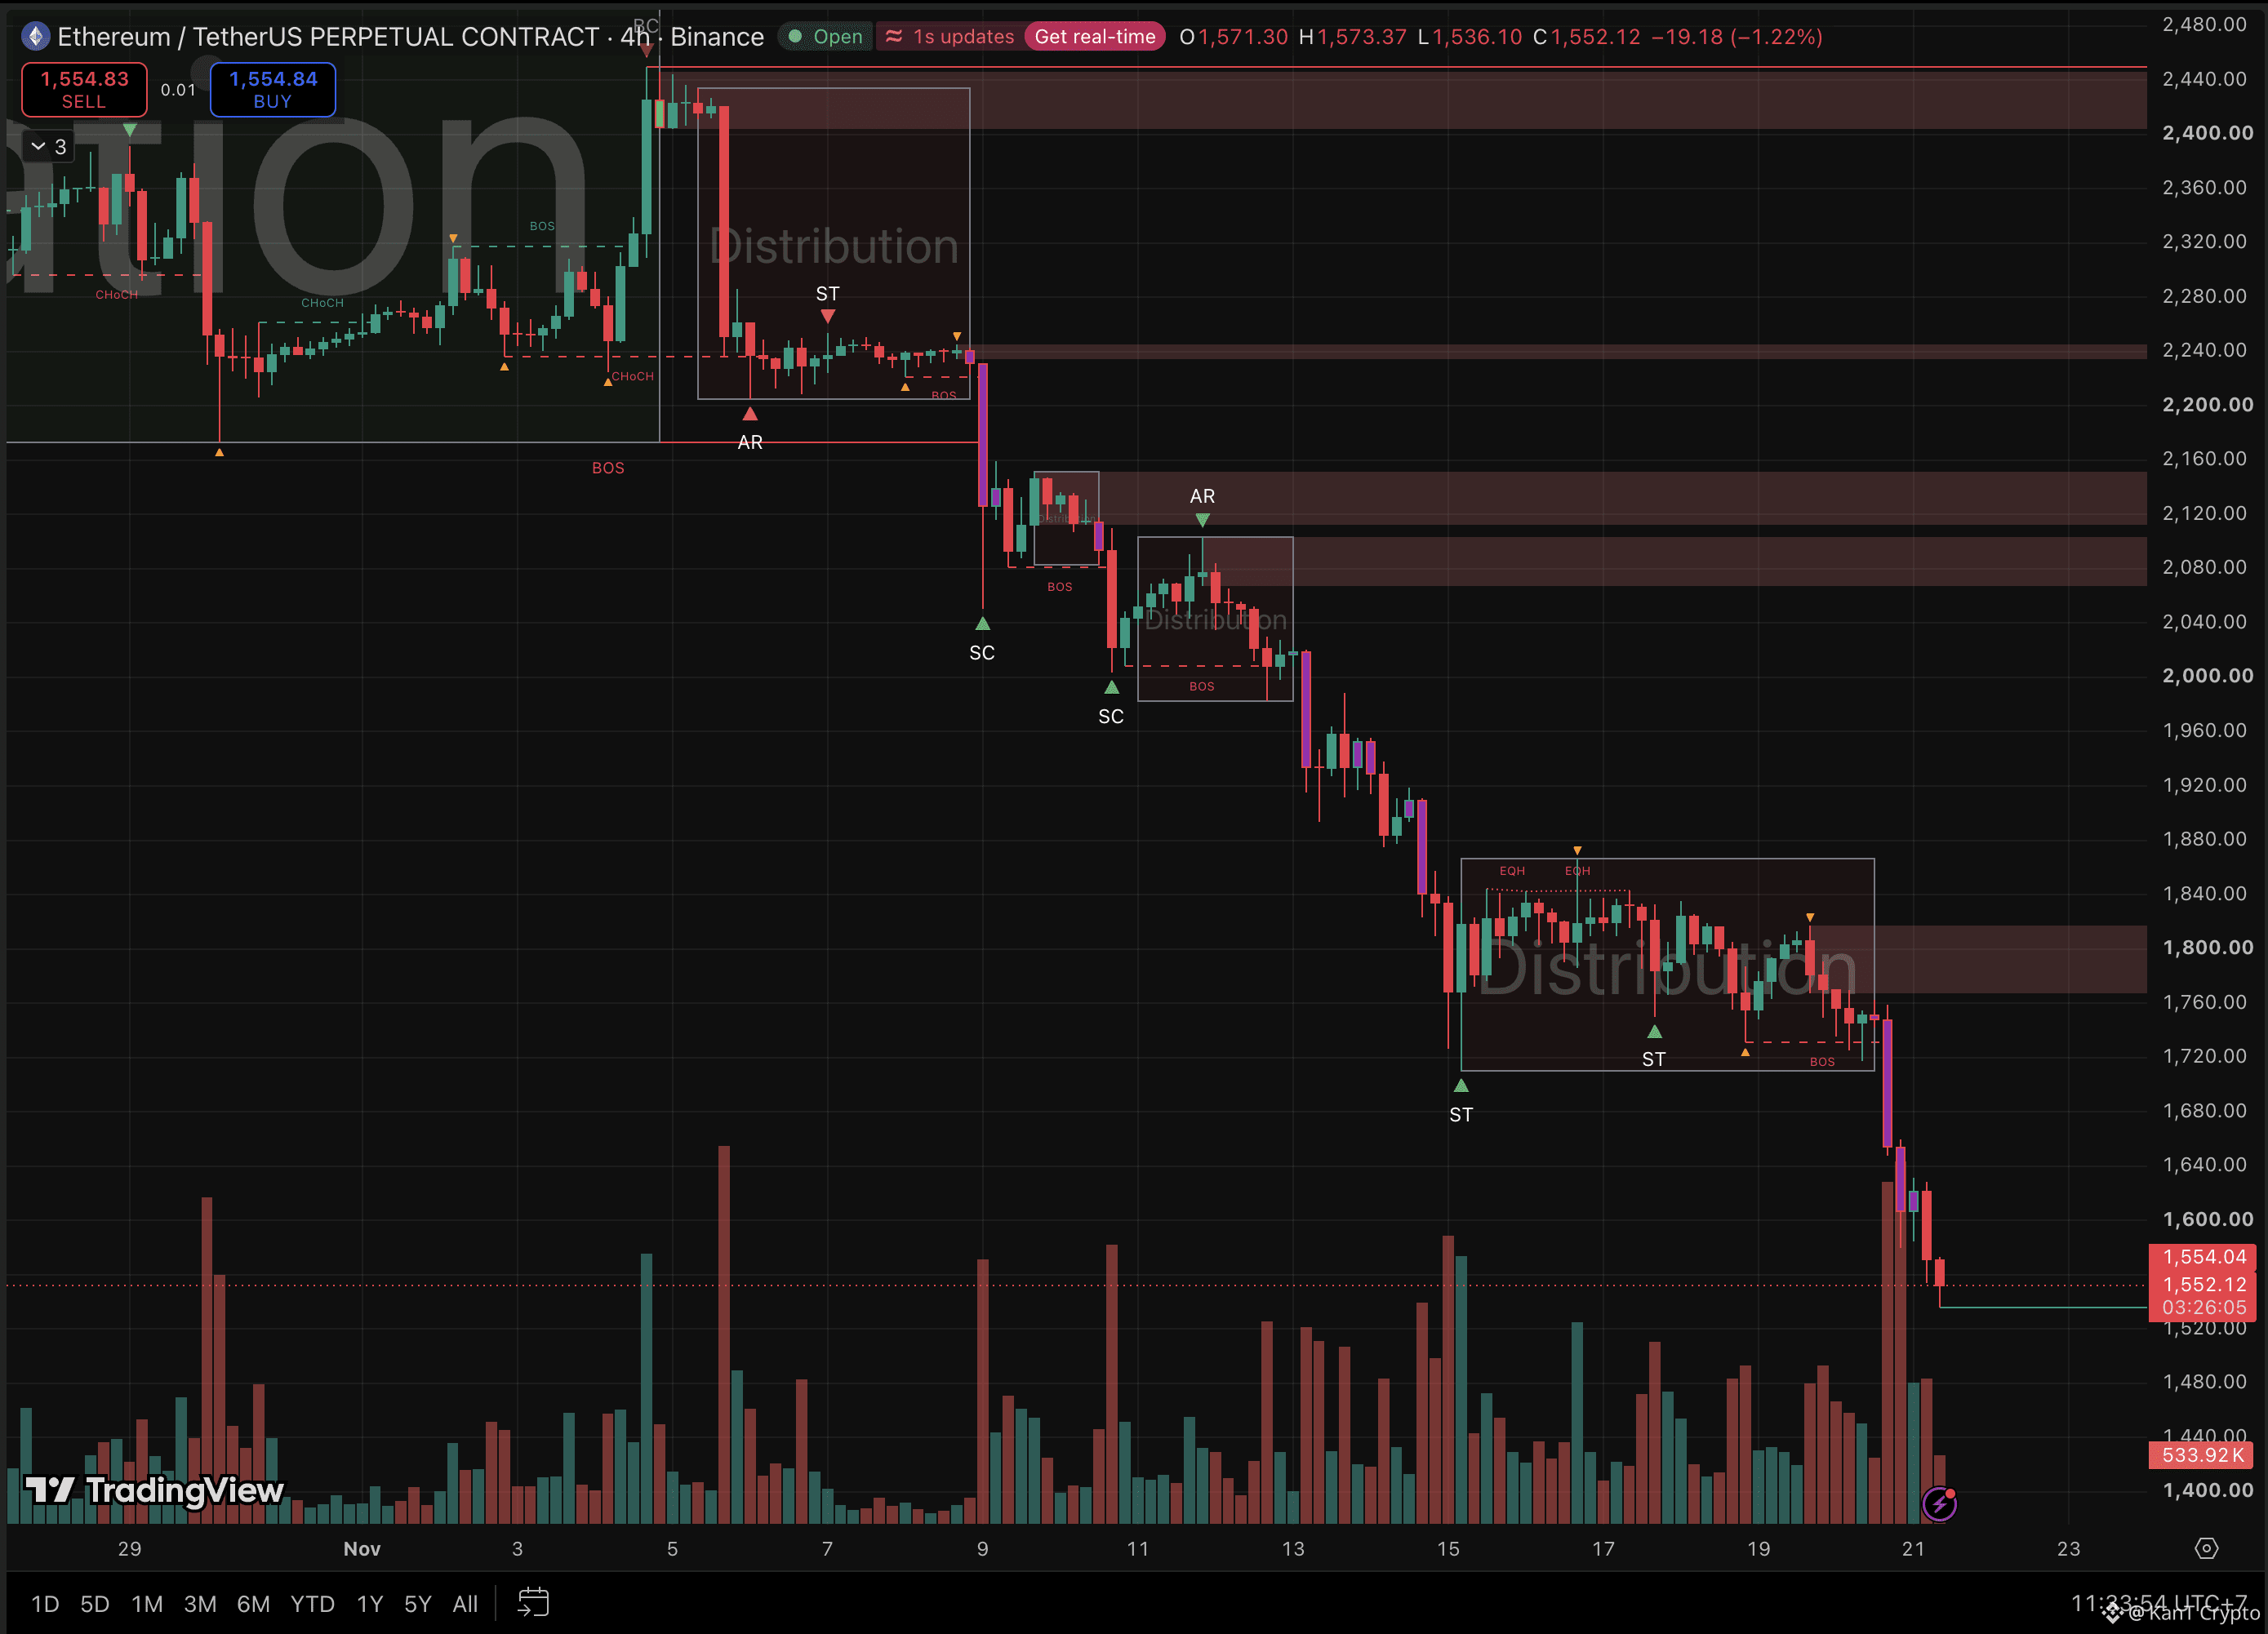
JUST IN: Crypto continues to crash
$BTC falls under $56,000
$ETH falls under $1,550
$XRP falls under $0.88
$SOL falls under $66
$650,000,000 in leveraged cryptocurrency positions liquidated in the past 60 minutes.
{future}(SOLUSDT)
{future}(ETHUSDT)
{future}(BTCUSDT)
JUST IN: Crypto continues to crash
$BTC falls under $56,000
$ETH falls under $1,550
$XRP falls under $0.88
$SOL falls under $66
$650,000,000 in leveraged cryptocurrency positions liquidated in the past 60 minutes.
$BTC falls under $56,000
$ETH falls under $1,550
$XRP falls under $0.88
$SOL falls under $66
$650,000,000 in leveraged cryptocurrency positions liquidated in the past 60 minutes.
1
117
·
--
Bullish
See translation
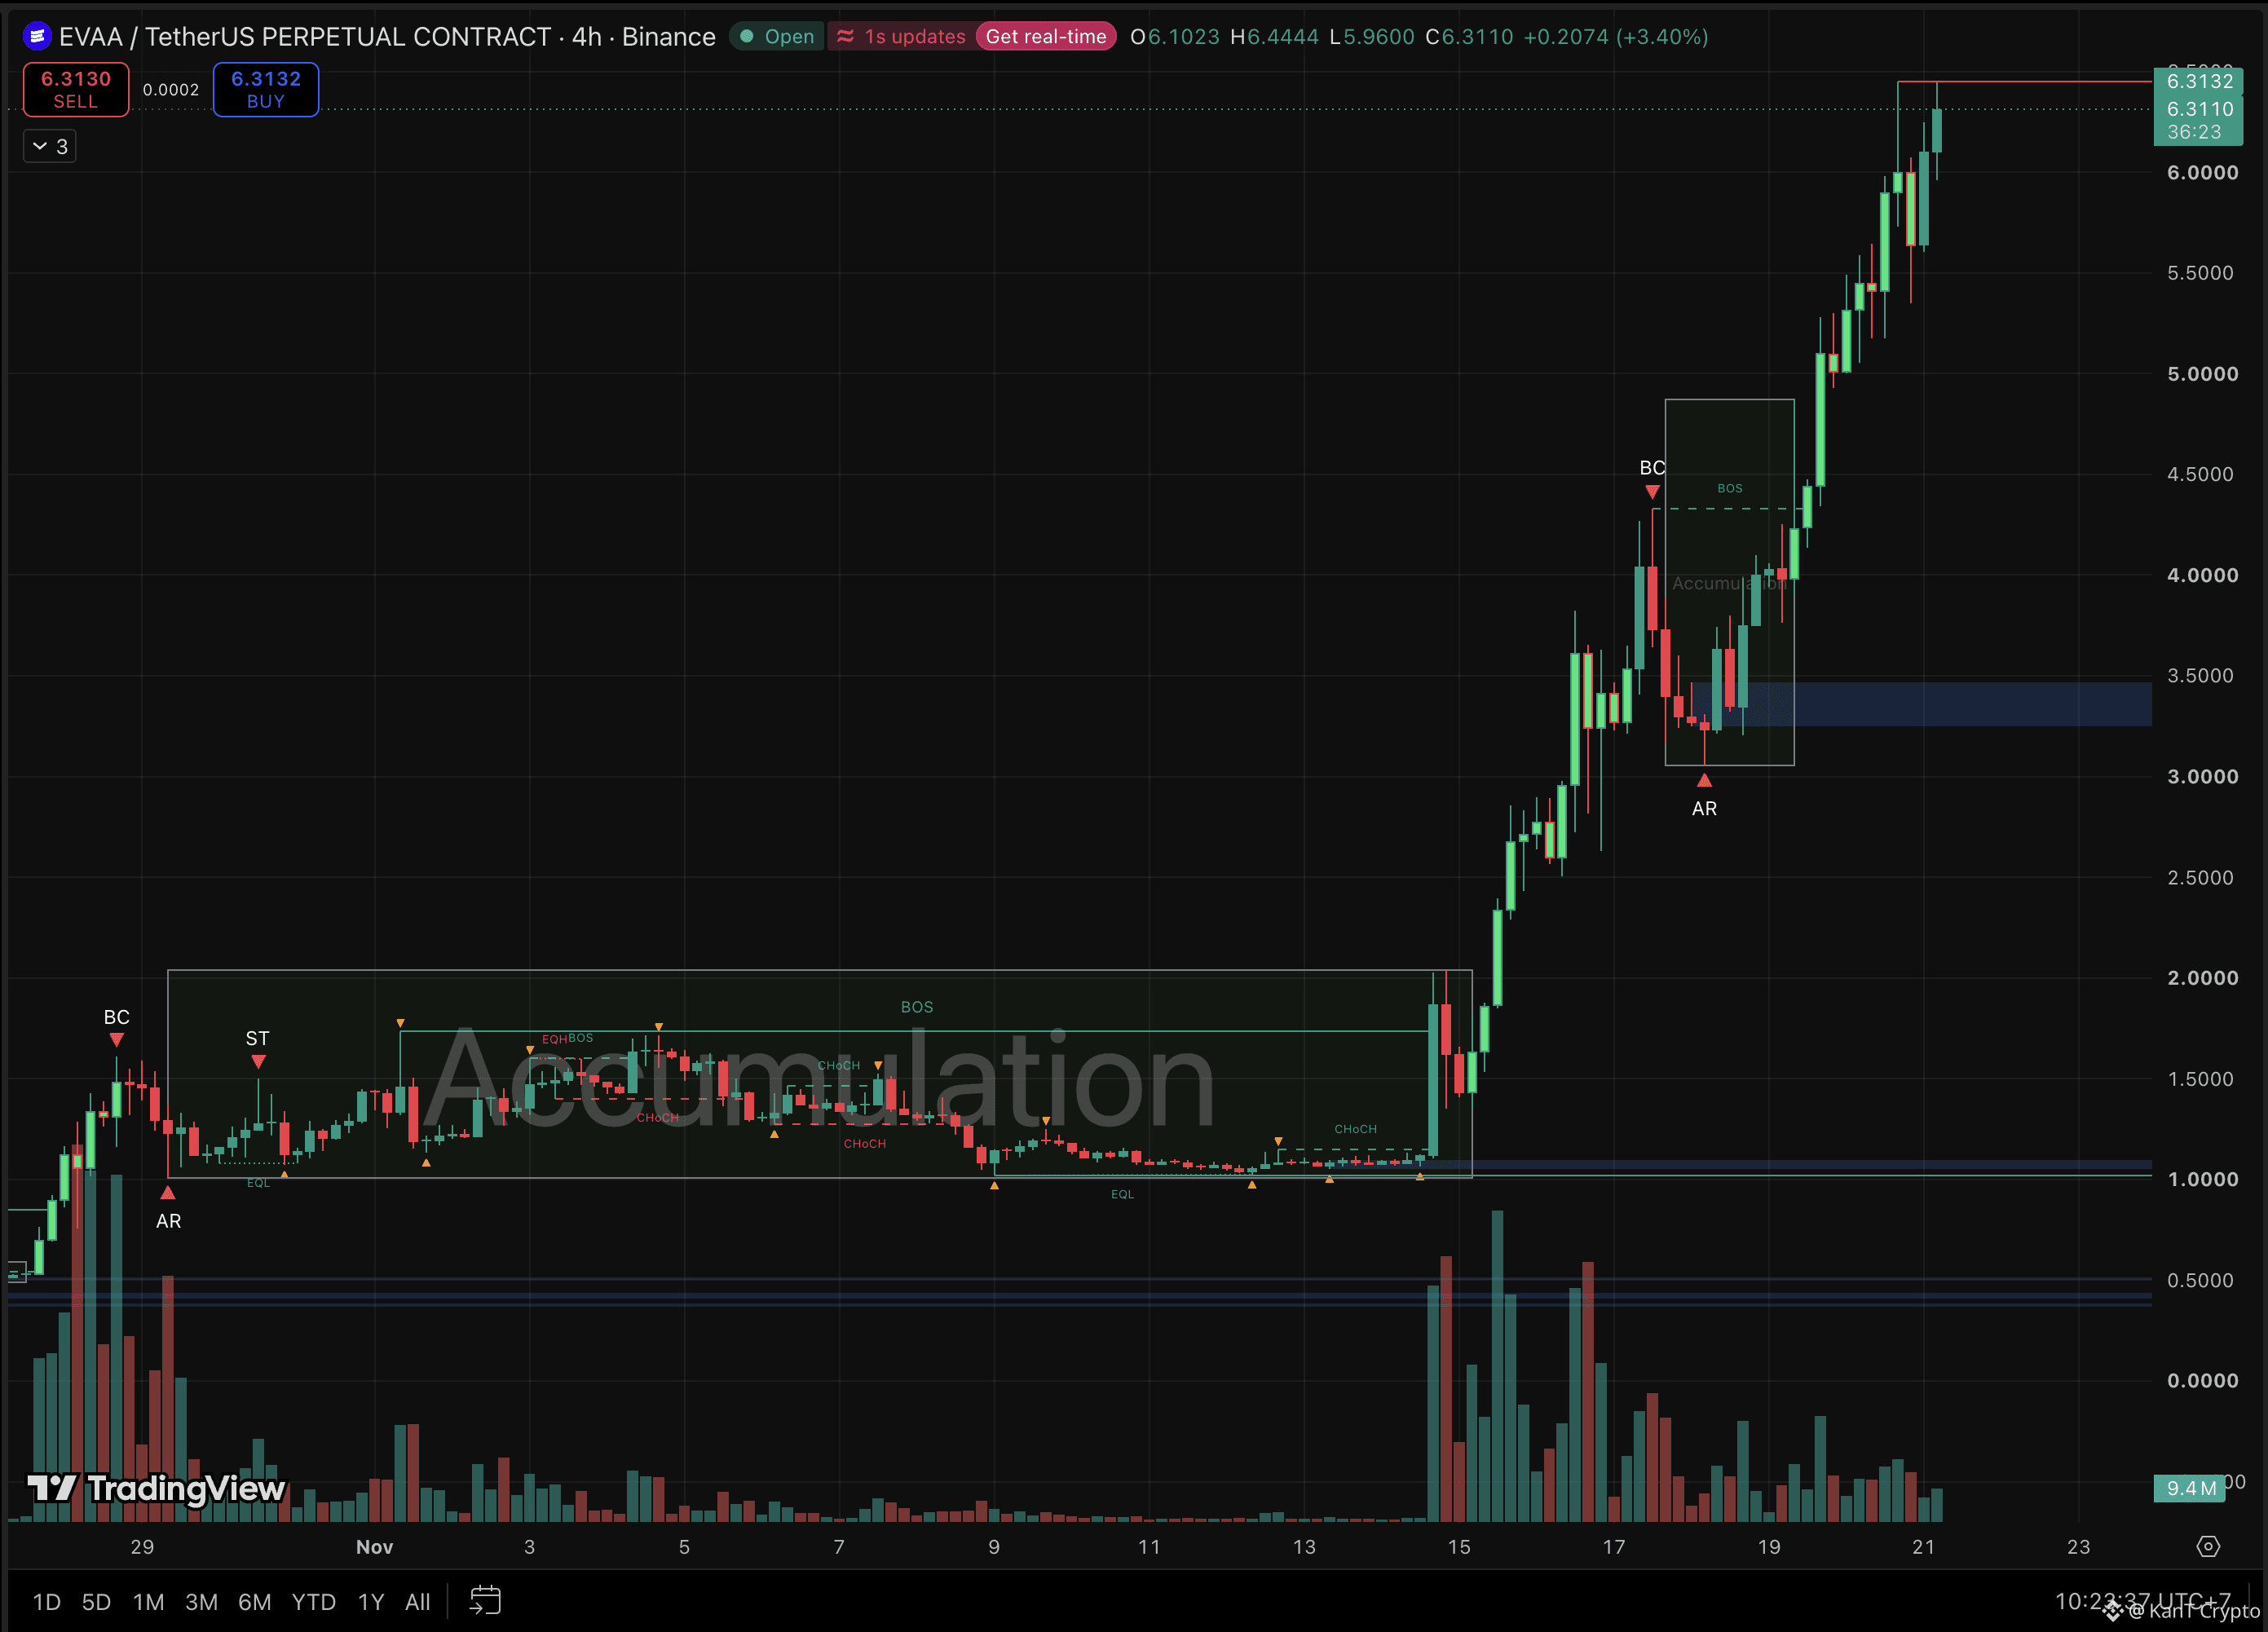
📈 Bitcoin bleeds. EVAA BLOOMS. 👀
A week ago: BTC dipped to $62K, EVAA sat near $1.
Now: BTC is under $58K, EVAA is at $6.31.
A 6x, straight against the tide.
This wasn't one lucky candle. Two quiet weeks boxed under $1.75 (classic Wyckoff accumulation) wore the sellers out, the breakout came on exploding volume, and a near 30% flush from $4.33 got bought back within days. That's what real demand looks like.
⚠️ Two details spoil the victory lap, though.
Every new high since $4.33 has come on lighter volume than the breakout days. Price climbs, fuel thins.
And $6.45 has capped price twice in 12 hours. Equal highs like that stack stop orders just above: a clean break feeds the run, another rejection starts to look like a double top.
From here, it's a fork:
A four-hour close above $6.45 with volume returning → the run stays alive.
Lose $5.35, the last shakeout low → a change of character (the first sign the trend is turning), and eyes drop to $4.33, the old breakout level, then the $3.25 to $3.47 demand zone.
No tide lifted this move, so none is needed to sink it. Anyone chasing up here should size small, set the stop first, and assume another 30% shakeout is on the table.
Strongest chart in a weak market, or the most crowded trade in it?
Not financial advice.
$EVAA
{future}(EVAAUSDT)
$BTC
{future}(BTCUSDT)
$AKE
{future}(AKEUSDT)
📈 Bitcoin bleeds. EVAA BLOOMS. 👀
A week ago: BTC dipped to $62K, EVAA sat near $1.
Now: BTC is under $58K, EVAA is at $6.31.
A 6x, straight against the tide.
This wasn't one lucky candle. Two quiet weeks boxed under $1.75 (classic Wyckoff accumulation) wore the sellers out, the breakout came on exploding volume, and a near 30% flush from $4.33 got bought back within days. That's what real demand looks like.
⚠️ Two details spoil the victory lap, though.
Every new high since $4.33 has come on lighter volume than the breakout days. Price climbs, fuel thins.
And $6.45 has capped price twice in 12 hours. Equal highs like that stack stop orders just above: a clean break feeds the run, another rejection starts to look like a double top.
From here, it's a fork:
A four-hour close above $6.45 with volume returning → the run stays alive.
Lose $5.35, the last shakeout low → a change of character (the first sign the trend is turning), and eyes drop to $4.33, the old breakout level, then the $3.25 to $3.47 demand zone.
No tide lifted this move, so none is needed to sink it. Anyone chasing up here should size small, set the stop first, and assume another 30% shakeout is on the table.
Strongest chart in a weak market, or the most crowded trade in it?
Not financial advice.
$EVAA
$BTC
$AKE
A week ago: BTC dipped to $62K, EVAA sat near $1.
Now: BTC is under $58K, EVAA is at $6.31.
A 6x, straight against the tide.
This wasn't one lucky candle. Two quiet weeks boxed under $1.75 (classic Wyckoff accumulation) wore the sellers out, the breakout came on exploding volume, and a near 30% flush from $4.33 got bought back within days. That's what real demand looks like.
⚠️ Two details spoil the victory lap, though.
Every new high since $4.33 has come on lighter volume than the breakout days. Price climbs, fuel thins.
And $6.45 has capped price twice in 12 hours. Equal highs like that stack stop orders just above: a clean break feeds the run, another rejection starts to look like a double top.
From here, it's a fork:
A four-hour close above $6.45 with volume returning → the run stays alive.
Lose $5.35, the last shakeout low → a change of character (the first sign the trend is turning), and eyes drop to $4.33, the old breakout level, then the $3.25 to $3.47 demand zone.
No tide lifted this move, so none is needed to sink it. Anyone chasing up here should size small, set the stop first, and assume another 30% shakeout is on the table.
Strongest chart in a weak market, or the most crowded trade in it?
Not financial advice.
$EVAA
$BTC
$AKE
1
2.4k
·
--
Bearish
See translation
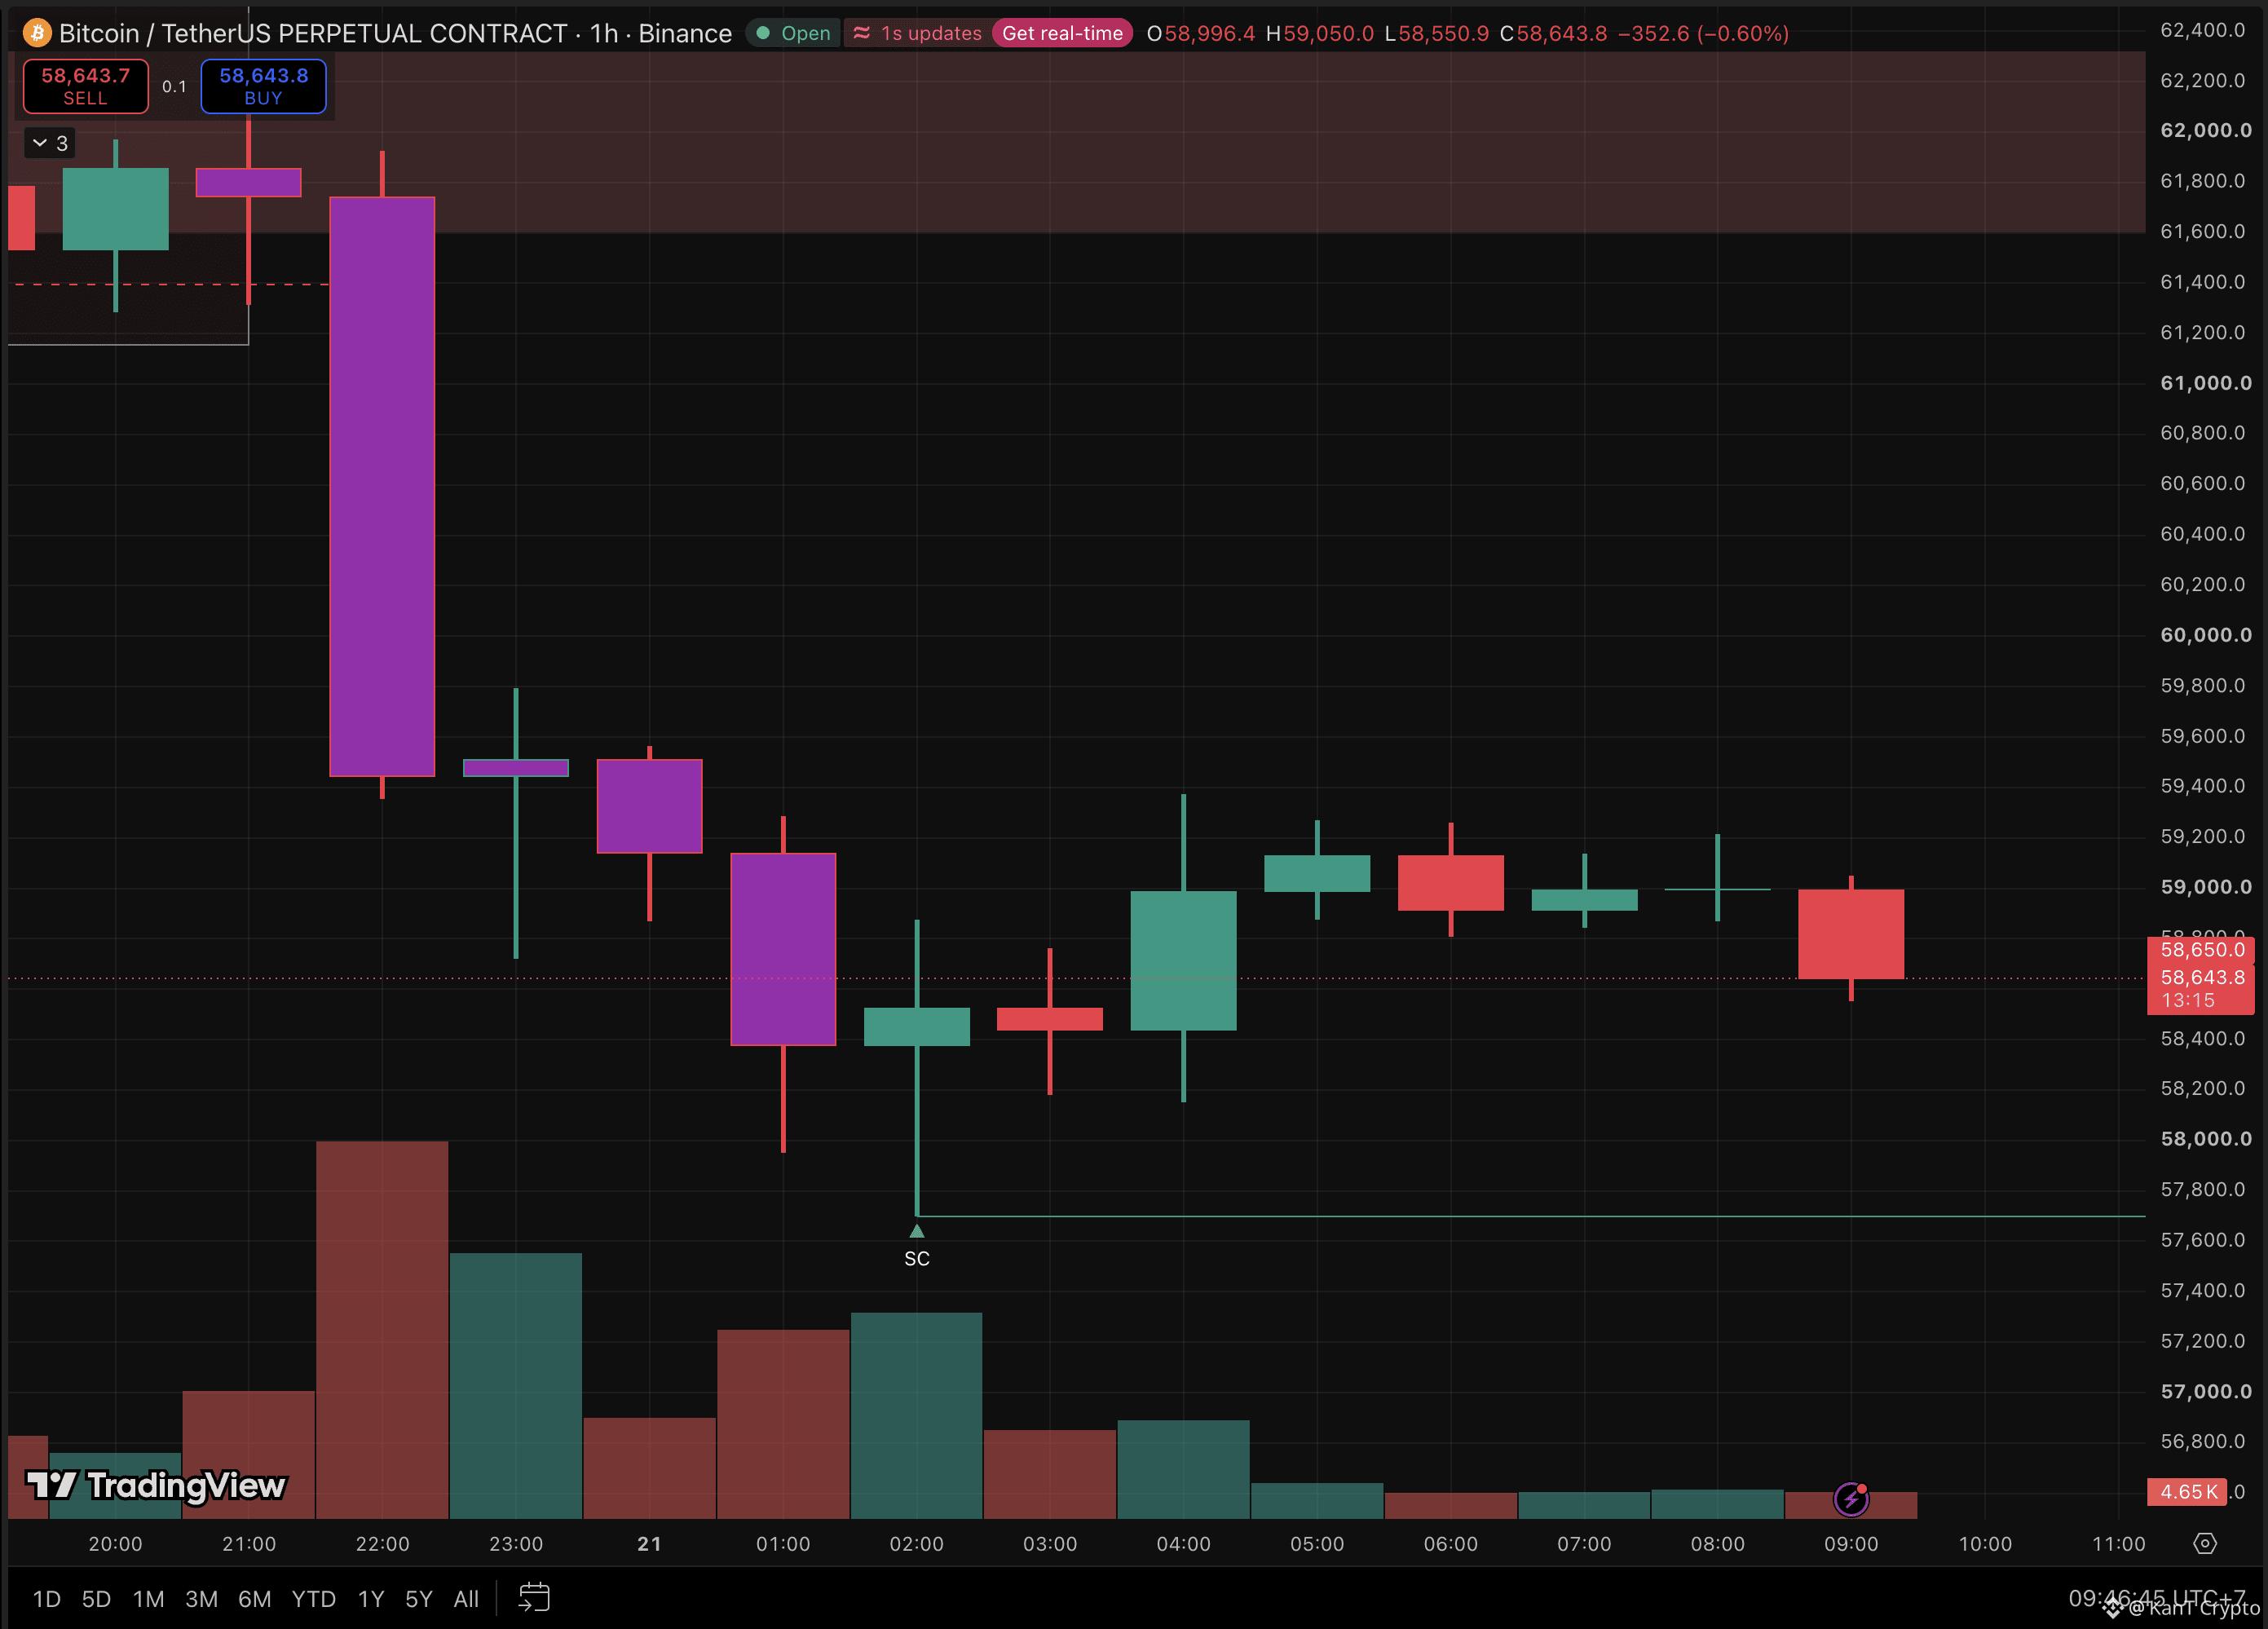
🎯 Bitcoin fell all the way back to its July low. Almost to the dollar.
Floor test number two. The first one held.
Overnight low: $57,700
July low: ~$57,700
Now: $58,644
24h liquidations: ~$1.5B, about 90% longs
The entire August to September rally: erased
Last night’s map said stay under $60K and the July low is next. It got there within about four hours. 📉
This wasn’t a crypto-only flush. The Nasdaq fell 5.3% on Friday, Nvidia lost 12.6%, and the S&P 500 logged a seventh straight losing day. Leverage did the rest: of the $1.5B wiped out, $1.35B were longs.
At $57.7K, buyers finally stepped in with size, and price bounced to $59.4K. That’s how a selling climax tends to look: forced sellers run dry at a level the market respects.
The follow-through is the problem. Each push since has stalled a little lower, and price is drifting back toward $58.5K. Buyers defended the floor. They haven’t taken control. 👀
What to watch:
Reclaim $59.4K, then $60K → the July floor holds twice, and a double bottom starts to form.
Lose $57.7K → a fresh 2026 low, and the lowest prices since September 2024.
Weekend liquidity is thin, and a second test of a major low can snap either way. Let a daily close decide, not a Saturday spike.
Double bottom at the July low, or the floor finally cracks?
Not financial advice.
$BTC
{future}(BTCUSDT)
$ETH
{future}(ETHUSDT)
$SOL
{future}(SOLUSDT)
🎯 Bitcoin fell all the way back to its July low. Almost to the dollar.
Floor test number two. The first one held.
Overnight low: $57,700
July low: ~$57,700
Now: $58,644
24h liquidations: ~$1.5B, about 90% longs
The entire August to September rally: erased
Last night’s map said stay under $60K and the July low is next. It got there within about four hours. 📉
This wasn’t a crypto-only flush. The Nasdaq fell 5.3% on Friday, Nvidia lost 12.6%, and the S&P 500 logged a seventh straight losing day. Leverage did the rest: of the $1.5B wiped out, $1.35B were longs.
At $57.7K, buyers finally stepped in with size, and price bounced to $59.4K. That’s how a selling climax tends to look: forced sellers run dry at a level the market respects.
The follow-through is the problem. Each push since has stalled a little lower, and price is drifting back toward $58.5K. Buyers defended the floor. They haven’t taken control. 👀
What to watch:
Reclaim $59.4K, then $60K → the July floor holds twice, and a double bottom starts to form.
Lose $57.7K → a fresh 2026 low, and the lowest prices since September 2024.
Weekend liquidity is thin, and a second test of a major low can snap either way. Let a daily close decide, not a Saturday spike.
Double bottom at the July low, or the floor finally cracks?
Not financial advice.
$BTC
$ETH
$SOL
Floor test number two. The first one held.
Overnight low: $57,700
July low: ~$57,700
Now: $58,644
24h liquidations: ~$1.5B, about 90% longs
The entire August to September rally: erased
Last night’s map said stay under $60K and the July low is next. It got there within about four hours. 📉
This wasn’t a crypto-only flush. The Nasdaq fell 5.3% on Friday, Nvidia lost 12.6%, and the S&P 500 logged a seventh straight losing day. Leverage did the rest: of the $1.5B wiped out, $1.35B were longs.
At $57.7K, buyers finally stepped in with size, and price bounced to $59.4K. That’s how a selling climax tends to look: forced sellers run dry at a level the market respects.
The follow-through is the problem. Each push since has stalled a little lower, and price is drifting back toward $58.5K. Buyers defended the floor. They haven’t taken control. 👀
What to watch:
Reclaim $59.4K, then $60K → the July floor holds twice, and a double bottom starts to form.
Lose $57.7K → a fresh 2026 low, and the lowest prices since September 2024.
Weekend liquidity is thin, and a second test of a major low can snap either way. Let a daily close decide, not a Saturday spike.
Double bottom at the July low, or the floor finally cracks?
Not financial advice.
$BTC
$ETH
$SOL
2
2.8k
·
--
Bearish
See translation
JUST IN: Financial markets are crashing
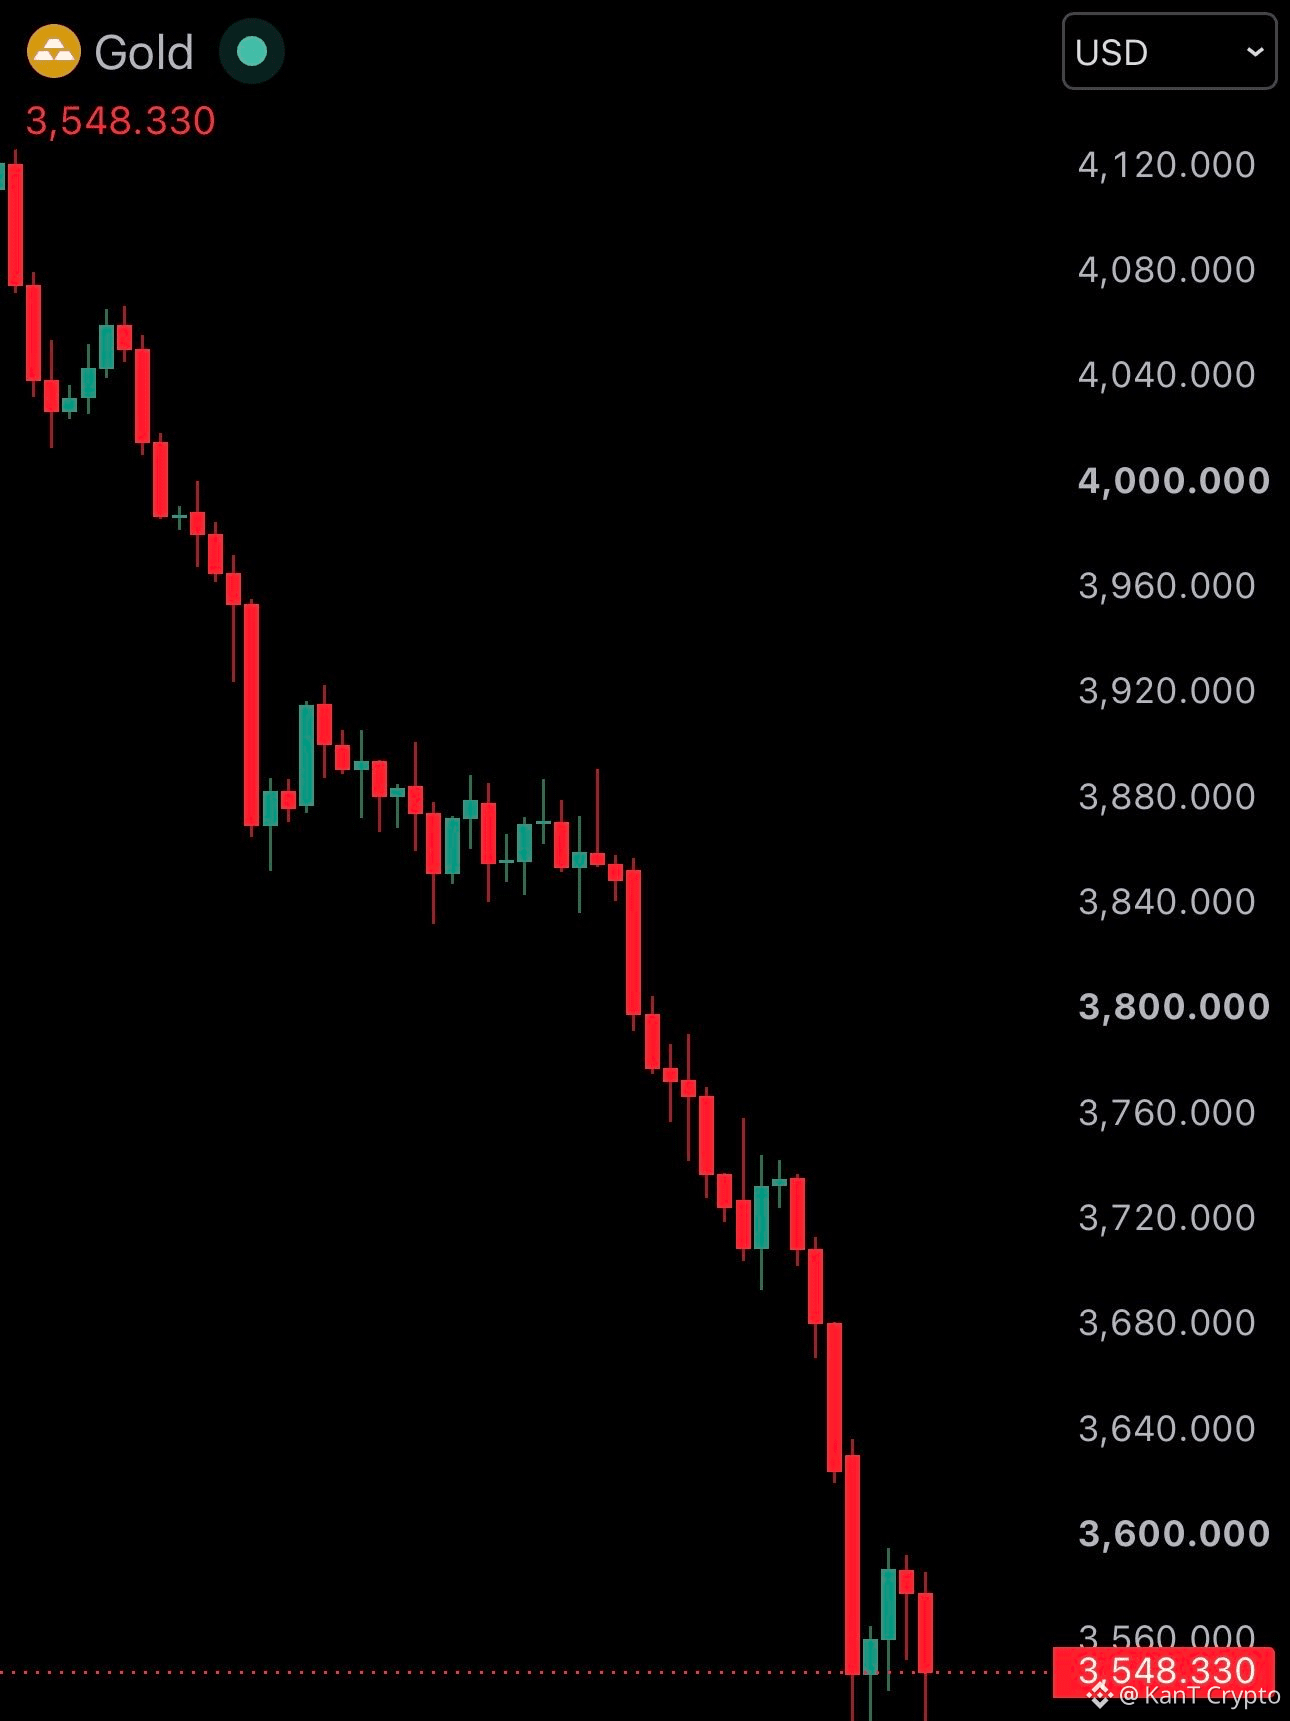
Gold falls under $3,550
S&P 500 falls under 7,100
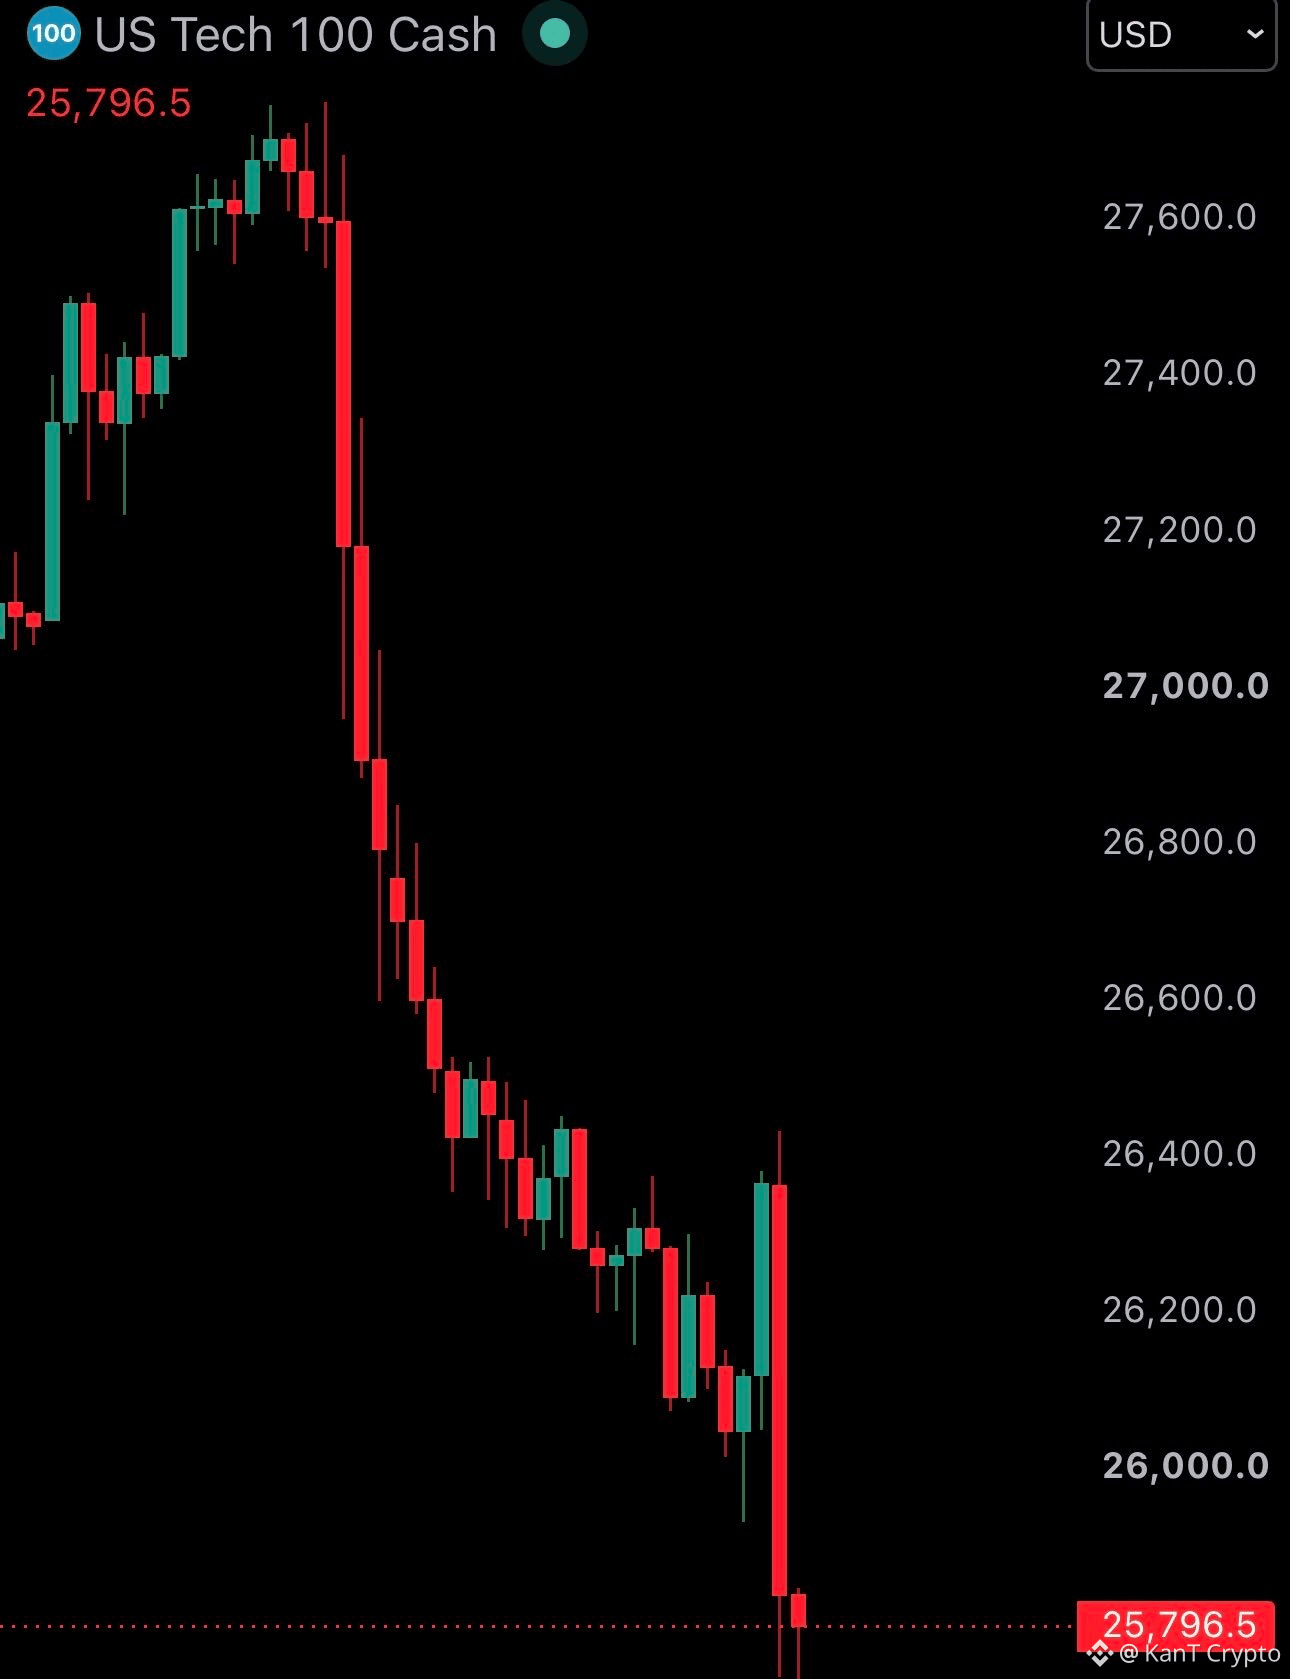
Nasdaq falls under 25,800
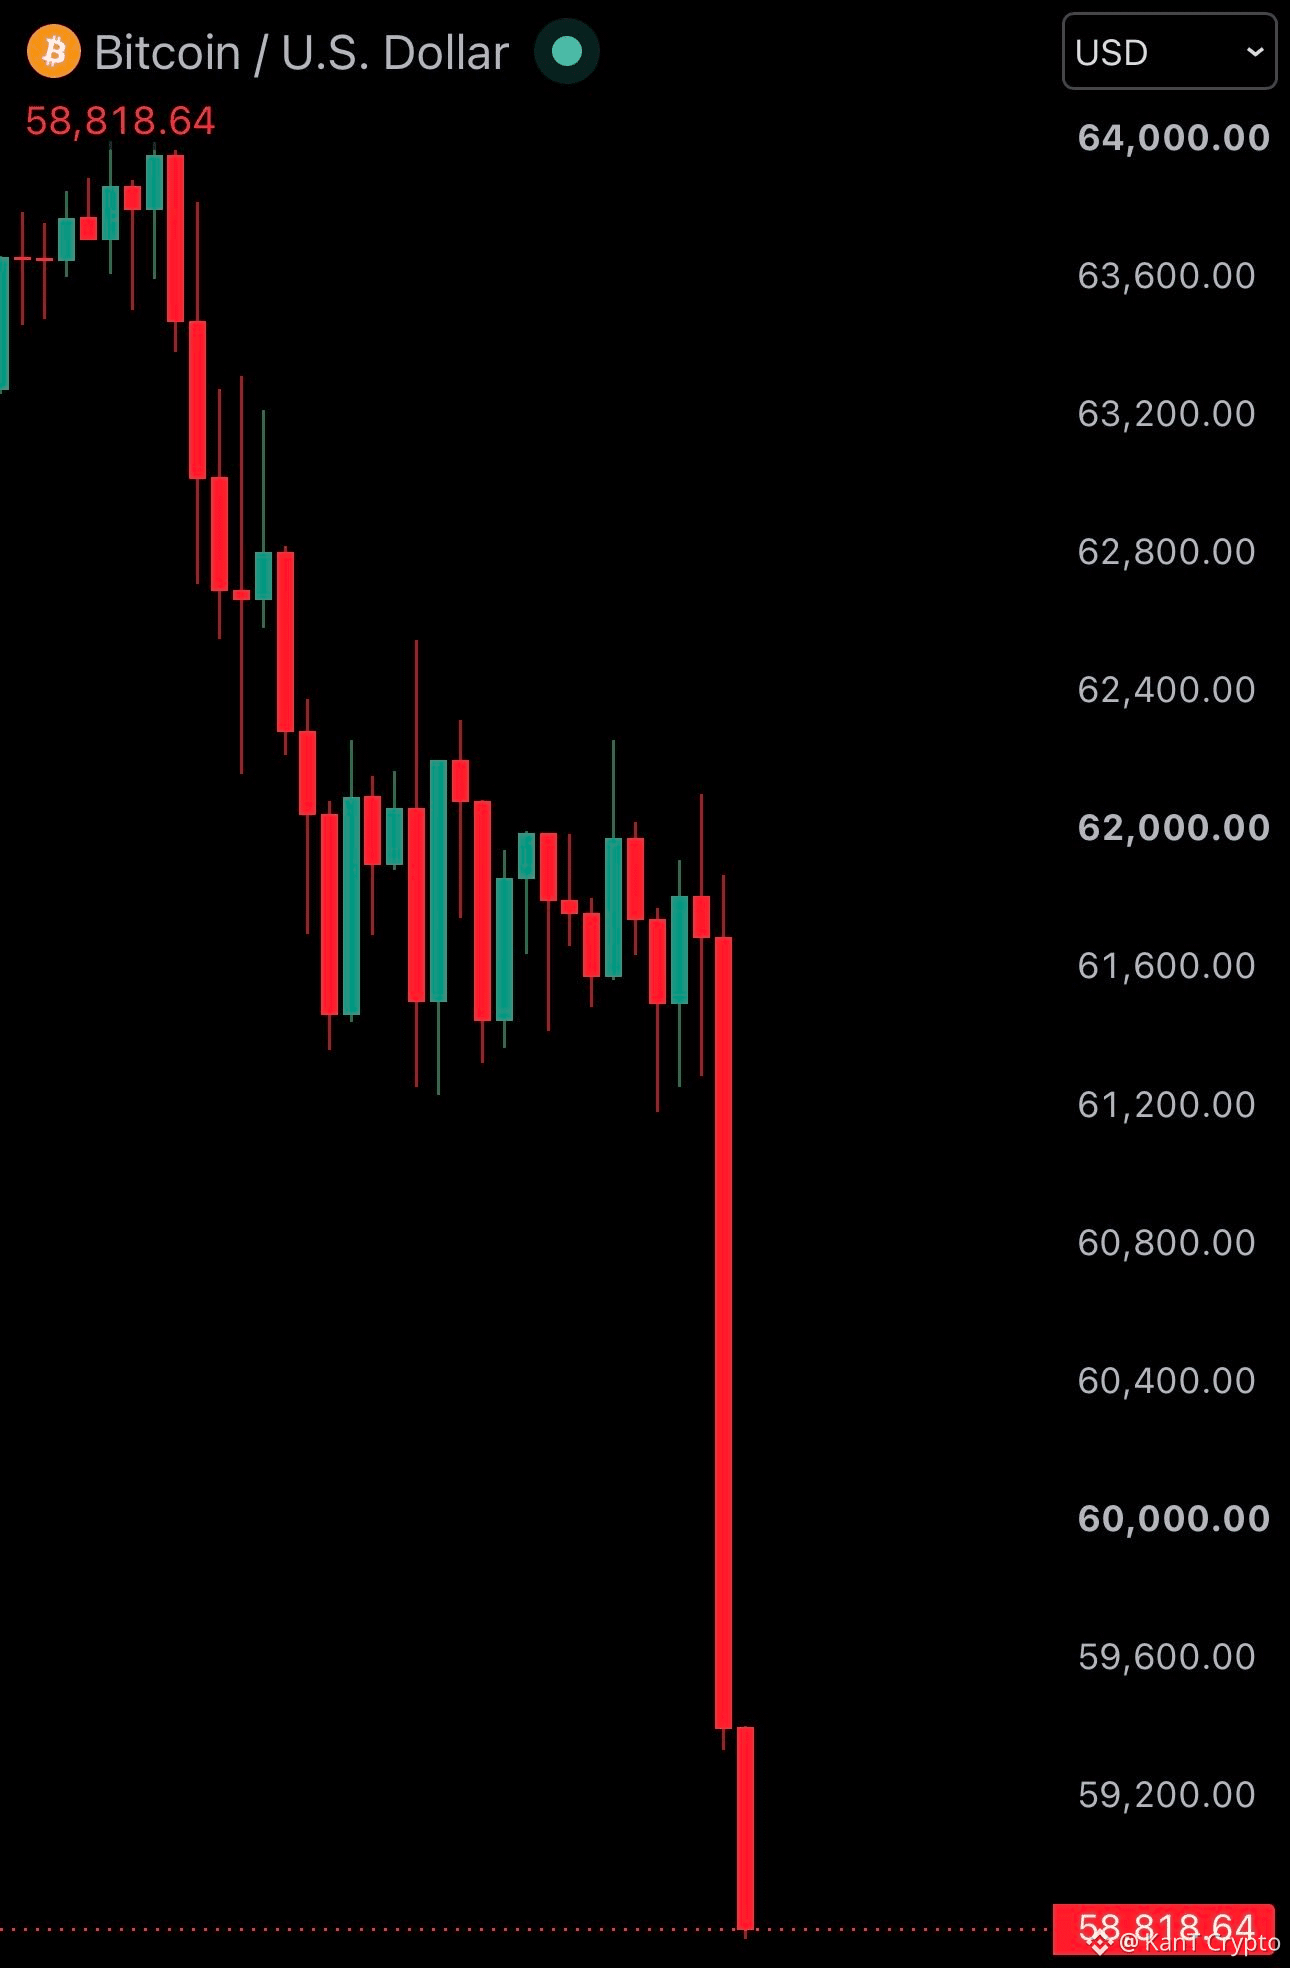
Bitcoin falls under $59,000
Trillions of dollars in combined market value have been wiped out today.
$BTC
{future}(BTCUSDT)
$XAU
{future}(XAUUSDT)
$NVDA
{future}(NVDAUSDT)
JUST IN: Financial markets are crashing
Gold falls under $3,550
S&P 500 falls under 7,100
Nasdaq falls under 25,800
Bitcoin falls under $59,000
Trillions of dollars in combined market value have been wiped out today.
$BTC
$XAU
$NVDA
Gold falls under $3,550
S&P 500 falls under 7,100
Nasdaq falls under 25,800
Bitcoin falls under $59,000
Trillions of dollars in combined market value have been wiped out today.
$BTC
$XAU
$NVDA
1
414
·
--
Bearish
See translation
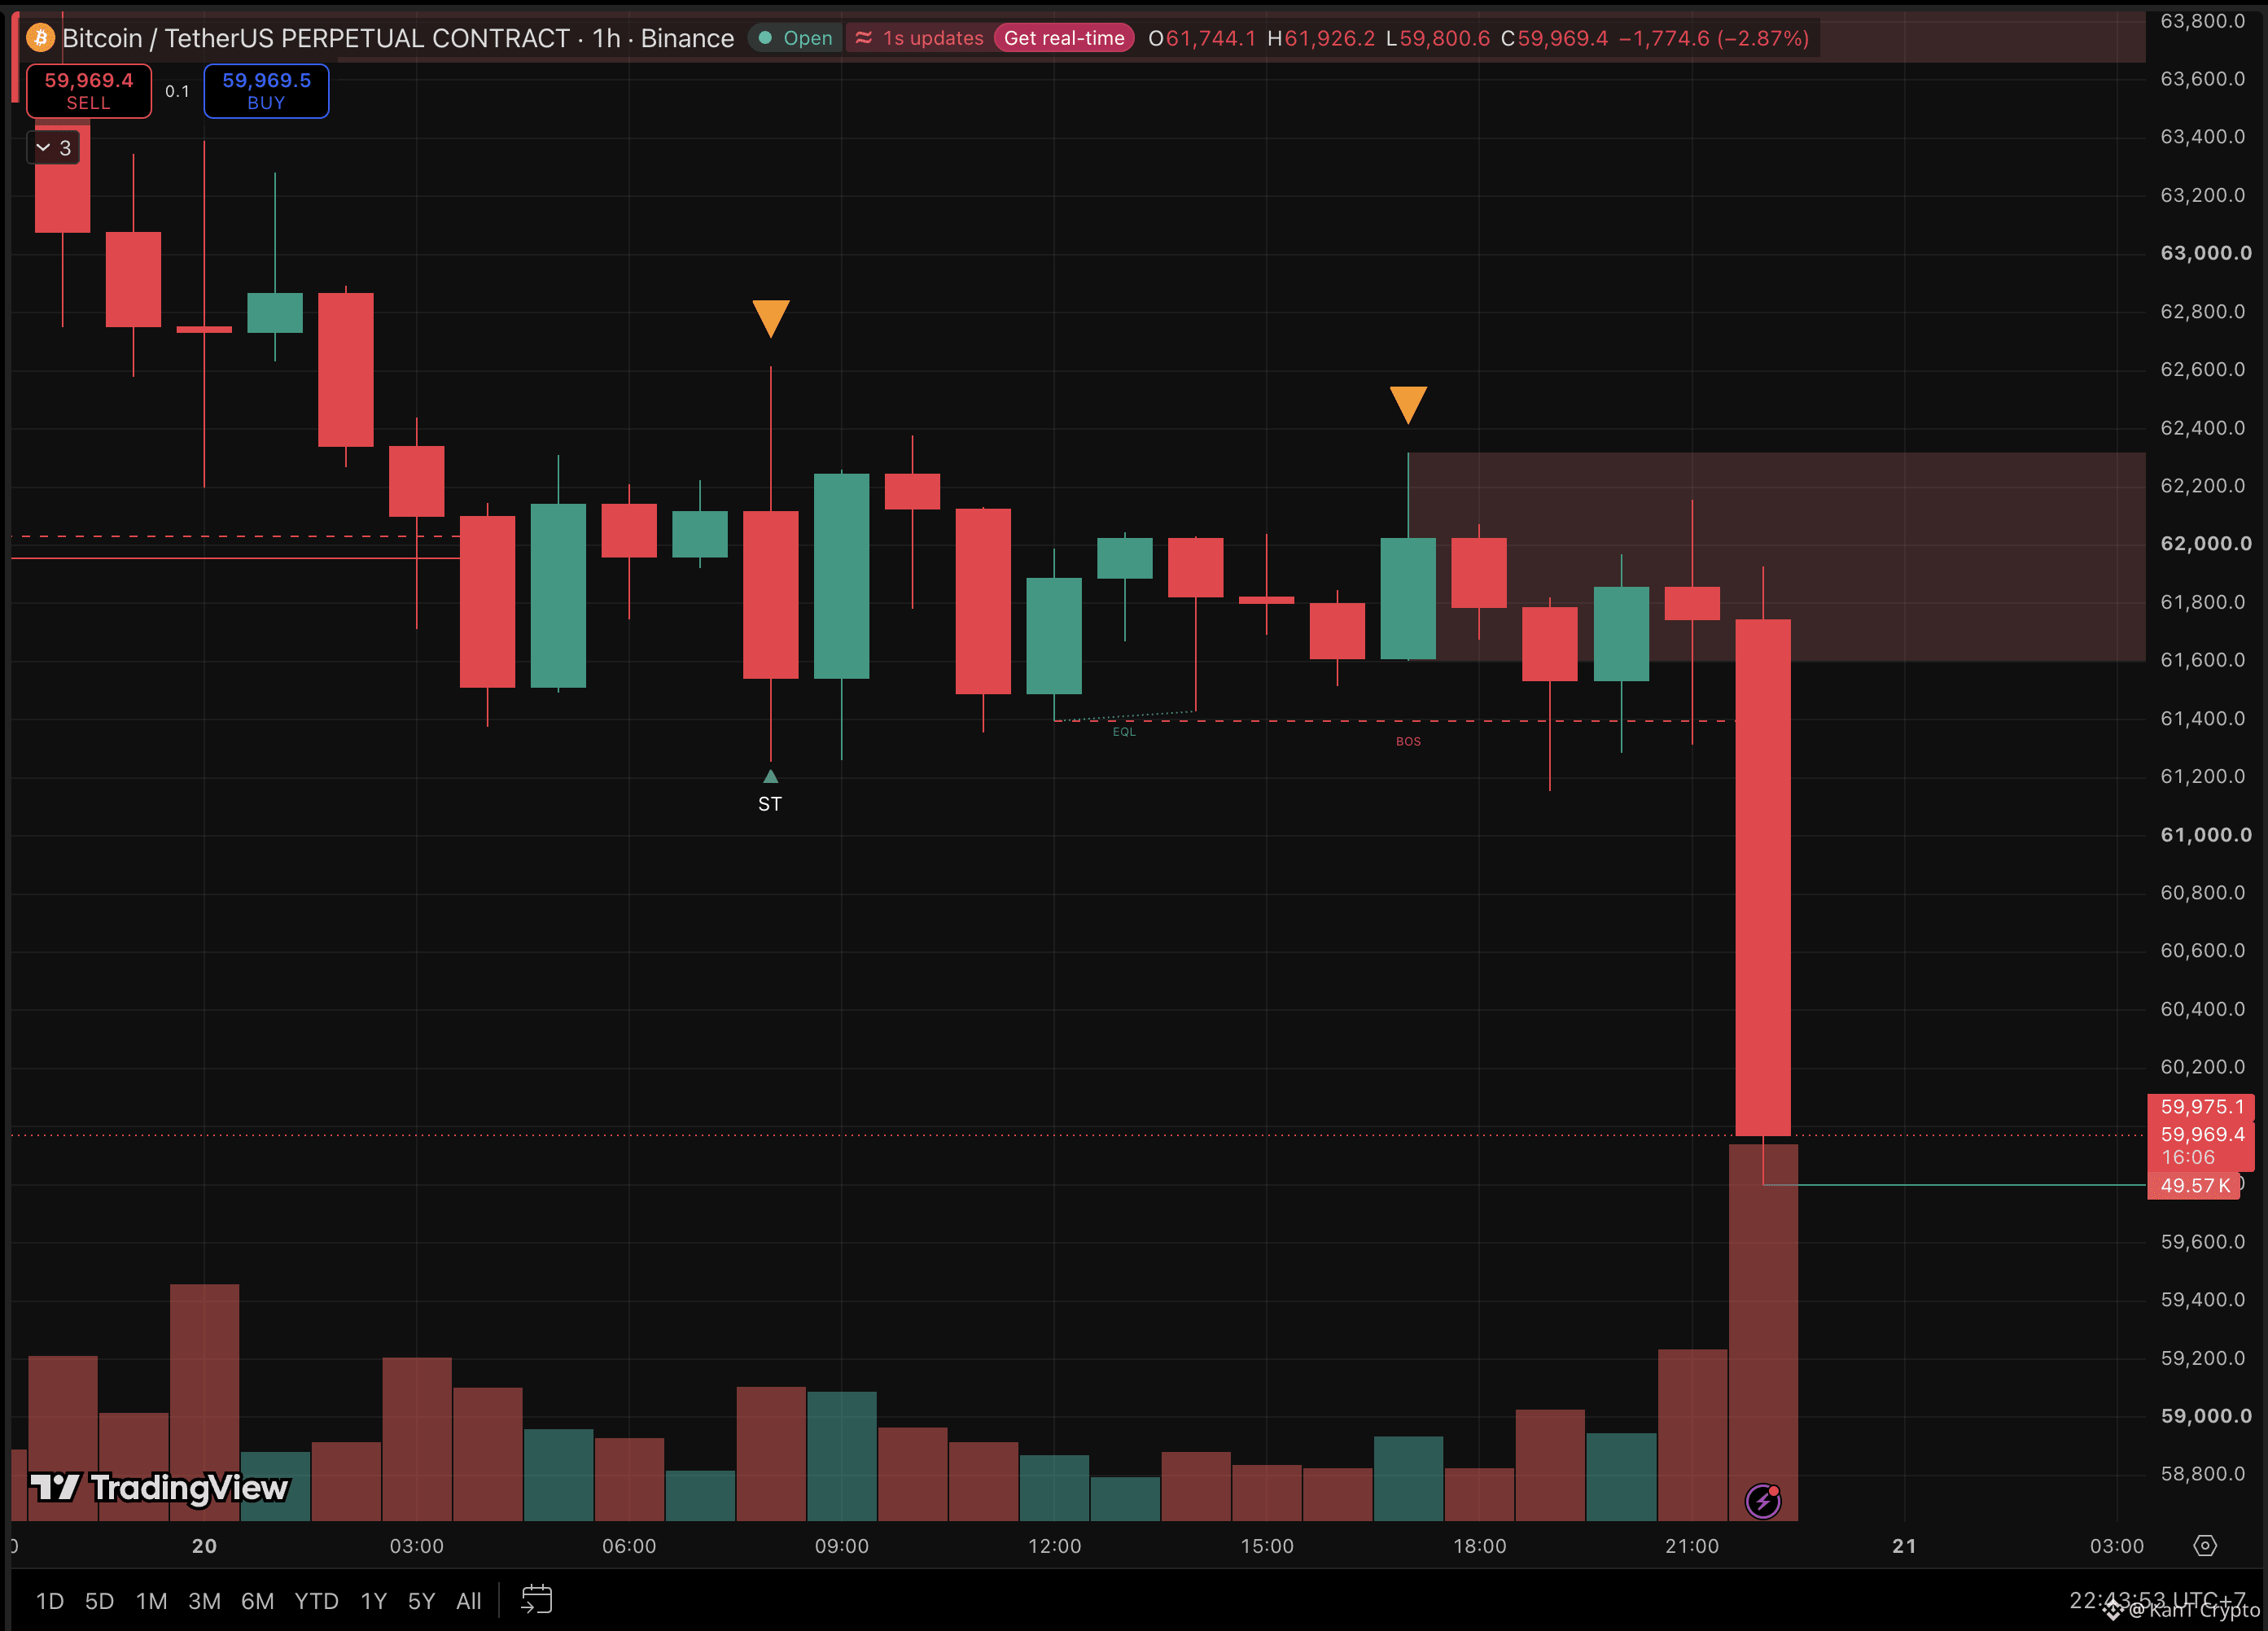
🚨 BREAKING: The 5 is back. Bitcoin just traded under $60,000 for the first time since July.
Low: $59,800
Drop in the hour after the US open: -$1,775
From the $126.2K record: about -52%
This morning’s map said lose $61.25K and $60K comes next, fast and violent rather than clean. That’s exactly how it arrived. 📉
For 13 hours, sellers leaned on every bounce near $62K. Underneath, stop orders kept piling up just below $61.4K. Once the US session opened, sellers went straight for them, and those forced exits carried price right through $60K.
The pressure isn’t only technical.
Spot ETFs bled $582M on Thursday, BlackRock’s IBIT with its biggest daily outflow since launch.
November outflows: about $3.47B.
Fed Governor Waller is openly floating a half-point hike for December.
And Bitcoin is on track for a seventh straight losing week, its longest streak since 2022.
The deeper problem: Glassnode says the average holder was only just in profit before this drop. Under $60K, the average coin may now be held at a loss, and holders underwater tend to sell into rallies just to get out even. 👀
Reclaim $61.4K on a 4H close → the break was a stop hunt, and $62.3K is the next ceiling.
Stay under $60K → the ~$57.8K July cycle low is next, and losing it means a fresh 2026 low.
Capitulation lows only show up in hindsight. Catching this one with leverage is a coin flip against the trend.
Stop hunt under $60K, or the road to $57.8K?
Not financial advice.
$BTC
{future}(BTCUSDT)
$ETH
{future}(ETHUSDT)
$SOL
{future}(SOLUSDT)
🚨 BREAKING: The 5 is back. Bitcoin just traded under $60,000 for the first time since July.
Low: $59,800
Drop in the hour after the US open: -$1,775
From the $126.2K record: about -52%
This morning’s map said lose $61.25K and $60K comes next, fast and violent rather than clean. That’s exactly how it arrived. 📉
For 13 hours, sellers leaned on every bounce near $62K. Underneath, stop orders kept piling up just below $61.4K. Once the US session opened, sellers went straight for them, and those forced exits carried price right through $60K.
The pressure isn’t only technical.
Spot ETFs bled $582M on Thursday, BlackRock’s IBIT with its biggest daily outflow since launch.
November outflows: about $3.47B.
Fed Governor Waller is openly floating a half-point hike for December.
And Bitcoin is on track for a seventh straight losing week, its longest streak since 2022.
The deeper problem: Glassnode says the average holder was only just in profit before this drop. Under $60K, the average coin may now be held at a loss, and holders underwater tend to sell into rallies just to get out even. 👀
Reclaim $61.4K on a 4H close → the break was a stop hunt, and $62.3K is the next ceiling.
Stay under $60K → the ~$57.8K July cycle low is next, and losing it means a fresh 2026 low.
Capitulation lows only show up in hindsight. Catching this one with leverage is a coin flip against the trend.
Stop hunt under $60K, or the road to $57.8K?
Not financial advice.
$BTC
$ETH
$SOL
Low: $59,800
Drop in the hour after the US open: -$1,775
From the $126.2K record: about -52%
This morning’s map said lose $61.25K and $60K comes next, fast and violent rather than clean. That’s exactly how it arrived. 📉
For 13 hours, sellers leaned on every bounce near $62K. Underneath, stop orders kept piling up just below $61.4K. Once the US session opened, sellers went straight for them, and those forced exits carried price right through $60K.
The pressure isn’t only technical.
Spot ETFs bled $582M on Thursday, BlackRock’s IBIT with its biggest daily outflow since launch.
November outflows: about $3.47B.
Fed Governor Waller is openly floating a half-point hike for December.
And Bitcoin is on track for a seventh straight losing week, its longest streak since 2022.
The deeper problem: Glassnode says the average holder was only just in profit before this drop. Under $60K, the average coin may now be held at a loss, and holders underwater tend to sell into rallies just to get out even. 👀
Reclaim $61.4K on a 4H close → the break was a stop hunt, and $62.3K is the next ceiling.
Stay under $60K → the ~$57.8K July cycle low is next, and losing it means a fresh 2026 low.
Capitulation lows only show up in hindsight. Catching this one with leverage is a coin flip against the trend.
Stop hunt under $60K, or the road to $57.8K?
Not financial advice.
$BTC
$ETH
$SOL
1
2.2k
·
--
Bearish
See translation
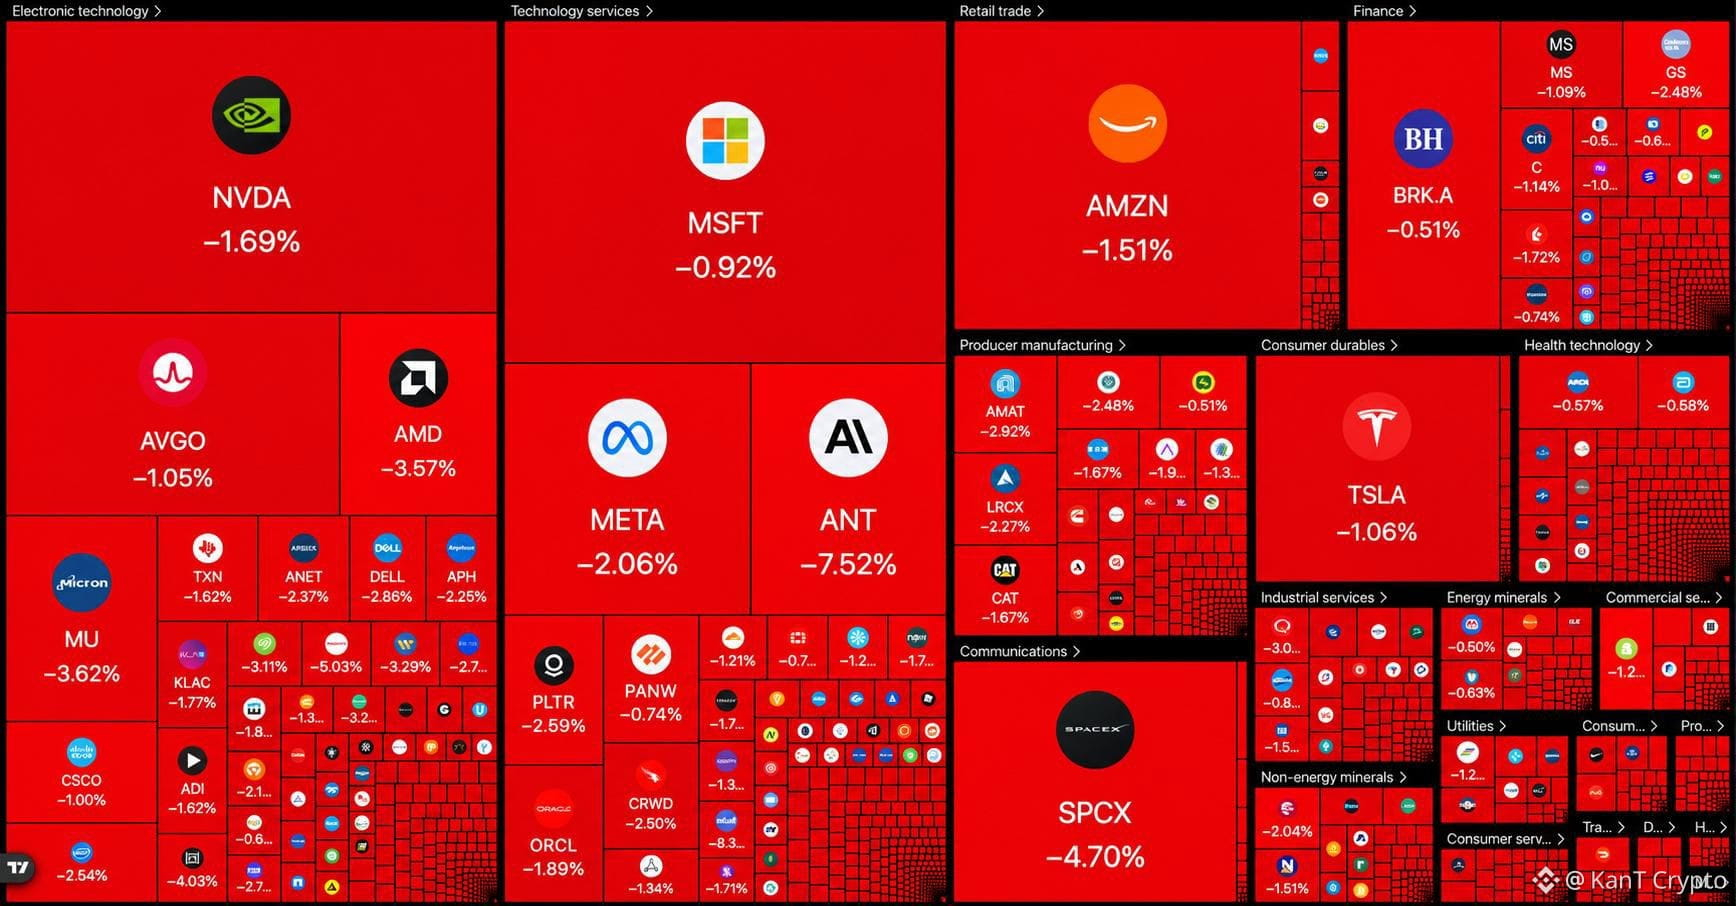
$500 BILLION has been wiped out from US stock market at open.
AI trade is breaking...
$NVDA
{future}(NVDAUSDT)
$ANT.US
$GOOGL
{stock_us}(ANT.US)
{future}(GOOGLUSDT)
$500 BILLION has been wiped out from US stock market at open.
AI trade is breaking...
$NVDA
$ANT.US
$GOOGL
AI trade is breaking...
$NVDA
$ANT.US
$GOOGL
3
2.1k
·
--
Bullish
See translation
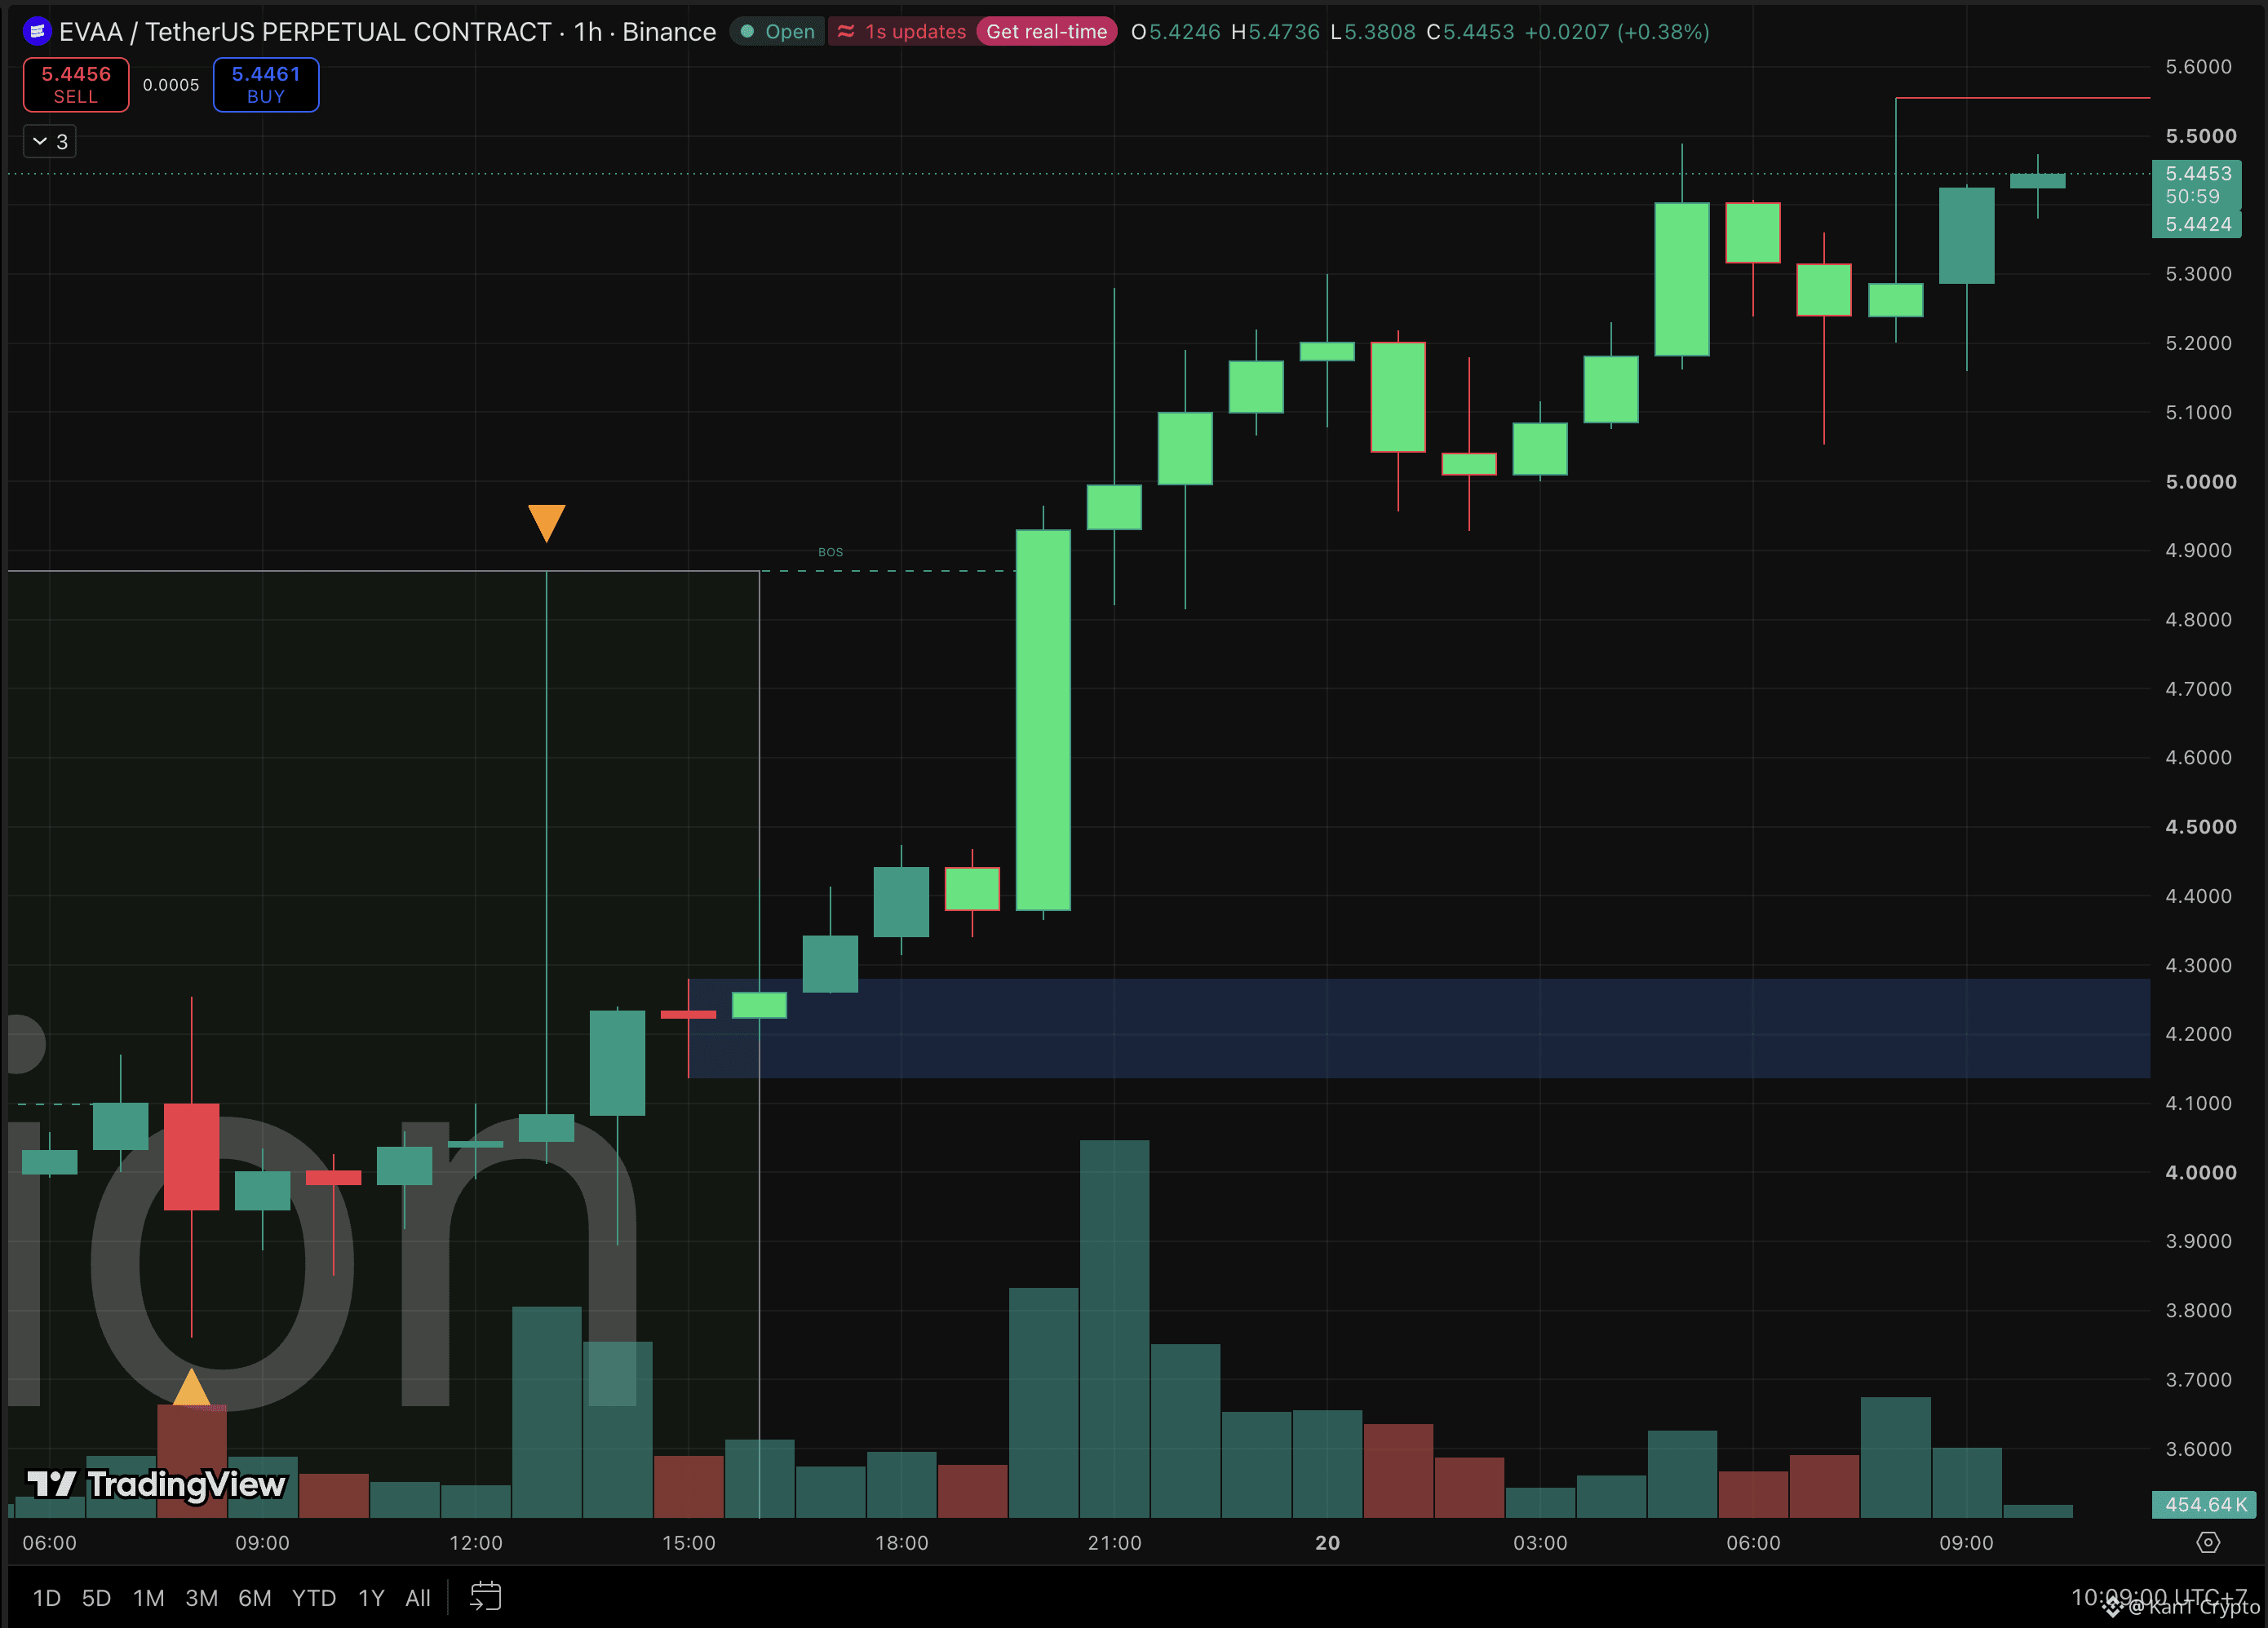
🚀 EVAA spiked to $5.556, got slapped back to $5.28, then climbed right back up like nothing happened.
Spike high: ~$5.556
Now: $5.445
Breakout start: ~$4.22, about +29% since
Accumulation low: ~$3.76
The setup was patient.
A full day of accumulation (quiet buying in a flat range), with one early wick to $4.87 that marked the ceiling.
Then a BOS (break of structure) right through that $4.87 line on surging volume.
Since then the trend has been clean.
Higher lows: ~$4.82, ~$4.93, ~$5.06, ~$5.16.
Higher highs: $5.28, $5.30, $5.485, then the $5.556 spike.
Wicks like that usually mean sellers are waiting overhead, and this one left a long upper shadow.
But the very next candle bought most of it back, and the dip held above the last higher low. 👀
That’s the difference between a blow-off top and a test of supply.
Volume is the one thing to watch.
It peaked right after the breakout, and the pushes since have come on far less.
Close above $5.556 on the 4H → the spike becomes the breakout, and the trend has room.
Lose $5.16 → the higher-low chain breaks, and the $4.93 to $5.00 shelf is next, with the $4.87 breakout line below it.
Chasing a coin right under its spike high is buying where sellers already showed up once. A pullback to a higher low is the calmer place to judge it.
Breakout through $5.556, or a second rejection at the wick?
Not financial advice.
$EVAA $MMT $ICNT
{future}(MMTUSDT)
{future}(ICNTUSDT)
{future}(EVAAUSDT)
🚀 EVAA spiked to $5.556, got slapped back to $5.28, then climbed right back up like nothing happened.
Spike high: ~$5.556
Now: $5.445
Breakout start: ~$4.22, about +29% since
Accumulation low: ~$3.76
The setup was patient.
A full day of accumulation (quiet buying in a flat range), with one early wick to $4.87 that marked the ceiling.
Then a BOS (break of structure) right through that $4.87 line on surging volume.
Since then the trend has been clean.
Higher lows: ~$4.82, ~$4.93, ~$5.06, ~$5.16.
Higher highs: $5.28, $5.30, $5.485, then the $5.556 spike.
Wicks like that usually mean sellers are waiting overhead, and this one left a long upper shadow.
But the very next candle bought most of it back, and the dip held above the last higher low. 👀
That’s the difference between a blow-off top and a test of supply.
Volume is the one thing to watch.
It peaked right after the breakout, and the pushes since have come on far less.
Close above $5.556 on the 4H → the spike becomes the breakout, and the trend has room.
Lose $5.16 → the higher-low chain breaks, and the $4.93 to $5.00 shelf is next, with the $4.87 breakout line below it.
Chasing a coin right under its spike high is buying where sellers already showed up once. A pullback to a higher low is the calmer place to judge it.
Breakout through $5.556, or a second rejection at the wick?
Not financial advice.
$EVAA $MMT $ICNT
Spike high: ~$5.556
Now: $5.445
Breakout start: ~$4.22, about +29% since
Accumulation low: ~$3.76
The setup was patient.
A full day of accumulation (quiet buying in a flat range), with one early wick to $4.87 that marked the ceiling.
Then a BOS (break of structure) right through that $4.87 line on surging volume.
Since then the trend has been clean.
Higher lows: ~$4.82, ~$4.93, ~$5.06, ~$5.16.
Higher highs: $5.28, $5.30, $5.485, then the $5.556 spike.
Wicks like that usually mean sellers are waiting overhead, and this one left a long upper shadow.
But the very next candle bought most of it back, and the dip held above the last higher low. 👀
That’s the difference between a blow-off top and a test of supply.
Volume is the one thing to watch.
It peaked right after the breakout, and the pushes since have come on far less.
Close above $5.556 on the 4H → the spike becomes the breakout, and the trend has room.
Lose $5.16 → the higher-low chain breaks, and the $4.93 to $5.00 shelf is next, with the $4.87 breakout line below it.
Chasing a coin right under its spike high is buying where sellers already showed up once. A pullback to a higher low is the calmer place to judge it.
Breakout through $5.556, or a second rejection at the wick?
Not financial advice.
$EVAA $MMT $ICNT
1
2
1.2k
·
--
Bullish
See translation
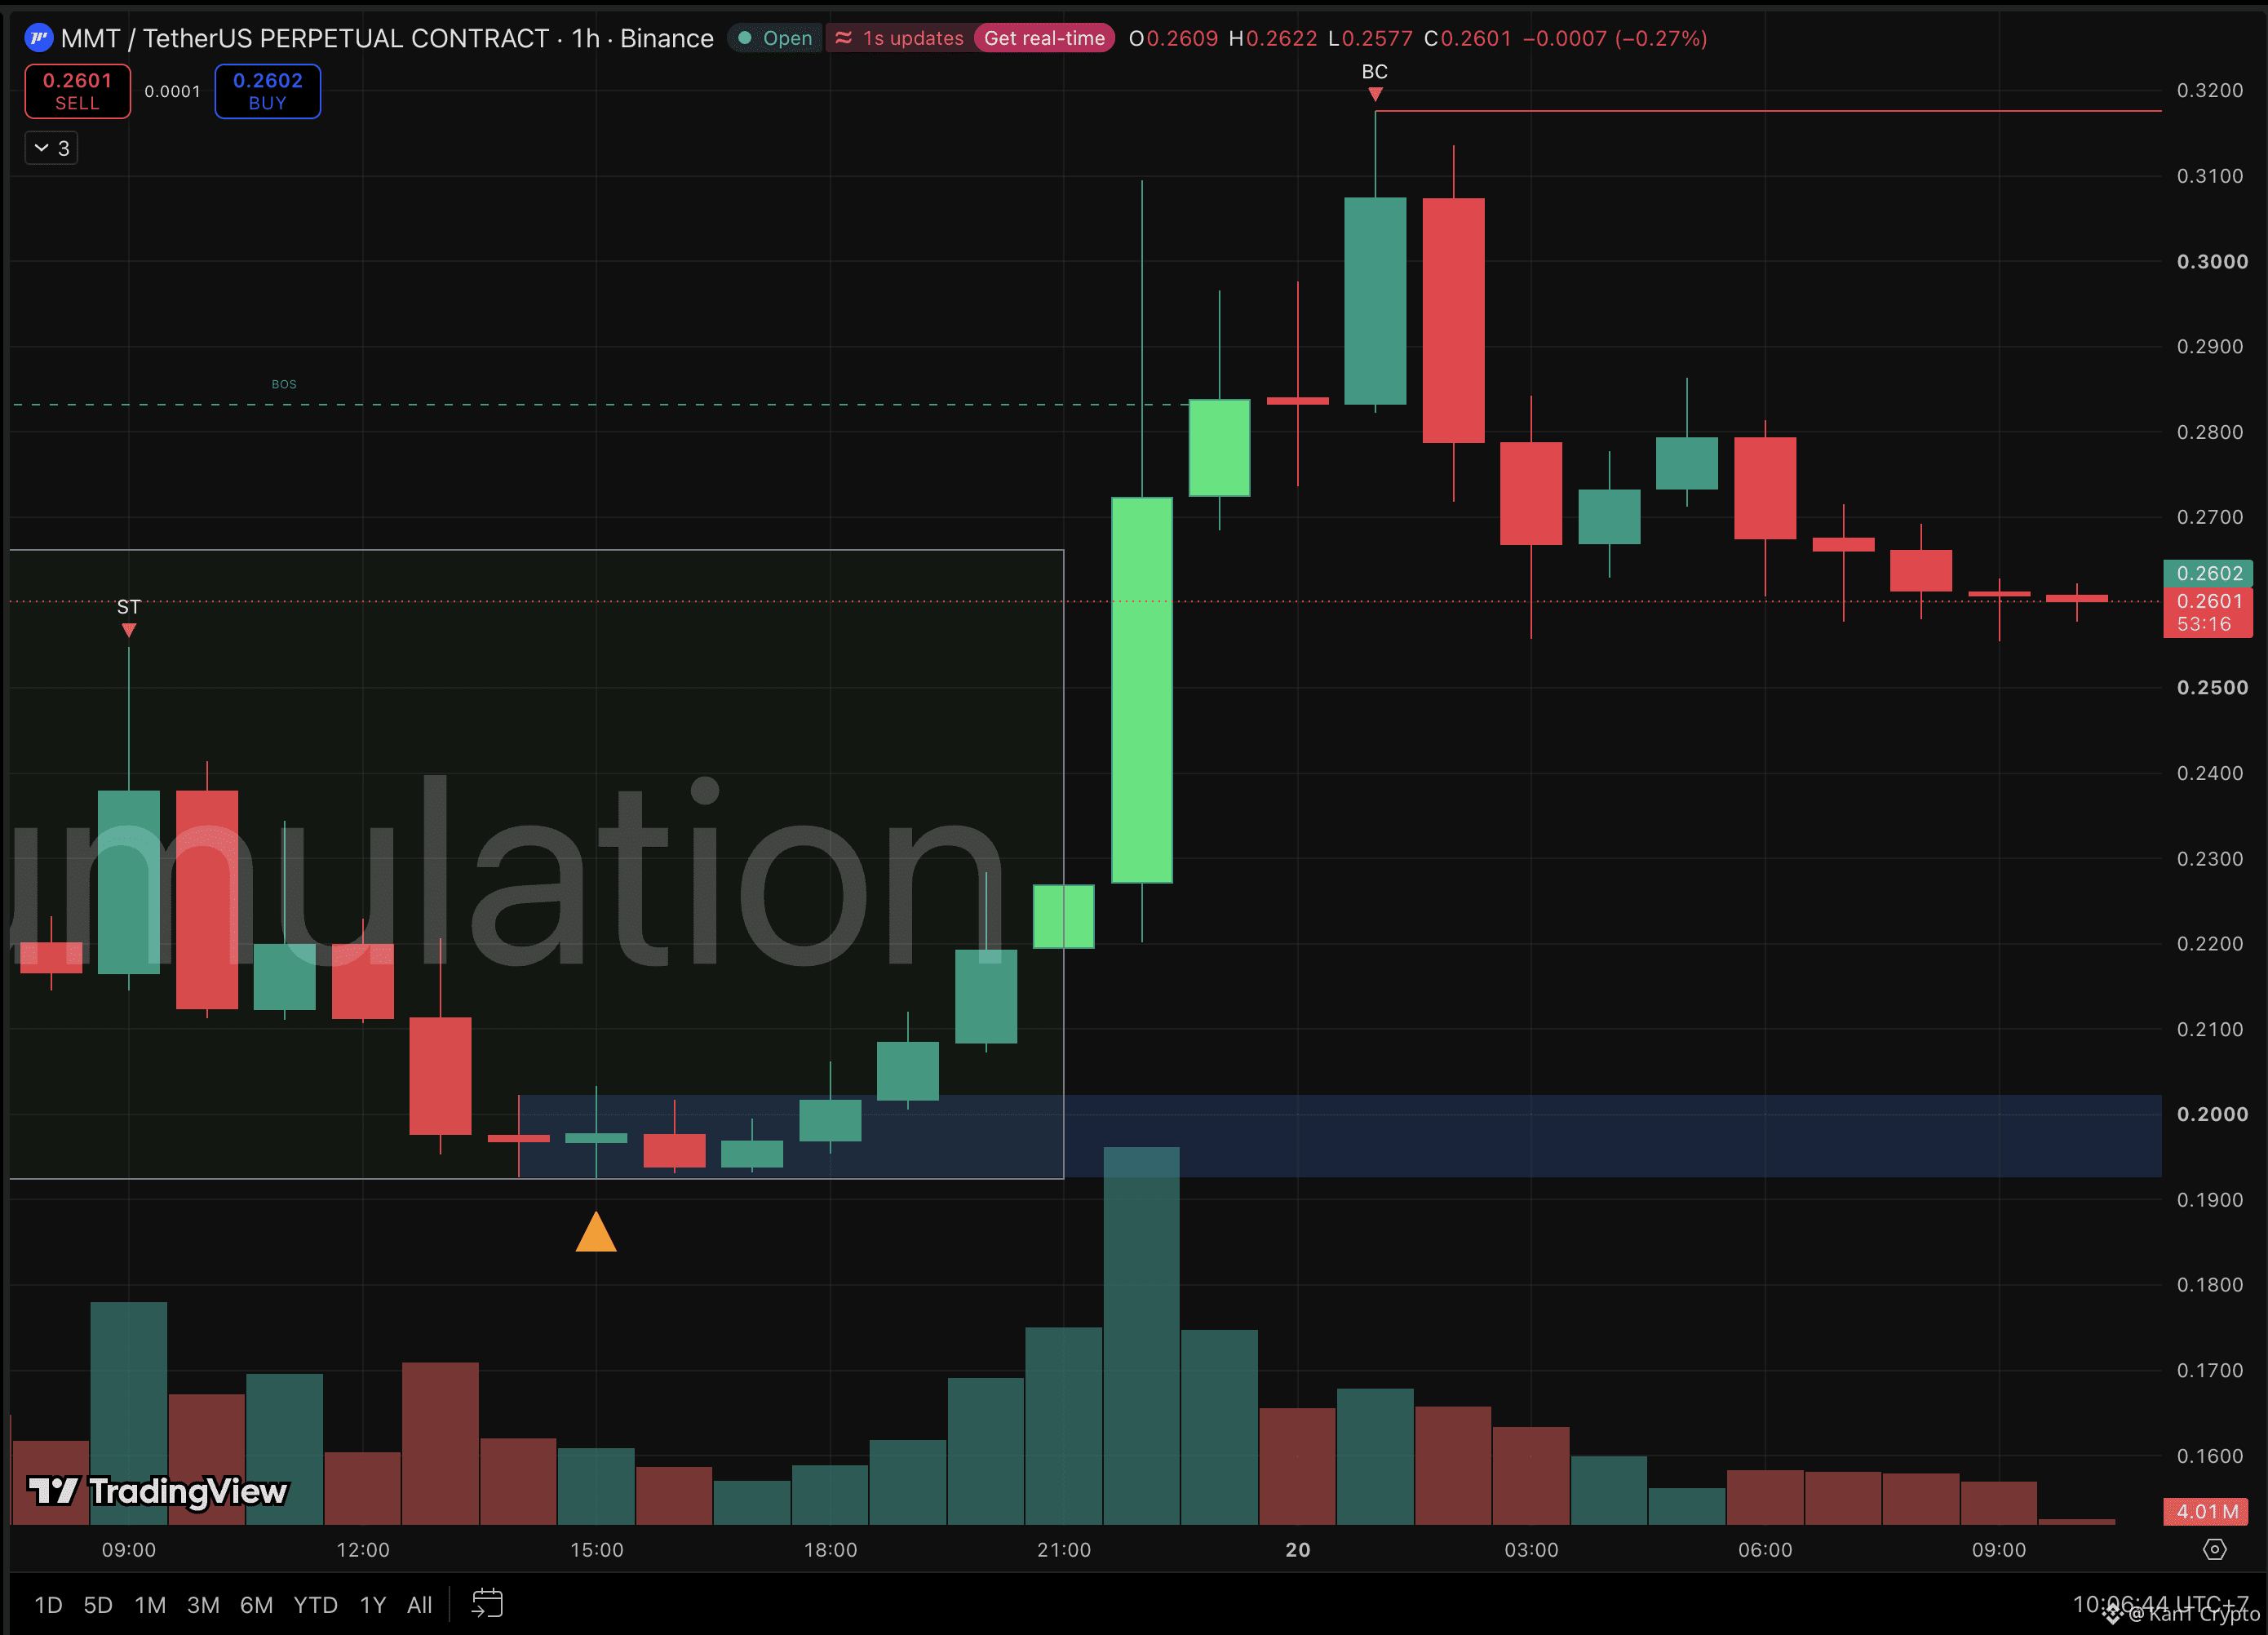
📊 +64% in 10 hours. -18% in the 9 hours after. MMT is giving everyone whiplash.
Low: ~$0.193
Buying climax high: ~$0.3176
Now: $0.2601
Yesterday’s map had both sides covered, and MMT hit both.
Lose $0.2145 → $0.2075 next. It went further, all the way to $0.193.
Then it reversed hard, smashed through the old $0.2835 high and topped at $0.3176.
Honest scorecard: the downside call landed first, the upside levels got blown past after.
Now look at the come-down.
The top printed a buying climax (late buyers piling in while early ones cash out).
The first drop stopped at ~$0.2667.
The bounce after it stalled at ~$0.286, a lower high.
And now price has slid under that $0.2667 low, back below the top of the old $0.193 to $0.266 accumulation box.
Volume tells the rest.
It has faded steadily since the top.
No panic selling, but no one rushing to buy either. 👀
That’s a market deciding, not crashing.
Reclaim $0.266 on a 4H close → the breakout is alive, $0.2835 then $0.3176 come back.
Lose $0.2205 → the breakout failed, and the $0.193 to $0.202 demand zone is the floor buyers defended before.
A coin that swings 60% in a day doesn’t care about your stop placement. Size like it can do it again tomorrow.
Fresh breakout taking a breather, or a fake one fading back into the box?
Not financial advice.
$MMT $EVAA $ICNT
{future}(ICNTUSDT)
{future}(EVAAUSDT)
{future}(MMTUSDT)
📊 +64% in 10 hours. -18% in the 9 hours after. MMT is giving everyone whiplash.
Low: ~$0.193
Buying climax high: ~$0.3176
Now: $0.2601
Yesterday’s map had both sides covered, and MMT hit both.
Lose $0.2145 → $0.2075 next. It went further, all the way to $0.193.
Then it reversed hard, smashed through the old $0.2835 high and topped at $0.3176.
Honest scorecard: the downside call landed first, the upside levels got blown past after.
Now look at the come-down.
The top printed a buying climax (late buyers piling in while early ones cash out).
The first drop stopped at ~$0.2667.
The bounce after it stalled at ~$0.286, a lower high.
And now price has slid under that $0.2667 low, back below the top of the old $0.193 to $0.266 accumulation box.
Volume tells the rest.
It has faded steadily since the top.
No panic selling, but no one rushing to buy either. 👀
That’s a market deciding, not crashing.
Reclaim $0.266 on a 4H close → the breakout is alive, $0.2835 then $0.3176 come back.
Lose $0.2205 → the breakout failed, and the $0.193 to $0.202 demand zone is the floor buyers defended before.
A coin that swings 60% in a day doesn’t care about your stop placement. Size like it can do it again tomorrow.
Fresh breakout taking a breather, or a fake one fading back into the box?
Not financial advice.
$MMT $EVAA $ICNT
Low: ~$0.193
Buying climax high: ~$0.3176
Now: $0.2601
Yesterday’s map had both sides covered, and MMT hit both.
Lose $0.2145 → $0.2075 next. It went further, all the way to $0.193.
Then it reversed hard, smashed through the old $0.2835 high and topped at $0.3176.
Honest scorecard: the downside call landed first, the upside levels got blown past after.
Now look at the come-down.
The top printed a buying climax (late buyers piling in while early ones cash out).
The first drop stopped at ~$0.2667.
The bounce after it stalled at ~$0.286, a lower high.
And now price has slid under that $0.2667 low, back below the top of the old $0.193 to $0.266 accumulation box.
Volume tells the rest.
It has faded steadily since the top.
No panic selling, but no one rushing to buy either. 👀
That’s a market deciding, not crashing.
Reclaim $0.266 on a 4H close → the breakout is alive, $0.2835 then $0.3176 come back.
Lose $0.2205 → the breakout failed, and the $0.193 to $0.202 demand zone is the floor buyers defended before.
A coin that swings 60% in a day doesn’t care about your stop placement. Size like it can do it again tomorrow.
Fresh breakout taking a breather, or a fake one fading back into the box?
Not financial advice.
$MMT $EVAA $ICNT
1
1
825
·
--
Bearish
See translation
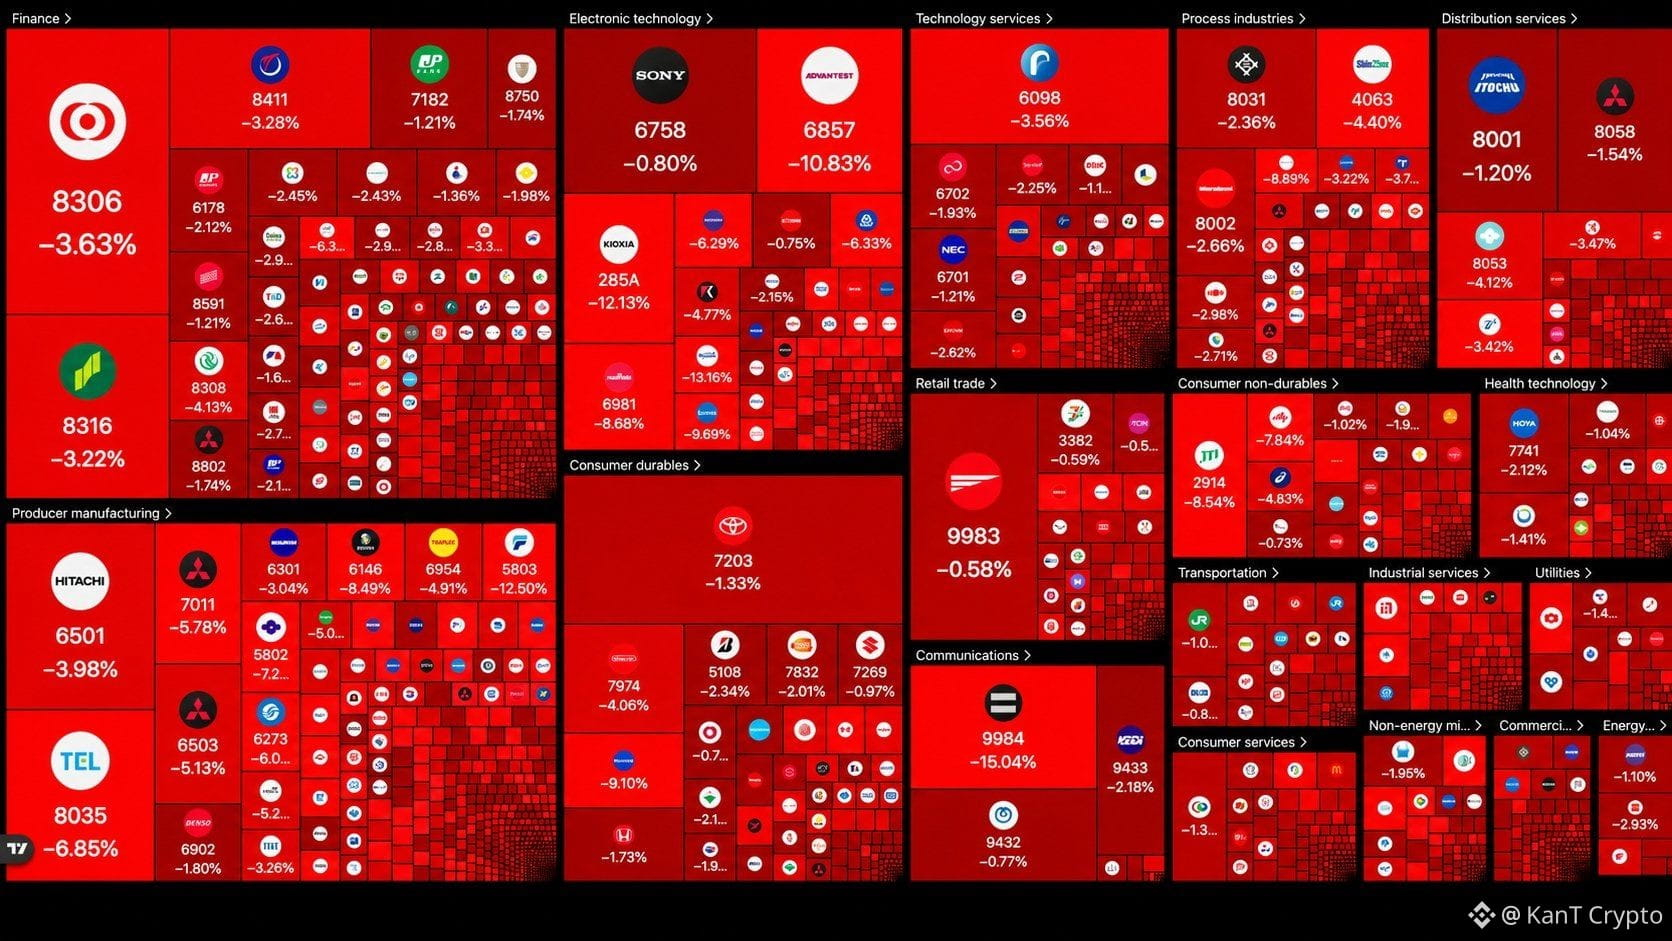
🩸MASSIVE CRASH
¥57 TRILLION has been wipeout from Japanese stock market today as Nikkei Hits a new 7 month low.
AI Bubble...
$BTC
{future}(BTCUSDT)
$NVDA
{future}(NVDAUSDT)
$ANTHROPIC
🩸MASSIVE CRASH
¥57 TRILLION has been wipeout from Japanese stock market today as Nikkei Hits a new 7 month low.
AI Bubble...
$BTC
$NVDA
$ANTHROPIC
¥57 TRILLION has been wipeout from Japanese stock market today as Nikkei Hits a new 7 month low.
AI Bubble...
$BTC
$NVDA
$ANTHROPIC
2
1k
·
--
Bearish
Verified
See translation
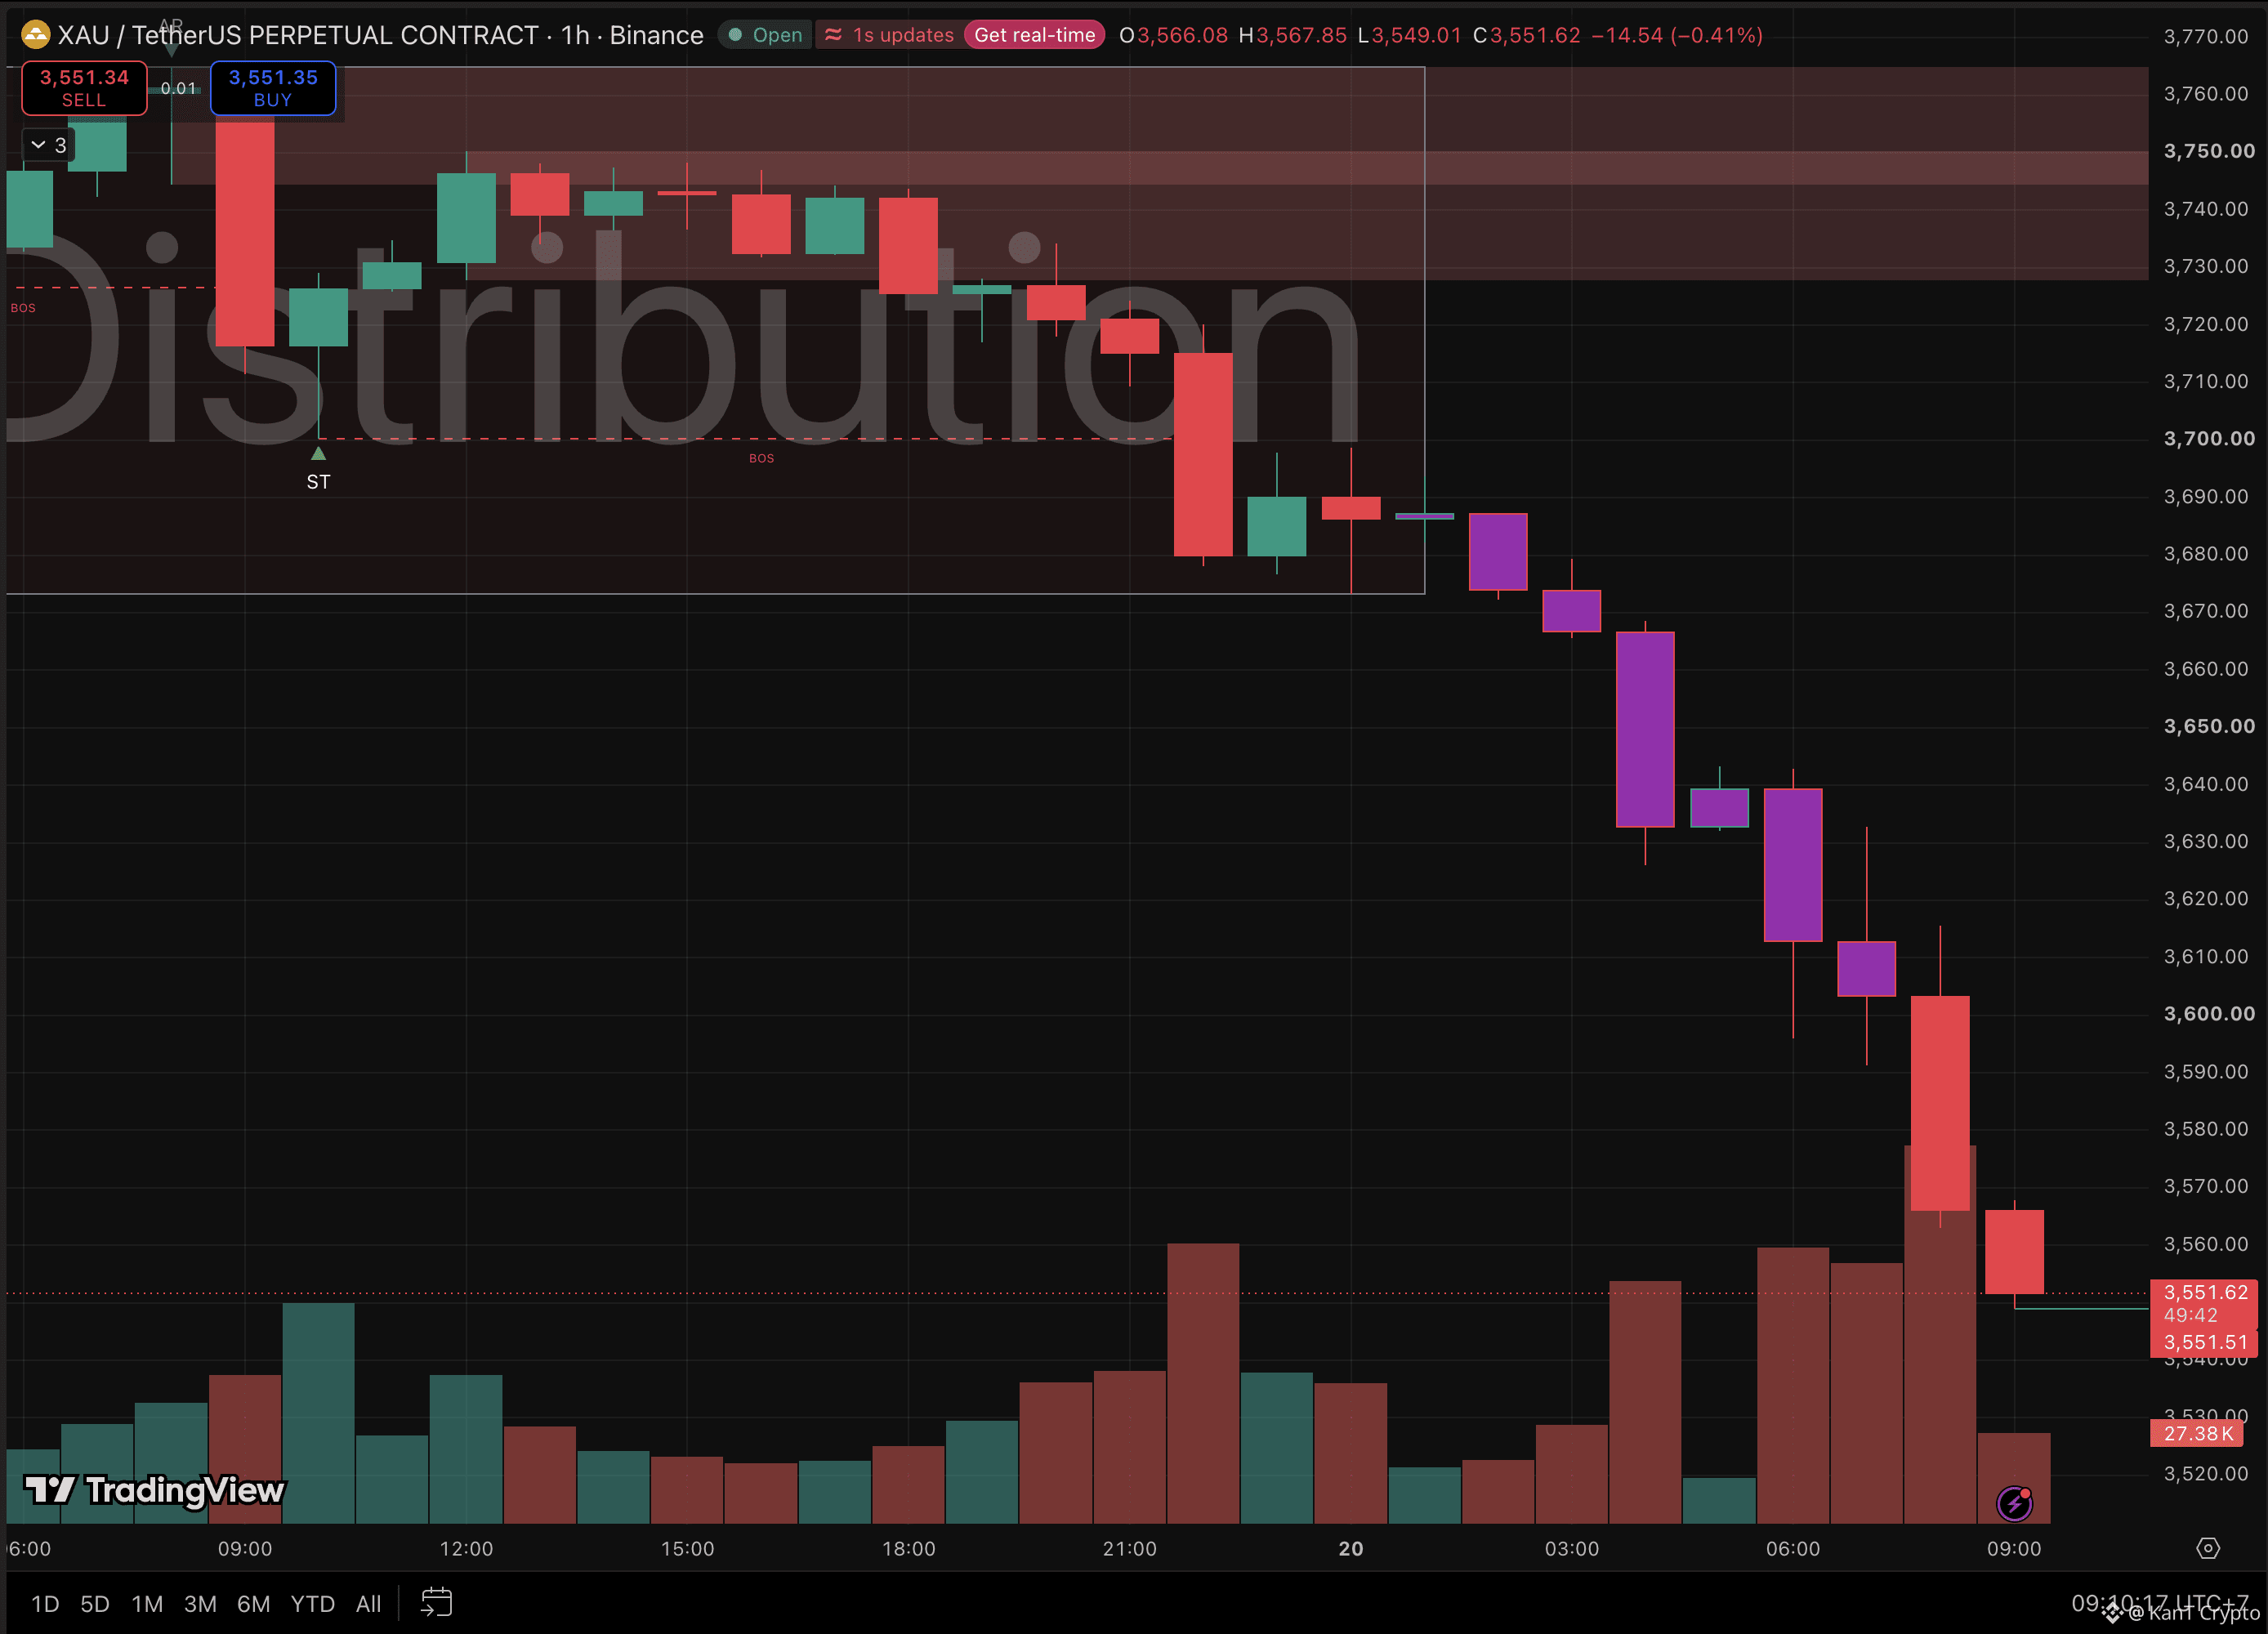
🏦 Central banks bought 321 tonnes of gold last quarter. Gold just broke $3,600 anyway.
Now: $3,551
24 hours ago: ~$3,766
From the January record near $5,590: about -36%
Lowest in more than 14 months
Yesterday’s map: lose $3,650 and the next leg opens.
It opened overnight. 📉
The chart was a textbook distribution: a flat range at $3,674 to $3,766 where sellers kept unloading into every bounce.
Once the BOS (break of structure) at $3,700 gave way, the floor at $3,674 went next.
Then came a string of heavy-volume candles, each closing near its low, straight through $3,600.
So who is selling into central bank demand?
US funds, mostly. North America was the only region with ETF outflows in October.
India’s bar and coin buying fell about 40%.
With the 10-year yield above 5% and a December hike close to certain, Western money has a better place to park cash.
But the other side hasn’t quit.
Global gold ETF holdings hit a record near 4,256 tonnes in October, led by Europe.
Chinese bar and coin demand rose 7%.
The West is selling, the East is buying, and right now the West is winning the tape.
Reclaim $3,600 on a 4H close → the flush is losing steam, $3,674 is the ceiling.
Stay under $3,600 → the flush can keep going, and nothing on this chart marks a floor below today’s $3,549 low.
Long-term buyers may see value building. Short-term, a trend this clean doesn’t reverse on hope.
West keeps selling, or East starts winning?
Not financial advice.
$XAUT
{future}(XAUTUSDT)
$XAU
{future}(XAUUSDT)
$PAXG
{future}(PAXGUSDT)
🏦 Central banks bought 321 tonnes of gold last quarter. Gold just broke $3,600 anyway.
Now: $3,551
24 hours ago: ~$3,766
From the January record near $5,590: about -36%
Lowest in more than 14 months
Yesterday’s map: lose $3,650 and the next leg opens.
It opened overnight. 📉
The chart was a textbook distribution: a flat range at $3,674 to $3,766 where sellers kept unloading into every bounce.
Once the BOS (break of structure) at $3,700 gave way, the floor at $3,674 went next.
Then came a string of heavy-volume candles, each closing near its low, straight through $3,600.
So who is selling into central bank demand?
US funds, mostly. North America was the only region with ETF outflows in October.
India’s bar and coin buying fell about 40%.
With the 10-year yield above 5% and a December hike close to certain, Western money has a better place to park cash.
But the other side hasn’t quit.
Global gold ETF holdings hit a record near 4,256 tonnes in October, led by Europe.
Chinese bar and coin demand rose 7%.
The West is selling, the East is buying, and right now the West is winning the tape.
Reclaim $3,600 on a 4H close → the flush is losing steam, $3,674 is the ceiling.
Stay under $3,600 → the flush can keep going, and nothing on this chart marks a floor below today’s $3,549 low.
Long-term buyers may see value building. Short-term, a trend this clean doesn’t reverse on hope.
West keeps selling, or East starts winning?
Not financial advice.
$XAUT
$XAU
$PAXG
Now: $3,551
24 hours ago: ~$3,766
From the January record near $5,590: about -36%
Lowest in more than 14 months
Yesterday’s map: lose $3,650 and the next leg opens.
It opened overnight. 📉
The chart was a textbook distribution: a flat range at $3,674 to $3,766 where sellers kept unloading into every bounce.
Once the BOS (break of structure) at $3,700 gave way, the floor at $3,674 went next.
Then came a string of heavy-volume candles, each closing near its low, straight through $3,600.
So who is selling into central bank demand?
US funds, mostly. North America was the only region with ETF outflows in October.
India’s bar and coin buying fell about 40%.
With the 10-year yield above 5% and a December hike close to certain, Western money has a better place to park cash.
But the other side hasn’t quit.
Global gold ETF holdings hit a record near 4,256 tonnes in October, led by Europe.
Chinese bar and coin demand rose 7%.
The West is selling, the East is buying, and right now the West is winning the tape.
Reclaim $3,600 on a 4H close → the flush is losing steam, $3,674 is the ceiling.
Stay under $3,600 → the flush can keep going, and nothing on this chart marks a floor below today’s $3,549 low.
Long-term buyers may see value building. Short-term, a trend this clean doesn’t reverse on hope.
West keeps selling, or East starts winning?
Not financial advice.
$XAUT
$XAU
$PAXG
1
2
3.5k
·
--
Bearish
See translation
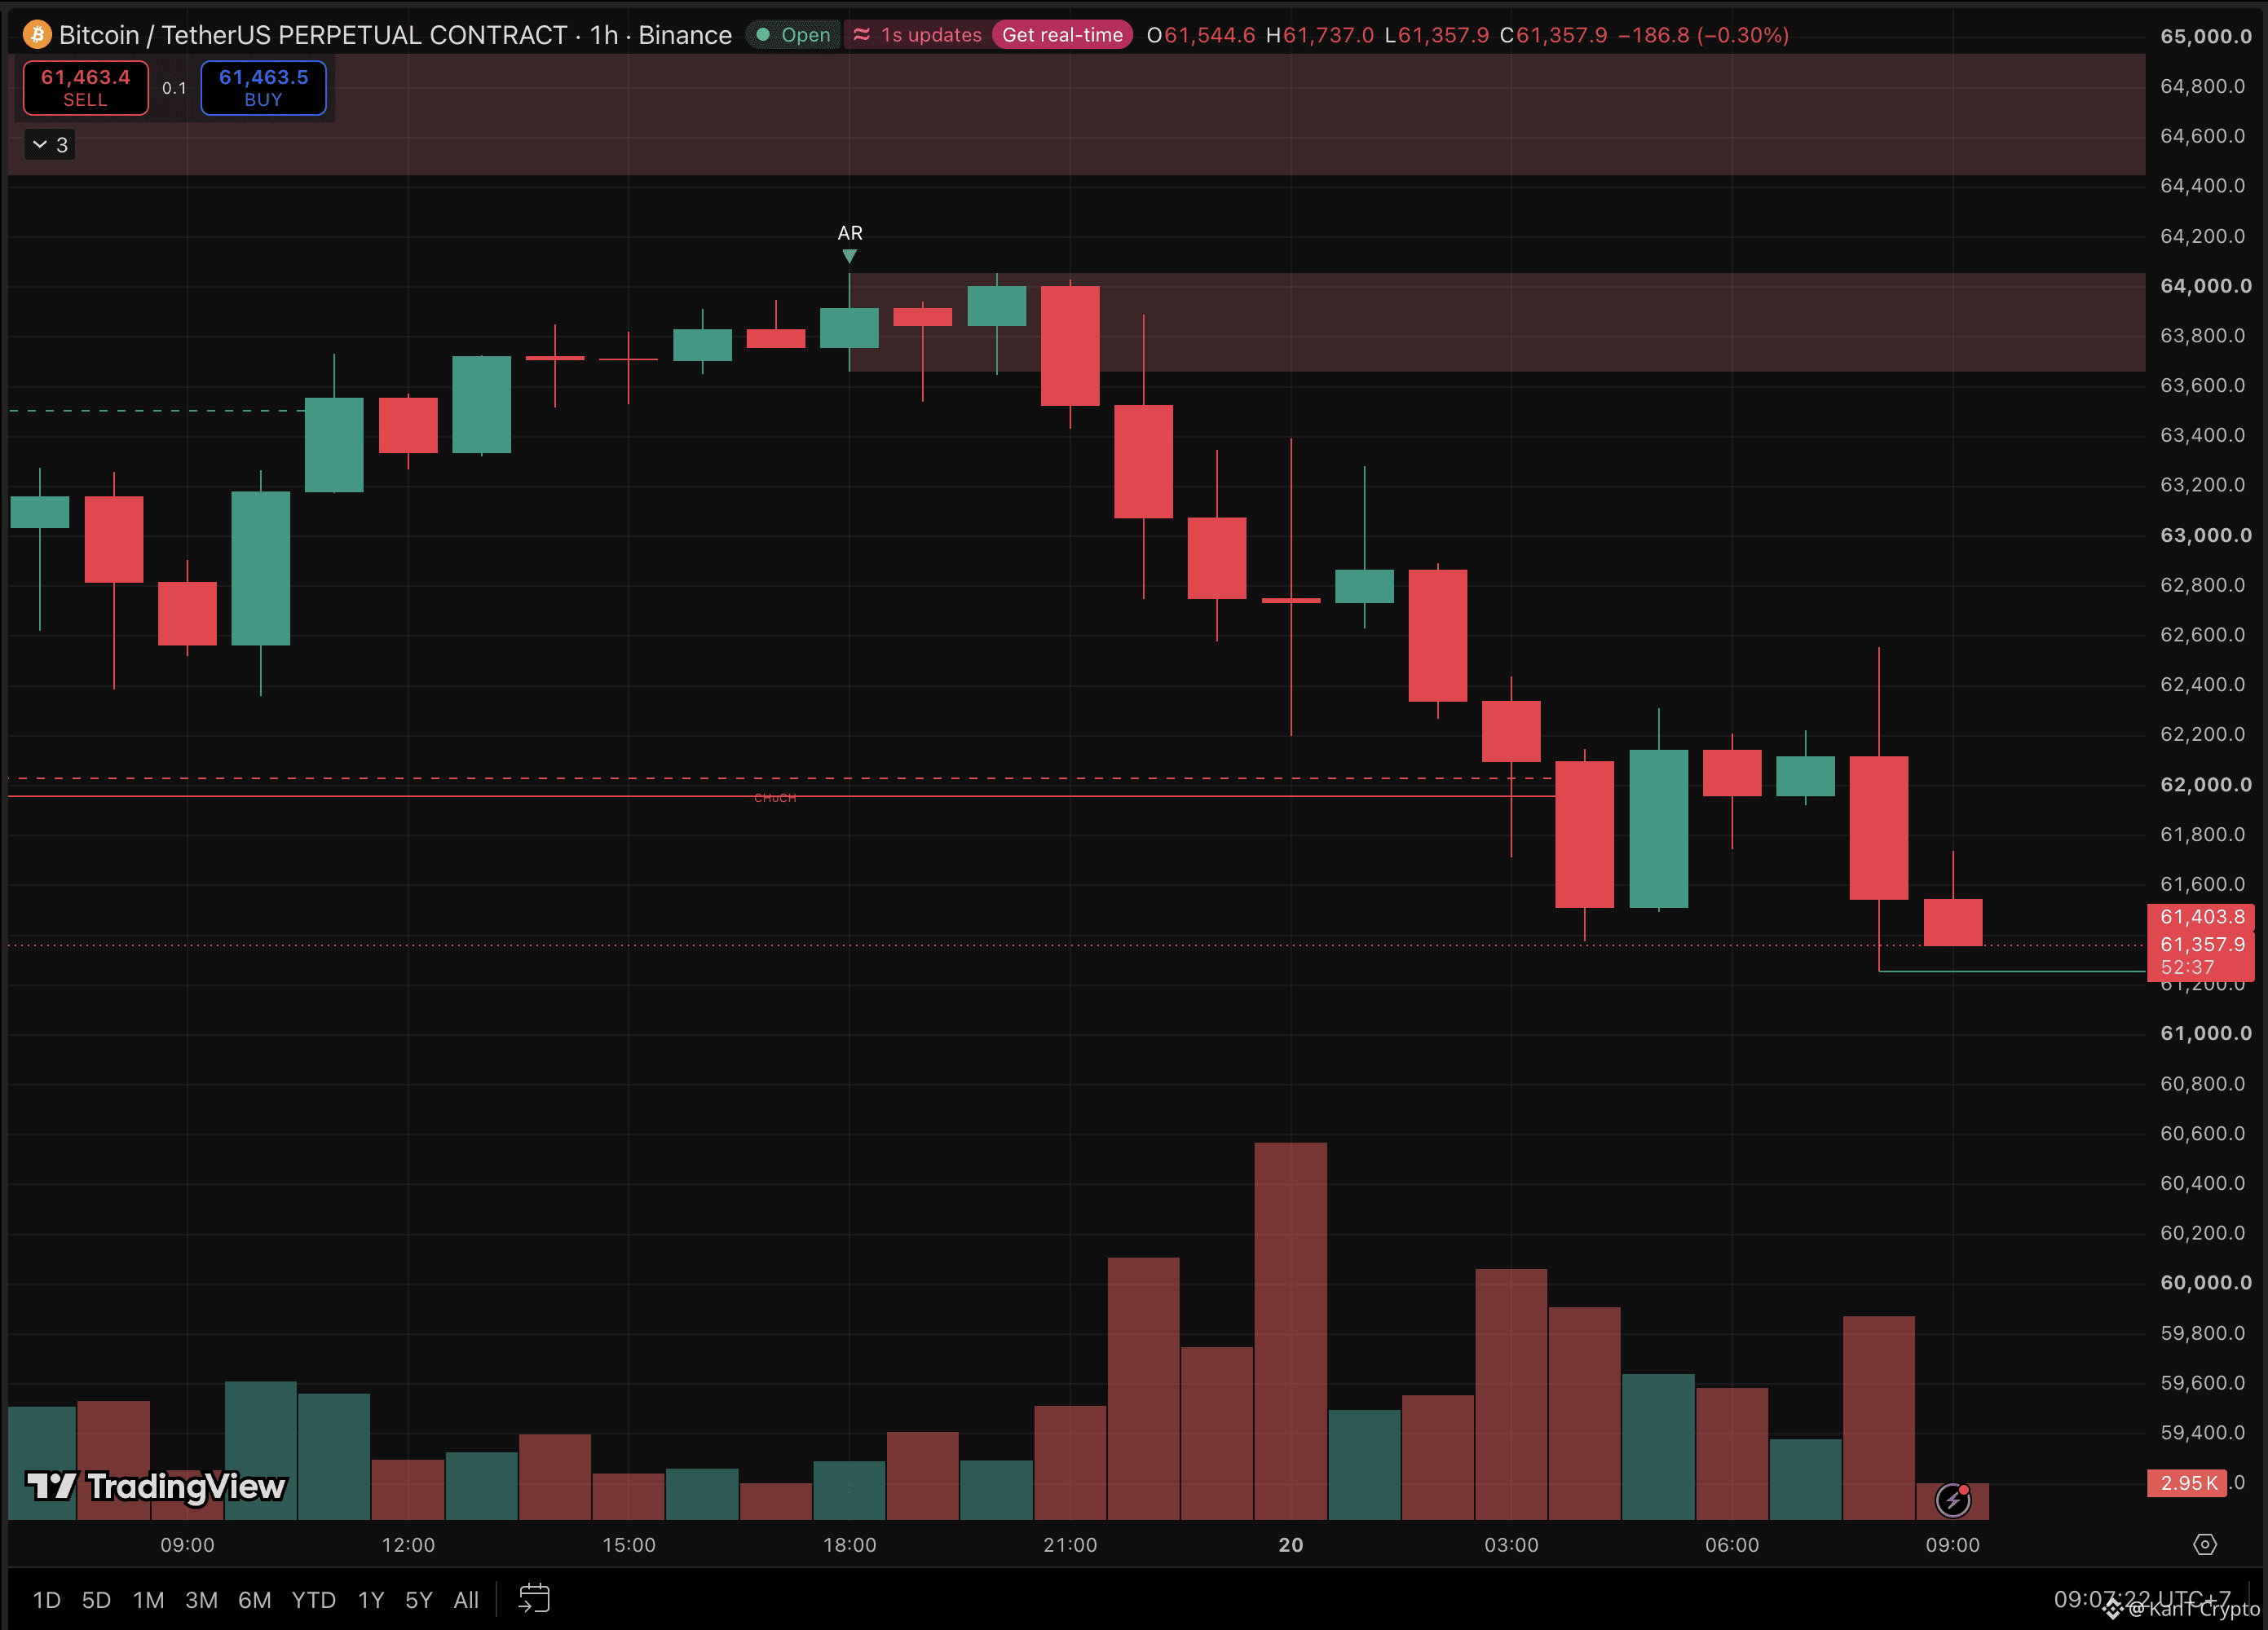
📉 Is Bitcoin about to see a 5 in front of its price again?
It’s 2% away.
Bounce high: ~$64.05K
Floor that just broke: ~$61.95K
New low: ~$61.25K
Now: $61,358
Wednesday’s map: hold $62K and $63.3K then $64.1K are the ceilings.
Bitcoin held, bounced, and tagged $64.05K almost to the dollar.
Then the $63.65K to $64.05K supply zone did its job and sent it straight back down.
This morning the floor gave way.
A CHoCH (the first sign the short-term trend flipped) printed right at $61.95K, the low that had held twice.
Then came the tell: price rallied back up to retest $62K from below, wicked to $62.55K, and got slammed into a fresh low.
Old floor, new ceiling, confirmed in one candle. 👀
Every bounce this month has followed the same script.
Tag supply, fail, make a lower low.
Until that pattern breaks, rallies are exits, not entries.
Reclaim $62K on a 4H close → the breakdown was a fakeout, and $64K is back on the table.
Lose $61.25K → $60K is next, where the most-traded put options sit, and below that the $57.7K cycle low.
Round numbers like $60K attract both panic sellers and bargain hunters, so expect a violent wick, not a clean touch.
Brief visit to the 5s, or a longer stay?
Not financial advice.
$BTC
{future}(BTCUSDT)
$ETH
{future}(ETHUSDT)
$SOL
{future}(SOLUSDT)
📉 Is Bitcoin about to see a 5 in front of its price again?
It’s 2% away.
Bounce high: ~$64.05K
Floor that just broke: ~$61.95K
New low: ~$61.25K
Now: $61,358
Wednesday’s map: hold $62K and $63.3K then $64.1K are the ceilings.
Bitcoin held, bounced, and tagged $64.05K almost to the dollar.
Then the $63.65K to $64.05K supply zone did its job and sent it straight back down.
This morning the floor gave way.
A CHoCH (the first sign the short-term trend flipped) printed right at $61.95K, the low that had held twice.
Then came the tell: price rallied back up to retest $62K from below, wicked to $62.55K, and got slammed into a fresh low.
Old floor, new ceiling, confirmed in one candle. 👀
Every bounce this month has followed the same script.
Tag supply, fail, make a lower low.
Until that pattern breaks, rallies are exits, not entries.
Reclaim $62K on a 4H close → the breakdown was a fakeout, and $64K is back on the table.
Lose $61.25K → $60K is next, where the most-traded put options sit, and below that the $57.7K cycle low.
Round numbers like $60K attract both panic sellers and bargain hunters, so expect a violent wick, not a clean touch.
Brief visit to the 5s, or a longer stay?
Not financial advice.
$BTC
$ETH
$SOL
It’s 2% away.
Bounce high: ~$64.05K
Floor that just broke: ~$61.95K
New low: ~$61.25K
Now: $61,358
Wednesday’s map: hold $62K and $63.3K then $64.1K are the ceilings.
Bitcoin held, bounced, and tagged $64.05K almost to the dollar.
Then the $63.65K to $64.05K supply zone did its job and sent it straight back down.
This morning the floor gave way.
A CHoCH (the first sign the short-term trend flipped) printed right at $61.95K, the low that had held twice.
Then came the tell: price rallied back up to retest $62K from below, wicked to $62.55K, and got slammed into a fresh low.
Old floor, new ceiling, confirmed in one candle. 👀
Every bounce this month has followed the same script.
Tag supply, fail, make a lower low.
Until that pattern breaks, rallies are exits, not entries.
Reclaim $62K on a 4H close → the breakdown was a fakeout, and $64K is back on the table.
Lose $61.25K → $60K is next, where the most-traded put options sit, and below that the $57.7K cycle low.
Round numbers like $60K attract both panic sellers and bargain hunters, so expect a violent wick, not a clean touch.
Brief visit to the 5s, or a longer stay?
Not financial advice.
$BTC
$ETH
$SOL
1
878
·
--
Bearish
Verified
See translation
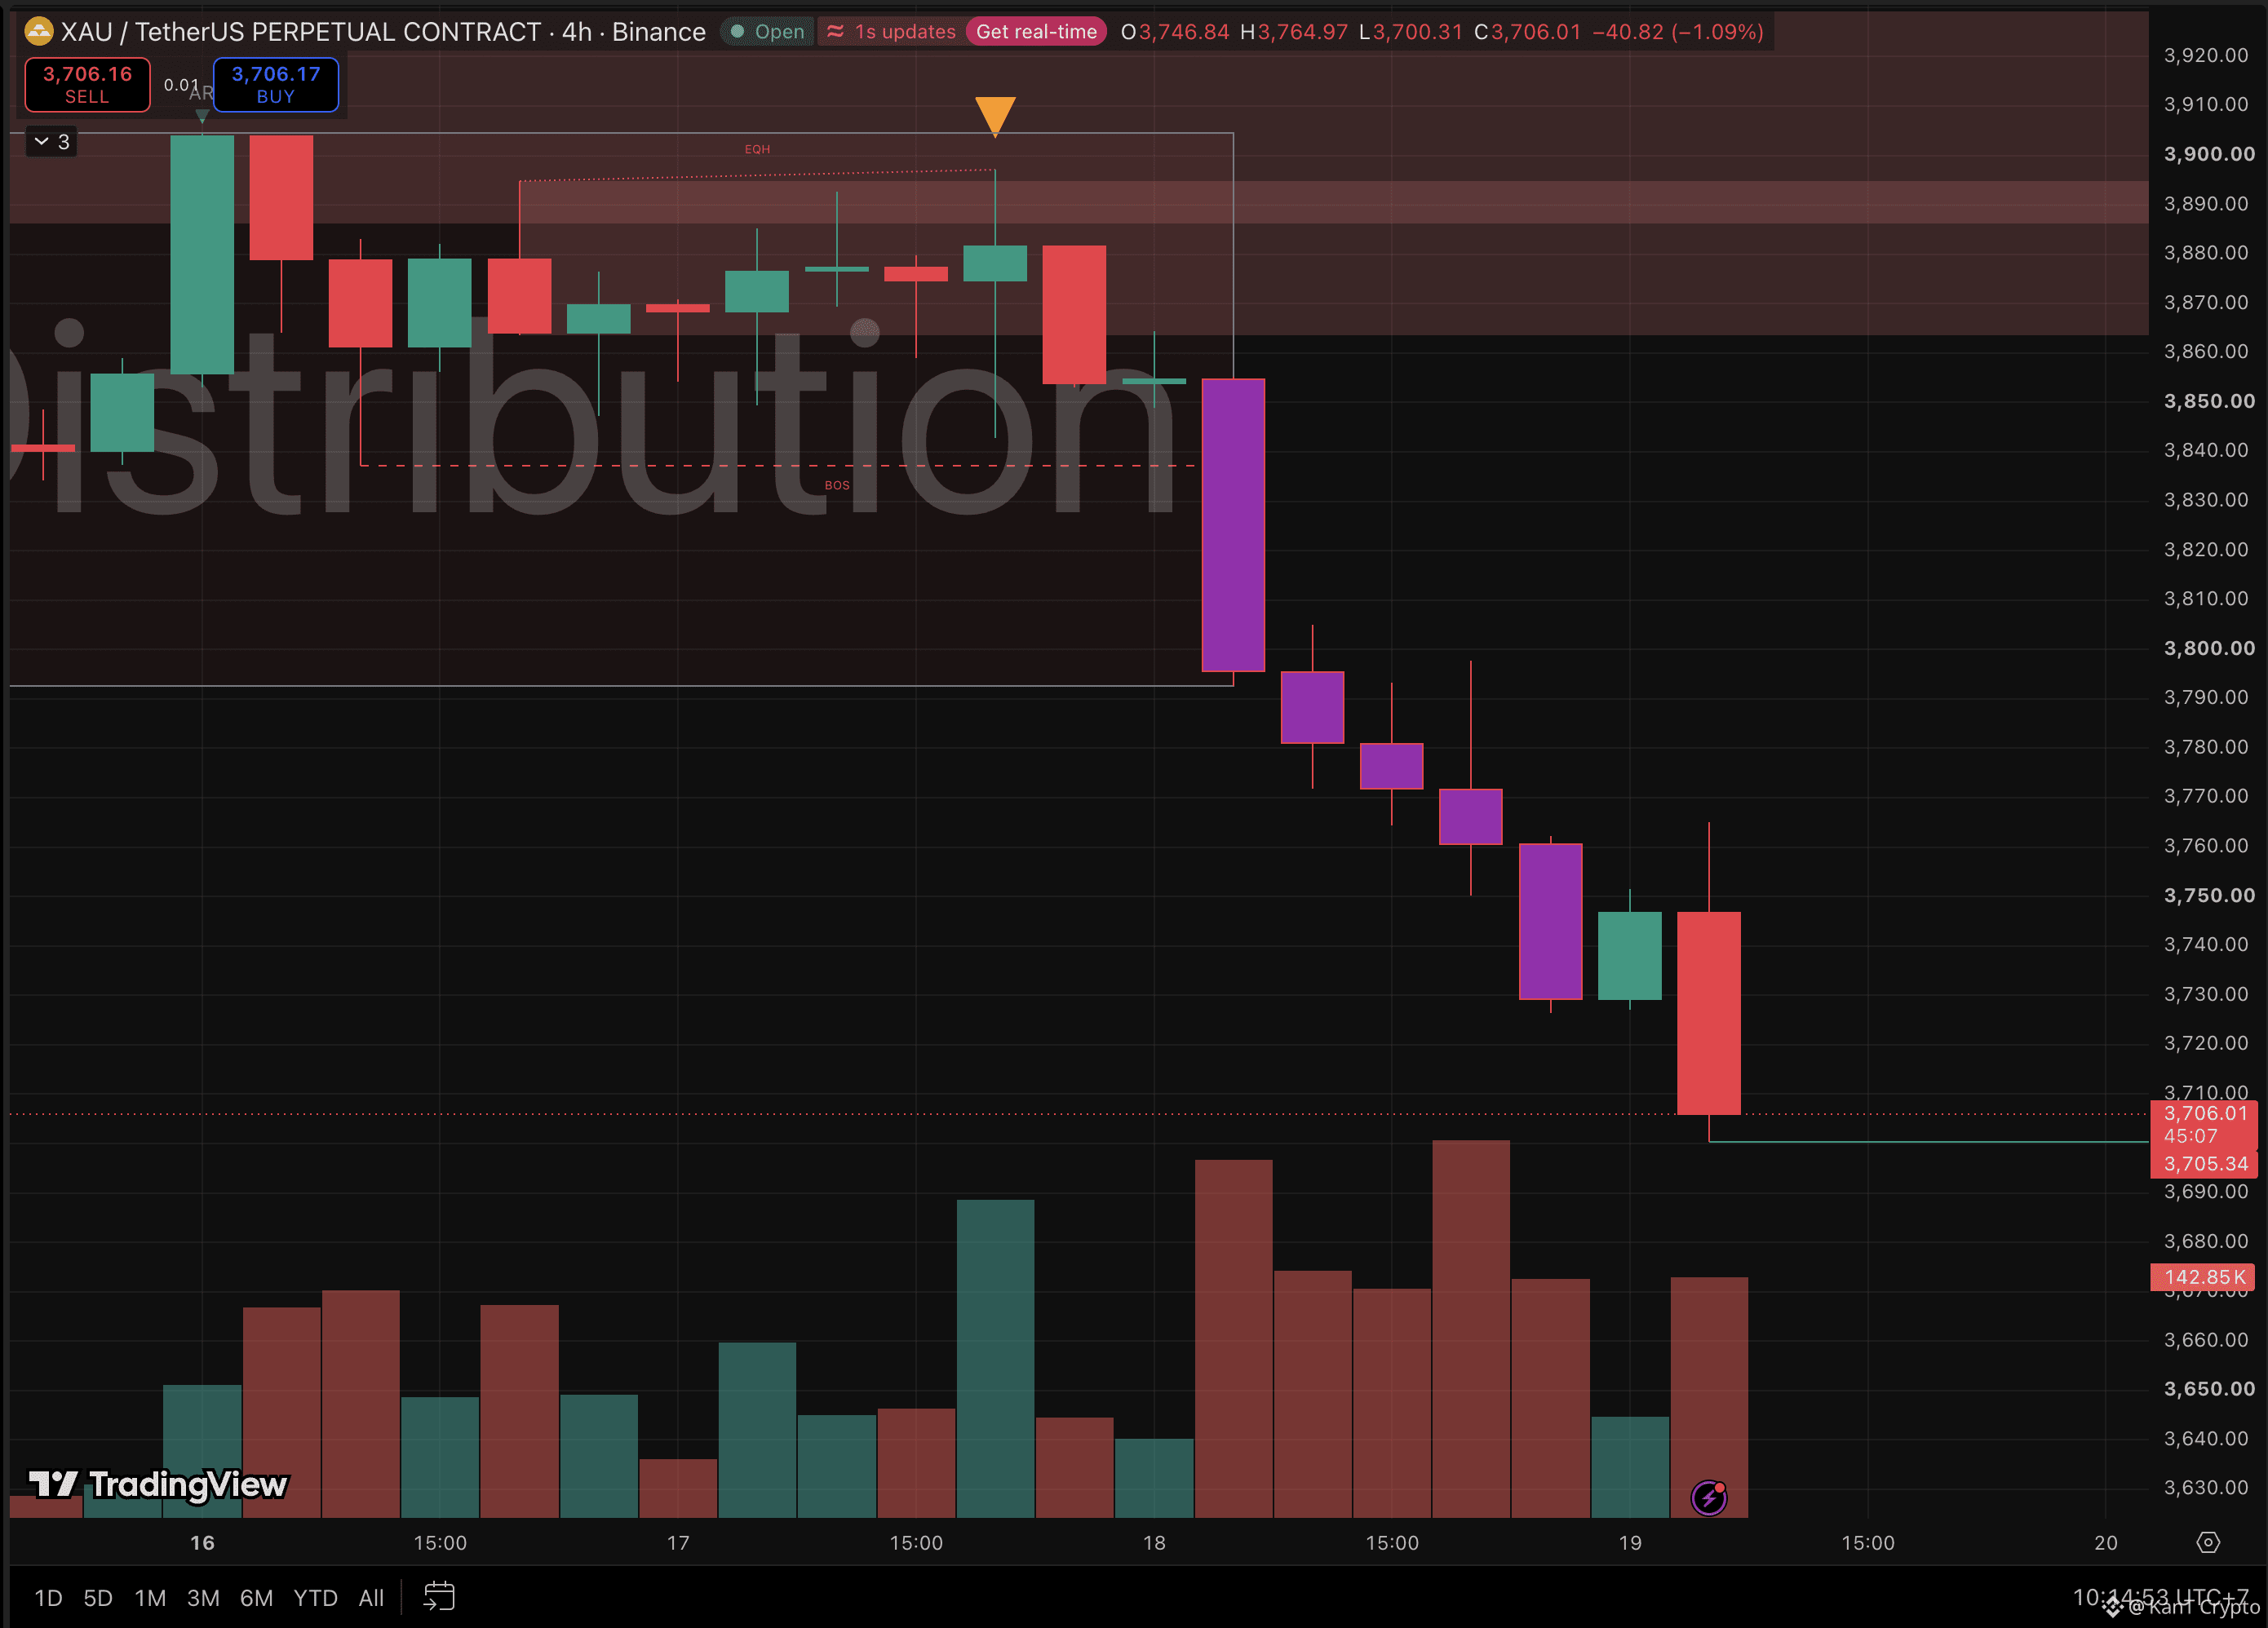
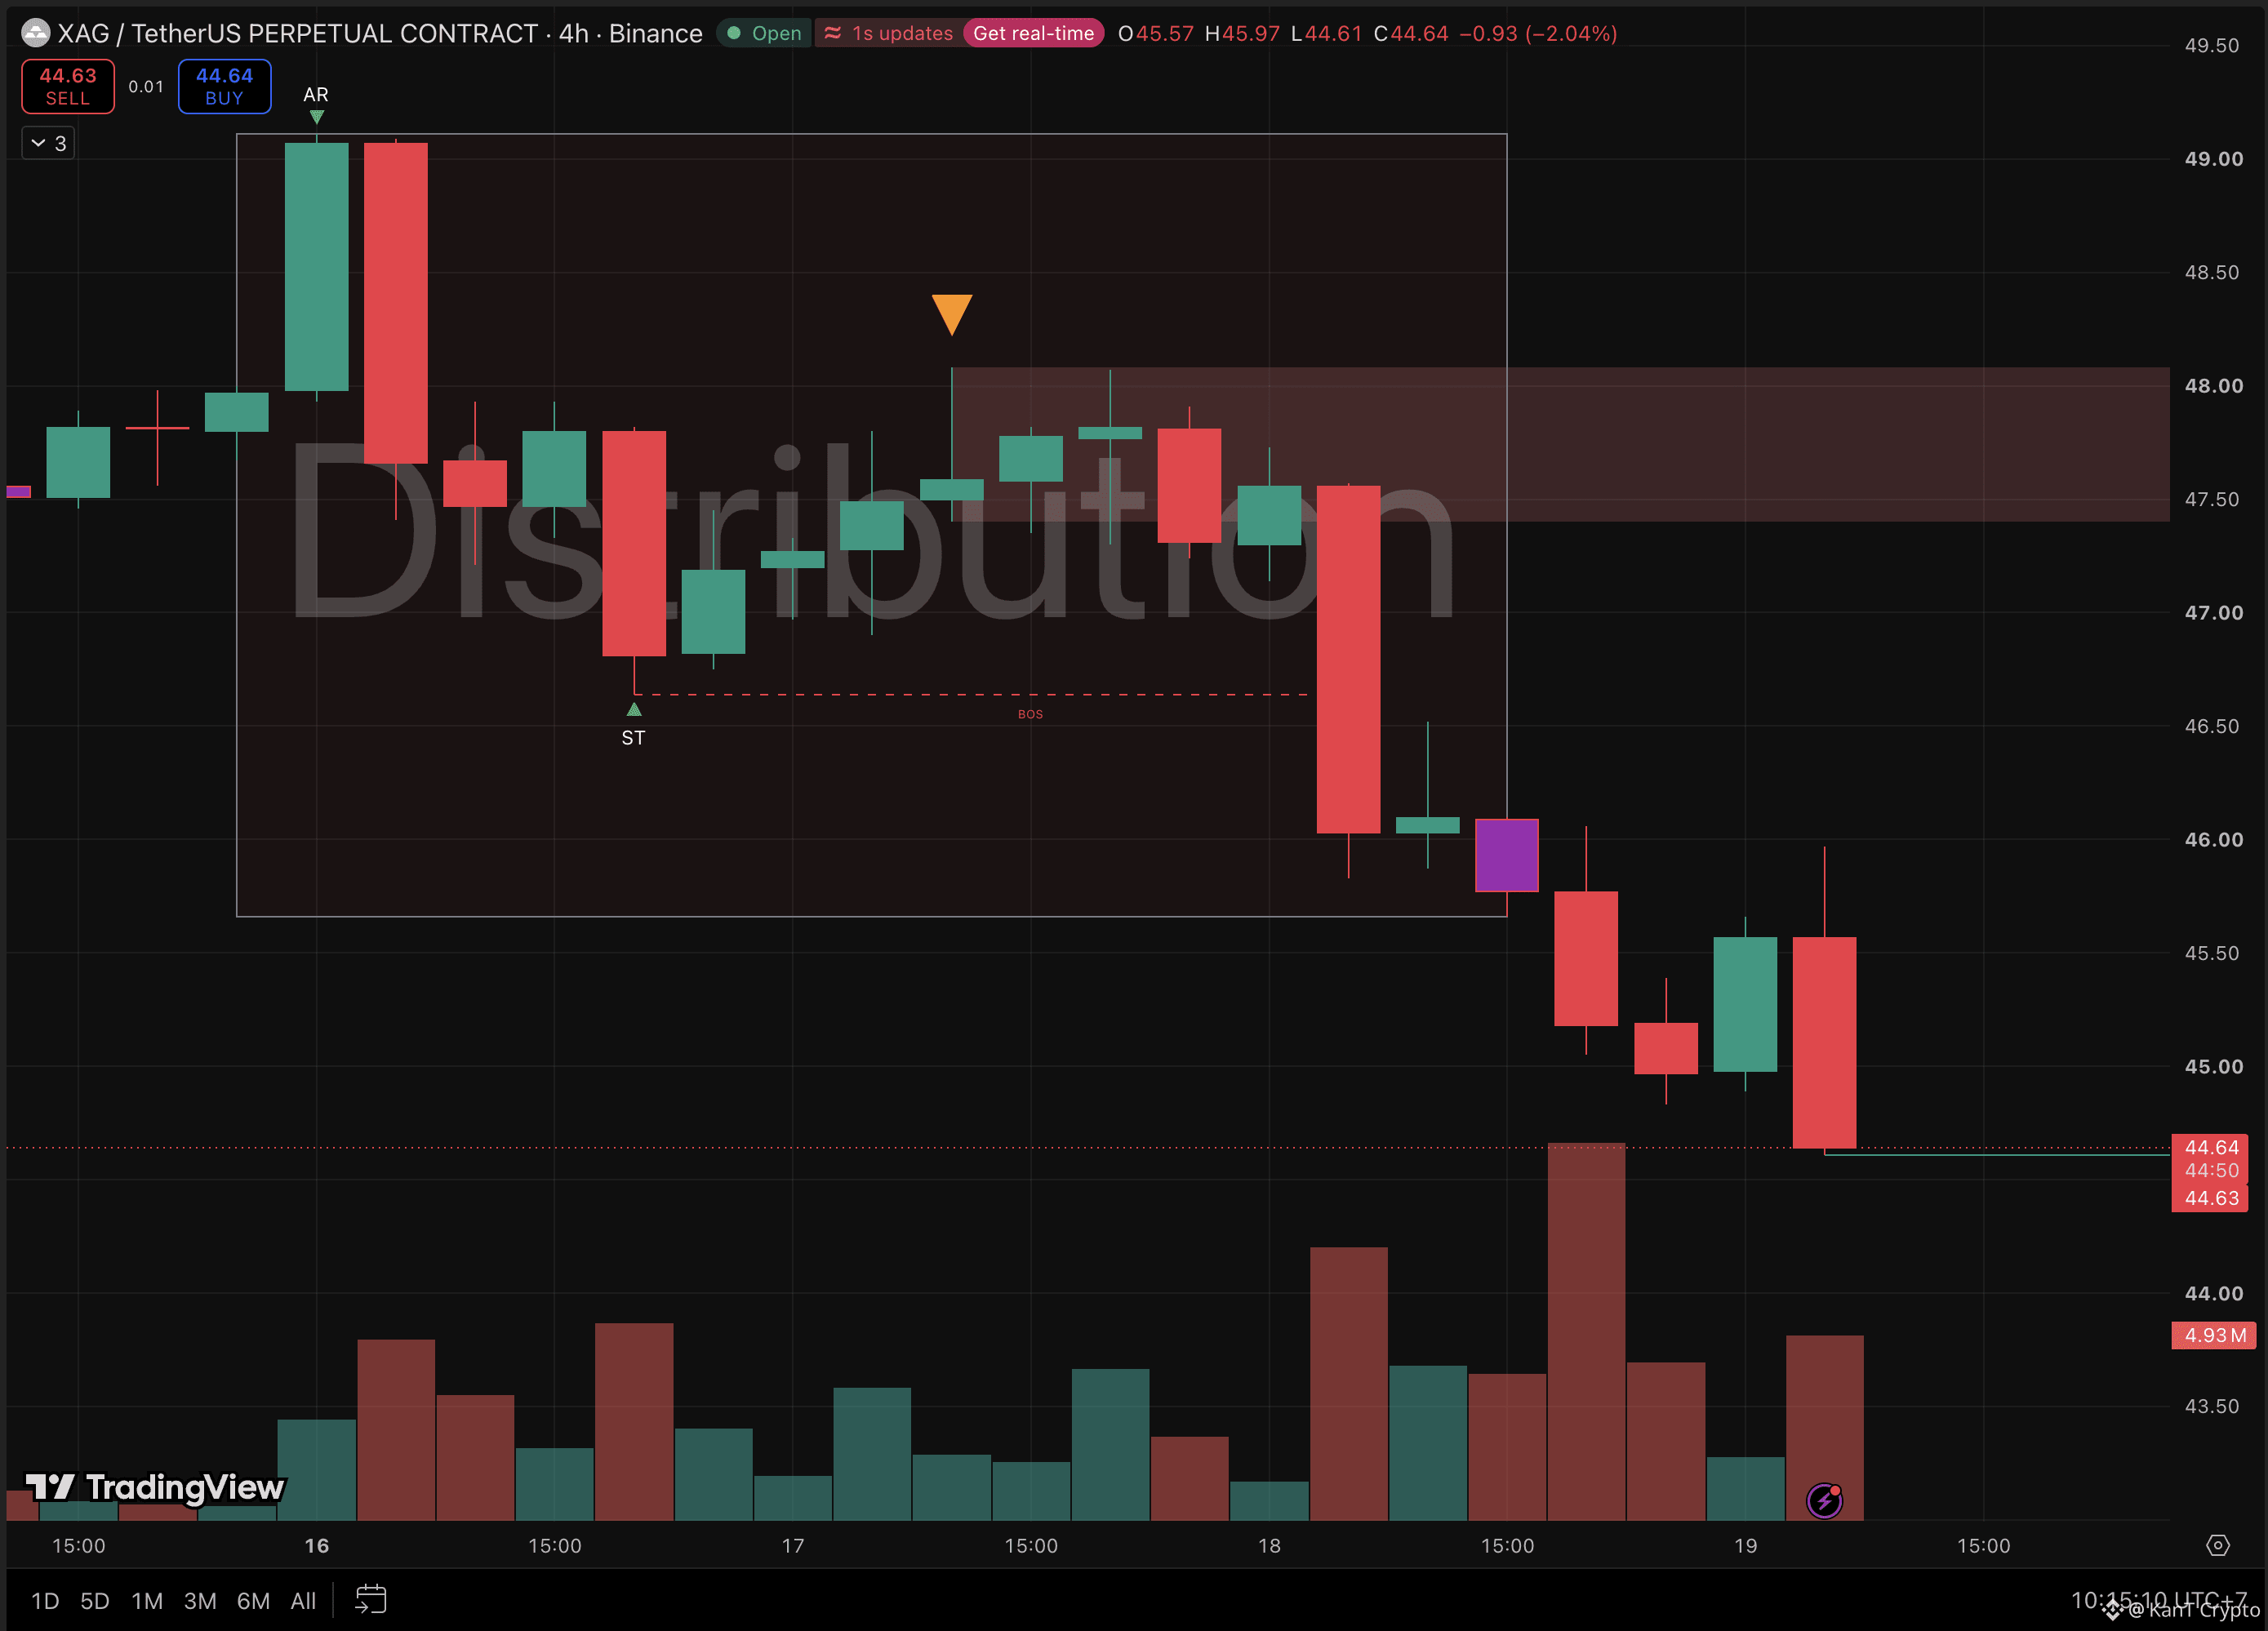
🚨 BREAKING: 🇺🇸 Over $400 BILLION just vanished from gold and silver in about 90 minutes.
Gold: ~$3,754 to ~$3,705, its lowest since September 2025
Silver: ~$45.85 to ~$44.70
Barely a green candle on the way down.
That $400B is paper value, price times every ounce above ground. But the move behind it is very real.
The trigger was the Fed’s own minutes.
Nearly all policymakers expect a December hike.
Some wanted to hike in October already.
Two floated a 50 basis point move (double the usual size).
Futures now price about 95% odds for December, plus more tightening in early 2027.
The dollar index pushed toward 103.8, its highest since April 2025.
For metals that pay nothing, a hawkish Fed and a strong dollar is the worst combo there is.
Yesterday’s map said a daily close under $3,780 keeps the staircase going.
It kept going, straight through $3,750 and Wednesday’s $3,719 low. 📉
Silver is falling harder than gold, often a sign leveraged positions are being forced out, not just hedges trimmed.
What to watch:
Gold reclaims $3,719 to $3,750 → a flush, not a collapse.
Gold loses $3,650 → the next leg opens.
Silver back above $45 → buyers stepping in.
Silver under $44 → the forced selling isn’t done.
Catching a falling metal the day the Fed turns this hawkish is a bet against the trend. Let it base first.
Capitulation flush, or the start of a deeper reset?
Not financial advice.
$XAU
{future}(XAUUSDT)
$XAG
{future}(XAGUSDT)
$PAXG
{future}(PAXGUSDT)
🚨 BREAKING: 🇺🇸 Over $400 BILLION just vanished from gold and silver in about 90 minutes.
Gold: ~$3,754 to ~$3,705, its lowest since September 2025
Silver: ~$45.85 to ~$44.70
Barely a green candle on the way down.
That $400B is paper value, price times every ounce above ground. But the move behind it is very real.
The trigger was the Fed’s own minutes.
Nearly all policymakers expect a December hike.
Some wanted to hike in October already.
Two floated a 50 basis point move (double the usual size).
Futures now price about 95% odds for December, plus more tightening in early 2027.
The dollar index pushed toward 103.8, its highest since April 2025.
For metals that pay nothing, a hawkish Fed and a strong dollar is the worst combo there is.
Yesterday’s map said a daily close under $3,780 keeps the staircase going.
It kept going, straight through $3,750 and Wednesday’s $3,719 low. 📉
Silver is falling harder than gold, often a sign leveraged positions are being forced out, not just hedges trimmed.
What to watch:
Gold reclaims $3,719 to $3,750 → a flush, not a collapse.
Gold loses $3,650 → the next leg opens.
Silver back above $45 → buyers stepping in.
Silver under $44 → the forced selling isn’t done.
Catching a falling metal the day the Fed turns this hawkish is a bet against the trend. Let it base first.
Capitulation flush, or the start of a deeper reset?
Not financial advice.
$XAU
$XAG
$PAXG
Gold: ~$3,754 to ~$3,705, its lowest since September 2025
Silver: ~$45.85 to ~$44.70
Barely a green candle on the way down.
That $400B is paper value, price times every ounce above ground. But the move behind it is very real.
The trigger was the Fed’s own minutes.
Nearly all policymakers expect a December hike.
Some wanted to hike in October already.
Two floated a 50 basis point move (double the usual size).
Futures now price about 95% odds for December, plus more tightening in early 2027.
The dollar index pushed toward 103.8, its highest since April 2025.
For metals that pay nothing, a hawkish Fed and a strong dollar is the worst combo there is.
Yesterday’s map said a daily close under $3,780 keeps the staircase going.
It kept going, straight through $3,750 and Wednesday’s $3,719 low. 📉
Silver is falling harder than gold, often a sign leveraged positions are being forced out, not just hedges trimmed.
What to watch:
Gold reclaims $3,719 to $3,750 → a flush, not a collapse.
Gold loses $3,650 → the next leg opens.
Silver back above $45 → buyers stepping in.
Silver under $44 → the forced selling isn’t done.
Catching a falling metal the day the Fed turns this hawkish is a bet against the trend. Let it base first.
Capitulation flush, or the start of a deeper reset?
Not financial advice.
$XAU
$XAG
$PAXG
1
3.4k
·
--
Bullish
See translation
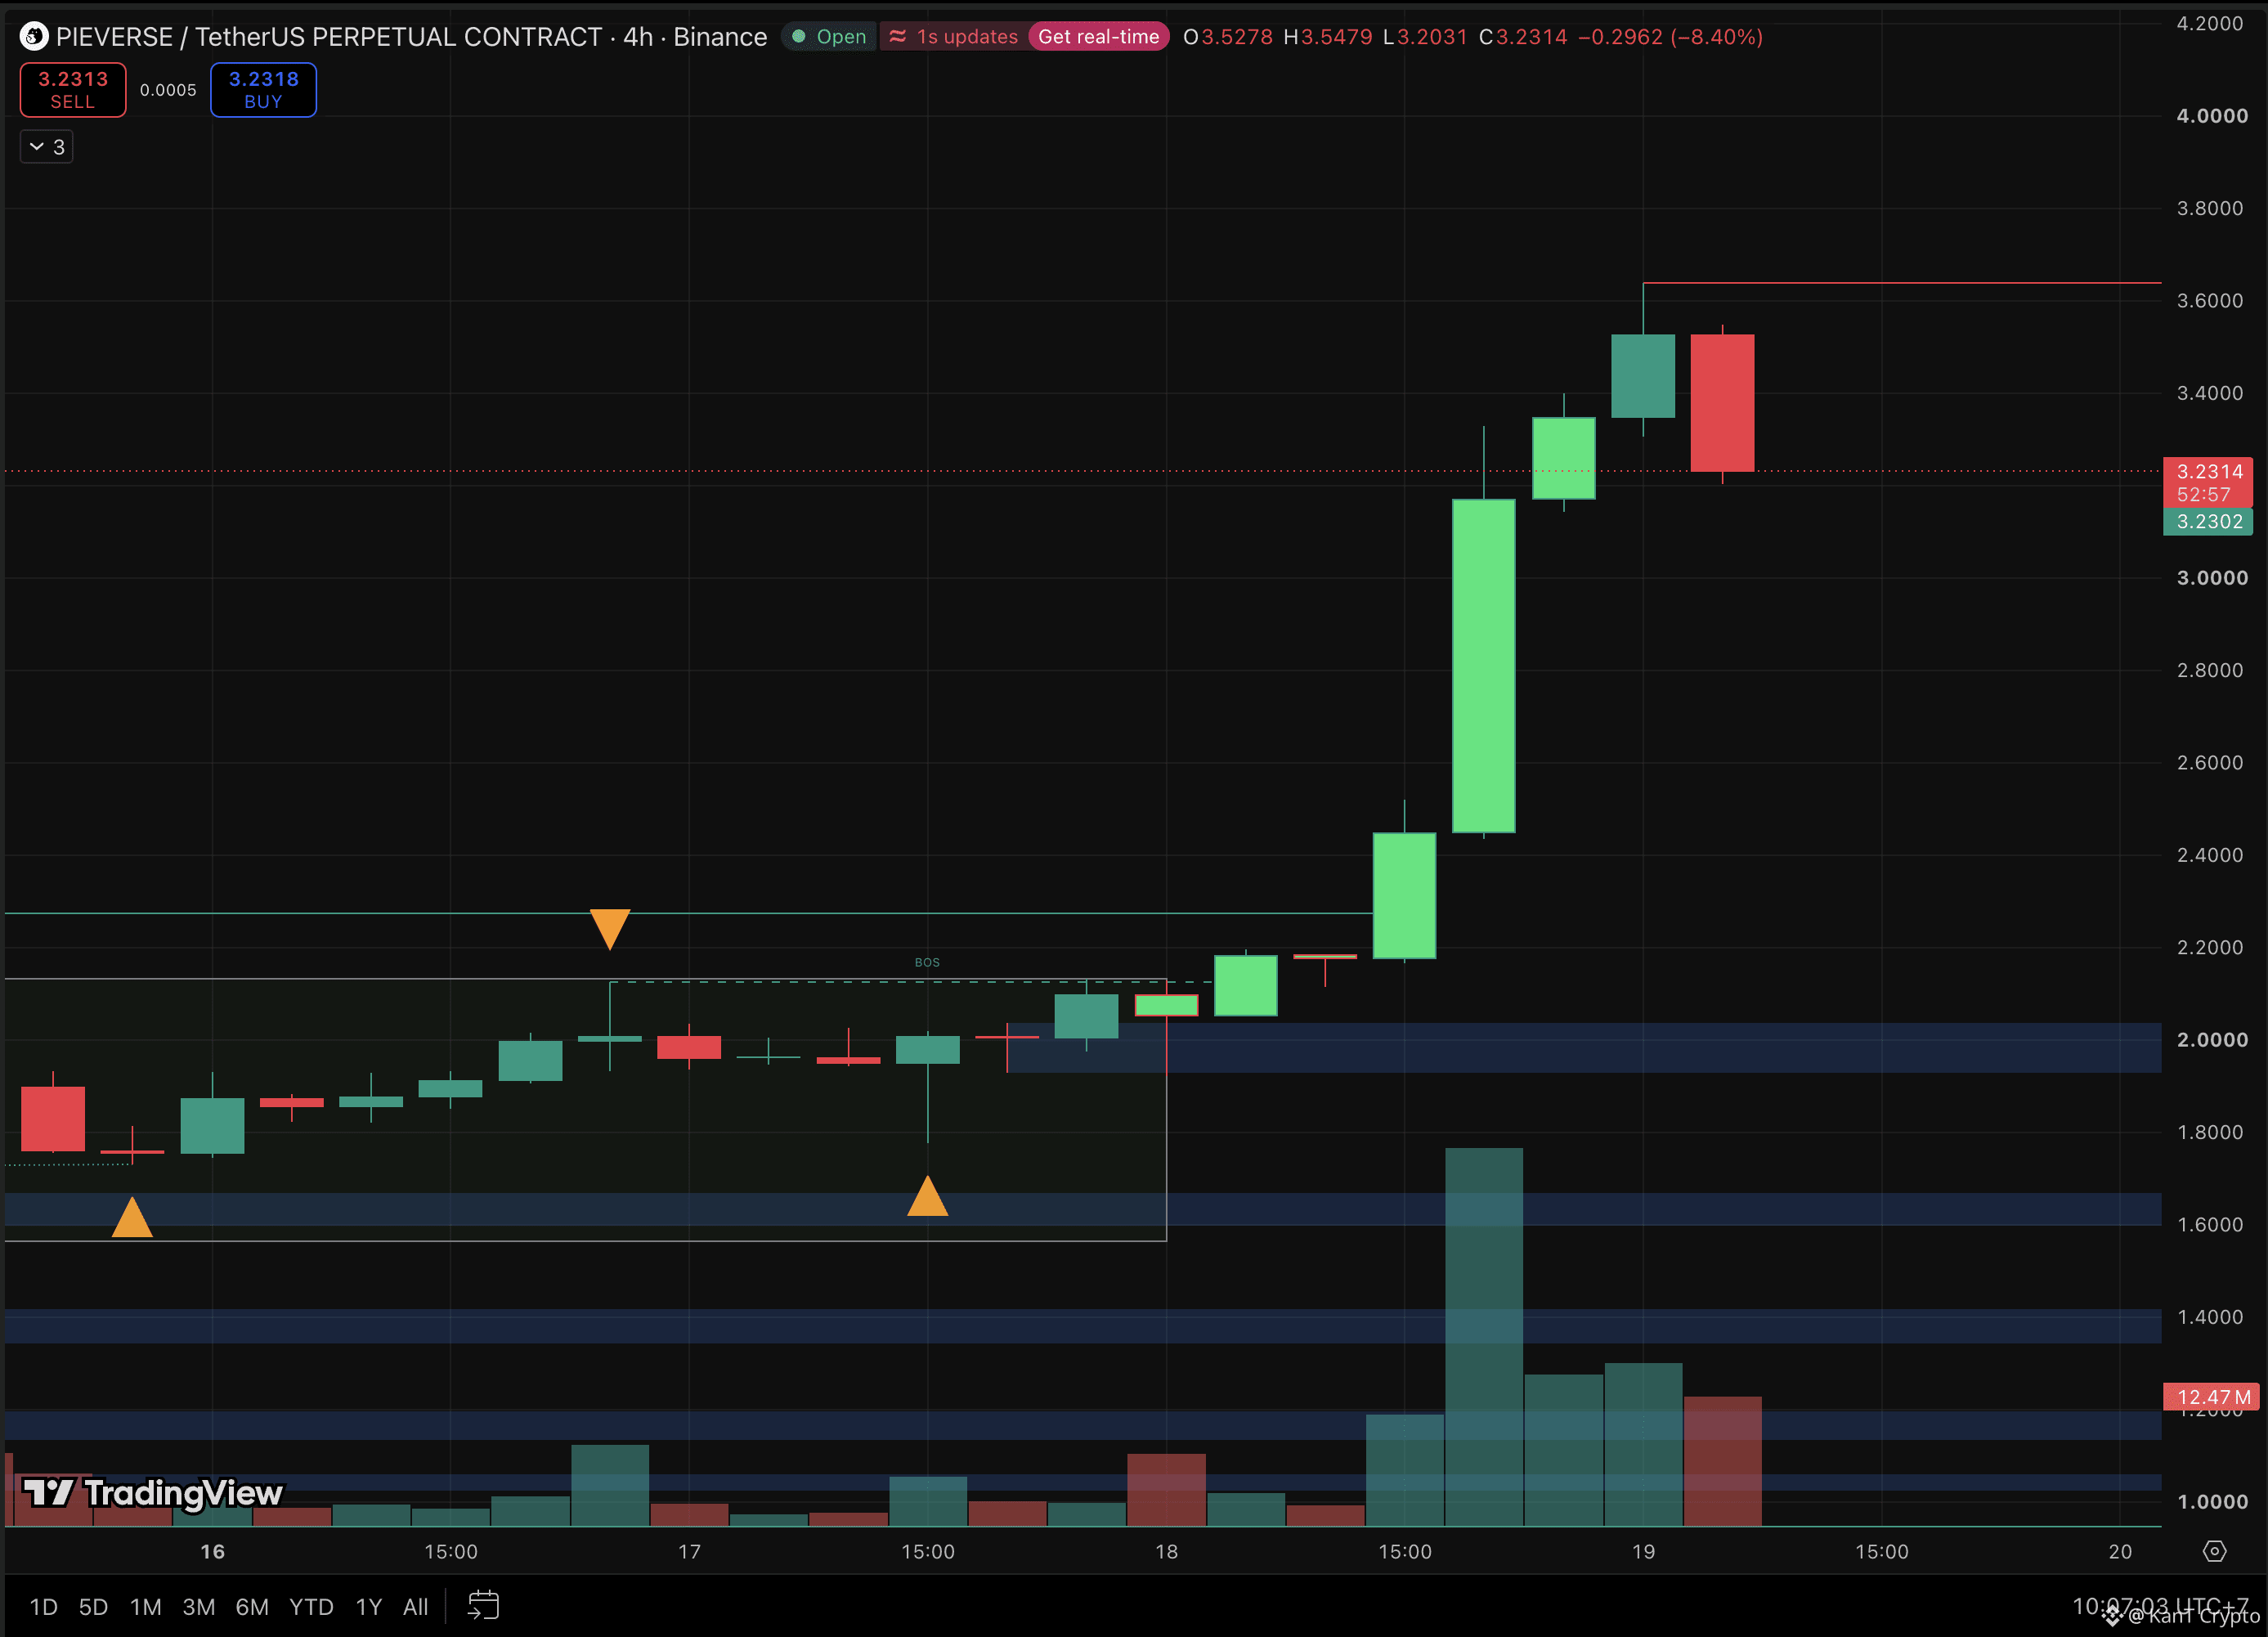
📉 PIEVERSE sprinted 70% in a day. Now it’s bent over, catching its breath at $3.23.
Breakout level: ~$2.13
Peak: ~$3.64
Now: $3.23, -8.4% on the 4H
Biggest candle: $2.45 to $3.17 in four hours, +29%
The run started properly.
Three days of accumulation (quiet buying in a flat range) between ~$1.78 and $2.13.
A BOS (break of structure) through $2.13.
Then the 29% candle on the heaviest volume of the whole chart.
But look at the top.
The green candles after the breakout came on far less volume than the breakout itself.
The last push left a wick at $3.64, meaning sellers were waiting up there.
And this 4H candle is shaping up as a bearish engulfing: its red body swallows the entire previous green one.
Buyers got slower, sellers got louder. 👀
The tricky part?
That 29% candle crossed $2.45 to $3.17 so fast it left almost no support in between.
Price is now sitting right on its top at ~$3.17.
Hold $3.17 → this is just a pause, and a reclaim of $3.52 brings $3.64 back.
Lose $3.17 on a 4H close → the air pocket opens, and $2.45 is the next real floor, with $2.13 below.
Buying a fresh red engulfing after a 70% day is a fast way to become someone’s exit. Let the next close show who’s in control.
Just a breather, or the top already in?
Not financial advice.
$PIEVERSE
{future}(PIEVERSEUSDT)
$MMT
{future}(MMTUSDT)
$EVAA
{future}(EVAAUSDT)
📉 PIEVERSE sprinted 70% in a day. Now it’s bent over, catching its breath at $3.23.
Breakout level: ~$2.13
Peak: ~$3.64
Now: $3.23, -8.4% on the 4H
Biggest candle: $2.45 to $3.17 in four hours, +29%
The run started properly.
Three days of accumulation (quiet buying in a flat range) between ~$1.78 and $2.13.
A BOS (break of structure) through $2.13.
Then the 29% candle on the heaviest volume of the whole chart.
But look at the top.
The green candles after the breakout came on far less volume than the breakout itself.
The last push left a wick at $3.64, meaning sellers were waiting up there.
And this 4H candle is shaping up as a bearish engulfing: its red body swallows the entire previous green one.
Buyers got slower, sellers got louder. 👀
The tricky part?
That 29% candle crossed $2.45 to $3.17 so fast it left almost no support in between.
Price is now sitting right on its top at ~$3.17.
Hold $3.17 → this is just a pause, and a reclaim of $3.52 brings $3.64 back.
Lose $3.17 on a 4H close → the air pocket opens, and $2.45 is the next real floor, with $2.13 below.
Buying a fresh red engulfing after a 70% day is a fast way to become someone’s exit. Let the next close show who’s in control.
Just a breather, or the top already in?
Not financial advice.
$PIEVERSE
$MMT
$EVAA
Breakout level: ~$2.13
Peak: ~$3.64
Now: $3.23, -8.4% on the 4H
Biggest candle: $2.45 to $3.17 in four hours, +29%
The run started properly.
Three days of accumulation (quiet buying in a flat range) between ~$1.78 and $2.13.
A BOS (break of structure) through $2.13.
Then the 29% candle on the heaviest volume of the whole chart.
But look at the top.
The green candles after the breakout came on far less volume than the breakout itself.
The last push left a wick at $3.64, meaning sellers were waiting up there.
And this 4H candle is shaping up as a bearish engulfing: its red body swallows the entire previous green one.
Buyers got slower, sellers got louder. 👀
The tricky part?
That 29% candle crossed $2.45 to $3.17 so fast it left almost no support in between.
Price is now sitting right on its top at ~$3.17.
Hold $3.17 → this is just a pause, and a reclaim of $3.52 brings $3.64 back.
Lose $3.17 on a 4H close → the air pocket opens, and $2.45 is the next real floor, with $2.13 below.
Buying a fresh red engulfing after a 70% day is a fast way to become someone’s exit. Let the next close show who’s in control.
Just a breather, or the top already in?
Not financial advice.
$PIEVERSE
$MMT
$EVAA
1
2.3k
·
--
Bullish
See translation
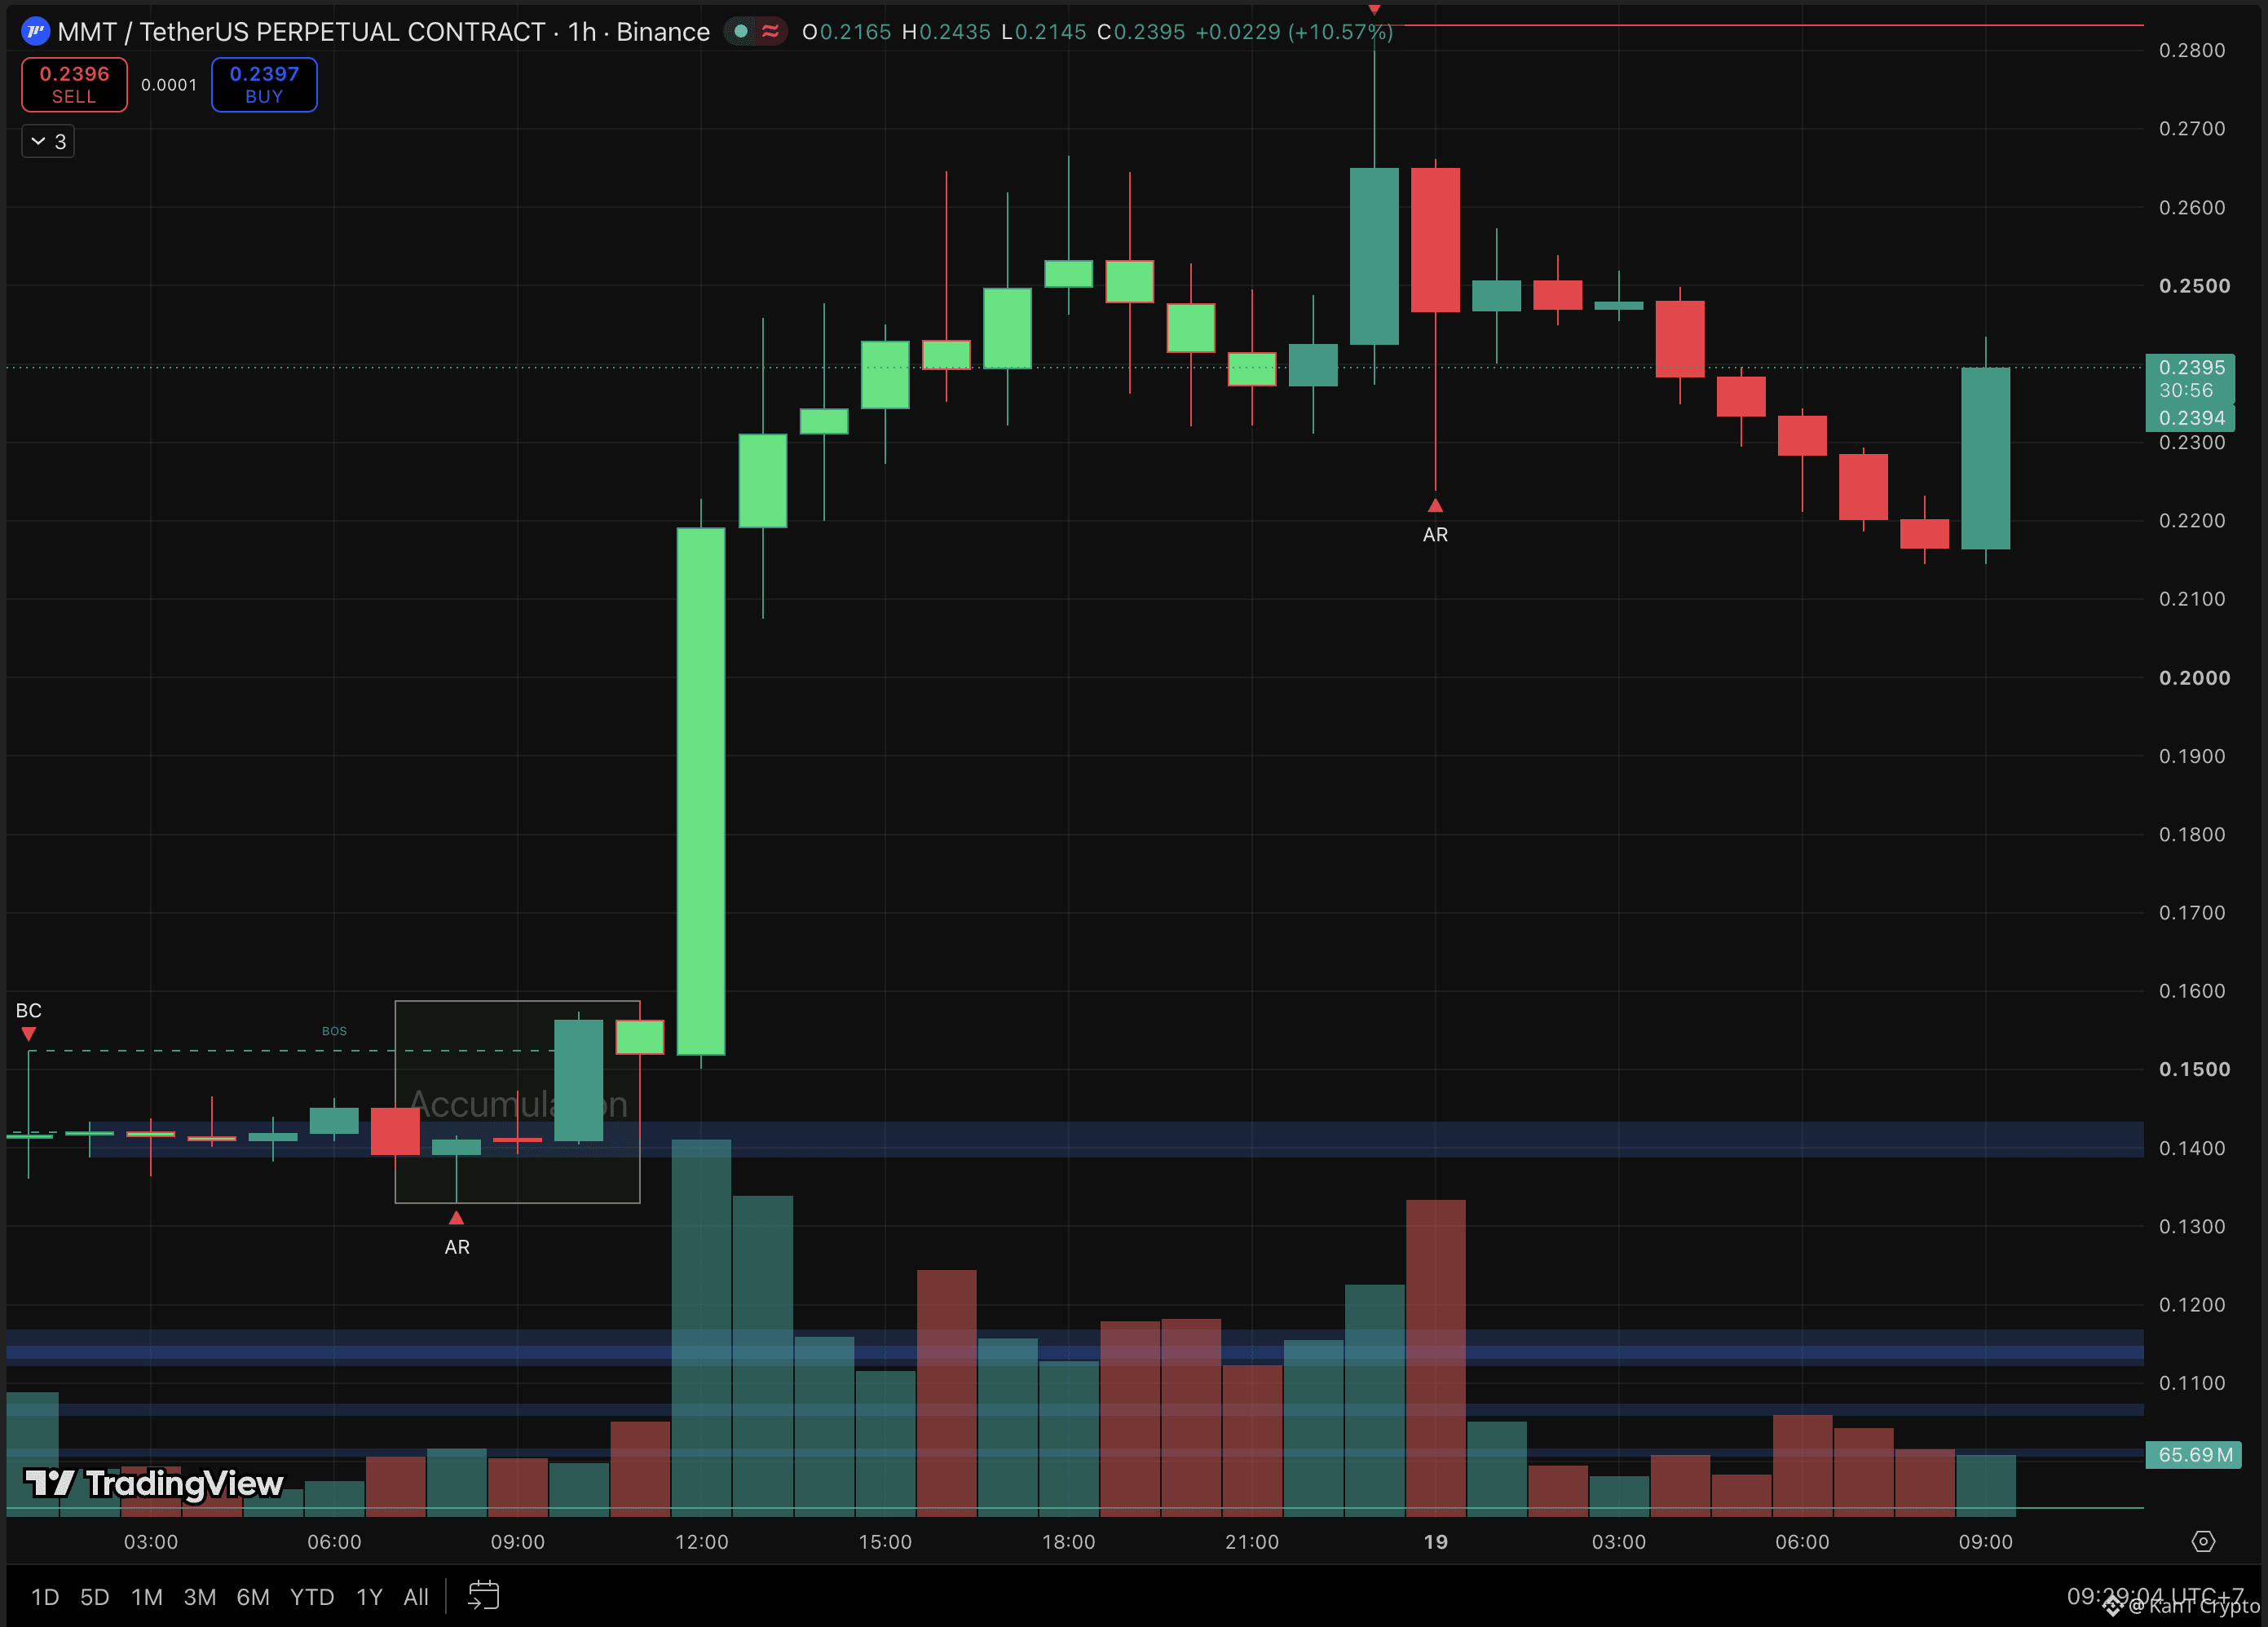
📈 MMT got knocked down 24% overnight. It just answered with a +10% candle.
Spike high: ~$0.2835
Overnight low: ~$0.2145
Now: $0.2395, +10.6% on the hour
Two days ago: ~$0.112
Yesterday’s map said a 4H close above $0.2458 keeps the staircase going.
It closed above, then wicked all the way to $0.2835.
Then the hangover.
That spike looks like a buying climax: late buyers piling in at the top while early holders sell into them.
The automatic reaction (the first sharp drop after a climax) hit $0.2238 within the hour.
After that came seven hours of lower highs, sliding to $0.2145 and slipping under that reaction low.
And then this candle.
It erased four red hours in one and pushed back above $0.2238.
A dip under a key low that snaps straight back is a classic shakeout, built to flush weak longs before the next push.
Volume on the bounce is decent, not explosive. 👀
So MMT has a range now: $0.2145 to $0.2835.
The middle, around $0.25, is where it chopped all of yesterday evening, and that’s the first real test.
Reclaim $0.25 on a 4H close → the shakeout worked, and $0.265 then $0.2835 come back.
Lose $0.2145 → the shakeout failed, $0.2075 is next, and the $0.159 box sits far below.
After a 2x run, every bounce gets sold by someone taking profit. Let $0.25 decide before chasing.
Shakeout before the next leg, or a bounce inside a topping range?
Not financial advice.
$MMT
{future}(MMTUSDT)
$PIPPIN
{future}(PIPPINUSDT)
$EVAA
{future}(EVAAUSDT)
📈 MMT got knocked down 24% overnight. It just answered with a +10% candle.
Spike high: ~$0.2835
Overnight low: ~$0.2145
Now: $0.2395, +10.6% on the hour
Two days ago: ~$0.112
Yesterday’s map said a 4H close above $0.2458 keeps the staircase going.
It closed above, then wicked all the way to $0.2835.
Then the hangover.
That spike looks like a buying climax: late buyers piling in at the top while early holders sell into them.
The automatic reaction (the first sharp drop after a climax) hit $0.2238 within the hour.
After that came seven hours of lower highs, sliding to $0.2145 and slipping under that reaction low.
And then this candle.
It erased four red hours in one and pushed back above $0.2238.
A dip under a key low that snaps straight back is a classic shakeout, built to flush weak longs before the next push.
Volume on the bounce is decent, not explosive. 👀
So MMT has a range now: $0.2145 to $0.2835.
The middle, around $0.25, is where it chopped all of yesterday evening, and that’s the first real test.
Reclaim $0.25 on a 4H close → the shakeout worked, and $0.265 then $0.2835 come back.
Lose $0.2145 → the shakeout failed, $0.2075 is next, and the $0.159 box sits far below.
After a 2x run, every bounce gets sold by someone taking profit. Let $0.25 decide before chasing.
Shakeout before the next leg, or a bounce inside a topping range?
Not financial advice.
$MMT
$PIPPIN
$EVAA
Spike high: ~$0.2835
Overnight low: ~$0.2145
Now: $0.2395, +10.6% on the hour
Two days ago: ~$0.112
Yesterday’s map said a 4H close above $0.2458 keeps the staircase going.
It closed above, then wicked all the way to $0.2835.
Then the hangover.
That spike looks like a buying climax: late buyers piling in at the top while early holders sell into them.
The automatic reaction (the first sharp drop after a climax) hit $0.2238 within the hour.
After that came seven hours of lower highs, sliding to $0.2145 and slipping under that reaction low.
And then this candle.
It erased four red hours in one and pushed back above $0.2238.
A dip under a key low that snaps straight back is a classic shakeout, built to flush weak longs before the next push.
Volume on the bounce is decent, not explosive. 👀
So MMT has a range now: $0.2145 to $0.2835.
The middle, around $0.25, is where it chopped all of yesterday evening, and that’s the first real test.
Reclaim $0.25 on a 4H close → the shakeout worked, and $0.265 then $0.2835 come back.
Lose $0.2145 → the shakeout failed, $0.2075 is next, and the $0.159 box sits far below.
After a 2x run, every bounce gets sold by someone taking profit. Let $0.25 decide before chasing.
Shakeout before the next leg, or a bounce inside a topping range?
Not financial advice.
$MMT
$PIPPIN
$EVAA
2
2.4k
·
--
Bearish
Verified
See translation
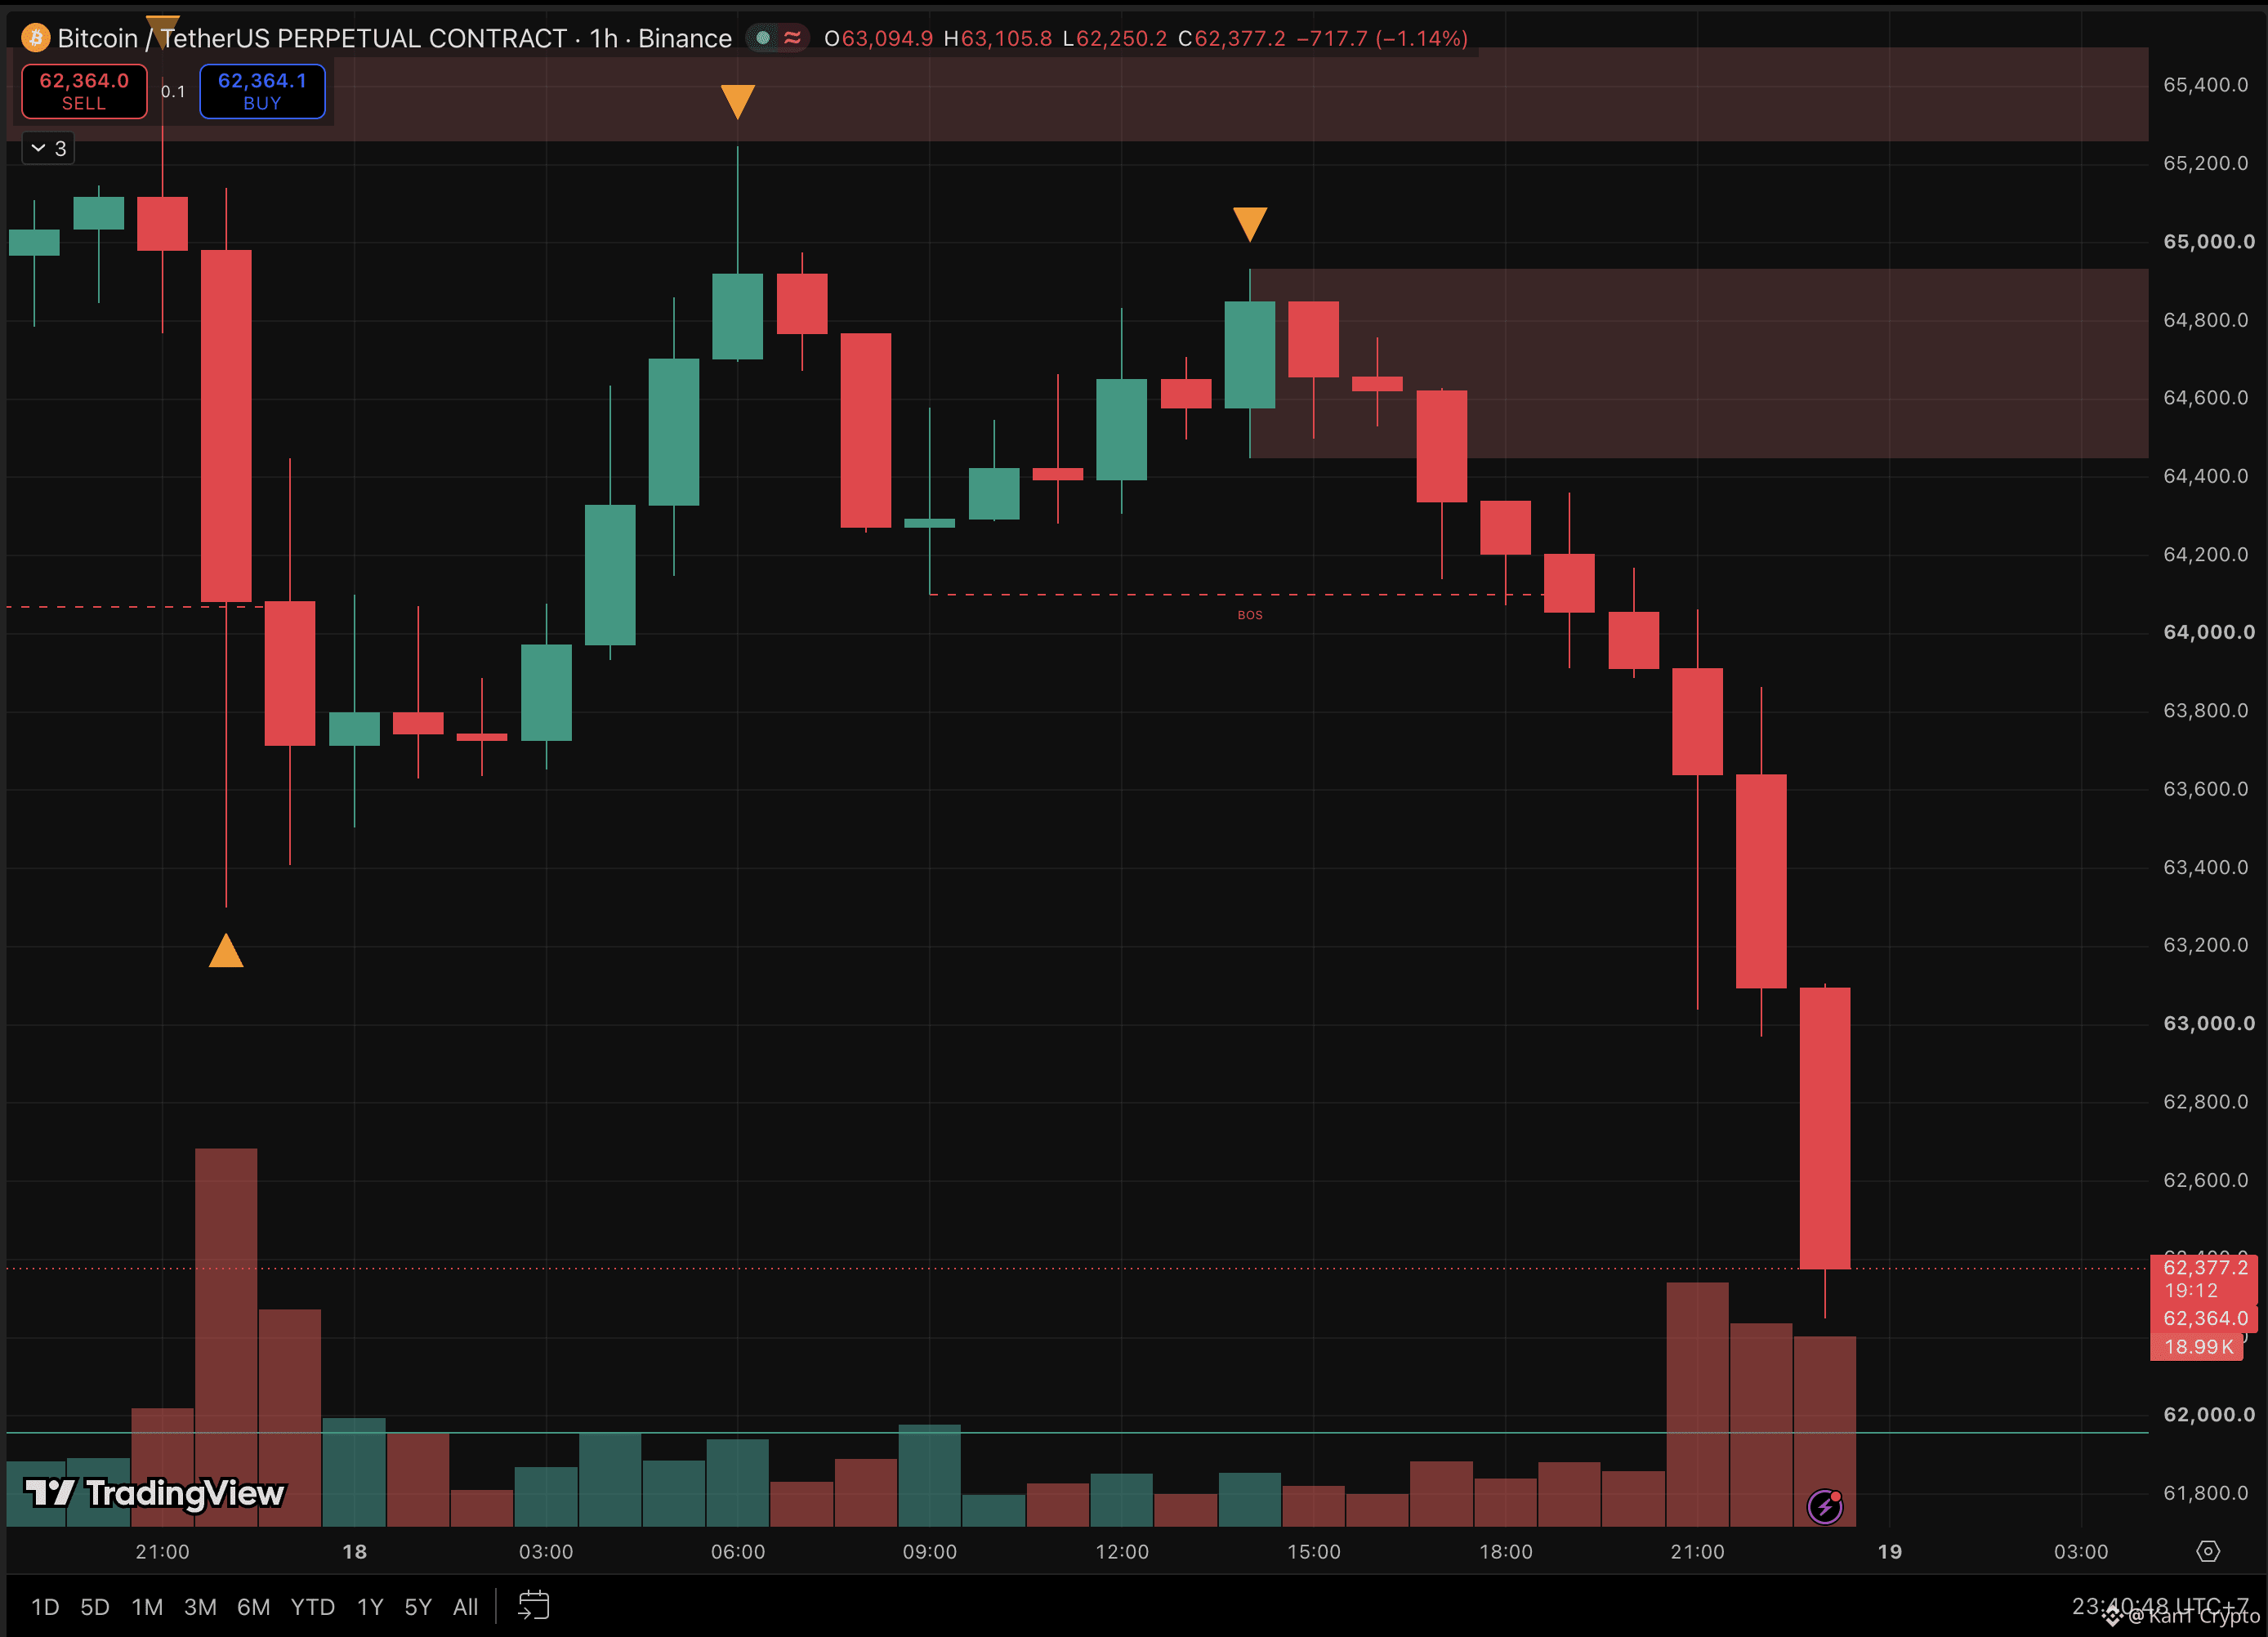
⚠️ Nvidia beat. Stock futures jumped. Bitcoin dumped $2,700 anyway.
Rejected at: ~$64.93K
Now: $62,377 (low $62,250)
Drop: about 4% in 9 hours
Fear and Greed: 13, extreme fear
This one isn't a headline shock. It's money quietly walking out.
The basis trade (buy spot, short futures, pocket the gap) now pays only 3% to 5% a year, near or below Treasury yields.
So that capital is rotating into stock futures instead.
When even the "safe" crypto trade stops paying, bids get thin.
The chart told the same story all day.
Sunday's map: hold $62K and the $65K to $66.1K zone is the ceiling.
Bitcoin climbed to ~$65.2K and got turned away right there.
Lower high at $64.93K.
BOS (break of structure, the trend printing a fresh low) at $64.1K.
Then three straight big red candles on rising volume. 📉
Now price is $400 from Sunday's $61.98K low.
That's the line.
Hold $62K → a double bottom is possible, with $63.3K then $64.1K as the first ceilings.
Lose $61.98K → $60K is next, and that's where the most-traded put option sits, so plenty of traders are positioned for it.
One more landmine tonight: the Fed's October minutes drop at 19:00 UTC, with December hike odds at 96%.
Retesting a low right before a Fed release is how both sides get wicked out. Smaller size, wider patience.
Double bottom at $62K, or $60K next?
Not financial advice.
$BTC
{future}(BTCUSDT)
$NVDA
{future}(NVDAUSDT)
$ETH
{future}(ETHUSDT)
⚠️ Nvidia beat. Stock futures jumped. Bitcoin dumped $2,700 anyway.
Rejected at: ~$64.93K
Now: $62,377 (low $62,250)
Drop: about 4% in 9 hours
Fear and Greed: 13, extreme fear
This one isn't a headline shock. It's money quietly walking out.
The basis trade (buy spot, short futures, pocket the gap) now pays only 3% to 5% a year, near or below Treasury yields.
So that capital is rotating into stock futures instead.
When even the "safe" crypto trade stops paying, bids get thin.
The chart told the same story all day.
Sunday's map: hold $62K and the $65K to $66.1K zone is the ceiling.
Bitcoin climbed to ~$65.2K and got turned away right there.
Lower high at $64.93K.
BOS (break of structure, the trend printing a fresh low) at $64.1K.
Then three straight big red candles on rising volume. 📉
Now price is $400 from Sunday's $61.98K low.
That's the line.
Hold $62K → a double bottom is possible, with $63.3K then $64.1K as the first ceilings.
Lose $61.98K → $60K is next, and that's where the most-traded put option sits, so plenty of traders are positioned for it.
One more landmine tonight: the Fed's October minutes drop at 19:00 UTC, with December hike odds at 96%.
Retesting a low right before a Fed release is how both sides get wicked out. Smaller size, wider patience.
Double bottom at $62K, or $60K next?
Not financial advice.
$BTC
$NVDA
$ETH
Rejected at: ~$64.93K
Now: $62,377 (low $62,250)
Drop: about 4% in 9 hours
Fear and Greed: 13, extreme fear
This one isn't a headline shock. It's money quietly walking out.
The basis trade (buy spot, short futures, pocket the gap) now pays only 3% to 5% a year, near or below Treasury yields.
So that capital is rotating into stock futures instead.
When even the "safe" crypto trade stops paying, bids get thin.
The chart told the same story all day.
Sunday's map: hold $62K and the $65K to $66.1K zone is the ceiling.
Bitcoin climbed to ~$65.2K and got turned away right there.
Lower high at $64.93K.
BOS (break of structure, the trend printing a fresh low) at $64.1K.
Then three straight big red candles on rising volume. 📉
Now price is $400 from Sunday's $61.98K low.
That's the line.
Hold $62K → a double bottom is possible, with $63.3K then $64.1K as the first ceilings.
Lose $61.98K → $60K is next, and that's where the most-traded put option sits, so plenty of traders are positioned for it.
One more landmine tonight: the Fed's October minutes drop at 19:00 UTC, with December hike odds at 96%.
Retesting a low right before a Fed release is how both sides get wicked out. Smaller size, wider patience.
Double bottom at $62K, or $60K next?
Not financial advice.
$BTC
$NVDA
$ETH
2
2
950
·
--
Bullish
See translation
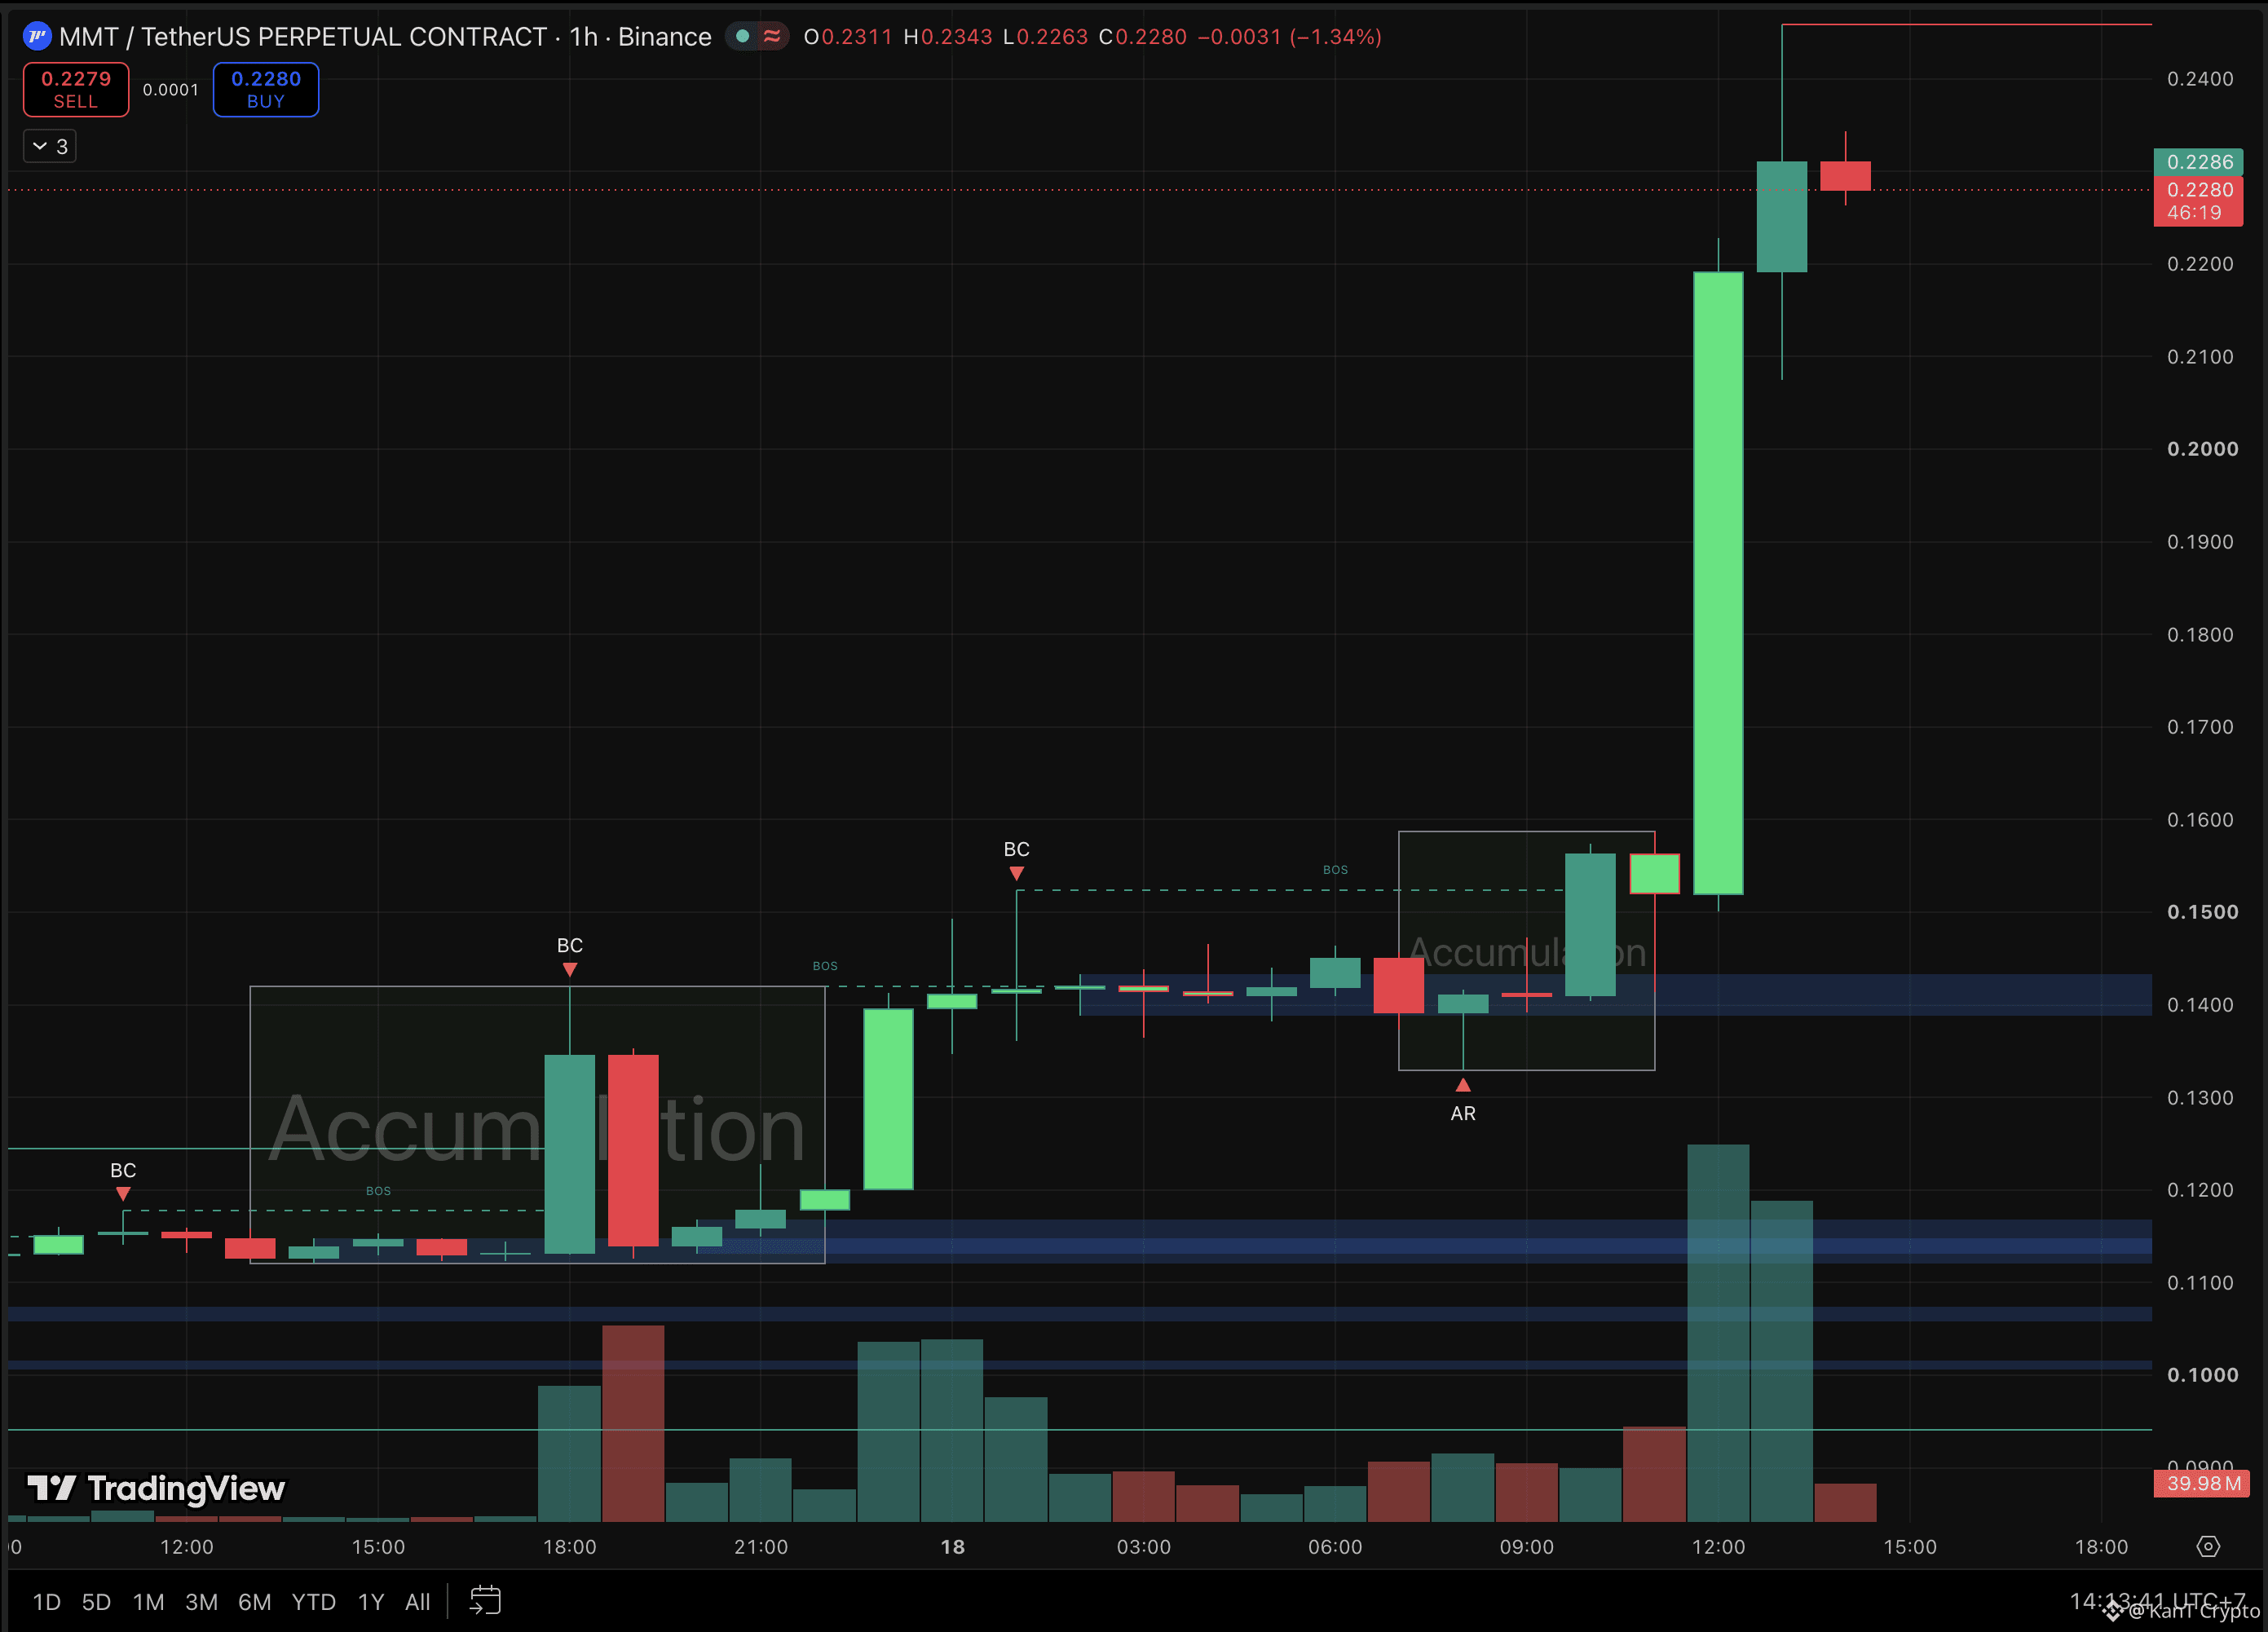
📈 MMT has been climbing a staircase for a day. The last step was an elevator.
One hourly candle: $0.152 to $0.219, about +44%
Wick high since: ~$0.2458
Now: $0.2280
Yesterday’s base: ~$0.112, so roughly 2x in a day
The pattern is almost too clean.
Step one: a tight accumulation box (quiet buying in a flat range) at $0.112 to $0.142.
Break out, pause.
Step two: another box at $0.133 to $0.159.
Break out again.
Then the 44% candle on the biggest volume bar on the chart.
Every box held its floor, and every breakout came on rising volume.
That’s how a trend is supposed to look. 👀
But the latest candles are flashing the first warning.
The push to $0.2458 left a long upper wick, meaning sellers met it hard.
The candle now is small and red, with volume fading fast.
And the 44% candle crossed $0.152 to $0.219 in one hour, leaving almost no support in between, the kind of zone price often comes back to fill.
$0.2195 is the first floor, the top of that monster candle.
Below it, $0.2075 (the latest wick low), then the $0.159 box top.
4H close above $0.2458 → the staircase keeps going.
Lose $0.2075 → the gap starts filling, and $0.159 is where the last box sits.
Buying the top of an elevator ride is how late longs get shaken out. Wait for a pullback that holds a floor.
Next step up, or time to fill the gap?
Not financial advice.
$MMT
{future}(MMTUSDT)
$BREV
{future}(BREVUSDT)
$NEAR
{future}(NEARUSDT)
📈 MMT has been climbing a staircase for a day. The last step was an elevator.
One hourly candle: $0.152 to $0.219, about +44%
Wick high since: ~$0.2458
Now: $0.2280
Yesterday’s base: ~$0.112, so roughly 2x in a day
The pattern is almost too clean.
Step one: a tight accumulation box (quiet buying in a flat range) at $0.112 to $0.142.
Break out, pause.
Step two: another box at $0.133 to $0.159.
Break out again.
Then the 44% candle on the biggest volume bar on the chart.
Every box held its floor, and every breakout came on rising volume.
That’s how a trend is supposed to look. 👀
But the latest candles are flashing the first warning.
The push to $0.2458 left a long upper wick, meaning sellers met it hard.
The candle now is small and red, with volume fading fast.
And the 44% candle crossed $0.152 to $0.219 in one hour, leaving almost no support in between, the kind of zone price often comes back to fill.
$0.2195 is the first floor, the top of that monster candle.
Below it, $0.2075 (the latest wick low), then the $0.159 box top.
4H close above $0.2458 → the staircase keeps going.
Lose $0.2075 → the gap starts filling, and $0.159 is where the last box sits.
Buying the top of an elevator ride is how late longs get shaken out. Wait for a pullback that holds a floor.
Next step up, or time to fill the gap?
Not financial advice.
$MMT
$BREV
$NEAR
One hourly candle: $0.152 to $0.219, about +44%
Wick high since: ~$0.2458
Now: $0.2280
Yesterday’s base: ~$0.112, so roughly 2x in a day
The pattern is almost too clean.
Step one: a tight accumulation box (quiet buying in a flat range) at $0.112 to $0.142.
Break out, pause.
Step two: another box at $0.133 to $0.159.
Break out again.
Then the 44% candle on the biggest volume bar on the chart.
Every box held its floor, and every breakout came on rising volume.
That’s how a trend is supposed to look. 👀
But the latest candles are flashing the first warning.
The push to $0.2458 left a long upper wick, meaning sellers met it hard.
The candle now is small and red, with volume fading fast.
And the 44% candle crossed $0.152 to $0.219 in one hour, leaving almost no support in between, the kind of zone price often comes back to fill.
$0.2195 is the first floor, the top of that monster candle.
Below it, $0.2075 (the latest wick low), then the $0.159 box top.
4H close above $0.2458 → the staircase keeps going.
Lose $0.2075 → the gap starts filling, and $0.159 is where the last box sits.
Buying the top of an elevator ride is how late longs get shaken out. Wait for a pullback that holds a floor.
Next step up, or time to fill the gap?
Not financial advice.
$MMT
$BREV
$NEAR
1
595
·
--
Bullish
See translation
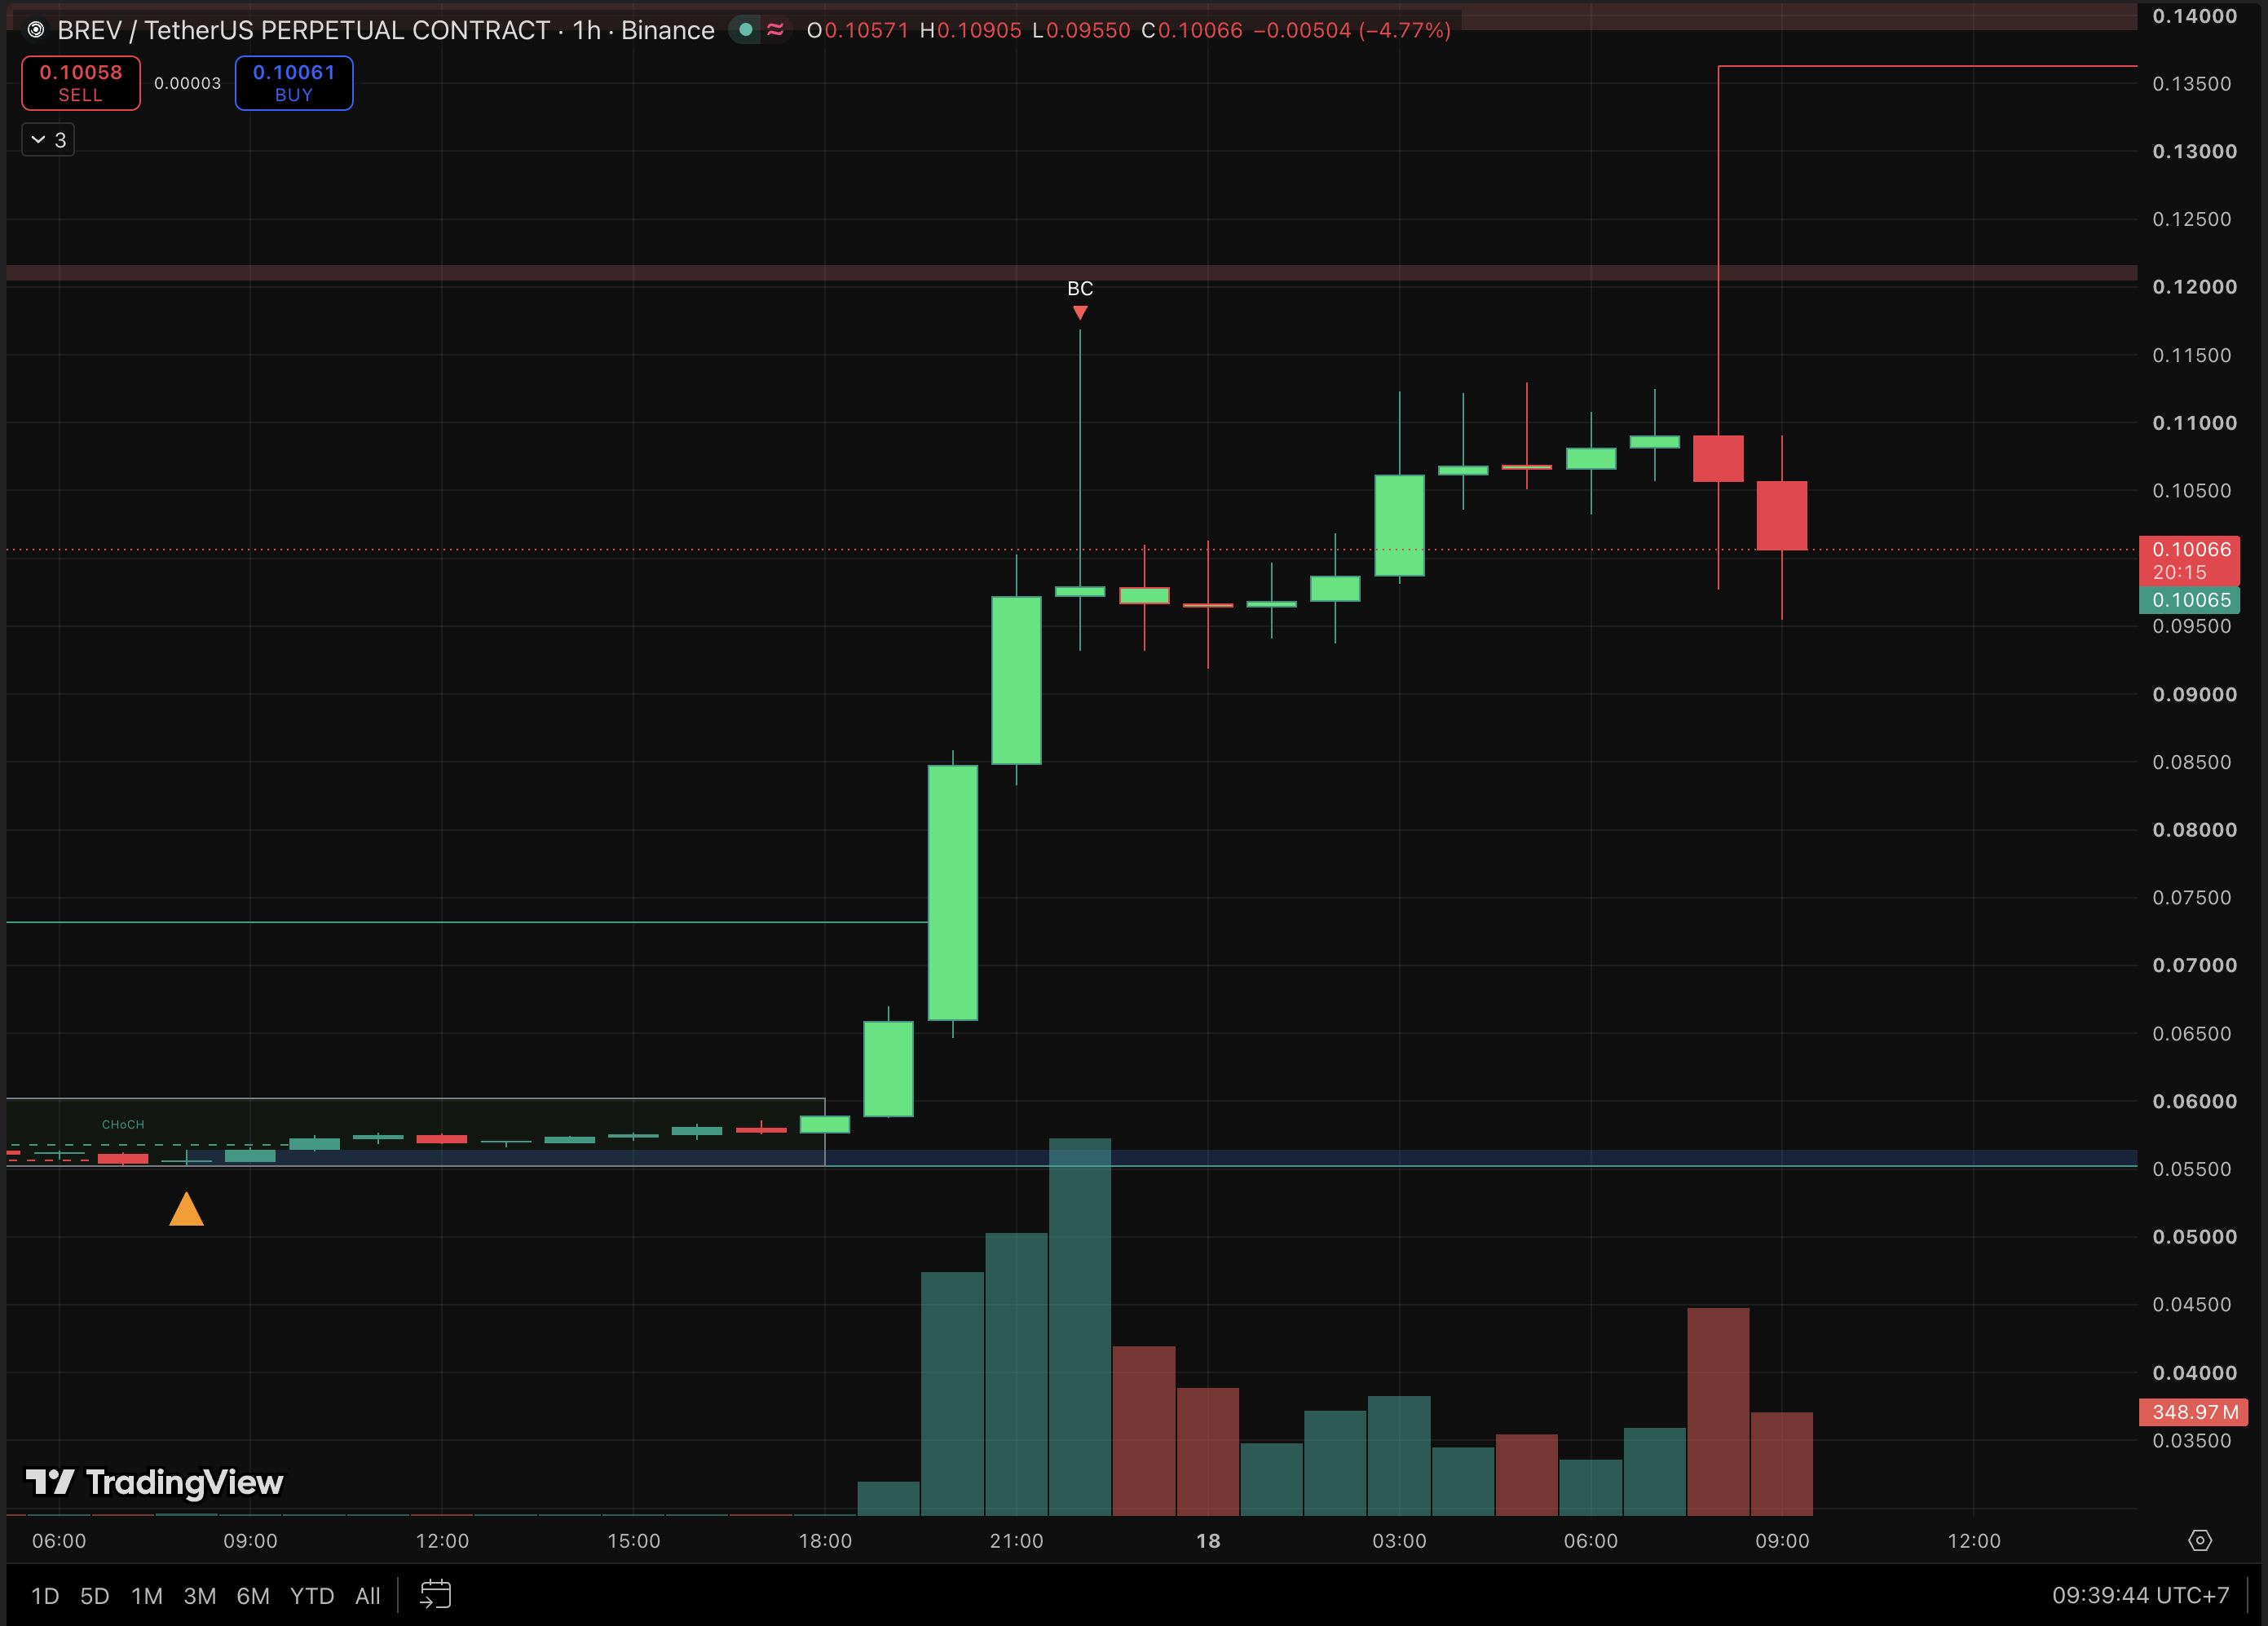
💸 Whoever bought BREV’s top at $0.136 is already down 26%. That top lasted less than an hour.
Spike high: ~$0.136
Same candle’s low: ~$0.0976
Now: $0.1007
Base before the run: ~$0.056
Rewind 15 hours.
BREV sat flat near $0.056, then nearly doubled in four hourly candles.
A buying climax (late buyers piling in as early ones cash out) printed at ~$0.1168.
Then it went sideways all night between $0.092 and $0.112. Fine so far.
Then came the wick.
One candle stabbed through the $0.1205 supply zone to $0.136, then collapsed right back into the range and closed red.
Next candle: another red, a low at $0.0955.
In Wyckoff terms that spike looks like an upthrust: a fake breakout above the range that grabs buy stops and traps breakout chasers before price slides back.
It came on the biggest red volume bar since the run started. 👀
It doesn’t confirm the top yet.
The $0.092 range floor is still intact, and buyers have defended it all night.
Reclaim $0.112 on a 4H close → the trap failed, and $0.1205 then $0.136 come back into view.
Lose $0.092 → the range breaks, and $0.073 is the next marked level, with the $0.056 base far below.
A coin that moves 40% inside one hourly candle will liquidate leverage on both sides. Small size or no size.
Upthrust before the slide, or a shakeout before round two?
Not financial advice.
$BREV
{future}(BREVUSDT)
$MMT
{future}(MMTUSDT)
$NEAR
{future}(NEARUSDT)
💸 Whoever bought BREV’s top at $0.136 is already down 26%. That top lasted less than an hour.
Spike high: ~$0.136
Same candle’s low: ~$0.0976
Now: $0.1007
Base before the run: ~$0.056
Rewind 15 hours.
BREV sat flat near $0.056, then nearly doubled in four hourly candles.
A buying climax (late buyers piling in as early ones cash out) printed at ~$0.1168.
Then it went sideways all night between $0.092 and $0.112. Fine so far.
Then came the wick.
One candle stabbed through the $0.1205 supply zone to $0.136, then collapsed right back into the range and closed red.
Next candle: another red, a low at $0.0955.
In Wyckoff terms that spike looks like an upthrust: a fake breakout above the range that grabs buy stops and traps breakout chasers before price slides back.
It came on the biggest red volume bar since the run started. 👀
It doesn’t confirm the top yet.
The $0.092 range floor is still intact, and buyers have defended it all night.
Reclaim $0.112 on a 4H close → the trap failed, and $0.1205 then $0.136 come back into view.
Lose $0.092 → the range breaks, and $0.073 is the next marked level, with the $0.056 base far below.
A coin that moves 40% inside one hourly candle will liquidate leverage on both sides. Small size or no size.
Upthrust before the slide, or a shakeout before round two?
Not financial advice.
$BREV
$MMT
$NEAR
Spike high: ~$0.136
Same candle’s low: ~$0.0976
Now: $0.1007
Base before the run: ~$0.056
Rewind 15 hours.
BREV sat flat near $0.056, then nearly doubled in four hourly candles.
A buying climax (late buyers piling in as early ones cash out) printed at ~$0.1168.
Then it went sideways all night between $0.092 and $0.112. Fine so far.
Then came the wick.
One candle stabbed through the $0.1205 supply zone to $0.136, then collapsed right back into the range and closed red.
Next candle: another red, a low at $0.0955.
In Wyckoff terms that spike looks like an upthrust: a fake breakout above the range that grabs buy stops and traps breakout chasers before price slides back.
It came on the biggest red volume bar since the run started. 👀
It doesn’t confirm the top yet.
The $0.092 range floor is still intact, and buyers have defended it all night.
Reclaim $0.112 on a 4H close → the trap failed, and $0.1205 then $0.136 come back into view.
Lose $0.092 → the range breaks, and $0.073 is the next marked level, with the $0.056 base far below.
A coin that moves 40% inside one hourly candle will liquidate leverage on both sides. Small size or no size.
Upthrust before the slide, or a shakeout before round two?
Not financial advice.
$BREV
$MMT
$NEAR
1
926
·
--
Bearish
Verified
See translation
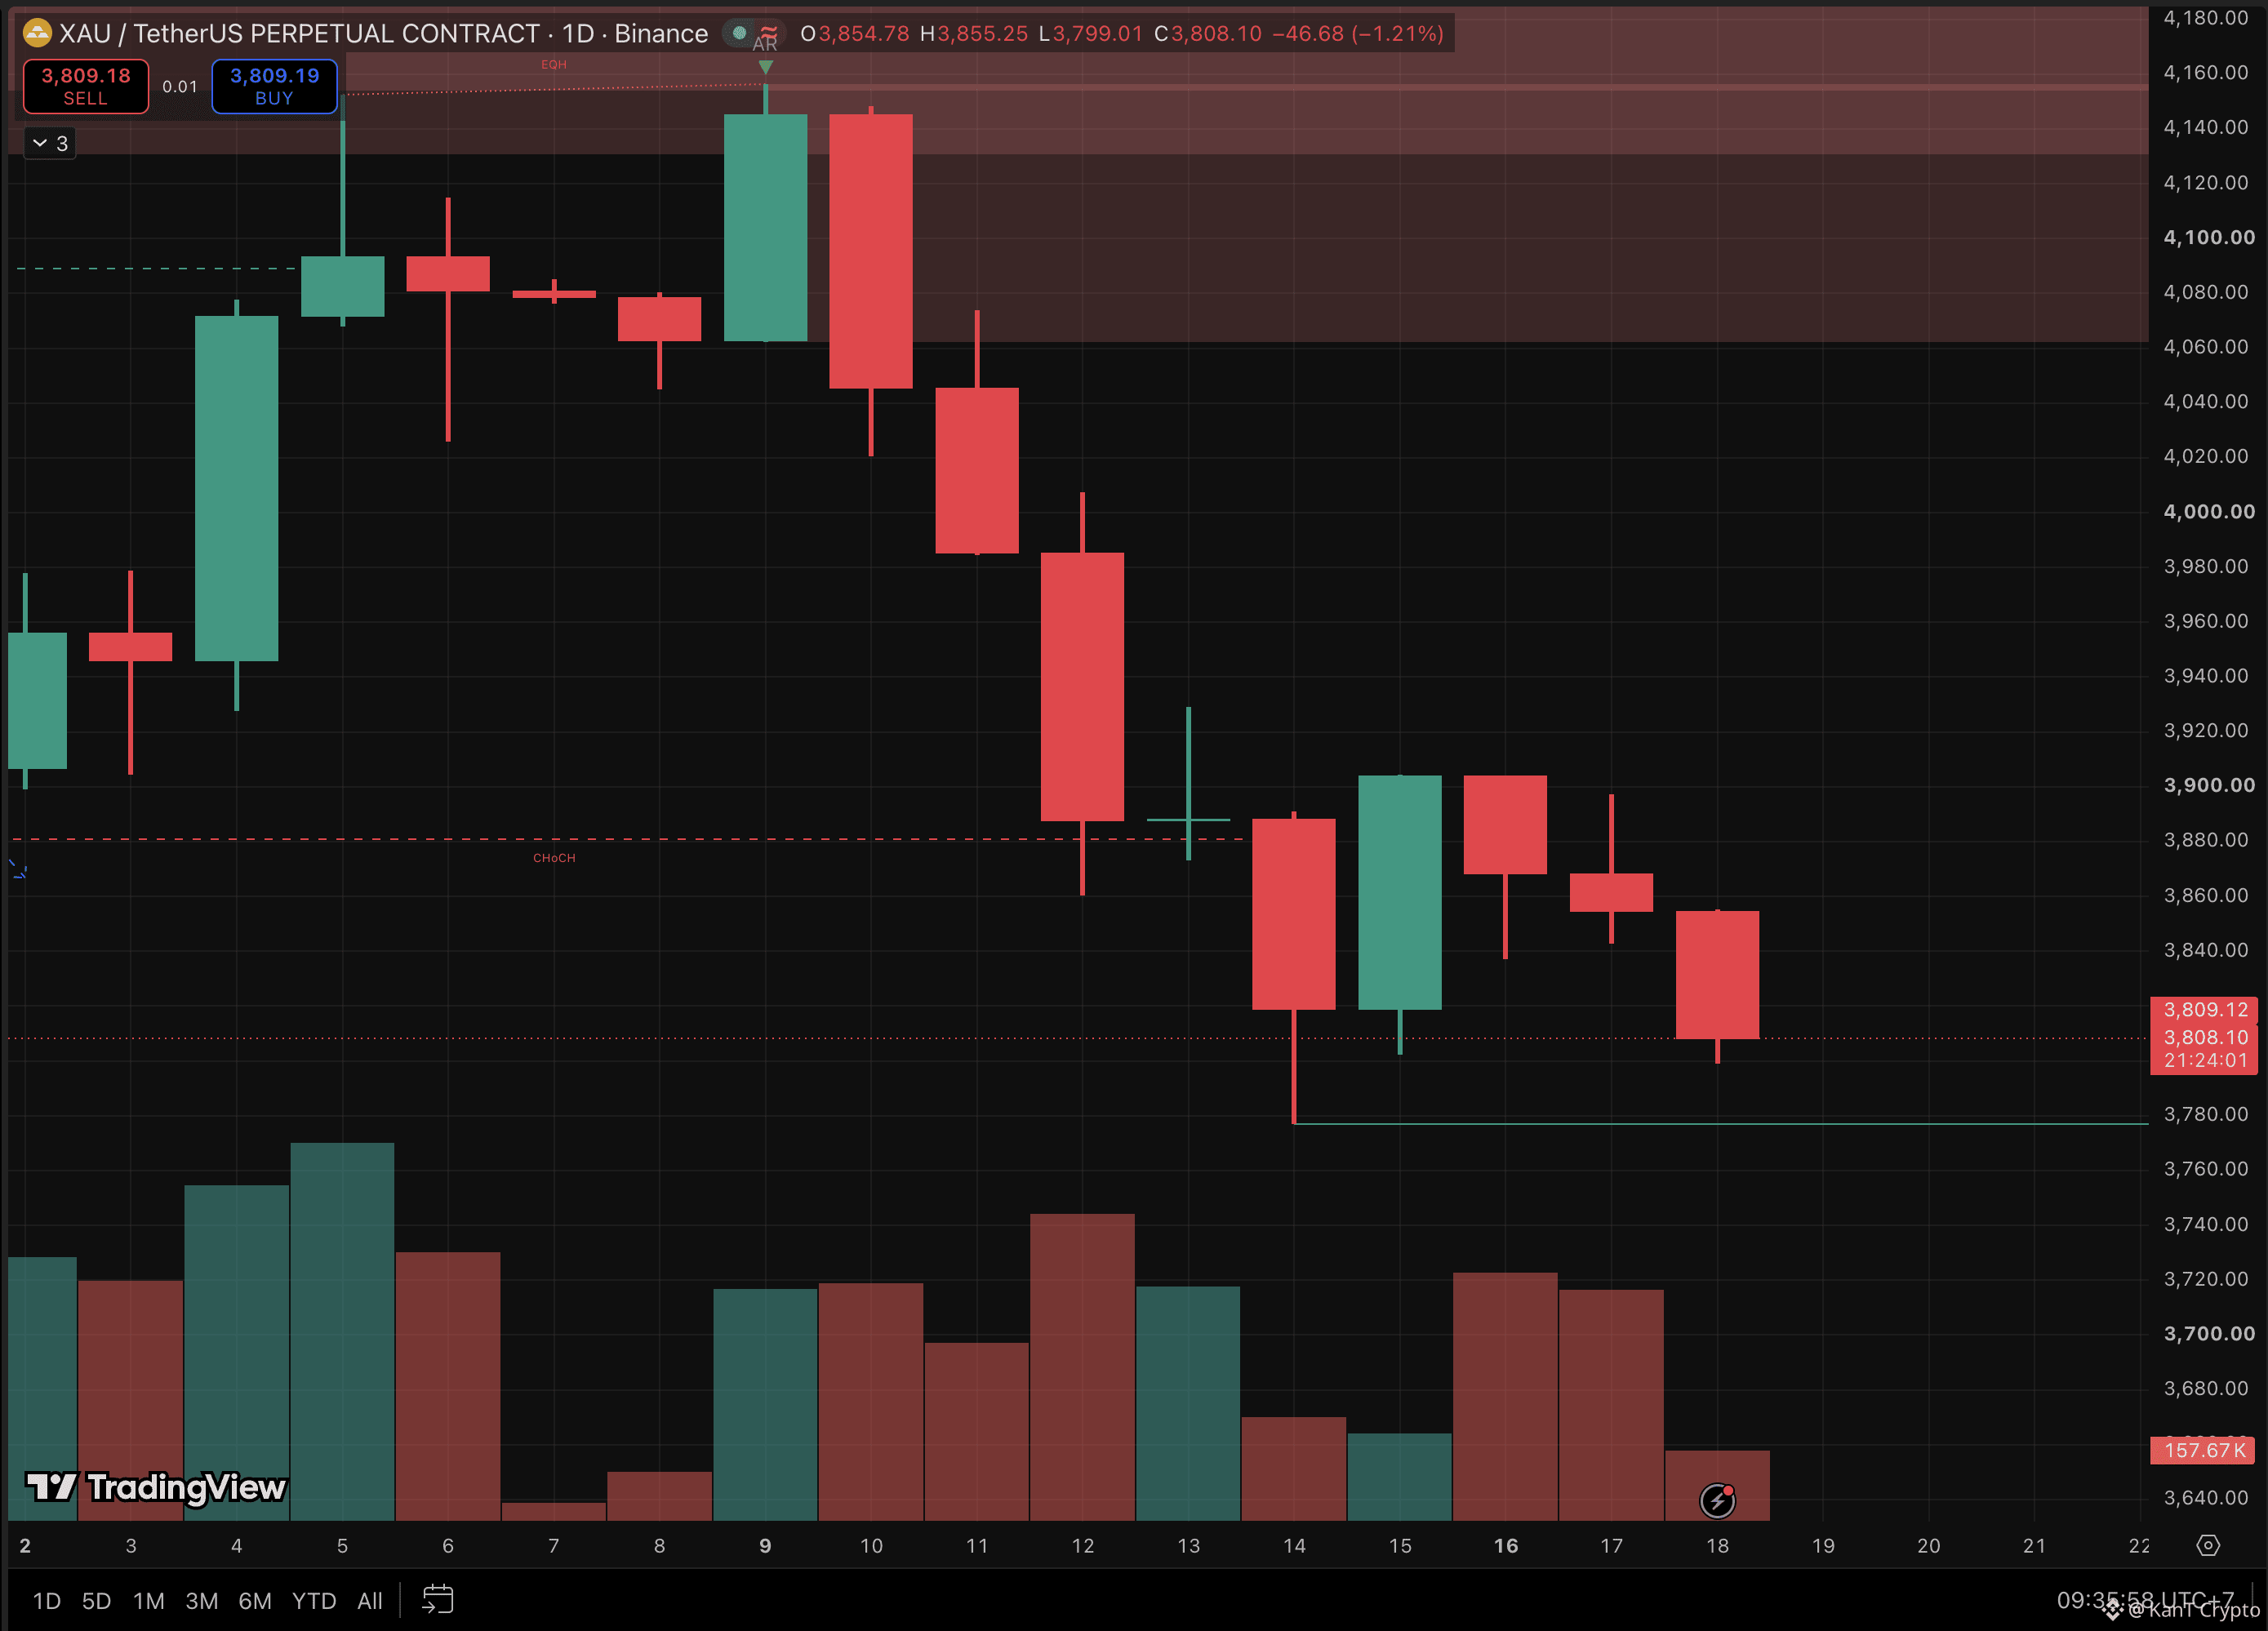
📉 JUST IN: Gold crashes under $3,800 for the first time since September 2025.
A war is still running. Hormuz is still a mess. And the “safe haven” is bleeding anyway.
Now: ~$3,793
A week ago: above $4,000
From the record near $5,595: about -32%
This chart has no panic wick. It’s a staircase.
Lower high at ~$3,857.
Shelf at $3,850 cracks.
A bounce to ~$3,820 gets sold within hours.
Then $3,800 goes on the biggest candle on the chart.
The reason isn’t fear. It’s money getting expensive.
December hike odds sit near 90%.
The dollar index is at 103.5.
The 10-year yield is above 5%.
Gold pays nothing, so when cash pays 5%, holding it costs real money.
And there’s a second hit.
Tech stocks dropped hard this week, and investors sold gold to cover losses elsewhere.
When gold, stocks and Bitcoin all fall together, that’s a liquidity squeeze, not a verdict on gold.
Gold got dumped the same way in March 2020, before it recovered. 👀
Desks flagged $3,780 to $3,800 as the last support zone.
Below that, nothing big is marked on this chart.
Reclaim $3,820 to $3,835 → the break was a flush, $3,850 is the next ceiling.
Lose $3,780 on a daily close → the staircase keeps going.
A broken round number retested from below is not a dip to blindly catch. Let it base first.
Liquidity flush, or the start of a deeper reset?
Not financial advice.
$XAU
{future}(XAUUSDT)
$XAUT
{future}(XAUTUSDT)
$PAXG
{future}(PAXGUSDT)
📉 JUST IN: Gold crashes under $3,800 for the first time since September 2025.
A war is still running. Hormuz is still a mess. And the “safe haven” is bleeding anyway.
Now: ~$3,793
A week ago: above $4,000
From the record near $5,595: about -32%
This chart has no panic wick. It’s a staircase.
Lower high at ~$3,857.
Shelf at $3,850 cracks.
A bounce to ~$3,820 gets sold within hours.
Then $3,800 goes on the biggest candle on the chart.
The reason isn’t fear. It’s money getting expensive.
December hike odds sit near 90%.
The dollar index is at 103.5.
The 10-year yield is above 5%.
Gold pays nothing, so when cash pays 5%, holding it costs real money.
And there’s a second hit.
Tech stocks dropped hard this week, and investors sold gold to cover losses elsewhere.
When gold, stocks and Bitcoin all fall together, that’s a liquidity squeeze, not a verdict on gold.
Gold got dumped the same way in March 2020, before it recovered. 👀
Desks flagged $3,780 to $3,800 as the last support zone.
Below that, nothing big is marked on this chart.
Reclaim $3,820 to $3,835 → the break was a flush, $3,850 is the next ceiling.
Lose $3,780 on a daily close → the staircase keeps going.
A broken round number retested from below is not a dip to blindly catch. Let it base first.
Liquidity flush, or the start of a deeper reset?
Not financial advice.
$XAU
$XAUT
$PAXG
A war is still running. Hormuz is still a mess. And the “safe haven” is bleeding anyway.
Now: ~$3,793
A week ago: above $4,000
From the record near $5,595: about -32%
This chart has no panic wick. It’s a staircase.
Lower high at ~$3,857.
Shelf at $3,850 cracks.
A bounce to ~$3,820 gets sold within hours.
Then $3,800 goes on the biggest candle on the chart.
The reason isn’t fear. It’s money getting expensive.
December hike odds sit near 90%.
The dollar index is at 103.5.
The 10-year yield is above 5%.
Gold pays nothing, so when cash pays 5%, holding it costs real money.
And there’s a second hit.
Tech stocks dropped hard this week, and investors sold gold to cover losses elsewhere.
When gold, stocks and Bitcoin all fall together, that’s a liquidity squeeze, not a verdict on gold.
Gold got dumped the same way in March 2020, before it recovered. 👀
Desks flagged $3,780 to $3,800 as the last support zone.
Below that, nothing big is marked on this chart.
Reclaim $3,820 to $3,835 → the break was a flush, $3,850 is the next ceiling.
Lose $3,780 on a daily close → the staircase keeps going.
A broken round number retested from below is not a dip to blindly catch. Let it base first.
Liquidity flush, or the start of a deeper reset?
Not financial advice.
$XAU
$XAUT
$PAXG
1
936
Log in to explore more content
Join global crypto users on Binance Square
⚡️ Get latest and useful information about crypto.
💬 Trusted by the world’s largest crypto exchange.
👍 Discover real insights from verified creators.
Email / Phone number
Trending Topics
NvidiaLoses$2.7TrillionInMonthAndAHalf
8,880 views
88 Discussing
Nvidia’s $2.7 Trillion Wipeout: When Narrative Overrides Numbers 📉
Crypto With Faisal
·5 Likes
·3.6k views
CanBTCReboundAfterFallingBelow60K?
647,612 views
2,733 Discussing
GlobalStocksFaceLongestLosingStreakSince2023
230,023 views
1,868 Discussing