
币圈十二叔
3.6k Posts

币圈十二叔
Report
Block User
量化交易员🤠量化带单中欢迎跟单🤖币安手续费八折返佣码: SR988
High-Frequency Trader
1.2 Years
12 Following
1.1K+ Followers
415 Liked
Posts
All
Quotes
Videos
·
--
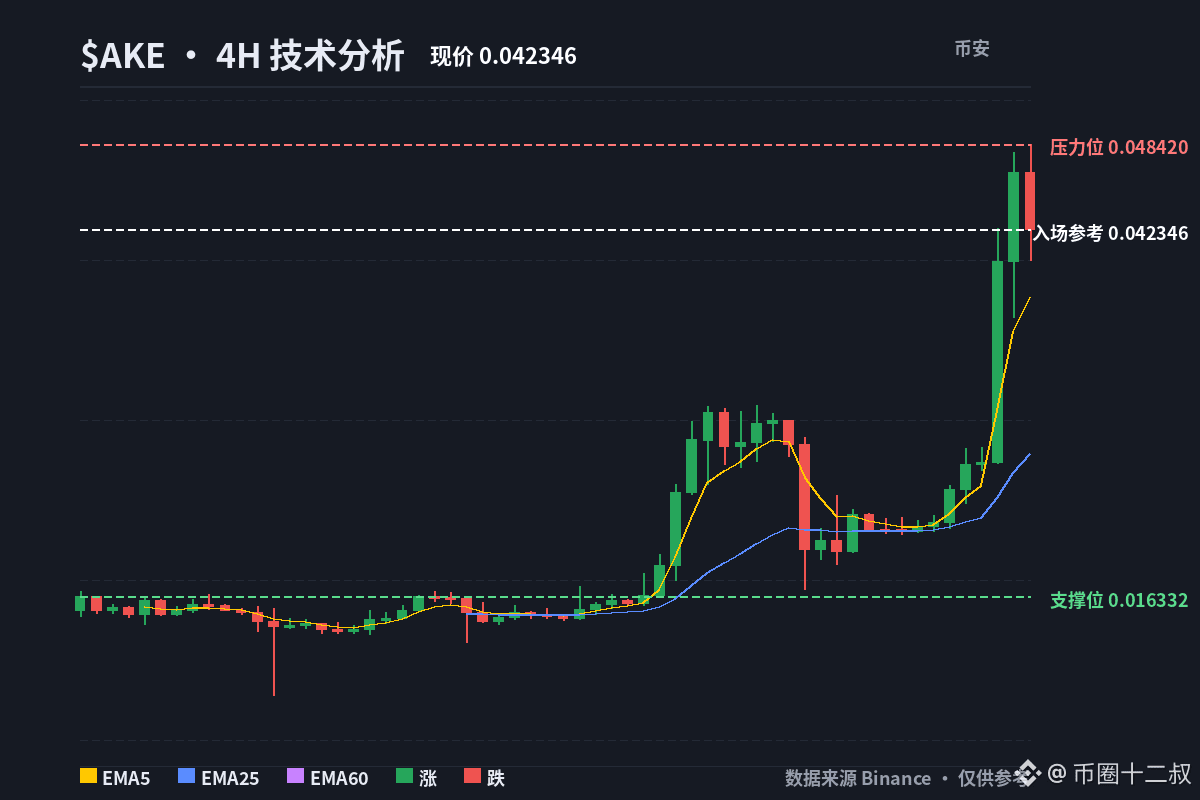
🚀 $AKE just hit a new all-time high, and the price is at $0.040993.
This price action is kind of interesting—the chart looks pretty strong.
7×24 multi-market monitoring: as soon as a move shows up, we respond immediately with no missed orders—something humans can’t do, I let machines do. The live trading sync entry is on my homepage.
🚀 $AKE just hit a new all-time high, and the price is at $0.040993.
This price action is kind of interesting—the chart looks pretty strong.
7×24 multi-market monitoring: as soon as a move shows up, we respond immediately with no missed orders—something humans can’t do, I let machines do. The live trading sync entry is on my homepage.
This price action is kind of interesting—the chart looks pretty strong.
7×24 multi-market monitoring: as soon as a move shows up, we respond immediately with no missed orders—something humans can’t do, I let machines do. The live trading sync entry is on my homepage.
4
·
--
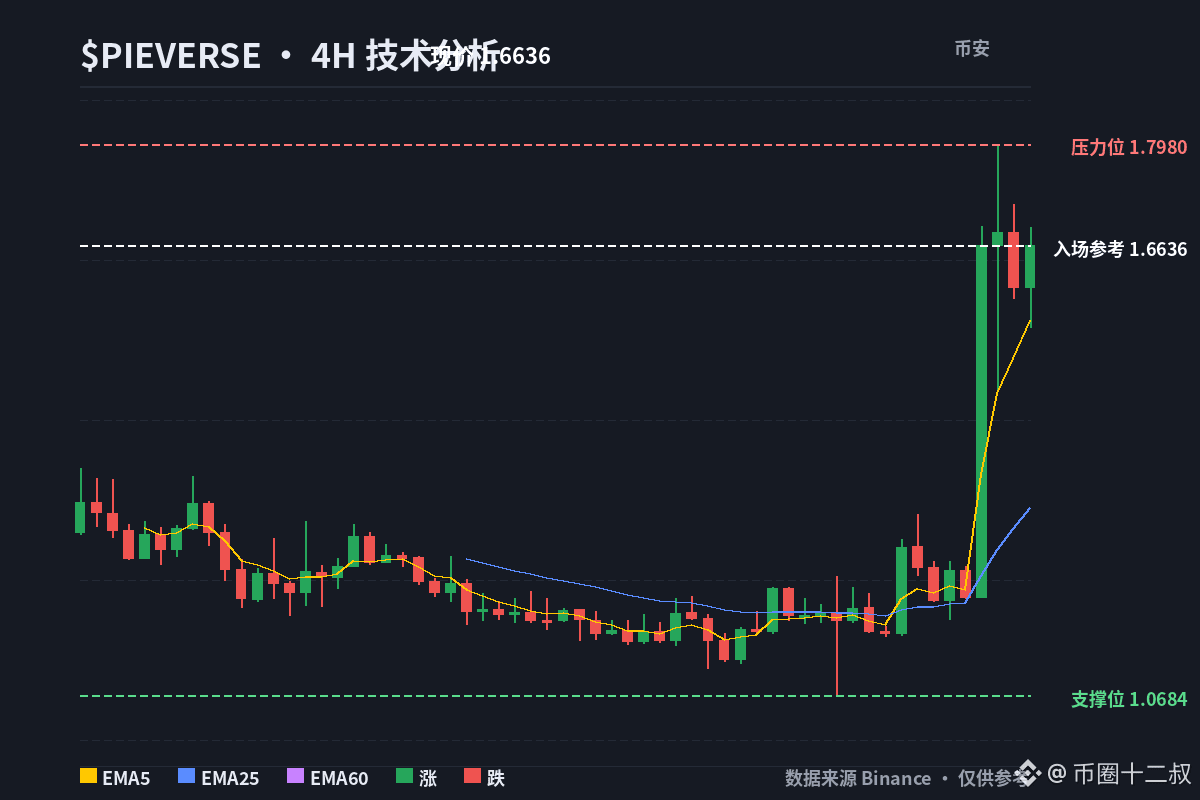
All shorts are closed. Wait until $PIEVERSE pins are inserted above the ATH, then look for short opportunities again. Also keep an eye on $BR and watch when they start taking profits and leaving.
Market direction strategy + US stock volatility arbitrage + long-term hold of mainstream coins—three parts are independent of each other but share the same risk-control foundation. Overall volatility and tail risk are kept under control. Go to the homepage to see the live trading.
All shorts are closed. Wait until $PIEVERSE pins are inserted above the ATH, then look for short opportunities again. Also keep an eye on $BR and watch when they start taking profits and leaving.
Market direction strategy + US stock volatility arbitrage + long-term hold of mainstream coins—three parts are independent of each other but share the same risk-control foundation. Overall volatility and tail risk are kept under control. Go to the homepage to see the live trading.
Market direction strategy + US stock volatility arbitrage + long-term hold of mainstream coins—three parts are independent of each other but share the same risk-control foundation. Overall volatility and tail risk are kept under control. Go to the homepage to see the live trading.
238
·
--
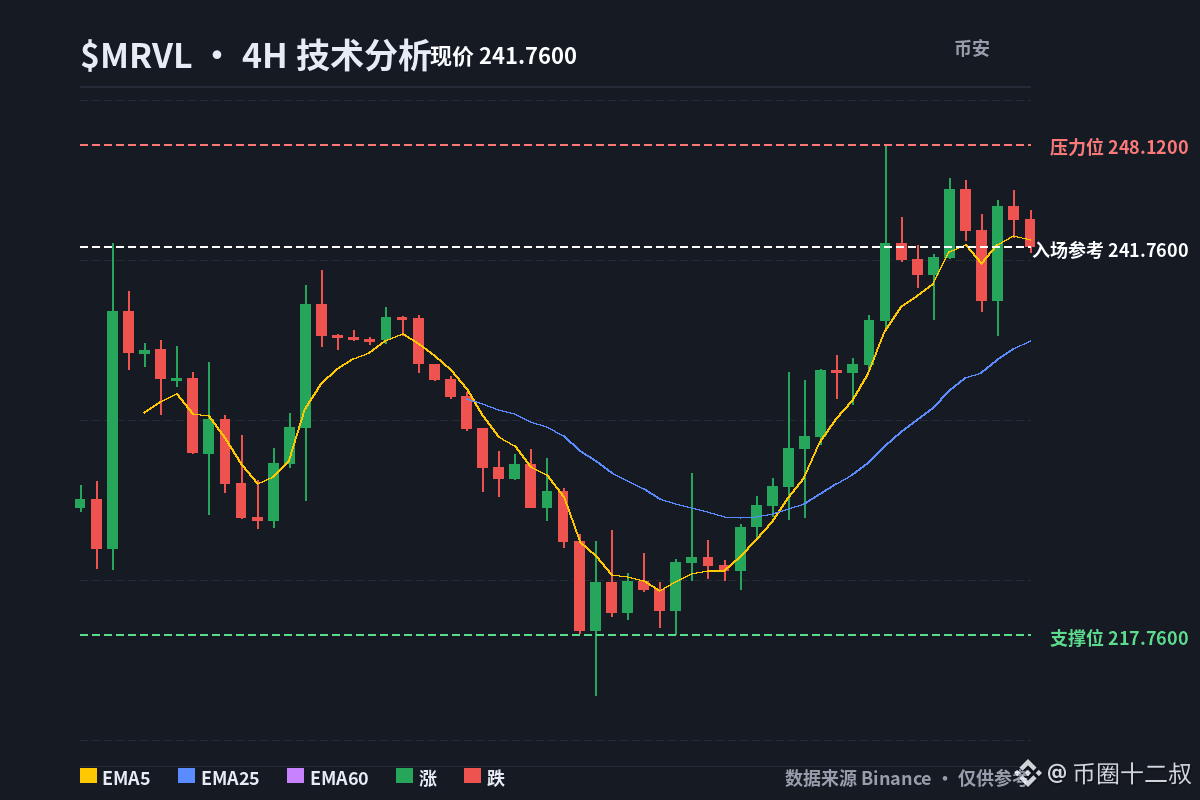
Honestly, when we talk about $MRVL now, do you think the focus should be on revenue growth from its AI data centers, or on its competitive strength in custom chips?
My approach isn’t about a single strategy going all-in: shorting to catch an overheating market, going long on leading companies to capture follow-on gains, trading the U.S. stock market’s volatility, and holding BTC/ETH/SOL long-term as a core position—when the market regime shifts, the capital automatically rebalances. You just follow along from the homepage.
Honestly, when we talk about $MRVL now, do you think the focus should be on revenue growth from its AI data centers, or on its competitive strength in custom chips?
My approach isn’t about a single strategy going all-in: shorting to catch an overheating market, going long on leading companies to capture follow-on gains, trading the U.S. stock market’s volatility, and holding BTC/ETH/SOL long-term as a core position—when the market regime shifts, the capital automatically rebalances. You just follow along from the homepage.
My approach isn’t about a single strategy going all-in: shorting to catch an overheating market, going long on leading companies to capture follow-on gains, trading the U.S. stock market’s volatility, and holding BTC/ETH/SOL long-term as a core position—when the market regime shifts, the capital automatically rebalances. You just follow along from the homepage.
248
·
--
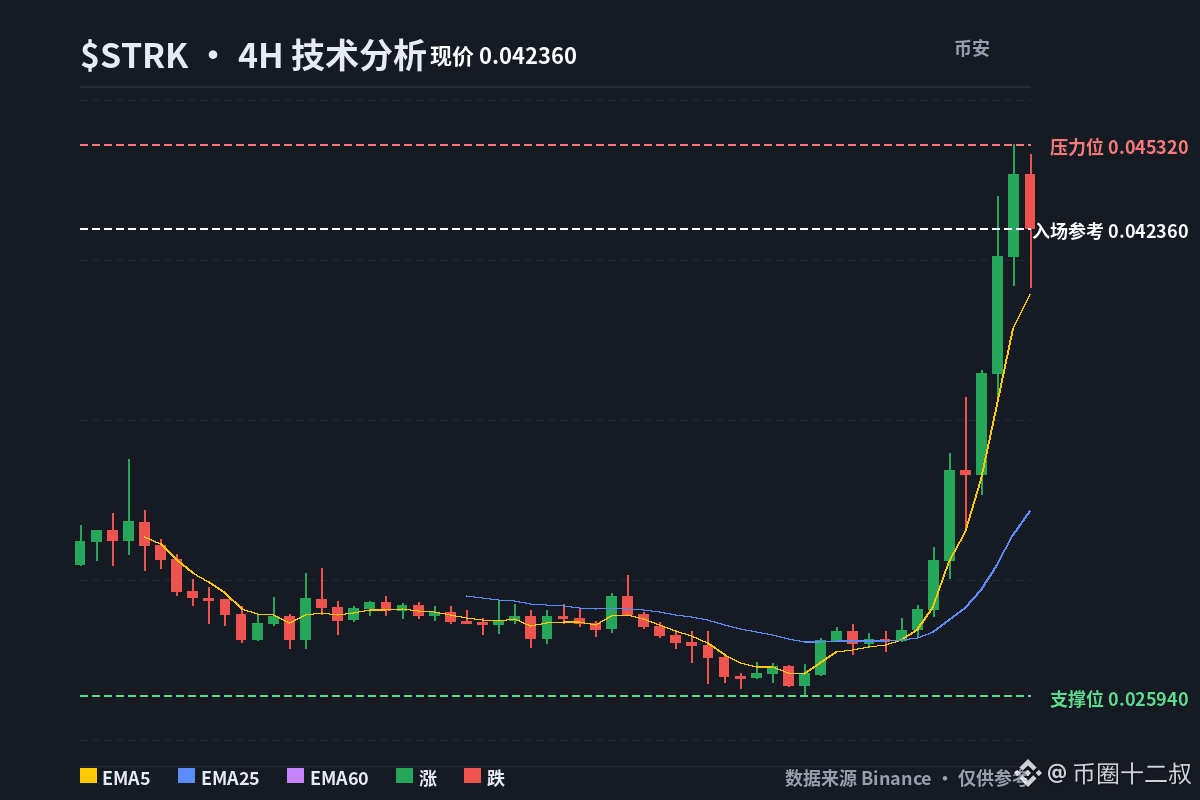
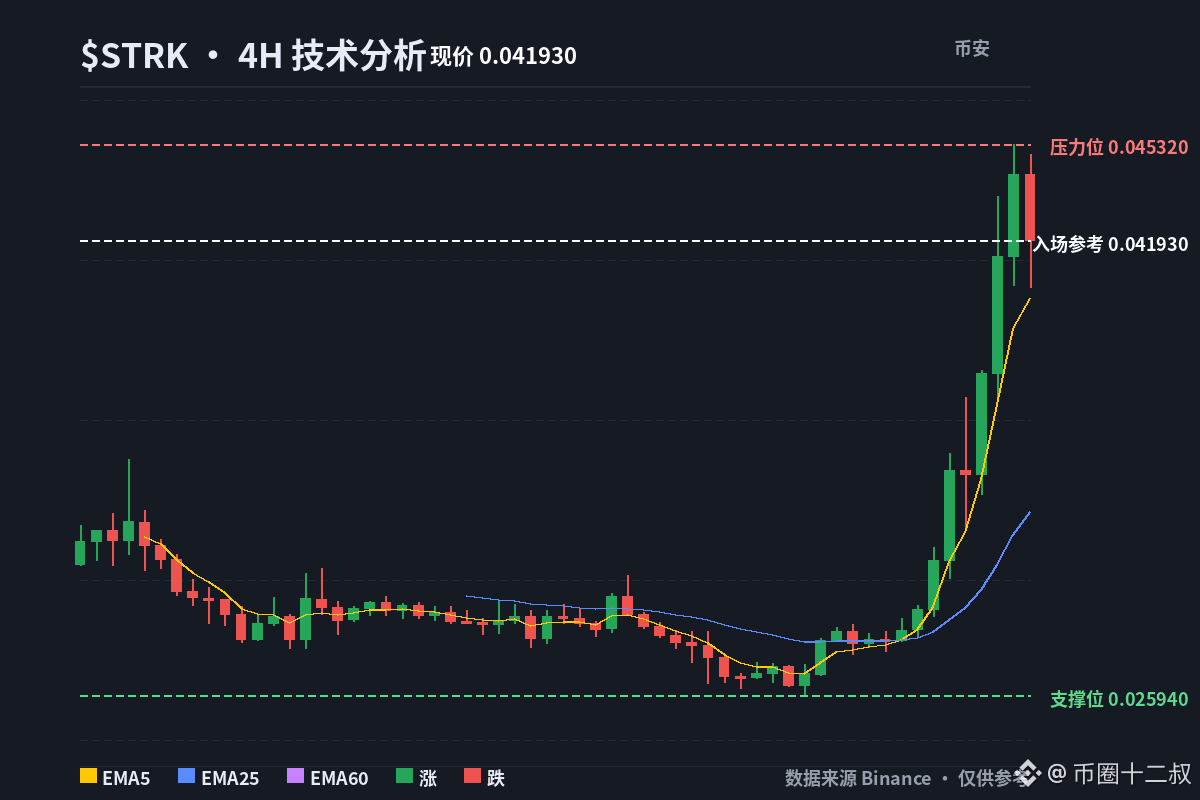
I’ve seen the OBV divergence signal for $STRK has already started to pay off. The upward, diagonal breakout thesis is indeed gradually taking shape.
My capital will automatically flow from the weakening strategy stream into the strong modules; in a headwind it contracts, in a tailwind it adds more. The drawdown guardrails are dynamic. There’s a live-trading entry point on the homepage.
I’ve seen the OBV divergence signal for $STRK has already started to pay off. The upward, diagonal breakout thesis is indeed gradually taking shape.
My capital will automatically flow from the weakening strategy stream into the strong modules; in a headwind it contracts, in a tailwind it adds more. The drawdown guardrails are dynamic. There’s a live-trading entry point on the homepage.
My capital will automatically flow from the weakening strategy stream into the strong modules; in a headwind it contracts, in a tailwind it adds more. The drawdown guardrails are dynamic. There’s a live-trading entry point on the homepage.
38
·
--
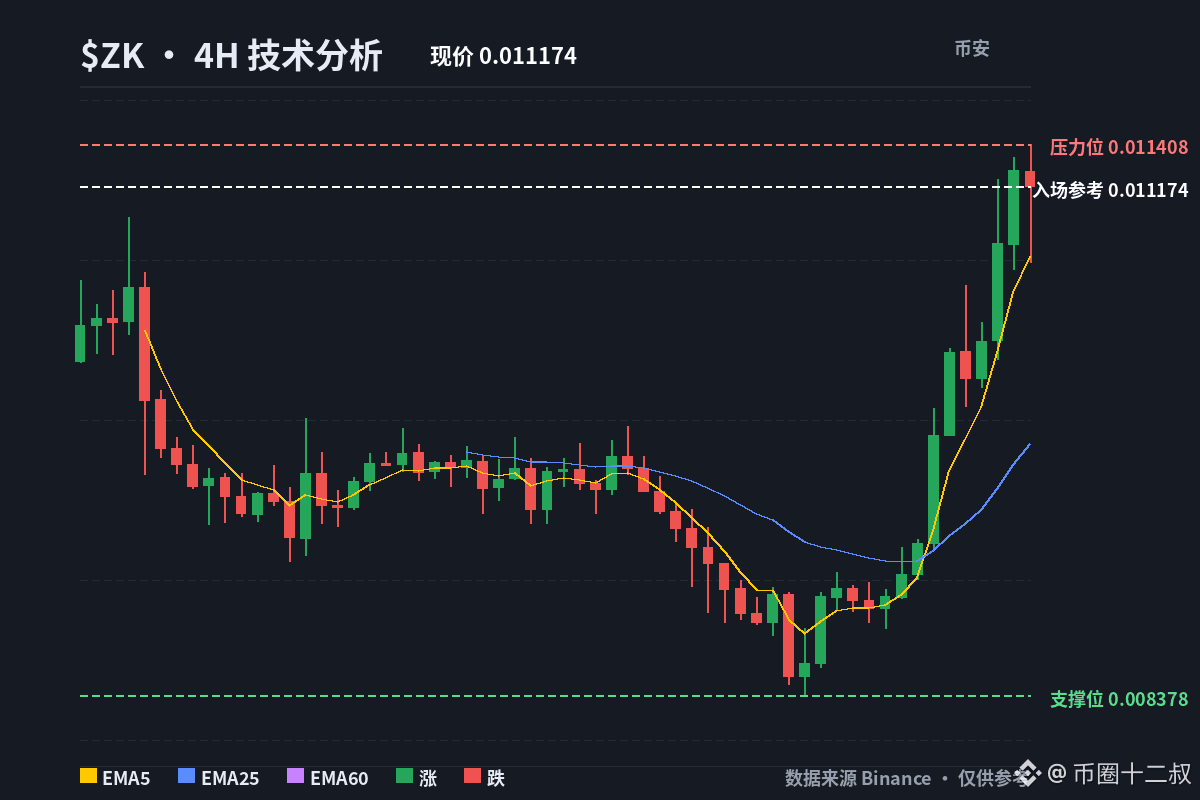
I thought yesterday's range midpoint would act as a pivot, but price sliced through it and found interest near the opposite boundary. Lesson: midpoint reactions can mislead when liquidity sits elsewhere. My next step: map the edges first, then judge the center. $ARB $ZK $STRK there are also several small gains/small losses
When a black swan arrives, a single strategy gets blown up instantly. I use a diversified approach, keeping leverage within 2x on equity, holding core positions through the cycle, and the homepage can sync with live trading.
I thought yesterday's range midpoint would act as a pivot, but price sliced through it and found interest near the opposite boundary. Lesson: midpoint reactions can mislead when liquidity sits elsewhere. My next step: map the edges first, then judge the center. $ARB $ZK $STRK there are also several small gains/small losses
When a black swan arrives, a single strategy gets blown up instantly. I use a diversified approach, keeping leverage within 2x on equity, holding core positions through the cycle, and the homepage can sync with live trading.
When a black swan arrives, a single strategy gets blown up instantly. I use a diversified approach, keeping leverage within 2x on equity, holding core positions through the cycle, and the homepage can sync with live trading.
133
·
--
Today, the biggest expected volatility on my watchlist is in small caps—no need to count on the MAG7.
$MU : watching 990 to 1020; EM is at $34.
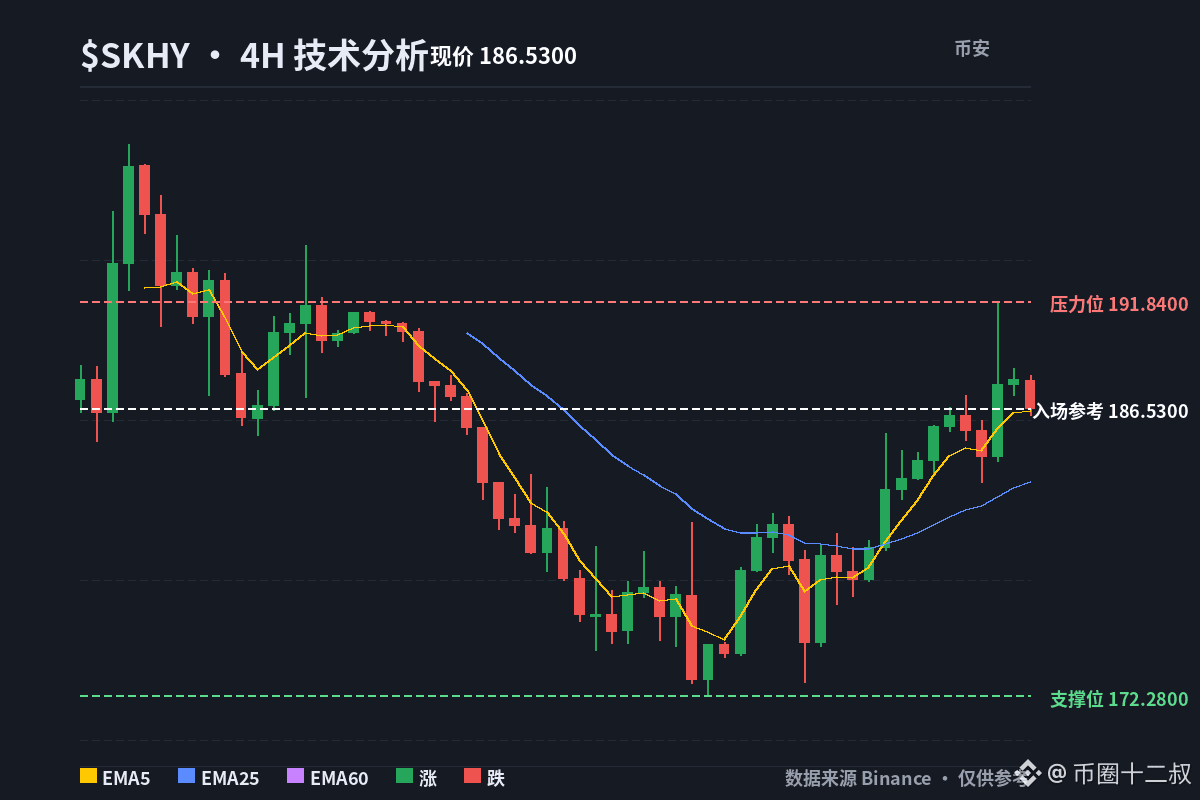
There are also several small-cap stocks in the 147 to 160 range. The line from $SKHY 200 must be defended, while $SNDK is looking for a breakout from 1600 to 1700.
Chasing gains and cutting losses, or trading based on rumors and headlines, is too easy to get trapped by liquidity. I only trade when my quantitative system signals trigger—not FOMO. If you want to sync up with my live trading, go to my profile.
Today, the biggest expected volatility on my watchlist is in small caps—no need to count on the MAG7.
$MU : watching 990 to 1020; EM is at $34.
There are also several small-cap stocks in the 147 to 160 range. The line from $SKHY 200 must be defended, while $SNDK is looking for a breakout from 1600 to 1700.
Chasing gains and cutting losses, or trading based on rumors and headlines, is too easy to get trapped by liquidity. I only trade when my quantitative system signals trigger—not FOMO. If you want to sync up with my live trading, go to my profile.
$MU : watching 990 to 1020; EM is at $34.
There are also several small-cap stocks in the 147 to 160 range. The line from $SKHY 200 must be defended, while $SNDK is looking for a breakout from 1600 to 1700.
Chasing gains and cutting losses, or trading based on rumors and headlines, is too easy to get trapped by liquidity. I only trade when my quantitative system signals trigger—not FOMO. If you want to sync up with my live trading, go to my profile.
129
·
--
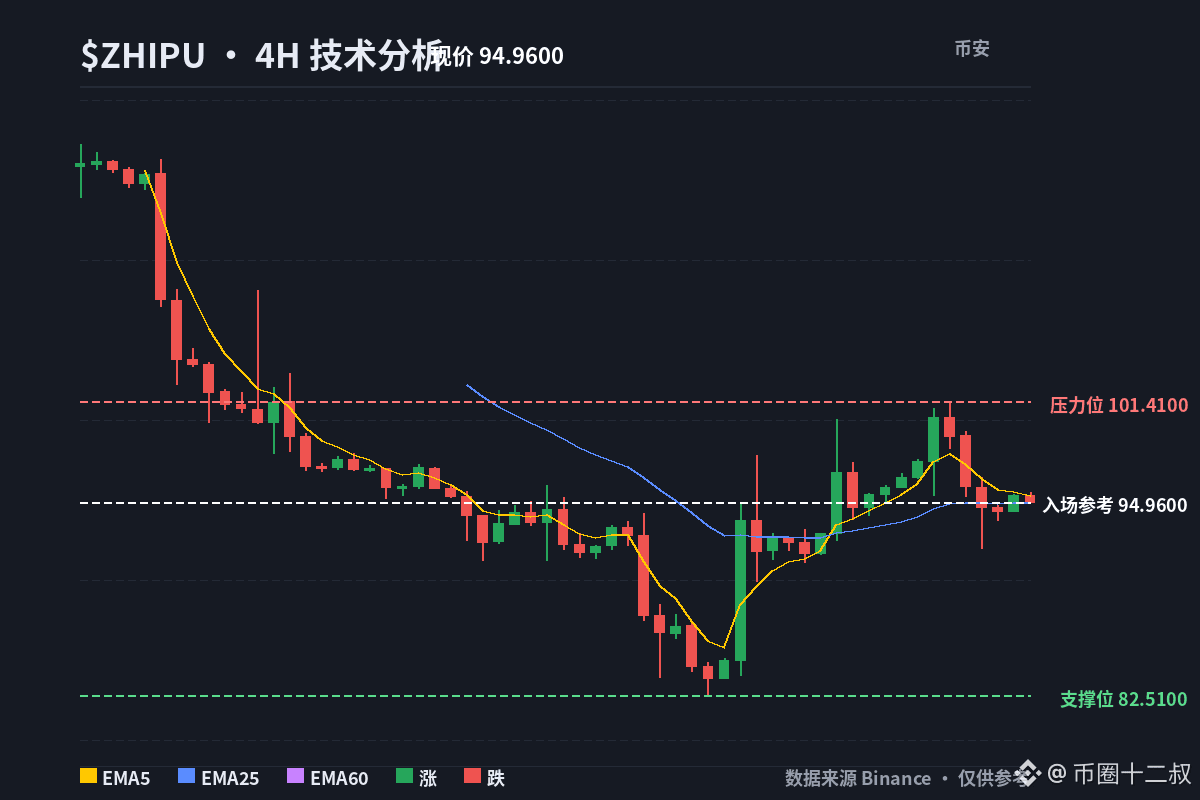
I saw on Hyperliquid that $ZHIPU briefly fell more than 9% after the close of trading in Hong Kong stocks, hitting a low of $92.045. It has since rebounded to $95.077, which is about HK$754.89.
The quantified answer is simple: disciplined execution + backtest verification + risk that stays under control. I don’t rely on luck—my system keeps watch for me. Tap the link on my profile to see the live trading.
I saw on Hyperliquid that $ZHIPU briefly fell more than 9% after the close of trading in Hong Kong stocks, hitting a low of $92.045. It has since rebounded to $95.077, which is about HK$754.89.
The quantified answer is simple: disciplined execution + backtest verification + risk that stays under control. I don’t rely on luck—my system keeps watch for me. Tap the link on my profile to see the live trading.
The quantified answer is simple: disciplined execution + backtest verification + risk that stays under control. I don’t rely on luck—my system keeps watch for me. Tap the link on my profile to see the live trading.
57
·
--
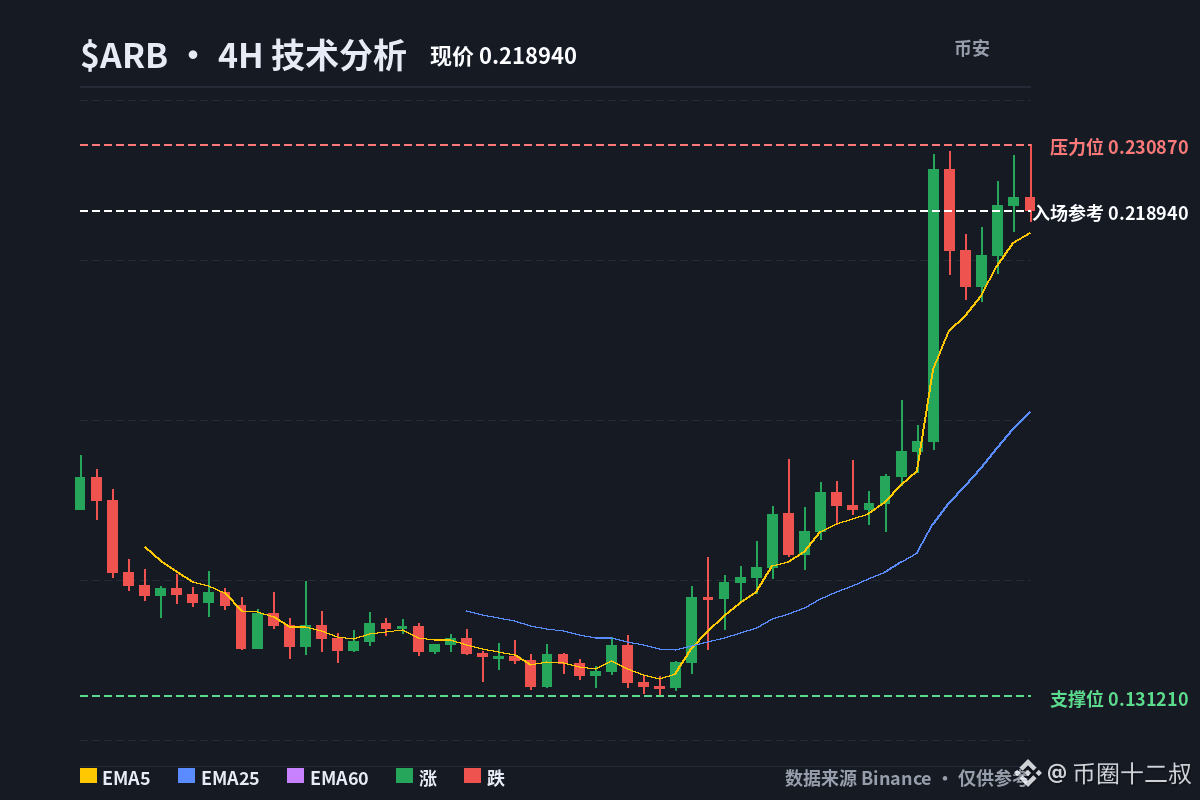
I saw $ARB ; this wave is definitely strong—directly pushing to $0.2192. A 162% gain isn’t a joke. The daily volume has also surged by more than 87%, above 836 million. Clearly, capital is moving in.
Put simply, most people in the market lose to emotions. I use a quantifiable system that’s reproducible and verifiable, turning human weaknesses into machine discipline. If you want to take shortcuts and just follow the car, go to the homepage and click a button.
I saw $ARB ; this wave is definitely strong—directly pushing to $0.2192. A 162% gain isn’t a joke. The daily volume has also surged by more than 87%, above 836 million. Clearly, capital is moving in.
Put simply, most people in the market lose to emotions. I use a quantifiable system that’s reproducible and verifiable, turning human weaknesses into machine discipline. If you want to take shortcuts and just follow the car, go to the homepage and click a button.
Put simply, most people in the market lose to emotions. I use a quantifiable system that’s reproducible and verifiable, turning human weaknesses into machine discipline. If you want to take shortcuts and just follow the car, go to the homepage and click a button.
79
·
--
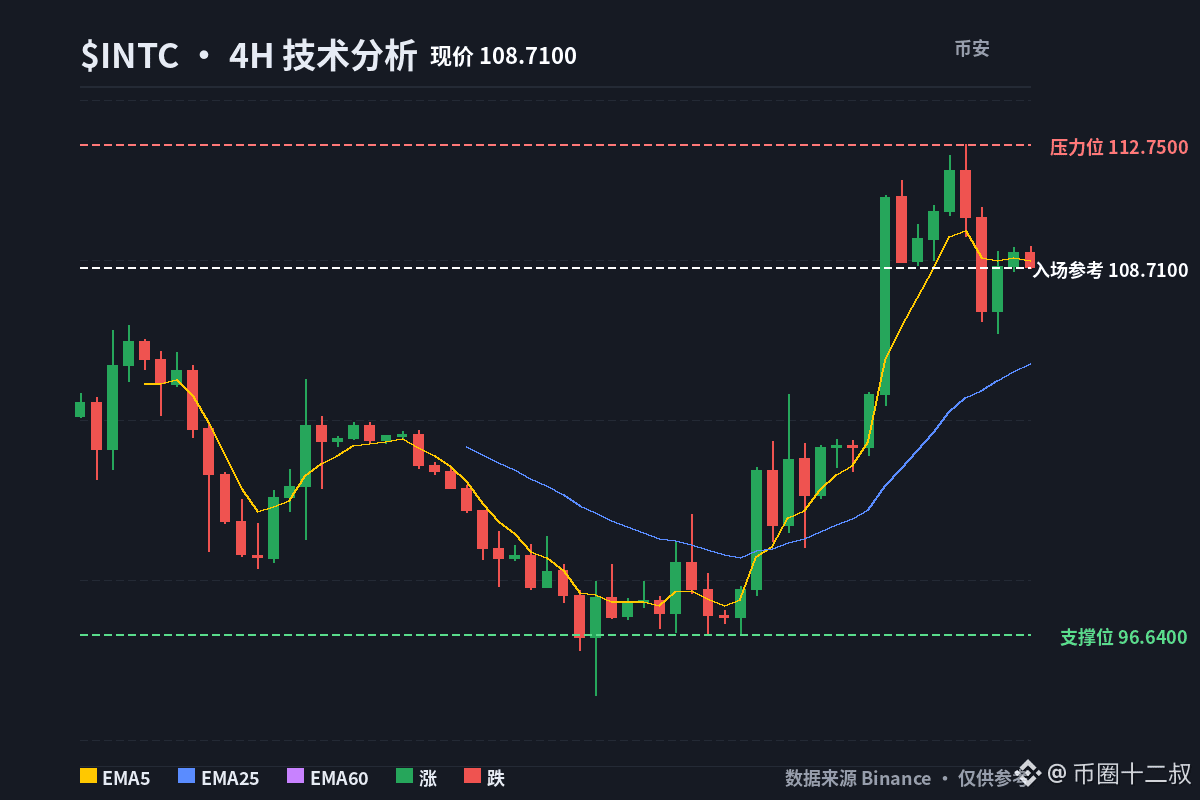
$INTC two days chart update, currently in the process of backtesting the breakout level.
The market is always changing; trends alternate between range and one-way moves, and black swan events keep coming in turn. A multi-strategy matrix ensures that each type of market has a corresponding playbook. Check the live trades by following along on the homepage.
$INTC two days chart update, currently in the process of backtesting the breakout level.
The market is always changing; trends alternate between range and one-way moves, and black swan events keep coming in turn. A multi-strategy matrix ensures that each type of market has a corresponding playbook. Check the live trades by following along on the homepage.
The market is always changing; trends alternate between range and one-way moves, and black swan events keep coming in turn. A multi-strategy matrix ensures that each type of market has a corresponding playbook. Check the live trades by following along on the homepage.
16
·
--
I didn't even realize that $STRK had risen by 100% within two days.
Not cutting losses while holding positions is the culprit behind turning small losses into bigger ones. I keep each position at ≤2% per product and strictly set stop-losses. My risk control is fully automated, and you can see the live trading run method on the homepage.
I didn't even realize that $STRK had risen by 100% within two days.
Not cutting losses while holding positions is the culprit behind turning small losses into bigger ones. I keep each position at ≤2% per product and strictly set stop-losses. My risk control is fully automated, and you can see the live trading run method on the homepage.
Not cutting losses while holding positions is the culprit behind turning small losses into bigger ones. I keep each position at ≤2% per product and strictly set stop-losses. My risk control is fully automated, and you can see the live trading run method on the homepage.
45
·
--
Yesterday when the FOMC came out, I checked the opportunities to bottom-fish with short-term 2X positions.
$INTW “wafer” narrative rotated back in; it has the greatest upside flexibility;
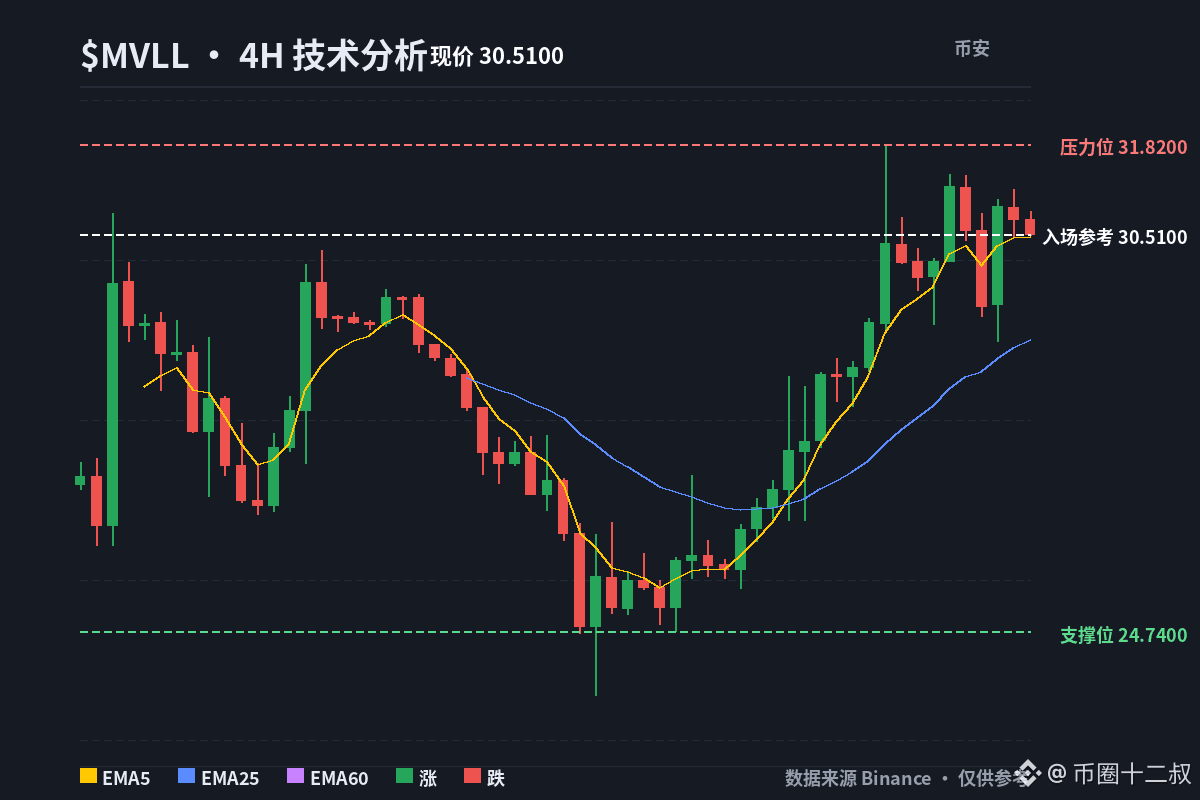
$MVLL data center chips—if they’ve truly sold off, they’ll naturally rebound;
In storage, $SNDG’s upside elasticity is even stronger than the underlying stock.
There are also several other small 2X plays moving up in sync—the sentiment in nuclear power stocks got crushed and they rebounded first, and the AI infrastructure chain that followed also rallied.
Frequent trading fees and slippage quietly eat away at the principal. I use a rolling, systematic rebalancing—adding on strength and trimming on contraction—while dynamically weighting the capital allocation based on recent performance. Go to my profile to see the live trades.
Yesterday when the FOMC came out, I checked the opportunities to bottom-fish with short-term 2X positions.
$INTW “wafer” narrative rotated back in; it has the greatest upside flexibility;
$MVLL data center chips—if they’ve truly sold off, they’ll naturally rebound;
In storage, $SNDG’s upside elasticity is even stronger than the underlying stock.
There are also several other small 2X plays moving up in sync—the sentiment in nuclear power stocks got crushed and they rebounded first, and the AI infrastructure chain that followed also rallied.
Frequent trading fees and slippage quietly eat away at the principal. I use a rolling, systematic rebalancing—adding on strength and trimming on contraction—while dynamically weighting the capital allocation based on recent performance. Go to my profile to see the live trades.
$INTW “wafer” narrative rotated back in; it has the greatest upside flexibility;
$MVLL data center chips—if they’ve truly sold off, they’ll naturally rebound;
In storage, $SNDG’s upside elasticity is even stronger than the underlying stock.
There are also several other small 2X plays moving up in sync—the sentiment in nuclear power stocks got crushed and they rebounded first, and the AI infrastructure chain that followed also rallied.
Frequent trading fees and slippage quietly eat away at the principal. I use a rolling, systematic rebalancing—adding on strength and trimming on contraction—while dynamically weighting the capital allocation based on recent performance. Go to my profile to see the live trades.
41
·
--
Brothers, yesterday’s closing report: Total profit/loss +$59.65, 100% win rate, 48 trades all winners. Public domain: +$35.61; US stock strategy: +$26.46—absolutely ruthless; altcoins: +$6.83; Feishu: +$2.32. Private domain: +$10.37; US stocks: +$7.12; altcoins: +$3.25; Feishu: 0. Signals: +$13.67; US stocks: +$7.93; altcoins: +$4.30; Feishu: +$1.44. The most satisfying one was $MSTR +$17.68—force_exit got me out; the mindset is to hold steadily. $ETH +$2.17, and $SOL +$2.14—most satisfying: stop-loss without hesitation. Don’t be afraid—just go for it. Today, keep chasing the upside. 👍😂😅
#每日战报 #十二叔 #make_money
Explain the complicated market clearly so everyone can understand it and make their own decisions
Click my profile to follow trades now
https://www.binance.com/zh-CN/copy-trading/lead-details/5051200019981811968
Brothers, yesterday’s closing report: Total profit/loss +$59.65, 100% win rate, 48 trades all winners. Public domain: +$35.61; US stock strategy: +$26.46—absolutely ruthless; altcoins: +$6.83; Feishu: +$2.32. Private domain: +$10.37; US stocks: +$7.12; altcoins: +$3.25; Feishu: 0. Signals: +$13.67; US stocks: +$7.93; altcoins: +$4.30; Feishu: +$1.44. The most satisfying one was $MSTR +$17.68—force_exit got me out; the mindset is to hold steadily. $ETH +$2.17, and $SOL +$2.14—most satisfying: stop-loss without hesitation. Don’t be afraid—just go for it. Today, keep chasing the upside. 👍😂😅
#每日战报 #十二叔 #make_money
Explain the complicated market clearly so everyone can understand it and make their own decisions
Click my profile to follow trades now
https://www.binance.com/zh-CN/copy-trading/lead-details/5051200019981811968
#每日战报 #十二叔 #make_money
Explain the complicated market clearly so everyone can understand it and make their own decisions
Click my profile to follow trades now
https://www.binance.com/zh-CN/copy-trading/lead-details/5051200019981811968
3
·
--
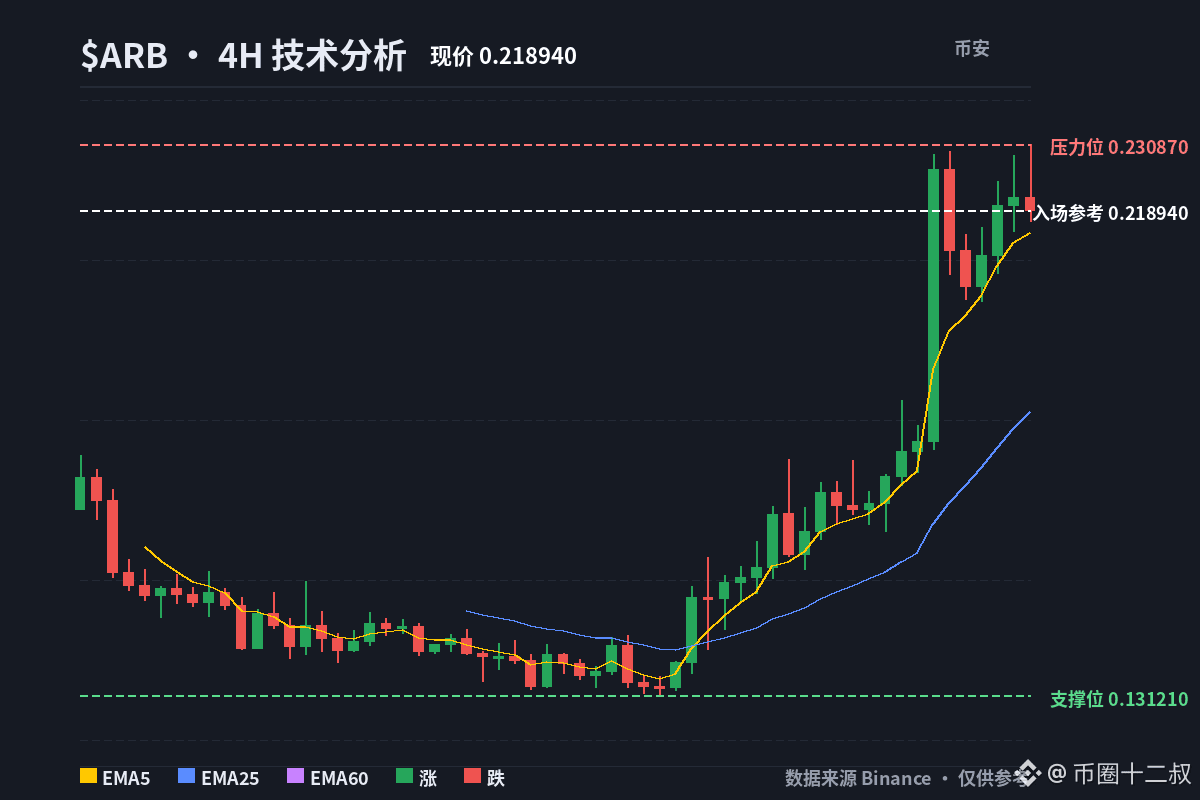
I’m seeing $ARB, this wave is really something—straight up surged 162%. Now the price is $0.2192.
In the past 24 hours, trading volume hit 836 million, up more than 87%. Market cap is 1.47 billion, up over 23%. FDV has surged to 2.17 billion—this liquidity is definitely strong.
Most retail investors lose money not because they can’t call it right, but because they can’t control their hands. My system—this setup has been backtested, with stop-loss fully automated—watches the market 24/7, never misses a trade. If you want to check it out, go see my profile.
I’m seeing $ARB , this wave is really something—straight up surged 162%. Now the price is $0.2192.
In the past 24 hours, trading volume hit 836 million, up more than 87%. Market cap is 1.47 billion, up over 23%. FDV has surged to 2.17 billion—this liquidity is definitely strong.
Most retail investors lose money not because they can’t call it right, but because they can’t control their hands. My system—this setup has been backtested, with stop-loss fully automated—watches the market 24/7, never misses a trade. If you want to check it out, go see my profile.
In the past 24 hours, trading volume hit 836 million, up more than 87%. Market cap is 1.47 billion, up over 23%. FDV has surged to 2.17 billion—this liquidity is definitely strong.
Most retail investors lose money not because they can’t call it right, but because they can’t control their hands. My system—this setup has been backtested, with stop-loss fully automated—watches the market 24/7, never misses a trade. If you want to check it out, go see my profile.
1
·
--
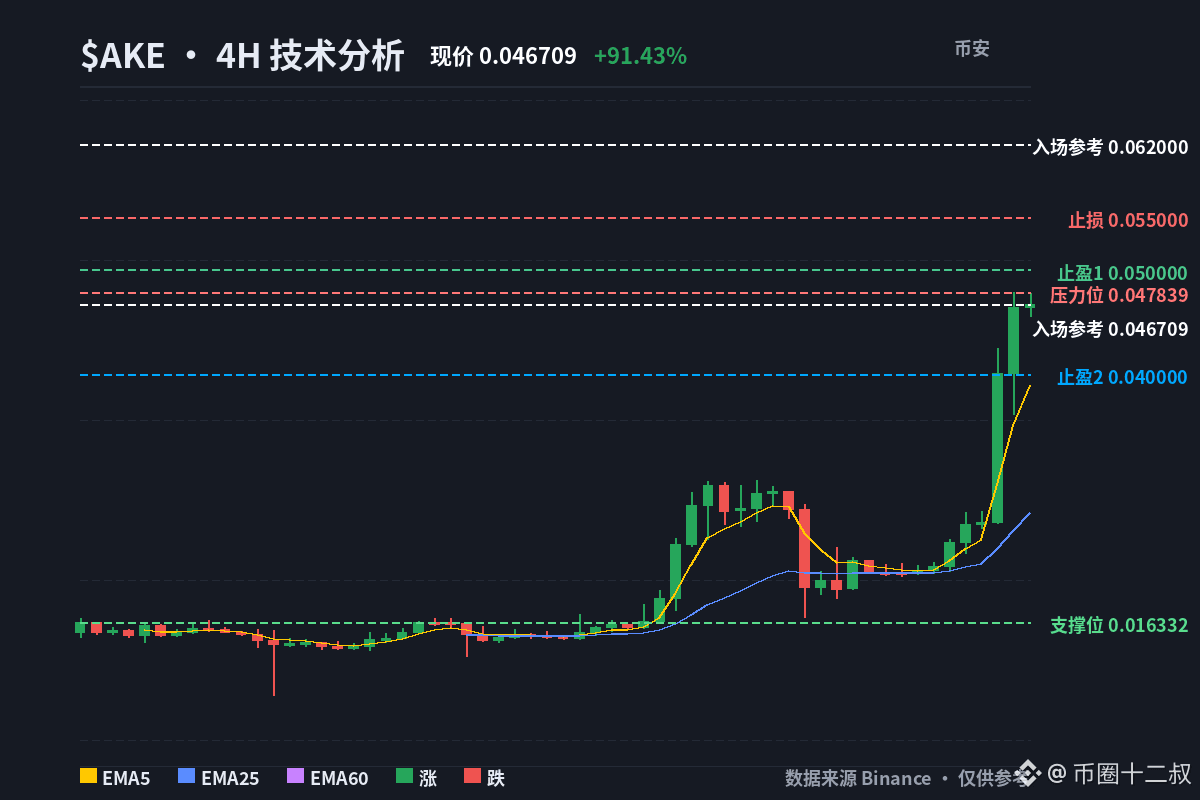
It feels great to chase the highs in the first hour; when the pullback comes, it’s a crematorium. $AKE 4 hours RSI shot straight up to 92.6, and the 7th daily RSI also hit 83. At this level, if there’s no pullback and it still goes limit-up, the chips waiting on the sidelines to get smashed are far more than the amount that can realistically be absorbed.
Positions first: the long/short ratio on the account is 0.8423, slightly bearish. Big holders are 0.7782, slightly bullish. Retail traders are betting on a pullback, while big holders are betting on squeezing shorts. But the 24h funding rate is +0.0300%—the longs are paying the protection fee. This isn’t the cost for new longs to enter; it’s the cushion old longs are holding profits with. OI is 130 million, market cap is 1 billion, leverage is maxed out—once the direction flips, it’s going to trigger a cascade.
In the 4-hour chart, long positioning is diverging (EMA5/25/60), and the price of 0.040096 is far above the moving averages. The daily chart is the same: the trend is there, but the location is already gone. I’m not buying longs at this point, and I’m not shorting at the rebound top.
That $AKE is stronger than BTC is true (BTC 24h +6.47%, it +91.43%), but this kind of strength is a “borrowed” kind—when the tide goes out, nobody will prop it up.
Wait until it rebounds to 0.062, then after it faces resistance, participate in the short.
📊 Direction: Short
💰 Entry reference: After the rebound to 0.062 and it meets resistance
🛑 Stop loss: 0.055—if it holds above, admit I’m wrong and exit
🎯 Take profit 1: 0.05 (near the 4h EMA5)
🎯 Take profit 2: 0.04 (the prior high retest level)
If it breaks below 0.055, back down. If it holds above 0.062, then go ahead and scold me for not having seen the world.
When you see RSI top out and reverse, or when it goes back up
$AKE #技术分析 #Uncle Twelve
Click my homepage to copy trade immediately
https://www.binance.com/zh-CN/copy-trading/lead-details/5051200019981811968
It feels great to chase the highs in the first hour; when the pullback comes, it’s a crematorium. $AKE 4 hours RSI shot straight up to 92.6, and the 7th daily RSI also hit 83. At this level, if there’s no pullback and it still goes limit-up, the chips waiting on the sidelines to get smashed are far more than the amount that can realistically be absorbed.
Positions first: the long/short ratio on the account is 0.8423, slightly bearish. Big holders are 0.7782, slightly bullish. Retail traders are betting on a pullback, while big holders are betting on squeezing shorts. But the 24h funding rate is +0.0300%—the longs are paying the protection fee. This isn’t the cost for new longs to enter; it’s the cushion old longs are holding profits with. OI is 130 million, market cap is 1 billion, leverage is maxed out—once the direction flips, it’s going to trigger a cascade.
In the 4-hour chart, long positioning is diverging (EMA5/25/60), and the price of 0.040096 is far above the moving averages. The daily chart is the same: the trend is there, but the location is already gone. I’m not buying longs at this point, and I’m not shorting at the rebound top.
That $AKE is stronger than BTC is true (BTC 24h +6.47%, it +91.43%), but this kind of strength is a “borrowed” kind—when the tide goes out, nobody will prop it up.
Wait until it rebounds to 0.062, then after it faces resistance, participate in the short.
📊 Direction: Short
💰 Entry reference: After the rebound to 0.062 and it meets resistance
🛑 Stop loss: 0.055—if it holds above, admit I’m wrong and exit
🎯 Take profit 1: 0.05 (near the 4h EMA5)
🎯 Take profit 2: 0.04 (the prior high retest level)
If it breaks below 0.055, back down. If it holds above 0.062, then go ahead and scold me for not having seen the world.
When you see RSI top out and reverse, or when it goes back up
$AKE #技术分析 #Uncle Twelve
Click my homepage to copy trade immediately
https://www.binance.com/zh-CN/copy-trading/lead-details/5051200019981811968
Positions first: the long/short ratio on the account is 0.8423, slightly bearish. Big holders are 0.7782, slightly bullish. Retail traders are betting on a pullback, while big holders are betting on squeezing shorts. But the 24h funding rate is +0.0300%—the longs are paying the protection fee. This isn’t the cost for new longs to enter; it’s the cushion old longs are holding profits with. OI is 130 million, market cap is 1 billion, leverage is maxed out—once the direction flips, it’s going to trigger a cascade.
In the 4-hour chart, long positioning is diverging (EMA5/25/60), and the price of 0.040096 is far above the moving averages. The daily chart is the same: the trend is there, but the location is already gone. I’m not buying longs at this point, and I’m not shorting at the rebound top.
That $AKE is stronger than BTC is true (BTC 24h +6.47%, it +91.43%), but this kind of strength is a “borrowed” kind—when the tide goes out, nobody will prop it up.
Wait until it rebounds to 0.062, then after it faces resistance, participate in the short.
📊 Direction: Short
💰 Entry reference: After the rebound to 0.062 and it meets resistance
🛑 Stop loss: 0.055—if it holds above, admit I’m wrong and exit
🎯 Take profit 1: 0.05 (near the 4h EMA5)
🎯 Take profit 2: 0.04 (the prior high retest level)
If it breaks below 0.055, back down. If it holds above 0.062, then go ahead and scold me for not having seen the world.
When you see RSI top out and reverse, or when it goes back up
$AKE #技术分析 #Uncle Twelve
Click my homepage to copy trade immediately
https://www.binance.com/zh-CN/copy-trading/lead-details/5051200019981811968
1
279
·
--
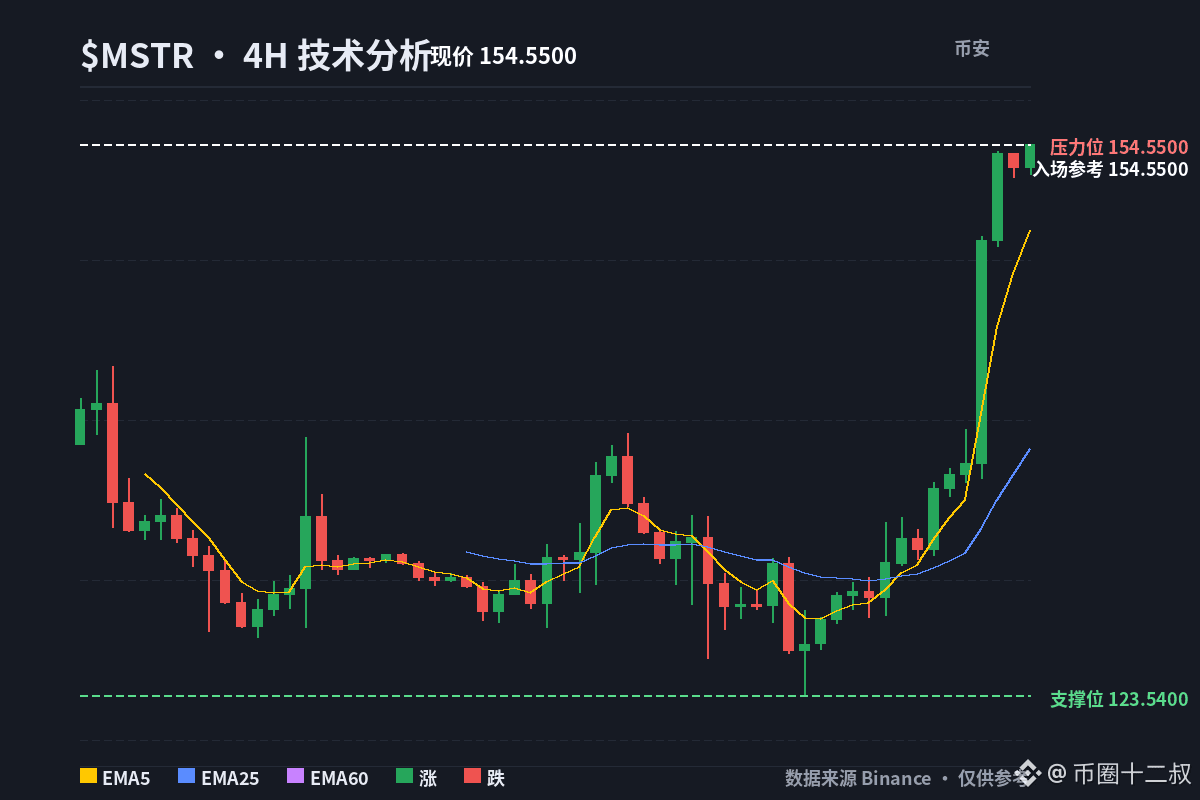
I already expected there would be a washout (check my earlier tweets), but I didn’t expect it to be this brutal.
Now that this two-week period of weakness is over, hopefully the rest will be calm and smooth 🤞
Most retail traders lose money not because they can’t call it correctly, but because they can’t control their hands. I’ve backtested this strategy, and it has fully automated stop-loss—my 7×24 system keeps watching the market without missing any orders. If you want to see it, you can go to my profile to check it out.
I already expected there would be a washout (check my earlier tweets), but I didn’t expect it to be this brutal.
Now that this two-week period of weakness is over, hopefully the rest will be calm and smooth 🤞
Most retail traders lose money not because they can’t call it correctly, but because they can’t control their hands. I’ve backtested this strategy, and it has fully automated stop-loss—my 7×24 system keeps watching the market without missing any orders. If you want to see it, you can go to my profile to check it out.
Now that this two-week period of weakness is over, hopefully the rest will be calm and smooth 🤞
Most retail traders lose money not because they can’t call it correctly, but because they can’t control their hands. I’ve backtested this strategy, and it has fully automated stop-loss—my 7×24 system keeps watching the market without missing any orders. If you want to see it, you can go to my profile to check it out.
11
·
--
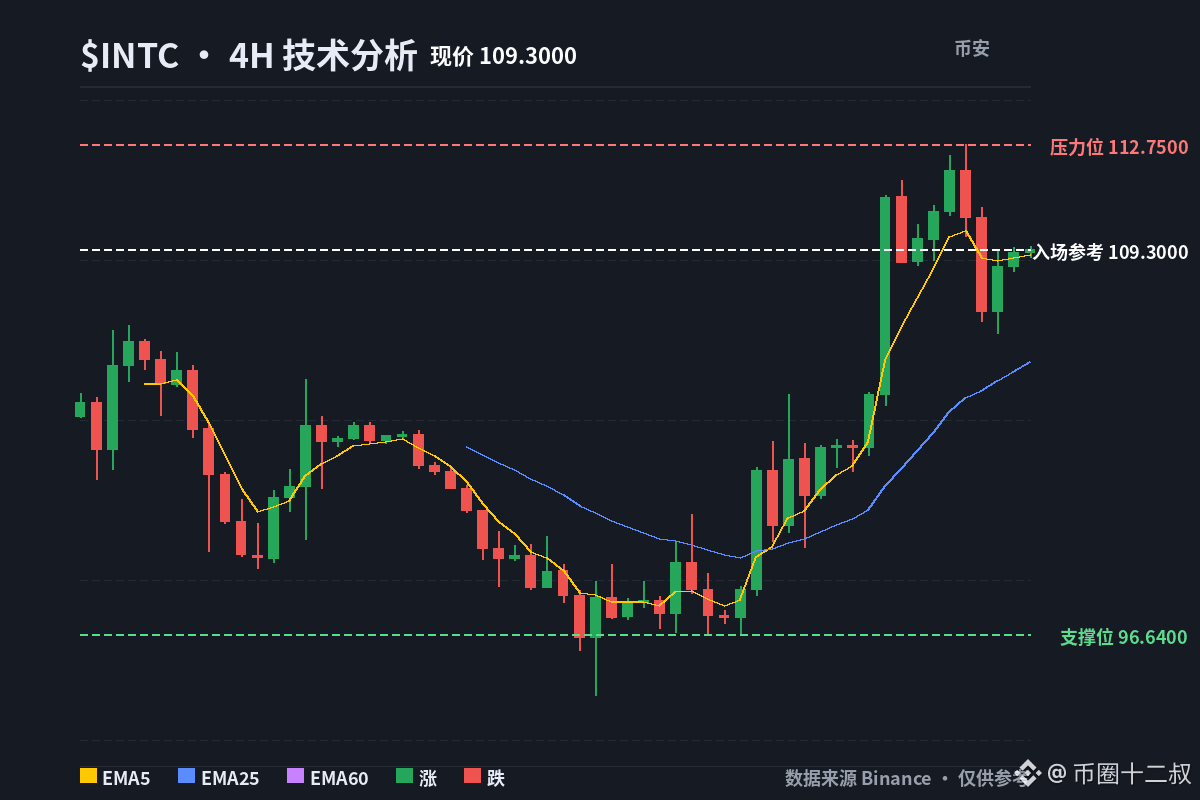
$INTC This 108 dollars is a solid hard support. If we pull back to this area, I think it’s worth considering taking a position.
Most retail traders lose money not because they can’t predict—it’s because they can’t control their hands. This system of mine has been backtested, with stop-loss fully automatic. I’m monitoring the market 24/7 without missing any orders. If you want, go check my homepage to view it together.
$INTC This 108 dollars is a solid hard support. If we pull back to this area, I think it’s worth considering taking a position.
Most retail traders lose money not because they can’t predict—it’s because they can’t control their hands. This system of mine has been backtested, with stop-loss fully automatic. I’m monitoring the market 24/7 without missing any orders. If you want, go check my homepage to view it together.
Most retail traders lose money not because they can’t predict—it’s because they can’t control their hands. This system of mine has been backtested, with stop-loss fully automatic. I’m monitoring the market 24/7 without missing any orders. If you want, go check my homepage to view it together.
1
·
--
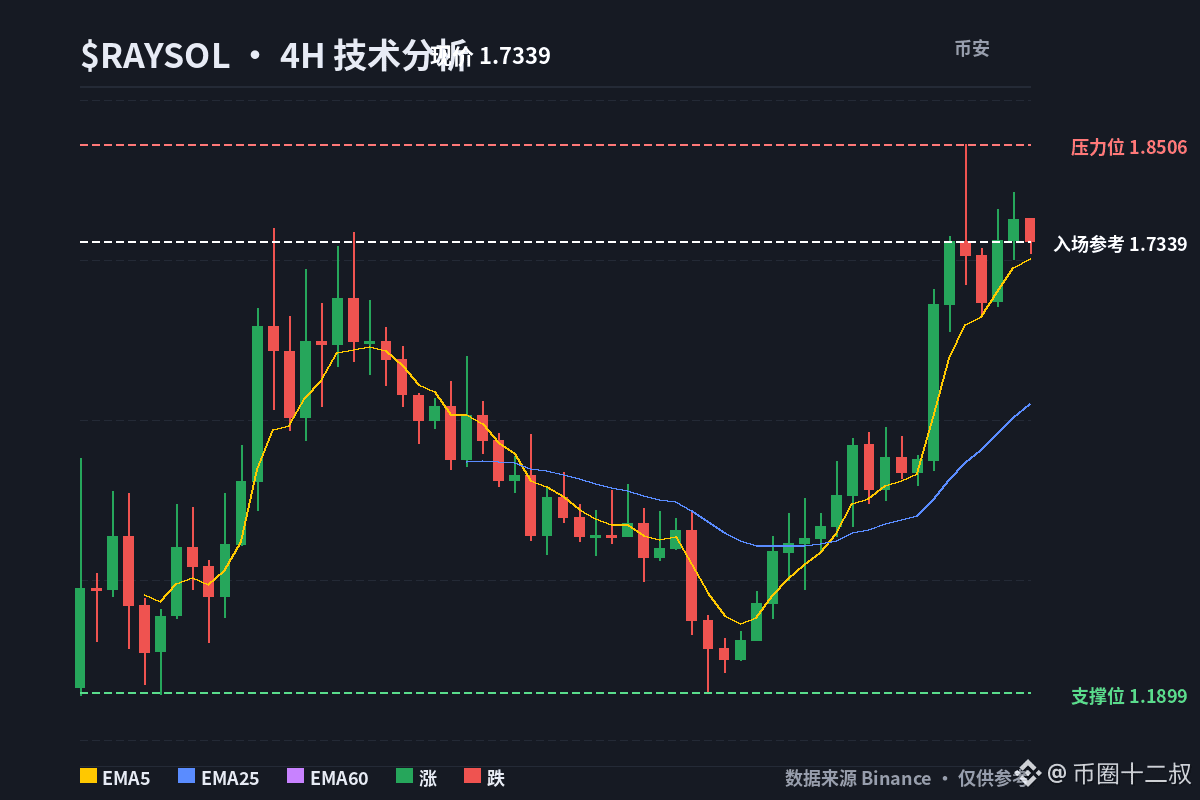
$RAYSOL This position is quite critical. The support levels I marked on my chart have already been tested multiple times.
Now the price has returned to the vicinity of the previous high, around $1.75. If it can hold firmly at this level, the next target is above $2.
NFA.
Frequent trading fees and slippage quietly erode the principal. My system continuously rolls the portfolio and adjusts by adding on strength and reducing on contraction; the capital allocation is dynamically weighted based on recent performance. Check the live trading on my profile.
$RAYSOL This position is quite critical. The support levels I marked on my chart have already been tested multiple times.
Now the price has returned to the vicinity of the previous high, around $1.75. If it can hold firmly at this level, the next target is above $2.
NFA.
Frequent trading fees and slippage quietly erode the principal. My system continuously rolls the portfolio and adjusts by adding on strength and reducing on contraction; the capital allocation is dynamically weighted based on recent performance. Check the live trading on my profile.
Now the price has returned to the vicinity of the previous high, around $1.75. If it can hold firmly at this level, the next target is above $2.
NFA.
Frequent trading fees and slippage quietly erode the principal. My system continuously rolls the portfolio and adjusts by adding on strength and reducing on contraction; the capital allocation is dynamically weighted based on recent performance. Check the live trading on my profile.
78
·
--
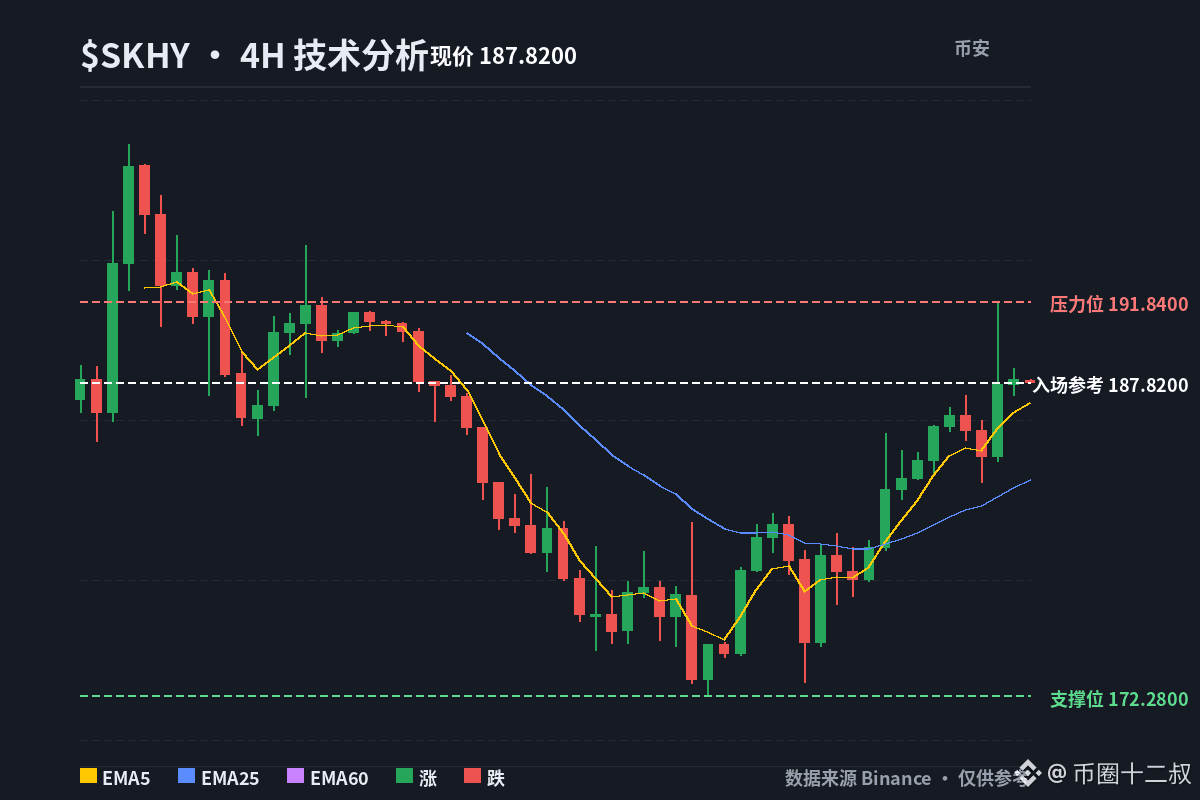
I’m watching the trend of $SKHY , and it feels like the buyers are a bit hesitant—the price hasn’t really been tightened, and the breakout strength isn’t strong enough.
Volatility is still there, and the key breakout level hasn’t been tested. I think we need to keep an eye on it.
My view is to wait for a tightening signal.
Instead of staring at the chart and burning the midnight oil guessing the direction, it’s better to see how my quant matrix automatically rebalances—go short when it’s time to short. There’s a follow-trade entry on the homepage—made for lazy folks.
I’m watching the trend of $SKHY , and it feels like the buyers are a bit hesitant—the price hasn’t really been tightened, and the breakout strength isn’t strong enough.
Volatility is still there, and the key breakout level hasn’t been tested. I think we need to keep an eye on it.
My view is to wait for a tightening signal.
Instead of staring at the chart and burning the midnight oil guessing the direction, it’s better to see how my quant matrix automatically rebalances—go short when it’s time to short. There’s a follow-trade entry on the homepage—made for lazy folks.
Volatility is still there, and the key breakout level hasn’t been tested. I think we need to keep an eye on it.
My view is to wait for a tightening signal.
Instead of staring at the chart and burning the midnight oil guessing the direction, it’s better to see how my quant matrix automatically rebalances—go short when it’s time to short. There’s a follow-trade entry on the homepage—made for lazy folks.
89
·
--
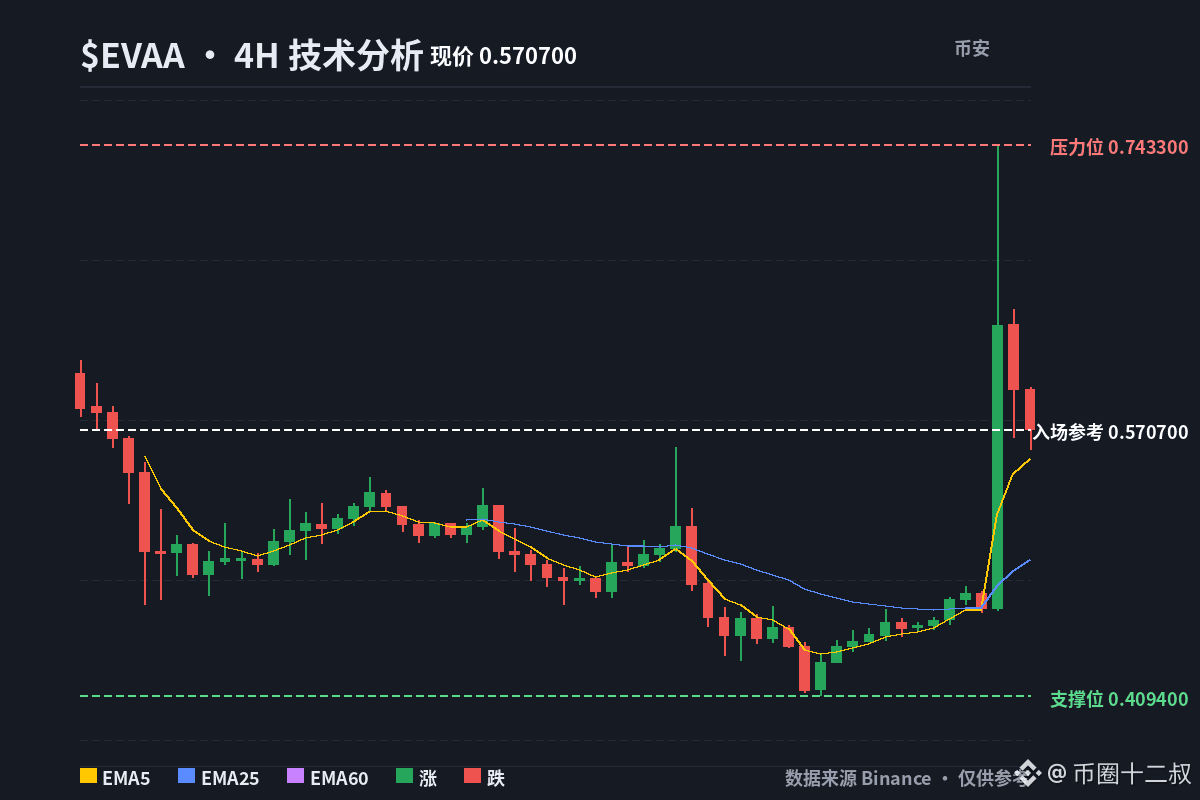
$EVAA 1 hourly level, current price 0.6572, just broke through the structure.
The previous candle didn’t manage to hold the moving average, but this one directly crosses EMA144/169/233. Volume is 181.11x the average volume, with double confirmation.
The probability of continuation looks like it’s moving up, but I don’t know whether it can hold up afterward.
My plan is bullish: enter long at 0.65720–0.65917, stop loss at 0.47729. Targets: first 0.92954, then 1.1104.
The “leader trading method” is: if potential >95 then start going long. “Slaying the dragon” is: if momentum/heat is overheated, then go short—every rule is clear and straightforward, no guessing based on impulse. If you want to follow, go to my profile.
$EVAA 1 hourly level, current price 0.6572, just broke through the structure.
The previous candle didn’t manage to hold the moving average, but this one directly crosses EMA144/169/233. Volume is 181.11x the average volume, with double confirmation.
The probability of continuation looks like it’s moving up, but I don’t know whether it can hold up afterward.
My plan is bullish: enter long at 0.65720–0.65917, stop loss at 0.47729. Targets: first 0.92954, then 1.1104.
The “leader trading method” is: if potential >95 then start going long. “Slaying the dragon” is: if momentum/heat is overheated, then go short—every rule is clear and straightforward, no guessing based on impulse. If you want to follow, go to my profile.
The previous candle didn’t manage to hold the moving average, but this one directly crosses EMA144/169/233. Volume is 181.11x the average volume, with double confirmation.
The probability of continuation looks like it’s moving up, but I don’t know whether it can hold up afterward.
My plan is bullish: enter long at 0.65720–0.65917, stop loss at 0.47729. Targets: first 0.92954, then 1.1104.
The “leader trading method” is: if potential >95 then start going long. “Slaying the dragon” is: if momentum/heat is overheated, then go short—every rule is clear and straightforward, no guessing based on impulse. If you want to follow, go to my profile.
4
·
--
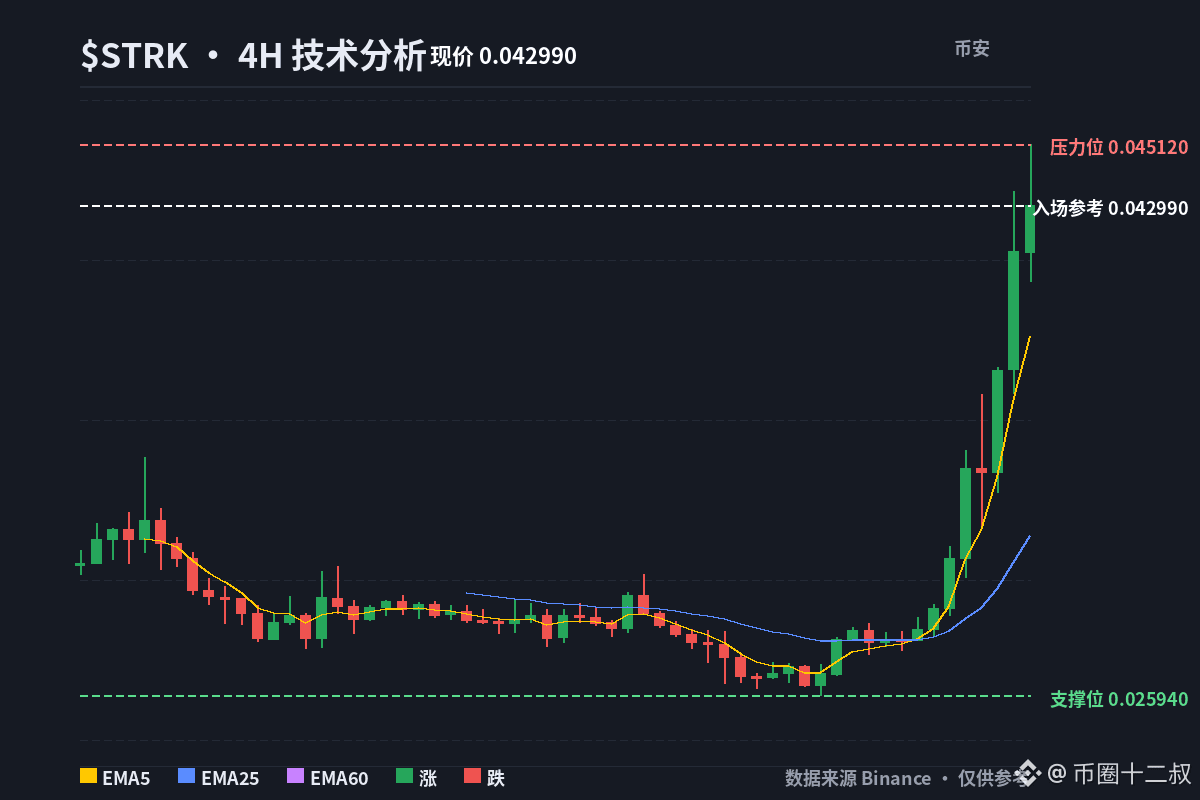
$STRK Why has there been a big surge over the past two days?
I took a look—Starknet’s new staking program has already gone live. Basically, it’s rewards that “lure” people into locking their tokens.
The more people lock them, the fewer liquid tokens there are in the market. On top of that, the ecosystem’s momentum is also heating up, so naturally the price has the push to move upward.
Frequent trading fees and slippage quietly erode the principal. I use a rolling system to rebalance, add on in the right places, and dynamically adjust the funding allocation based on recent performance. Go check the live trading on the homepage.
$STRK Why has there been a big surge over the past two days?
I took a look—Starknet’s new staking program has already gone live. Basically, it’s rewards that “lure” people into locking their tokens.
The more people lock them, the fewer liquid tokens there are in the market. On top of that, the ecosystem’s momentum is also heating up, so naturally the price has the push to move upward.
Frequent trading fees and slippage quietly erode the principal. I use a rolling system to rebalance, add on in the right places, and dynamically adjust the funding allocation based on recent performance. Go check the live trading on the homepage.
I took a look—Starknet’s new staking program has already gone live. Basically, it’s rewards that “lure” people into locking their tokens.
The more people lock them, the fewer liquid tokens there are in the market. On top of that, the ecosystem’s momentum is also heating up, so naturally the price has the push to move upward.
Frequent trading fees and slippage quietly erode the principal. I use a rolling system to rebalance, add on in the right places, and dynamically adjust the funding allocation based on recent performance. Go check the live trading on the homepage.
63
Log in to explore more content
Join global crypto users on Binance Square
⚡️ Get latest and useful information about crypto.
💬 Trusted by the world’s largest crypto exchange.
👍 Discover real insights from verified creators.
Email / Phone number
Trending Topics
BTCBreaks80K
128,654 views
2,008 Discussing
$BTC
What price is BTC going to hit in 2026?
Spot is sitting at $80,748. 104 days to go
↑ $90k - 58%
↑ $100k - 24%
↓ $70k dip first - 48%
The bull case floating around the floor:
>August had a proper run from $62,275 up to $81,479 — up 31% bottom to top
>The CLARITY Act flopped its Senate cloture vote 49-50 on 15 Sept. BTC was already sliding well before the vote, touched $74,968 in that hour, and won it all back inside three days
>The Fed hiked rates on 16 Sept — first time since July 2023. Spot is currently floating 7.4% above that day's low
>The altcoins are proper outrunning it. 30-day view: SOL up 38%, XRP up 35%, ETH up 32% versus BTC up 23%
>The timeline is still packed with reasons why this ought to break down — and that’s precisely the wall of worry bull markets tend to climb
>The midterms land on 3 Nov, right smack in the middle of this market window
So, what would you put down for a punt at +24% in 104 days?
$ETH
$SOL
#BTCBreaks80K #solonapumping #ETH🔥🔥🔥🔥🔥🔥 #BullMarket📈
Wealthy bloke
·6 Likes
·5.2k views
比特币突破8万
97,591 views
274 Discussing
SOLJumpsAbout10%
993 views
70 Discussing