
goldenbit
205 Posts

goldenbit
Report
Block User
Разбираю движения цены, объём и фандинг на Binance. Показываю, что подтверждает сценарий и что его отменит. Здесь важен контекст, а не громкие прогнозы.
0 Following
32 Followers
49 Liked
Posts
All
Quotes
·
--
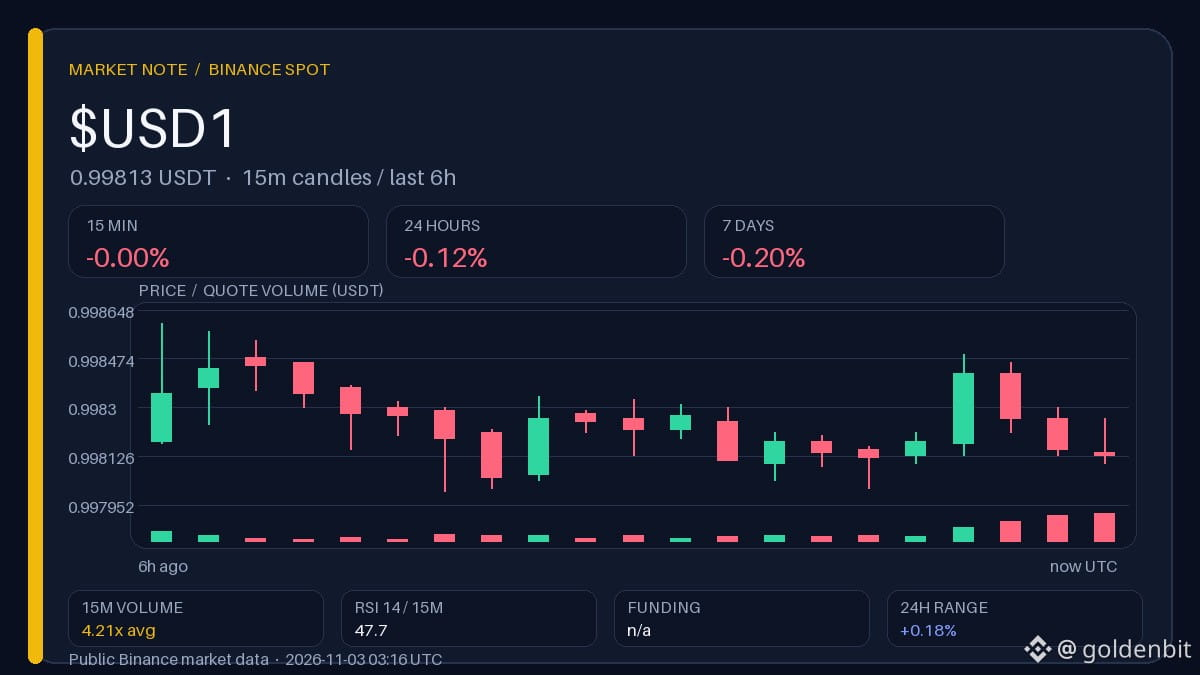
$USD1: volume quadrupled, but the price barely moved
Such a sharp increase in volume alongside an almost unchanged price points more to stablecoin mechanics than to a new impulse. The price changed by −0.12% over 24 hours and −0.2% over the week; an RSI of 47.7 indicates neutrality, which argues against interpreting the spike as the start of a move.
Observation range · 5 h
Above 0.998600: Holding above the upper boundary of the local range while volume remains elevated would support the case for genuine demand rather than a one-off flow.
Below 0.998000: A return to the lower boundary of the range with volume unchanged would weaken the impulse hypothesis and bring the interpretation back to the pair’s usual mechanics.
These are historical levels; a single wick does not confirm the scenario.
What would need to change in the price for the volume spike to stop looking like technical noise?
Binance data, snapshot at 03:16 UTC. The author may receive rewards through Binance Square Write to Earn.
$USD1 : volume quadrupled, but the price barely moved
Such a sharp increase in volume alongside an almost unchanged price points more to stablecoin mechanics than to a new impulse. The price changed by −0.12% over 24 hours and −0.2% over the week; an RSI of 47.7 indicates neutrality, which argues against interpreting the spike as the start of a move.
Observation range · 5 h
Above 0.998600: Holding above the upper boundary of the local range while volume remains elevated would support the case for genuine demand rather than a one-off flow.
Below 0.998000: A return to the lower boundary of the range with volume unchanged would weaken the impulse hypothesis and bring the interpretation back to the pair’s usual mechanics.
These are historical levels; a single wick does not confirm the scenario.
What would need to change in the price for the volume spike to stop looking like technical noise?
Binance data, snapshot at 03:16 UTC. The author may receive rewards through Binance Square Write to Earn.
Such a sharp increase in volume alongside an almost unchanged price points more to stablecoin mechanics than to a new impulse. The price changed by −0.12% over 24 hours and −0.2% over the week; an RSI of 47.7 indicates neutrality, which argues against interpreting the spike as the start of a move.
Observation range · 5 h
Above 0.998600: Holding above the upper boundary of the local range while volume remains elevated would support the case for genuine demand rather than a one-off flow.
Below 0.998000: A return to the lower boundary of the range with volume unchanged would weaken the impulse hypothesis and bring the interpretation back to the pair’s usual mechanics.
These are historical levels; a single wick does not confirm the scenario.
What would need to change in the price for the volume spike to stop looking like technical noise?
Binance data, snapshot at 03:16 UTC. The author may receive rewards through Binance Square Write to Earn.
25
·
--
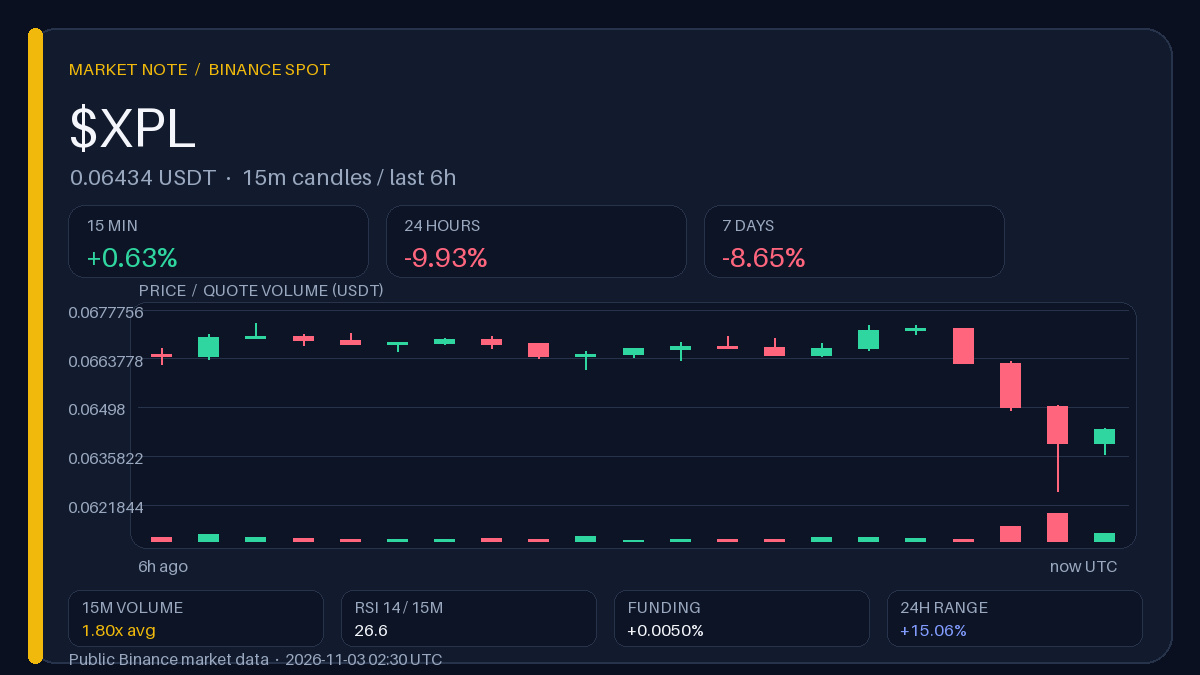
$XPL: A 15-minute bounce doesn’t erase weekly pressure
A brief gain amid losses over the past day and week is more often a pullback within weakness than a change in direction. An RSI of 26.6 on the 15-minute chart indicates oversold conditions, but volume 1.8 times above normal is not yet confirmation of a reversal.
Observation range · 5 h
Above 0.067390: Holding above the upper boundary of the local range would support the hypothesis of a shift in short-term momentum.
Below 0.062570: A return to the lower boundary of the range would confirm that the bounce was merely a pause within a longer decline.
These are historical levels; a single wick does not confirm a scenario.
↩️ Previous “Watchlist” update recap (01.11 07:30 UTC): XPL 0.074410 → 0.071400 USDT (−4.05% in 12 h), funding +0.005% → +0.005%.
What would need to change in volume for the bounce to stop looking technical?
Binance data, snapshot at 02:30 UTC. The author may receive rewards through Binance Square Write to Earn.
$XPL : A 15-minute bounce doesn’t erase weekly pressure
A brief gain amid losses over the past day and week is more often a pullback within weakness than a change in direction. An RSI of 26.6 on the 15-minute chart indicates oversold conditions, but volume 1.8 times above normal is not yet confirmation of a reversal.
Observation range · 5 h
Above 0.067390: Holding above the upper boundary of the local range would support the hypothesis of a shift in short-term momentum.
Below 0.062570: A return to the lower boundary of the range would confirm that the bounce was merely a pause within a longer decline.
These are historical levels; a single wick does not confirm a scenario.
↩️ Previous “Watchlist” update recap (01.11 07:30 UTC): XPL 0.074410 → 0.071400 USDT (−4.05% in 12 h), funding +0.005% → +0.005%.
What would need to change in volume for the bounce to stop looking technical?
Binance data, snapshot at 02:30 UTC. The author may receive rewards through Binance Square Write to Earn.
A brief gain amid losses over the past day and week is more often a pullback within weakness than a change in direction. An RSI of 26.6 on the 15-minute chart indicates oversold conditions, but volume 1.8 times above normal is not yet confirmation of a reversal.
Observation range · 5 h
Above 0.067390: Holding above the upper boundary of the local range would support the hypothesis of a shift in short-term momentum.
Below 0.062570: A return to the lower boundary of the range would confirm that the bounce was merely a pause within a longer decline.
These are historical levels; a single wick does not confirm a scenario.
↩️ Previous “Watchlist” update recap (01.11 07:30 UTC): XPL 0.074410 → 0.071400 USDT (−4.05% in 12 h), funding +0.005% → +0.005%.
What would need to change in volume for the bounce to stop looking technical?
Binance data, snapshot at 02:30 UTC. The author may receive rewards through Binance Square Write to Earn.
44
·
--
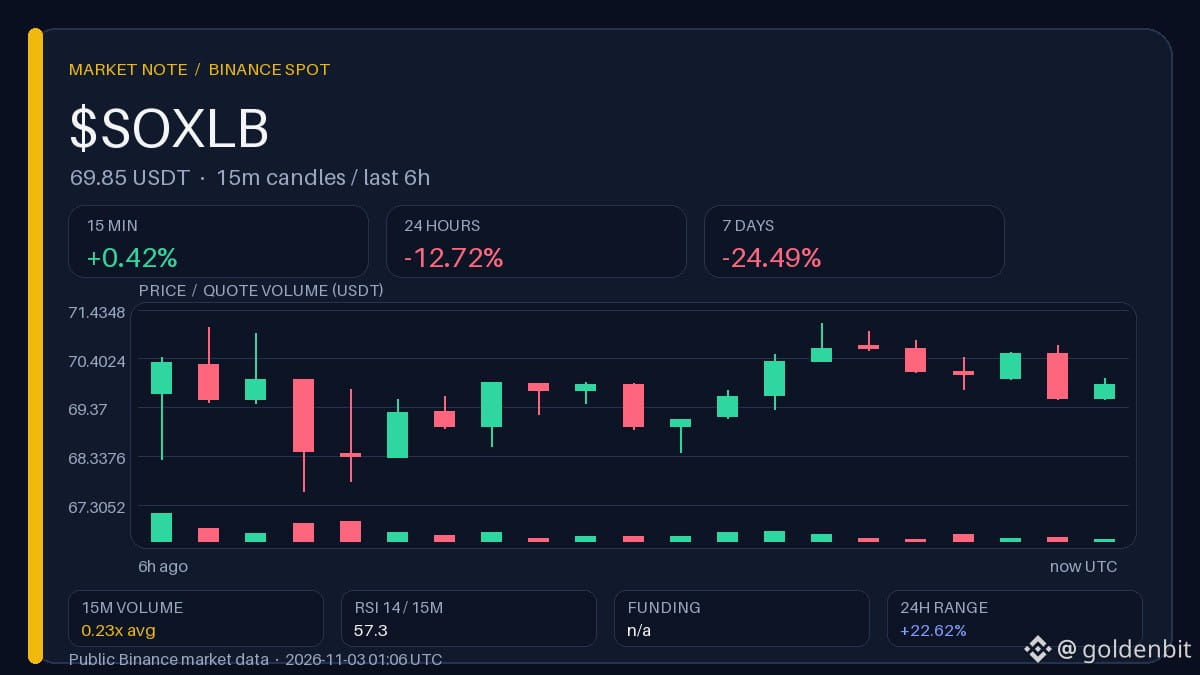
$SOXLB: up over 15 minutes, amid a 12.72% decline over 24 hours
The brief bounce looks more like a pause within a downtrend than a reversal: the week is down 24.49%. Volume on this move is weak—0.23 times normal—so the bounce has yet to be confirmed; meanwhile, the price is holding in the upper part of the local range.
Observation range · 5 h
Above 71.1500: A hold above the range’s upper boundary on healthy volume would weaken the “bounce within a downtrend” thesis.
Below 67.5900: A return to the range’s lower boundary would refocus attention on the fact that the daily and weekly trends are still down.
These are historical levels; a lone wick does not confirm a scenario.
What would need to change in volume for the short-term gain to stop looking like noise within a daily decline?
Binance data, snapshot at 01:06 UTC. The author may receive rewards through Binance Square Write to Earn.
$SOXLB : up over 15 minutes, amid a 12.72% decline over 24 hours
The brief bounce looks more like a pause within a downtrend than a reversal: the week is down 24.49%. Volume on this move is weak—0.23 times normal—so the bounce has yet to be confirmed; meanwhile, the price is holding in the upper part of the local range.
Observation range · 5 h
Above 71.1500: A hold above the range’s upper boundary on healthy volume would weaken the “bounce within a downtrend” thesis.
Below 67.5900: A return to the range’s lower boundary would refocus attention on the fact that the daily and weekly trends are still down.
These are historical levels; a lone wick does not confirm a scenario.
What would need to change in volume for the short-term gain to stop looking like noise within a daily decline?
Binance data, snapshot at 01:06 UTC. The author may receive rewards through Binance Square Write to Earn.
The brief bounce looks more like a pause within a downtrend than a reversal: the week is down 24.49%. Volume on this move is weak—0.23 times normal—so the bounce has yet to be confirmed; meanwhile, the price is holding in the upper part of the local range.
Observation range · 5 h
Above 71.1500: A hold above the range’s upper boundary on healthy volume would weaken the “bounce within a downtrend” thesis.
Below 67.5900: A return to the range’s lower boundary would refocus attention on the fact that the daily and weekly trends are still down.
These are historical levels; a lone wick does not confirm a scenario.
What would need to change in volume for the short-term gain to stop looking like noise within a daily decline?
Binance data, snapshot at 01:06 UTC. The author may receive rewards through Binance Square Write to Earn.
51
·
--
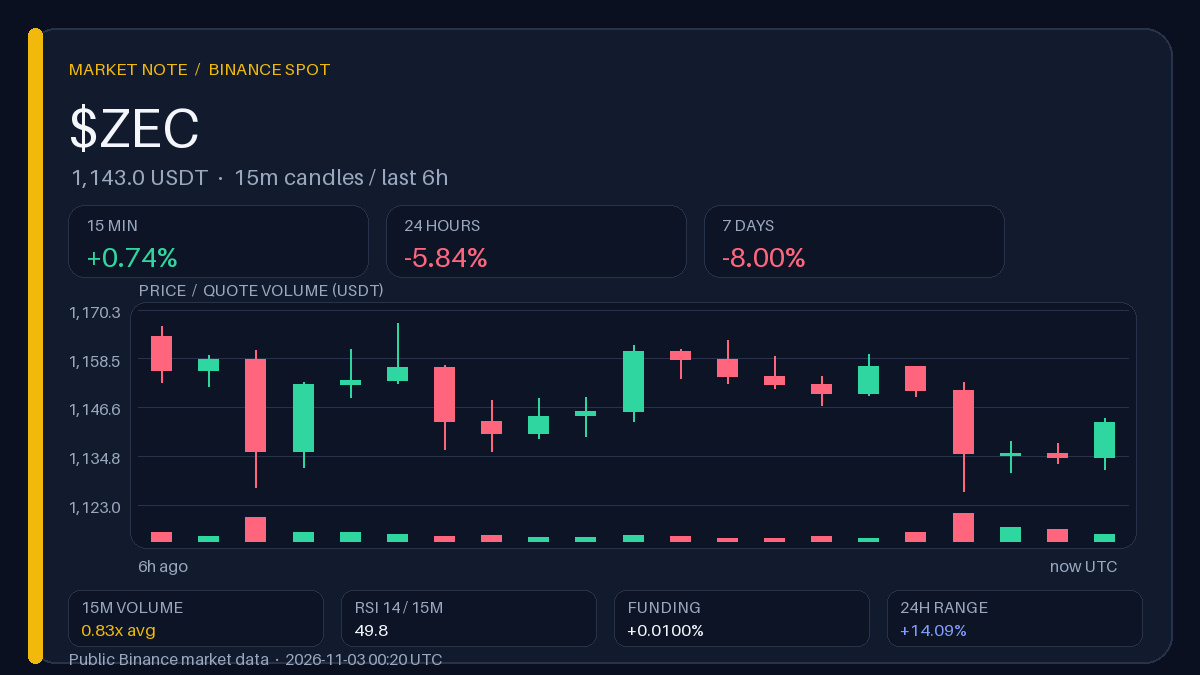
$ZEC A bounce within a decline is not yet a reversal
A brief gain over fifteen minutes looks more like a pause in the daily decline than a change in direction. Volume on this bounce is below average—0.83 of normal—and funding at +0.01% shows neither overheated longs nor short pressure.
Observation range · 5 h
Above 1,167.03: Holding above the upper boundary of the range with volume remaining active would strengthen the case for a shift in the short-term trend.
Below 1,126.25: A return to the lower boundary would confirm that the move remains only a pullback within the daily decline.
These are historical levels; a single wick does not confirm the scenario.
↩️ Recap of the previous “Volume Radar” issue (01.11 02:36 UTC): ZEC 1,249.49 → 1,243.66 USDT (−0.47% over 12 h), funding −0.011% → +0.005%.
What would need to change in volume for the bounce to stop being just a pause within the decline?
Binance data, snapshot at 00:20 UTC. The author may receive a reward through Binance Square Write to Earn.
$ZEC A bounce within a decline is not yet a reversal
A brief gain over fifteen minutes looks more like a pause in the daily decline than a change in direction. Volume on this bounce is below average—0.83 of normal—and funding at +0.01% shows neither overheated longs nor short pressure.
Observation range · 5 h
Above 1,167.03: Holding above the upper boundary of the range with volume remaining active would strengthen the case for a shift in the short-term trend.
Below 1,126.25: A return to the lower boundary would confirm that the move remains only a pullback within the daily decline.
These are historical levels; a single wick does not confirm the scenario.
↩️ Recap of the previous “Volume Radar” issue (01.11 02:36 UTC): ZEC 1,249.49 → 1,243.66 USDT (−0.47% over 12 h), funding −0.011% → +0.005%.
What would need to change in volume for the bounce to stop being just a pause within the decline?
Binance data, snapshot at 00:20 UTC. The author may receive a reward through Binance Square Write to Earn.
A brief gain over fifteen minutes looks more like a pause in the daily decline than a change in direction. Volume on this bounce is below average—0.83 of normal—and funding at +0.01% shows neither overheated longs nor short pressure.
Observation range · 5 h
Above 1,167.03: Holding above the upper boundary of the range with volume remaining active would strengthen the case for a shift in the short-term trend.
Below 1,126.25: A return to the lower boundary would confirm that the move remains only a pullback within the daily decline.
These are historical levels; a single wick does not confirm the scenario.
↩️ Recap of the previous “Volume Radar” issue (01.11 02:36 UTC): ZEC 1,249.49 → 1,243.66 USDT (−0.47% over 12 h), funding −0.011% → +0.005%.
What would need to change in volume for the bounce to stop being just a pause within the decline?
Binance data, snapshot at 00:20 UTC. The author may receive a reward through Binance Square Write to Earn.
82
·
--
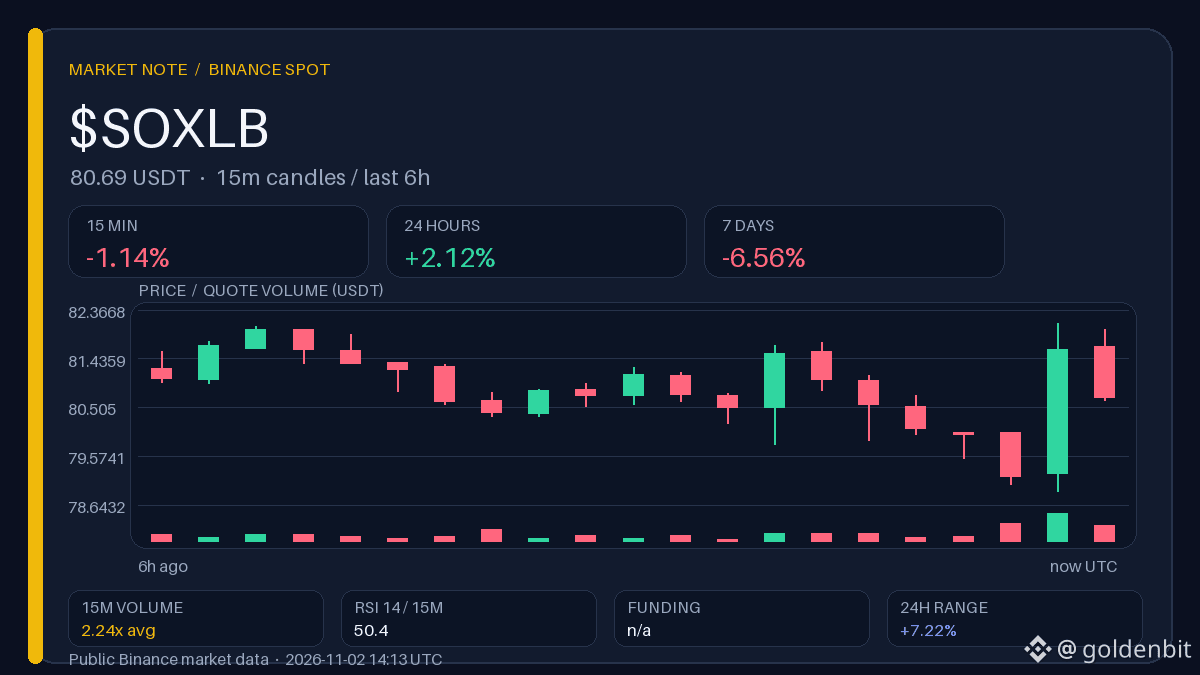
$SOXLB: volume is picking up on the pullback, but the week is still negative
The 15-minute volume spike looks more like distribution after a week-long decline than the start of a reversal. The price gained 2.12% over 24 hours, but is down 6.56% for the week, and RSI at 50.4 shows neither overbought nor oversold conditions.
Observation range · 5 h
Above 82.1100: A sustained move above the top of the range as volume cools would weaken the case for simple distribution.
Below 78.9000: A move back below the bottom of the range would confirm that the daily gain was merely a bounce within the weekly decline.
Historical levels; a single wick does not confirm a scenario.
↩️ Recap of the previous “Volume Radar” issue (31.10 07:05 UTC): SOXLB 77.5400 → 77.2600 USDT (−0.36% over 12 h).
Will the price stay above the midpoint of the local range if volume returns to normal?
Binance data, snapshot at 14:13 UTC. The author may receive rewards through Binance Square Write to Earn.
$SOXLB : volume is picking up on the pullback, but the week is still negative
The 15-minute volume spike looks more like distribution after a week-long decline than the start of a reversal. The price gained 2.12% over 24 hours, but is down 6.56% for the week, and RSI at 50.4 shows neither overbought nor oversold conditions.
Observation range · 5 h
Above 82.1100: A sustained move above the top of the range as volume cools would weaken the case for simple distribution.
Below 78.9000: A move back below the bottom of the range would confirm that the daily gain was merely a bounce within the weekly decline.
Historical levels; a single wick does not confirm a scenario.
↩️ Recap of the previous “Volume Radar” issue (31.10 07:05 UTC): SOXLB 77.5400 → 77.2600 USDT (−0.36% over 12 h).
Will the price stay above the midpoint of the local range if volume returns to normal?
Binance data, snapshot at 14:13 UTC. The author may receive rewards through Binance Square Write to Earn.
The 15-minute volume spike looks more like distribution after a week-long decline than the start of a reversal. The price gained 2.12% over 24 hours, but is down 6.56% for the week, and RSI at 50.4 shows neither overbought nor oversold conditions.
Observation range · 5 h
Above 82.1100: A sustained move above the top of the range as volume cools would weaken the case for simple distribution.
Below 78.9000: A move back below the bottom of the range would confirm that the daily gain was merely a bounce within the weekly decline.
Historical levels; a single wick does not confirm a scenario.
↩️ Recap of the previous “Volume Radar” issue (31.10 07:05 UTC): SOXLB 77.5400 → 77.2600 USDT (−0.36% over 12 h).
Will the price stay above the midpoint of the local range if volume returns to normal?
Binance data, snapshot at 14:13 UTC. The author may receive rewards through Binance Square Write to Earn.
·
--
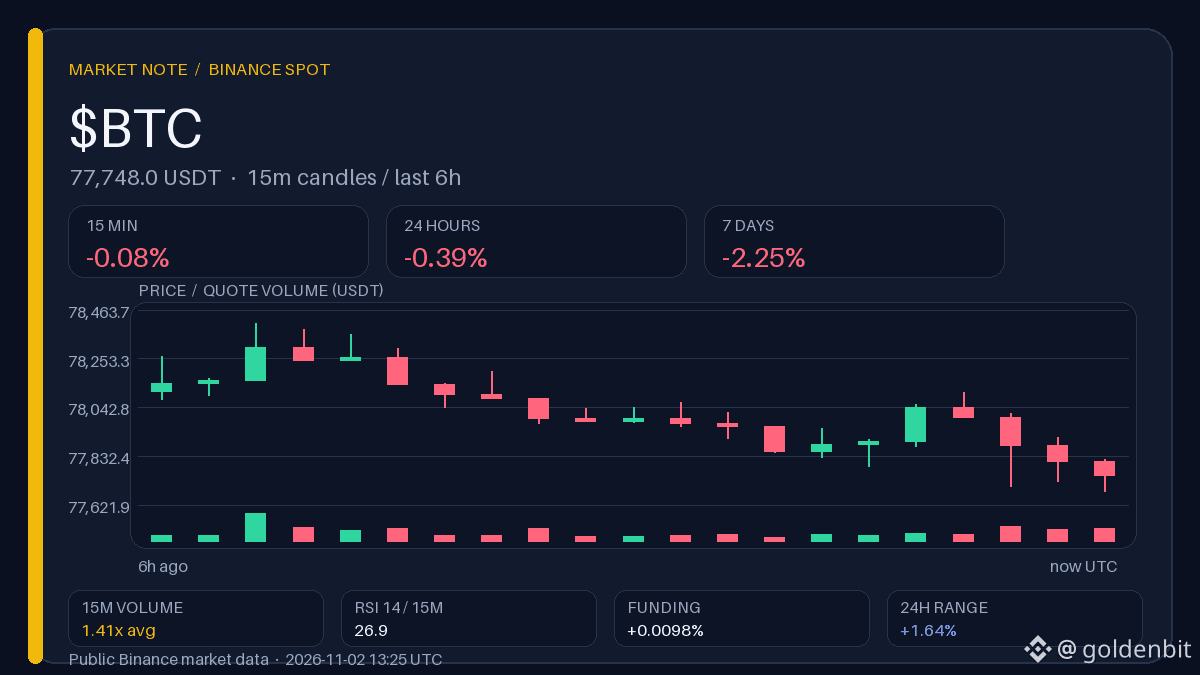
$BTC Near the lower edge: SAFU news and price are moving in opposite directions
So far, the market hasn’t confirmed that the withdrawal of half of SAFU’s bitcoin reserve was a bearish trigger: the short-term momentum is weak, but there’s no panic either. Down 2.25% over 7 days and 0.39% over 24 hours; with the 15-minute RSI at 26.9, this looks more like a fade than a sell-off. Hypothesis: the price has already priced in the news.
Observation range · 5 h
Above 78 405,66: Holding above the window’s upper boundary would weaken the case that the news is pressuring the price.
Below 77 680,00: Returning below and holding under the lower boundary would strengthen the case that the market is still repricing the news.
These are historical levels; a single wick does not confirm the scenario.
🗞 News: Cointelegraph.
↩️ Previous “Volume Radar” recap (01.11 06:20 UTC): BTC 78 048,73 → 77 933,64 USDT (−0,15% over 12 h), funding +0,010% → +0,010%.
If the SAFU reserve isn’t replenished, which will reflect it first — funding or volume on pullbacks?
Binance data, snapshot at 13:25 UTC. The author may receive rewards through Binance Square Write to Earn.
$BTC Near the lower edge: SAFU news and price are moving in opposite directions
So far, the market hasn’t confirmed that the withdrawal of half of SAFU’s bitcoin reserve was a bearish trigger: the short-term momentum is weak, but there’s no panic either. Down 2.25% over 7 days and 0.39% over 24 hours; with the 15-minute RSI at 26.9, this looks more like a fade than a sell-off. Hypothesis: the price has already priced in the news.
Observation range · 5 h
Above 78 405,66: Holding above the window’s upper boundary would weaken the case that the news is pressuring the price.
Below 77 680,00: Returning below and holding under the lower boundary would strengthen the case that the market is still repricing the news.
These are historical levels; a single wick does not confirm the scenario.
🗞 News: Cointelegraph.
↩️ Previous “Volume Radar” recap (01.11 06:20 UTC): BTC 78 048,73 → 77 933,64 USDT (−0,15% over 12 h), funding +0,010% → +0,010%.
If the SAFU reserve isn’t replenished, which will reflect it first — funding or volume on pullbacks?
Binance data, snapshot at 13:25 UTC. The author may receive rewards through Binance Square Write to Earn.
So far, the market hasn’t confirmed that the withdrawal of half of SAFU’s bitcoin reserve was a bearish trigger: the short-term momentum is weak, but there’s no panic either. Down 2.25% over 7 days and 0.39% over 24 hours; with the 15-minute RSI at 26.9, this looks more like a fade than a sell-off. Hypothesis: the price has already priced in the news.
Observation range · 5 h
Above 78 405,66: Holding above the window’s upper boundary would weaken the case that the news is pressuring the price.
Below 77 680,00: Returning below and holding under the lower boundary would strengthen the case that the market is still repricing the news.
These are historical levels; a single wick does not confirm the scenario.
🗞 News: Cointelegraph.
↩️ Previous “Volume Radar” recap (01.11 06:20 UTC): BTC 78 048,73 → 77 933,64 USDT (−0,15% over 12 h), funding +0,010% → +0,010%.
If the SAFU reserve isn’t replenished, which will reflect it first — funding or volume on pullbacks?
Binance data, snapshot at 13:25 UTC. The author may receive rewards through Binance Square Write to Earn.
1
·
--
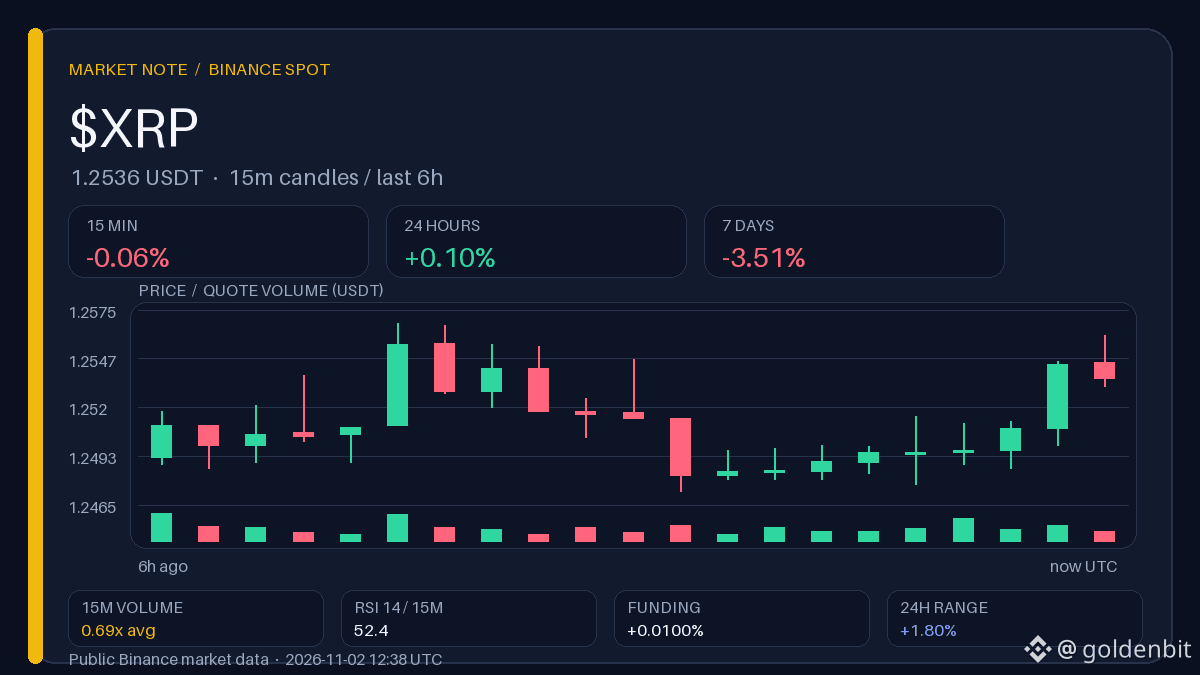
$XRP: Ledger patch news leaves price unmoved
The reported vulnerability looks serious, but the market is still treating it as a technical issue rather than a blow to confidence in the network. The price is up 0.1% over 24 hours and down 3.51% over the week, while 15-minute volume is 0.69 of normal: there is almost no reaction, but no confirmation that the market is calm either.
Observation range · 5 h
Above 1.2567: Holding above the upper boundary of the local range on active volume would weaken the case that the market has ignored the news.
Below 1.2473: A return to the lower edge of the range amid rising volume would support the view that the risk has not yet been priced in.
These are historical levels; a single wick does not confirm a scenario.
🗞 News: CoinDesk.
What would need to appear in the fix notes for the market to stop considering this an internal Ledger matter?
Binance data, snapshot at 12:38 UTC. The author may receive rewards through Binance Square Write to Earn.
$XRP : Ledger patch news leaves price unmoved
The reported vulnerability looks serious, but the market is still treating it as a technical issue rather than a blow to confidence in the network. The price is up 0.1% over 24 hours and down 3.51% over the week, while 15-minute volume is 0.69 of normal: there is almost no reaction, but no confirmation that the market is calm either.
Observation range · 5 h
Above 1.2567: Holding above the upper boundary of the local range on active volume would weaken the case that the market has ignored the news.
Below 1.2473: A return to the lower edge of the range amid rising volume would support the view that the risk has not yet been priced in.
These are historical levels; a single wick does not confirm a scenario.
🗞 News: CoinDesk.
What would need to appear in the fix notes for the market to stop considering this an internal Ledger matter?
Binance data, snapshot at 12:38 UTC. The author may receive rewards through Binance Square Write to Earn.
The reported vulnerability looks serious, but the market is still treating it as a technical issue rather than a blow to confidence in the network. The price is up 0.1% over 24 hours and down 3.51% over the week, while 15-minute volume is 0.69 of normal: there is almost no reaction, but no confirmation that the market is calm either.
Observation range · 5 h
Above 1.2567: Holding above the upper boundary of the local range on active volume would weaken the case that the market has ignored the news.
Below 1.2473: A return to the lower edge of the range amid rising volume would support the view that the risk has not yet been priced in.
These are historical levels; a single wick does not confirm a scenario.
🗞 News: CoinDesk.
What would need to appear in the fix notes for the market to stop considering this an internal Ledger matter?
Binance data, snapshot at 12:38 UTC. The author may receive rewards through Binance Square Write to Earn.
4
·
--
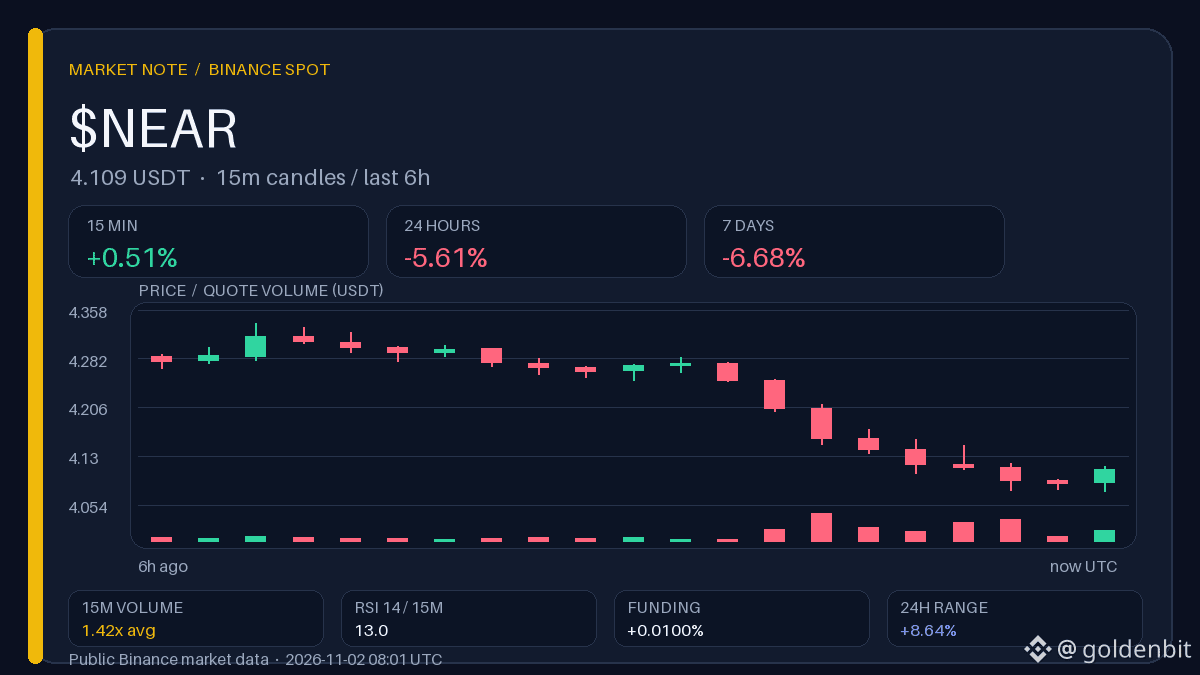
$NEAR At the lower boundary: a bounce, but no reversal
A fifteen-minute gain amid losses over the day and week is more likely noise at support than a change in direction. The 15m RSI is 13—the price is at the lower edge of the range, while volume is only 1.42 times above normal: buyers have yet to confirm the bounce.
Observation range · 5 h
Above 4.3370: Holding above the local upper boundary would weaken the case that the move is merely a pullback within a downtrend.
Below 4.0750: A move back below the lower boundary would confirm that the brief gain has not changed the longer-term trend.
These are historical levels; a single wick does not confirm a scenario.
What would need to change in volume for the bounce to stop looking like a fluke?
Binance data, snapshot at 08:01 UTC. The author may receive a reward through Binance Square Write to Earn.
$NEAR At the lower boundary: a bounce, but no reversal
A fifteen-minute gain amid losses over the day and week is more likely noise at support than a change in direction. The 15m RSI is 13—the price is at the lower edge of the range, while volume is only 1.42 times above normal: buyers have yet to confirm the bounce.
Observation range · 5 h
Above 4.3370: Holding above the local upper boundary would weaken the case that the move is merely a pullback within a downtrend.
Below 4.0750: A move back below the lower boundary would confirm that the brief gain has not changed the longer-term trend.
These are historical levels; a single wick does not confirm a scenario.
What would need to change in volume for the bounce to stop looking like a fluke?
Binance data, snapshot at 08:01 UTC. The author may receive a reward through Binance Square Write to Earn.
A fifteen-minute gain amid losses over the day and week is more likely noise at support than a change in direction. The 15m RSI is 13—the price is at the lower edge of the range, while volume is only 1.42 times above normal: buyers have yet to confirm the bounce.
Observation range · 5 h
Above 4.3370: Holding above the local upper boundary would weaken the case that the move is merely a pullback within a downtrend.
Below 4.0750: A move back below the lower boundary would confirm that the brief gain has not changed the longer-term trend.
These are historical levels; a single wick does not confirm a scenario.
What would need to change in volume for the bounce to stop looking like a fluke?
Binance data, snapshot at 08:01 UTC. The author may receive a reward through Binance Square Write to Earn.
7
·
--
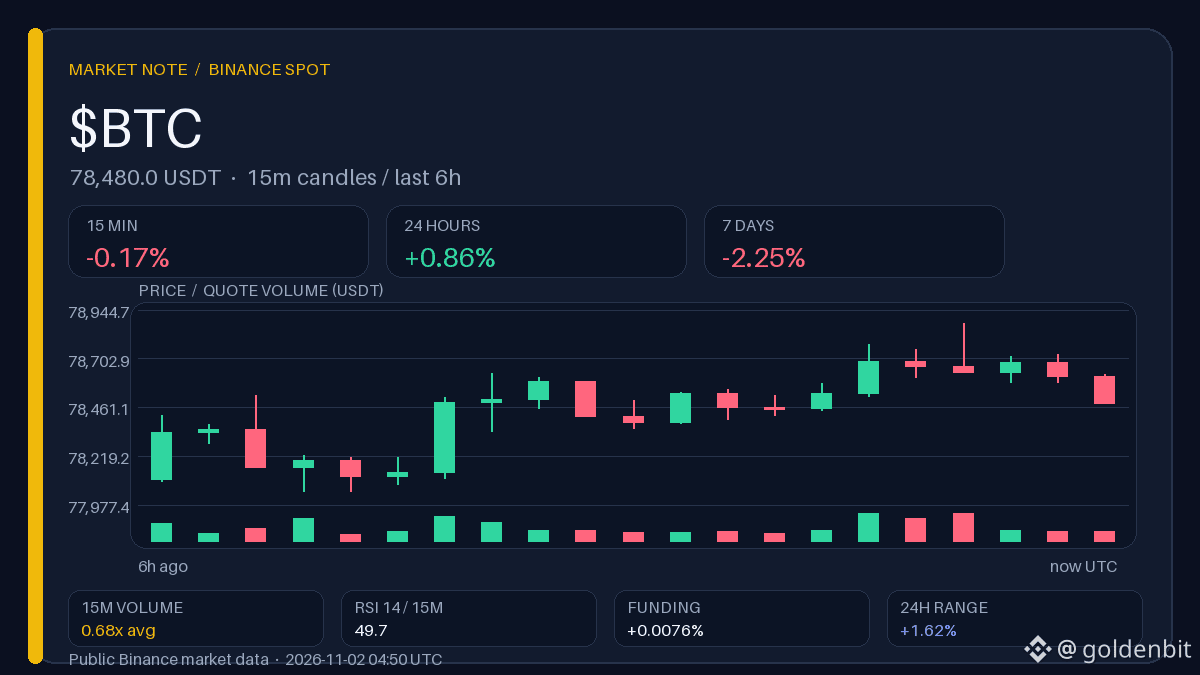
$BTC recovers from hack, but volume is not keeping pace with price
The rebound after a major hack looks more like a recovery in sentiment than confirmed demand. The price is up 0.86% over 24 hours, while 15-minute volume is only 0.68 of normal; the weekly change is −2.25%.
Observation range · 5 h
Above 78 878,01: A hold above the window’s upper bound, accompanied by rising volume, would strengthen the case for a recovery in demand.
Below 78 044,11: A move back below the window’s lower bound would weaken the rebound hypothesis and shift focus back to weekly weakness.
Historical levels; a single wick does not confirm a scenario.
🗞 News: CoinDesk.
↩️ Previous “Volume Radar” update recap (01.11 06:20 UTC): BTC 78 048,73 → 77 933,64 USDT (−0.15% over 12 h), funding +0.010% → +0.010%.
What would need to change in volume for the daily gain to stop looking like a fluke?
Binance data, snapshot at 04:50 UTC. The author may receive rewards through Binance Square Write to Earn.
$BTC recovers from hack, but volume is not keeping pace with price
The rebound after a major hack looks more like a recovery in sentiment than confirmed demand. The price is up 0.86% over 24 hours, while 15-minute volume is only 0.68 of normal; the weekly change is −2.25%.
Observation range · 5 h
Above 78 878,01: A hold above the window’s upper bound, accompanied by rising volume, would strengthen the case for a recovery in demand.
Below 78 044,11: A move back below the window’s lower bound would weaken the rebound hypothesis and shift focus back to weekly weakness.
Historical levels; a single wick does not confirm a scenario.
🗞 News: CoinDesk.
↩️ Previous “Volume Radar” update recap (01.11 06:20 UTC): BTC 78 048,73 → 77 933,64 USDT (−0.15% over 12 h), funding +0.010% → +0.010%.
What would need to change in volume for the daily gain to stop looking like a fluke?
Binance data, snapshot at 04:50 UTC. The author may receive rewards through Binance Square Write to Earn.
The rebound after a major hack looks more like a recovery in sentiment than confirmed demand. The price is up 0.86% over 24 hours, while 15-minute volume is only 0.68 of normal; the weekly change is −2.25%.
Observation range · 5 h
Above 78 878,01: A hold above the window’s upper bound, accompanied by rising volume, would strengthen the case for a recovery in demand.
Below 78 044,11: A move back below the window’s lower bound would weaken the rebound hypothesis and shift focus back to weekly weakness.
Historical levels; a single wick does not confirm a scenario.
🗞 News: CoinDesk.
↩️ Previous “Volume Radar” update recap (01.11 06:20 UTC): BTC 78 048,73 → 77 933,64 USDT (−0.15% over 12 h), funding +0.010% → +0.010%.
What would need to change in volume for the daily gain to stop looking like a fluke?
Binance data, snapshot at 04:50 UTC. The author may receive rewards through Binance Square Write to Earn.
26
·
--
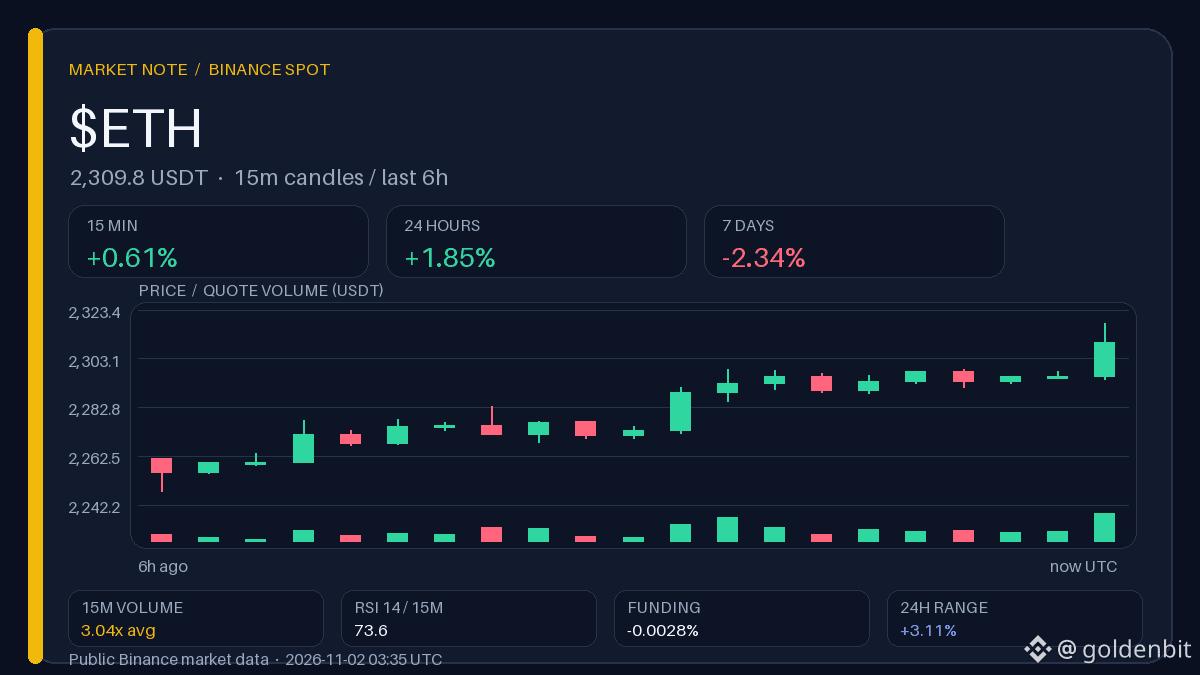
$ETH At the upper edge of the window: volume has risen, but the week is still in the red
A surge in 15-minute volume is strengthening the short-term momentum, but it doesn't erase the weekly loss—that tension is the main story. Over 15 minutes, the price gained 0.61% on volume 3.04 times above normal, but over 7 days the asset lost 2.34%.
Observation range · 5 h
Above 2,317.84: Holding above the window's upper boundary while volume remains elevated would support interpreting the momentum as a continuation.
Below 2,247.84: A return below the window's upper boundary on declining volume would weaken the continuation case.
Historical levels; a single wick does not confirm a scenario.
↩️ Recap of the previous “Funding Radar” issue (31.10 01:02 UTC): ETH 2,250.06 → 2,250.33 USDT (+0.01% over 12 h), funding −0.012% → −0.006%.
Will the price hold near the window's upper edge if volume returns to normal?
Binance data, snapshot at 03:35 UTC. The author may receive rewards through Binance Square Write to Earn.
$ETH At the upper edge of the window: volume has risen, but the week is still in the red
A surge in 15-minute volume is strengthening the short-term momentum, but it doesn't erase the weekly loss—that tension is the main story. Over 15 minutes, the price gained 0.61% on volume 3.04 times above normal, but over 7 days the asset lost 2.34%.
Observation range · 5 h
Above 2,317.84: Holding above the window's upper boundary while volume remains elevated would support interpreting the momentum as a continuation.
Below 2,247.84: A return below the window's upper boundary on declining volume would weaken the continuation case.
Historical levels; a single wick does not confirm a scenario.
↩️ Recap of the previous “Funding Radar” issue (31.10 01:02 UTC): ETH 2,250.06 → 2,250.33 USDT (+0.01% over 12 h), funding −0.012% → −0.006%.
Will the price hold near the window's upper edge if volume returns to normal?
Binance data, snapshot at 03:35 UTC. The author may receive rewards through Binance Square Write to Earn.
A surge in 15-minute volume is strengthening the short-term momentum, but it doesn't erase the weekly loss—that tension is the main story. Over 15 minutes, the price gained 0.61% on volume 3.04 times above normal, but over 7 days the asset lost 2.34%.
Observation range · 5 h
Above 2,317.84: Holding above the window's upper boundary while volume remains elevated would support interpreting the momentum as a continuation.
Below 2,247.84: A return below the window's upper boundary on declining volume would weaken the continuation case.
Historical levels; a single wick does not confirm a scenario.
↩️ Recap of the previous “Funding Radar” issue (31.10 01:02 UTC): ETH 2,250.06 → 2,250.33 USDT (+0.01% over 12 h), funding −0.012% → −0.006%.
Will the price hold near the window's upper edge if volume returns to normal?
Binance data, snapshot at 03:35 UTC. The author may receive rewards through Binance Square Write to Earn.
29
·
--
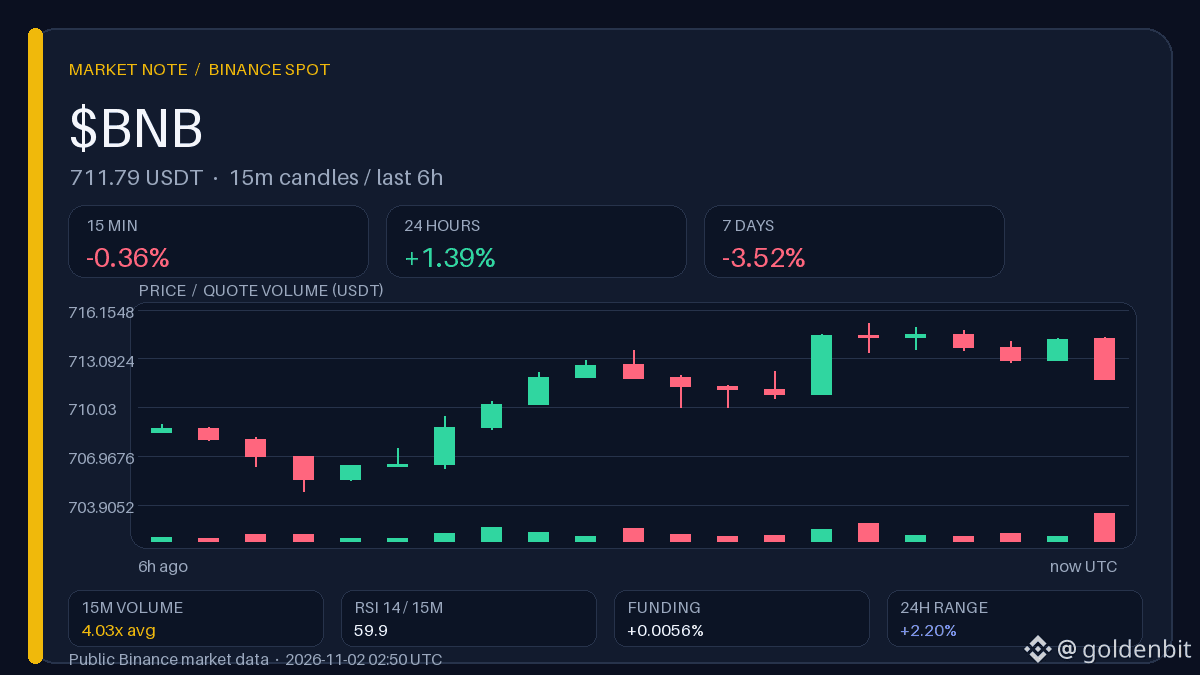
$BNB: Funding is positive, but the week is still in the red
Positive funding shows that long positions are paying, but it is only the cost of positioning, not a forecast of direction. 15-minute volume is 4.03 times above normal, while the weekly change is −3.52%: the spike has not yet reversed the longer-term trend.
Observation range · 5 h
Above 715.31: Holding above the window’s upper boundary while volume remains elevated would support the idea that momentum is turning into sustained strength.
Below 704.75: A move back below the window’s lower boundary would weaken the continuation thesis and refocus attention on the weekly decline.
These are historical levels; a single wick does not confirm a scenario.
What would need to change in funding for the current volume spike to stop looking local?
Binance data, snapshot at 02:50 UTC. The author may receive rewards through Binance Square Write to Earn.
$BNB : Funding is positive, but the week is still in the red
Positive funding shows that long positions are paying, but it is only the cost of positioning, not a forecast of direction. 15-minute volume is 4.03 times above normal, while the weekly change is −3.52%: the spike has not yet reversed the longer-term trend.
Observation range · 5 h
Above 715.31: Holding above the window’s upper boundary while volume remains elevated would support the idea that momentum is turning into sustained strength.
Below 704.75: A move back below the window’s lower boundary would weaken the continuation thesis and refocus attention on the weekly decline.
These are historical levels; a single wick does not confirm a scenario.
What would need to change in funding for the current volume spike to stop looking local?
Binance data, snapshot at 02:50 UTC. The author may receive rewards through Binance Square Write to Earn.
Positive funding shows that long positions are paying, but it is only the cost of positioning, not a forecast of direction. 15-minute volume is 4.03 times above normal, while the weekly change is −3.52%: the spike has not yet reversed the longer-term trend.
Observation range · 5 h
Above 715.31: Holding above the window’s upper boundary while volume remains elevated would support the idea that momentum is turning into sustained strength.
Below 704.75: A move back below the window’s lower boundary would weaken the continuation thesis and refocus attention on the weekly decline.
These are historical levels; a single wick does not confirm a scenario.
What would need to change in funding for the current volume spike to stop looking local?
Binance data, snapshot at 02:50 UTC. The author may receive rewards through Binance Square Write to Earn.
41
·
--
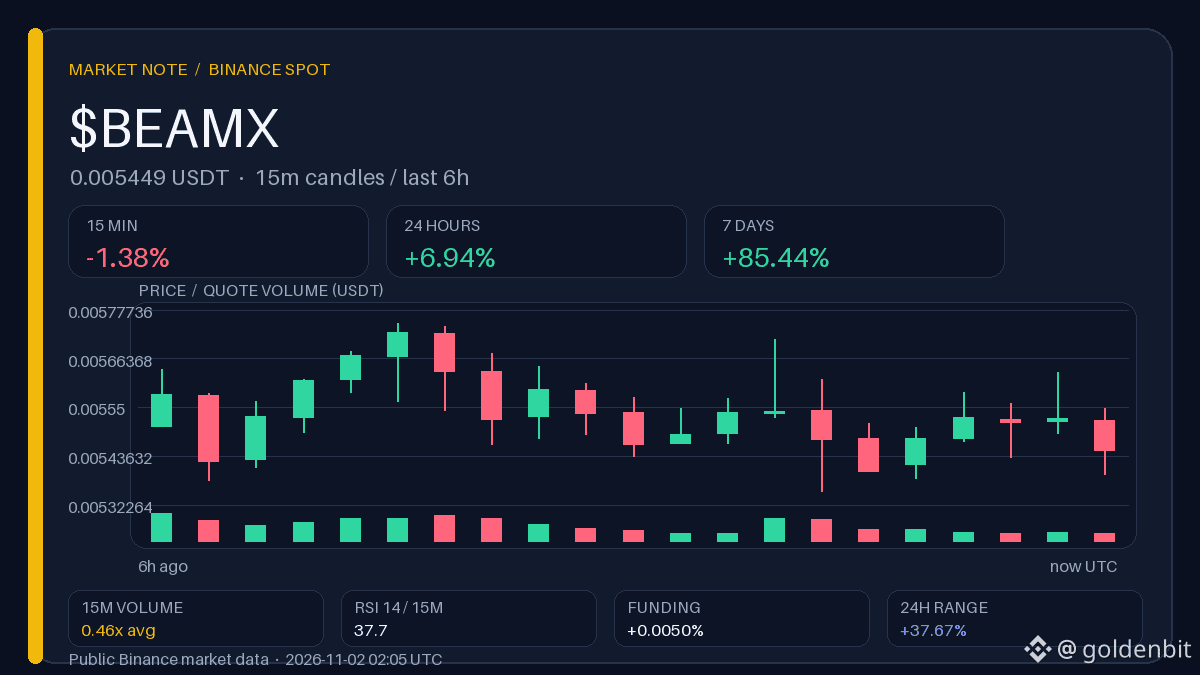
$BEAMX: the week-long rise is holding, but momentum is already turning against it
A pullback on the 15-minute timeframe amid weekly gains is either a pause or the first crack in the trend; volume hasn’t picked a side yet. The 15-minute decline is happening on volume at 0.46 of normal — a weak pullback more often points to a pause than a reversal, but that’s a hypothesis, not a conclusion.
Observation range · 5h
Above 0.005746: Holding above the upper boundary of the local range would support the pause-within-an-uptrend scenario.
Below 0.005354: A move back below the lower boundary of the range would weaken the pause scenario and strengthen the reversal narrative.
Historical levels; a single wick does not confirm a scenario.
↩️ Recap of the previous “Contrast Radar” edition (01.11 00:49 UTC): BEAMX 0.005056 → 0.005002 USDT (−1.07% in 12h), funding +0.005% → +0.005%.
What would need to change in volume for this pullback to stop looking like a pause?
Binance data, snapshot at 02:05 UTC. The author may receive rewards through Binance Square Write to Earn.
$BEAMX : the week-long rise is holding, but momentum is already turning against it
A pullback on the 15-minute timeframe amid weekly gains is either a pause or the first crack in the trend; volume hasn’t picked a side yet. The 15-minute decline is happening on volume at 0.46 of normal — a weak pullback more often points to a pause than a reversal, but that’s a hypothesis, not a conclusion.
Observation range · 5h
Above 0.005746: Holding above the upper boundary of the local range would support the pause-within-an-uptrend scenario.
Below 0.005354: A move back below the lower boundary of the range would weaken the pause scenario and strengthen the reversal narrative.
Historical levels; a single wick does not confirm a scenario.
↩️ Recap of the previous “Contrast Radar” edition (01.11 00:49 UTC): BEAMX 0.005056 → 0.005002 USDT (−1.07% in 12h), funding +0.005% → +0.005%.
What would need to change in volume for this pullback to stop looking like a pause?
Binance data, snapshot at 02:05 UTC. The author may receive rewards through Binance Square Write to Earn.
A pullback on the 15-minute timeframe amid weekly gains is either a pause or the first crack in the trend; volume hasn’t picked a side yet. The 15-minute decline is happening on volume at 0.46 of normal — a weak pullback more often points to a pause than a reversal, but that’s a hypothesis, not a conclusion.
Observation range · 5h
Above 0.005746: Holding above the upper boundary of the local range would support the pause-within-an-uptrend scenario.
Below 0.005354: A move back below the lower boundary of the range would weaken the pause scenario and strengthen the reversal narrative.
Historical levels; a single wick does not confirm a scenario.
↩️ Recap of the previous “Contrast Radar” edition (01.11 00:49 UTC): BEAMX 0.005056 → 0.005002 USDT (−1.07% in 12h), funding +0.005% → +0.005%.
What would need to change in volume for this pullback to stop looking like a pause?
Binance data, snapshot at 02:05 UTC. The author may receive rewards through Binance Square Write to Earn.
67
·
--
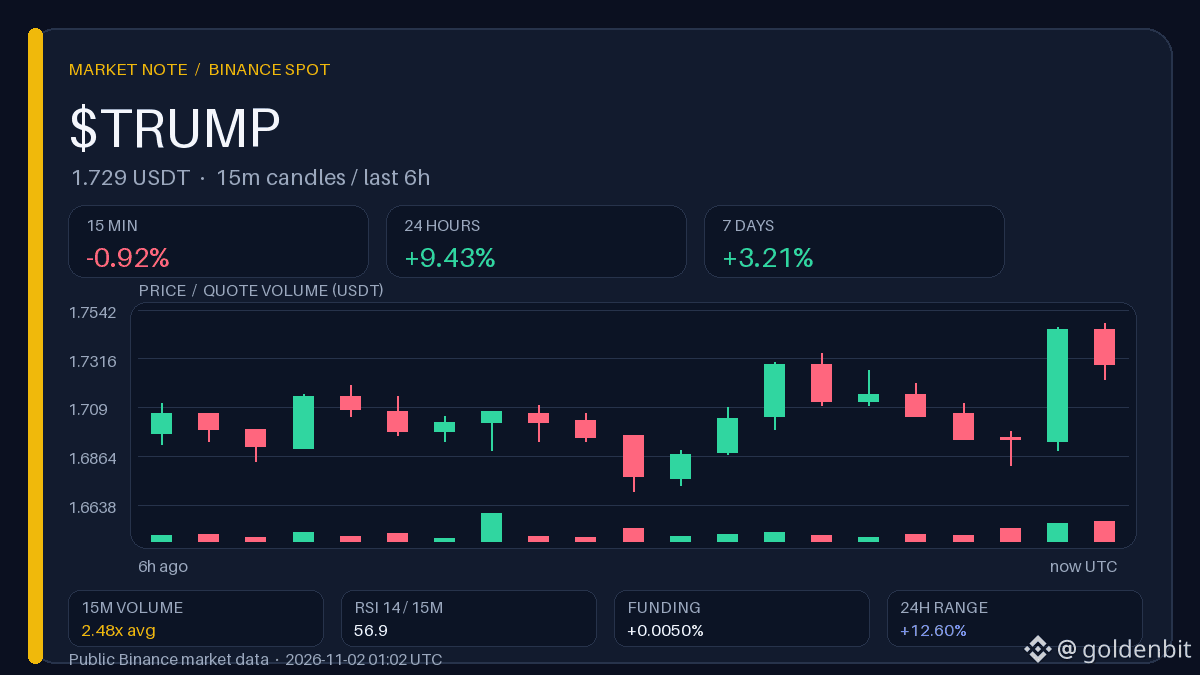
$TRUMP Up on the day, but volume on the pullback is already twice the norm
While the pullback is happening on elevated volume, the daily gain remains unconfirmed, and it is volume—not price—that will determine how to interpret it. Over 15 minutes, the price is down 0.92% on volume 2.48 times above normal, while an RSI of 56.9 shows neither overbought conditions nor a reversal.
Observation range · 5 h
Above 1.7480: A hold above the upper boundary of the range on weak volume would more likely confirm a pause than continued growth.
Below 1.6700: A move back below the lower boundary of the range on current volume would strengthen the interpretation of the pullback as the start of a reversal.
Historical levels; a single wick does not confirm a scenario.
What would need to change in volume for the pullback to stop looking like distribution?
Binance data, snapshot at 01:02 UTC. The author may receive a reward through Binance Square Write to Earn.
$TRUMP Up on the day, but volume on the pullback is already twice the norm
While the pullback is happening on elevated volume, the daily gain remains unconfirmed, and it is volume—not price—that will determine how to interpret it. Over 15 minutes, the price is down 0.92% on volume 2.48 times above normal, while an RSI of 56.9 shows neither overbought conditions nor a reversal.
Observation range · 5 h
Above 1.7480: A hold above the upper boundary of the range on weak volume would more likely confirm a pause than continued growth.
Below 1.6700: A move back below the lower boundary of the range on current volume would strengthen the interpretation of the pullback as the start of a reversal.
Historical levels; a single wick does not confirm a scenario.
What would need to change in volume for the pullback to stop looking like distribution?
Binance data, snapshot at 01:02 UTC. The author may receive a reward through Binance Square Write to Earn.
While the pullback is happening on elevated volume, the daily gain remains unconfirmed, and it is volume—not price—that will determine how to interpret it. Over 15 minutes, the price is down 0.92% on volume 2.48 times above normal, while an RSI of 56.9 shows neither overbought conditions nor a reversal.
Observation range · 5 h
Above 1.7480: A hold above the upper boundary of the range on weak volume would more likely confirm a pause than continued growth.
Below 1.6700: A move back below the lower boundary of the range on current volume would strengthen the interpretation of the pullback as the start of a reversal.
Historical levels; a single wick does not confirm a scenario.
What would need to change in volume for the pullback to stop looking like distribution?
Binance data, snapshot at 01:02 UTC. The author may receive a reward through Binance Square Write to Earn.
72
·
--
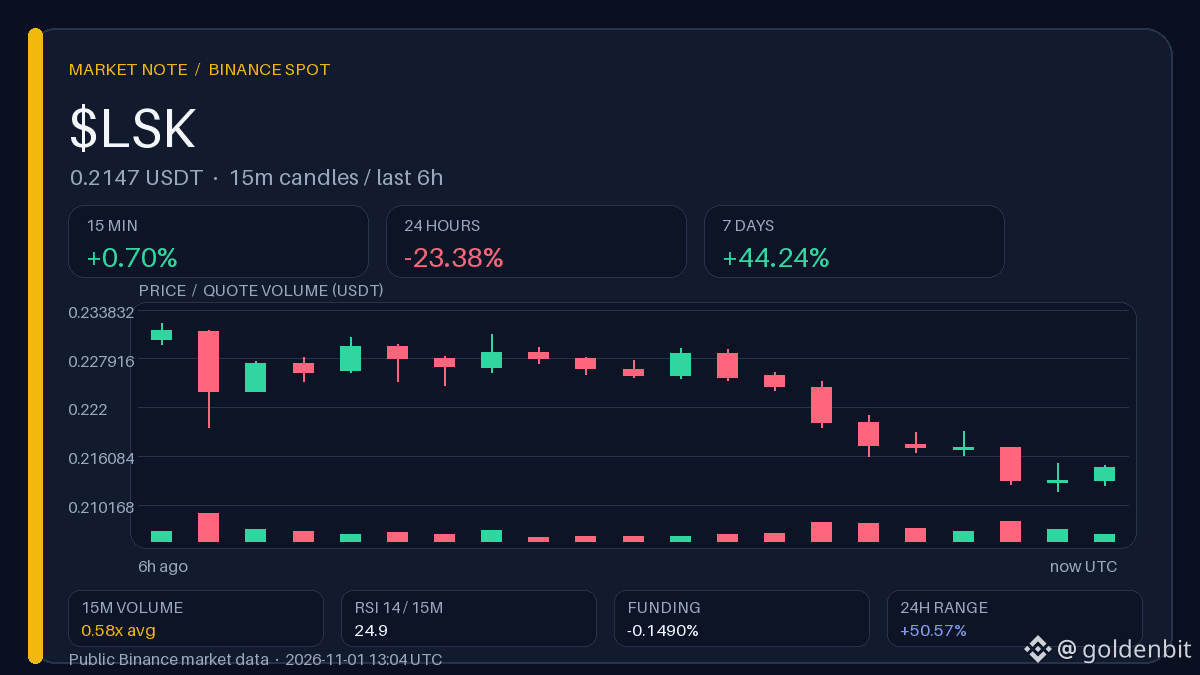
$LSK: shorts are paying, but 15 minutes are already against the week
The weekly rise is holding, but short-term momentum and volume don't confirm its continuation. Funding is −0.149% with price below the week's upper boundary: there is a short bias, but 15-minute volume is 0.58 of normal, making this more a hypothesis of position unwinding than confirmation.
Observation range · 5 h
Above 0.232200: Holding above the window's upper boundary while funding remains negative would strengthen the hypothesis of pressure on shorts.
Below 0.211800: A return to the lower boundary on weak volume would weaken the short-bias thesis and shift focus back to daily weakness.
Levels are historical; a single wick does not confirm a scenario.
↩️ Recap of the previous “Watchlist” edition (31.10 15:30 UTC): LSK 0.303100 → 0.229100 USDT (−24.41% in 12 h), funding −0.142% → −0.081%.
If the price returns to the upper boundary of the local range, will funding continue to deepen or start to normalize?
Binance data, snapshot at 13:04 UTC. The author may receive rewards through Binance Square Write to Earn.
$LSK : shorts are paying, but 15 minutes are already against the week
The weekly rise is holding, but short-term momentum and volume don't confirm its continuation. Funding is −0.149% with price below the week's upper boundary: there is a short bias, but 15-minute volume is 0.58 of normal, making this more a hypothesis of position unwinding than confirmation.
Observation range · 5 h
Above 0.232200: Holding above the window's upper boundary while funding remains negative would strengthen the hypothesis of pressure on shorts.
Below 0.211800: A return to the lower boundary on weak volume would weaken the short-bias thesis and shift focus back to daily weakness.
Levels are historical; a single wick does not confirm a scenario.
↩️ Recap of the previous “Watchlist” edition (31.10 15:30 UTC): LSK 0.303100 → 0.229100 USDT (−24.41% in 12 h), funding −0.142% → −0.081%.
If the price returns to the upper boundary of the local range, will funding continue to deepen or start to normalize?
Binance data, snapshot at 13:04 UTC. The author may receive rewards through Binance Square Write to Earn.
The weekly rise is holding, but short-term momentum and volume don't confirm its continuation. Funding is −0.149% with price below the week's upper boundary: there is a short bias, but 15-minute volume is 0.58 of normal, making this more a hypothesis of position unwinding than confirmation.
Observation range · 5 h
Above 0.232200: Holding above the window's upper boundary while funding remains negative would strengthen the hypothesis of pressure on shorts.
Below 0.211800: A return to the lower boundary on weak volume would weaken the short-bias thesis and shift focus back to daily weakness.
Levels are historical; a single wick does not confirm a scenario.
↩️ Recap of the previous “Watchlist” edition (31.10 15:30 UTC): LSK 0.303100 → 0.229100 USDT (−24.41% in 12 h), funding −0.142% → −0.081%.
If the price returns to the upper boundary of the local range, will funding continue to deepen or start to normalize?
Binance data, snapshot at 13:04 UTC. The author may receive rewards through Binance Square Write to Earn.
5
·
--
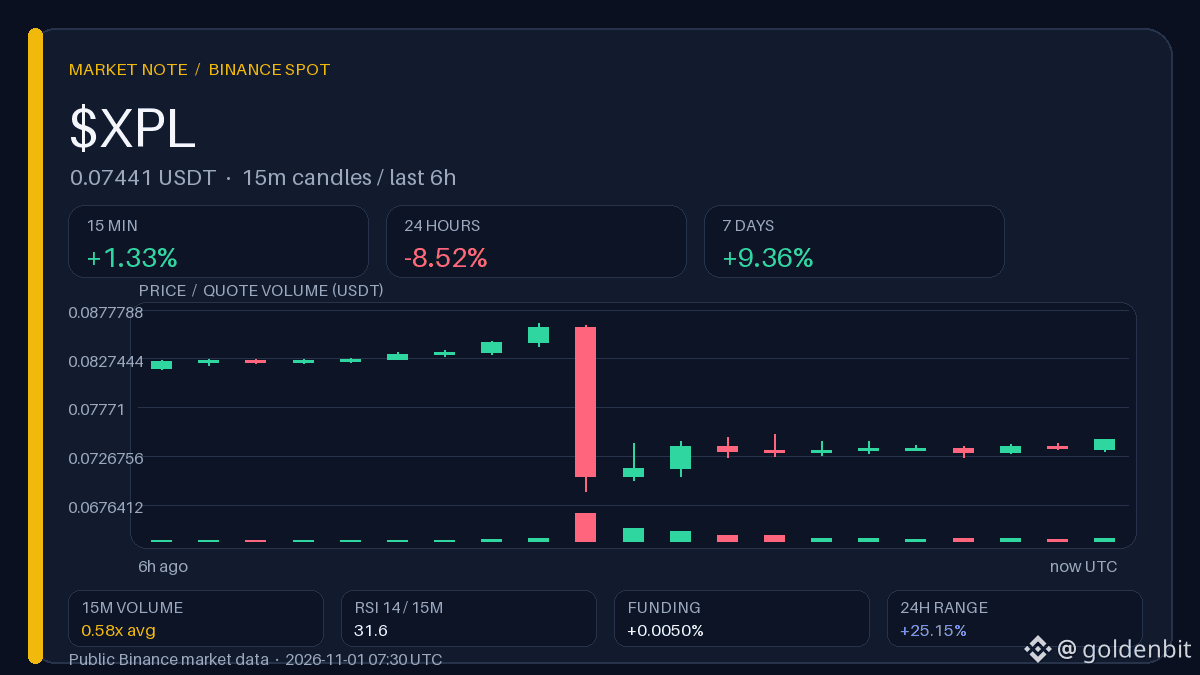
$XPL: funding is positive, but positioning does not confirm a bounce
Positive funding despite a daily loss indicates that longs are paying to hold their positions, not that the market is ready to reverse. The price gained 1.33% over 15 minutes, but volume during that window was only 0.58 of normal—a bounce without buyers’ participation.
• $XPL: −8.52% in 24h · +1.33% in 15m · funding +0.005%
• $BEAMX: +27.53% in 24h · +2.79% in 15m · funding +0.005%
• $BTC: +0.62% in 24h · −0.02% in 15m · funding +0.010%
What to watch next: Will funding stay positive if the 15-minute momentum fades?
How would volume need to change for positive funding to look like demand rather than inertia?
Binance data, snapshot at 07:30 UTC. The author may receive rewards through Binance Square Write to Earn.
$XPL : funding is positive, but positioning does not confirm a bounce
Positive funding despite a daily loss indicates that longs are paying to hold their positions, not that the market is ready to reverse. The price gained 1.33% over 15 minutes, but volume during that window was only 0.58 of normal—a bounce without buyers’ participation.
• $XPL : −8.52% in 24h · +1.33% in 15m · funding +0.005%
• $BEAMX : +27.53% in 24h · +2.79% in 15m · funding +0.005%
• $BTC : +0.62% in 24h · −0.02% in 15m · funding +0.010%
What to watch next: Will funding stay positive if the 15-minute momentum fades?
How would volume need to change for positive funding to look like demand rather than inertia?
Binance data, snapshot at 07:30 UTC. The author may receive rewards through Binance Square Write to Earn.
Positive funding despite a daily loss indicates that longs are paying to hold their positions, not that the market is ready to reverse. The price gained 1.33% over 15 minutes, but volume during that window was only 0.58 of normal—a bounce without buyers’ participation.
• $XPL : −8.52% in 24h · +1.33% in 15m · funding +0.005%
• $BEAMX : +27.53% in 24h · +2.79% in 15m · funding +0.005%
• $BTC : +0.62% in 24h · −0.02% in 15m · funding +0.010%
What to watch next: Will funding stay positive if the 15-minute momentum fades?
How would volume need to change for positive funding to look like demand rather than inertia?
Binance data, snapshot at 07:30 UTC. The author may receive rewards through Binance Square Write to Earn.
2
·
--
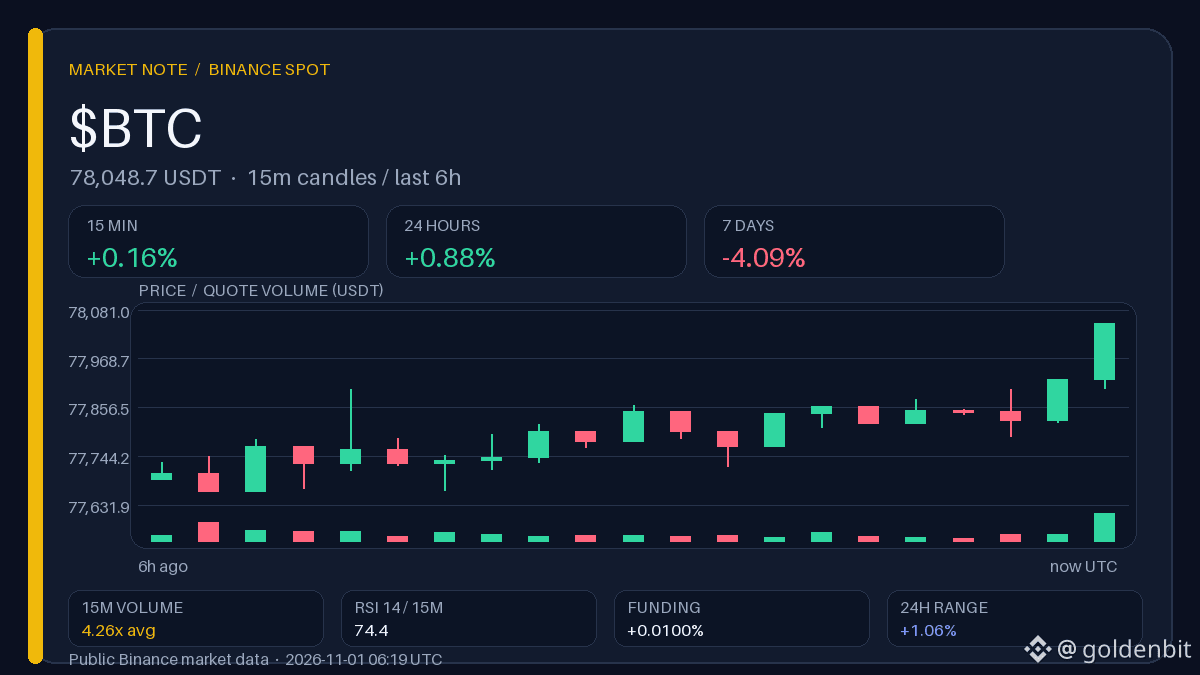
$BTC At the upper edge of the window: volume is 4.26 times above normal, but the weekly trend is against it
The 15-minute volume spike and RSI of 74.4 look like momentum, but the weekly drop of −4.09% casts doubt on its continuation. The price is holding near the upper boundary of the local window, while funding at +0.01% shows no signs of overheating—this looks more like a local move than a broader reversal.
Observation range · 5 h
Above 78 049,99: Holding above the upper boundary of the window with volume sustained would support the case for local momentum.
Below 77 662,91: A return to the lower boundary of the window as volume cools would point to noise, not a reversal.
These are historical levels; a single wick does not confirm the scenario.
↩️ Recap of the previous edition, “News and Numbers” (31.10 13:31 UTC): BTC 77 490,85 → 77 681,99 USDT (+0,25% in 12 h), funding +0,010% → +0,010%.
Will the price hold near the upper boundary of the window if volume returns to its average level?
Binance data, snapshot at 06:19 UTC. The author may receive rewards through Binance Square Write to Earn.
$BTC At the upper edge of the window: volume is 4.26 times above normal, but the weekly trend is against it
The 15-minute volume spike and RSI of 74.4 look like momentum, but the weekly drop of −4.09% casts doubt on its continuation. The price is holding near the upper boundary of the local window, while funding at +0.01% shows no signs of overheating—this looks more like a local move than a broader reversal.
Observation range · 5 h
Above 78 049,99: Holding above the upper boundary of the window with volume sustained would support the case for local momentum.
Below 77 662,91: A return to the lower boundary of the window as volume cools would point to noise, not a reversal.
These are historical levels; a single wick does not confirm the scenario.
↩️ Recap of the previous edition, “News and Numbers” (31.10 13:31 UTC): BTC 77 490,85 → 77 681,99 USDT (+0,25% in 12 h), funding +0,010% → +0,010%.
Will the price hold near the upper boundary of the window if volume returns to its average level?
Binance data, snapshot at 06:19 UTC. The author may receive rewards through Binance Square Write to Earn.
The 15-minute volume spike and RSI of 74.4 look like momentum, but the weekly drop of −4.09% casts doubt on its continuation. The price is holding near the upper boundary of the local window, while funding at +0.01% shows no signs of overheating—this looks more like a local move than a broader reversal.
Observation range · 5 h
Above 78 049,99: Holding above the upper boundary of the window with volume sustained would support the case for local momentum.
Below 77 662,91: A return to the lower boundary of the window as volume cools would point to noise, not a reversal.
These are historical levels; a single wick does not confirm the scenario.
↩️ Recap of the previous edition, “News and Numbers” (31.10 13:31 UTC): BTC 77 490,85 → 77 681,99 USDT (+0,25% in 12 h), funding +0,010% → +0,010%.
Will the price hold near the upper boundary of the window if volume returns to its average level?
Binance data, snapshot at 06:19 UTC. The author may receive rewards through Binance Square Write to Earn.
9
·
--
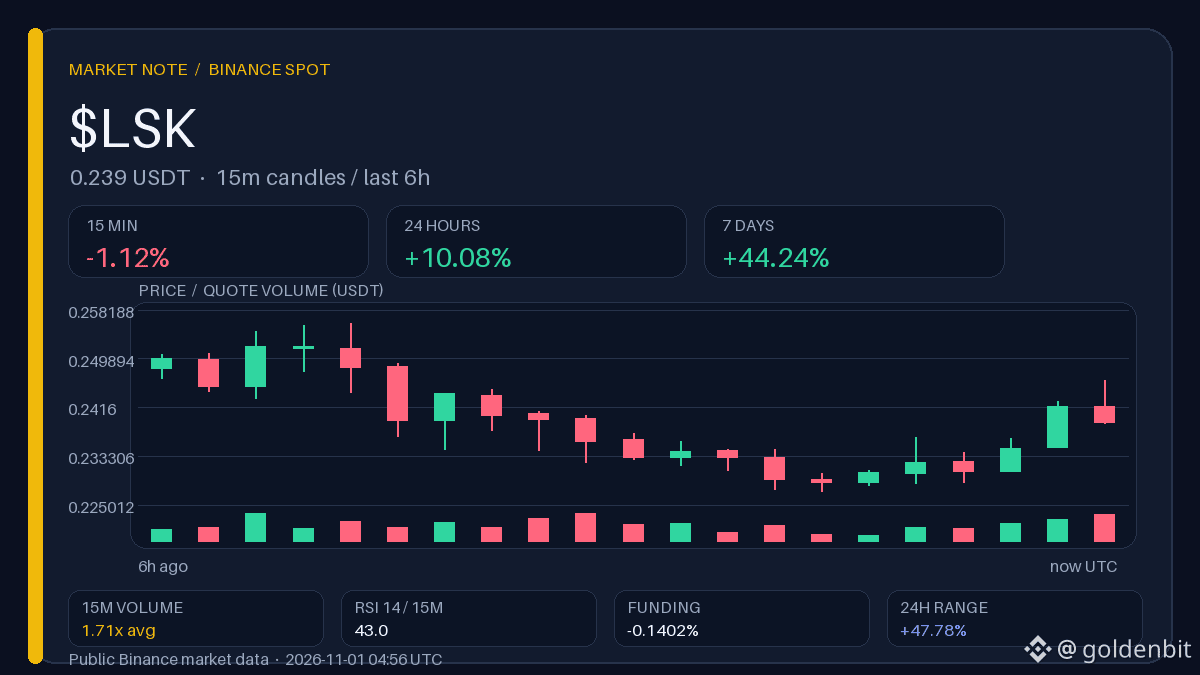
$LSK: Weekly gains hold, but funding is already paying for shorts
A 44.24% gain over the week doesn’t erase the imbalance: negative funding and weak intraday momentum are pulling in opposite directions. Funding at −0.1402% despite weekly gains suggests that shorts may be overcrowded, but the 15-minute chart is already down −1.12%, with RSI at 43.
Observation range · 5 h
Above 0.255900: A hold above the upper boundary of the range, while funding remains negative, would strengthen the case for pressure on shorts.
Below 0.227300: A move back below the lower boundary of the range would weaken the imbalance thesis and shift focus back to the 24-hour momentum.
These are historical levels; a single wick does not confirm a scenario.
↩️ Recap of the previous “Watchlist” issue (31.10 15:30 UTC): LSK 0.303100 → 0.229100 USDT (−24.41% in 12 h), funding −0.142% → −0.081%.
If funding stays negative while the price moves sideways, who will give in first—the shorts or the dip buyers?
Binance data, snapshot at 04:56 UTC. The author may receive rewards through Binance Square Write to Earn.
$LSK : Weekly gains hold, but funding is already paying for shorts
A 44.24% gain over the week doesn’t erase the imbalance: negative funding and weak intraday momentum are pulling in opposite directions. Funding at −0.1402% despite weekly gains suggests that shorts may be overcrowded, but the 15-minute chart is already down −1.12%, with RSI at 43.
Observation range · 5 h
Above 0.255900: A hold above the upper boundary of the range, while funding remains negative, would strengthen the case for pressure on shorts.
Below 0.227300: A move back below the lower boundary of the range would weaken the imbalance thesis and shift focus back to the 24-hour momentum.
These are historical levels; a single wick does not confirm a scenario.
↩️ Recap of the previous “Watchlist” issue (31.10 15:30 UTC): LSK 0.303100 → 0.229100 USDT (−24.41% in 12 h), funding −0.142% → −0.081%.
If funding stays negative while the price moves sideways, who will give in first—the shorts or the dip buyers?
Binance data, snapshot at 04:56 UTC. The author may receive rewards through Binance Square Write to Earn.
A 44.24% gain over the week doesn’t erase the imbalance: negative funding and weak intraday momentum are pulling in opposite directions. Funding at −0.1402% despite weekly gains suggests that shorts may be overcrowded, but the 15-minute chart is already down −1.12%, with RSI at 43.
Observation range · 5 h
Above 0.255900: A hold above the upper boundary of the range, while funding remains negative, would strengthen the case for pressure on shorts.
Below 0.227300: A move back below the lower boundary of the range would weaken the imbalance thesis and shift focus back to the 24-hour momentum.
These are historical levels; a single wick does not confirm a scenario.
↩️ Recap of the previous “Watchlist” issue (31.10 15:30 UTC): LSK 0.303100 → 0.229100 USDT (−24.41% in 12 h), funding −0.142% → −0.081%.
If funding stays negative while the price moves sideways, who will give in first—the shorts or the dip buyers?
Binance data, snapshot at 04:56 UTC. The author may receive rewards through Binance Square Write to Earn.
7
·
--
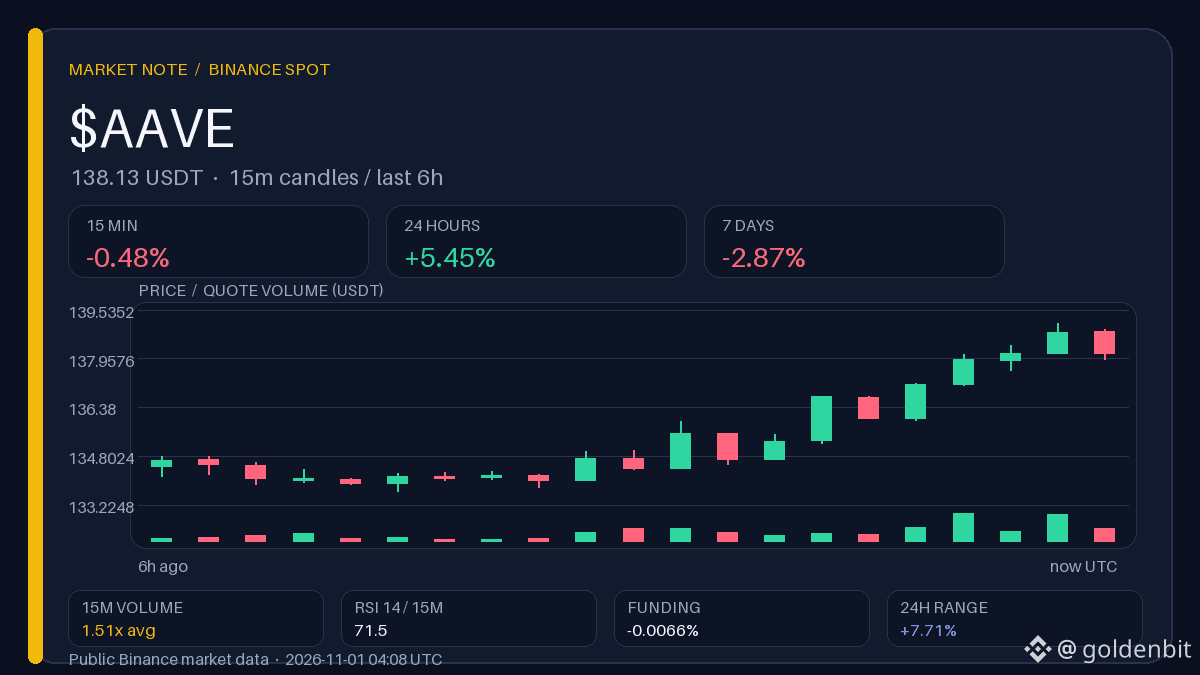
$AAVE near the upper boundary, but the short-term impulse is already moving against it
The daily and weekly trends are diverging: the 24-hour gain looks stronger than the weekly trend, while the last 15 minutes are already moving in the opposite direction. Price is near the upper edge of the 5-hour window, RSI is 71.5, and 15-minute volume is 1.51 times normal — there is confirmation, but funding is negative.
Observation range · 5 h
Above 139.10: A hold above the window’s upper boundary would strengthen the case that the daily impulse matters more than the short-term pullback.
Below 133.66: A return to the window’s lower boundary would support the view that the daily gain was a rebound within a weak week.
Historical levels; a single wick does not confirm a scenario.
What will outweigh the other: the daily gain, or the weak week and the 15-minute dip?
Binance data, snapshot at 04:08 UTC. The author may receive a reward through Binance Square Write to Earn.
$AAVE near the upper boundary, but the short-term impulse is already moving against it
The daily and weekly trends are diverging: the 24-hour gain looks stronger than the weekly trend, while the last 15 minutes are already moving in the opposite direction. Price is near the upper edge of the 5-hour window, RSI is 71.5, and 15-minute volume is 1.51 times normal — there is confirmation, but funding is negative.
Observation range · 5 h
Above 139.10: A hold above the window’s upper boundary would strengthen the case that the daily impulse matters more than the short-term pullback.
Below 133.66: A return to the window’s lower boundary would support the view that the daily gain was a rebound within a weak week.
Historical levels; a single wick does not confirm a scenario.
What will outweigh the other: the daily gain, or the weak week and the 15-minute dip?
Binance data, snapshot at 04:08 UTC. The author may receive a reward through Binance Square Write to Earn.
The daily and weekly trends are diverging: the 24-hour gain looks stronger than the weekly trend, while the last 15 minutes are already moving in the opposite direction. Price is near the upper edge of the 5-hour window, RSI is 71.5, and 15-minute volume is 1.51 times normal — there is confirmation, but funding is negative.
Observation range · 5 h
Above 139.10: A hold above the window’s upper boundary would strengthen the case that the daily impulse matters more than the short-term pullback.
Below 133.66: A return to the window’s lower boundary would support the view that the daily gain was a rebound within a weak week.
Historical levels; a single wick does not confirm a scenario.
What will outweigh the other: the daily gain, or the weak week and the 15-minute dip?
Binance data, snapshot at 04:08 UTC. The author may receive a reward through Binance Square Write to Earn.
2
·
--
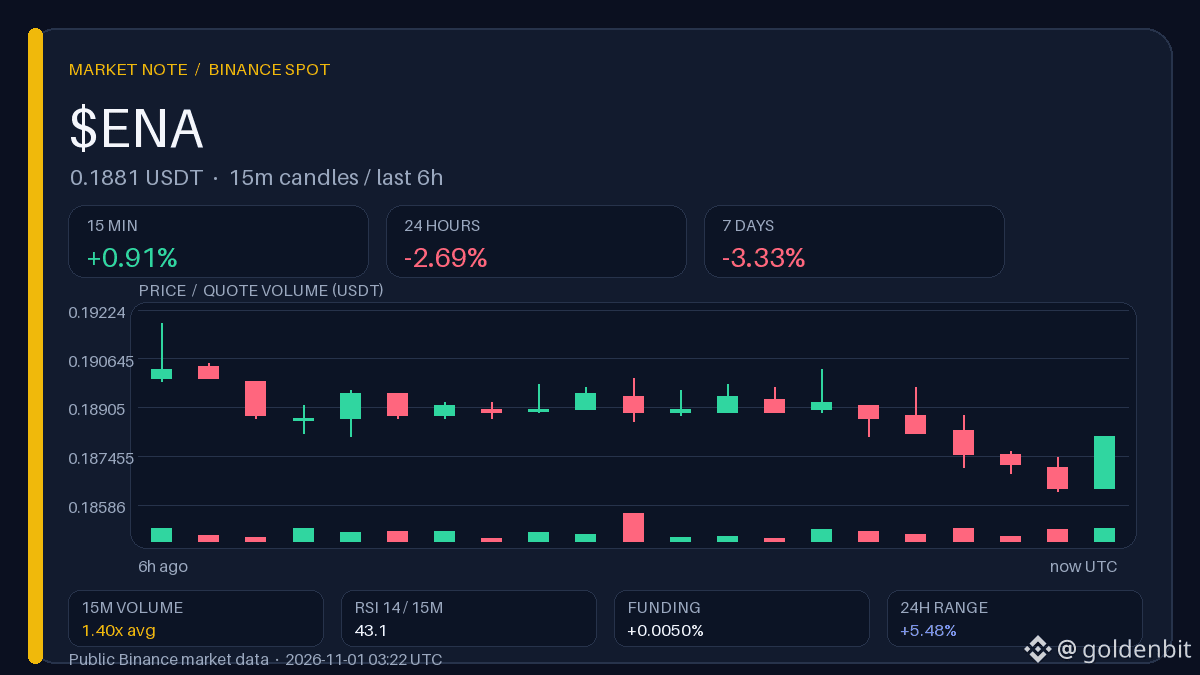
$ENA: A 15-minute rebound doesn’t erase daily weakness
The modest gain looks more like noise within a down day than the start of a reversal. The price rose 0.91% over 15 minutes on volume 1.4 times above normal, but it’s still down 2.69% over 24 hours, and an RSI of 43.1 shows no signs of overheating.
Observation range · 5 h
Above 0.191800: A hold above the upper boundary of the range would weaken the interpretation of the rebound as intraday noise.
Below 0.186300: A return to the lower boundary of the range would strengthen the view that the brief gain was merely a pullback.
Historical levels; a single wick does not confirm a scenario.
↩️ Previous issue of “Watchlist” recap (29.10 15:30 UTC): ENA 0.210900 → 0.183100 USDT (−13.18% in 12 h), funding +0.005% → +0.005%.
What matters more for the current hypothesis: volume returning to normal or the daily loss holding?
Binance data, snapshot at 03:22 UTC. The author may receive rewards through Binance Square Write to Earn.
$ENA : A 15-minute rebound doesn’t erase daily weakness
The modest gain looks more like noise within a down day than the start of a reversal. The price rose 0.91% over 15 minutes on volume 1.4 times above normal, but it’s still down 2.69% over 24 hours, and an RSI of 43.1 shows no signs of overheating.
Observation range · 5 h
Above 0.191800: A hold above the upper boundary of the range would weaken the interpretation of the rebound as intraday noise.
Below 0.186300: A return to the lower boundary of the range would strengthen the view that the brief gain was merely a pullback.
Historical levels; a single wick does not confirm a scenario.
↩️ Previous issue of “Watchlist” recap (29.10 15:30 UTC): ENA 0.210900 → 0.183100 USDT (−13.18% in 12 h), funding +0.005% → +0.005%.
What matters more for the current hypothesis: volume returning to normal or the daily loss holding?
Binance data, snapshot at 03:22 UTC. The author may receive rewards through Binance Square Write to Earn.
The modest gain looks more like noise within a down day than the start of a reversal. The price rose 0.91% over 15 minutes on volume 1.4 times above normal, but it’s still down 2.69% over 24 hours, and an RSI of 43.1 shows no signs of overheating.
Observation range · 5 h
Above 0.191800: A hold above the upper boundary of the range would weaken the interpretation of the rebound as intraday noise.
Below 0.186300: A return to the lower boundary of the range would strengthen the view that the brief gain was merely a pullback.
Historical levels; a single wick does not confirm a scenario.
↩️ Previous issue of “Watchlist” recap (29.10 15:30 UTC): ENA 0.210900 → 0.183100 USDT (−13.18% in 12 h), funding +0.005% → +0.005%.
What matters more for the current hypothesis: volume returning to normal or the daily loss holding?
Binance data, snapshot at 03:22 UTC. The author may receive rewards through Binance Square Write to Earn.
27
·
--
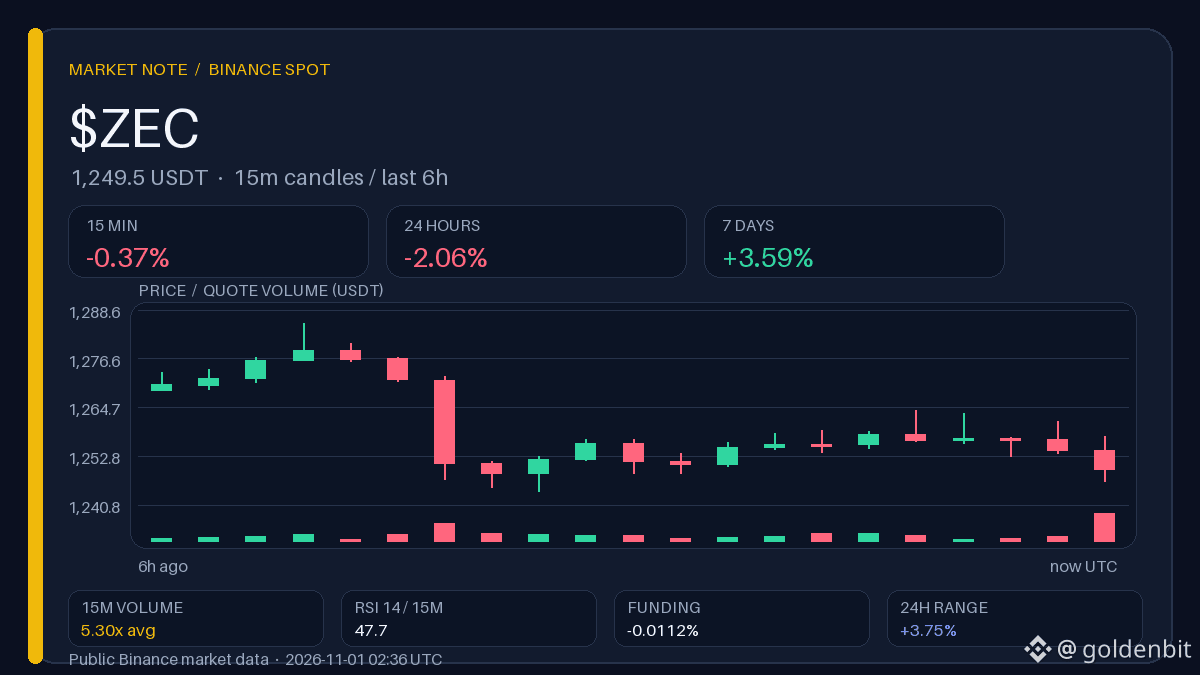
$ZEC: volume 5.3x above normal, but price is near the lower edge of the window
A volume spike without an upward move more often signals position unwinding than a new impulse. Over 24 hours, the price is down 2.06%, while the week is still up 3.59%: the brief volume spike has not yet been confirmed by price direction.
Observation range · 5 h
Above 1,285.29: A hold above the upper edge of the window would mean volume aligned with the direction rather than contradicting it.
Below 1,244.14: A return to the lower edge would strengthen the case that the volume spike was driven by position exits.
These are historical levels; a single wick does not confirm the scenario.
What would need to change in the price for this volume to stop looking like position unwinding?
Binance data, snapshot at 02:36 UTC. The author may receive rewards through Binance Square Write to Earn.
$ZEC : volume 5.3x above normal, but price is near the lower edge of the window
A volume spike without an upward move more often signals position unwinding than a new impulse. Over 24 hours, the price is down 2.06%, while the week is still up 3.59%: the brief volume spike has not yet been confirmed by price direction.
Observation range · 5 h
Above 1,285.29: A hold above the upper edge of the window would mean volume aligned with the direction rather than contradicting it.
Below 1,244.14: A return to the lower edge would strengthen the case that the volume spike was driven by position exits.
These are historical levels; a single wick does not confirm the scenario.
What would need to change in the price for this volume to stop looking like position unwinding?
Binance data, snapshot at 02:36 UTC. The author may receive rewards through Binance Square Write to Earn.
A volume spike without an upward move more often signals position unwinding than a new impulse. Over 24 hours, the price is down 2.06%, while the week is still up 3.59%: the brief volume spike has not yet been confirmed by price direction.
Observation range · 5 h
Above 1,285.29: A hold above the upper edge of the window would mean volume aligned with the direction rather than contradicting it.
Below 1,244.14: A return to the lower edge would strengthen the case that the volume spike was driven by position exits.
These are historical levels; a single wick does not confirm the scenario.
What would need to change in the price for this volume to stop looking like position unwinding?
Binance data, snapshot at 02:36 UTC. The author may receive rewards through Binance Square Write to Earn.
25
Log in to explore more content
Join global crypto users on Binance Square
⚡️ Get latest and useful information about crypto.
💬 Trusted by the world’s largest crypto exchange.
👍 Discover real insights from verified creators.
Email / Phone number
Trending Topics
BinanceReopensWithdrawalsForMoreAssets
4,055 views
263 Discussing
Security Incident | Recovery Update #6: Withdrawals Reopen for More Assets (2026-11-03)
Binance Announcement
·80 Likes
·188.5k views
AppleReportsMixedResults
3,722 views
241 Discussing
BinanceWithdrawalScamWarning
83,989 views
1,058 Discussing