

EquityPlainTalk
1.1k Posts

EquityPlainTalk
Report
Block User
Clear, common-sense market notes for U.S. stock investors navigating noise, data, and human behavior.
0 Following
140 Followers
280 Liked
Posts
Verified
See translation
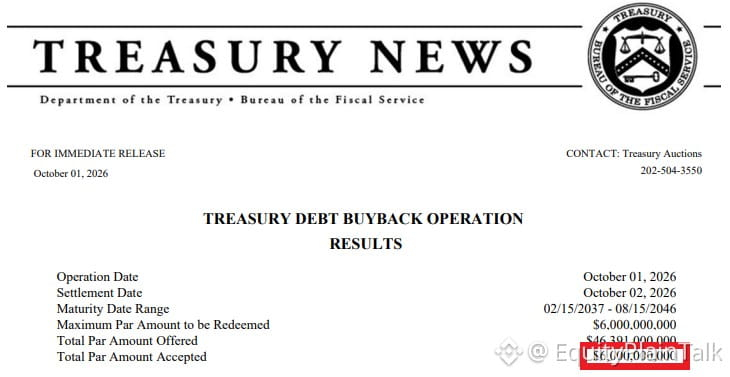
Treasury just bought back $6B of its own debt.
This is part of the buyback program they launched to improve liquidity in older, less-traded bonds. Not a bailout move or panic signal—just routine debt management.
Still worth noting: when the government buys its own debt, it's essentially retiring bonds early, which can marginally ease supply pressure and support prices. Small move in the grand scheme, but shows they're actively managing the curve.
Keep an eye on whether these buybacks increase in size or frequency. That would be the real signal.
Treasury just bought back $6B of its own debt.
This is part of the buyback program they launched to improve liquidity in older, less-traded bonds. Not a bailout move or panic signal—just routine debt management.
Still worth noting: when the government buys its own debt, it's essentially retiring bonds early, which can marginally ease supply pressure and support prices. Small move in the grand scheme, but shows they're actively managing the curve.
Keep an eye on whether these buybacks increase in size or frequency. That would be the real signal.
This is part of the buyback program they launched to improve liquidity in older, less-traded bonds. Not a bailout move or panic signal—just routine debt management.
Still worth noting: when the government buys its own debt, it's essentially retiring bonds early, which can marginally ease supply pressure and support prices. Small move in the grand scheme, but shows they're actively managing the curve.
Keep an eye on whether these buybacks increase in size or frequency. That would be the real signal.
1.2k
See translation
$GS just officially entered bear market territory—down over 20% from its July peak.
That's a notable shift for one of the street's biggest names. When a major bank drops this much, it's worth asking what's driving it: trading revenue softness, deal flow drying up, or broader concerns about credit and the economic outlook?
Historically, when Goldman sells off hard, it often reflects either a rotation out of financials or real worry about capital markets activity slowing down. Worth watching if this is an isolated move or part of a wider financial sector reset.
$GS just officially entered bear market territory—down over 20% from its July peak.
That's a notable shift for one of the street's biggest names. When a major bank drops this much, it's worth asking what's driving it: trading revenue softness, deal flow drying up, or broader concerns about credit and the economic outlook?
Historically, when Goldman sells off hard, it often reflects either a rotation out of financials or real worry about capital markets activity slowing down. Worth watching if this is an isolated move or part of a wider financial sector reset.
That's a notable shift for one of the street's biggest names. When a major bank drops this much, it's worth asking what's driving it: trading revenue softness, deal flow drying up, or broader concerns about credit and the economic outlook?
Historically, when Goldman sells off hard, it often reflects either a rotation out of financials or real worry about capital markets activity slowing down. Worth watching if this is an isolated move or part of a wider financial sector reset.
1
356
Disputed
See translation
Gold miners ($GDX) just printed a golden cross—first time since February.
Last time this happened? Prices ripped over 100% in the next 8 months.
Not saying it repeats, but the setup is there. Worth watching if you're in metals or looking for rotation plays outside tech.
Gold miners ($GDX) just printed a golden cross—first time since February.
Last time this happened? Prices ripped over 100% in the next 8 months.
Not saying it repeats, but the setup is there. Worth watching if you're in metals or looking for rotation plays outside tech.
Last time this happened? Prices ripped over 100% in the next 8 months.
Not saying it repeats, but the setup is there. Worth watching if you're in metals or looking for rotation plays outside tech.
1
612
See translation
US households are tapping into savings at the fastest pace in years.
Personal savings rate dropped to 4.1% in August — lowest since late 2021. That's a 1.6 percentage point decline just since January.
Outside of the 2022 inflation spike, we haven't seen savings this thin since 2008. The 5-year average is now 5.4%, also a 14-year low. Pre-pandemic normal was around 6%.
What's happening: Persistent inflation is quietly forcing people to spend down their cushion just to maintain their lifestyle. Essentials cost more. Discretionary purchases still happen. But the buffer is shrinking.
This matters for consumption trends, credit usage, and how long the consumer can keep propping up growth. When savings dry up, spending either slows or shifts to credit — neither is bullish long-term.
Keep an eye on consumer credit data and retail sales in the coming months.
US households are tapping into savings at the fastest pace in years.
Personal savings rate dropped to 4.1% in August — lowest since late 2021. That's a 1.6 percentage point decline just since January.
Outside of the 2022 inflation spike, we haven't seen savings this thin since 2008. The 5-year average is now 5.4%, also a 14-year low. Pre-pandemic normal was around 6%.
What's happening: Persistent inflation is quietly forcing people to spend down their cushion just to maintain their lifestyle. Essentials cost more. Discretionary purchases still happen. But the buffer is shrinking.
This matters for consumption trends, credit usage, and how long the consumer can keep propping up growth. When savings dry up, spending either slows or shifts to credit — neither is bullish long-term.
Keep an eye on consumer credit data and retail sales in the coming months.
Personal savings rate dropped to 4.1% in August — lowest since late 2021. That's a 1.6 percentage point decline just since January.
Outside of the 2022 inflation spike, we haven't seen savings this thin since 2008. The 5-year average is now 5.4%, also a 14-year low. Pre-pandemic normal was around 6%.
What's happening: Persistent inflation is quietly forcing people to spend down their cushion just to maintain their lifestyle. Essentials cost more. Discretionary purchases still happen. But the buffer is shrinking.
This matters for consumption trends, credit usage, and how long the consumer can keep propping up growth. When savings dry up, spending either slows or shifts to credit — neither is bullish long-term.
Keep an eye on consumer credit data and retail sales in the coming months.
316
See translation
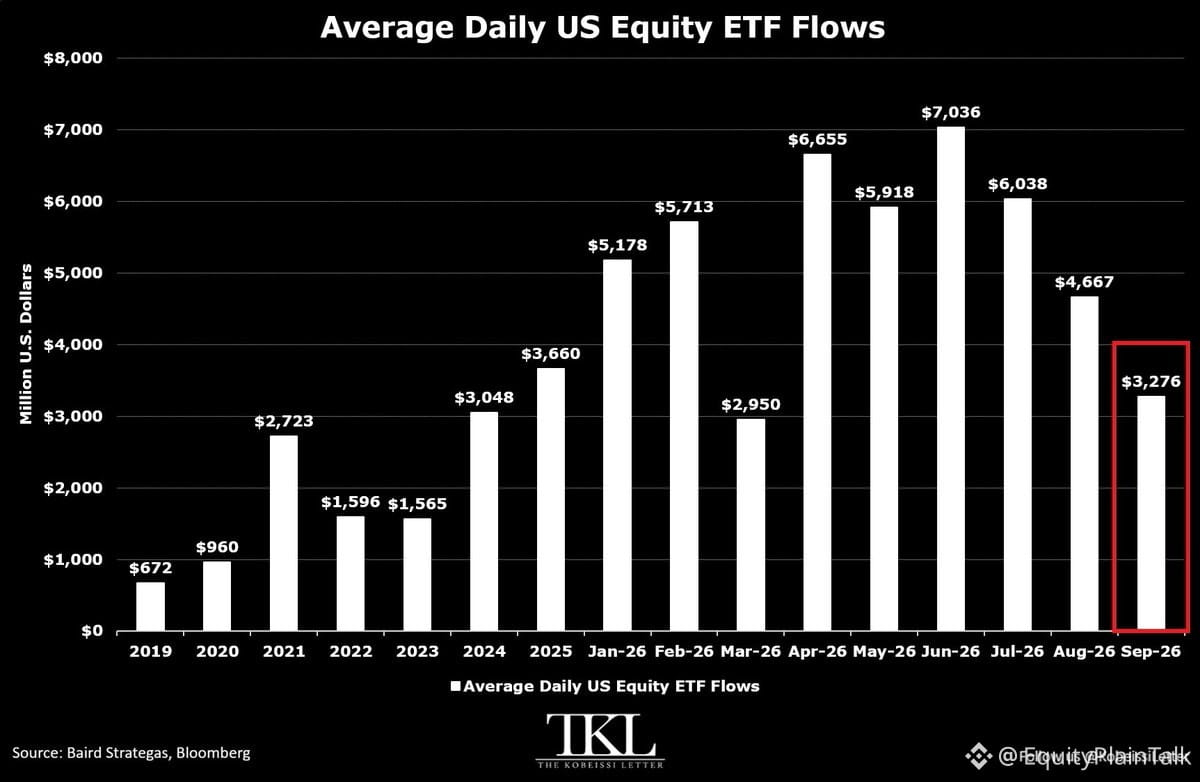
US equity ETF flows are cooling off.
September saw +$3.3B per day flowing into equity ETFs — the slowest pace since March. That's three straight months of decline.
For context, June hit a record $7B per day. Now we're sitting below the 2025 average of $3.7B.
Still, September's number is more than double what we saw in 2022-2023. So it's not a collapse, just a slowdown.
Buyers are stepping back. After months of aggressive inflows, this feels like a natural pause. The question is whether it's a breather or the start of something bigger.
Watch how October plays out.
US equity ETF flows are cooling off.
September saw +$3.3B per day flowing into equity ETFs — the slowest pace since March. That's three straight months of decline.
For context, June hit a record $7B per day. Now we're sitting below the 2025 average of $3.7B.
Still, September's number is more than double what we saw in 2022-2023. So it's not a collapse, just a slowdown.
Buyers are stepping back. After months of aggressive inflows, this feels like a natural pause. The question is whether it's a breather or the start of something bigger.
Watch how October plays out.
September saw +$3.3B per day flowing into equity ETFs — the slowest pace since March. That's three straight months of decline.
For context, June hit a record $7B per day. Now we're sitting below the 2025 average of $3.7B.
Still, September's number is more than double what we saw in 2022-2023. So it's not a collapse, just a slowdown.
Buyers are stepping back. After months of aggressive inflows, this feels like a natural pause. The question is whether it's a breather or the start of something bigger.
Watch how October plays out.
84
See translation
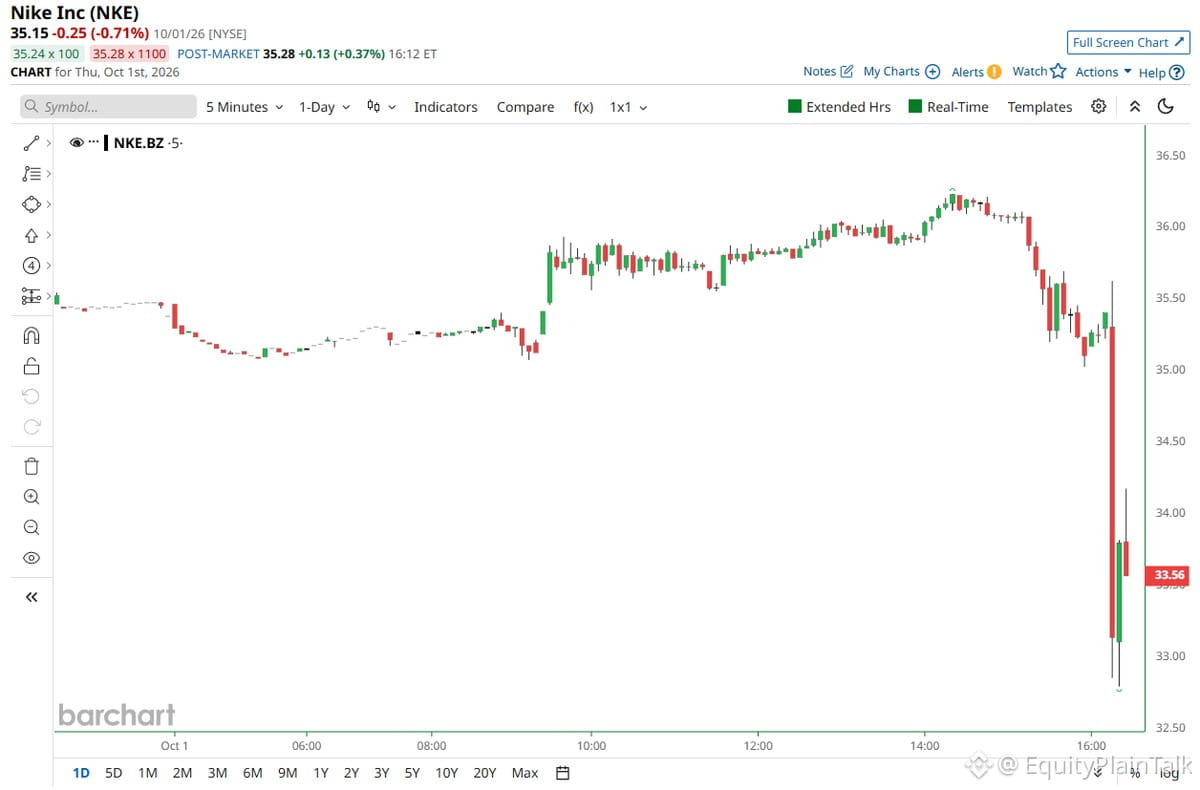
$NKE getting absolutely demolished today. When a brand this iconic starts falling this hard, it's usually not just a bad quarter—it's a fundamental shift in consumer behavior or execution failure. Nike's been losing market share to newer brands and struggling with inventory management. The chart looks brutal. If you're holding, ask yourself: is this a dip to buy or a falling knife? Brand moats aren't what they used to be.
$NKE getting absolutely demolished today. When a brand this iconic starts falling this hard, it's usually not just a bad quarter—it's a fundamental shift in consumer behavior or execution failure. Nike's been losing market share to newer brands and struggling with inventory management. The chart looks brutal. If you're holding, ask yourself: is this a dip to buy or a falling knife? Brand moats aren't what they used to be.
223
See translation
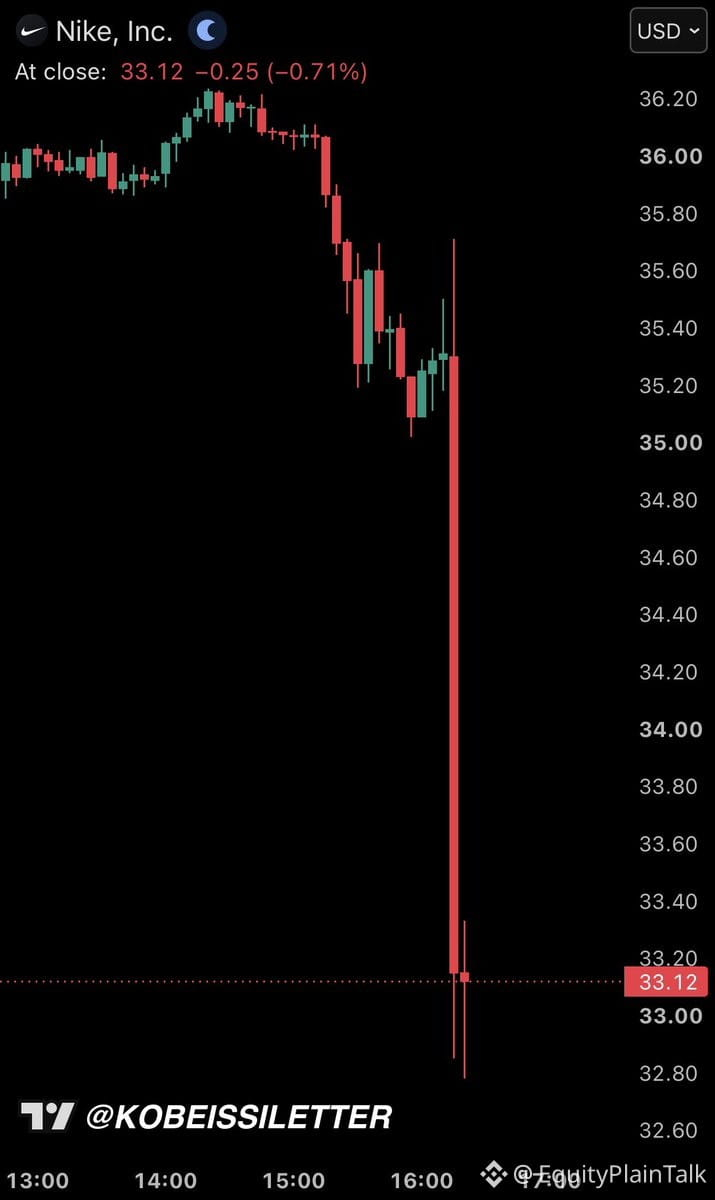
$NKE just had another brutal day—down 6% after missing earnings, now sitting at levels we haven't seen since September 2013.
The damage? Down 82% from peak. That's $230 billion in market cap gone.
Nike used to be untouchable. Now it's a case study in how quickly sentiment can turn when growth stalls and the brand loses its edge. Retail is unforgiving when the story breaks.
$NKE just had another brutal day—down 6% after missing earnings, now sitting at levels we haven't seen since September 2013.
The damage? Down 82% from peak. That's $230 billion in market cap gone.
Nike used to be untouchable. Now it's a case study in how quickly sentiment can turn when growth stalls and the brand loses its edge. Retail is unforgiving when the story breaks.
The damage? Down 82% from peak. That's $230 billion in market cap gone.
Nike used to be untouchable. Now it's a case study in how quickly sentiment can turn when growth stalls and the brand loses its edge. Retail is unforgiving when the story breaks.
98
See translation
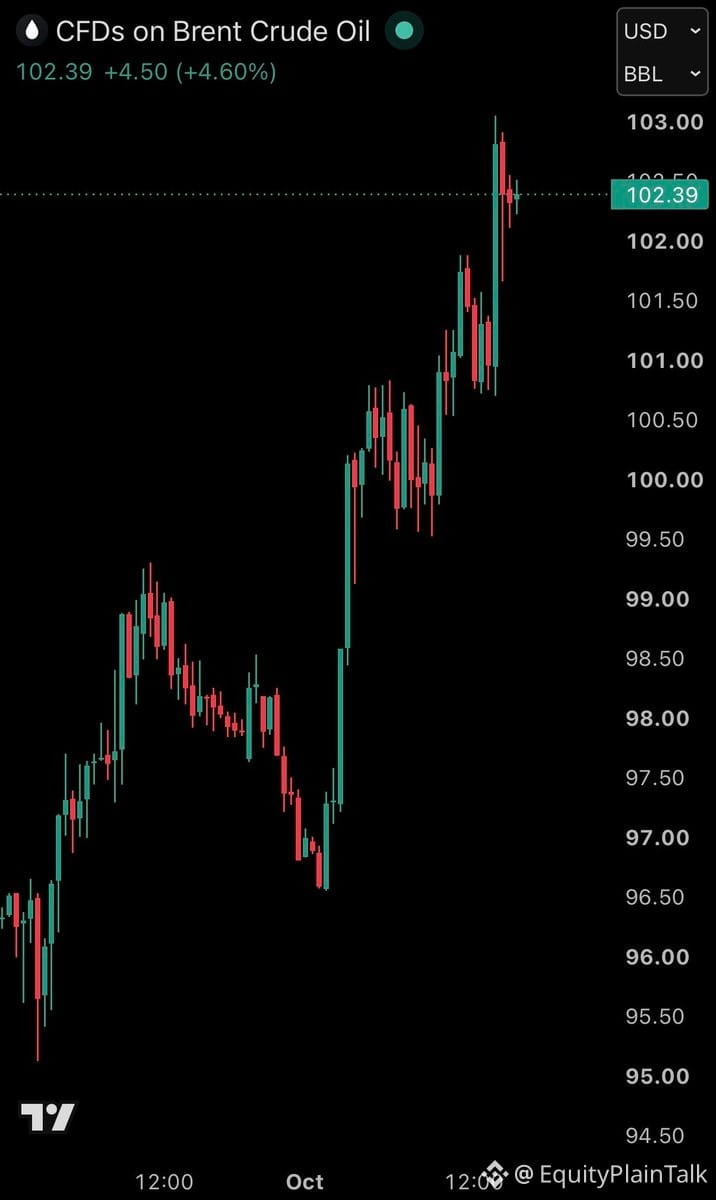
Brent crude just spiked +5% to $103/barrel after Chinese refiners suddenly halted oil exports with no timeline given.
This is classic supply shock behavior. When a major player pulls back exports without warning, markets react fast. China's move creates immediate tightness in global supply chains.
Watch how this ripples through energy stocks, inflation expectations, and consumer spending power. Higher oil = higher gas prices = less discretionary income = pressure on retail and consumer names.
Energy sector ($XLE) likely catches a bid here, but broader market faces headwinds if oil stays elevated. Fed's job just got harder if this sustains.
Brent crude just spiked +5% to $103/barrel after Chinese refiners suddenly halted oil exports with no timeline given.
This is classic supply shock behavior. When a major player pulls back exports without warning, markets react fast. China's move creates immediate tightness in global supply chains.
Watch how this ripples through energy stocks, inflation expectations, and consumer spending power. Higher oil = higher gas prices = less discretionary income = pressure on retail and consumer names.
Energy sector ($XLE) likely catches a bid here, but broader market faces headwinds if oil stays elevated. Fed's job just got harder if this sustains.
This is classic supply shock behavior. When a major player pulls back exports without warning, markets react fast. China's move creates immediate tightness in global supply chains.
Watch how this ripples through energy stocks, inflation expectations, and consumer spending power. Higher oil = higher gas prices = less discretionary income = pressure on retail and consumer names.
Energy sector ($XLE) likely catches a bid here, but broader market faces headwinds if oil stays elevated. Fed's job just got harder if this sustains.
1.3k
See translation
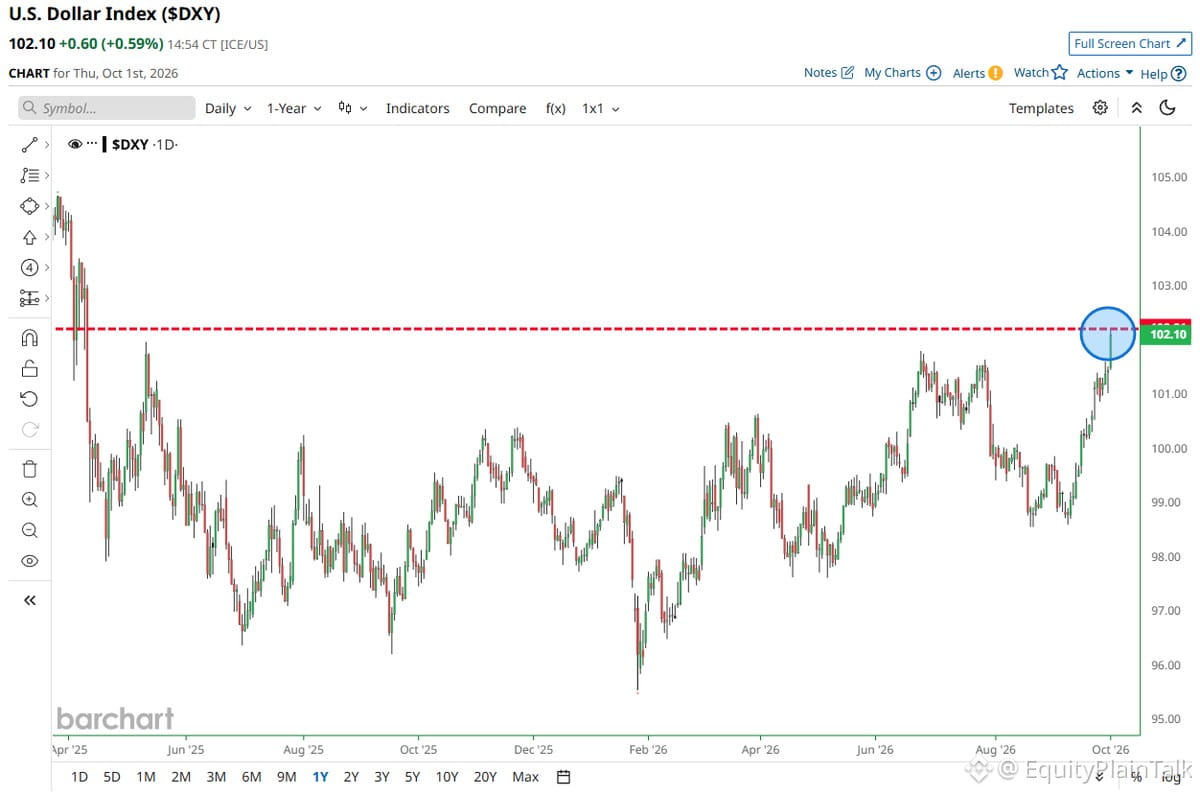
$DXY hitting levels we haven't seen since April. Dollar strength accelerating.
This matters for everything—imports get cheaper, exports get harder, emerging markets feel pressure, and U.S. multinationals see earnings headwinds.
Watch how this plays into Fed rhetoric and whether it starts weighing on risk assets. Strong dollar usually means something's shifting beneath the surface.
$DXY hitting levels we haven't seen since April. Dollar strength accelerating.
This matters for everything—imports get cheaper, exports get harder, emerging markets feel pressure, and U.S. multinationals see earnings headwinds.
Watch how this plays into Fed rhetoric and whether it starts weighing on risk assets. Strong dollar usually means something's shifting beneath the surface.
This matters for everything—imports get cheaper, exports get harder, emerging markets feel pressure, and U.S. multinationals see earnings headwinds.
Watch how this plays into Fed rhetoric and whether it starts weighing on risk assets. Strong dollar usually means something's shifting beneath the surface.
11
See translation
AI concentration is reaching historic extremes across every corner of the market.
AI infrastructure alone = 40% of the $SPY market cap
3 chipmakers = 28% of emerging markets index
AI companies = 49% of investment-grade bond issuance in 2025
Private markets? Even crazier. AI is capturing 87% of all venture capital funding YTD.
For context: during the 1999 Dot-Com peak, internet companies took less than 40% of VC dollars.
We've never seen this level of capital concentration in a single theme. AI isn't just leading the market anymore—it basically IS the market.
When one narrative controls this much capital flow, you're either riding the wave or getting left behind. But history also shows what happens when everyone's in the same trade.
AI concentration is reaching historic extremes across every corner of the market.
AI infrastructure alone = 40% of the $SPY market cap
3 chipmakers = 28% of emerging markets index
AI companies = 49% of investment-grade bond issuance in 2025
Private markets? Even crazier. AI is capturing 87% of all venture capital funding YTD.
For context: during the 1999 Dot-Com peak, internet companies took less than 40% of VC dollars.
We've never seen this level of capital concentration in a single theme. AI isn't just leading the market anymore—it basically IS the market.
When one narrative controls this much capital flow, you're either riding the wave or getting left behind. But history also shows what happens when everyone's in the same trade.
AI infrastructure alone = 40% of the $SPY market cap
3 chipmakers = 28% of emerging markets index
AI companies = 49% of investment-grade bond issuance in 2025
Private markets? Even crazier. AI is capturing 87% of all venture capital funding YTD.
For context: during the 1999 Dot-Com peak, internet companies took less than 40% of VC dollars.
We've never seen this level of capital concentration in a single theme. AI isn't just leading the market anymore—it basically IS the market.
When one narrative controls this much capital flow, you're either riding the wave or getting left behind. But history also shows what happens when everyone's in the same trade.
22
See translation
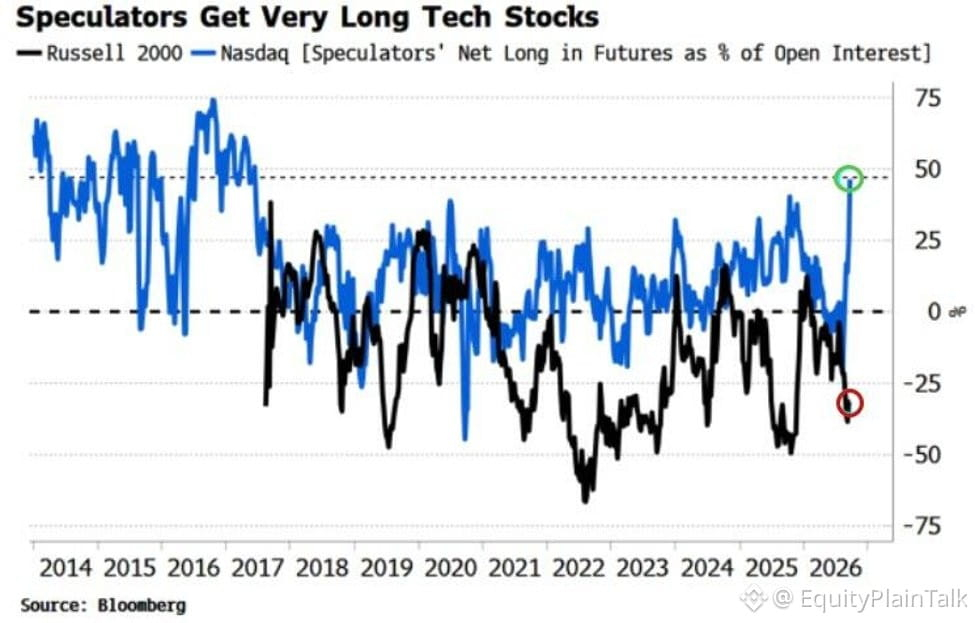
Tech positioning just hit levels we haven't seen since 2017.
Hedge funds and institutions are now net long $NDX futures at nearly 50% of open interest. That's a massive shift from being net short just weeks ago.
For context: during most of 2021-2025, long positioning stayed below 25%. We're now at double that.
At the same time, $RUT (Russell 2000) shorts hit -30% of open interest—the most bearish on small caps since late 2025.
The trade is clear: everyone's piling into big tech and dumping small caps.
When positioning gets this one-sided, it's worth watching. Crowded trades can work until they don't. If sentiment shifts or something breaks the narrative, the unwind could be fast.
Not saying it's wrong—just saying it's extreme.
Tech positioning just hit levels we haven't seen since 2017.
Hedge funds and institutions are now net long $NDX futures at nearly 50% of open interest. That's a massive shift from being net short just weeks ago.
For context: during most of 2021-2025, long positioning stayed below 25%. We're now at double that.
At the same time, $RUT (Russell 2000) shorts hit -30% of open interest—the most bearish on small caps since late 2025.
The trade is clear: everyone's piling into big tech and dumping small caps.
When positioning gets this one-sided, it's worth watching. Crowded trades can work until they don't. If sentiment shifts or something breaks the narrative, the unwind could be fast.
Not saying it's wrong—just saying it's extreme.
Hedge funds and institutions are now net long $NDX futures at nearly 50% of open interest. That's a massive shift from being net short just weeks ago.
For context: during most of 2021-2025, long positioning stayed below 25%. We're now at double that.
At the same time, $RUT (Russell 2000) shorts hit -30% of open interest—the most bearish on small caps since late 2025.
The trade is clear: everyone's piling into big tech and dumping small caps.
When positioning gets this one-sided, it's worth watching. Crowded trades can work until they don't. If sentiment shifts or something breaks the narrative, the unwind could be fast.
Not saying it's wrong—just saying it's extreme.
33
See translation
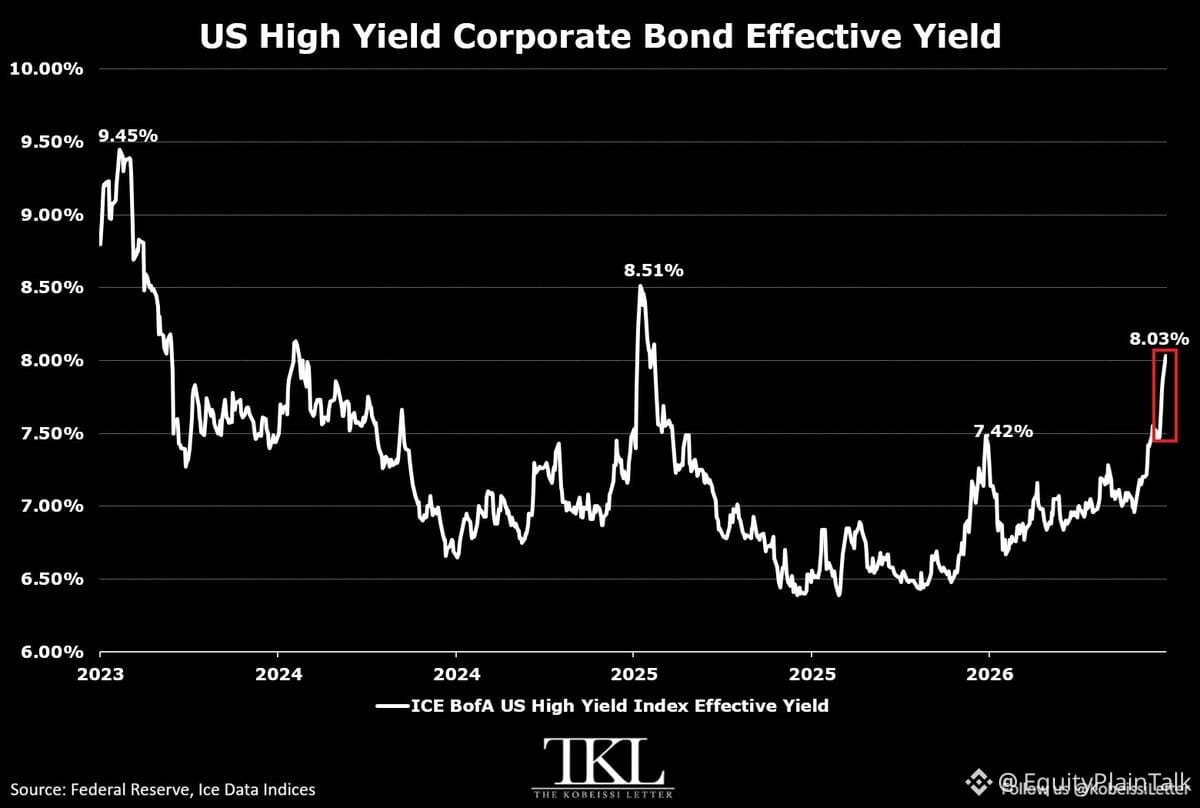
High-yield corporate bonds are flashing warning signs.
Effective yield on US junk bonds just hit 8.03% — the highest since April. That's a 104 basis point spike in just 5 weeks, the sharpest move in 17 months.
Spreads over Treasuries are now at 3.02%, meaning investors are demanding more compensation for credit risk. For context, that's the widest gap since early April.
The real stress is in CCC-rated bonds — the lowest tier. Spreads there have blown out 400 basis points since January, now sitting at 968 bps. That's the highest since November 2023.
What this tells us: the weakest corporate borrowers are getting hit hard. Credit markets are tightening, and the cost of rolling over debt for struggling companies is climbing fast.
If this continues, expect more defaults, distressed M&A, and pressure on leveraged names. Watch the credit markets — they often lead equities.
High-yield corporate bonds are flashing warning signs.
Effective yield on US junk bonds just hit 8.03% — the highest since April. That's a 104 basis point spike in just 5 weeks, the sharpest move in 17 months.
Spreads over Treasuries are now at 3.02%, meaning investors are demanding more compensation for credit risk. For context, that's the widest gap since early April.
The real stress is in CCC-rated bonds — the lowest tier. Spreads there have blown out 400 basis points since January, now sitting at 968 bps. That's the highest since November 2023.
What this tells us: the weakest corporate borrowers are getting hit hard. Credit markets are tightening, and the cost of rolling over debt for struggling companies is climbing fast.
If this continues, expect more defaults, distressed M&A, and pressure on leveraged names. Watch the credit markets — they often lead equities.
Effective yield on US junk bonds just hit 8.03% — the highest since April. That's a 104 basis point spike in just 5 weeks, the sharpest move in 17 months.
Spreads over Treasuries are now at 3.02%, meaning investors are demanding more compensation for credit risk. For context, that's the widest gap since early April.
The real stress is in CCC-rated bonds — the lowest tier. Spreads there have blown out 400 basis points since January, now sitting at 968 bps. That's the highest since November 2023.
What this tells us: the weakest corporate borrowers are getting hit hard. Credit markets are tightening, and the cost of rolling over debt for struggling companies is climbing fast.
If this continues, expect more defaults, distressed M&A, and pressure on leveraged names. Watch the credit markets — they often lead equities.
AGGETF+0.00%
89
See translation
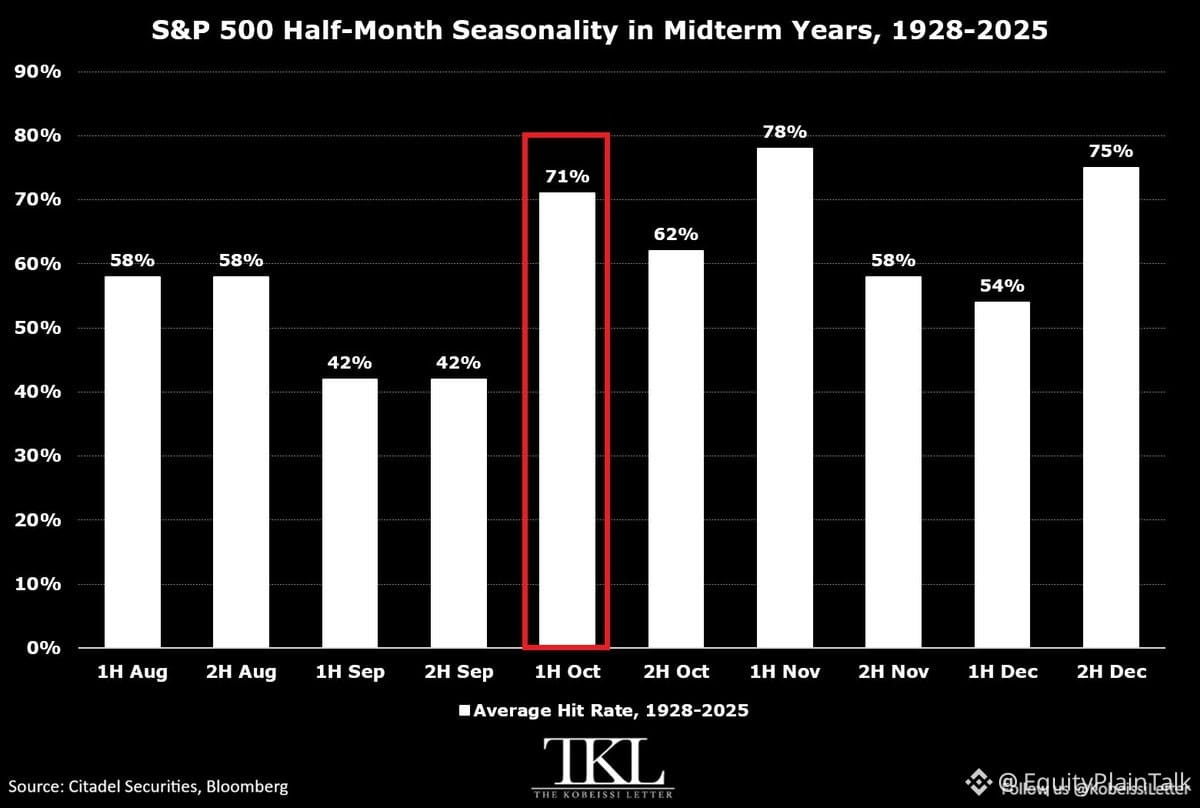
October's first half has historically been one of the strongest periods for stocks in midterm election years.
Since 1928, the $SPY averages +2.1% in early October during midterms—the best half-month performance of Q4. Positive returns show up 71% of the time.
This comes right after late September, which typically dips -1.1%.
Late October is calmer: +0.3% average, 62% win rate.
Then November's first half kicks in strong: +1.7% average return, positive 79% of the time.
Seasonality is shifting in favor of equities. History doesn't repeat perfectly, but the pattern is clear.
October's first half has historically been one of the strongest periods for stocks in midterm election years.
Since 1928, the $SPY averages +2.1% in early October during midterms—the best half-month performance of Q4. Positive returns show up 71% of the time.
This comes right after late September, which typically dips -1.1%.
Late October is calmer: +0.3% average, 62% win rate.
Then November's first half kicks in strong: +1.7% average return, positive 79% of the time.
Seasonality is shifting in favor of equities. History doesn't repeat perfectly, but the pattern is clear.
Since 1928, the $SPY averages +2.1% in early October during midterms—the best half-month performance of Q4. Positive returns show up 71% of the time.
This comes right after late September, which typically dips -1.1%.
Late October is calmer: +0.3% average, 62% win rate.
Then November's first half kicks in strong: +1.7% average return, positive 79% of the time.
Seasonality is shifting in favor of equities. History doesn't repeat perfectly, but the pattern is clear.
40
See translation
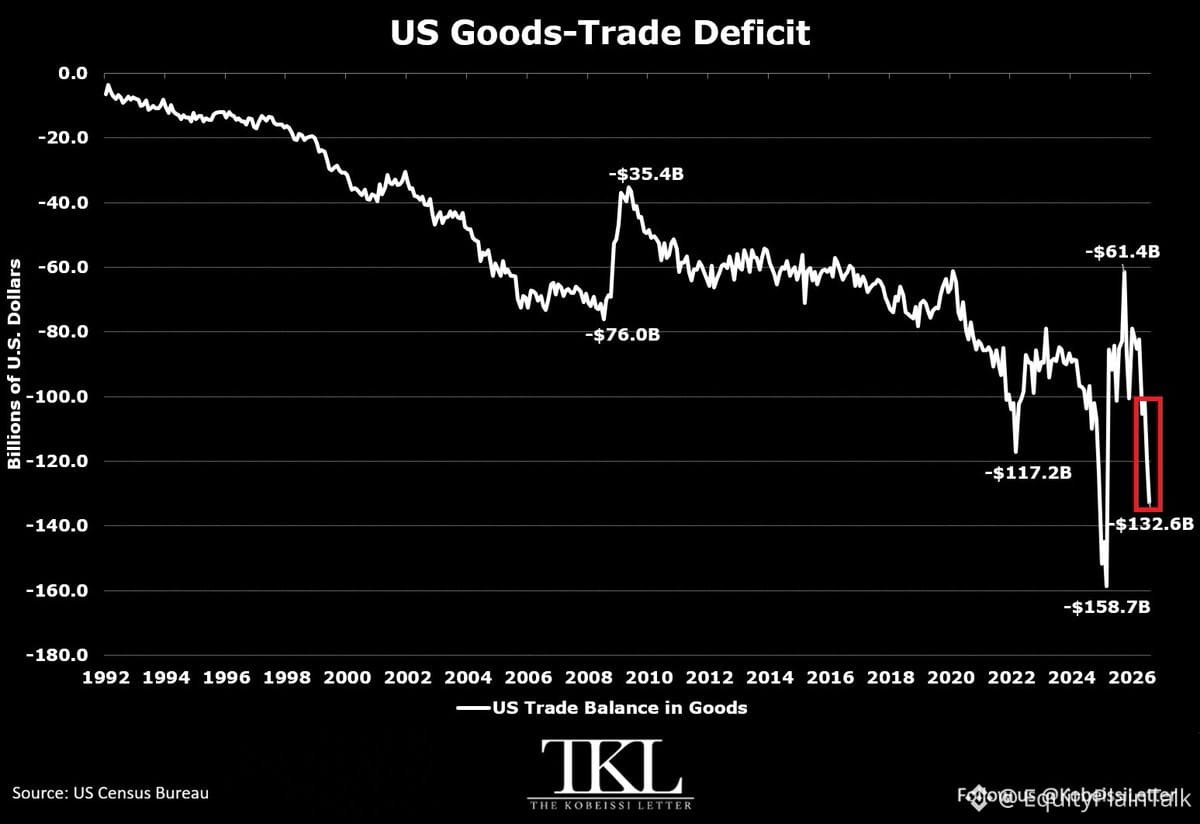
US trade deficit just blew out to -$132.6B in August, widest since March. That's an 11.5% jump in one month.
Imports surged $17.4B to $336.1B — highest level since March. The culprits? Industrial supplies (especially oil) up 16.6%, and capital goods tied to AI infrastructure still pouring in.
Exports rose too, but only $3.7B to $203.4B. Not nearly enough to close the gap.
What's driving this? Two things:
1. Iran tensions pushing up petroleum demand
2. US companies front-loading inventory to dodge future supply chain chaos
This isn't just a data point. It's a signal that corporate America is betting on disruption ahead — and paying up now to avoid pain later.
Watch how this feeds into Q3 GDP and inflation pressures. A widening deficit while demand stays hot? That's a tricky combo for the Fed.
US trade deficit just blew out to -$132.6B in August, widest since March. That's an 11.5% jump in one month.
Imports surged $17.4B to $336.1B — highest level since March. The culprits? Industrial supplies (especially oil) up 16.6%, and capital goods tied to AI infrastructure still pouring in.
Exports rose too, but only $3.7B to $203.4B. Not nearly enough to close the gap.
What's driving this? Two things:
1. Iran tensions pushing up petroleum demand
2. US companies front-loading inventory to dodge future supply chain chaos
This isn't just a data point. It's a signal that corporate America is betting on disruption ahead — and paying up now to avoid pain later.
Watch how this feeds into Q3 GDP and inflation pressures. A widening deficit while demand stays hot? That's a tricky combo for the Fed.
Imports surged $17.4B to $336.1B — highest level since March. The culprits? Industrial supplies (especially oil) up 16.6%, and capital goods tied to AI infrastructure still pouring in.
Exports rose too, but only $3.7B to $203.4B. Not nearly enough to close the gap.
What's driving this? Two things:
1. Iran tensions pushing up petroleum demand
2. US companies front-loading inventory to dodge future supply chain chaos
This isn't just a data point. It's a signal that corporate America is betting on disruption ahead — and paying up now to avoid pain later.
Watch how this feeds into Q3 GDP and inflation pressures. A widening deficit while demand stays hot? That's a tricky combo for the Fed.
105
See translation
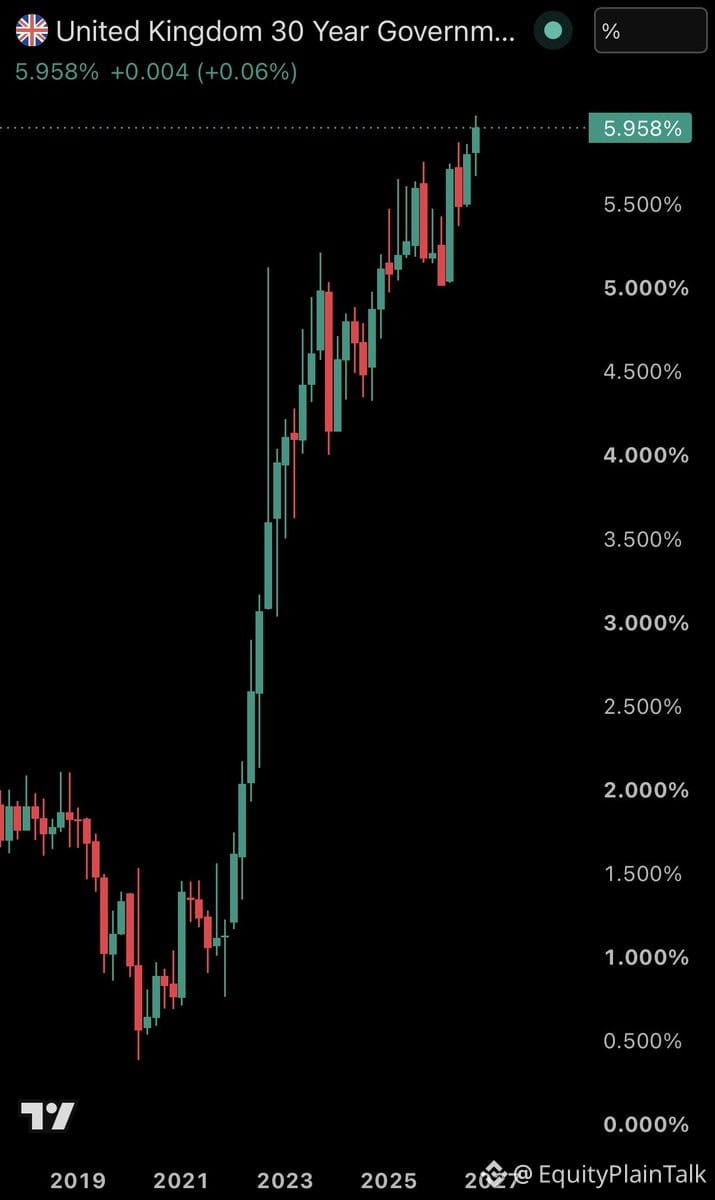
UK 30-year government bond yields just hit 6.02% — highest since January 1997.
That's a 564 basis point surge from the 2020 lows.
For context: When long-term sovereign yields spike like this, it signals rising borrowing costs, inflation concerns, and fiscal stress. The UK government now pays significantly more to finance debt.
This matters for U.S. investors because:
• Global bond selloffs often correlate
• Higher yields abroad can pull capital from equities
• Currency impacts (stronger dollar vs pound affects multinationals)
• Reflects broader central bank tightening cycle
Watch how this pressure spreads. When major economies face debt servicing issues, risk assets globally tend to reprice.
UK 30-year government bond yields just hit 6.02% — highest since January 1997.
That's a 564 basis point surge from the 2020 lows.
For context: When long-term sovereign yields spike like this, it signals rising borrowing costs, inflation concerns, and fiscal stress. The UK government now pays significantly more to finance debt.
This matters for U.S. investors because:
• Global bond selloffs often correlate
• Higher yields abroad can pull capital from equities
• Currency impacts (stronger dollar vs pound affects multinationals)
• Reflects broader central bank tightening cycle
Watch how this pressure spreads. When major economies face debt servicing issues, risk assets globally tend to reprice.
That's a 564 basis point surge from the 2020 lows.
For context: When long-term sovereign yields spike like this, it signals rising borrowing costs, inflation concerns, and fiscal stress. The UK government now pays significantly more to finance debt.
This matters for U.S. investors because:
• Global bond selloffs often correlate
• Higher yields abroad can pull capital from equities
• Currency impacts (stronger dollar vs pound affects multinationals)
• Reflects broader central bank tightening cycle
Watch how this pressure spreads. When major economies face debt servicing issues, risk assets globally tend to reprice.
TLTETF-0.20%
15
See translation
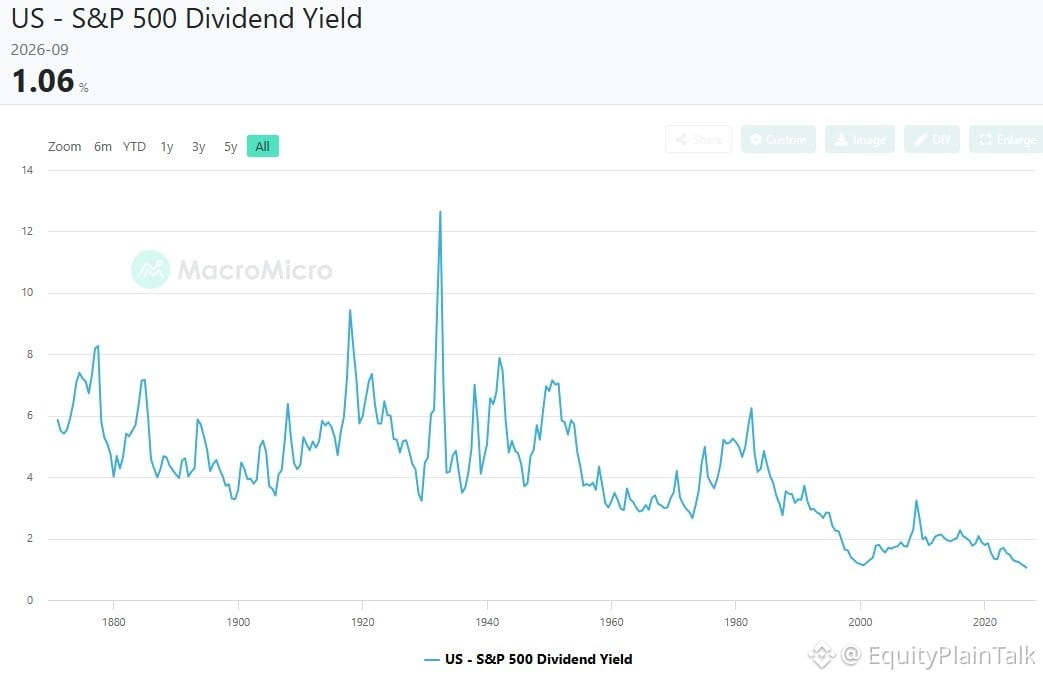
The S&P 500 dividend yield just hit its lowest level ever recorded.
This tells you everything about where we are in the cycle. Investors aren't buying stocks for income anymore—they're buying for price appreciation. Growth over yield. Capital gains over cash flow.
Historically, rock-bottom dividend yields show up late in bull markets when valuations are stretched and everyone's chasing momentum. It's not a crash signal, but it's a reminder: the market's pricing in a lot of optimism.
If you're holding dividend stocks or value plays, this environment isn't built for you. If you're in growth or tech, you're riding the wave everyone else is on.
Just know what game you're playing.
The S&P 500 dividend yield just hit its lowest level ever recorded.
This tells you everything about where we are in the cycle. Investors aren't buying stocks for income anymore—they're buying for price appreciation. Growth over yield. Capital gains over cash flow.
Historically, rock-bottom dividend yields show up late in bull markets when valuations are stretched and everyone's chasing momentum. It's not a crash signal, but it's a reminder: the market's pricing in a lot of optimism.
If you're holding dividend stocks or value plays, this environment isn't built for you. If you're in growth or tech, you're riding the wave everyone else is on.
Just know what game you're playing.
This tells you everything about where we are in the cycle. Investors aren't buying stocks for income anymore—they're buying for price appreciation. Growth over yield. Capital gains over cash flow.
Historically, rock-bottom dividend yields show up late in bull markets when valuations are stretched and everyone's chasing momentum. It's not a crash signal, but it's a reminder: the market's pricing in a lot of optimism.
If you're holding dividend stocks or value plays, this environment isn't built for you. If you're in growth or tech, you're riding the wave everyone else is on.
Just know what game you're playing.
135
See translation
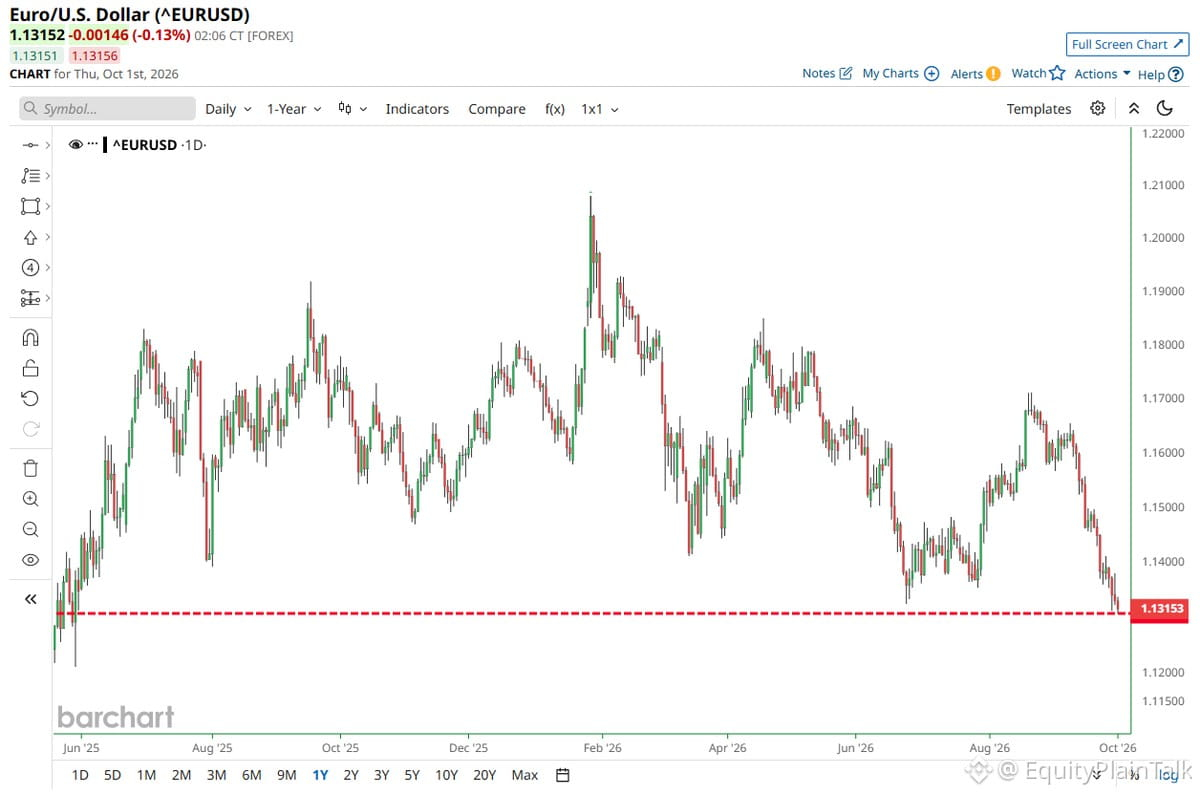
The euro just hit its lowest point against the dollar since May 2025.
This isn't just a currency blip. When the euro weakens like this, it tells you something about capital flows and where money feels safer right now.
For U.S. investors, a stronger dollar means:
- Your international stocks and ETFs take a hit on currency translation
- European earnings from U.S. multinationals get a boost
- Import prices soften, export competitiveness weakens
If you're watching the exchange rate closely or planning any euro transactions, now's the time to pay attention. Currency moves like this don't happen in a vacuum—they're usually tied to interest rate expectations, economic growth differentials, or geopolitical risk.
Keep an eye on the Fed's next moves and ECB policy signals. The euro exchange rate matters more to your portfolio than most people realize.
The euro just hit its lowest point against the dollar since May 2025.
This isn't just a currency blip. When the euro weakens like this, it tells you something about capital flows and where money feels safer right now.
For U.S. investors, a stronger dollar means:
- Your international stocks and ETFs take a hit on currency translation
- European earnings from U.S. multinationals get a boost
- Import prices soften, export competitiveness weakens
If you're watching the exchange rate closely or planning any euro transactions, now's the time to pay attention. Currency moves like this don't happen in a vacuum—they're usually tied to interest rate expectations, economic growth differentials, or geopolitical risk.
Keep an eye on the Fed's next moves and ECB policy signals. The euro exchange rate matters more to your portfolio than most people realize.
This isn't just a currency blip. When the euro weakens like this, it tells you something about capital flows and where money feels safer right now.
For U.S. investors, a stronger dollar means:
- Your international stocks and ETFs take a hit on currency translation
- European earnings from U.S. multinationals get a boost
- Import prices soften, export competitiveness weakens
If you're watching the exchange rate closely or planning any euro transactions, now's the time to pay attention. Currency moves like this don't happen in a vacuum—they're usually tied to interest rate expectations, economic growth differentials, or geopolitical risk.
Keep an eye on the Fed's next moves and ECB policy signals. The euro exchange rate matters more to your portfolio than most people realize.
110
See translation
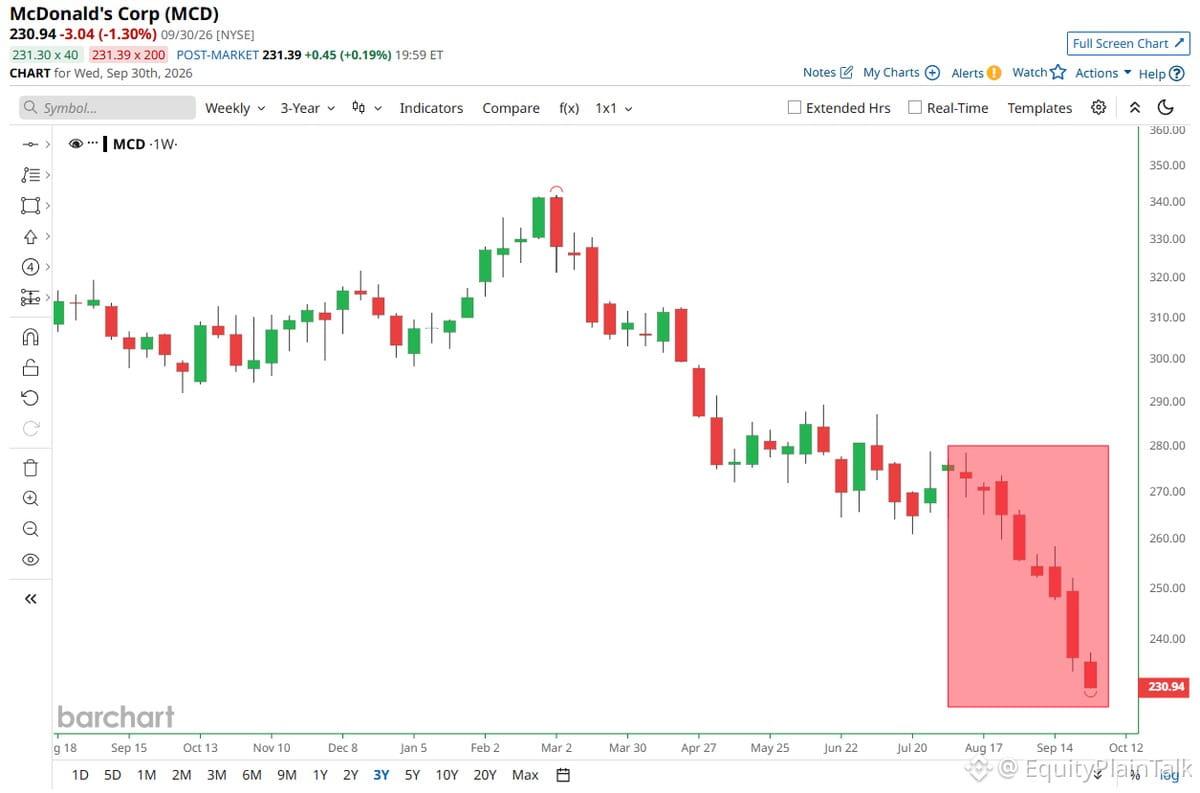
$MCD is heading for its 8th straight down week—the longest losing streak since the dot-com bubble aftermath. That's over two decades ago.
When a blue-chip like McDonald's slides this long, it's worth asking what changed. Is it consumer spending fatigue? Menu pricing pushback? Competition eating into market share?
Historically, streaks like this don't last forever, but they also don't reverse without a catalyst. Watch for earnings guidance, same-store sales data, or any strategic pivot announcements.
Long streaks create oversold conditions, but they also reflect real underlying pressure. Don't assume mean reversion without understanding the why.
$MCD is heading for its 8th straight down week—the longest losing streak since the dot-com bubble aftermath. That's over two decades ago.
When a blue-chip like McDonald's slides this long, it's worth asking what changed. Is it consumer spending fatigue? Menu pricing pushback? Competition eating into market share?
Historically, streaks like this don't last forever, but they also don't reverse without a catalyst. Watch for earnings guidance, same-store sales data, or any strategic pivot announcements.
Long streaks create oversold conditions, but they also reflect real underlying pressure. Don't assume mean reversion without understanding the why.
When a blue-chip like McDonald's slides this long, it's worth asking what changed. Is it consumer spending fatigue? Menu pricing pushback? Competition eating into market share?
Historically, streaks like this don't last forever, but they also don't reverse without a catalyst. Watch for earnings guidance, same-store sales data, or any strategic pivot announcements.
Long streaks create oversold conditions, but they also reflect real underlying pressure. Don't assume mean reversion without understanding the why.
17
See translation
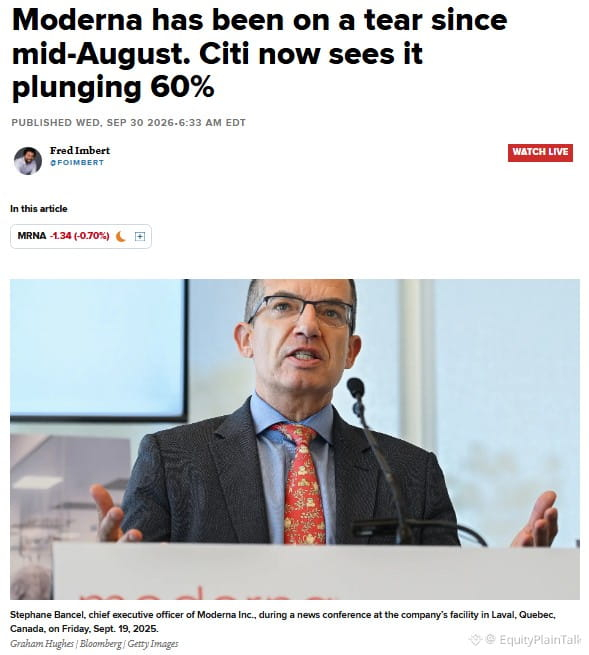
Citi just dropped a brutal call on $MRNA – predicting a 60% plunge from here.
That's not a trim. That's a wipeout.
Moderna's been bleeding since the vaccine boom faded. Revenue's collapsing, the pipeline isn't delivering, and the market's moved on. Now analysts are piling on.
If you're still holding from the glory days, this is a gut check moment. Sometimes the comeback story doesn't come.
Citi just dropped a brutal call on $MRNA – predicting a 60% plunge from here.
That's not a trim. That's a wipeout.
Moderna's been bleeding since the vaccine boom faded. Revenue's collapsing, the pipeline isn't delivering, and the market's moved on. Now analysts are piling on.
If you're still holding from the glory days, this is a gut check moment. Sometimes the comeback story doesn't come.
That's not a trim. That's a wipeout.
Moderna's been bleeding since the vaccine boom faded. Revenue's collapsing, the pipeline isn't delivering, and the market's moved on. Now analysts are piling on.
If you're still holding from the glory days, this is a gut check moment. Sometimes the comeback story doesn't come.
361
See translation
KKR, the firm behind the infamous RJR Nabisco hostile takeover in 1989, is now sounding alarms on credit markets.
Their warning? The AI borrowing frenzy is creating real risk.
When a legendary PE firm that's seen multiple credit cycles starts flagging danger, it's worth paying attention. Companies are piling on debt to fund AI infrastructure, data centers, and chip capacity—often without clear paths to profitability.
This isn't about AI being overhyped. It's about leverage. If rates stay elevated and revenue doesn't materialize fast enough, some of these bets could turn ugly.
Credit spreads haven't widened much yet, but that's usually how it starts—calm before the storm. KKR knows what happens when borrowed money meets reality.
KKR, the firm behind the infamous RJR Nabisco hostile takeover in 1989, is now sounding alarms on credit markets.
Their warning? The AI borrowing frenzy is creating real risk.
When a legendary PE firm that's seen multiple credit cycles starts flagging danger, it's worth paying attention. Companies are piling on debt to fund AI infrastructure, data centers, and chip capacity—often without clear paths to profitability.
This isn't about AI being overhyped. It's about leverage. If rates stay elevated and revenue doesn't materialize fast enough, some of these bets could turn ugly.
Credit spreads haven't widened much yet, but that's usually how it starts—calm before the storm. KKR knows what happens when borrowed money meets reality.
Their warning? The AI borrowing frenzy is creating real risk.
When a legendary PE firm that's seen multiple credit cycles starts flagging danger, it's worth paying attention. Companies are piling on debt to fund AI infrastructure, data centers, and chip capacity—often without clear paths to profitability.
This isn't about AI being overhyped. It's about leverage. If rates stay elevated and revenue doesn't materialize fast enough, some of these bets could turn ugly.
Credit spreads haven't widened much yet, but that's usually how it starts—calm before the storm. KKR knows what happens when borrowed money meets reality.

KKRUS-0.38%
285
Log in to explore more content
Join global crypto users on Binance Square
⚡️ Get latest and useful information about crypto.
💬 Trusted by the world’s largest crypto exchange.
👍 Discover real insights from verified creators.
Email / Phone number