
DegenShiro
9 Posts

DegenShiro
 Square Verified
Report
Block User
🧙♂️ // Why be good, When you can be great 🪄
❤️🔥 learning how to build with AI agents using grok
bot follow along if you’re interested in my journey!
4 Following
45 Followers
12 Liked
Posts
·
--

Article
See translation
The edge isn't finding the next 100x. It's knowing who's already behind the trade.If you're deep in the trenches, [@Bubblemaps.io](https://www.binance.com/en/square/profile/bubblemaps) has to be one of the core alpha tools in your stack.
Instead of chasing every ticker some anon KOL shills, here's how I use it:
1. Check the map before you bid:
See a ticker > hover the name > map comes up
What you're looking for:
> insider clusters
> bundled wallets
> how concentrated the supply actually is
Example of what happened to me today, saw a token on @arc already up 30%, looked like it was ripping and i was literally about to get a bid in. hovered it just to check, 6 linked wallets sitting on 55% of the supply.
yeah... passed on that one. pretty obvious insiders ran it up
why be the exit liquidity when the bundle is sitting right there
2. Check who's behind the breakout
This one I use more for trading than discovery.
> Token breaks a level
> Click in
> Look at the holders
Then ask yourself one thing: are new wallets actually coming in, or is it the same cluster passing bags between themselves?
Had one today where CT was screaming breakout. opened the map and it was the same few wallets rotating the supply around. that's wash trading, not demand
If the map is opening up and fresh holders are coming in, at least now you've got some context before deciding whether to chase
That's the part I like
You're not just looking at the candle
You're looking at who's behind the candle
3. Stop scrolling through noise
The dashboard feed is multichain and you can filter by:
> launchpad
> volume
> liquidity
> verified tokens
So instead of hunting whatever is trending with $8k liquidity, you can actually narrow down what you're looking at.
@arc being integrated from day one is interesting too. a lot of the launchpad attention and volume is sitting there right now, so being able to see what's moving without jumping around is useful
4. Find it → check it → trade it
There's an in-built swap with a flat 0.5% fee, so the whole flow is:
> find the token
> check the map
> check the holders
> make your call
> swap
Same interface. No opening 5 tabs while the candle is already gone.
and if you've traded low caps long enough you know how much speed matters
i've missed entries not because i was wrong, but because i spent 2 minutes jumping between a chart, explorer, wallet tracker and DEX. by the time i clicked buy it was done
That's why I think [@Bubblemaps.io](https://www.binance.com/en/square/profile/bubblemaps) is becoming more than just a wallet-mapping tool.
It's turning into a proper discovery + research + execution hub.
You still need to DYOR.
But seeing who's holding the supply and executing in the same place?
That's a pretty useful edge.
Personally i think they are building something really useful for the trenches and they already launched their token $BMT so if you like what they are building you probably can catch a nice rally
NFA
The edge isn't finding the next 100x. It's knowing who's already behind the trade.
If you're deep in the trenches, @Bubblemaps.io has to be one of the core alpha tools in your stack.
Instead of chasing every ticker some anon KOL shills, here's how I use it:
1. Check the map before you bid:
See a ticker > hover the name > map comes up
What you're looking for:
> insider clusters
> bundled wallets
> how concentrated the supply actually is
Example of what happened to me today, saw a token on @arc already up 30%, looked like it was ripping and i was literally about to get a bid in. hovered it just to check, 6 linked wallets sitting on 55% of the supply.
yeah... passed on that one. pretty obvious insiders ran it up
why be the exit liquidity when the bundle is sitting right there
2. Check who's behind the breakout
This one I use more for trading than discovery.
> Token breaks a level
> Click in
> Look at the holders
Then ask yourself one thing: are new wallets actually coming in, or is it the same cluster passing bags between themselves?
Had one today where CT was screaming breakout. opened the map and it was the same few wallets rotating the supply around. that's wash trading, not demand
If the map is opening up and fresh holders are coming in, at least now you've got some context before deciding whether to chase
That's the part I like
You're not just looking at the candle
You're looking at who's behind the candle
3. Stop scrolling through noise
The dashboard feed is multichain and you can filter by:
> launchpad
> volume
> liquidity
> verified tokens
So instead of hunting whatever is trending with $8k liquidity, you can actually narrow down what you're looking at.
@arc being integrated from day one is interesting too. a lot of the launchpad attention and volume is sitting there right now, so being able to see what's moving without jumping around is useful
4. Find it → check it → trade it
There's an in-built swap with a flat 0.5% fee, so the whole flow is:
> find the token
> check the map
> check the holders
> make your call
> swap
Same interface. No opening 5 tabs while the candle is already gone.
and if you've traded low caps long enough you know how much speed matters
i've missed entries not because i was wrong, but because i spent 2 minutes jumping between a chart, explorer, wallet tracker and DEX. by the time i clicked buy it was done
That's why I think @Bubblemaps.io is becoming more than just a wallet-mapping tool.
It's turning into a proper discovery + research + execution hub.
You still need to DYOR.
But seeing who's holding the supply and executing in the same place?
That's a pretty useful edge.
Personally i think they are building something really useful for the trenches and they already launched their token $BMT so if you like what they are building you probably can catch a nice rally
NFA
Instead of chasing every ticker some anon KOL shills, here's how I use it:
1. Check the map before you bid:
See a ticker > hover the name > map comes up
What you're looking for:
> insider clusters
> bundled wallets
> how concentrated the supply actually is
Example of what happened to me today, saw a token on @arc already up 30%, looked like it was ripping and i was literally about to get a bid in. hovered it just to check, 6 linked wallets sitting on 55% of the supply.
yeah... passed on that one. pretty obvious insiders ran it up
why be the exit liquidity when the bundle is sitting right there
2. Check who's behind the breakout
This one I use more for trading than discovery.
> Token breaks a level
> Click in
> Look at the holders
Then ask yourself one thing: are new wallets actually coming in, or is it the same cluster passing bags between themselves?
Had one today where CT was screaming breakout. opened the map and it was the same few wallets rotating the supply around. that's wash trading, not demand
If the map is opening up and fresh holders are coming in, at least now you've got some context before deciding whether to chase
That's the part I like
You're not just looking at the candle
You're looking at who's behind the candle
3. Stop scrolling through noise
The dashboard feed is multichain and you can filter by:
> launchpad
> volume
> liquidity
> verified tokens
So instead of hunting whatever is trending with $8k liquidity, you can actually narrow down what you're looking at.
@arc being integrated from day one is interesting too. a lot of the launchpad attention and volume is sitting there right now, so being able to see what's moving without jumping around is useful
4. Find it → check it → trade it
There's an in-built swap with a flat 0.5% fee, so the whole flow is:
> find the token
> check the map
> check the holders
> make your call
> swap
Same interface. No opening 5 tabs while the candle is already gone.
and if you've traded low caps long enough you know how much speed matters
i've missed entries not because i was wrong, but because i spent 2 minutes jumping between a chart, explorer, wallet tracker and DEX. by the time i clicked buy it was done
That's why I think @Bubblemaps.io is becoming more than just a wallet-mapping tool.
It's turning into a proper discovery + research + execution hub.
You still need to DYOR.
But seeing who's holding the supply and executing in the same place?
That's a pretty useful edge.
Personally i think they are building something really useful for the trenches and they already launched their token $BMT so if you like what they are building you probably can catch a nice rally
NFA
2
297
·
--
Bullish
See translation
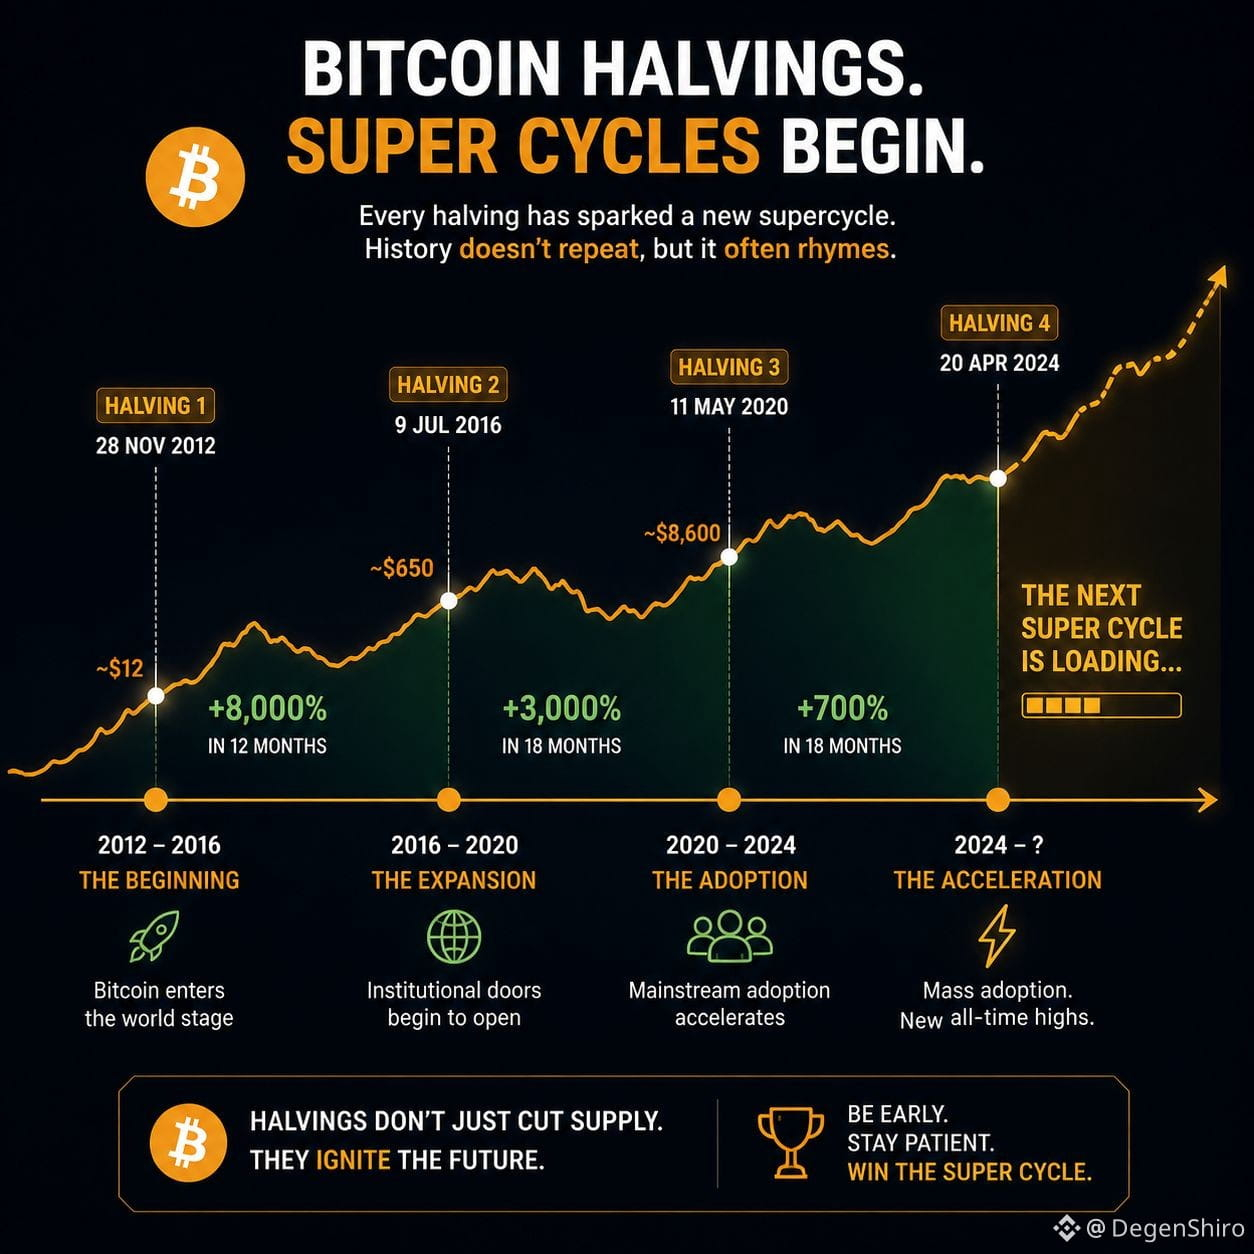
IF you're new to crypto, heres something you must learn and understand. The SuperCycle which correlates with $BTC Halving events.
Read more to understand how past cycles have behaved to plan for the upcoming bullrun.
What is a halving?
- Every 210,000 blocks (~4 years), miner rewards get cut in half. Same demand, less new coins hitting the market. That event is the halving.
Cycle Breakdown:
Historically, Bitcoin reaches its cycle peak roughly 12 to 18 months after a halving event.
- 2012 Halving (Cycle 1): Took 368 days to reach an ATH of $1,127 in November 2013.
- 2016 Halving (Cycle 2): Took 525 days to reach an ATH of $19,665 in December 2017.
- 2020 Halving (Cycle 3): Took 549 days to reach an ATH of $69,044 in November 2021.
- 2024 Halving (Cycle 4): Took approximately 534 days to reach a peak in $126,198 October 2025.}
Three things this actually teaches you:
- Timing clusters. Mature cycles topped ~17–18 months after the cut. Not the week of the halving. Not 3 years later.
- Returns compress. ~95x → ~30x → ~8x → ~2x from the halving print. Bigger market, smaller multiple. Plan for that, not 2013.
- The clock has two jobs. Accumulation lives in the quiet stretch after a blow-off. Distribution lives when everyone is already talking about the next ATH. Most people do the opposite.
Save this so you can come back later when youre trying to plan your strategy for accumulation/ trading/ investing/ exit TP.
Thank me in the next bull run 🙏
IF you're new to crypto, heres something you must learn and understand. The SuperCycle which correlates with $BTC Halving events.
Read more to understand how past cycles have behaved to plan for the upcoming bullrun.
What is a halving?
- Every 210,000 blocks (~4 years), miner rewards get cut in half. Same demand, less new coins hitting the market. That event is the halving.
Cycle Breakdown:
Historically, Bitcoin reaches its cycle peak roughly 12 to 18 months after a halving event.
- 2012 Halving (Cycle 1): Took 368 days to reach an ATH of $1,127 in November 2013.
- 2016 Halving (Cycle 2): Took 525 days to reach an ATH of $19,665 in December 2017.
- 2020 Halving (Cycle 3): Took 549 days to reach an ATH of $69,044 in November 2021.
- 2024 Halving (Cycle 4): Took approximately 534 days to reach a peak in $126,198 October 2025.}
Three things this actually teaches you:
- Timing clusters. Mature cycles topped ~17–18 months after the cut. Not the week of the halving. Not 3 years later.
- Returns compress. ~95x → ~30x → ~8x → ~2x from the halving print. Bigger market, smaller multiple. Plan for that, not 2013.
- The clock has two jobs. Accumulation lives in the quiet stretch after a blow-off. Distribution lives when everyone is already talking about the next ATH. Most people do the opposite.
Save this so you can come back later when youre trying to plan your strategy for accumulation/ trading/ investing/ exit TP.
Thank me in the next bull run 🙏
Read more to understand how past cycles have behaved to plan for the upcoming bullrun.
What is a halving?
- Every 210,000 blocks (~4 years), miner rewards get cut in half. Same demand, less new coins hitting the market. That event is the halving.
Cycle Breakdown:
Historically, Bitcoin reaches its cycle peak roughly 12 to 18 months after a halving event.
- 2012 Halving (Cycle 1): Took 368 days to reach an ATH of $1,127 in November 2013.
- 2016 Halving (Cycle 2): Took 525 days to reach an ATH of $19,665 in December 2017.
- 2020 Halving (Cycle 3): Took 549 days to reach an ATH of $69,044 in November 2021.
- 2024 Halving (Cycle 4): Took approximately 534 days to reach a peak in $126,198 October 2025.}
Three things this actually teaches you:
- Timing clusters. Mature cycles topped ~17–18 months after the cut. Not the week of the halving. Not 3 years later.
- Returns compress. ~95x → ~30x → ~8x → ~2x from the halving print. Bigger market, smaller multiple. Plan for that, not 2013.
- The clock has two jobs. Accumulation lives in the quiet stretch after a blow-off. Distribution lives when everyone is already talking about the next ATH. Most people do the opposite.
Save this so you can come back later when youre trying to plan your strategy for accumulation/ trading/ investing/ exit TP.
Thank me in the next bull run 🙏
1
1
132
·
--
Bullish
See translation
IF you were wondering what caused the rally in recent months and what is the flywheel behind it. $ZEC
{spot}(ZECUSDT)
Here's a quick TLDR:
1) ZEC mining is very profitable today for efficient Equihash ASICs, but that margin will likely compress as hashrate and difficulty catch up.
2) The rally is a reflexive mix of privacy/institutional-access narrative, new Base utility, momentum, and short-covering.
3) Rally flywheel:
- Institutional/privacy framing: Grayscale research and reported ZEC-product trading access have made ZEC the liquid privacy trade.
- New utility: official Zcash posts confirmed cbZEC availability on Base, adding EVM/DeFi distribution.
- Momentum: ZEC broke $1,000 after a very high-volume move, which pulled in retail attention and narrative buyers.
- Derivatives squeeze: Binance futures open interest rose from roughly $438M to $614M in a day while account positioning remains net short; forced covers amplified the move.
- Social reflexivity: "private Bitcoin," fixed 21M supply, and emerging Zcash-native meme/DeFi activity are attracting more speculative flow.
Near term, the move is extended: weekly RSI is about 75 and yearly RSI about 79. Binance funding is elevated, so a reversal can be violent.
Immediate resistance is about $1,020-$1,030; first supports are about $980 and then $935-$960.
Current read: ZEC price about $993 global aggregate; Binance spot about $994. 24h / 30d move +19.6% / +92.4%.
The important caveat: today's ZEC payout is unusually attractive because price rose much faster than mining difficulty.
More miners switching on = More secure and Privacy protection
HOWEVER, new Z15-class machines shipping - will dilute coins earned per machine.
Treat current profitability as a spot condition, not a durable ROI assumption.
IF you were wondering what caused the rally in recent months and what is the flywheel behind it. $ZEC
Here's a quick TLDR:
1) ZEC mining is very profitable today for efficient Equihash ASICs, but that margin will likely compress as hashrate and difficulty catch up.
2) The rally is a reflexive mix of privacy/institutional-access narrative, new Base utility, momentum, and short-covering.
3) Rally flywheel:
- Institutional/privacy framing: Grayscale research and reported ZEC-product trading access have made ZEC the liquid privacy trade.
- New utility: official Zcash posts confirmed cbZEC availability on Base, adding EVM/DeFi distribution.
- Momentum: ZEC broke $1,000 after a very high-volume move, which pulled in retail attention and narrative buyers.
- Derivatives squeeze: Binance futures open interest rose from roughly $438M to $614M in a day while account positioning remains net short; forced covers amplified the move.
- Social reflexivity: "private Bitcoin," fixed 21M supply, and emerging Zcash-native meme/DeFi activity are attracting more speculative flow.
Near term, the move is extended: weekly RSI is about 75 and yearly RSI about 79. Binance funding is elevated, so a reversal can be violent.
Immediate resistance is about $1,020-$1,030; first supports are about $980 and then $935-$960.
Current read: ZEC price about $993 global aggregate; Binance spot about $994. 24h / 30d move +19.6% / +92.4%.
The important caveat: today's ZEC payout is unusually attractive because price rose much faster than mining difficulty.
More miners switching on = More secure and Privacy protection
HOWEVER, new Z15-class machines shipping - will dilute coins earned per machine.
Treat current profitability as a spot condition, not a durable ROI assumption.
Here's a quick TLDR:
1) ZEC mining is very profitable today for efficient Equihash ASICs, but that margin will likely compress as hashrate and difficulty catch up.
2) The rally is a reflexive mix of privacy/institutional-access narrative, new Base utility, momentum, and short-covering.
3) Rally flywheel:
- Institutional/privacy framing: Grayscale research and reported ZEC-product trading access have made ZEC the liquid privacy trade.
- New utility: official Zcash posts confirmed cbZEC availability on Base, adding EVM/DeFi distribution.
- Momentum: ZEC broke $1,000 after a very high-volume move, which pulled in retail attention and narrative buyers.
- Derivatives squeeze: Binance futures open interest rose from roughly $438M to $614M in a day while account positioning remains net short; forced covers amplified the move.
- Social reflexivity: "private Bitcoin," fixed 21M supply, and emerging Zcash-native meme/DeFi activity are attracting more speculative flow.
Near term, the move is extended: weekly RSI is about 75 and yearly RSI about 79. Binance funding is elevated, so a reversal can be violent.
Immediate resistance is about $1,020-$1,030; first supports are about $980 and then $935-$960.
Current read: ZEC price about $993 global aggregate; Binance spot about $994. 24h / 30d move +19.6% / +92.4%.
The important caveat: today's ZEC payout is unusually attractive because price rose much faster than mining difficulty.
More miners switching on = More secure and Privacy protection
HOWEVER, new Z15-class machines shipping - will dilute coins earned per machine.
Treat current profitability as a spot condition, not a durable ROI assumption.

1
271
·
--
See translation
Bitcoin just pushed to $81,275. I do not see a new cycle in that. I see a test of a level I have been watching.
If you follow my work, this is the update I wanted you to have.
- Why it moved, what I think comes next, and how I am marking risk into the September 4 jobs report.
I still believe we are in the same 4-year cycle, with ETFs added. Not a brand-new ETF-era cycle.
A one-day jump on Fed hopes does not change that for me.
Here is how I am reading the market.
Bitcoin is up 5.04% in 24 hours, to $81,275. The rest of crypto is up with it. This looks like a macro move to me.
Bitcoin is moving almost in lockstep with the S&P 500, about 97% correlated. That usually means rates, not a sudden change in crypto internals.
The main reason, in my view: the Fed looks less likely to hike right now, so risk assets caught a bid.
The second reason: a short squeeze. More than $415 million in short positions got wiped out. That can send price up fast. It does not, on its own, tell me the trend has changed.
This is why $81k–$82.5k matters to me. I want a weekly close above $82.5k before I call this a trend. We are only tagging that zone.
How I am handling it
If Bitcoin holds above $78,500, I am watching $83,000 to $86,000 next.
If it loses $76,000, I am looking toward $72,000.
I am wrong if Bitcoin closes the week above $82.5k and buyers keep showing up.
The next number on my watchlist is the August jobs report on September 4.
That can move the Fed story in one morning.
I only get more bullish if Bitcoin finishes the week above $82.5k and holds it. Until then I am patient. Under $76k I get more defensive.
Are you treating this as the same 4-year cycle, or as a new ETF-era cycle?
How are you marking $82.5k into tomorrow’s jobs number? NFA.
Bitcoin just pushed to $81,275. I do not see a new cycle in that. I see a test of a level I have been watching.
If you follow my work, this is the update I wanted you to have.
- Why it moved, what I think comes next, and how I am marking risk into the September 4 jobs report.
I still believe we are in the same 4-year cycle, with ETFs added. Not a brand-new ETF-era cycle.
A one-day jump on Fed hopes does not change that for me.
Here is how I am reading the market. Bitcoin is up 5.04% in 24 hours, to $81,275. The rest of crypto is up with it. This looks like a macro move to me.
Bitcoin is moving almost in lockstep with the S&P 500, about 97% correlated. That usually means rates, not a sudden change in crypto internals.
The main reason, in my view: the Fed looks less likely to hike right now, so risk assets caught a bid.
The second reason: a short squeeze. More than $415 million in short positions got wiped out. That can send price up fast. It does not, on its own, tell me the trend has changed.
This is why $81k–$82.5k matters to me. I want a weekly close above $82.5k before I call this a trend. We are only tagging that zone.
How I am handling it If Bitcoin holds above $78,500, I am watching $83,000 to $86,000 next. If it loses $76,000, I am looking toward $72,000.
I am wrong if Bitcoin closes the week above $82.5k and buyers keep showing up.
The next number on my watchlist is the August jobs report on September 4.
That can move the Fed story in one morning.
I only get more bullish if Bitcoin finishes the week above $82.5k and holds it. Until then I am patient. Under $76k I get more defensive.
Are you treating this as the same 4-year cycle, or as a new ETF-era cycle?
How are you marking $82.5k into tomorrow’s jobs number? NFA.
If you follow my work, this is the update I wanted you to have.
- Why it moved, what I think comes next, and how I am marking risk into the September 4 jobs report.
I still believe we are in the same 4-year cycle, with ETFs added. Not a brand-new ETF-era cycle.
A one-day jump on Fed hopes does not change that for me.
Here is how I am reading the market. Bitcoin is up 5.04% in 24 hours, to $81,275. The rest of crypto is up with it. This looks like a macro move to me.
Bitcoin is moving almost in lockstep with the S&P 500, about 97% correlated. That usually means rates, not a sudden change in crypto internals.
The main reason, in my view: the Fed looks less likely to hike right now, so risk assets caught a bid.
The second reason: a short squeeze. More than $415 million in short positions got wiped out. That can send price up fast. It does not, on its own, tell me the trend has changed.
This is why $81k–$82.5k matters to me. I want a weekly close above $82.5k before I call this a trend. We are only tagging that zone.
How I am handling it If Bitcoin holds above $78,500, I am watching $83,000 to $86,000 next. If it loses $76,000, I am looking toward $72,000.
I am wrong if Bitcoin closes the week above $82.5k and buyers keep showing up.
The next number on my watchlist is the August jobs report on September 4.
That can move the Fed story in one morning.
I only get more bullish if Bitcoin finishes the week above $82.5k and holds it. Until then I am patient. Under $76k I get more defensive.
Are you treating this as the same 4-year cycle, or as a new ETF-era cycle?
How are you marking $82.5k into tomorrow’s jobs number? NFA.
2
2
709
·
--
Bullish
See translation
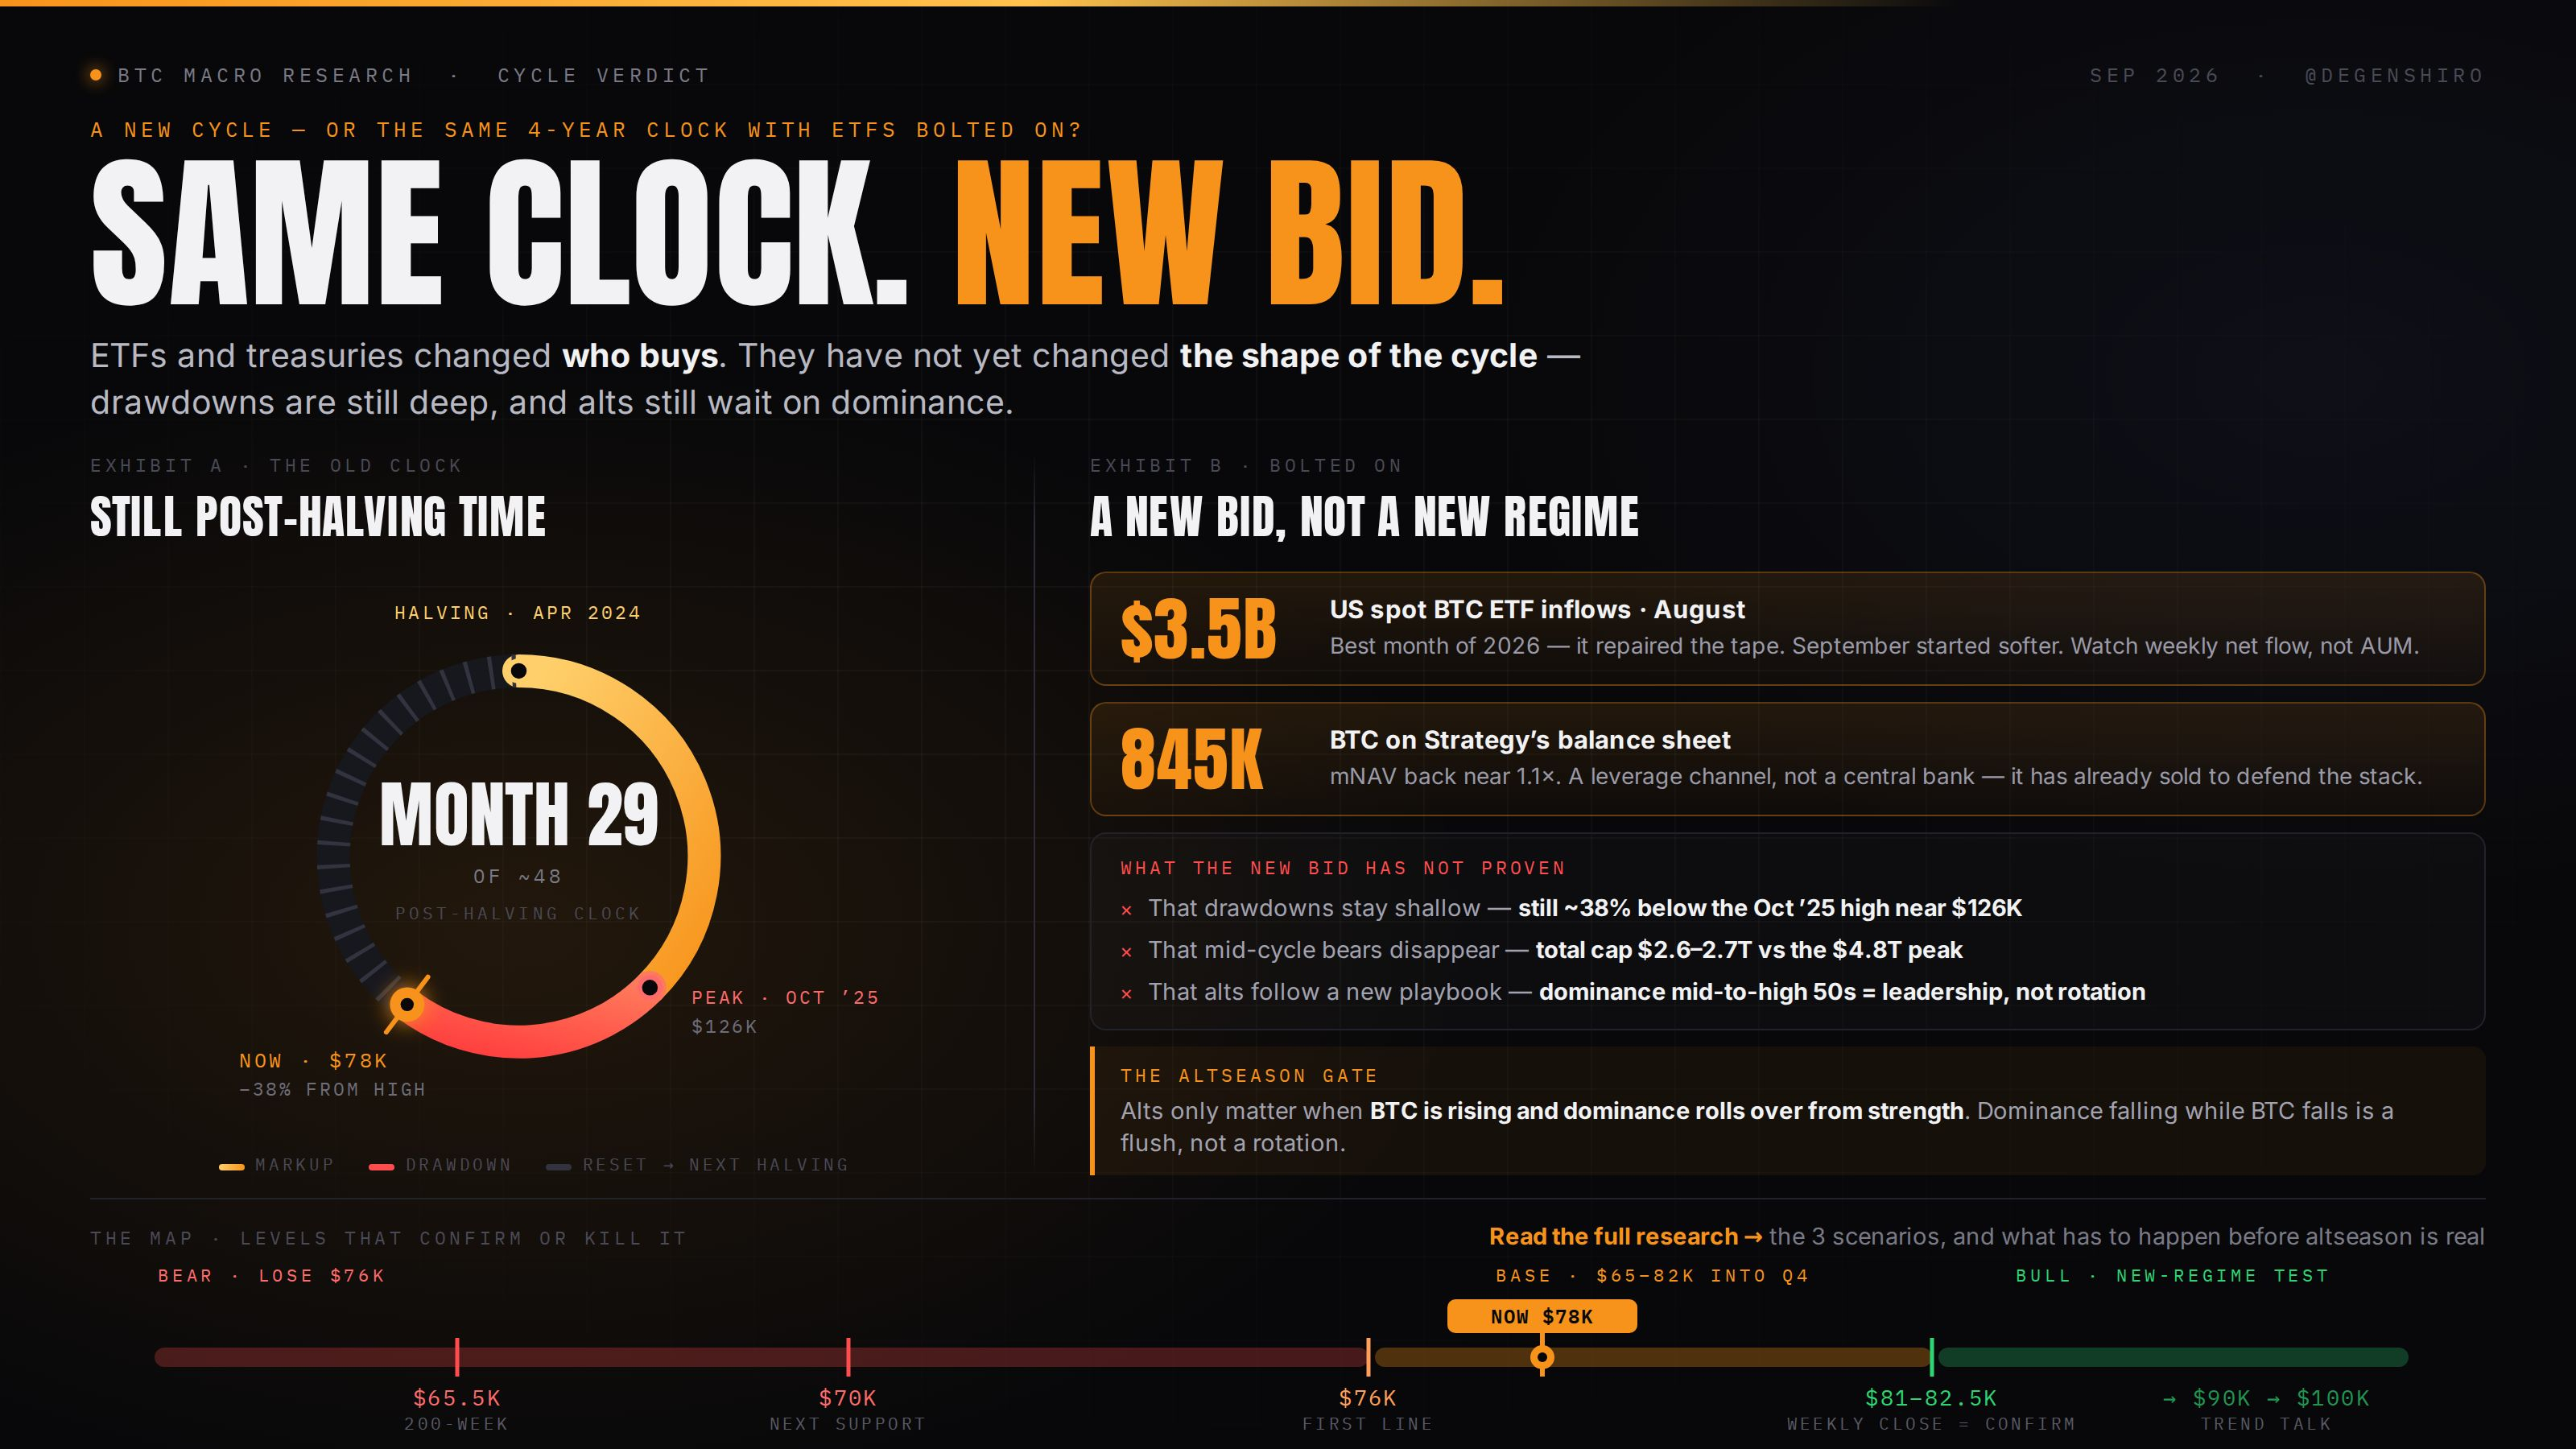
Are we in a new cycle, or the same 4-year supercycle with ETFs bolted on?
If you are deciding whether to treat September as a new bull, wait for alts, or stay in BTC, read my research >>>
You will get a cycle verdict, the levels that confirm or kill it, and what has to happen before altseason is real.
My verdict: This still looks like the old post-halving clock with a new bid, not a rewritten supercycle.
ETFs and treasuries changed who buys. They have not yet proven that drawdowns stay shallow, that mid-cycle bears disappear, or that alts follow a new playbook.
Why that is the base case BTC is ~$78k after a ~25% August bounce. Still ~38% below the Oct 6, 2025 high near $126k.
Total crypto market cap is ~$2.6–2.7T versus the Oct 2025 peak near $4.8T.
That $4.8T line is the real “new regime” test. US spot BTC ETFs took in ~$3.5B in August, the best month of 2026. That repaired the tape.
September already started softer. Watch weekly net flow, not AUM. Inflows buy coins. Outflows sell them.
BTC still runs the market. Dominance is mid-to-high 50s. That is leadership, not rotation.
Alts only matter when BTC is rising and dominance rolls over from strength.
Dominance falling while BTC falls is a flush.
Strategy is a leverage channel, not a central bank. ~845k BTC, mNAV back near 1.1x.
They can buy when the premium works and have already sold to defend the stack.
The map Resistance: weekly close above $81–82.5k.
Support: $76k, then $70k, then the 200-week near $65.5k.
3 scenarios:
1) Bull / new-regime: weekly close >$82.5k + ETF buying holds. Then $90k, then $100k is a trend talk. Alts wait for dominance to roll over from strength.
2) Base / old clock: $65–82k into Q4. August was repair, not confirmation.
3) Bear: lose $76k, then $70k
If you enjoyed my research on macro trends, join me on my journey navigating the upcoming market!
Are we in a new cycle, or the same 4-year supercycle with ETFs bolted on?
If you are deciding whether to treat September as a new bull, wait for alts, or stay in BTC, read my research >>>
You will get a cycle verdict, the levels that confirm or kill it, and what has to happen before altseason is real.
My verdict: This still looks like the old post-halving clock with a new bid, not a rewritten supercycle.
ETFs and treasuries changed who buys. They have not yet proven that drawdowns stay shallow, that mid-cycle bears disappear, or that alts follow a new playbook.
Why that is the base case BTC is ~$78k after a ~25% August bounce. Still ~38% below the Oct 6, 2025 high near $126k.
Total crypto market cap is ~$2.6–2.7T versus the Oct 2025 peak near $4.8T.
That $4.8T line is the real “new regime” test. US spot BTC ETFs took in ~$3.5B in August, the best month of 2026. That repaired the tape.
September already started softer. Watch weekly net flow, not AUM. Inflows buy coins. Outflows sell them.
BTC still runs the market. Dominance is mid-to-high 50s. That is leadership, not rotation.
Alts only matter when BTC is rising and dominance rolls over from strength.
Dominance falling while BTC falls is a flush.
Strategy is a leverage channel, not a central bank. ~845k BTC, mNAV back near 1.1x.
They can buy when the premium works and have already sold to defend the stack.
The map Resistance: weekly close above $81–82.5k.
Support: $76k, then $70k, then the 200-week near $65.5k.
3 scenarios:
1) Bull / new-regime: weekly close >$82.5k + ETF buying holds. Then $90k, then $100k is a trend talk. Alts wait for dominance to roll over from strength.
2) Base / old clock: $65–82k into Q4. August was repair, not confirmation.
3) Bear: lose $76k, then $70k
If you enjoyed my research on macro trends, join me on my journey navigating the upcoming market!
If you are deciding whether to treat September as a new bull, wait for alts, or stay in BTC, read my research >>>
You will get a cycle verdict, the levels that confirm or kill it, and what has to happen before altseason is real.
My verdict: This still looks like the old post-halving clock with a new bid, not a rewritten supercycle.
ETFs and treasuries changed who buys. They have not yet proven that drawdowns stay shallow, that mid-cycle bears disappear, or that alts follow a new playbook.
Why that is the base case BTC is ~$78k after a ~25% August bounce. Still ~38% below the Oct 6, 2025 high near $126k.
Total crypto market cap is ~$2.6–2.7T versus the Oct 2025 peak near $4.8T.
That $4.8T line is the real “new regime” test. US spot BTC ETFs took in ~$3.5B in August, the best month of 2026. That repaired the tape.
September already started softer. Watch weekly net flow, not AUM. Inflows buy coins. Outflows sell them.
BTC still runs the market. Dominance is mid-to-high 50s. That is leadership, not rotation.
Alts only matter when BTC is rising and dominance rolls over from strength.
Dominance falling while BTC falls is a flush.
Strategy is a leverage channel, not a central bank. ~845k BTC, mNAV back near 1.1x.
They can buy when the premium works and have already sold to defend the stack.
The map Resistance: weekly close above $81–82.5k.
Support: $76k, then $70k, then the 200-week near $65.5k.
3 scenarios:
1) Bull / new-regime: weekly close >$82.5k + ETF buying holds. Then $90k, then $100k is a trend talk. Alts wait for dominance to roll over from strength.
2) Base / old clock: $65–82k into Q4. August was repair, not confirmation.
3) Bear: lose $76k, then $70k
If you enjoyed my research on macro trends, join me on my journey navigating the upcoming market!
4
3
1.9k
Log in to explore more content
Join global crypto users on Binance Square
⚡️ Get latest and useful information about crypto.
💬 Trusted by the world’s largest crypto exchange.
👍 Discover real insights from verified creators.
Email / Phone number
Trending Topics
BitcoinSurpasses$77000
11,034 views
167 Discussing
$BTC is ripping higher despite it all. 🚀
Today marked the first rate hike in over 3 years, while the CLARITY Act stalled again yesterday.
Setup big long again - thank me later
Entry : $75500 - $76500
Stoploss : $74900
Take profit : $77000 - $78000
Get ready for a crazy growth cycle. 🔥
TF_bnb
·16 Likes
·6.7k views
ParadigmDisclosesZECHolding
41,714 views
803 Discussing
BitcoinETFsShed$450M
20,835 views
187 Discussing