
Huutruong039811
10.6k Posts

Huutruong039811
Report
Block User
Crypto Airdrop Daily | Follow for new opportunities | Binance UID 152277880 | X Huutruong039811 | KITE 277880 🇻🇳
Open Trade
High-Frequency Trader
5.5 Years
3.6K+ Following
2.4K+ Followers
847 Liked
Posts
Portfolio
All
Quotes
Videos
Live
·
--
Bearish
See translation
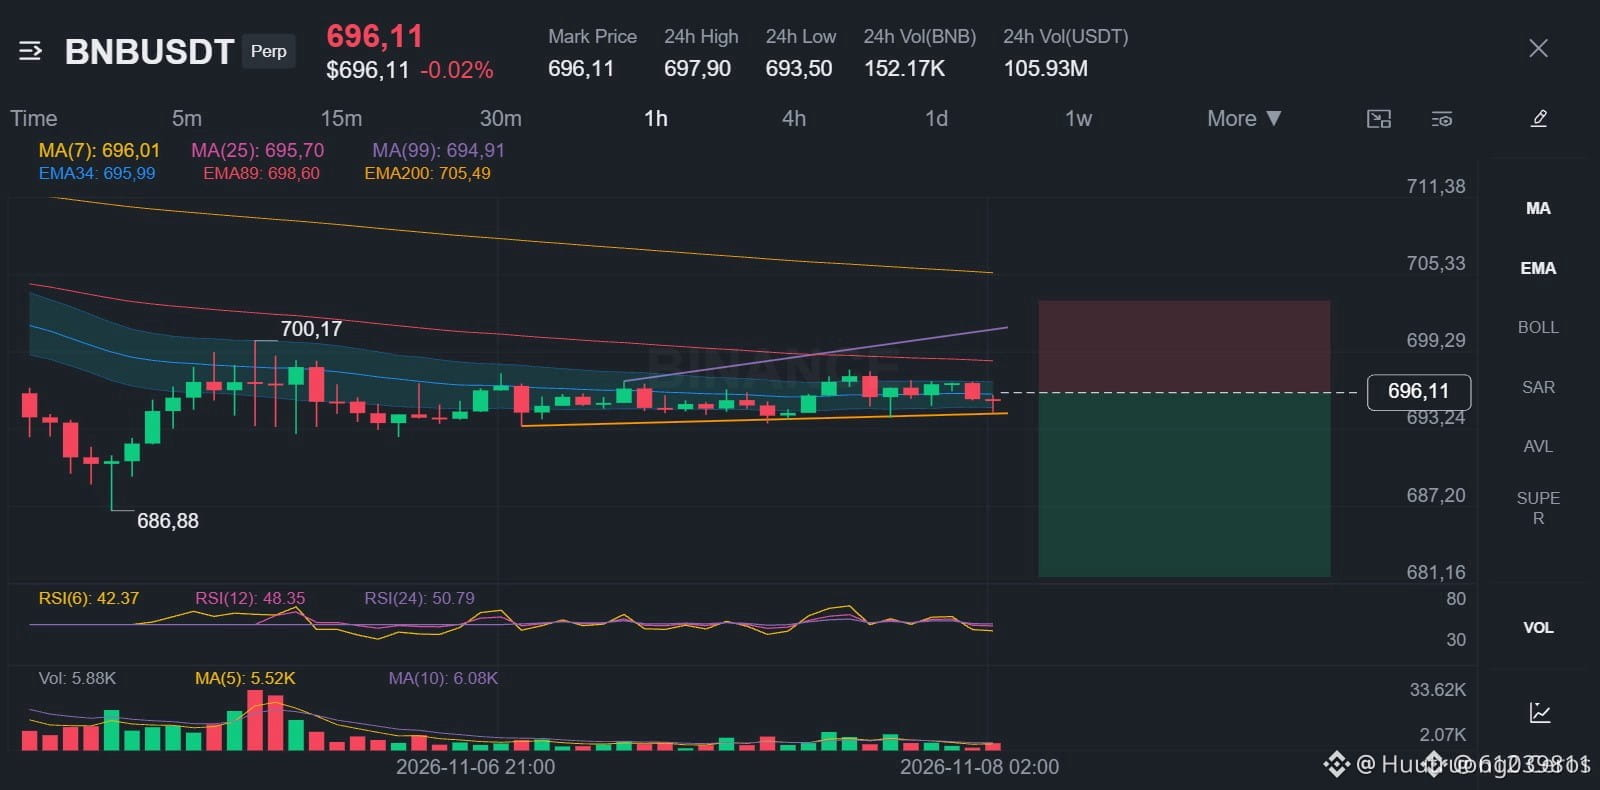
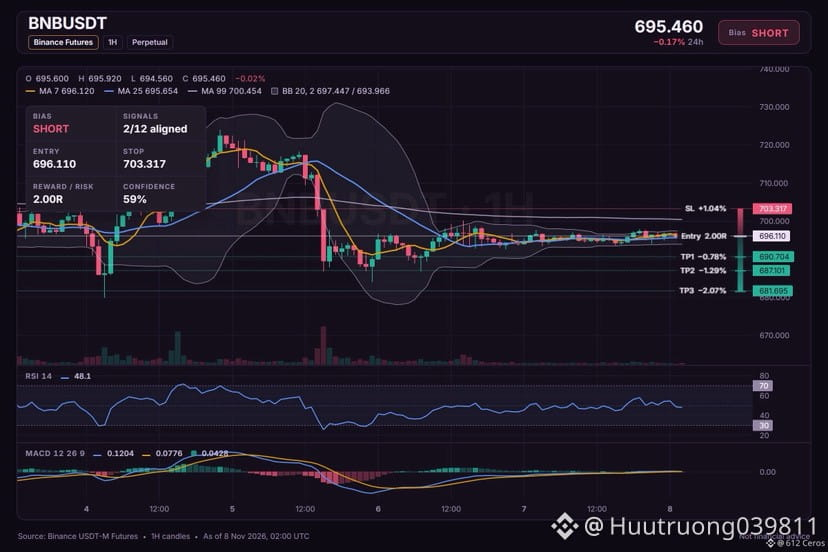
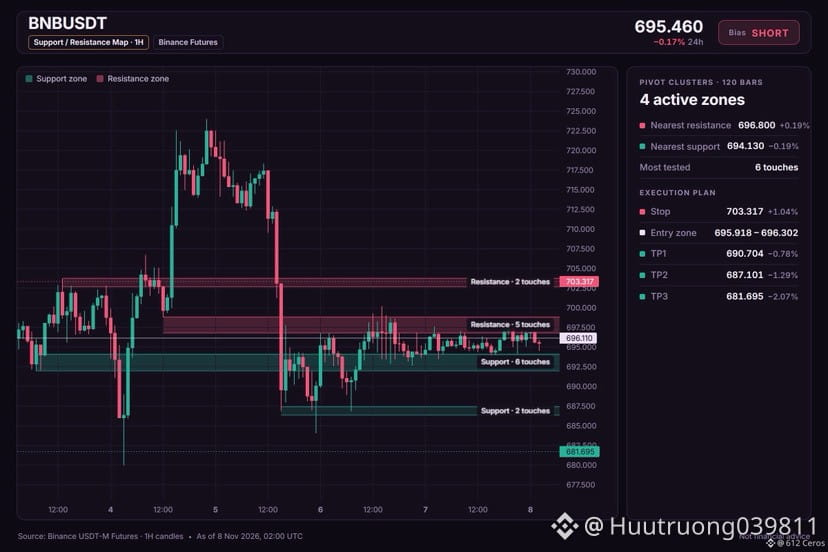
🔴 $BNB /USDT · Bias: SHORT
The 4h trend points lower as price sits below both EMAs in a bearish stack.
Entry: 695.918 – 696.302
TP1: 690.704 (-0.8%)
TP2: 687.101 (-1.3%)
TP3: 681.695 (-2.1%)
SL: 703.317 (+1.0%)
Note: moderate conviction only, keep size light.
Why: The 4h trend shows price below EMA50 and EMA200, a bearish stack meaning the swing trend is clearly down.
Plan: close 50% at TP1, 25% at TP2, 25% at TP3, and move the stop to entry after TP1.
Do you see price rejecting the upper band here?
{spot}(BNBUSDT)
🔴 $BNB /USDT · Bias: SHORT
The 4h trend points lower as price sits below both EMAs in a bearish stack.
Entry: 695.918 – 696.302
TP1: 690.704 (-0.8%)
TP2: 687.101 (-1.3%)
TP3: 681.695 (-2.1%)
SL: 703.317 (+1.0%)
Note: moderate conviction only, keep size light.
Why: The 4h trend shows price below EMA50 and EMA200, a bearish stack meaning the swing trend is clearly down.
Plan: close 50% at TP1, 25% at TP2, 25% at TP3, and move the stop to entry after TP1.
Do you see price rejecting the upper band here?
The 4h trend points lower as price sits below both EMAs in a bearish stack.
Entry: 695.918 – 696.302
TP1: 690.704 (-0.8%)
TP2: 687.101 (-1.3%)
TP3: 681.695 (-2.1%)
SL: 703.317 (+1.0%)
Note: moderate conviction only, keep size light.
Why: The 4h trend shows price below EMA50 and EMA200, a bearish stack meaning the swing trend is clearly down.
Plan: close 50% at TP1, 25% at TP2, 25% at TP3, and move the stop to entry after TP1.
Do you see price rejecting the upper band here?
12
·
--
Bearish
See translation
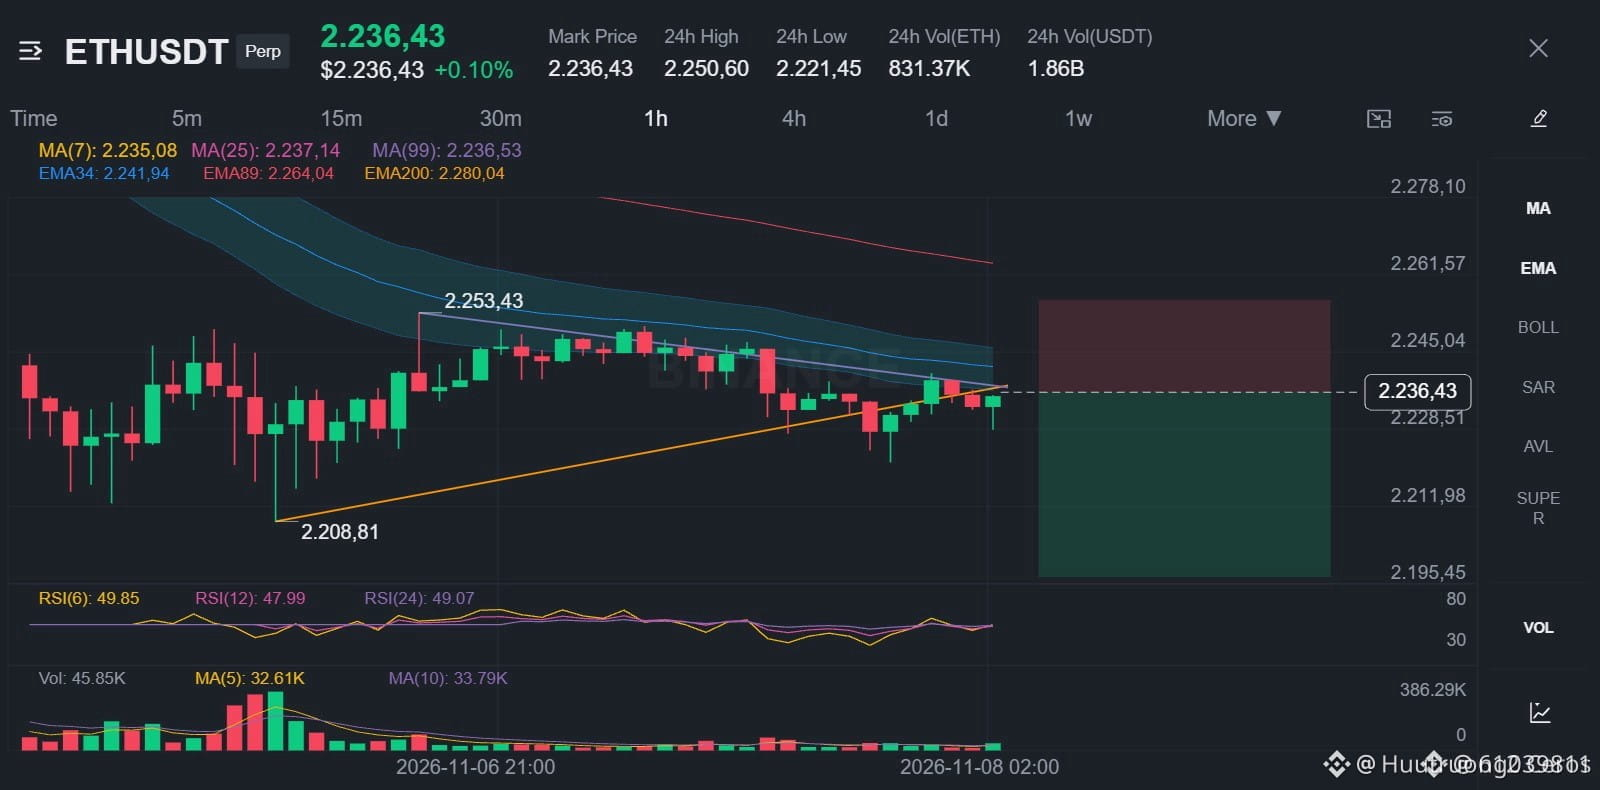
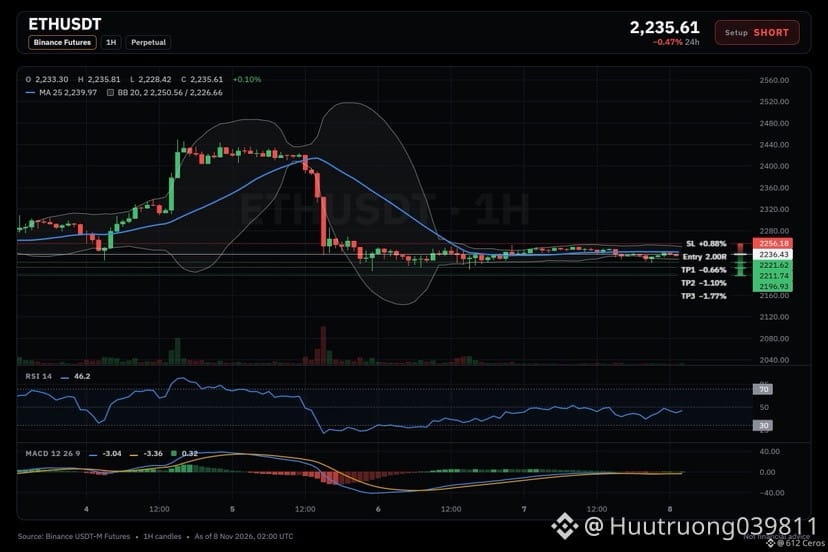
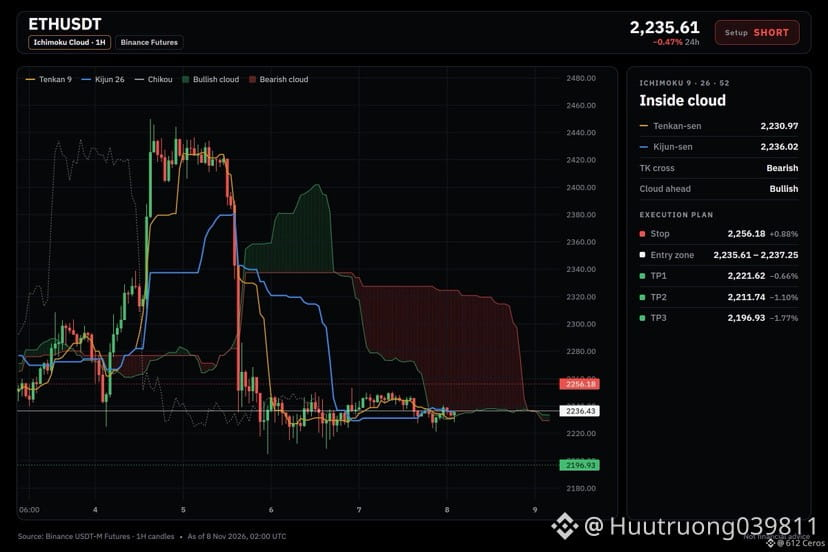
🔴 $ETH /USDT · Bias: SHORT
The 4h trend points lower as price sits below both EMAs in a bearish stack.
Entry: 2235.61 – 2237.25
TP1: 2221.62 (-0.7%)
TP2: 2211.74 (-1.1%)
TP3: 2196.93 (-1.8%)
SL: 2256.18 (+0.9%)
Note: moderate conviction only, keep size light.
Why: The 4h RSI is at 42.0, which shows bearish momentum because it sits below the 45 level that separates neutral from bearish territory.
Plan: close 50% at TP1, 25% at TP2, 25% at TP3, and move the stop to entry after TP1.
Do you agree with a short here?
{spot}(ETHUSDT)
🔴 $ETH /USDT · Bias: SHORT
The 4h trend points lower as price sits below both EMAs in a bearish stack.
Entry: 2235.61 – 2237.25
TP1: 2221.62 (-0.7%)
TP2: 2211.74 (-1.1%)
TP3: 2196.93 (-1.8%)
SL: 2256.18 (+0.9%)
Note: moderate conviction only, keep size light.
Why: The 4h RSI is at 42.0, which shows bearish momentum because it sits below the 45 level that separates neutral from bearish territory.
Plan: close 50% at TP1, 25% at TP2, 25% at TP3, and move the stop to entry after TP1.
Do you agree with a short here?
The 4h trend points lower as price sits below both EMAs in a bearish stack.
Entry: 2235.61 – 2237.25
TP1: 2221.62 (-0.7%)
TP2: 2211.74 (-1.1%)
TP3: 2196.93 (-1.8%)
SL: 2256.18 (+0.9%)
Note: moderate conviction only, keep size light.
Why: The 4h RSI is at 42.0, which shows bearish momentum because it sits below the 45 level that separates neutral from bearish territory.
Plan: close 50% at TP1, 25% at TP2, 25% at TP3, and move the stop to entry after TP1.
Do you agree with a short here?
13
·
--
Bearish
See translation
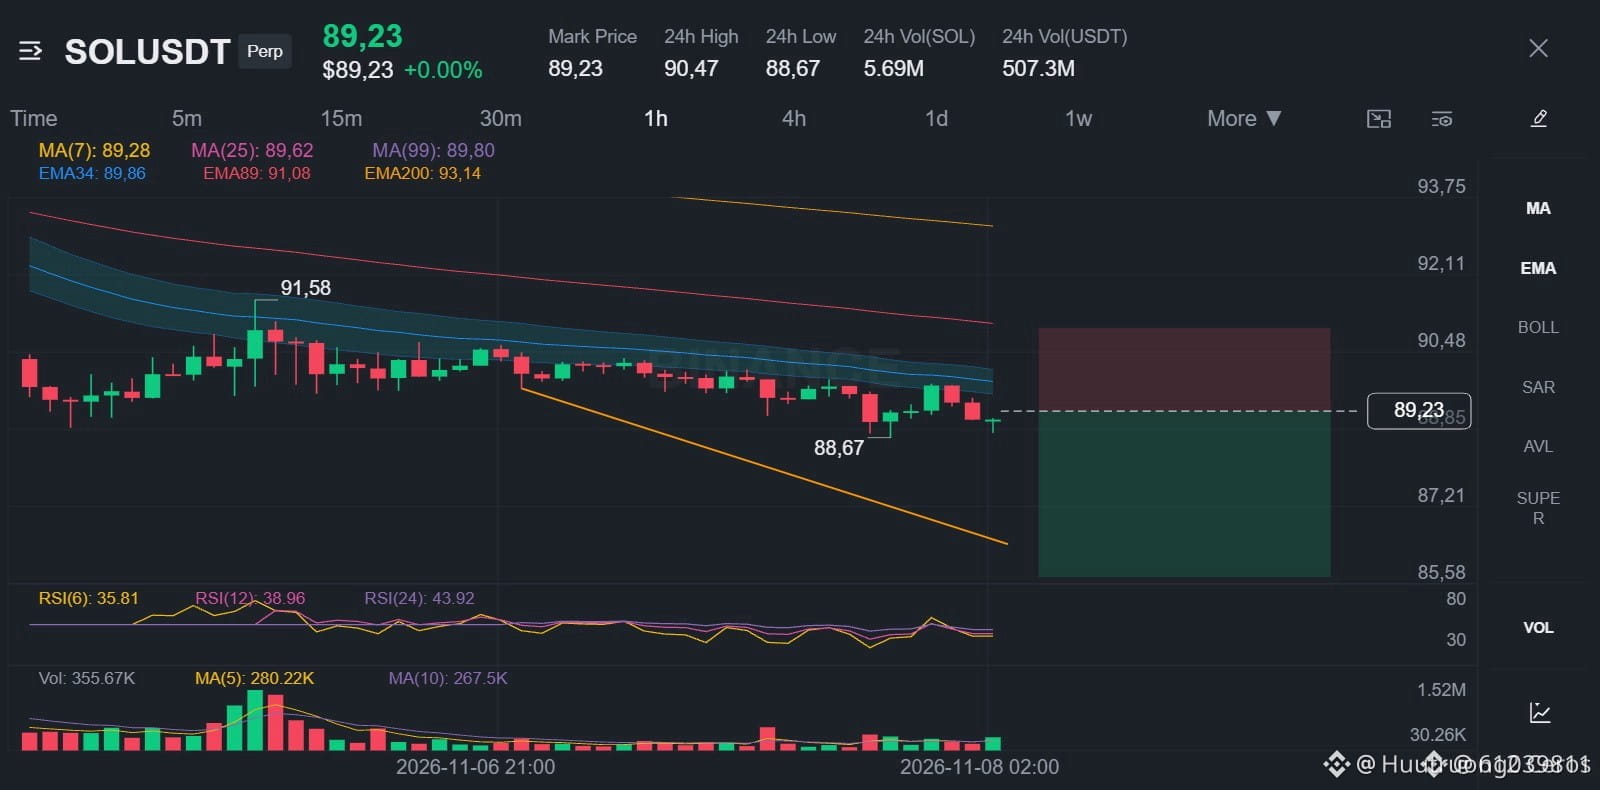
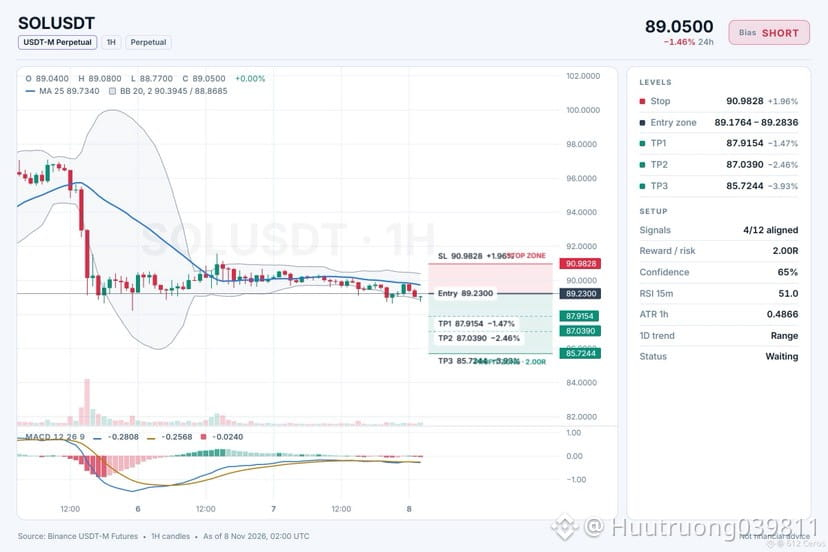
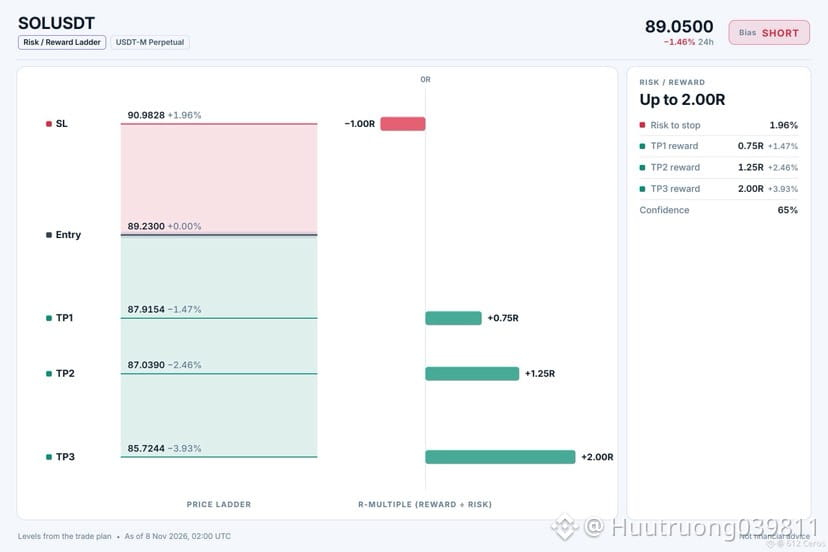
🔴 $SOL /USDT · Bias: SHORT
The 4h trend points lower as price sits below both EMAs in a bearish stack.
Entry: 89.1764 – 89.2836
TP1: 87.9154 (-1.5%)
TP2: 87.0390 (-2.5%)
TP3: 85.7244 (-3.9%)
SL: 90.9828 (+2.0%)
Note: moderate conviction only, keep size light.
Why: The 4h trend is bearish because price is below EMA50 and EMA200 in a bearish stack, meaning the swing trend is down.
Plan: close 50% at TP1, 25% at TP2, 25% at TP3, and move the stop to entry after TP1.
Where do you see SOL heading from the entry at 89.1764?
{spot}(SOLUSDT)
🔴 $SOL /USDT · Bias: SHORT
The 4h trend points lower as price sits below both EMAs in a bearish stack.
Entry: 89.1764 – 89.2836
TP1: 87.9154 (-1.5%)
TP2: 87.0390 (-2.5%)
TP3: 85.7244 (-3.9%)
SL: 90.9828 (+2.0%)
Note: moderate conviction only, keep size light.
Why: The 4h trend is bearish because price is below EMA50 and EMA200 in a bearish stack, meaning the swing trend is down.
Plan: close 50% at TP1, 25% at TP2, 25% at TP3, and move the stop to entry after TP1.
Where do you see SOL heading from the entry at 89.1764?
The 4h trend points lower as price sits below both EMAs in a bearish stack.
Entry: 89.1764 – 89.2836
TP1: 87.9154 (-1.5%)
TP2: 87.0390 (-2.5%)
TP3: 85.7244 (-3.9%)
SL: 90.9828 (+2.0%)
Note: moderate conviction only, keep size light.
Why: The 4h trend is bearish because price is below EMA50 and EMA200 in a bearish stack, meaning the swing trend is down.
Plan: close 50% at TP1, 25% at TP2, 25% at TP3, and move the stop to entry after TP1.
Where do you see SOL heading from the entry at 89.1764?
13
·
--
Bearish
See translation
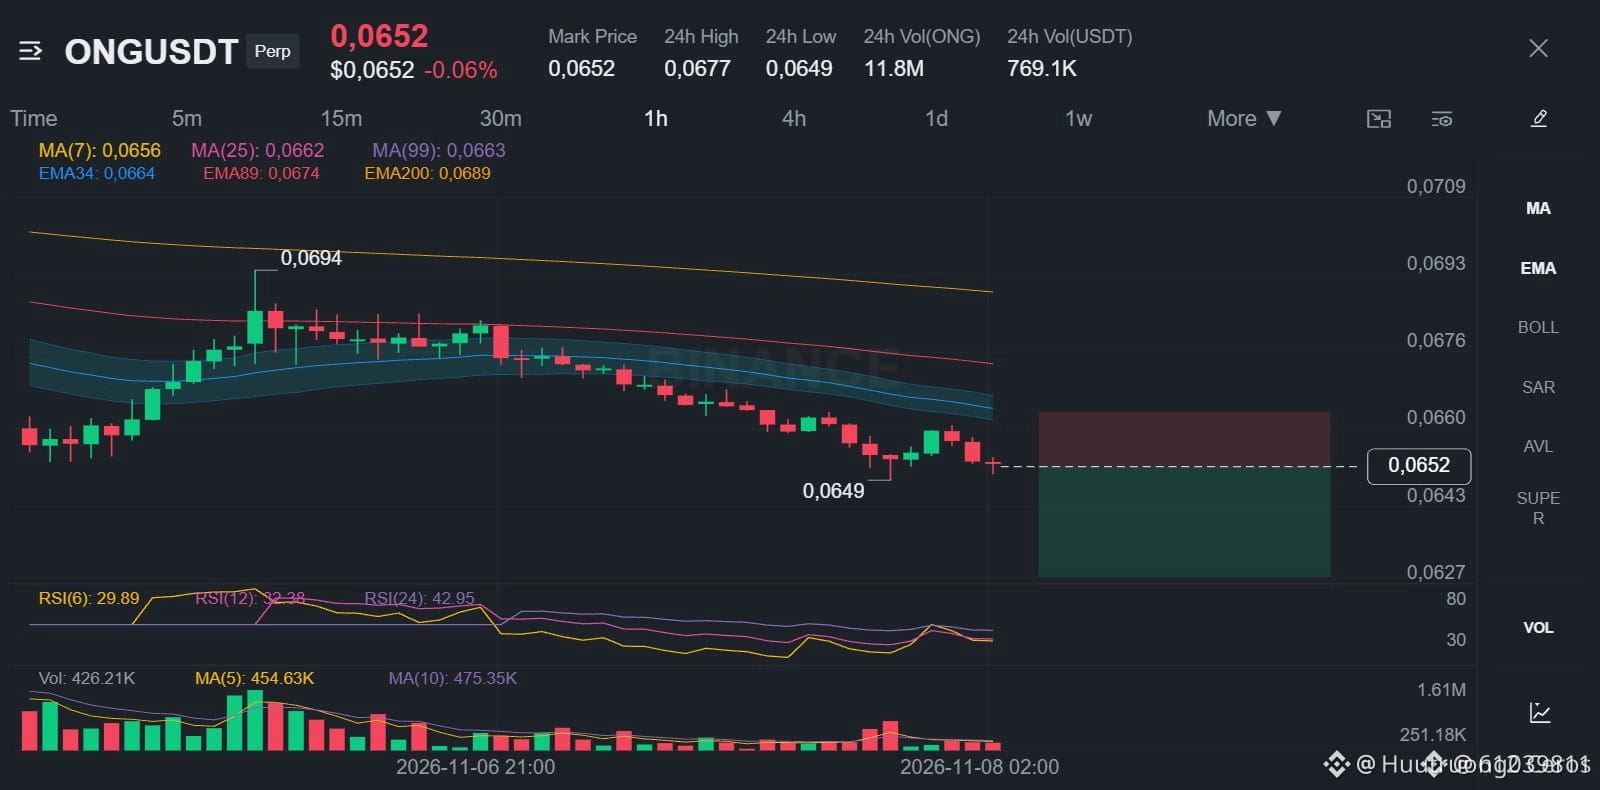
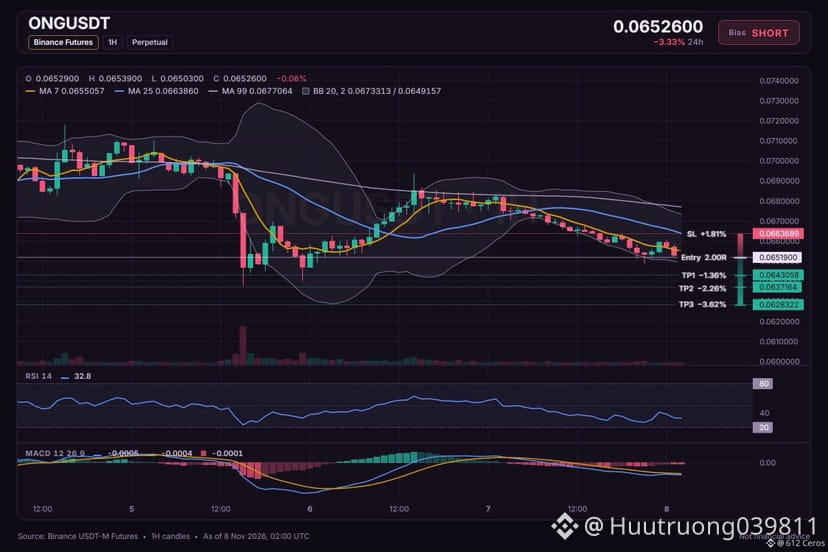
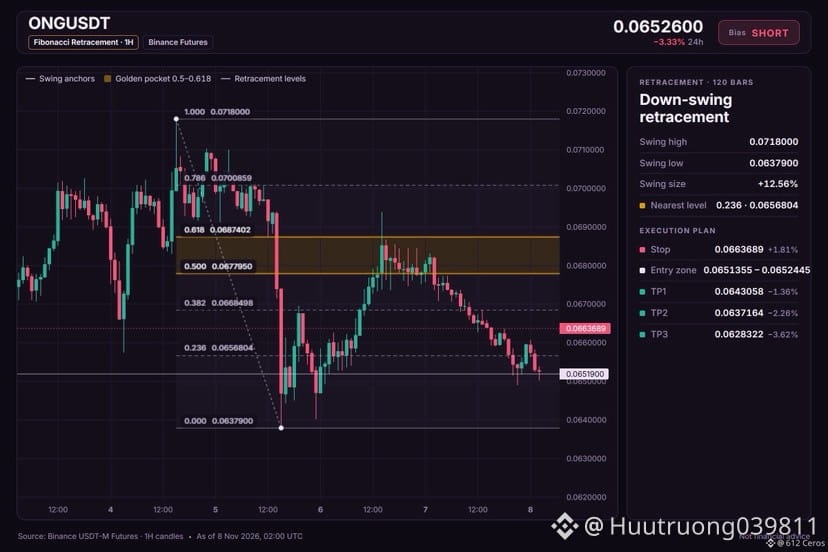
🔴 $ONG /USDT · Bias: SHORT
ONG shows a bearish 4h trend with price below both EMAs, pointing lower.
Entry: 0.0651355 – 0.0652445
TP1: 0.0643058 (-1.4%)
TP2: 0.0637164 (-2.3%)
TP3: 0.0628322 (-3.6%)
SL: 0.0663689 (+1.8%)
Why: ADX 27.4 with sellers in control means the directional movement index shows a strong downtrend with DI minus well above DI plus.
Risk: Far below its average, bounce likely (−3.2 ATR from 1h EMA50)
Plan: close 50% at TP1, 25% at TP2, 25% at TP3, and move the stop to entry after TP1.
Do you think ONG continues lower from the entry zone?
{spot}(ONGUSDT)
🔴 $ONG /USDT · Bias: SHORT
ONG shows a bearish 4h trend with price below both EMAs, pointing lower.
Entry: 0.0651355 – 0.0652445
TP1: 0.0643058 (-1.4%)
TP2: 0.0637164 (-2.3%)
TP3: 0.0628322 (-3.6%)
SL: 0.0663689 (+1.8%)
Why: ADX 27.4 with sellers in control means the directional movement index shows a strong downtrend with DI minus well above DI plus.
Risk: Far below its average, bounce likely (−3.2 ATR from 1h EMA50)
Plan: close 50% at TP1, 25% at TP2, 25% at TP3, and move the stop to entry after TP1.
Do you think ONG continues lower from the entry zone?
ONG shows a bearish 4h trend with price below both EMAs, pointing lower.
Entry: 0.0651355 – 0.0652445
TP1: 0.0643058 (-1.4%)
TP2: 0.0637164 (-2.3%)
TP3: 0.0628322 (-3.6%)
SL: 0.0663689 (+1.8%)
Why: ADX 27.4 with sellers in control means the directional movement index shows a strong downtrend with DI minus well above DI plus.
Risk: Far below its average, bounce likely (−3.2 ATR from 1h EMA50)
Plan: close 50% at TP1, 25% at TP2, 25% at TP3, and move the stop to entry after TP1.
Do you think ONG continues lower from the entry zone?
40
·
--
Bearish
See translation
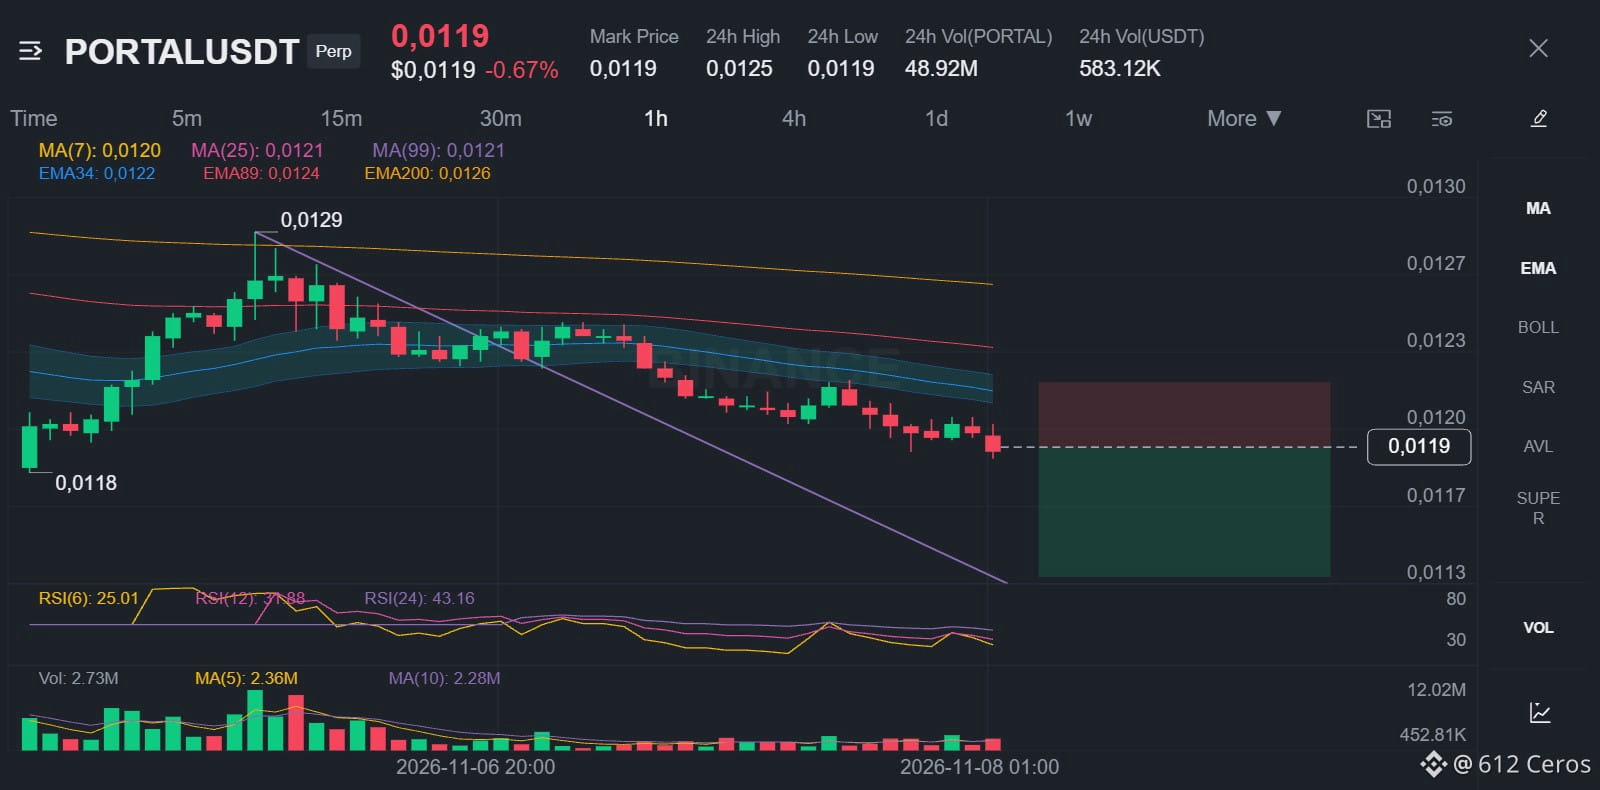
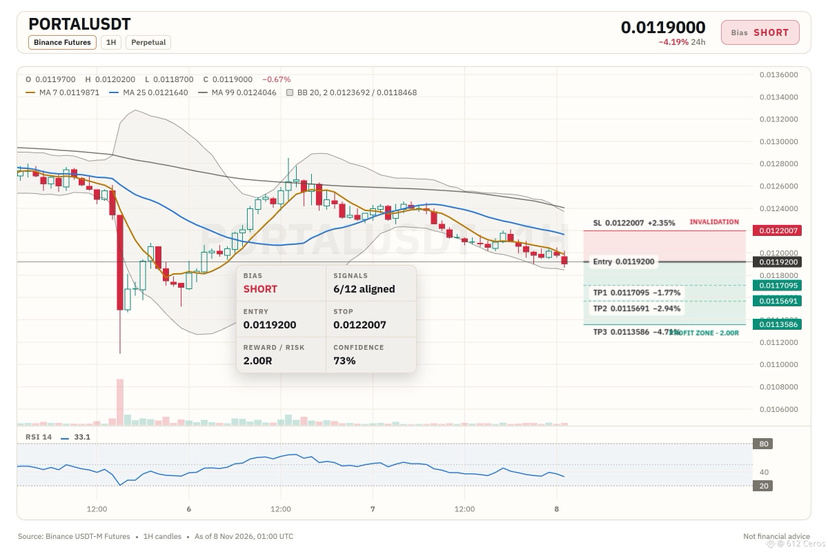
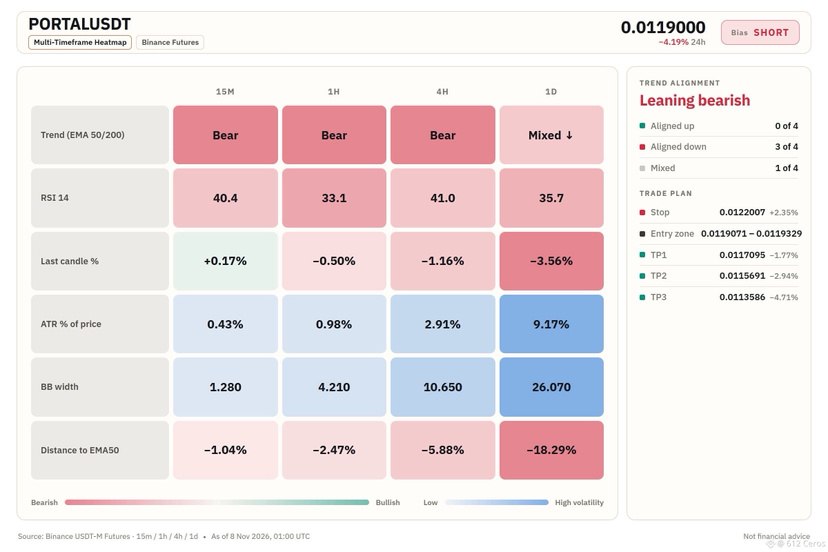
🔴 $PORTAL /USDT · Bias: SHORT
4h bearish stack keeps price below both EMAs, pointing lower for PORTAL.
Entry: 0.0119071 – 0.0119329
TP1: 0.0117095 (-1.8%)
TP2: 0.0115691 (-2.9%)
TP3: 0.0113586 (-4.7%)
SL: 0.0122007 (+2.4%)
Why: ADX 24.5 with DI+ 12.0 vs DI− 27.4 means sellers are driving the move.
Plan: close 50% at TP1, 25% at TP2, 25% at TP3, and move the stop to entry after TP1.
Where do you see the next reaction for PORTAL?
{spot}(PORTALUSDT)
🔴 $PORTAL /USDT · Bias: SHORT
4h bearish stack keeps price below both EMAs, pointing lower for PORTAL.
Entry: 0.0119071 – 0.0119329
TP1: 0.0117095 (-1.8%)
TP2: 0.0115691 (-2.9%)
TP3: 0.0113586 (-4.7%)
SL: 0.0122007 (+2.4%)
Why: ADX 24.5 with DI+ 12.0 vs DI− 27.4 means sellers are driving the move.
Plan: close 50% at TP1, 25% at TP2, 25% at TP3, and move the stop to entry after TP1.
Where do you see the next reaction for PORTAL?
4h bearish stack keeps price below both EMAs, pointing lower for PORTAL.
Entry: 0.0119071 – 0.0119329
TP1: 0.0117095 (-1.8%)
TP2: 0.0115691 (-2.9%)
TP3: 0.0113586 (-4.7%)
SL: 0.0122007 (+2.4%)
Why: ADX 24.5 with DI+ 12.0 vs DI− 27.4 means sellers are driving the move.
Plan: close 50% at TP1, 25% at TP2, 25% at TP3, and move the stop to entry after TP1.
Where do you see the next reaction for PORTAL?
39
·
--
Bearish
See translation
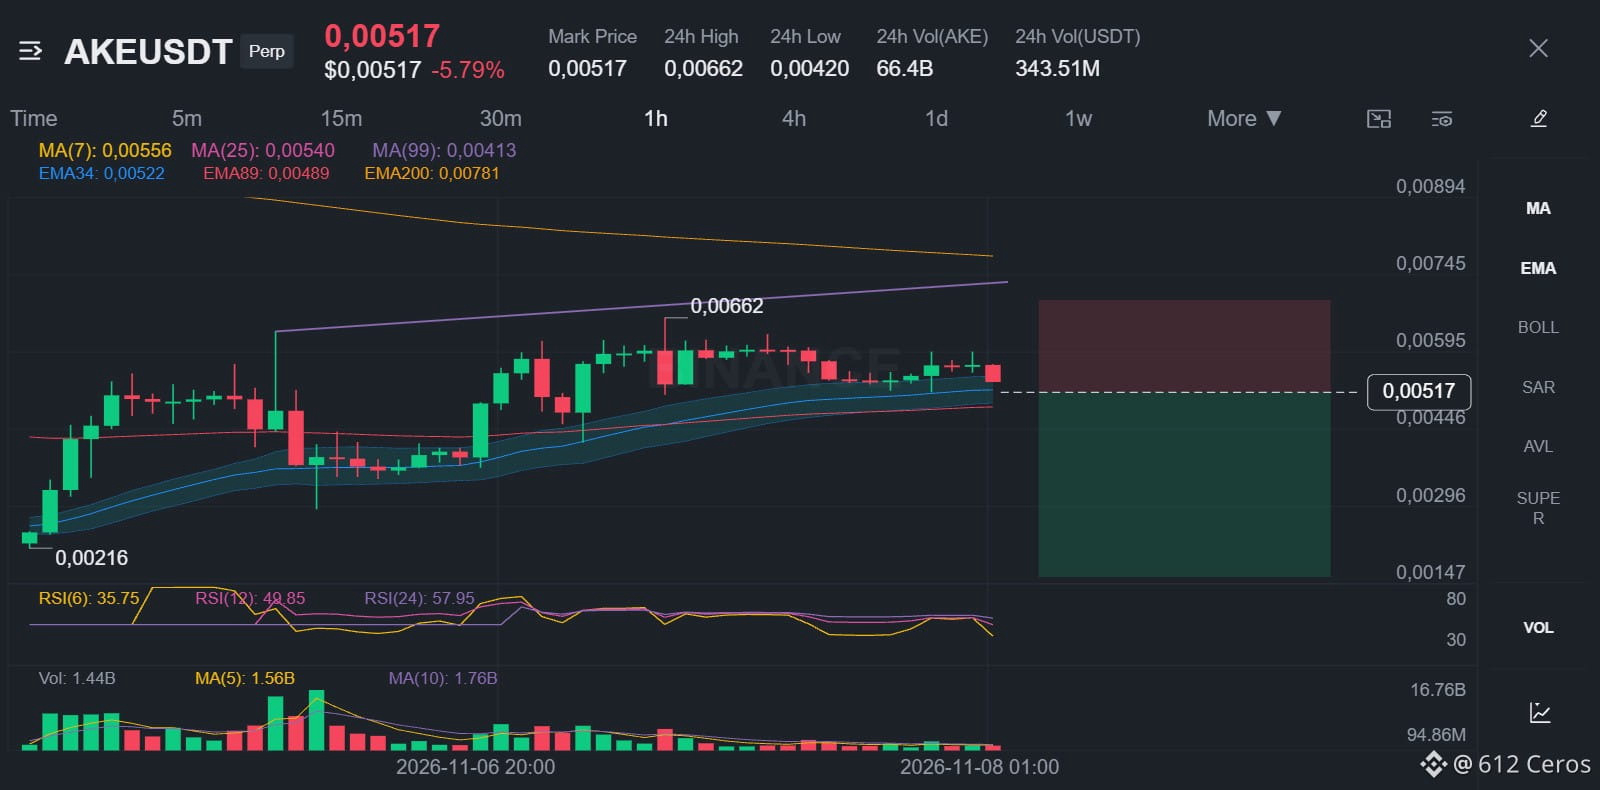
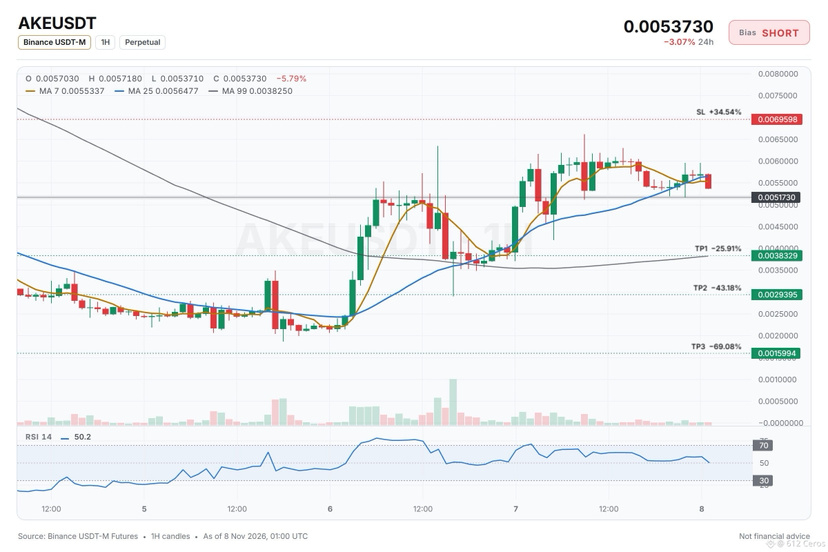
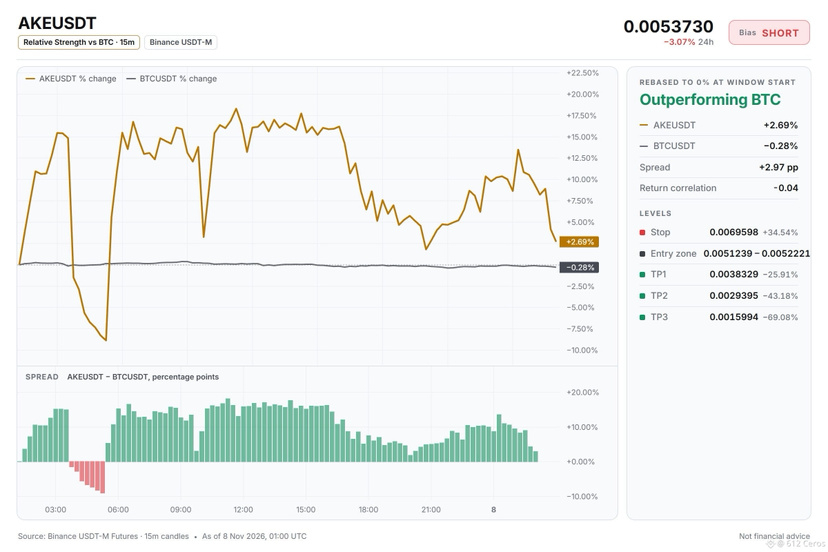
🔴 $AKE /USDT · Bias: SHORT
The 4h trend points lower as price sits below both EMAs in a bearish stack.
Entry: 0.0051239 – 0.0052221
TP1: 0.0038329 (-25.9%)
TP2: 0.0029395 (-43.2%)
TP3: 0.0015994 (-69.1%)
SL: 0.0069598 (+34.5%)
Note: moderate conviction only, keep size light.
Why: Sellers are driving the move, with ADX 25.1 and DI minus above DI plus, meaning the down move has clear momentum.
Plan: close 50% at TP1, 25% at TP2, 25% at TP3, and move the stop to entry after TP1.
Do you see room for more downside from here?
{future}(AKEUSDT)
🔴 $AKE /USDT · Bias: SHORT
The 4h trend points lower as price sits below both EMAs in a bearish stack.
Entry: 0.0051239 – 0.0052221
TP1: 0.0038329 (-25.9%)
TP2: 0.0029395 (-43.2%)
TP3: 0.0015994 (-69.1%)
SL: 0.0069598 (+34.5%)
Note: moderate conviction only, keep size light.
Why: Sellers are driving the move, with ADX 25.1 and DI minus above DI plus, meaning the down move has clear momentum.
Plan: close 50% at TP1, 25% at TP2, 25% at TP3, and move the stop to entry after TP1.
Do you see room for more downside from here?
The 4h trend points lower as price sits below both EMAs in a bearish stack.
Entry: 0.0051239 – 0.0052221
TP1: 0.0038329 (-25.9%)
TP2: 0.0029395 (-43.2%)
TP3: 0.0015994 (-69.1%)
SL: 0.0069598 (+34.5%)
Note: moderate conviction only, keep size light.
Why: Sellers are driving the move, with ADX 25.1 and DI minus above DI plus, meaning the down move has clear momentum.
Plan: close 50% at TP1, 25% at TP2, 25% at TP3, and move the stop to entry after TP1.
Do you see room for more downside from here?
52
·
--
Bearish
See translation
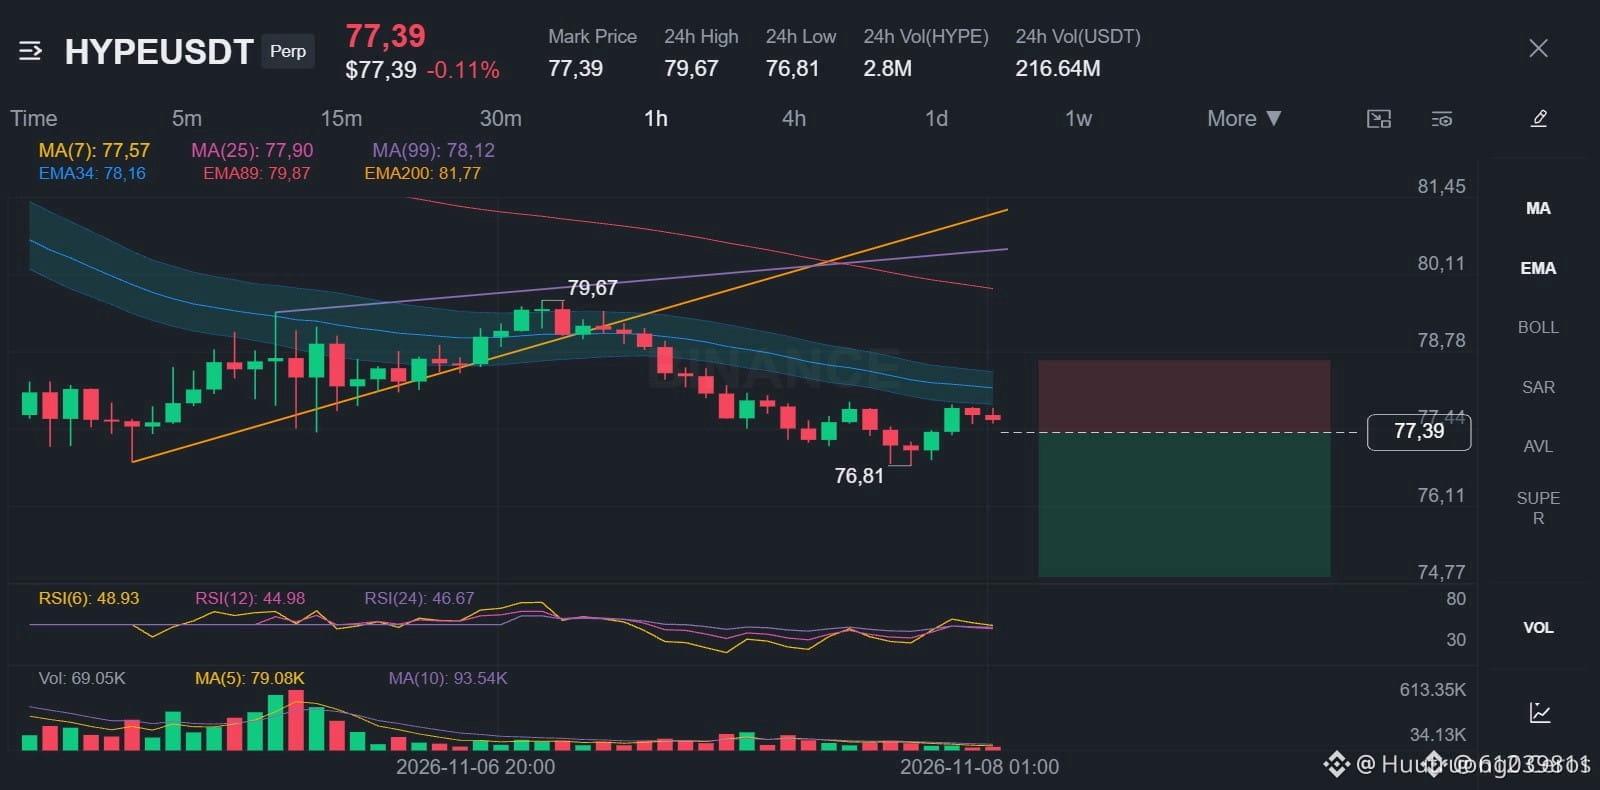
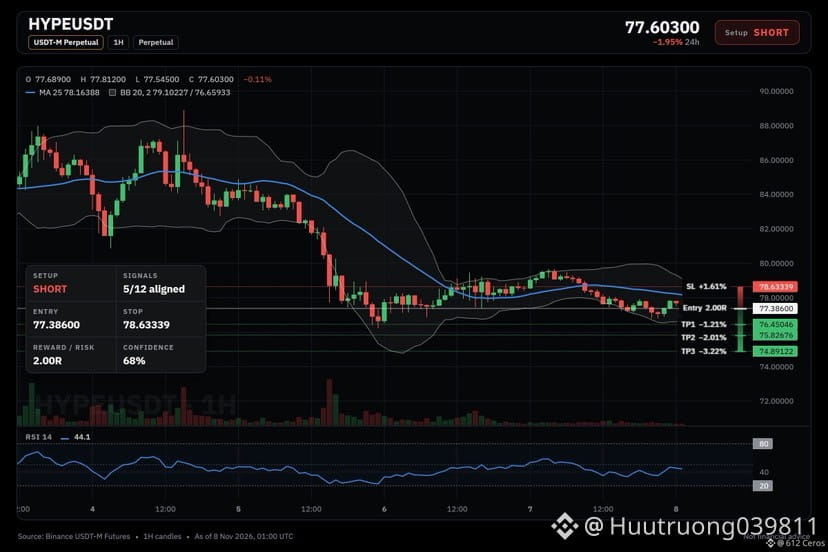
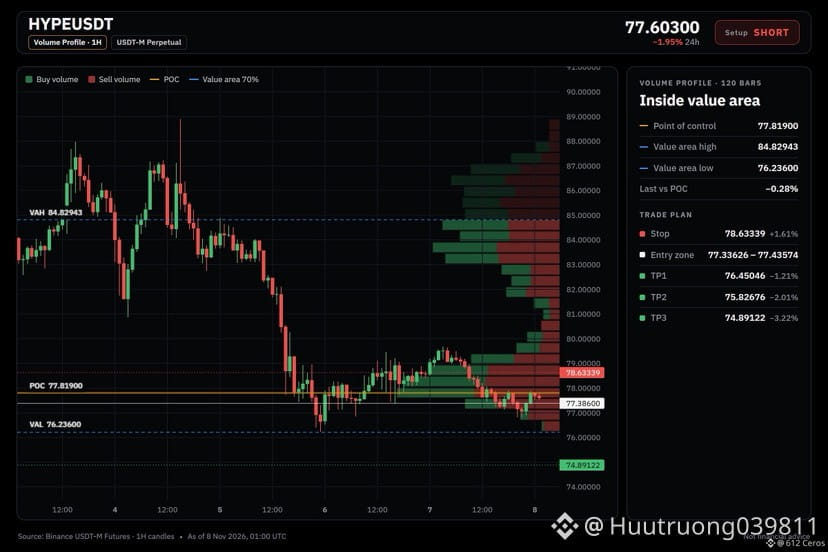
🔴 $HYPE /USDT · Bias: SHORT
4h bearish stack and price below both EMAs, pointing lower for HYPE.
Entry: 77.33626 – 77.43574
TP1: 76.45046 (-1.2%)
TP2: 75.82676 (-2.0%)
TP3: 74.89122 (-3.2%)
SL: 78.63339 (+1.6%)
Note: moderate conviction only, keep size light.
Why: The 4h trend shows price below EMA50 and EMA200 in a bearish stack, meaning the swing trend is down.
Plan: close 50% at TP1, 25% at TP2, 25% at TP3, and move the stop to entry after TP1.
Do you agree that HYPE should keep moving lower from here?
{spot}(HYPEUSDT)
🔴 $HYPE /USDT · Bias: SHORT
4h bearish stack and price below both EMAs, pointing lower for HYPE.
Entry: 77.33626 – 77.43574
TP1: 76.45046 (-1.2%)
TP2: 75.82676 (-2.0%)
TP3: 74.89122 (-3.2%)
SL: 78.63339 (+1.6%)
Note: moderate conviction only, keep size light.
Why: The 4h trend shows price below EMA50 and EMA200 in a bearish stack, meaning the swing trend is down.
Plan: close 50% at TP1, 25% at TP2, 25% at TP3, and move the stop to entry after TP1.
Do you agree that HYPE should keep moving lower from here?
4h bearish stack and price below both EMAs, pointing lower for HYPE.
Entry: 77.33626 – 77.43574
TP1: 76.45046 (-1.2%)
TP2: 75.82676 (-2.0%)
TP3: 74.89122 (-3.2%)
SL: 78.63339 (+1.6%)
Note: moderate conviction only, keep size light.
Why: The 4h trend shows price below EMA50 and EMA200 in a bearish stack, meaning the swing trend is down.
Plan: close 50% at TP1, 25% at TP2, 25% at TP3, and move the stop to entry after TP1.
Do you agree that HYPE should keep moving lower from here?
78
·
--
Bearish
See translation
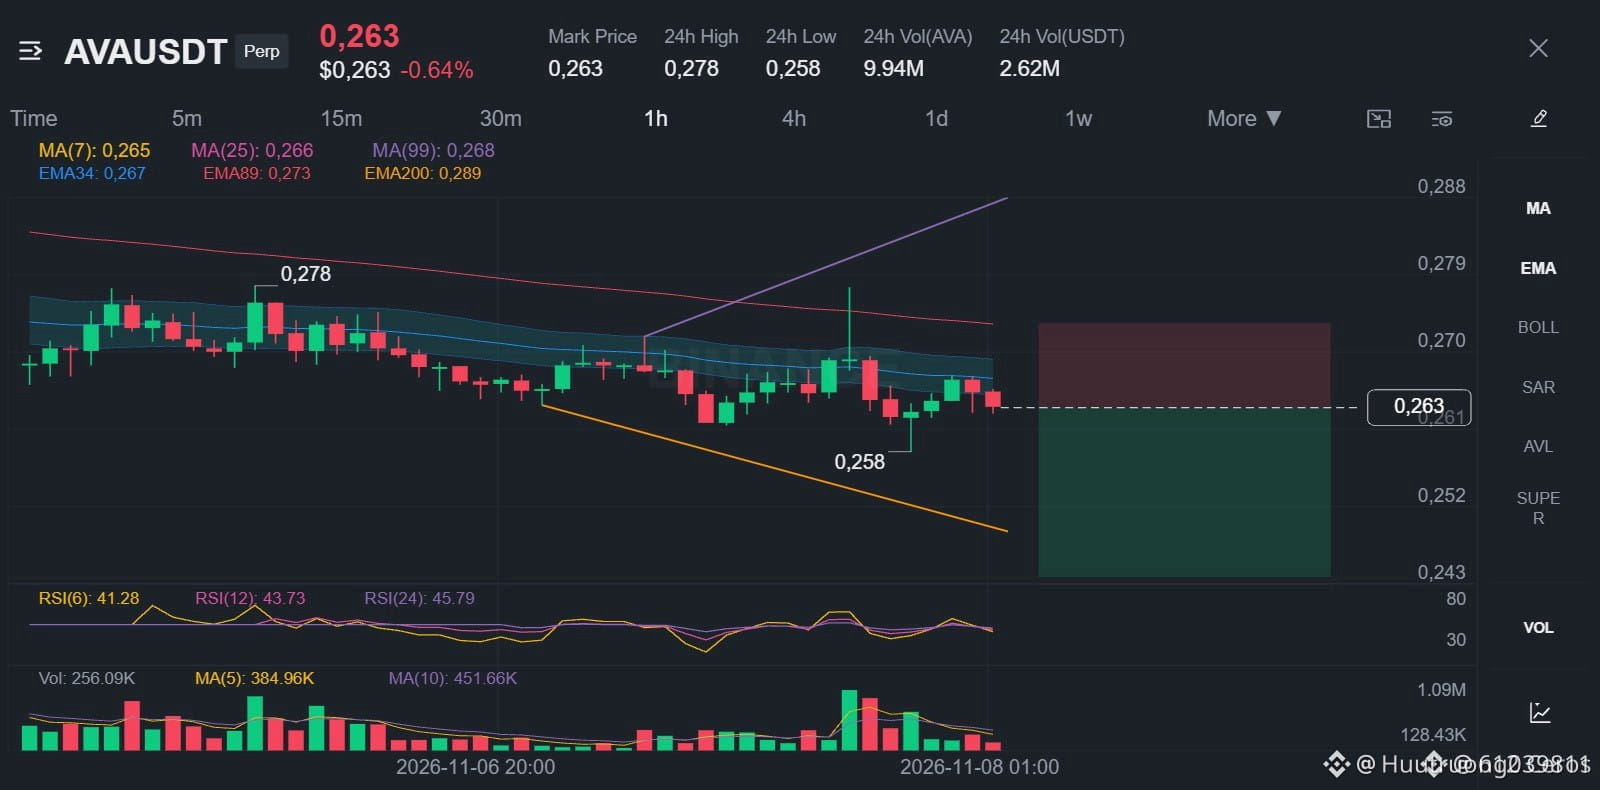
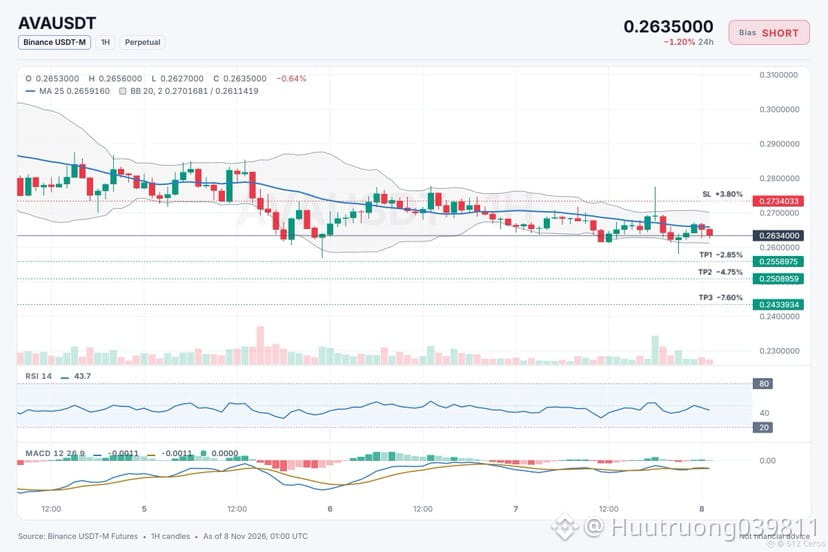
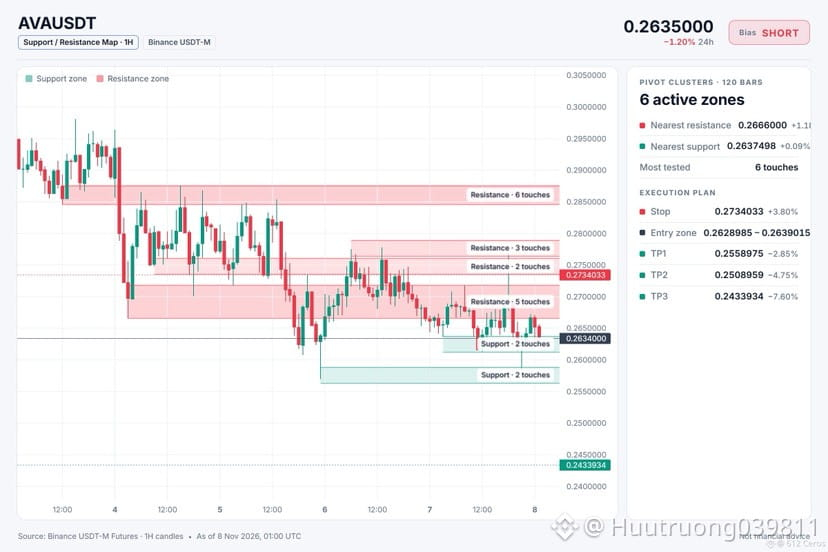
🔴 $AVA /USDT · Bias: SHORT
The 4h trend points lower as price sits below both EMAs in a bearish stack.
Entry: 0.2628985 – 0.2639015
TP1: 0.2558975 (-2.8%)
TP2: 0.2508959 (-4.7%)
TP3: 0.2433934 (-7.6%)
SL: 0.2734033 (+3.8%)
Note: moderate conviction only, keep size light.
Why: 4h RSI reads 41.6, meaning bearish momentum because it sits below 45.
Plan: close 50% at TP1, 25% at TP2, 25% at TP3, and move the stop to entry after TP1.
Do you see this trade as a valid short?
{spot}(AVAUSDT)
🔴 $AVA /USDT · Bias: SHORT
The 4h trend points lower as price sits below both EMAs in a bearish stack.
Entry: 0.2628985 – 0.2639015
TP1: 0.2558975 (-2.8%)
TP2: 0.2508959 (-4.7%)
TP3: 0.2433934 (-7.6%)
SL: 0.2734033 (+3.8%)
Note: moderate conviction only, keep size light.
Why: 4h RSI reads 41.6, meaning bearish momentum because it sits below 45.
Plan: close 50% at TP1, 25% at TP2, 25% at TP3, and move the stop to entry after TP1.
Do you see this trade as a valid short?
The 4h trend points lower as price sits below both EMAs in a bearish stack.
Entry: 0.2628985 – 0.2639015
TP1: 0.2558975 (-2.8%)
TP2: 0.2508959 (-4.7%)
TP3: 0.2433934 (-7.6%)
SL: 0.2734033 (+3.8%)
Note: moderate conviction only, keep size light.
Why: 4h RSI reads 41.6, meaning bearish momentum because it sits below 45.
Plan: close 50% at TP1, 25% at TP2, 25% at TP3, and move the stop to entry after TP1.
Do you see this trade as a valid short?
78
·
--
Bearish
See translation
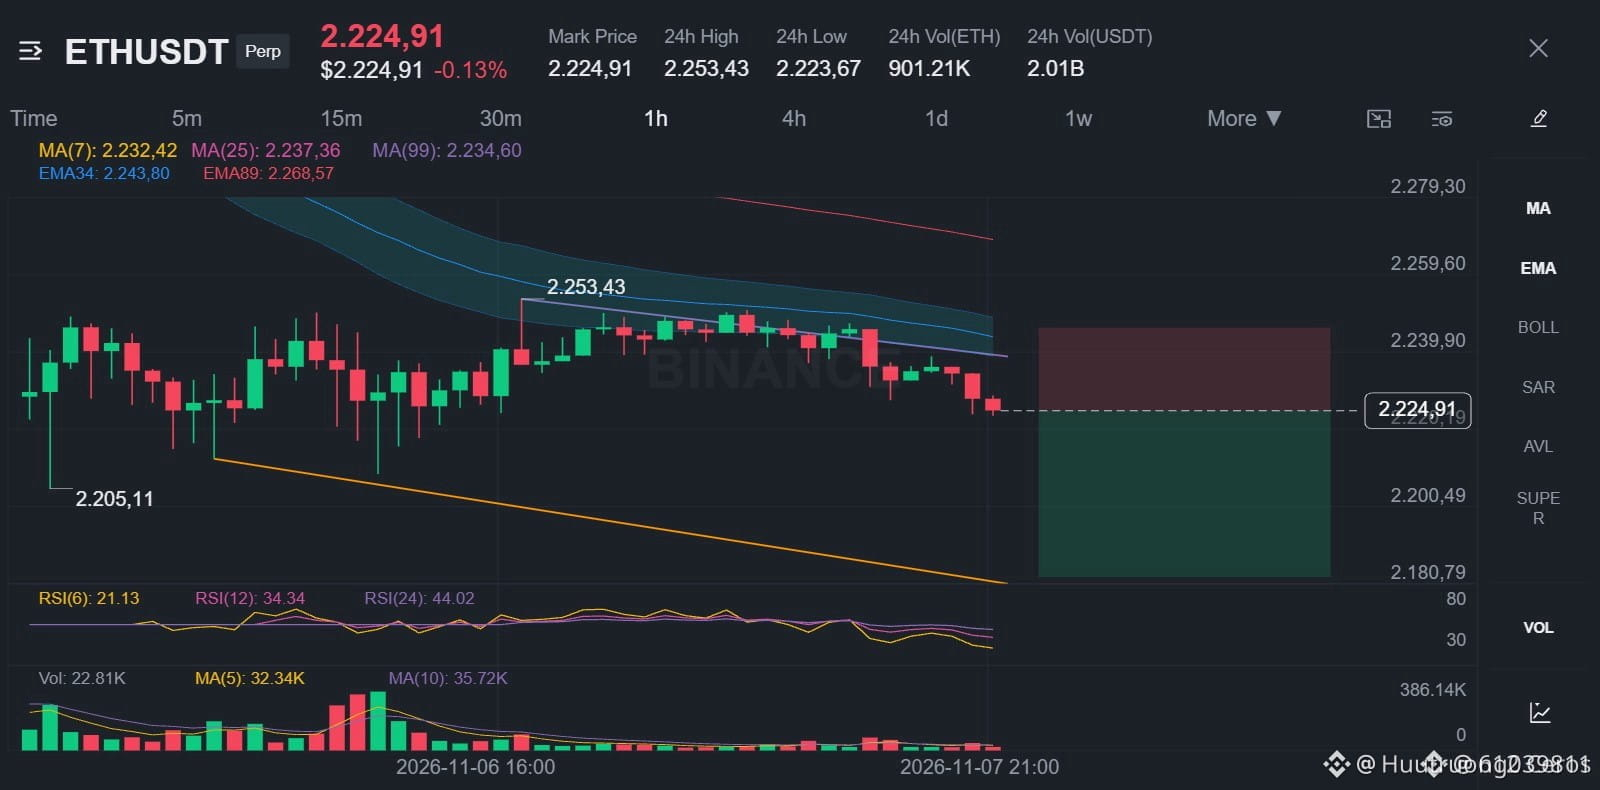
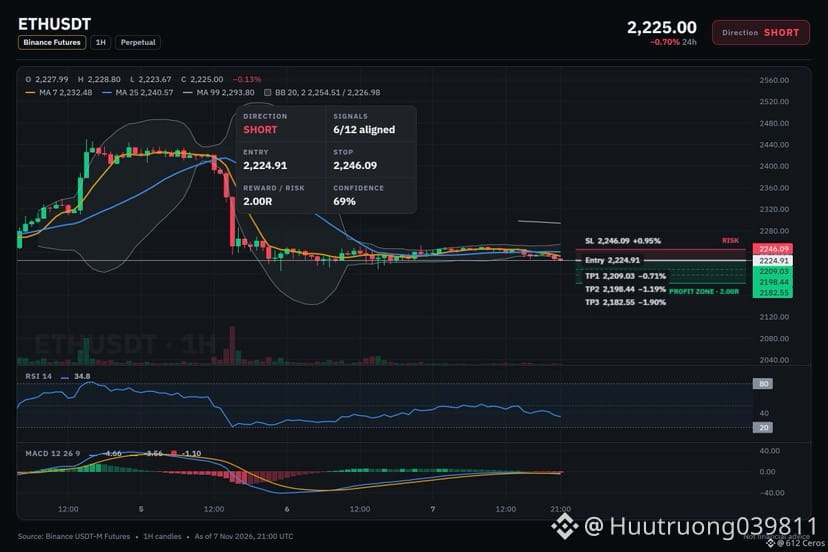
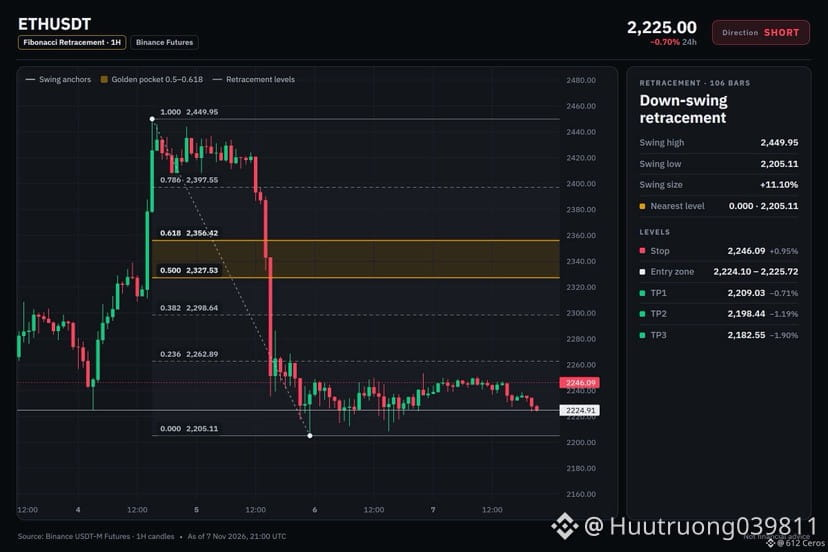
🔴 $ETH /USDT · Bias: SHORT
4h bearish stack points lower as price sits below both EMAs.
Entry: 2224.10 – 2225.72
TP1: 2209.03 (-0.7%)
TP2: 2198.44 (-1.2%)
TP3: 2182.55 (-1.9%)
SL: 2246.09 (+1.0%)
Why: ADX 40.5 with sellers in control means the move has strong directional momentum.
Risk: Far below its average, bounce likely (−3.1 ATR from 1h EMA50)
Plan: close 50% at TP1, 25% at TP2, 25% at TP3, and move the stop to entry after TP1.
Do you see this trade staying directional or fading at the entry?
{spot}(ETHUSDT)
🔴 $ETH /USDT · Bias: SHORT
4h bearish stack points lower as price sits below both EMAs.
Entry: 2224.10 – 2225.72
TP1: 2209.03 (-0.7%)
TP2: 2198.44 (-1.2%)
TP3: 2182.55 (-1.9%)
SL: 2246.09 (+1.0%)
Why: ADX 40.5 with sellers in control means the move has strong directional momentum.
Risk: Far below its average, bounce likely (−3.1 ATR from 1h EMA50)
Plan: close 50% at TP1, 25% at TP2, 25% at TP3, and move the stop to entry after TP1.
Do you see this trade staying directional or fading at the entry?
4h bearish stack points lower as price sits below both EMAs.
Entry: 2224.10 – 2225.72
TP1: 2209.03 (-0.7%)
TP2: 2198.44 (-1.2%)
TP3: 2182.55 (-1.9%)
SL: 2246.09 (+1.0%)
Why: ADX 40.5 with sellers in control means the move has strong directional momentum.
Risk: Far below its average, bounce likely (−3.1 ATR from 1h EMA50)
Plan: close 50% at TP1, 25% at TP2, 25% at TP3, and move the stop to entry after TP1.
Do you see this trade staying directional or fading at the entry?
16
·
--
Bearish
See translation
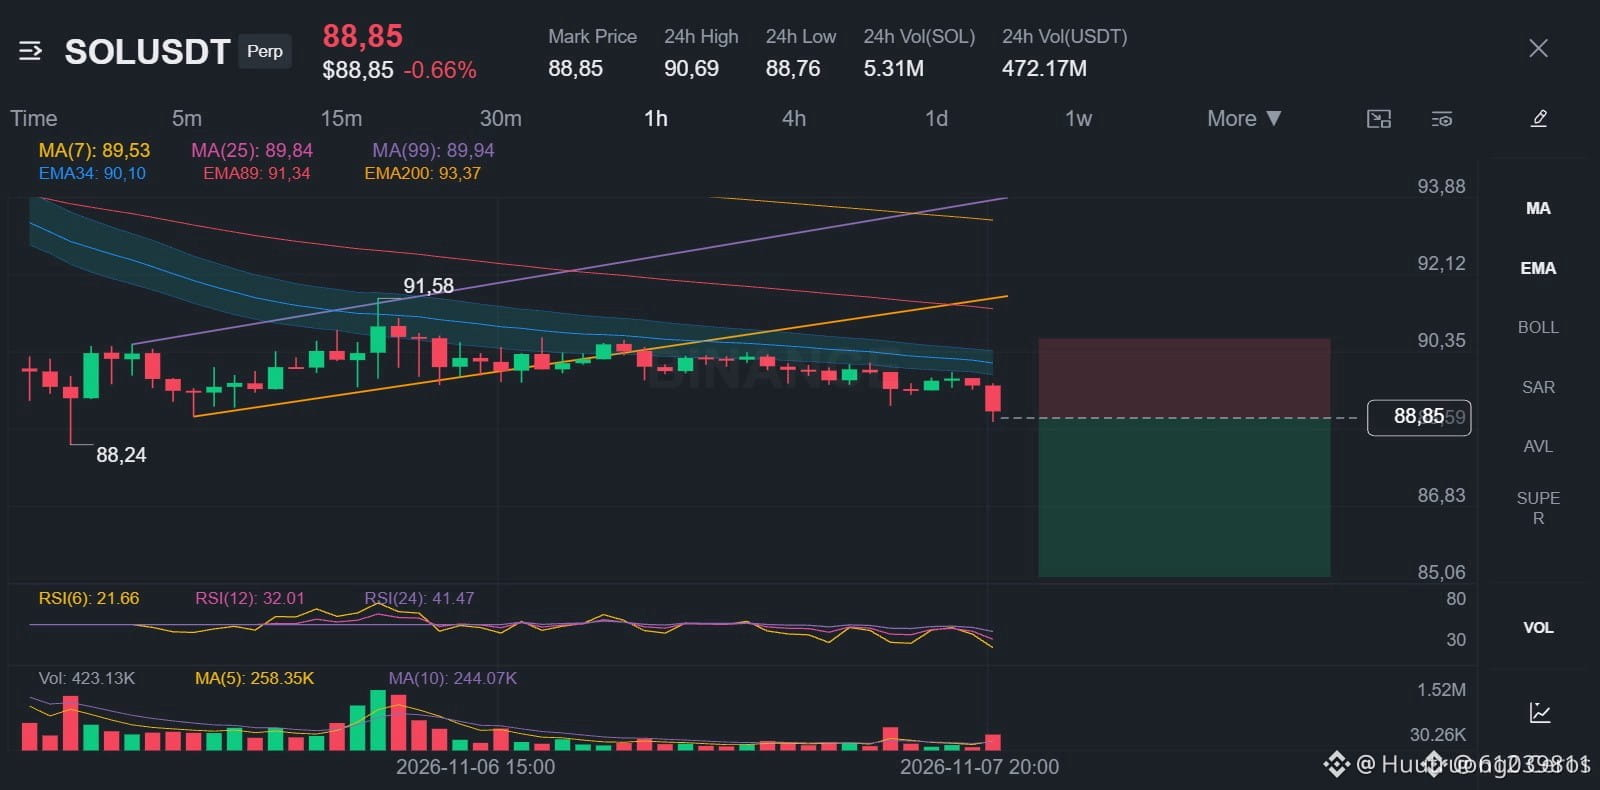
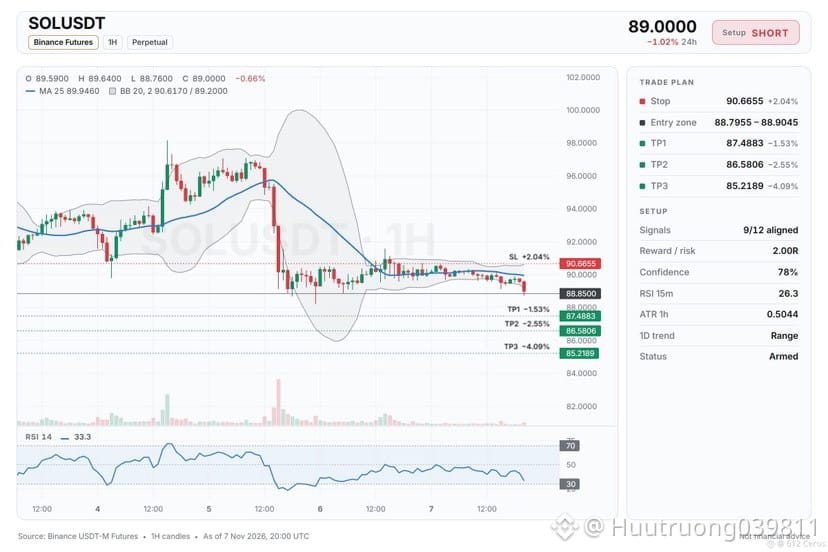
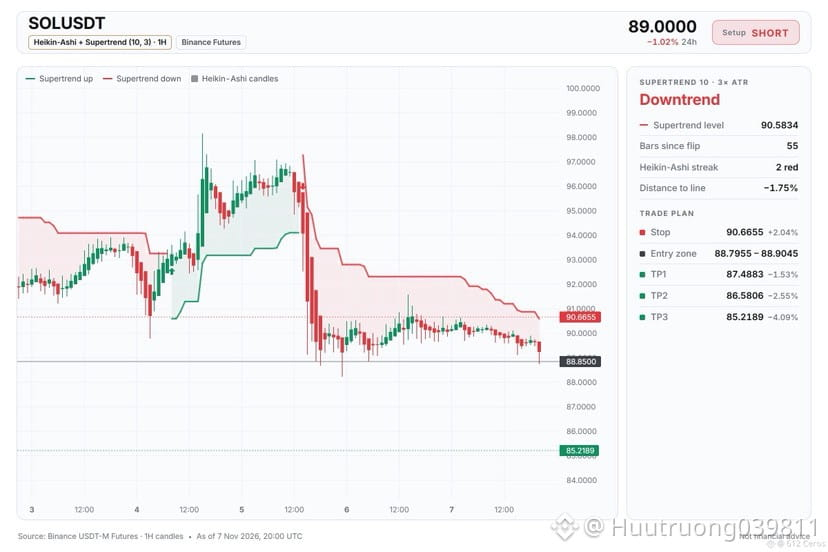
🔴 $SOL /USDT · Bias: SHORT
The 4h price sits below both EMAs in a bearish stack, pointing lower.
Entry: 88.7955 – 88.9045
TP1: 87.4883 (-1.5%)
TP2: 86.5806 (-2.6%)
TP3: 85.2189 (-4.1%)
SL: 90.6655 (+2.0%)
Why: The 1h price sits below both EMAs in a bearish stack, meaning the short-term trend is down.
Risk: Far below its average, bounce likely (−3.2 ATR from 1h EMA50)
Plan: close 50% at TP1, 25% at TP2, 25% at TP3, and move the stop to entry after TP1.
Do you see this as a good short entry?
{spot}(SOLUSDT)
🔴 $SOL /USDT · Bias: SHORT
The 4h price sits below both EMAs in a bearish stack, pointing lower.
Entry: 88.7955 – 88.9045
TP1: 87.4883 (-1.5%)
TP2: 86.5806 (-2.6%)
TP3: 85.2189 (-4.1%)
SL: 90.6655 (+2.0%)
Why: The 1h price sits below both EMAs in a bearish stack, meaning the short-term trend is down.
Risk: Far below its average, bounce likely (−3.2 ATR from 1h EMA50)
Plan: close 50% at TP1, 25% at TP2, 25% at TP3, and move the stop to entry after TP1.
Do you see this as a good short entry?
The 4h price sits below both EMAs in a bearish stack, pointing lower.
Entry: 88.7955 – 88.9045
TP1: 87.4883 (-1.5%)
TP2: 86.5806 (-2.6%)
TP3: 85.2189 (-4.1%)
SL: 90.6655 (+2.0%)
Why: The 1h price sits below both EMAs in a bearish stack, meaning the short-term trend is down.
Risk: Far below its average, bounce likely (−3.2 ATR from 1h EMA50)
Plan: close 50% at TP1, 25% at TP2, 25% at TP3, and move the stop to entry after TP1.
Do you see this as a good short entry?
13
·
--
Bearish
See translation
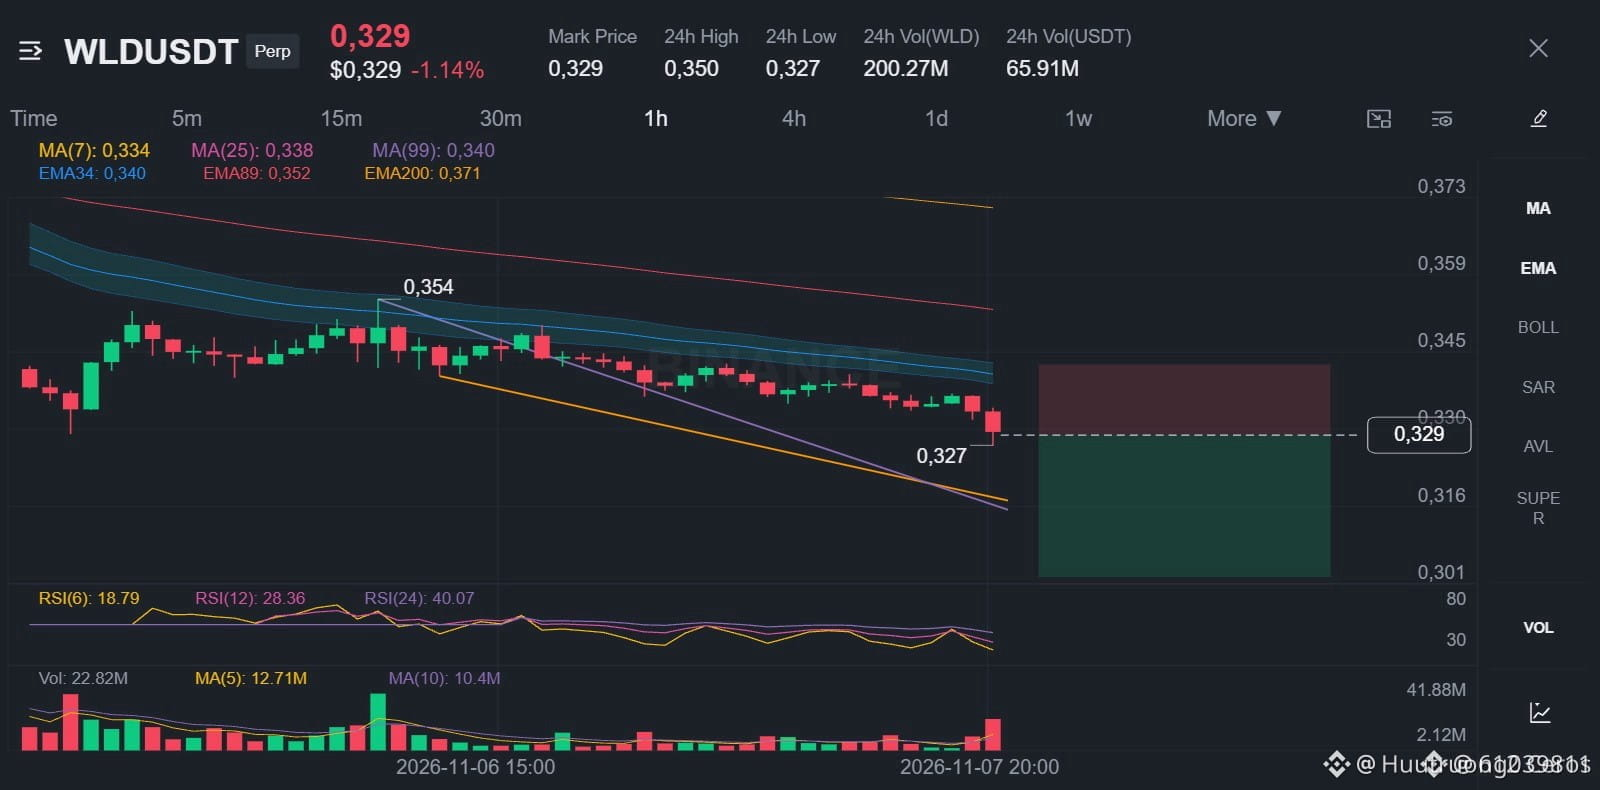
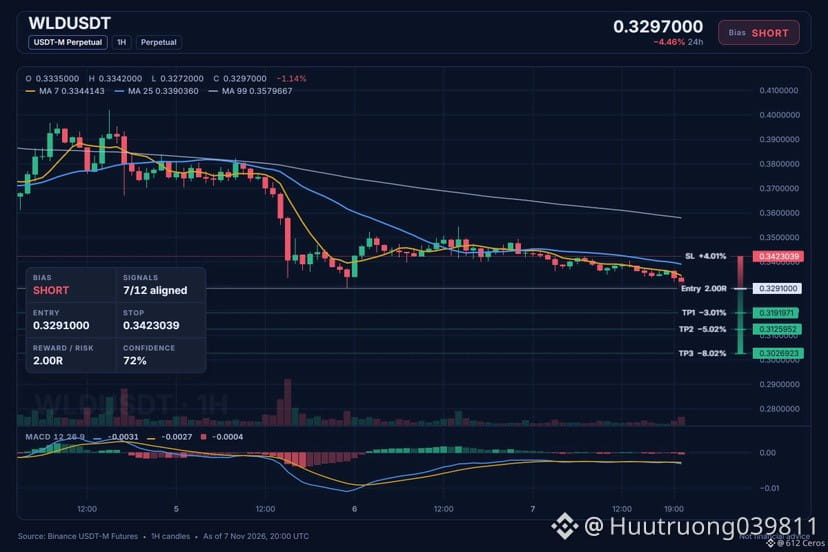
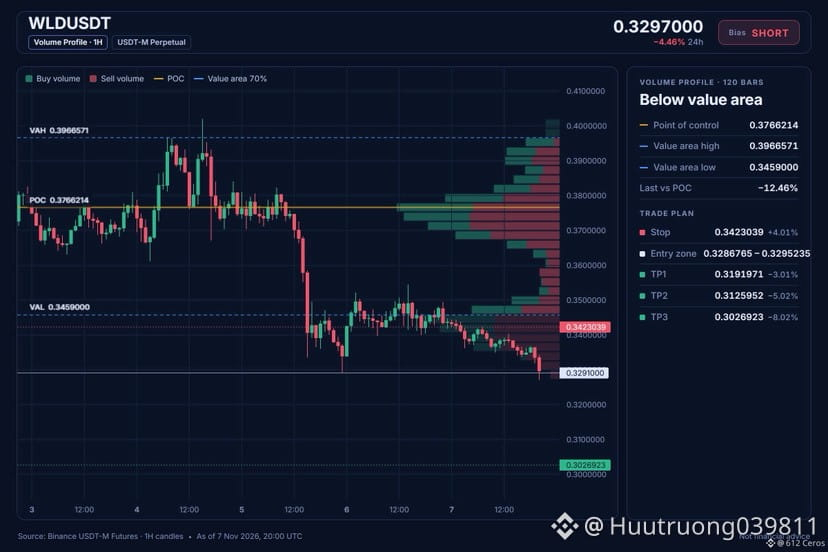
🔴 $WLD /USDT · Bias: SHORT
WLD sits below both EMAs on the 4h chart, pointing lower.
Entry: 0.3286765 – 0.3295235
TP1: 0.3191971 (-3.0%)
TP2: 0.3125952 (-5.0%)
TP3: 0.3026923 (-8.0%)
SL: 0.3423039 (+4.0%)
Why: The 4h trend shows price below EMA50 and EMA200 in a bearish stack, meaning the swing trend is down.
Risk: Far below its average, bounce likely (−4.1 ATR from 1h EMA50)
Plan: close 50% at TP1, 25% at TP2, 25% at TP3, and move the stop to entry after TP1.
Where do you think this short ends?
{spot}(WLDUSDT)
🔴 $WLD /USDT · Bias: SHORT
WLD sits below both EMAs on the 4h chart, pointing lower.
Entry: 0.3286765 – 0.3295235
TP1: 0.3191971 (-3.0%)
TP2: 0.3125952 (-5.0%)
TP3: 0.3026923 (-8.0%)
SL: 0.3423039 (+4.0%)
Why: The 4h trend shows price below EMA50 and EMA200 in a bearish stack, meaning the swing trend is down.
Risk: Far below its average, bounce likely (−4.1 ATR from 1h EMA50)
Plan: close 50% at TP1, 25% at TP2, 25% at TP3, and move the stop to entry after TP1.
Where do you think this short ends?
WLD sits below both EMAs on the 4h chart, pointing lower.
Entry: 0.3286765 – 0.3295235
TP1: 0.3191971 (-3.0%)
TP2: 0.3125952 (-5.0%)
TP3: 0.3026923 (-8.0%)
SL: 0.3423039 (+4.0%)
Why: The 4h trend shows price below EMA50 and EMA200 in a bearish stack, meaning the swing trend is down.
Risk: Far below its average, bounce likely (−4.1 ATR from 1h EMA50)
Plan: close 50% at TP1, 25% at TP2, 25% at TP3, and move the stop to entry after TP1.
Where do you think this short ends?
18
·
--
Bearish
See translation
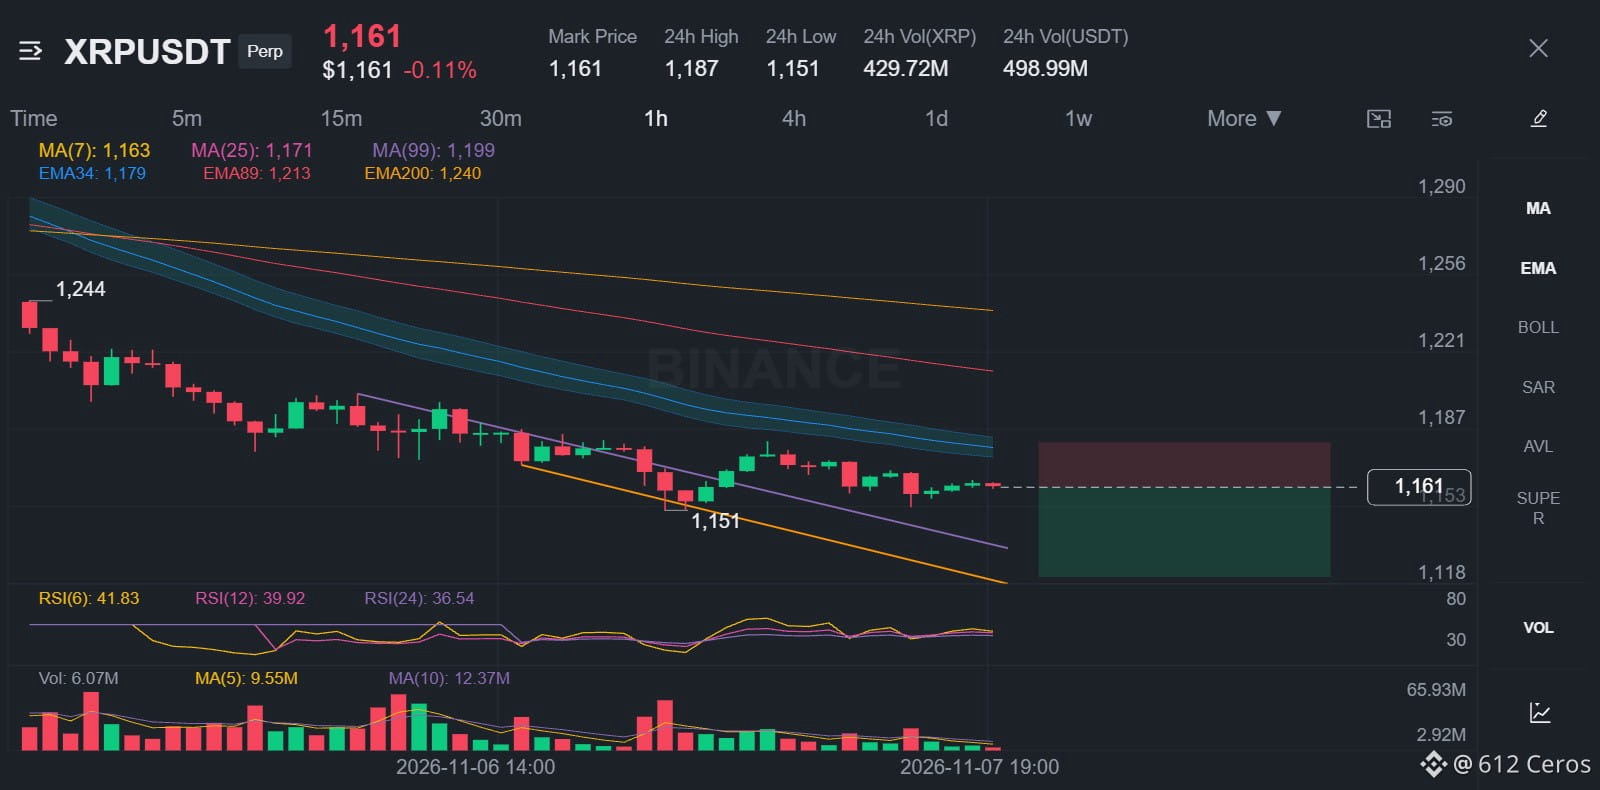
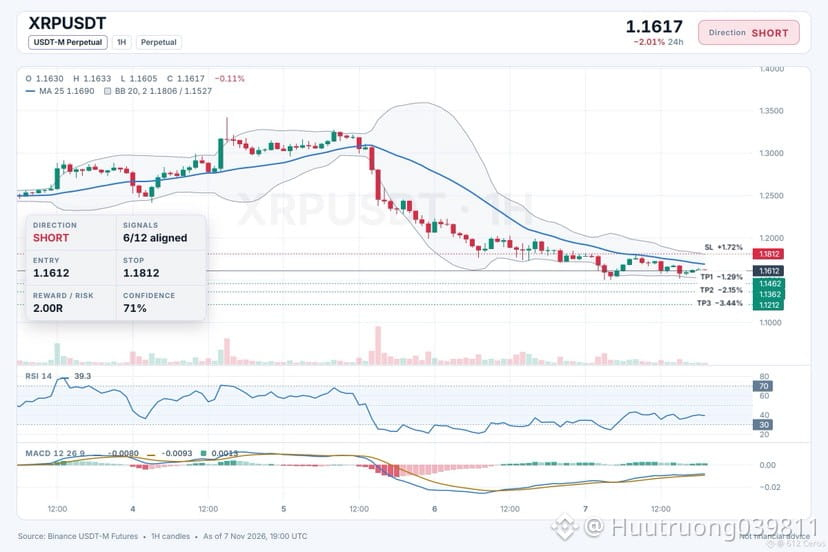
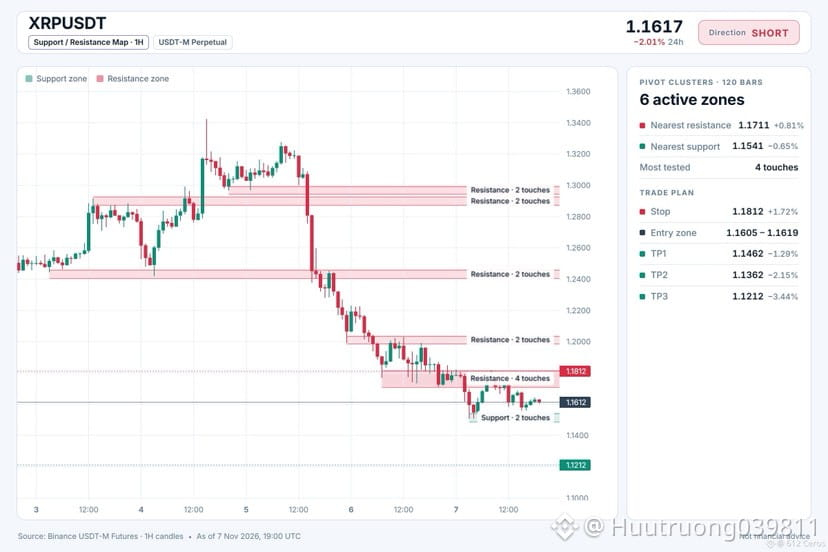
🔴 $XRP /USDT · Bias: SHORT
XRP breaks below all three EMAs as the trend turns clearly bearish.
Entry: 1.1605 – 1.1619
TP1: 1.1462 (-1.3%)
TP2: 1.1362 (-2.2%)
TP3: 1.1212 (-3.4%)
SL: 1.1812 (+1.7%)
Why: 4h RSI at 31.1 means sellers have the momentum, so price should keep falling.
Risk: Far below its average, bounce likely (−3.6 ATR from 1h EMA50)
Plan: close 50% at TP1, 25% at TP2, 25% at TP3, and move the stop to entry after TP1.
Where do you see XRP heading from here?
{spot}(XRPUSDT)
🔴 $XRP /USDT · Bias: SHORT
XRP breaks below all three EMAs as the trend turns clearly bearish.
Entry: 1.1605 – 1.1619
TP1: 1.1462 (-1.3%)
TP2: 1.1362 (-2.2%)
TP3: 1.1212 (-3.4%)
SL: 1.1812 (+1.7%)
Why: 4h RSI at 31.1 means sellers have the momentum, so price should keep falling.
Risk: Far below its average, bounce likely (−3.6 ATR from 1h EMA50)
Plan: close 50% at TP1, 25% at TP2, 25% at TP3, and move the stop to entry after TP1.
Where do you see XRP heading from here?
XRP breaks below all three EMAs as the trend turns clearly bearish.
Entry: 1.1605 – 1.1619
TP1: 1.1462 (-1.3%)
TP2: 1.1362 (-2.2%)
TP3: 1.1212 (-3.4%)
SL: 1.1812 (+1.7%)
Why: 4h RSI at 31.1 means sellers have the momentum, so price should keep falling.
Risk: Far below its average, bounce likely (−3.6 ATR from 1h EMA50)
Plan: close 50% at TP1, 25% at TP2, 25% at TP3, and move the stop to entry after TP1.
Where do you see XRP heading from here?
23
·
--
Bearish
See translation
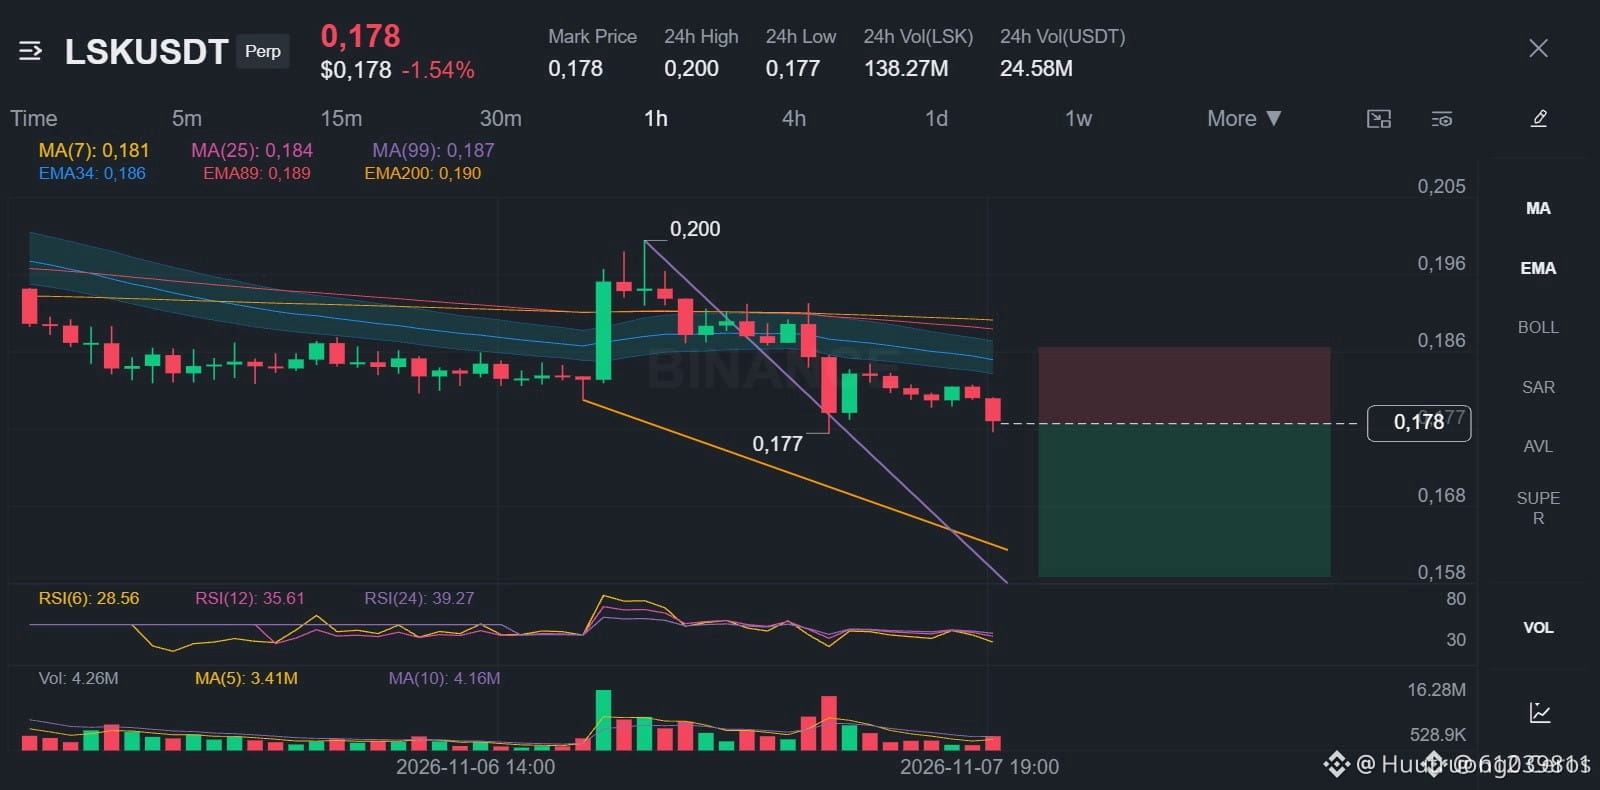
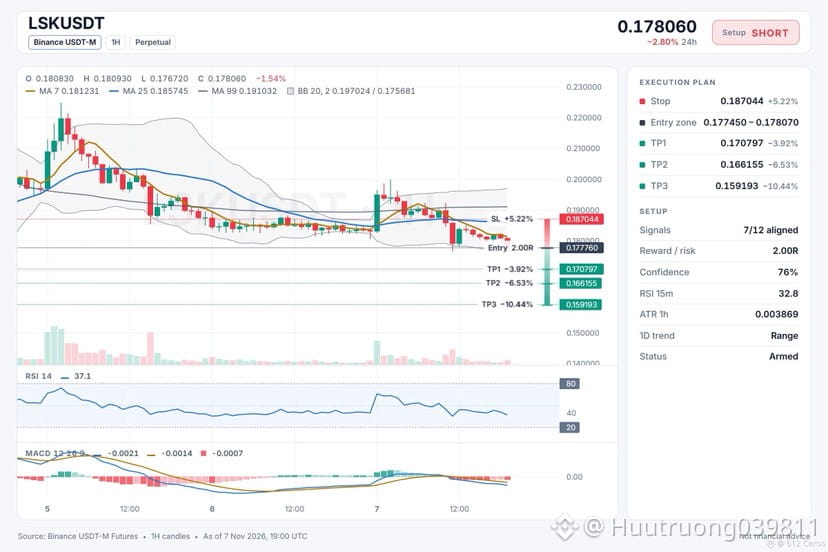
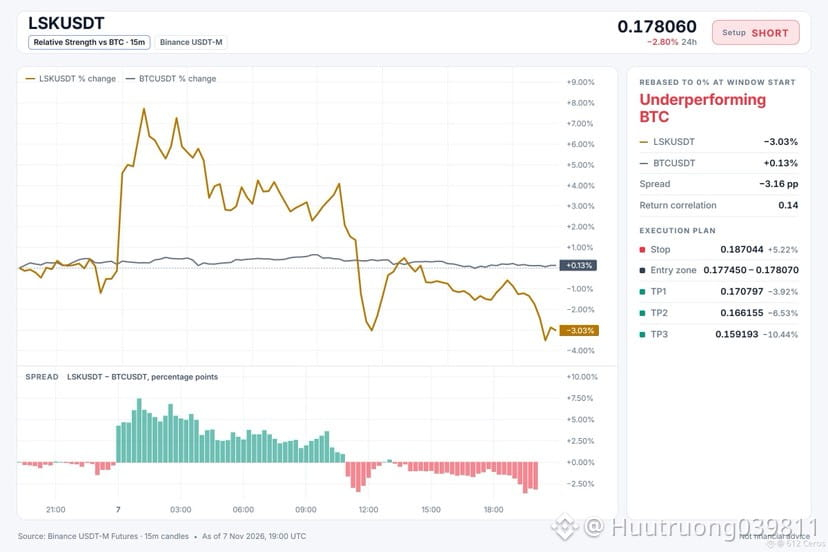
🔴 $LSK /USDT · Bias: SHORT
Bearish stack on the 4h chart points lower as price sits below both EMAs.
Entry: 0.177450 – 0.178070
TP1: 0.170797 (-3.9%)
TP2: 0.166155 (-6.5%)
TP3: 0.159193 (-10.4%)
SL: 0.187044 (+5.2%)
Why: ADX 28.4 with sellers in control means the directional movement index shows strong selling pressure.
Plan: close 50% at TP1, 25% at TP2, 25% at TP3, and move the stop to entry after TP1.
Would you enter short here or wait for a lower pullback?
{spot}(LSKUSDT)
🔴 $LSK /USDT · Bias: SHORT
Bearish stack on the 4h chart points lower as price sits below both EMAs.
Entry: 0.177450 – 0.178070
TP1: 0.170797 (-3.9%)
TP2: 0.166155 (-6.5%)
TP3: 0.159193 (-10.4%)
SL: 0.187044 (+5.2%)
Why: ADX 28.4 with sellers in control means the directional movement index shows strong selling pressure.
Plan: close 50% at TP1, 25% at TP2, 25% at TP3, and move the stop to entry after TP1.
Would you enter short here or wait for a lower pullback?
Bearish stack on the 4h chart points lower as price sits below both EMAs.
Entry: 0.177450 – 0.178070
TP1: 0.170797 (-3.9%)
TP2: 0.166155 (-6.5%)
TP3: 0.159193 (-10.4%)
SL: 0.187044 (+5.2%)
Why: ADX 28.4 with sellers in control means the directional movement index shows strong selling pressure.
Plan: close 50% at TP1, 25% at TP2, 25% at TP3, and move the stop to entry after TP1.
Would you enter short here or wait for a lower pullback?
14
·
--
Bearish
See translation
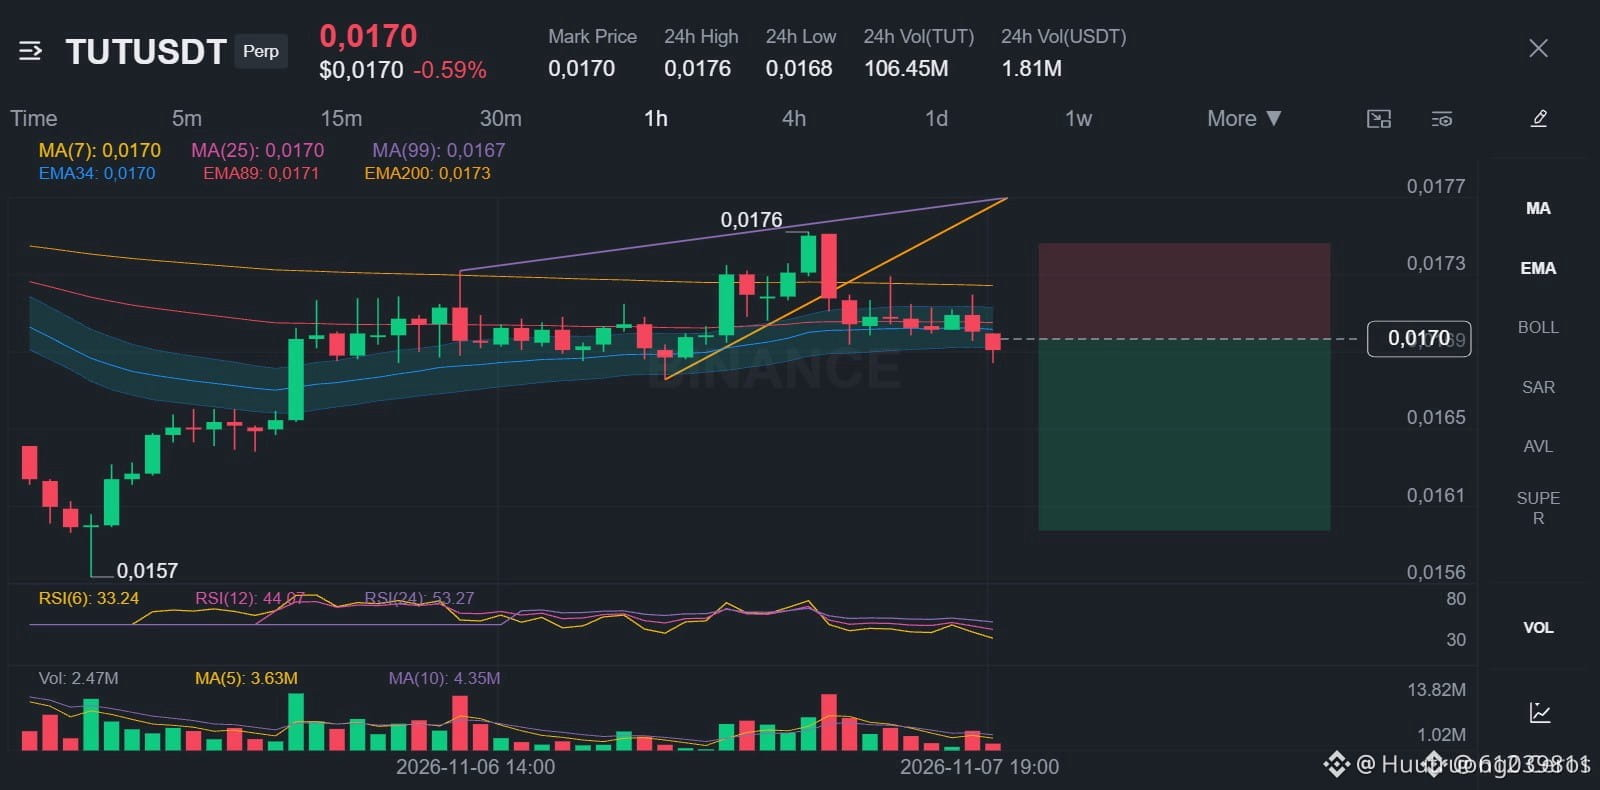
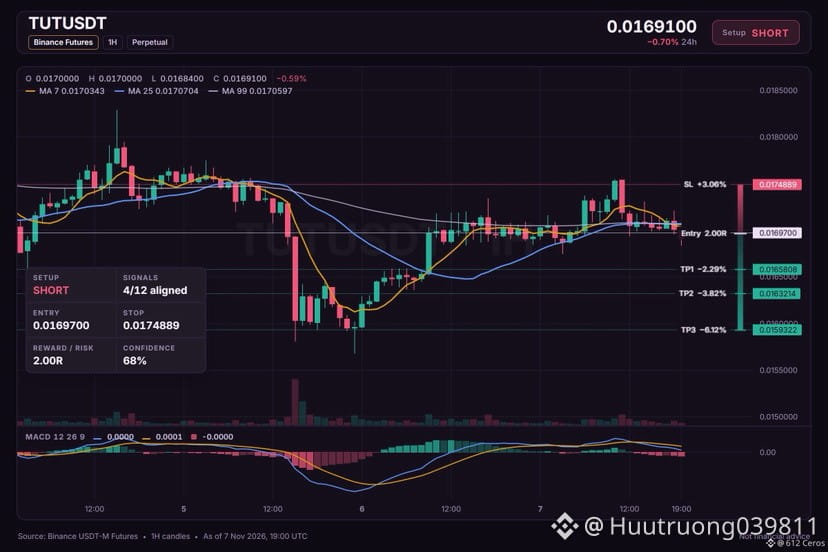
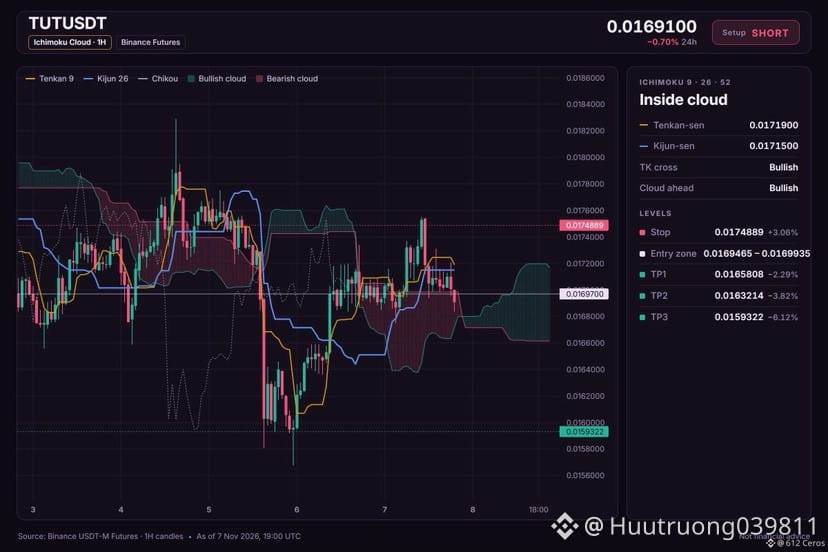
🔴 $TUT /USDT · Bias: SHORT
The daily trend points lower as price sits below both EMAs in a bearish stack.
Entry: 0.0169465 – 0.0169935
TP1: 0.0165808 (-2.3%)
TP2: 0.0163214 (-3.8%)
TP3: 0.0159322 (-6.1%)
SL: 0.0174889 (+3.1%)
Note: moderate conviction only, keep size light.
Why: Daily trend shows price below EMA50 and EMA200 in a bearish stack, meaning the big-picture trend is down.
Plan: close 50% at TP1, 25% at TP2, 25% at TP3, and move the stop to entry after TP1.
Where do you want to take profits on this short?
{spot}(TUTUSDT)
🔴 $TUT /USDT · Bias: SHORT
The daily trend points lower as price sits below both EMAs in a bearish stack.
Entry: 0.0169465 – 0.0169935
TP1: 0.0165808 (-2.3%)
TP2: 0.0163214 (-3.8%)
TP3: 0.0159322 (-6.1%)
SL: 0.0174889 (+3.1%)
Note: moderate conviction only, keep size light.
Why: Daily trend shows price below EMA50 and EMA200 in a bearish stack, meaning the big-picture trend is down.
Plan: close 50% at TP1, 25% at TP2, 25% at TP3, and move the stop to entry after TP1.
Where do you want to take profits on this short?
The daily trend points lower as price sits below both EMAs in a bearish stack.
Entry: 0.0169465 – 0.0169935
TP1: 0.0165808 (-2.3%)
TP2: 0.0163214 (-3.8%)
TP3: 0.0159322 (-6.1%)
SL: 0.0174889 (+3.1%)
Note: moderate conviction only, keep size light.
Why: Daily trend shows price below EMA50 and EMA200 in a bearish stack, meaning the big-picture trend is down.
Plan: close 50% at TP1, 25% at TP2, 25% at TP3, and move the stop to entry after TP1.
Where do you want to take profits on this short?
17
·
--
Bearish
See translation
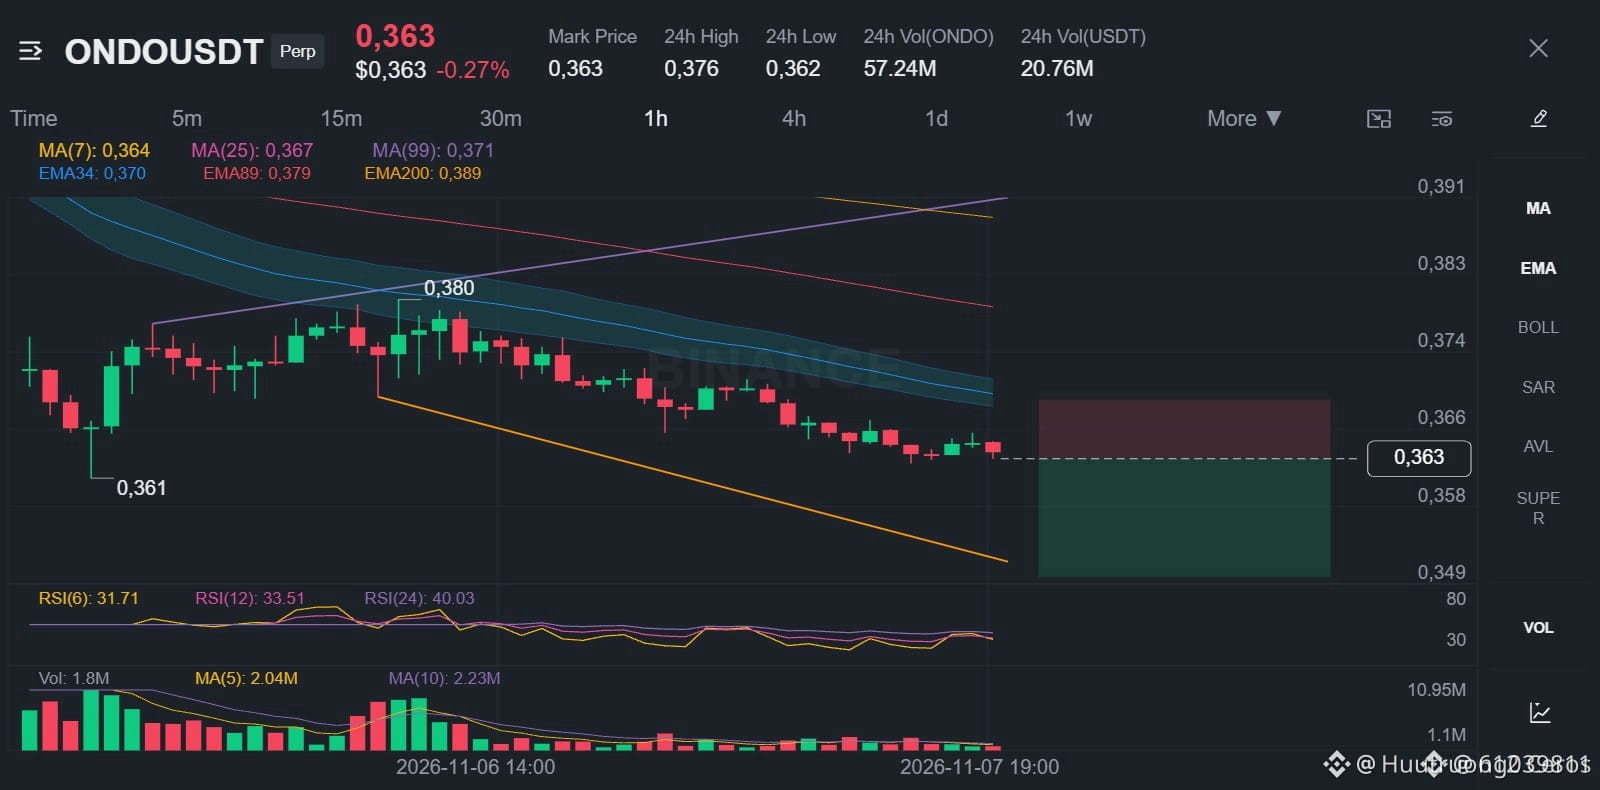
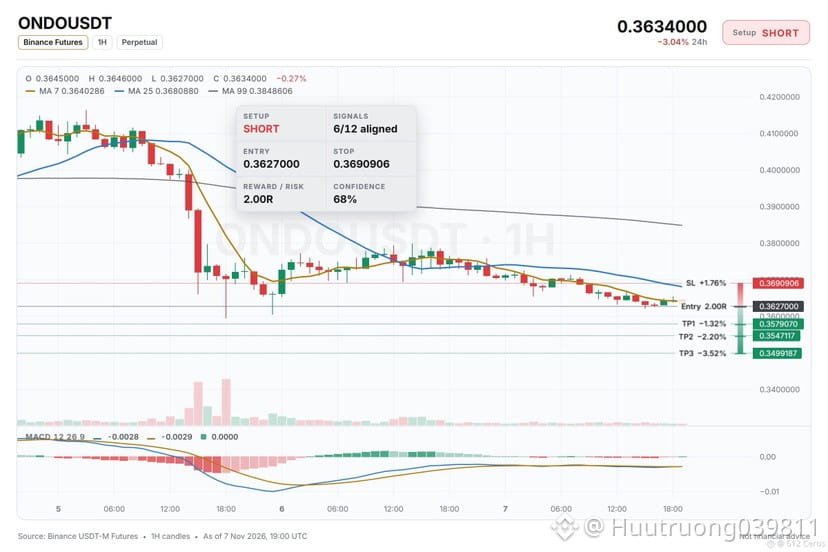
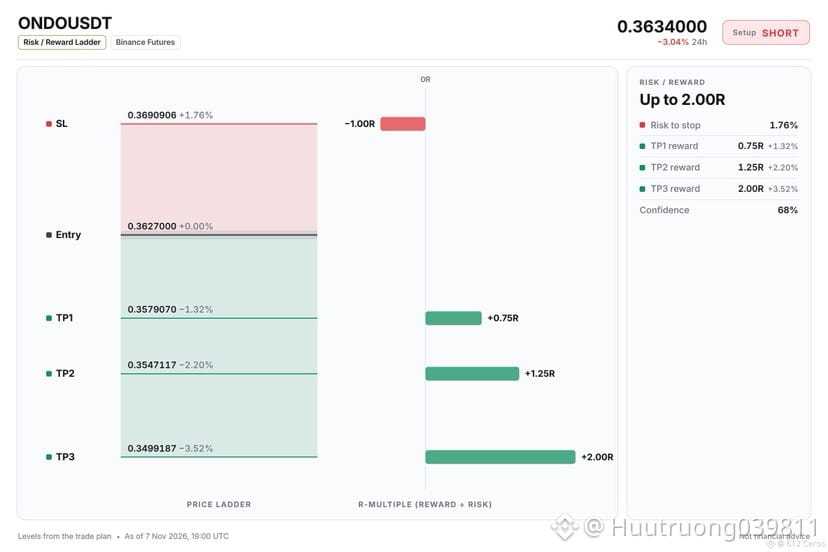
🔴 $ONDO /USDT · Bias: SHORT
Price sits below both EMAs in a bearish stack, pointing lower.
Entry: 0.3624450 – 0.3629550
TP1: 0.3579070 (-1.3%)
TP2: 0.3547117 (-2.2%)
TP3: 0.3499187 (-3.5%)
SL: 0.3690906 (+1.8%)
Why: ADX 26.8 with sellers in control means the short-term move has strong directional momentum.
Risk: Far below its average, bounce likely (−3.8 ATR from 1h EMA50)
Plan: close 50% at TP1, 25% at TP2, 25% at TP3, and move the stop to entry after TP1.
Where do you see ONDO heading from here?
{spot}(ONDOUSDT)
🔴 $ONDO /USDT · Bias: SHORT
Price sits below both EMAs in a bearish stack, pointing lower.
Entry: 0.3624450 – 0.3629550
TP1: 0.3579070 (-1.3%)
TP2: 0.3547117 (-2.2%)
TP3: 0.3499187 (-3.5%)
SL: 0.3690906 (+1.8%)
Why: ADX 26.8 with sellers in control means the short-term move has strong directional momentum.
Risk: Far below its average, bounce likely (−3.8 ATR from 1h EMA50)
Plan: close 50% at TP1, 25% at TP2, 25% at TP3, and move the stop to entry after TP1.
Where do you see ONDO heading from here?
Price sits below both EMAs in a bearish stack, pointing lower.
Entry: 0.3624450 – 0.3629550
TP1: 0.3579070 (-1.3%)
TP2: 0.3547117 (-2.2%)
TP3: 0.3499187 (-3.5%)
SL: 0.3690906 (+1.8%)
Why: ADX 26.8 with sellers in control means the short-term move has strong directional momentum.
Risk: Far below its average, bounce likely (−3.8 ATR from 1h EMA50)
Plan: close 50% at TP1, 25% at TP2, 25% at TP3, and move the stop to entry after TP1.
Where do you see ONDO heading from here?
19
·
--
Bearish
See translation
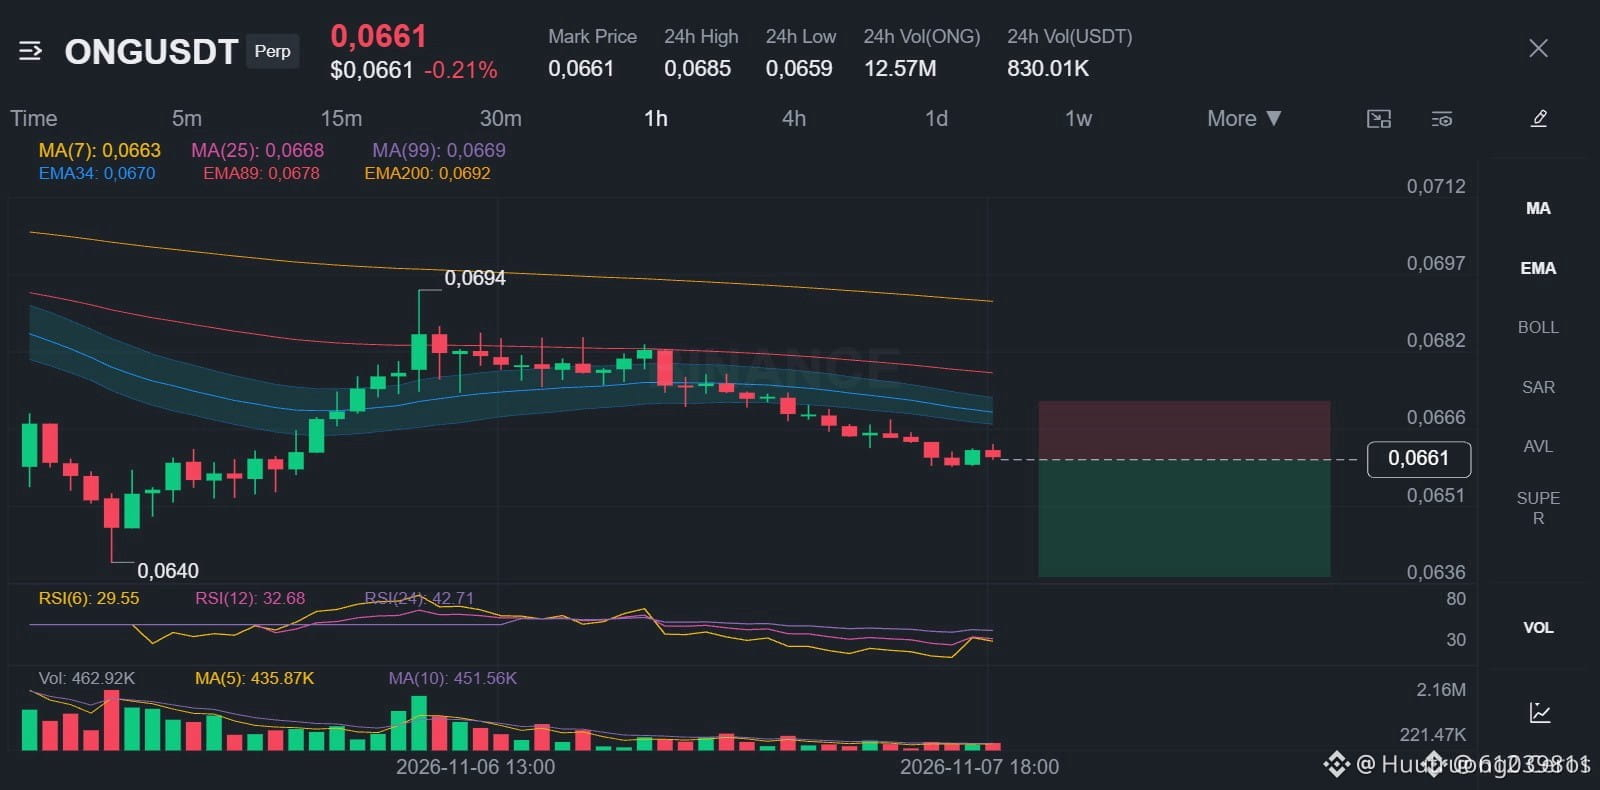
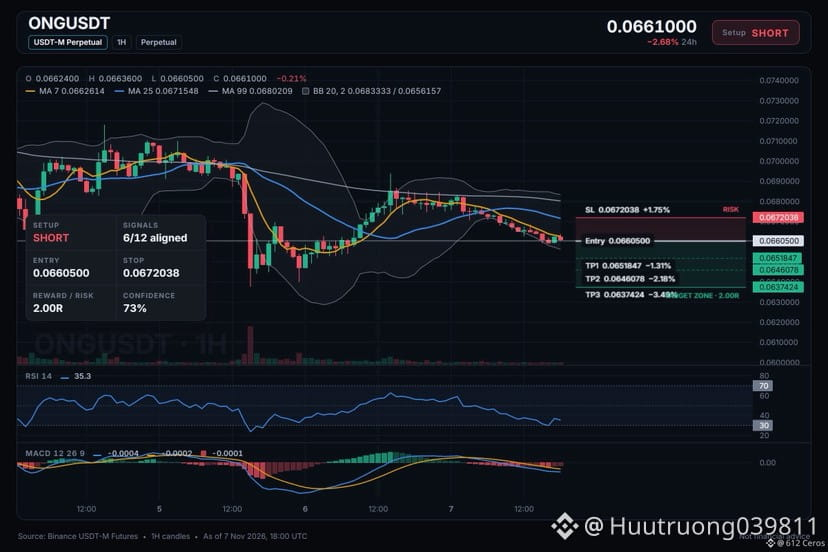
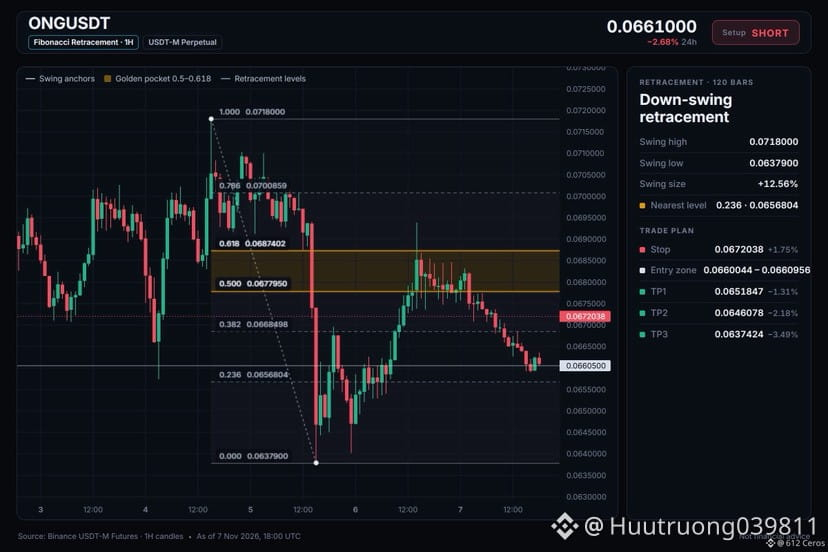
🔴 $ONG /USDT · Bias: SHORT
The 4h price sits below both EMAs in a bearish stack, pointing lower.
Entry: 0.0660044 – 0.0660956
TP1: 0.0651847 (-1.3%)
TP2: 0.0646078 (-2.2%)
TP3: 0.0637424 (-3.5%)
SL: 0.0672038 (+1.7%)
Why: The 4h trend shows price below EMA50 and EMA200, a bearish stack meaning the swing trend is down.
Plan: close 50% at TP1, 25% at TP2, 25% at TP3, and move the stop to entry after TP1.
Do you see this as a valid short entry?
{spot}(ONGUSDT)
🔴 $ONG /USDT · Bias: SHORT
The 4h price sits below both EMAs in a bearish stack, pointing lower.
Entry: 0.0660044 – 0.0660956
TP1: 0.0651847 (-1.3%)
TP2: 0.0646078 (-2.2%)
TP3: 0.0637424 (-3.5%)
SL: 0.0672038 (+1.7%)
Why: The 4h trend shows price below EMA50 and EMA200, a bearish stack meaning the swing trend is down.
Plan: close 50% at TP1, 25% at TP2, 25% at TP3, and move the stop to entry after TP1.
Do you see this as a valid short entry?
The 4h price sits below both EMAs in a bearish stack, pointing lower.
Entry: 0.0660044 – 0.0660956
TP1: 0.0651847 (-1.3%)
TP2: 0.0646078 (-2.2%)
TP3: 0.0637424 (-3.5%)
SL: 0.0672038 (+1.7%)
Why: The 4h trend shows price below EMA50 and EMA200, a bearish stack meaning the swing trend is down.
Plan: close 50% at TP1, 25% at TP2, 25% at TP3, and move the stop to entry after TP1.
Do you see this as a valid short entry?
19
·
--
Bearish
See translation
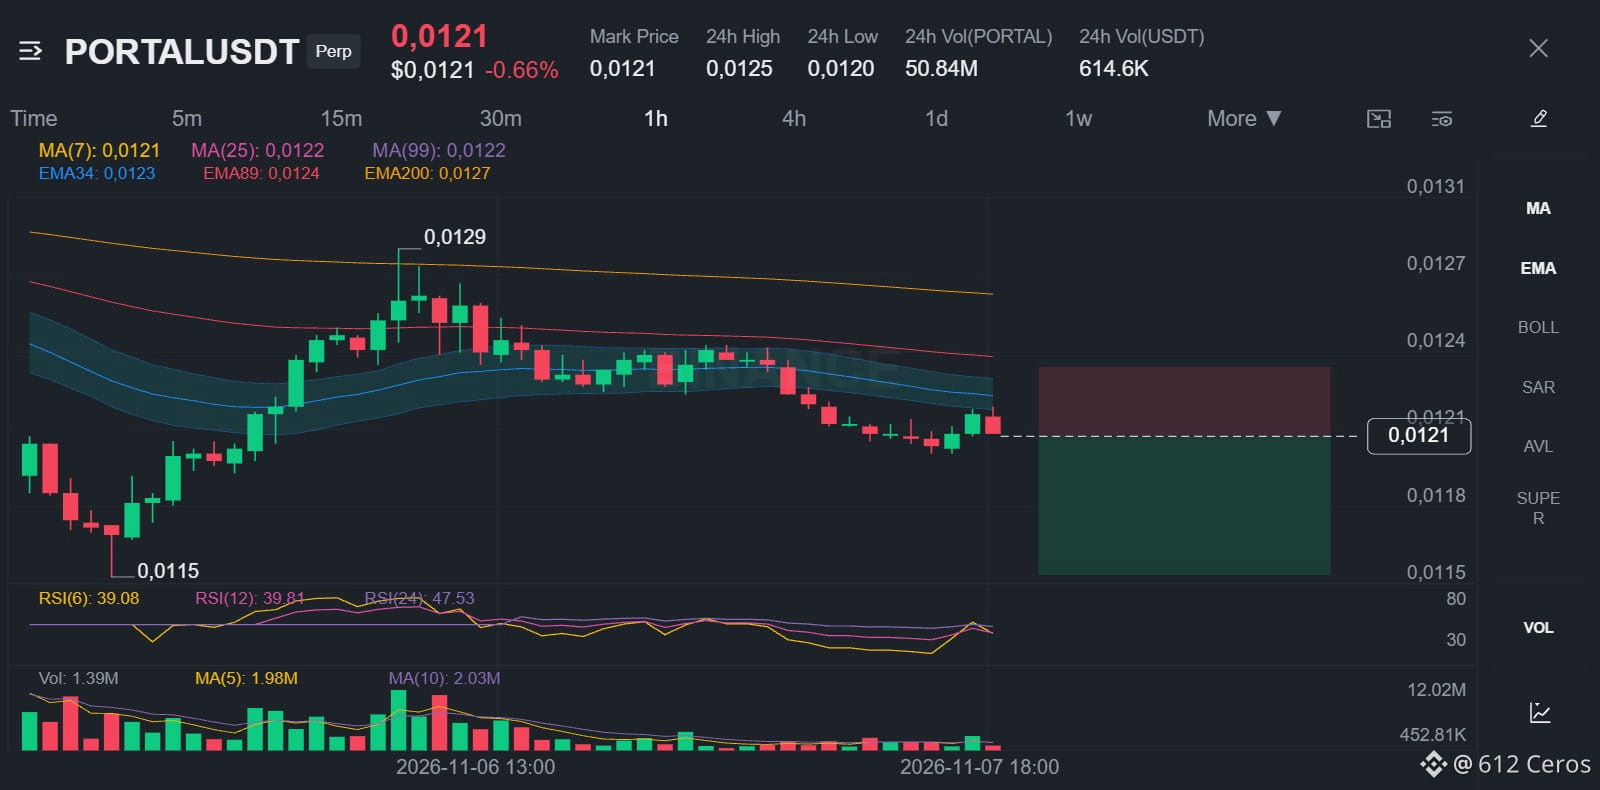
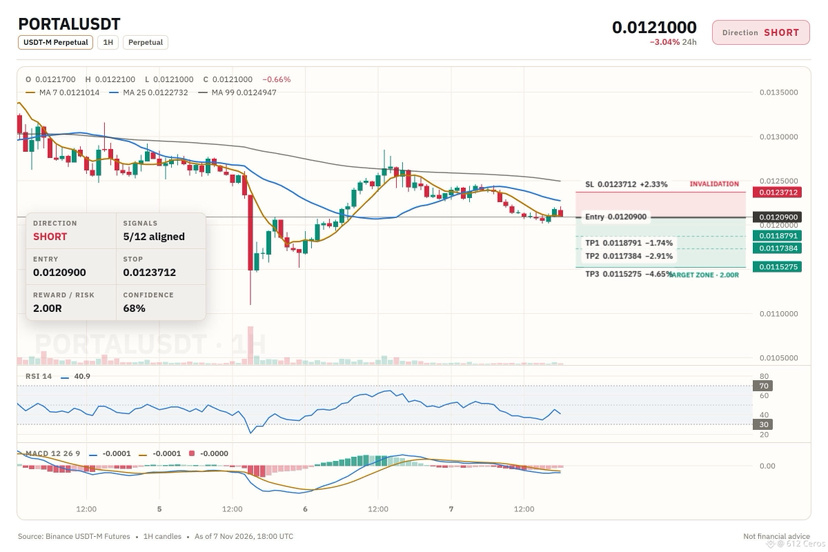
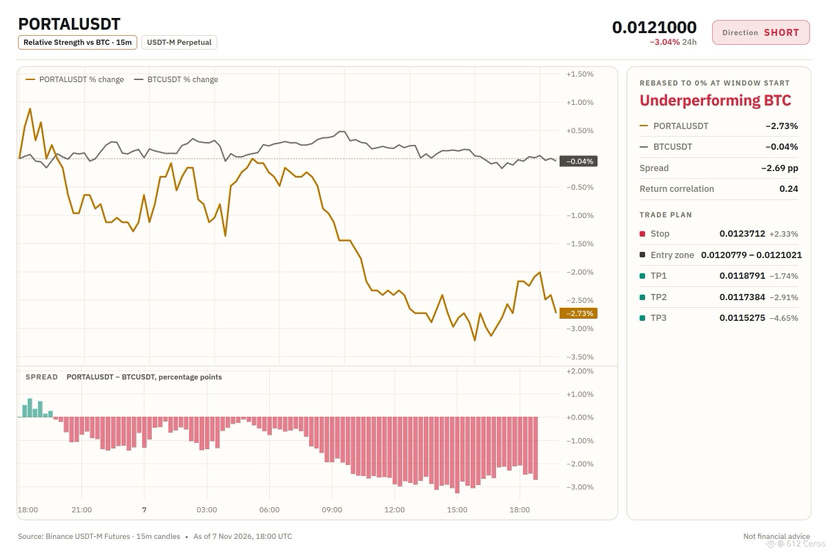
🔴 $PORTAL /USDT · Bias: SHORT
Price sits below both EMAs in a bearish stack, pointing lower.
Entry: 0.0120779 – 0.0121021
TP1: 0.0118791 (-1.7%)
TP2: 0.0117384 (-2.9%)
TP3: 0.0115275 (-4.7%)
SL: 0.0123712 (+2.3%)
Note: moderate conviction only, keep size light.
Why: the 4h price is below both EMAs in a bearish stack, meaning the swing trend is down.
Plan: close 50% at TP1, 25% at TP2, 25% at TP3, and move the stop to entry after TP1.
Do you see more downside from here?
{spot}(PORTALUSDT)
🔴 $PORTAL /USDT · Bias: SHORT
Price sits below both EMAs in a bearish stack, pointing lower.
Entry: 0.0120779 – 0.0121021
TP1: 0.0118791 (-1.7%)
TP2: 0.0117384 (-2.9%)
TP3: 0.0115275 (-4.7%)
SL: 0.0123712 (+2.3%)
Note: moderate conviction only, keep size light.
Why: the 4h price is below both EMAs in a bearish stack, meaning the swing trend is down.
Plan: close 50% at TP1, 25% at TP2, 25% at TP3, and move the stop to entry after TP1.
Do you see more downside from here?
Price sits below both EMAs in a bearish stack, pointing lower.
Entry: 0.0120779 – 0.0121021
TP1: 0.0118791 (-1.7%)
TP2: 0.0117384 (-2.9%)
TP3: 0.0115275 (-4.7%)
SL: 0.0123712 (+2.3%)
Note: moderate conviction only, keep size light.
Why: the 4h price is below both EMAs in a bearish stack, meaning the swing trend is down.
Plan: close 50% at TP1, 25% at TP2, 25% at TP3, and move the stop to entry after TP1.
Do you see more downside from here?
17
·
--
Bearish
See translation
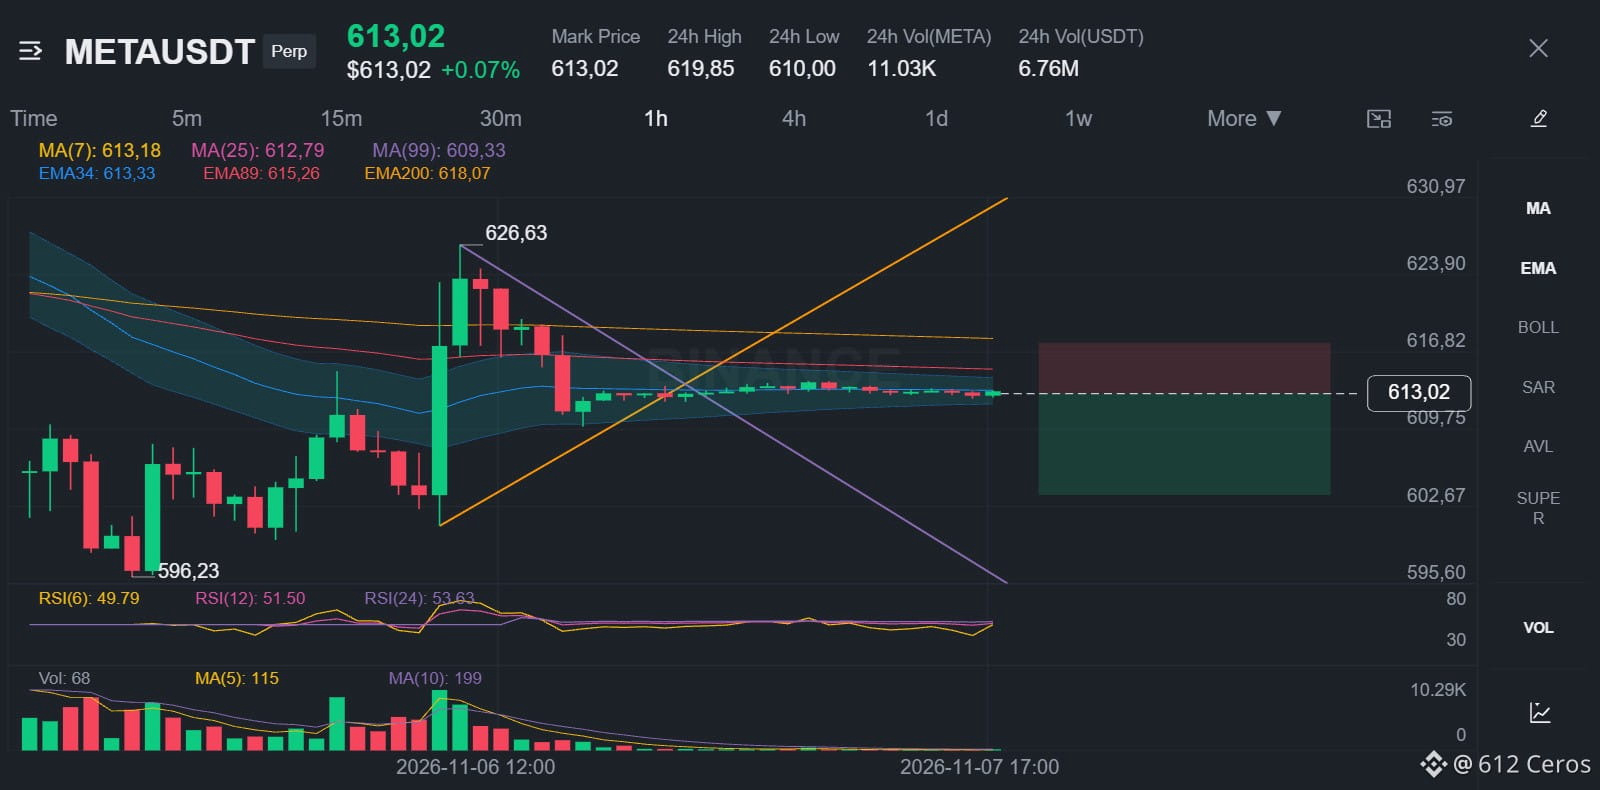
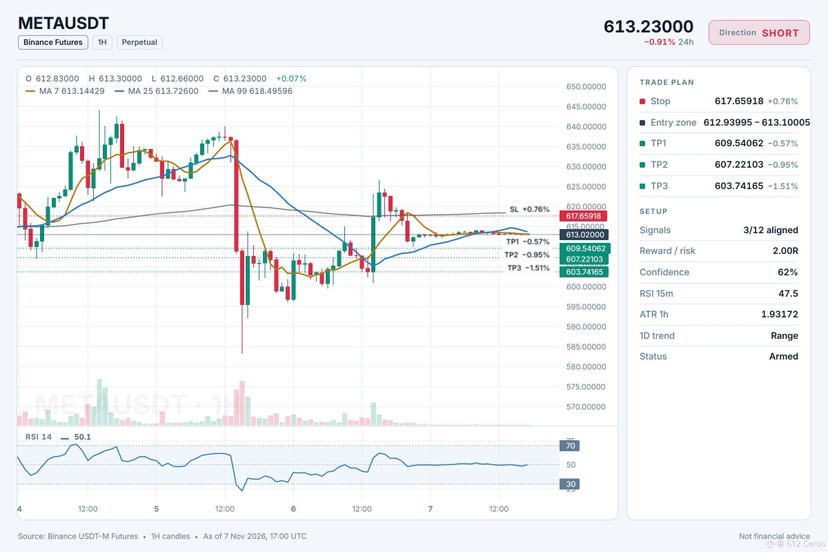
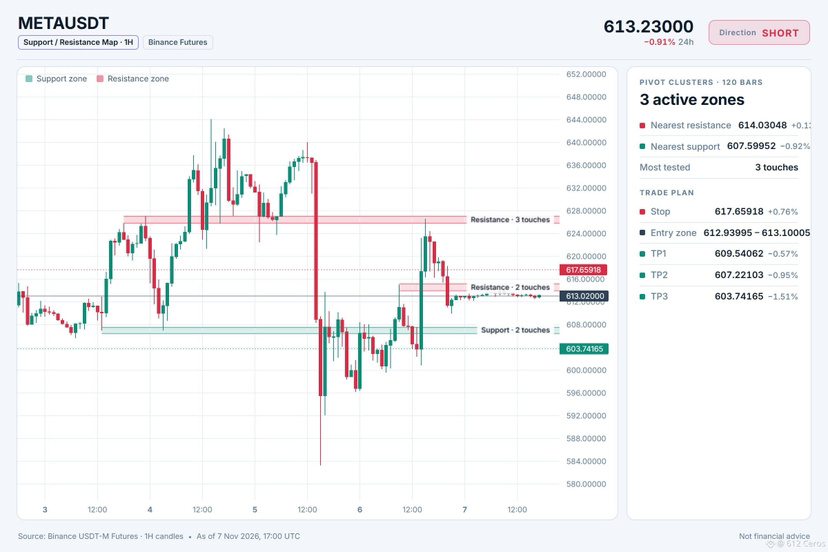
🔴 $META /USDT · Bias: SHORT
4h bearish stack points lower after price broke below both EMAs.
Entry: 612.93995 – 613.10005
TP1: 609.54062 (-0.6%)
TP2: 607.22103 (-0.9%)
TP3: 603.74165 (-1.5%)
SL: 617.65918 (+0.8%)
Note: moderate conviction only, keep size light.
Why: The 4h price sits below both EMAs in a bearish stack, meaning the swing trend is down.
Plan: close 50% at TP1, 25% at TP2, 25% at TP3, and move the stop to entry after TP1.
Do you think price continues lower from here?
{future}(METAUSDT)
🔴 $META /USDT · Bias: SHORT
4h bearish stack points lower after price broke below both EMAs.
Entry: 612.93995 – 613.10005
TP1: 609.54062 (-0.6%)
TP2: 607.22103 (-0.9%)
TP3: 603.74165 (-1.5%)
SL: 617.65918 (+0.8%)
Note: moderate conviction only, keep size light.
Why: The 4h price sits below both EMAs in a bearish stack, meaning the swing trend is down.
Plan: close 50% at TP1, 25% at TP2, 25% at TP3, and move the stop to entry after TP1.
Do you think price continues lower from here?
4h bearish stack points lower after price broke below both EMAs.
Entry: 612.93995 – 613.10005
TP1: 609.54062 (-0.6%)
TP2: 607.22103 (-0.9%)
TP3: 603.74165 (-1.5%)
SL: 617.65918 (+0.8%)
Note: moderate conviction only, keep size light.
Why: The 4h price sits below both EMAs in a bearish stack, meaning the swing trend is down.
Plan: close 50% at TP1, 25% at TP2, 25% at TP3, and move the stop to entry after TP1.
Do you think price continues lower from here?
18
·
--
Bullish
See translation
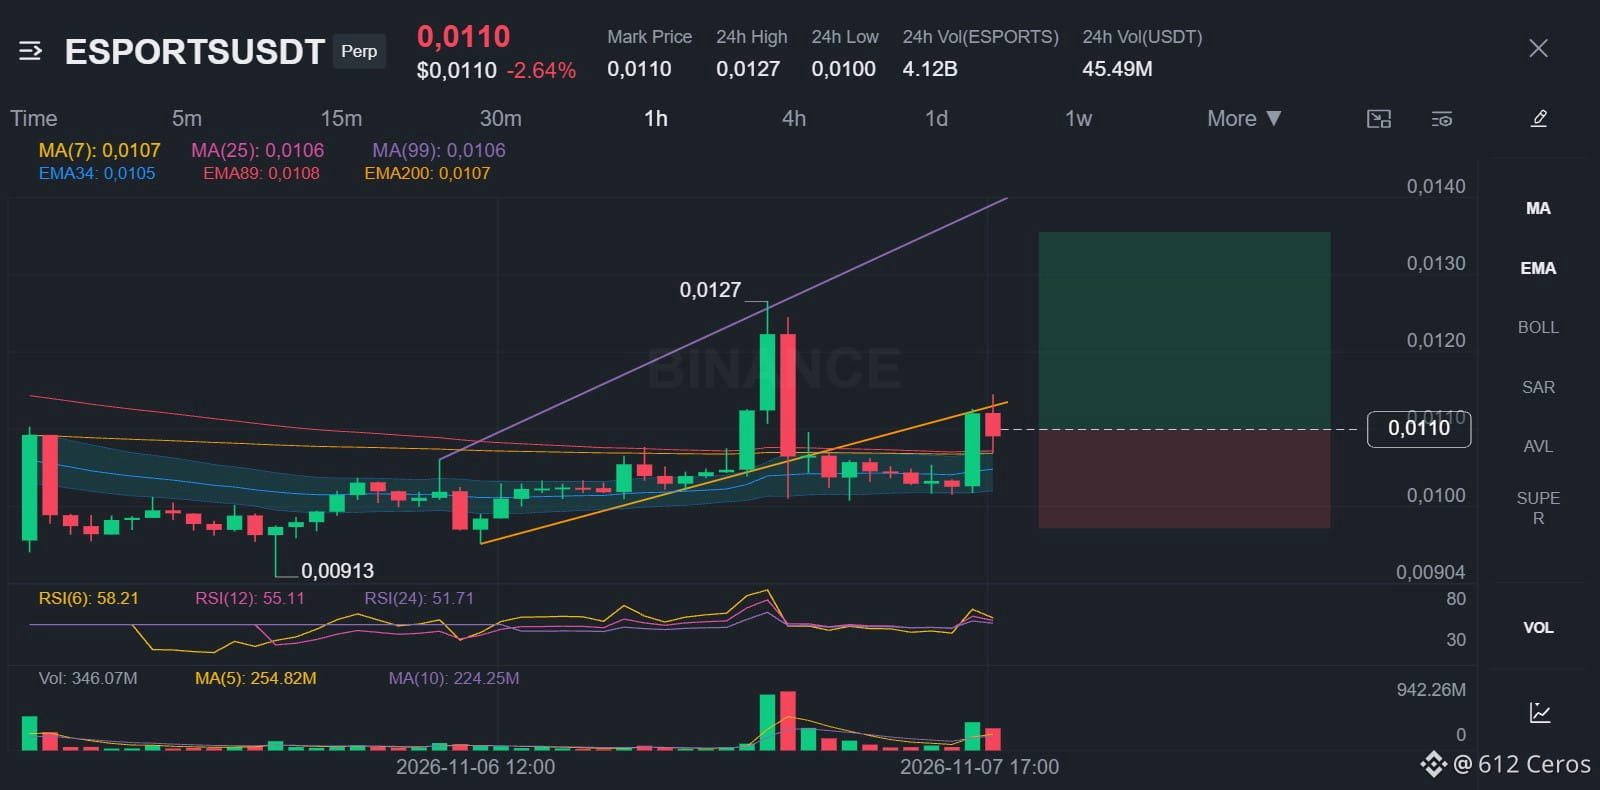
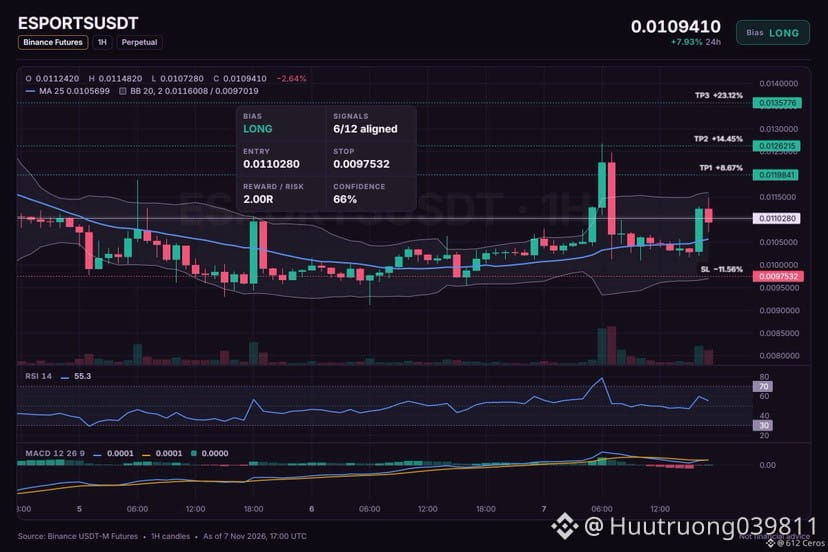
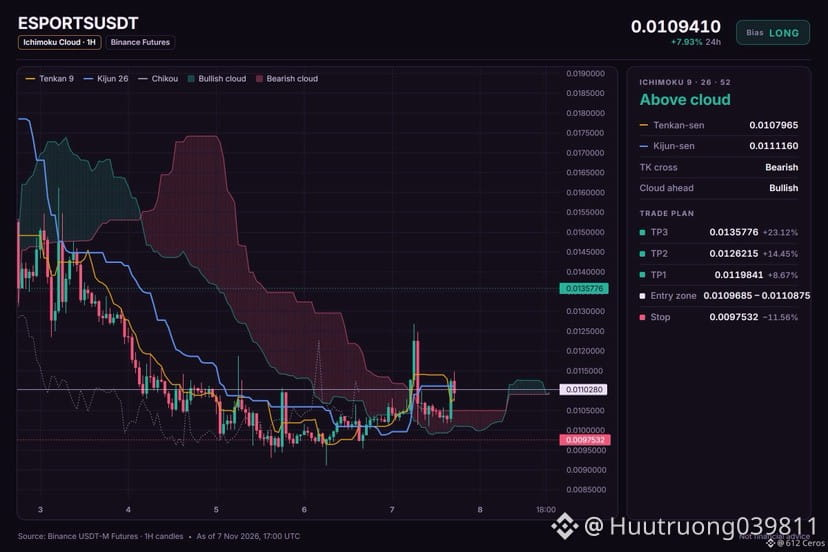
🟢 $ESPORTS /USDT · Bias: LONG
4h bullish stack forms as price rises above both EMAs.
Entry: 0.0109685 – 0.0110875
TP1: 0.0119841 (+8.7%)
TP2: 0.0126215 (+14.4%)
TP3: 0.0135776 (+23.1%)
SL: 0.0097532 (-11.6%)
Caution: counter-trend idea backed by 6 signals only. Smaller size, hard stop.
Why: The 4h trend shows price above EMA50 and EMA200, meaning the swing trend is up, which supports a long.
Risk: Daily trend down (below EMA50 & EMA200)
Plan: close 50% at TP1, 25% at TP2, 25% at TP3, and move the stop to entry after TP1.
Where do you place this counter-trend long?
{future}(ESPORTSUSDT)
🟢 $ESPORTS /USDT · Bias: LONG
4h bullish stack forms as price rises above both EMAs.
Entry: 0.0109685 – 0.0110875
TP1: 0.0119841 (+8.7%)
TP2: 0.0126215 (+14.4%)
TP3: 0.0135776 (+23.1%)
SL: 0.0097532 (-11.6%)
Caution: counter-trend idea backed by 6 signals only. Smaller size, hard stop.
Why: The 4h trend shows price above EMA50 and EMA200, meaning the swing trend is up, which supports a long.
Risk: Daily trend down (below EMA50 & EMA200)
Plan: close 50% at TP1, 25% at TP2, 25% at TP3, and move the stop to entry after TP1.
Where do you place this counter-trend long?
4h bullish stack forms as price rises above both EMAs.
Entry: 0.0109685 – 0.0110875
TP1: 0.0119841 (+8.7%)
TP2: 0.0126215 (+14.4%)
TP3: 0.0135776 (+23.1%)
SL: 0.0097532 (-11.6%)
Caution: counter-trend idea backed by 6 signals only. Smaller size, hard stop.
Why: The 4h trend shows price above EMA50 and EMA200, meaning the swing trend is up, which supports a long.
Risk: Daily trend down (below EMA50 & EMA200)
Plan: close 50% at TP1, 25% at TP2, 25% at TP3, and move the stop to entry after TP1.
Where do you place this counter-trend long?
18
·
--
Bearish
See translation
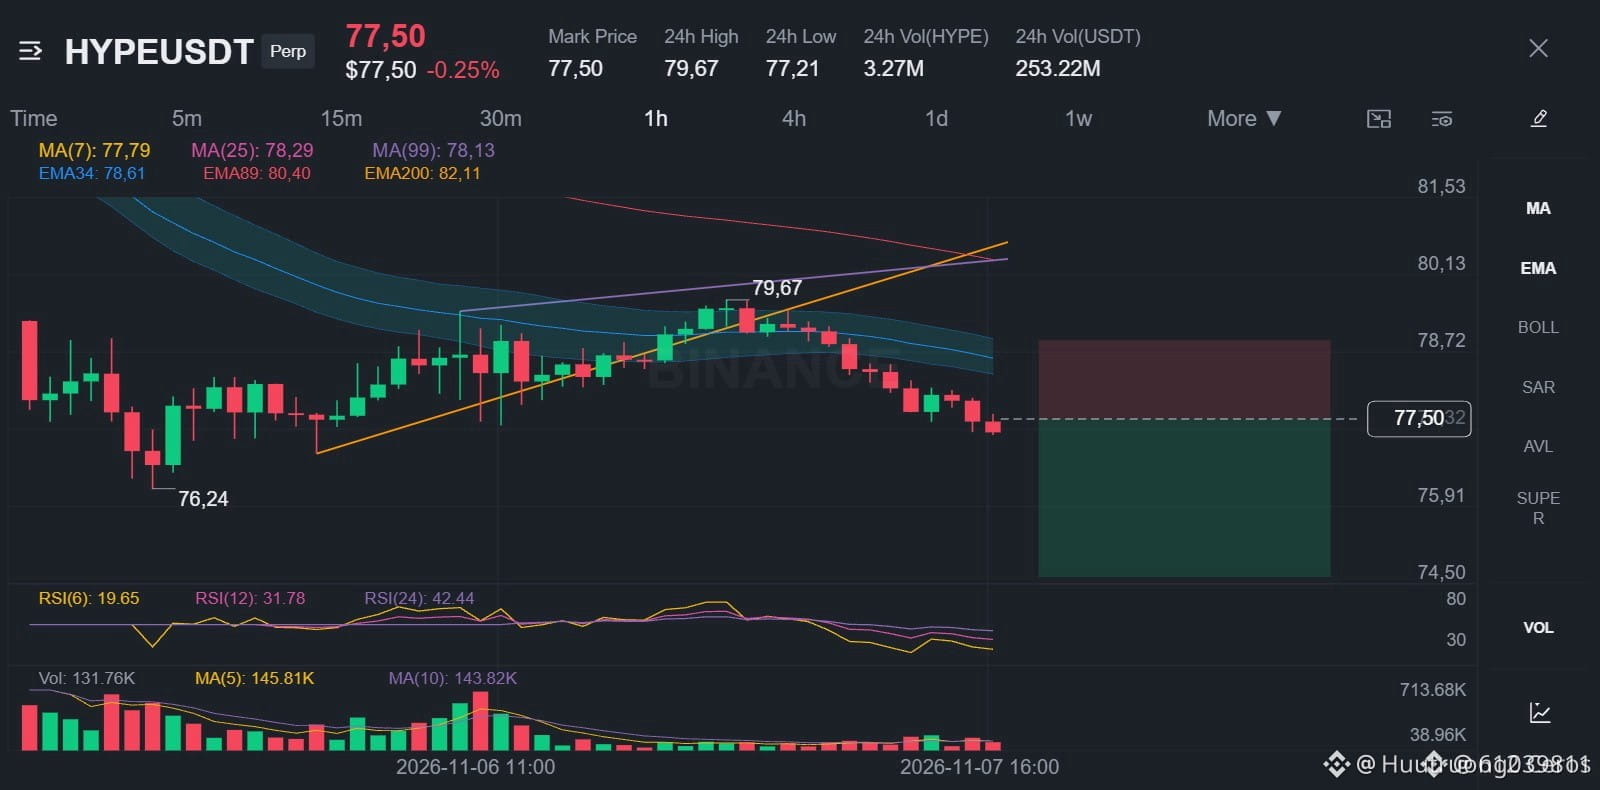
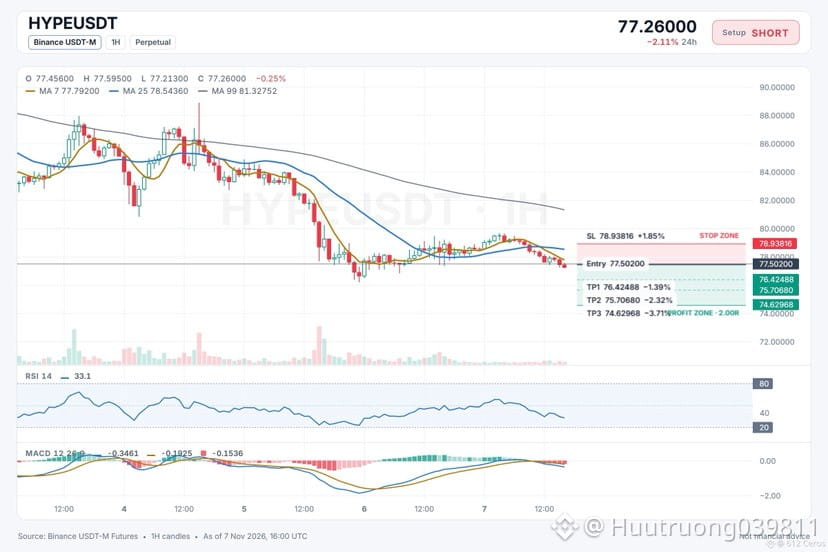
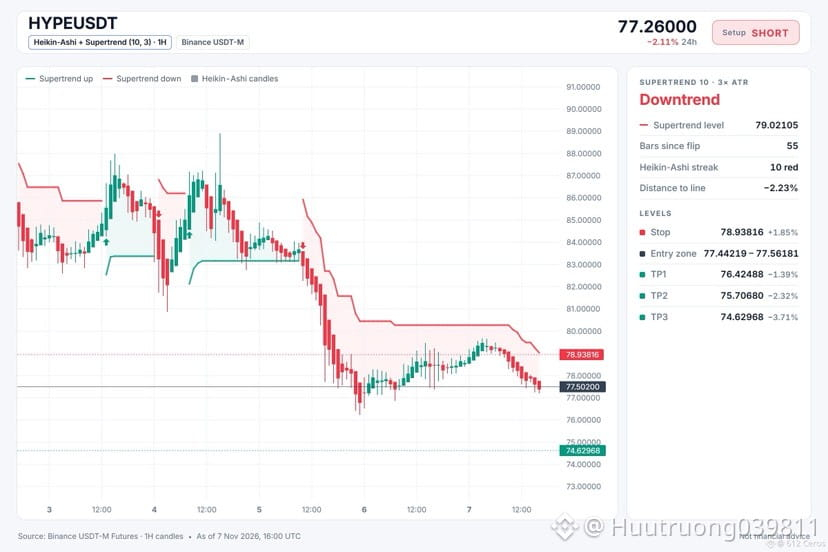
🔴 $HYPE /USDT · Bias: SHORT
The 4h price sits below both EMAs in a bearish stack, pointing lower.
Entry: 77.44219 – 77.56181
TP1: 76.42488 (-1.4%)
TP2: 75.70680 (-2.3%)
TP3: 74.62968 (-3.7%)
SL: 78.93816 (+1.9%)
Note: moderate conviction only, keep size light.
Why: The 1h price is below both EMAs in a bearish stack, so the short-term trend is down.
Plan: close 50% at TP1, 25% at TP2, 25% at TP3, and move the stop to entry after TP1.
Where do you see this trade heading?
{spot}(HYPEUSDT)
🔴 $HYPE /USDT · Bias: SHORT
The 4h price sits below both EMAs in a bearish stack, pointing lower.
Entry: 77.44219 – 77.56181
TP1: 76.42488 (-1.4%)
TP2: 75.70680 (-2.3%)
TP3: 74.62968 (-3.7%)
SL: 78.93816 (+1.9%)
Note: moderate conviction only, keep size light.
Why: The 1h price is below both EMAs in a bearish stack, so the short-term trend is down.
Plan: close 50% at TP1, 25% at TP2, 25% at TP3, and move the stop to entry after TP1.
Where do you see this trade heading?
The 4h price sits below both EMAs in a bearish stack, pointing lower.
Entry: 77.44219 – 77.56181
TP1: 76.42488 (-1.4%)
TP2: 75.70680 (-2.3%)
TP3: 74.62968 (-3.7%)
SL: 78.93816 (+1.9%)
Note: moderate conviction only, keep size light.
Why: The 1h price is below both EMAs in a bearish stack, so the short-term trend is down.
Plan: close 50% at TP1, 25% at TP2, 25% at TP3, and move the stop to entry after TP1.
Where do you see this trade heading?
7
Log in to explore more content
Join global crypto users on Binance Square
⚡️ Get latest and useful information about crypto.
💬 Trusted by the world’s largest crypto exchange.
👍 Discover real insights from verified creators.
Email / Phone number
Trending Topics
JobsReportRaisesHikeOdds
600,412 views
3,766 Discussing
TradFi News | US Adds 165,000 Jobs in October, More Than Double the 65,000 Forecast, as Unemployment Falls to 4.1%
Binance News
·44 Likes
·24.4k views
CPITestsDecemberRateOutlook
198,357 views
1,422 Discussing
US Data Center Rules May Constrain AI Expansion
84,043 views
239 Discussing