
Tra100d
180 Posts

Tra100d
Report
Block User
3 Following
51 Followers
57 Liked
Posts
·
--
See translation
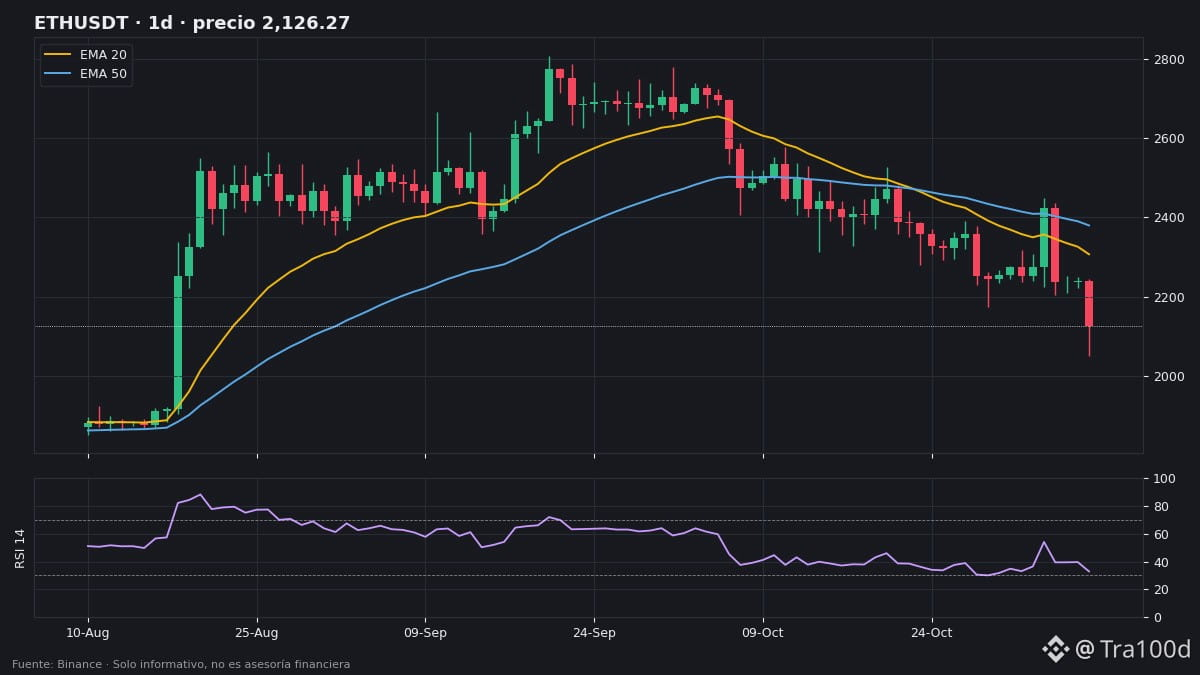
📉 Esta mañana $ETH estaba apenas debajo de su EMA 200 diaria. El cierre del domingo lo confirmó con fuerza: 2.126 $ frente a 2.240 $ (−5,1 %). Ahora cotiza en 2.146 $ (−4,1 % en 24 h).
📊 Contexto diario:
• Tendencia bajista/rango: debajo de la EMA 20 (2.307 $), la EMA 50 (2.380 $) y la EMA 200 (2.240 $)
• RSI 32,9: cerca de la sobreventa (en 4 h ya marca 23,3)
• −5,6 % en las últimas 6 velas; perdió el mínimo de 20 días anterior (2.173 $) y tocó 2.050 $
• ATR 101 $ (4,7 %): rango esperable por día
📏 Niveles:
• Soporte: 2.050 $ (nuevo mínimo de 20 días)
• Resistencias: 2.173 $ (soporte roto), 2.240 $ (EMA 200) y 2.307 $ (EMA 20)
🟢 Escenario alcista: recuperar 2.173 $ y volver a cerrar sobre la EMA 200 (2.240 $) invalidaría la ruptura.
🔴 Escenario bajista: seguir debajo de 2.173 $ deja los 2.050 $ como siguiente parada.
👀 Qué vigilar: funding pasa a negativo (−0,007 %) e interés abierto −3,2 %: se cierran posiciones, típico de largos liquidados. El cierre diario del lunes dirá si la ruptura se sostiene.
¿Recupera la EMA 200 o busca los 2.050 $? 👇
#ETH #Ethereum #AnalisisTecnico #Cripto #Tra100d
⚠️ Contenido solo informativo y educativo, no es asesoría financiera. Las criptomonedas son volátiles: investiga y opera con precaución.
📉 Esta mañana $ETH estaba apenas debajo de su EMA 200 diaria. El cierre del domingo lo confirmó con fuerza: 2.126 $ frente a 2.240 $ (−5,1 %). Ahora cotiza en 2.146 $ (−4,1 % en 24 h).
📊 Contexto diario:
• Tendencia bajista/rango: debajo de la EMA 20 (2.307 $), la EMA 50 (2.380 $) y la EMA 200 (2.240 $)
• RSI 32,9: cerca de la sobreventa (en 4 h ya marca 23,3)
• −5,6 % en las últimas 6 velas; perdió el mínimo de 20 días anterior (2.173 $) y tocó 2.050 $
• ATR 101 $ (4,7 %): rango esperable por día
📏 Niveles:
• Soporte: 2.050 $ (nuevo mínimo de 20 días)
• Resistencias: 2.173 $ (soporte roto), 2.240 $ (EMA 200) y 2.307 $ (EMA 20)
🟢 Escenario alcista: recuperar 2.173 $ y volver a cerrar sobre la EMA 200 (2.240 $) invalidaría la ruptura.
🔴 Escenario bajista: seguir debajo de 2.173 $ deja los 2.050 $ como siguiente parada.
👀 Qué vigilar: funding pasa a negativo (−0,007 %) e interés abierto −3,2 %: se cierran posiciones, típico de largos liquidados. El cierre diario del lunes dirá si la ruptura se sostiene.
¿Recupera la EMA 200 o busca los 2.050 $? 👇
#ETH #Ethereum #AnalisisTecnico #Cripto #Tra100d
⚠️ Contenido solo informativo y educativo, no es asesoría financiera. Las criptomonedas son volátiles: investiga y opera con precaución.
📊 Contexto diario:
• Tendencia bajista/rango: debajo de la EMA 20 (2.307 $), la EMA 50 (2.380 $) y la EMA 200 (2.240 $)
• RSI 32,9: cerca de la sobreventa (en 4 h ya marca 23,3)
• −5,6 % en las últimas 6 velas; perdió el mínimo de 20 días anterior (2.173 $) y tocó 2.050 $
• ATR 101 $ (4,7 %): rango esperable por día
📏 Niveles:
• Soporte: 2.050 $ (nuevo mínimo de 20 días)
• Resistencias: 2.173 $ (soporte roto), 2.240 $ (EMA 200) y 2.307 $ (EMA 20)
🟢 Escenario alcista: recuperar 2.173 $ y volver a cerrar sobre la EMA 200 (2.240 $) invalidaría la ruptura.
🔴 Escenario bajista: seguir debajo de 2.173 $ deja los 2.050 $ como siguiente parada.
👀 Qué vigilar: funding pasa a negativo (−0,007 %) e interés abierto −3,2 %: se cierran posiciones, típico de largos liquidados. El cierre diario del lunes dirá si la ruptura se sostiene.
¿Recupera la EMA 200 o busca los 2.050 $? 👇
#ETH #Ethereum #AnalisisTecnico #Cripto #Tra100d
⚠️ Contenido solo informativo y educativo, no es asesoría financiera. Las criptomonedas son volátiles: investiga y opera con precaución.
12
·
--
See translation
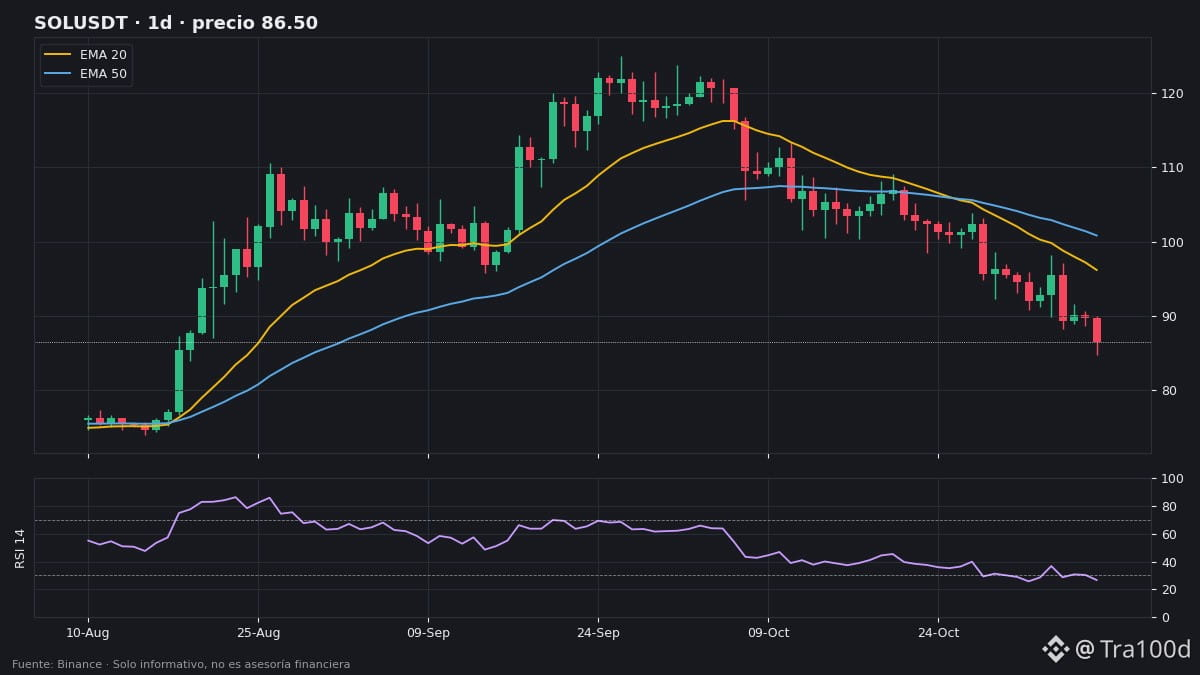
🚨 $SOL rompió el soporte de 88,24 $ que vigilábamos esta mañana: tocó 84,66 $ (nuevo mínimo de 20 días) y ahora rebota a 87,74 $ (−1,9 % en 24 h).
RSI diario 26,7: ya en sobreventa. Cerró el día en 86,50 $, debajo de su EMA 200 diaria (93,74 $), con −5,9 % en 6 velas e interés abierto −1,7 % (salen posiciones).
📏 Niveles: 88,24 $ pasa de soporte a resistencia; perder 84,66 $ abre un mínimo nuevo. Recuperar 94 $ seguiría siendo la primera señal de fuerza.
#SOL #Solana #Alerta #Cripto #Tra100d
⚠️ Contenido solo informativo y educativo, no es asesoría financiera. Las criptomonedas son volátiles: investiga y opera con precaución.
🚨 $SOL rompió el soporte de 88,24 $ que vigilábamos esta mañana: tocó 84,66 $ (nuevo mínimo de 20 días) y ahora rebota a 87,74 $ (−1,9 % en 24 h).
RSI diario 26,7: ya en sobreventa. Cerró el día en 86,50 $, debajo de su EMA 200 diaria (93,74 $), con −5,9 % en 6 velas e interés abierto −1,7 % (salen posiciones).
📏 Niveles: 88,24 $ pasa de soporte a resistencia; perder 84,66 $ abre un mínimo nuevo. Recuperar 94 $ seguiría siendo la primera señal de fuerza.
#SOL #Solana #Alerta #Cripto #Tra100d
⚠️ Contenido solo informativo y educativo, no es asesoría financiera. Las criptomonedas son volátiles: investiga y opera con precaución.
RSI diario 26,7: ya en sobreventa. Cerró el día en 86,50 $, debajo de su EMA 200 diaria (93,74 $), con −5,9 % en 6 velas e interés abierto −1,7 % (salen posiciones).
📏 Niveles: 88,24 $ pasa de soporte a resistencia; perder 84,66 $ abre un mínimo nuevo. Recuperar 94 $ seguiría siendo la primera señal de fuerza.
#SOL #Solana #Alerta #Cripto #Tra100d
⚠️ Contenido solo informativo y educativo, no es asesoría financiera. Las criptomonedas son volátiles: investiga y opera con precaución.
47
·
--
🧠 "RSI at 30 = you should buy." It's one of the most repeated myths in crypto. Let's see what it really means.
📘 What it is: the RSI (relative strength index) measures from 0 to 100 how strong the rises were compared with the falls over the last 14 candles.
• Above 70 → overbought: it rose quickly.
• Below 30 → oversold: it fell quickly.
• Between 40 and 60 → neutral zone.
📊 Today's daily RSI (Binance):
• $SOL : 30.4 → on the verge of oversold territory
• $XRP : 31.6
• DOGE: 34.5
• BTC: 38.0
• $PEPE : 55.8 → neutral, the only meme coin in the green today (+1.8%)
❌ Common mistake: treating oversold conditions as a signal of a rebound. Real example: on Saturday, XRP had a daily RSI of 32, and today it still hasn't rebounded, trading below its previous low ($1.1645). In strong downtrends, the RSI can stay low for days.
💡 Use it better like this: combine it with support levels, the trend (EMAs), and volume—not on its own.
📝 In one line: the RSI tells you how quickly the price moved, not where it's headed.
Do you use the RSI in your analyses? YES / NO 👇
#RSI #AnalisisTecnico #AprendeCripto #Binance #Tra100d
⚠️ For informational and educational purposes only; this is not financial advice. Cryptocurrencies are volatile: do your research and trade with caution.
🧠 "RSI at 30 = you should buy." It's one of the most repeated myths in crypto. Let's see what it really means.
📘 What it is: the RSI (relative strength index) measures from 0 to 100 how strong the rises were compared with the falls over the last 14 candles.
• Above 70 → overbought: it rose quickly.
• Below 30 → oversold: it fell quickly.
• Between 40 and 60 → neutral zone.
📊 Today's daily RSI (Binance):
• $SOL : 30.4 → on the verge of oversold territory
• $XRP : 31.6
• DOGE: 34.5
• BTC: 38.0
• $PEPE : 55.8 → neutral, the only meme coin in the green today (+1.8%)
❌ Common mistake: treating oversold conditions as a signal of a rebound. Real example: on Saturday, XRP had a daily RSI of 32, and today it still hasn't rebounded, trading below its previous low ($1.1645). In strong downtrends, the RSI can stay low for days.
💡 Use it better like this: combine it with support levels, the trend (EMAs), and volume—not on its own.
📝 In one line: the RSI tells you how quickly the price moved, not where it's headed.
Do you use the RSI in your analyses? YES / NO 👇
#RSI #AnalisisTecnico #AprendeCripto #Binance #Tra100d
⚠️ For informational and educational purposes only; this is not financial advice. Cryptocurrencies are volatile: do your research and trade with caution.
📘 What it is: the RSI (relative strength index) measures from 0 to 100 how strong the rises were compared with the falls over the last 14 candles.
• Above 70 → overbought: it rose quickly.
• Below 30 → oversold: it fell quickly.
• Between 40 and 60 → neutral zone.
📊 Today's daily RSI (Binance):
• $SOL : 30.4 → on the verge of oversold territory
• $XRP : 31.6
• DOGE: 34.5
• BTC: 38.0
• $PEPE : 55.8 → neutral, the only meme coin in the green today (+1.8%)
❌ Common mistake: treating oversold conditions as a signal of a rebound. Real example: on Saturday, XRP had a daily RSI of 32, and today it still hasn't rebounded, trading below its previous low ($1.1645). In strong downtrends, the RSI can stay low for days.
💡 Use it better like this: combine it with support levels, the trend (EMAs), and volume—not on its own.
📝 In one line: the RSI tells you how quickly the price moved, not where it's headed.
Do you use the RSI in your analyses? YES / NO 👇
#RSI #AnalisisTecnico #AprendeCripto #Binance #Tra100d
⚠️ For informational and educational purposes only; this is not financial advice. Cryptocurrencies are volatile: do your research and trade with caution.
24
·
--
🔥 Quiet Sunday… except for Zcash: $ZEC traded $109.1M, more than $SOL ($54.7M) and XRP ($52.4M) combined.
📌 3 things today:
• ZEC is the third-largest pair by volume, behind only BTC and ETH, and the biggest decliner in the group: −1.8% ($1,272.7).
• Even so, on the daily chart it remains in a strong uptrend: trading 48% above its 200-day EMA ($858.8).
• Negative funding (−0.008%) and open interest up 2.1%: shorts are coming in, betting on a correction.
🔍 Why it matters: so much volume in a coin that isn’t BTC or ETH shows where the market’s attention is. Its daily ATR is 9.5%, triple BTC’s: it moves a lot in both directions. I couldn’t find any confirmed news to explain it; these are just the data.
Meanwhile: the Fear and Greed Index rises from 25 to 28 (out of extreme fear), $BTC −0.04% ($75,976) and ETH −0.2%.
What does all this volume in ZEC tell you? 👇
#ZEC #Zcash #Altcoins #Cripto #Tra100d
⚠️ For informational and educational purposes only; this is not financial advice. Cryptocurrencies are volatile: do your own research and trade with caution.
🔥 Quiet Sunday… except for Zcash: $ZEC traded $109.1M, more than $SOL ($54.7M) and XRP ($52.4M) combined.
📌 3 things today:
• ZEC is the third-largest pair by volume, behind only BTC and ETH, and the biggest decliner in the group: −1.8% ($1,272.7).
• Even so, on the daily chart it remains in a strong uptrend: trading 48% above its 200-day EMA ($858.8).
• Negative funding (−0.008%) and open interest up 2.1%: shorts are coming in, betting on a correction.
🔍 Why it matters: so much volume in a coin that isn’t BTC or ETH shows where the market’s attention is. Its daily ATR is 9.5%, triple BTC’s: it moves a lot in both directions. I couldn’t find any confirmed news to explain it; these are just the data.
Meanwhile: the Fear and Greed Index rises from 25 to 28 (out of extreme fear), $BTC −0.04% ($75,976) and ETH −0.2%.
What does all this volume in ZEC tell you? 👇
#ZEC #Zcash #Altcoins #Cripto #Tra100d
⚠️ For informational and educational purposes only; this is not financial advice. Cryptocurrencies are volatile: do your own research and trade with caution.
📌 3 things today:
• ZEC is the third-largest pair by volume, behind only BTC and ETH, and the biggest decliner in the group: −1.8% ($1,272.7).
• Even so, on the daily chart it remains in a strong uptrend: trading 48% above its 200-day EMA ($858.8).
• Negative funding (−0.008%) and open interest up 2.1%: shorts are coming in, betting on a correction.
🔍 Why it matters: so much volume in a coin that isn’t BTC or ETH shows where the market’s attention is. Its daily ATR is 9.5%, triple BTC’s: it moves a lot in both directions. I couldn’t find any confirmed news to explain it; these are just the data.
Meanwhile: the Fear and Greed Index rises from 25 to 28 (out of extreme fear), $BTC −0.04% ($75,976) and ETH −0.2%.
What does all this volume in ZEC tell you? 👇
#ZEC #Zcash #Altcoins #Cripto #Tra100d
⚠️ For informational and educational purposes only; this is not financial advice. Cryptocurrencies are volatile: do your own research and trade with caution.
29
·
--
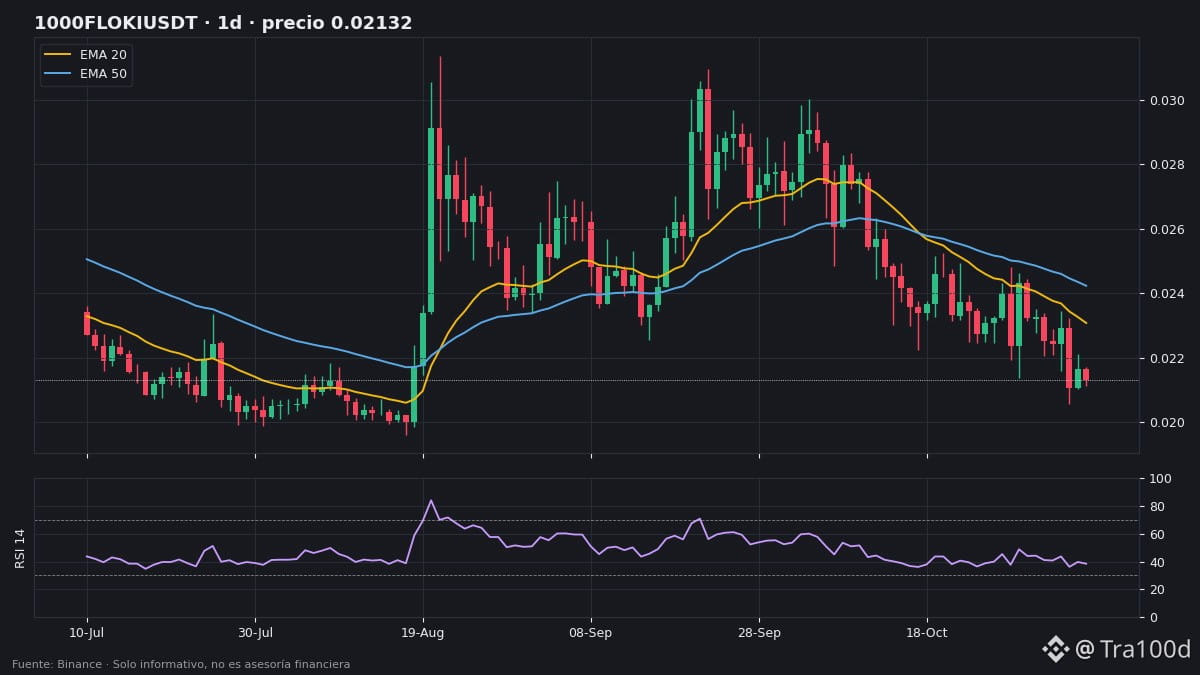
🐕 $FLOKI has the most negative funding rate among the major meme coins today: −0.028%. In other words, there are so many shorts that they’re the ones paying to stay in their positions.
📊 The data (Binance):
• Spot price: $0.00002124 (−0.84% in 24h)
• −8.3% over the last 6 daily candles; strong bearish daily trend, RSI 38
• Futures open interest: +1.1% in 24h → more positions are entering, not exiting
💸 Funding comparison: PEPE, $DOGE and SHIB +0.010%, WIF +0.004%, BONK +0.003%… and FLOKI −0.028%. A $1,000 short pays about $0.28 per funding payment.
📏 Levels (price per token): support at the 20-day low, $0.00002057; resistance at the daily 20 EMA, $0.00002308.
⚡ Risk: daily ATR of 7.0%. With many shorts stacked up, a bounce could accelerate due to forced closures, but the price could also keep falling: funding is not a signal.
Short squeeze, or are the bears still in control? Reply “SHORT SQUEEZE” or “BEARS” 👇
#FLOKI #Memecoin #FundingRate #Cripto #Tra100d
⚠️ For informational and educational purposes only; this is not financial advice. Cryptocurrencies are volatile: do your own research and trade with caution.
🐕 $FLOKI has the most negative funding rate among the major meme coins today: −0.028%. In other words, there are so many shorts that they’re the ones paying to stay in their positions.
📊 The data (Binance):
• Spot price: $0.00002124 (−0.84% in 24h)
• −8.3% over the last 6 daily candles; strong bearish daily trend, RSI 38
• Futures open interest: +1.1% in 24h → more positions are entering, not exiting
💸 Funding comparison: PEPE, $DOGE and SHIB +0.010%, WIF +0.004%, BONK +0.003%… and FLOKI −0.028%. A $1,000 short pays about $0.28 per funding payment.
📏 Levels (price per token): support at the 20-day low, $0.00002057; resistance at the daily 20 EMA, $0.00002308.
⚡ Risk: daily ATR of 7.0%. With many shorts stacked up, a bounce could accelerate due to forced closures, but the price could also keep falling: funding is not a signal.
Short squeeze, or are the bears still in control? Reply “SHORT SQUEEZE” or “BEARS” 👇
#FLOKI #Memecoin #FundingRate #Cripto #Tra100d
⚠️ For informational and educational purposes only; this is not financial advice. Cryptocurrencies are volatile: do your own research and trade with caution.
📊 The data (Binance):
• Spot price: $0.00002124 (−0.84% in 24h)
• −8.3% over the last 6 daily candles; strong bearish daily trend, RSI 38
• Futures open interest: +1.1% in 24h → more positions are entering, not exiting
💸 Funding comparison: PEPE, $DOGE and SHIB +0.010%, WIF +0.004%, BONK +0.003%… and FLOKI −0.028%. A $1,000 short pays about $0.28 per funding payment.
📏 Levels (price per token): support at the 20-day low, $0.00002057; resistance at the daily 20 EMA, $0.00002308.
⚡ Risk: daily ATR of 7.0%. With many shorts stacked up, a bounce could accelerate due to forced closures, but the price could also keep falling: funding is not a signal.
Short squeeze, or are the bears still in control? Reply “SHORT SQUEEZE” or “BEARS” 👇
#FLOKI #Memecoin #FundingRate #Cripto #Tra100d
⚠️ For informational and educational purposes only; this is not financial advice. Cryptocurrencies are volatile: do your own research and trade with caution.
139
·
--
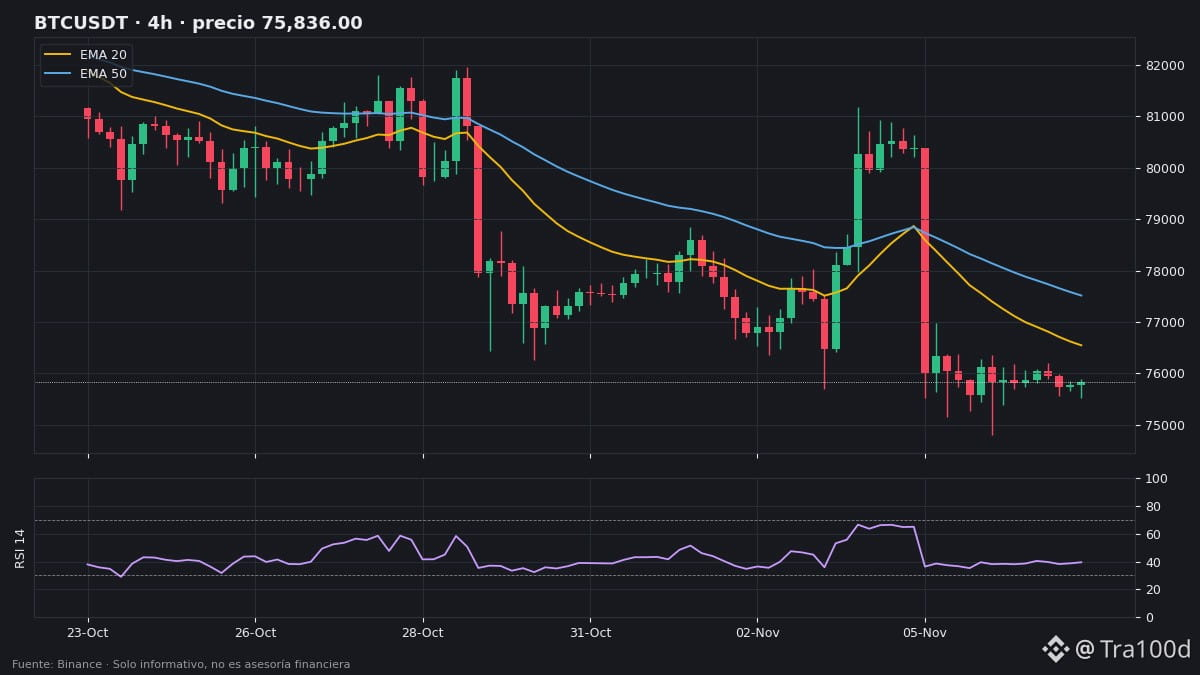
📉 $BTC closes Saturday nearly flat (−0.2%, $75,756) and with almost no volume: the last 4-hour candle moved just 20% of its average.
📊 4-hour context:
• Strong downtrend: price ($75,836 in futures) below the EMA 20 ($76,547), EMA 50 ($77,515), and EMA 200 ($80,254)
• RSI 39.5: weak, not oversold
• ATR $802 (1.1%): expected range per candle
📏 Levels:
• Double support: $74,811 (20-candle low) + $75,046 (daily EMA 200). A zone, not a line.
• Resistance: $76,547 (EMA 20) and $77,515 (EMA 50); the 20-candle high is at $80,928.
🟢 Bullish scenario: reclaiming the 4-hour EMA 20 opens the door to $77,500.
🔴 Bearish scenario: losing $74,800 leaves BTC below its daily EMA 200, a level the entire market is watching.
👀 What to watch: funding is nearly neutral (+0.0054%) and open interest is down 0.4%. With volume this low, any weekend breakout needs confirmation.
Will it hold $74,800 or lose it? 👇
#BTC #AnalisisTecnico #Bitcoin #Cripto #Tra100d
⚠️ For informational and educational purposes only; this is not financial advice. Cryptocurrencies are volatile: do your own research and trade with caution.
📉 $BTC closes Saturday nearly flat (−0.2%, $75,756) and with almost no volume: the last 4-hour candle moved just 20% of its average.
📊 4-hour context:
• Strong downtrend: price ($75,836 in futures) below the EMA 20 ($76,547), EMA 50 ($77,515), and EMA 200 ($80,254)
• RSI 39.5: weak, not oversold
• ATR $802 (1.1%): expected range per candle
📏 Levels:
• Double support: $74,811 (20-candle low) + $75,046 (daily EMA 200). A zone, not a line.
• Resistance: $76,547 (EMA 20) and $77,515 (EMA 50); the 20-candle high is at $80,928.
🟢 Bullish scenario: reclaiming the 4-hour EMA 20 opens the door to $77,500.
🔴 Bearish scenario: losing $74,800 leaves BTC below its daily EMA 200, a level the entire market is watching.
👀 What to watch: funding is nearly neutral (+0.0054%) and open interest is down 0.4%. With volume this low, any weekend breakout needs confirmation.
Will it hold $74,800 or lose it? 👇
#BTC #AnalisisTecnico #Bitcoin #Cripto #Tra100d
⚠️ For informational and educational purposes only; this is not financial advice. Cryptocurrencies are volatile: do your own research and trade with caution.
📊 4-hour context:
• Strong downtrend: price ($75,836 in futures) below the EMA 20 ($76,547), EMA 50 ($77,515), and EMA 200 ($80,254)
• RSI 39.5: weak, not oversold
• ATR $802 (1.1%): expected range per candle
📏 Levels:
• Double support: $74,811 (20-candle low) + $75,046 (daily EMA 200). A zone, not a line.
• Resistance: $76,547 (EMA 20) and $77,515 (EMA 50); the 20-candle high is at $80,928.
🟢 Bullish scenario: reclaiming the 4-hour EMA 20 opens the door to $77,500.
🔴 Bearish scenario: losing $74,800 leaves BTC below its daily EMA 200, a level the entire market is watching.
👀 What to watch: funding is nearly neutral (+0.0054%) and open interest is down 0.4%. With volume this low, any weekend breakout needs confirmation.
Will it hold $74,800 or lose it? 👇
#BTC #AnalisisTecnico #Bitcoin #Cripto #Tra100d
⚠️ For informational and educational purposes only; this is not financial advice. Cryptocurrencies are volatile: do your own research and trade with caution.
123
·
--
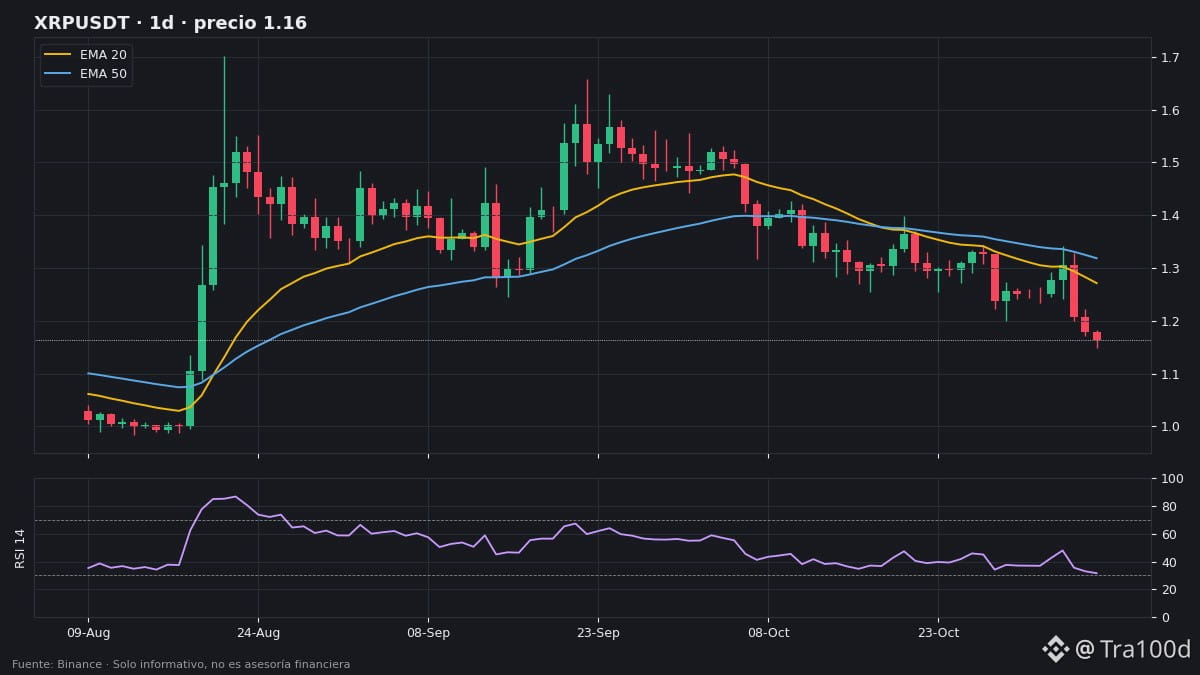
🚨 $XRP remains below its 20-day low: trading at $1.163 (−1.6% in 24h) after touching $1.1477, a new low for the last 20 daily candles.
Daily RSI is 32, near oversold territory, and far from its daily EMA 200 ($1.31). Key level: reclaim $1.17, the floor it lost, or watch whether it holds $1.1477.
#XRP #Alerta #Cripto #Tra100d
⚠️ For informational and educational purposes only; this is not financial advice. Cryptocurrencies are volatile: do your own research and trade with caution.
🚨 $XRP remains below its 20-day low: trading at $1.163 (−1.6% in 24h) after touching $1.1477, a new low for the last 20 daily candles.
Daily RSI is 32, near oversold territory, and far from its daily EMA 200 ($1.31). Key level: reclaim $1.17, the floor it lost, or watch whether it holds $1.1477.
#XRP #Alerta #Cripto #Tra100d
⚠️ For informational and educational purposes only; this is not financial advice. Cryptocurrencies are volatile: do your own research and trade with caution.
Daily RSI is 32, near oversold territory, and far from its daily EMA 200 ($1.31). Key level: reclaim $1.17, the floor it lost, or watch whether it holds $1.1477.
#XRP #Alerta #Cripto #Tra100d
⚠️ For informational and educational purposes only; this is not financial advice. Cryptocurrencies are volatile: do your own research and trade with caution.
1.1k
·
--
🧠 Post #100 🎉 And today, let’s look at something almost nobody checks before opening a futures position: funding.
📘 What it is: with perpetual futures, longs and shorts pay each other a small fee at regular intervals (usually every 8 hours). This helps keep the futures price from drifting away from the spot price.
• Positive funding → longs pay shorts.
• Negative funding → shorts pay longs.
📊 Today's examples (Binance):
• $ONE : −0.0187% → shorts pay (it rose +34%)
• FLOKI: −0.0138% → shorts pay
• $BTC : −0.0006% → practically neutral
• XRP, SHIB, and PEPE: 0.010% → the usual base rate
🧮 Example: a $1,000 short position in ONE at −0.0187% pays $0.19 per settlement. Not much, but with leverage and over several days, it adds up.
❌ Common mistake: thinking “negative funding = it’s going to rise.” It only tells you how traders are positioned. It can trigger a short squeeze, but it isn't a signal.
📝 In one line: funding tells you who's betting more heavily and who pays to stay in their position.
Do you check funding before trading? YES / NO 👇
#Futuros #FundingRate #AprendeCripto #Binance #Tra100d
⚠️ For informational and educational purposes only; this is not financial advice. Cryptocurrencies are volatile: do your research and trade with caution.
🧠 Post #100 🎉 And today, let’s look at something almost nobody checks before opening a futures position: funding.
📘 What it is: with perpetual futures, longs and shorts pay each other a small fee at regular intervals (usually every 8 hours). This helps keep the futures price from drifting away from the spot price.
• Positive funding → longs pay shorts.
• Negative funding → shorts pay longs.
📊 Today's examples (Binance):
• $ONE : −0.0187% → shorts pay (it rose +34%)
• FLOKI: −0.0138% → shorts pay
• $BTC : −0.0006% → practically neutral
• XRP, SHIB, and PEPE: 0.010% → the usual base rate
🧮 Example: a $1,000 short position in ONE at −0.0187% pays $0.19 per settlement. Not much, but with leverage and over several days, it adds up.
❌ Common mistake: thinking “negative funding = it’s going to rise.” It only tells you how traders are positioned. It can trigger a short squeeze, but it isn't a signal.
📝 In one line: funding tells you who's betting more heavily and who pays to stay in their position.
Do you check funding before trading? YES / NO 👇
#Futuros #FundingRate #AprendeCripto #Binance #Tra100d
⚠️ For informational and educational purposes only; this is not financial advice. Cryptocurrencies are volatile: do your research and trade with caution.
📘 What it is: with perpetual futures, longs and shorts pay each other a small fee at regular intervals (usually every 8 hours). This helps keep the futures price from drifting away from the spot price.
• Positive funding → longs pay shorts.
• Negative funding → shorts pay longs.
📊 Today's examples (Binance):
• $ONE : −0.0187% → shorts pay (it rose +34%)
• FLOKI: −0.0138% → shorts pay
• $BTC : −0.0006% → practically neutral
• XRP, SHIB, and PEPE: 0.010% → the usual base rate
🧮 Example: a $1,000 short position in ONE at −0.0187% pays $0.19 per settlement. Not much, but with leverage and over several days, it adds up.
❌ Common mistake: thinking “negative funding = it’s going to rise.” It only tells you how traders are positioned. It can trigger a short squeeze, but it isn't a signal.
📝 In one line: funding tells you who's betting more heavily and who pays to stay in their position.
Do you check funding before trading? YES / NO 👇
#Futuros #FundingRate #AprendeCripto #Binance #Tra100d
⚠️ For informational and educational purposes only; this is not financial advice. Cryptocurrencies are volatile: do your research and trade with caution.
1
203
·
--
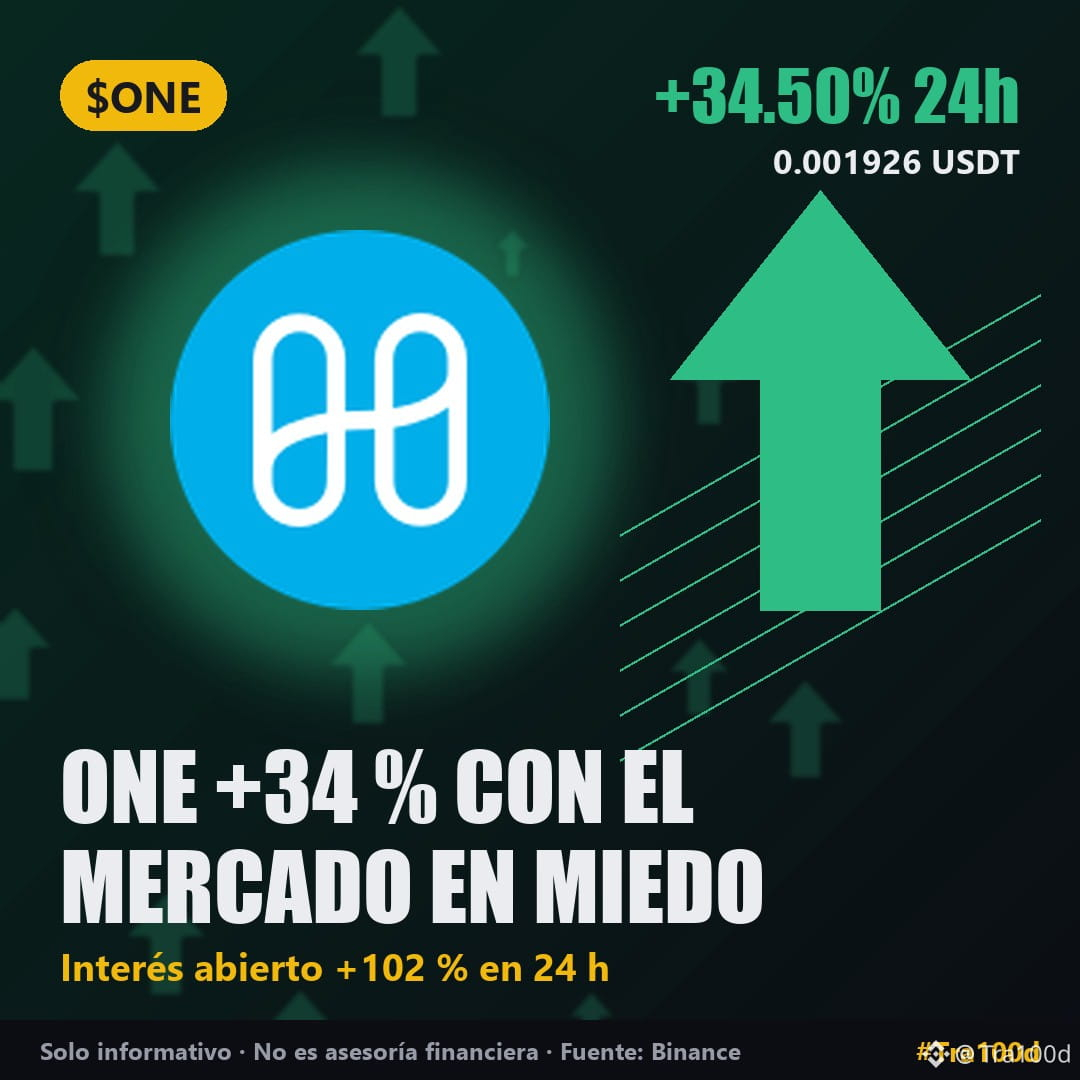
🚀 The Fear and Greed Index drops to 25 (extreme fear)… while Harmony ($ONE ) rises +34.5% in 24 hours.
📌 3 things to know today:
• ONE is trading at $0.001926, with $32.5M traded; its daily volume is 26.7 times its average.
• Open interest in futures doubled: +102% in 24 hours.
• Funding is negative (−0.0187%): lots of short sellers are betting on a drop, and they’re the ones paying.
🔍 Why it matters: The 4-hour RSI is at 84 (strongly overbought) and the daily ATR is 11.3%. With so many shorts, a rally could accelerate as positions are forcibly closed, but a move like this could also reverse just as quickly. I couldn’t find any confirmed news explaining it: these are just the numbers.
Meanwhile, the rest of the market is quiet: $BTC −0.2% ($76,009), ETH +0.03%, and XRP is leading the declines (−2.6%).
A temporary pump, or is there something behind it? 👇
#ONE #Altcoins #MiedoYCodicia #Cripto #Tra100d
⚠️ For informational and educational purposes only; this is not financial advice. Cryptocurrencies are volatile: do your own research and trade with caution.
🚀 The Fear and Greed Index drops to 25 (extreme fear)… while Harmony ($ONE ) rises +34.5% in 24 hours.
📌 3 things to know today:
• ONE is trading at $0.001926, with $32.5M traded; its daily volume is 26.7 times its average.
• Open interest in futures doubled: +102% in 24 hours.
• Funding is negative (−0.0187%): lots of short sellers are betting on a drop, and they’re the ones paying.
🔍 Why it matters: The 4-hour RSI is at 84 (strongly overbought) and the daily ATR is 11.3%. With so many shorts, a rally could accelerate as positions are forcibly closed, but a move like this could also reverse just as quickly. I couldn’t find any confirmed news explaining it: these are just the numbers.
Meanwhile, the rest of the market is quiet: $BTC −0.2% ($76,009), ETH +0.03%, and XRP is leading the declines (−2.6%).
A temporary pump, or is there something behind it? 👇
#ONE #Altcoins #MiedoYCodicia #Cripto #Tra100d
⚠️ For informational and educational purposes only; this is not financial advice. Cryptocurrencies are volatile: do your own research and trade with caution.
📌 3 things to know today:
• ONE is trading at $0.001926, with $32.5M traded; its daily volume is 26.7 times its average.
• Open interest in futures doubled: +102% in 24 hours.
• Funding is negative (−0.0187%): lots of short sellers are betting on a drop, and they’re the ones paying.
🔍 Why it matters: The 4-hour RSI is at 84 (strongly overbought) and the daily ATR is 11.3%. With so many shorts, a rally could accelerate as positions are forcibly closed, but a move like this could also reverse just as quickly. I couldn’t find any confirmed news explaining it: these are just the numbers.
Meanwhile, the rest of the market is quiet: $BTC −0.2% ($76,009), ETH +0.03%, and XRP is leading the declines (−2.6%).
A temporary pump, or is there something behind it? 👇
#ONE #Altcoins #MiedoYCodicia #Cripto #Tra100d
⚠️ For informational and educational purposes only; this is not financial advice. Cryptocurrencies are volatile: do your own research and trade with caution.
147
·
--
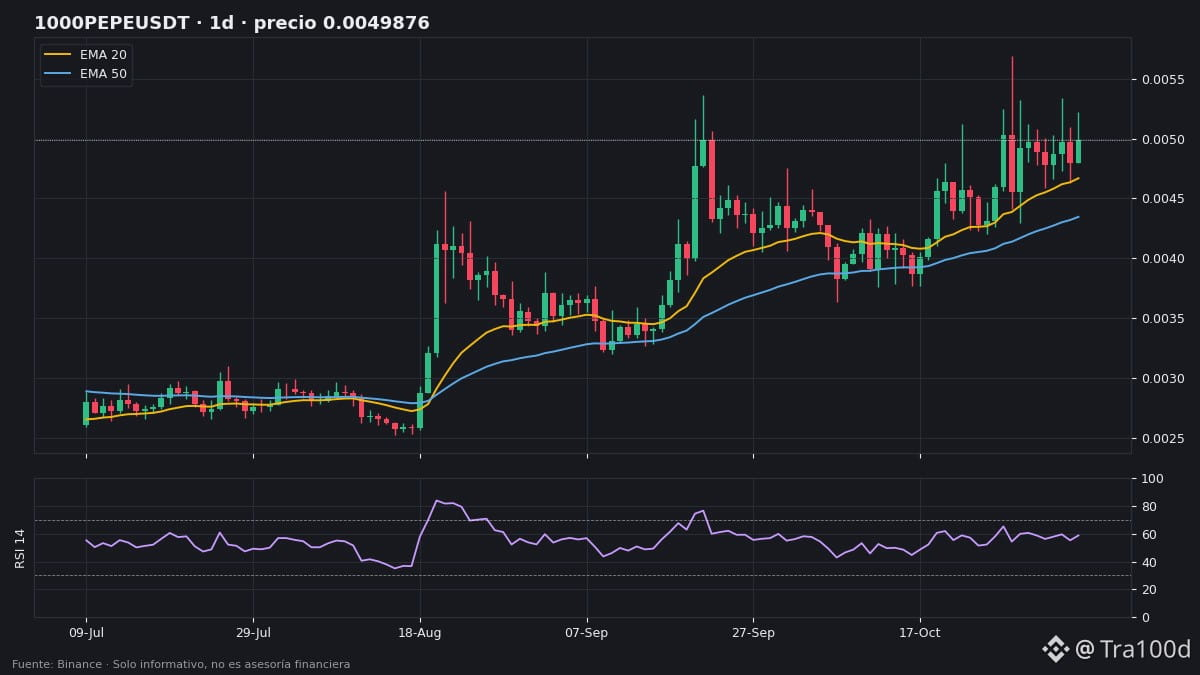
🐸 Today all the meme coins are in the red, and $PEPE is falling the most… but on the daily chart, it’s the only one still in an uptrend.
📊 The data (Binance):
• Spot price: $0.0000049 (−4.48% in 24 h) with $40.4 M in volume
• The rest: $DOGE −1.2%, FLOKI −2.2%, SHIB −2.4%, BONK −4.1%, WIF −4.1%
• Daily: above its 20, 50, and 200 EMAs, RSI 59. DOGE, SHIB, FLOKI, and BONK are in strong downtrends
• 4 h: RSI 48, just below its 20 EMA and supported by the 50 EMA
💸 Funding fell from 0.029% yesterday to 0.010% today: longs aren’t paying as much anymore. Excess leverage has cooled off.
📏 Levels (price per token): nearby support at the 4 h 50 EMA, $0.00000489; resistance at the 4 h 20 EMA, $0.00000495, followed by the 20-day high of $0.00000569.
⚡ Risk: its daily ATR is 9.1%. Almost triple that of $BTC (3.2%).
Healthy correction or has PEPE run out of steam? Reply “HEALTHY” or “IT’S OVER” 👇
#PEPE #Memecoin #Cripto #Binance #Tra100d
⚠️ For informational and educational purposes only; this is not financial advice. Cryptocurrencies are volatile: do your own research and trade with caution.
🐸 Today all the meme coins are in the red, and $PEPE is falling the most… but on the daily chart, it’s the only one still in an uptrend.
📊 The data (Binance):
• Spot price: $0.0000049 (−4.48% in 24 h) with $40.4 M in volume
• The rest: $DOGE −1.2%, FLOKI −2.2%, SHIB −2.4%, BONK −4.1%, WIF −4.1%
• Daily: above its 20, 50, and 200 EMAs, RSI 59. DOGE, SHIB, FLOKI, and BONK are in strong downtrends
• 4 h: RSI 48, just below its 20 EMA and supported by the 50 EMA
💸 Funding fell from 0.029% yesterday to 0.010% today: longs aren’t paying as much anymore. Excess leverage has cooled off.
📏 Levels (price per token): nearby support at the 4 h 50 EMA, $0.00000489; resistance at the 4 h 20 EMA, $0.00000495, followed by the 20-day high of $0.00000569.
⚡ Risk: its daily ATR is 9.1%. Almost triple that of $BTC (3.2%).
Healthy correction or has PEPE run out of steam? Reply “HEALTHY” or “IT’S OVER” 👇
#PEPE #Memecoin #Cripto #Binance #Tra100d
⚠️ For informational and educational purposes only; this is not financial advice. Cryptocurrencies are volatile: do your own research and trade with caution.
📊 The data (Binance):
• Spot price: $0.0000049 (−4.48% in 24 h) with $40.4 M in volume
• The rest: $DOGE −1.2%, FLOKI −2.2%, SHIB −2.4%, BONK −4.1%, WIF −4.1%
• Daily: above its 20, 50, and 200 EMAs, RSI 59. DOGE, SHIB, FLOKI, and BONK are in strong downtrends
• 4 h: RSI 48, just below its 20 EMA and supported by the 50 EMA
💸 Funding fell from 0.029% yesterday to 0.010% today: longs aren’t paying as much anymore. Excess leverage has cooled off.
📏 Levels (price per token): nearby support at the 4 h 50 EMA, $0.00000489; resistance at the 4 h 20 EMA, $0.00000495, followed by the 20-day high of $0.00000569.
⚡ Risk: its daily ATR is 9.1%. Almost triple that of $BTC (3.2%).
Healthy correction or has PEPE run out of steam? Reply “HEALTHY” or “IT’S OVER” 👇
#PEPE #Memecoin #Cripto #Binance #Tra100d
⚠️ For informational and educational purposes only; this is not financial advice. Cryptocurrencies are volatile: do your own research and trade with caution.
93
·
--
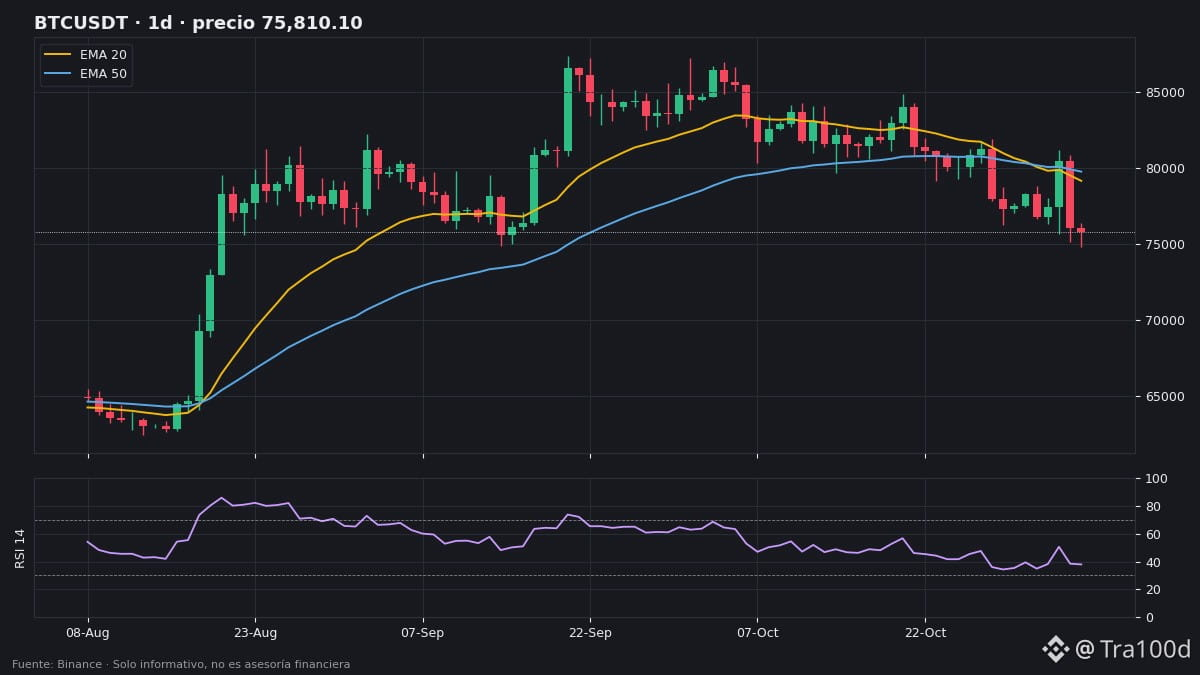
📉 $BTC remains below the daily 20 and 50 EMAs. The next major line is just 1.5% away: the daily 200 EMA.
🧭 Context: after dropping 5.5% on Nov 5, BTC closed nearly flat on Nov 6 at $75,810 (−0.3%); it is now hovering around $76,000. Fear and Greed is at 25 (extreme fear). The 4-hour trend is strongly bearish; on the daily chart, it remains above its 200 EMA, so the broader trend has not yet broken.
📊 Levels (daily, Binance):
• Resistance 1: 20 EMA at $79,185 and 50 EMA at $79,790
• Resistance 2: 20-candle high at $84,875
• Support 1: 20-candle low at $74,810
• Support 2: 200 EMA at $74,675
• Daily RSI: 38 · Daily ATR: $2,409 (3.2%)
🟢 Bullish scenario: the $74,675–$74,810 zone holds and BTC recovers the $79,200–$79,800 range around the 20/50 EMAs on a daily close.
🔴 Bearish scenario: a daily close below $74,675 would also mean BTC loses its broader trend.
👀 What to watch: daily volume returned to average (1.1x), and selling has slowed; open interest rose 2.3% and funding is 0.006% (neutral): new positions are opening without a clear bias.
Will BTC defend the daily 200 EMA? 👇
#BTC #Bitcoin #AnalisisTecnico #Cripto #Tra100d
⚠️ For informational and educational purposes only; this is not financial advice. Cryptocurrencies are volatile: do your own research and trade with caution.
📉 $BTC remains below the daily 20 and 50 EMAs. The next major line is just 1.5% away: the daily 200 EMA.
🧭 Context: after dropping 5.5% on Nov 5, BTC closed nearly flat on Nov 6 at $75,810 (−0.3%); it is now hovering around $76,000. Fear and Greed is at 25 (extreme fear). The 4-hour trend is strongly bearish; on the daily chart, it remains above its 200 EMA, so the broader trend has not yet broken.
📊 Levels (daily, Binance):
• Resistance 1: 20 EMA at $79,185 and 50 EMA at $79,790
• Resistance 2: 20-candle high at $84,875
• Support 1: 20-candle low at $74,810
• Support 2: 200 EMA at $74,675
• Daily RSI: 38 · Daily ATR: $2,409 (3.2%)
🟢 Bullish scenario: the $74,675–$74,810 zone holds and BTC recovers the $79,200–$79,800 range around the 20/50 EMAs on a daily close.
🔴 Bearish scenario: a daily close below $74,675 would also mean BTC loses its broader trend.
👀 What to watch: daily volume returned to average (1.1x), and selling has slowed; open interest rose 2.3% and funding is 0.006% (neutral): new positions are opening without a clear bias.
Will BTC defend the daily 200 EMA? 👇
#BTC #Bitcoin #AnalisisTecnico #Cripto #Tra100d
⚠️ For informational and educational purposes only; this is not financial advice. Cryptocurrencies are volatile: do your own research and trade with caution.
🧭 Context: after dropping 5.5% on Nov 5, BTC closed nearly flat on Nov 6 at $75,810 (−0.3%); it is now hovering around $76,000. Fear and Greed is at 25 (extreme fear). The 4-hour trend is strongly bearish; on the daily chart, it remains above its 200 EMA, so the broader trend has not yet broken.
📊 Levels (daily, Binance):
• Resistance 1: 20 EMA at $79,185 and 50 EMA at $79,790
• Resistance 2: 20-candle high at $84,875
• Support 1: 20-candle low at $74,810
• Support 2: 200 EMA at $74,675
• Daily RSI: 38 · Daily ATR: $2,409 (3.2%)
🟢 Bullish scenario: the $74,675–$74,810 zone holds and BTC recovers the $79,200–$79,800 range around the 20/50 EMAs on a daily close.
🔴 Bearish scenario: a daily close below $74,675 would also mean BTC loses its broader trend.
👀 What to watch: daily volume returned to average (1.1x), and selling has slowed; open interest rose 2.3% and funding is 0.006% (neutral): new positions are opening without a clear bias.
Will BTC defend the daily 200 EMA? 👇
#BTC #Bitcoin #AnalisisTecnico #Cripto #Tra100d
⚠️ For informational and educational purposes only; this is not financial advice. Cryptocurrencies are volatile: do your own research and trade with caution.
90
·
--
⚠️ $ETH is still clinging to its daily 200 EMA. After falling 7.7% on Nov 5, it closed flat (+0.02%) on Nov 6 at $2,237.6, with the 200 EMA at $2,233.9: just 0.2% above.
Daily RSI at 39 and volume at average (0.95x): a pause after the drop, not yet oversold.
Key levels: 4-hour support at $2,205 and daily support at $2,173 (20-candle low). To ease the pressure, reclaim $2,280–$2,295 (4-hour 20/50 EMAs).
Open interest +2.8% and funding at 0.009% (neutral): positions are coming in, with no clear bias.
Will the daily 200 EMA hold, or will it break? 👇
#ETH #Ethereum #EMA200 #Cripto #Tra100d
⚠️ For informational and educational purposes only; this is not financial advice. Cryptocurrencies are volatile: do your own research and trade with caution.
⚠️ $ETH is still clinging to its daily 200 EMA. After falling 7.7% on Nov 5, it closed flat (+0.02%) on Nov 6 at $2,237.6, with the 200 EMA at $2,233.9: just 0.2% above.
Daily RSI at 39 and volume at average (0.95x): a pause after the drop, not yet oversold.
Key levels: 4-hour support at $2,205 and daily support at $2,173 (20-candle low). To ease the pressure, reclaim $2,280–$2,295 (4-hour 20/50 EMAs).
Open interest +2.8% and funding at 0.009% (neutral): positions are coming in, with no clear bias.
Will the daily 200 EMA hold, or will it break? 👇
#ETH #Ethereum #EMA200 #Cripto #Tra100d
⚠️ For informational and educational purposes only; this is not financial advice. Cryptocurrencies are volatile: do your own research and trade with caution.
Daily RSI at 39 and volume at average (0.95x): a pause after the drop, not yet oversold.
Key levels: 4-hour support at $2,205 and daily support at $2,173 (20-candle low). To ease the pressure, reclaim $2,280–$2,295 (4-hour 20/50 EMAs).
Open interest +2.8% and funding at 0.009% (neutral): positions are coming in, with no clear bias.
Will the daily 200 EMA hold, or will it break? 👇
#ETH #Ethereum #EMA200 #Cripto #Tra100d
⚠️ For informational and educational purposes only; this is not financial advice. Cryptocurrencies are volatile: do your own research and trade with caution.
140
·
--
🧠 $BTC touched $75,158 today and bounced. Is that number “the support”? It’s better to think of it as a zone.
📘 What they are:
• Support: a zone where buyers have appeared before and the price stopped falling.
• Resistance: a zone where sellers have appeared and the price stopped rising.
• A simple way to find them: the low and high of the last 20 candles.
📊 Example using today’s data (Binance):
• BTC 4 h: 20-candle low at $75,158, price at $75,573. Its 4 h ATR is $1,136: real support is a band, not a single number.
• 4 h resistance: the 20 and 50 EMAs, between $77,716 and $78,322.
• $XRP daily: its 20-candle low was $1.1991 and today it’s trading at $1.19. When support breaks, it often starts acting as resistance.
❌ Common mistake: placing the stop exactly at support. Everyone puts it there, and a wick of one ATR can sweep it before the price reverses.
✅ In one line: support and resistance are zones sized to volatility; confirm with candle closes, not wicks.
Do you draw support levels using lows, EMAs, or round numbers? 👇
#AnalisisTecnico #Soporte #BTC #Cripto #Tra100d
⚠️ For informational and educational purposes only; this is not financial advice. Cryptocurrencies are volatile: do your research and trade with caution.
🧠 $BTC touched $75,158 today and bounced. Is that number “the support”? It’s better to think of it as a zone.
📘 What they are:
• Support: a zone where buyers have appeared before and the price stopped falling.
• Resistance: a zone where sellers have appeared and the price stopped rising.
• A simple way to find them: the low and high of the last 20 candles.
📊 Example using today’s data (Binance):
• BTC 4 h: 20-candle low at $75,158, price at $75,573. Its 4 h ATR is $1,136: real support is a band, not a single number.
• 4 h resistance: the 20 and 50 EMAs, between $77,716 and $78,322.
• $XRP daily: its 20-candle low was $1.1991 and today it’s trading at $1.19. When support breaks, it often starts acting as resistance.
❌ Common mistake: placing the stop exactly at support. Everyone puts it there, and a wick of one ATR can sweep it before the price reverses.
✅ In one line: support and resistance are zones sized to volatility; confirm with candle closes, not wicks.
Do you draw support levels using lows, EMAs, or round numbers? 👇
#AnalisisTecnico #Soporte #BTC #Cripto #Tra100d
⚠️ For informational and educational purposes only; this is not financial advice. Cryptocurrencies are volatile: do your research and trade with caution.
📘 What they are:
• Support: a zone where buyers have appeared before and the price stopped falling.
• Resistance: a zone where sellers have appeared and the price stopped rising.
• A simple way to find them: the low and high of the last 20 candles.
📊 Example using today’s data (Binance):
• BTC 4 h: 20-candle low at $75,158, price at $75,573. Its 4 h ATR is $1,136: real support is a band, not a single number.
• 4 h resistance: the 20 and 50 EMAs, between $77,716 and $78,322.
• $XRP daily: its 20-candle low was $1.1991 and today it’s trading at $1.19. When support breaks, it often starts acting as resistance.
❌ Common mistake: placing the stop exactly at support. Everyone puts it there, and a wick of one ATR can sweep it before the price reverses.
✅ In one line: support and resistance are zones sized to volatility; confirm with candle closes, not wicks.
Do you draw support levels using lows, EMAs, or round numbers? 👇
#AnalisisTecnico #Soporte #BTC #Cripto #Tra100d
⚠️ For informational and educational purposes only; this is not financial advice. Cryptocurrencies are volatile: do your research and trade with caution.
113
·
--
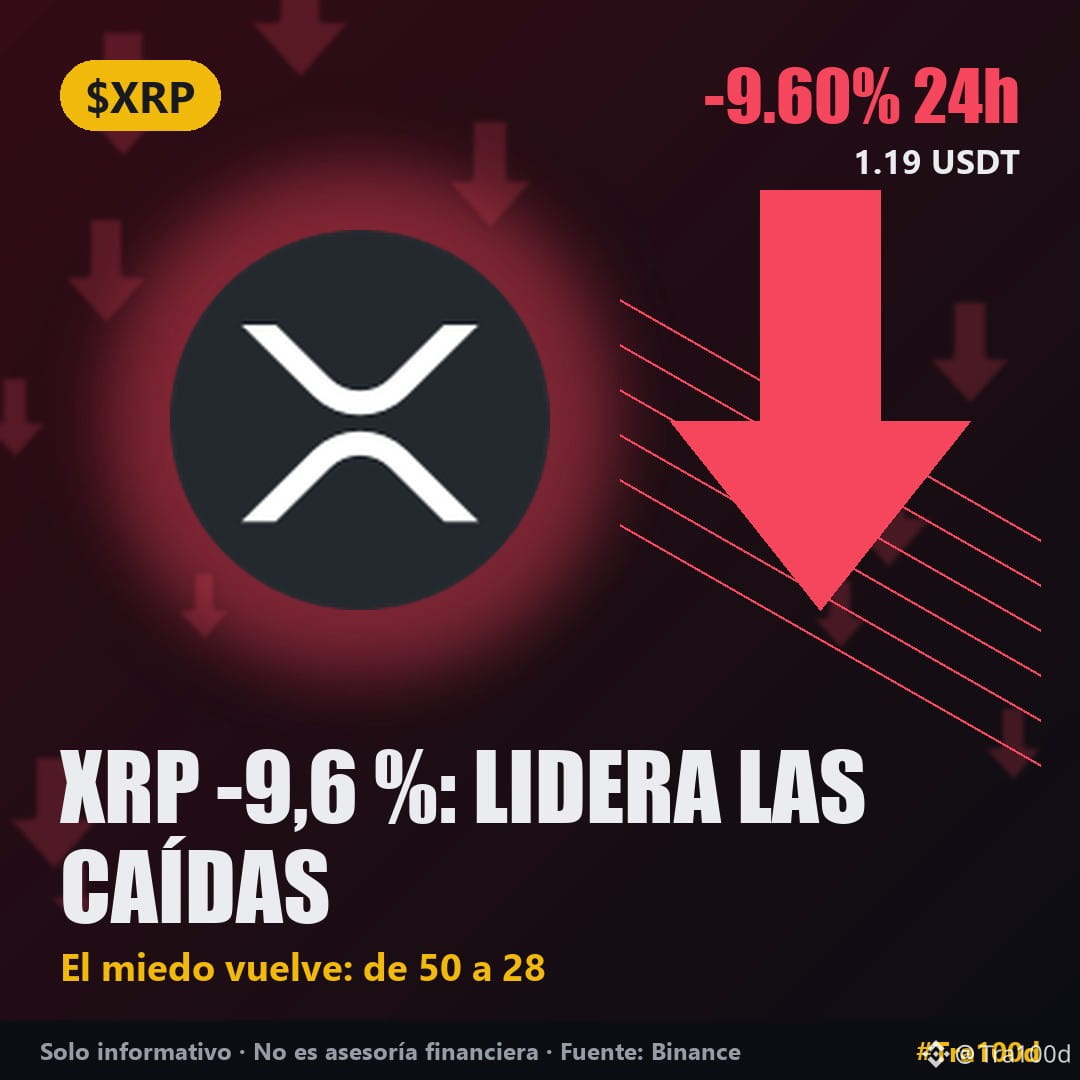
📉 Yesterday, the market was "neutral" (50). Today, the Fear and Greed Index drops to 28: fear is back.
📌 3 stats for today:
• $XRP is the biggest loser among the highest-volume coins: down 9.6% to $1.19, with $160.6M traded.
• $ETH is down 7.3% to $2,241 and $BTC is down 5.2% to $76,104 ($2.069B in volume).
• Almost nothing is spared: only ARB is up (+3.6%); SOL is down 6.4%, ENA 7.7%, and NEAR 6.7%.
🔍 Why it matters: XRP's 4-hour RSI hit 28 (oversold), and its open interest fell 1.5%: positions are being closed, not new shorts opened. On the daily chart, it's already below its 200 EMA ($1.31).
A relief bounce over the weekend, or will fear continue? 👇
#XRP #MiedoYCodicia #BTC #Cripto #Tra100d
⚠️ For informational and educational purposes only; this is not financial advice. Cryptocurrencies are volatile: do your own research and trade with caution.
📉 Yesterday, the market was "neutral" (50). Today, the Fear and Greed Index drops to 28: fear is back.
📌 3 stats for today:
• $XRP is the biggest loser among the highest-volume coins: down 9.6% to $1.19, with $160.6M traded.
• $ETH is down 7.3% to $2,241 and $BTC is down 5.2% to $76,104 ($2.069B in volume).
• Almost nothing is spared: only ARB is up (+3.6%); SOL is down 6.4%, ENA 7.7%, and NEAR 6.7%.
🔍 Why it matters: XRP's 4-hour RSI hit 28 (oversold), and its open interest fell 1.5%: positions are being closed, not new shorts opened. On the daily chart, it's already below its 200 EMA ($1.31).
A relief bounce over the weekend, or will fear continue? 👇
#XRP #MiedoYCodicia #BTC #Cripto #Tra100d
⚠️ For informational and educational purposes only; this is not financial advice. Cryptocurrencies are volatile: do your own research and trade with caution.
📌 3 stats for today:
• $XRP is the biggest loser among the highest-volume coins: down 9.6% to $1.19, with $160.6M traded.
• $ETH is down 7.3% to $2,241 and $BTC is down 5.2% to $76,104 ($2.069B in volume).
• Almost nothing is spared: only ARB is up (+3.6%); SOL is down 6.4%, ENA 7.7%, and NEAR 6.7%.
🔍 Why it matters: XRP's 4-hour RSI hit 28 (oversold), and its open interest fell 1.5%: positions are being closed, not new shorts opened. On the daily chart, it's already below its 200 EMA ($1.31).
A relief bounce over the weekend, or will fear continue? 👇
#XRP #MiedoYCodicia #BTC #Cripto #Tra100d
⚠️ For informational and educational purposes only; this is not financial advice. Cryptocurrencies are volatile: do your own research and trade with caution.
141
·
--
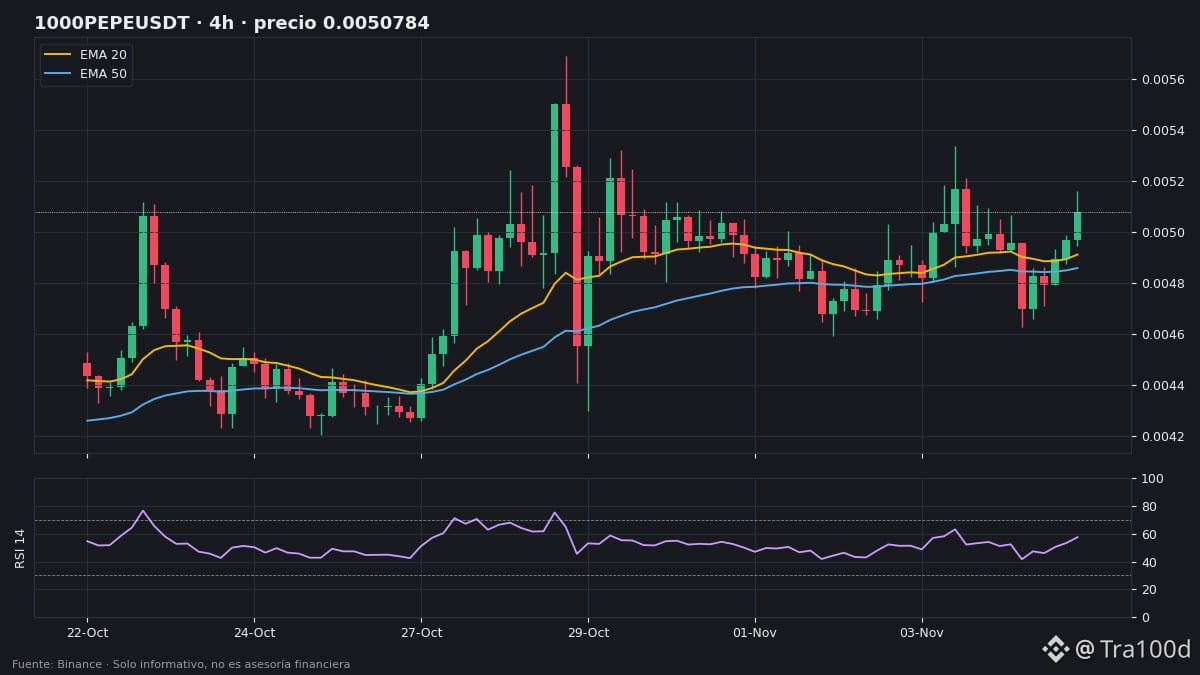
🐸 Market in the red, fear at 28… and $PEPE is the only meme coin on the list rising today on Binance.
📊 The data (Binance):
• Spot price: $0.00000506 (+2.43% in 24 h) with $67.9M in volume
• The rest of the meme coins are falling: $DOGE −5.6%, FLOKI −4.6%, $SHIB −3.2%, BONK −3.0%, WIF −2.8%
• 4 h trend: strongly bullish, above its 20, 50 and 200 EMAs
• 4 h RSI: 53 · Daily RSI: 55 (not overbought)
💸 What stands out: its funding rate is 0.029%, almost 6 times BTC's (0.005%). Longs are paying dearly to keep their bets open.
📏 4 h levels (price of 1 token): resistance at the 20-candle high, $0.00000534; support at the low, $0.00000463.
⚡ Risk: its daily ATR is 9.5%. With high funding and lots of longs, if the market keeps falling, a long squeeze could happen fast.
Can PEPE hold up on its own against the market? Reply "HOLDS" or "FALLS" 👇
#PEPE #Memecoin #Futuros #Cripto #Tra100d
⚠️ For informational and educational purposes only; this is not financial advice. Cryptocurrencies are volatile: do your own research and trade with caution.
🐸 Market in the red, fear at 28… and $PEPE is the only meme coin on the list rising today on Binance.
📊 The data (Binance):
• Spot price: $0.00000506 (+2.43% in 24 h) with $67.9M in volume
• The rest of the meme coins are falling: $DOGE −5.6%, FLOKI −4.6%, $SHIB −3.2%, BONK −3.0%, WIF −2.8%
• 4 h trend: strongly bullish, above its 20, 50 and 200 EMAs
• 4 h RSI: 53 · Daily RSI: 55 (not overbought)
💸 What stands out: its funding rate is 0.029%, almost 6 times BTC's (0.005%). Longs are paying dearly to keep their bets open.
📏 4 h levels (price of 1 token): resistance at the 20-candle high, $0.00000534; support at the low, $0.00000463.
⚡ Risk: its daily ATR is 9.5%. With high funding and lots of longs, if the market keeps falling, a long squeeze could happen fast.
Can PEPE hold up on its own against the market? Reply "HOLDS" or "FALLS" 👇
#PEPE #Memecoin #Futuros #Cripto #Tra100d
⚠️ For informational and educational purposes only; this is not financial advice. Cryptocurrencies are volatile: do your own research and trade with caution.
📊 The data (Binance):
• Spot price: $0.00000506 (+2.43% in 24 h) with $67.9M in volume
• The rest of the meme coins are falling: $DOGE −5.6%, FLOKI −4.6%, $SHIB −3.2%, BONK −3.0%, WIF −2.8%
• 4 h trend: strongly bullish, above its 20, 50 and 200 EMAs
• 4 h RSI: 53 · Daily RSI: 55 (not overbought)
💸 What stands out: its funding rate is 0.029%, almost 6 times BTC's (0.005%). Longs are paying dearly to keep their bets open.
📏 4 h levels (price of 1 token): resistance at the 20-candle high, $0.00000534; support at the low, $0.00000463.
⚡ Risk: its daily ATR is 9.5%. With high funding and lots of longs, if the market keeps falling, a long squeeze could happen fast.
Can PEPE hold up on its own against the market? Reply "HOLDS" or "FALLS" 👇
#PEPE #Memecoin #Futuros #Cripto #Tra100d
⚠️ For informational and educational purposes only; this is not financial advice. Cryptocurrencies are volatile: do your own research and trade with caution.
130
·
--
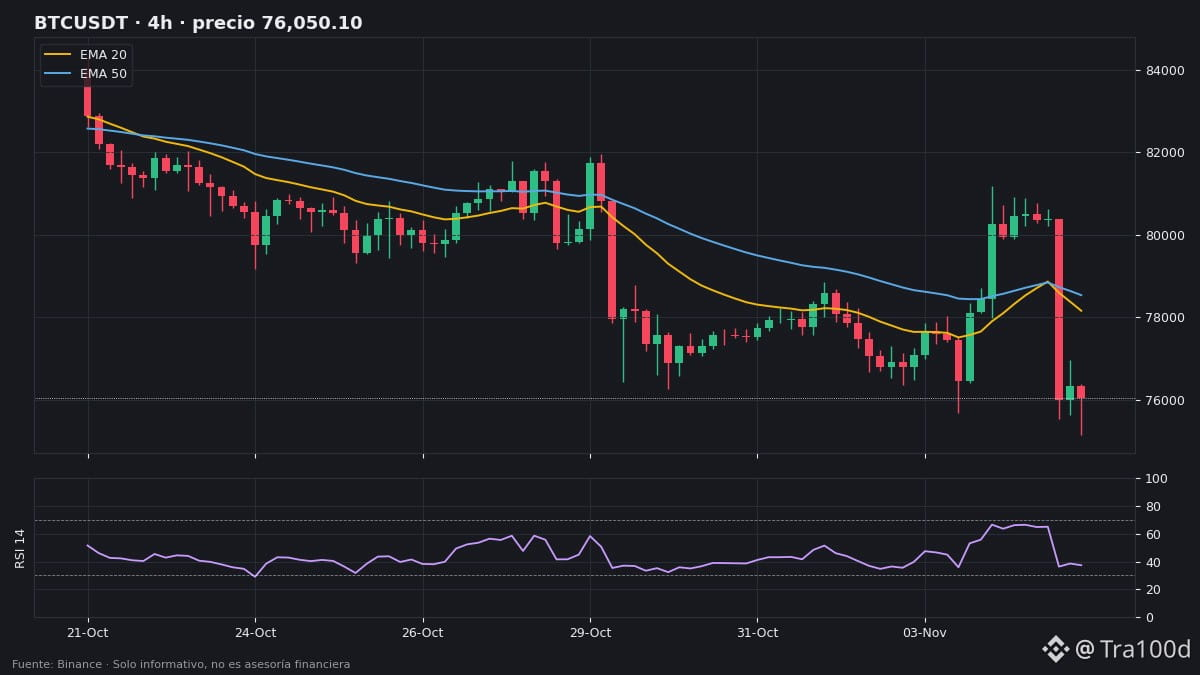
📉 A few hours ago, #BTC was at $80,362, facing its 4-hour EMA 200. The bearish scenario played out: the EMA 200 rejected it, and it also lost the EMA 20 and EMA 50.
🧭 Context: price at $76,180, down 5.4% over the last 6 4-hour candles. The Fear and Greed Index fell from 50 to 28 (fear).
📊 Levels (4 h, Binance):
• Resistance 1: EMA 20 at 77,994 $ and EMA 50 at $78,476
• Resistance 2: EMA 200 at $80,320
• Support 1: 20-candle low at $75,208
• 4-hour RSI: 38 (weak, not oversold) · 4-hour ATR: 1,389 $ (1.8%)
🟢 Bullish scenario: it holds 75,208 $ and recovers the 78,000–78,500 $ EMA 20/50 zone with a 4-hour close.
🔴 Bearish scenario: a 4-hour close below 75,208 $ would leave the price below the recent low.
👀 What to watch: this time the drop came with volume (1.2 times the average), unlike the previous rise, which came on low volume. Funding: 0.008% (neutral).
Will BTC hold 75,000 $ this week? 👇
#BTC #Bitcoin #AnalisisTecnico #Cripto #Tra100d
⚠️ For informational and educational purposes only; not financial advice. Cryptocurrencies are volatile: do your own research and trade with caution.
📉 A few hours ago, #BTC was at $80,362, facing its 4-hour EMA 200. The bearish scenario played out: the EMA 200 rejected it, and it also lost the EMA 20 and EMA 50.
🧭 Context: price at $76,180, down 5.4% over the last 6 4-hour candles. The Fear and Greed Index fell from 50 to 28 (fear).
📊 Levels (4 h, Binance):
• Resistance 1: EMA 20 at 77,994 $ and EMA 50 at $78,476
• Resistance 2: EMA 200 at $80,320
• Support 1: 20-candle low at $75,208
• 4-hour RSI: 38 (weak, not oversold) · 4-hour ATR: 1,389 $ (1.8%)
🟢 Bullish scenario: it holds 75,208 $ and recovers the 78,000–78,500 $ EMA 20/50 zone with a 4-hour close.
🔴 Bearish scenario: a 4-hour close below 75,208 $ would leave the price below the recent low.
👀 What to watch: this time the drop came with volume (1.2 times the average), unlike the previous rise, which came on low volume. Funding: 0.008% (neutral).
Will BTC hold 75,000 $ this week? 👇
#BTC #Bitcoin #AnalisisTecnico #Cripto #Tra100d
⚠️ For informational and educational purposes only; not financial advice. Cryptocurrencies are volatile: do your own research and trade with caution.
🧭 Context: price at $76,180, down 5.4% over the last 6 4-hour candles. The Fear and Greed Index fell from 50 to 28 (fear).
📊 Levels (4 h, Binance):
• Resistance 1: EMA 20 at 77,994 $ and EMA 50 at $78,476
• Resistance 2: EMA 200 at $80,320
• Support 1: 20-candle low at $75,208
• 4-hour RSI: 38 (weak, not oversold) · 4-hour ATR: 1,389 $ (1.8%)
🟢 Bullish scenario: it holds 75,208 $ and recovers the 78,000–78,500 $ EMA 20/50 zone with a 4-hour close.
🔴 Bearish scenario: a 4-hour close below 75,208 $ would leave the price below the recent low.
👀 What to watch: this time the drop came with volume (1.2 times the average), unlike the previous rise, which came on low volume. Funding: 0.008% (neutral).
Will BTC hold 75,000 $ this week? 👇
#BTC #Bitcoin #AnalisisTecnico #Cripto #Tra100d
⚠️ For informational and educational purposes only; not financial advice. Cryptocurrencies are volatile: do your own research and trade with caution.
87
·
--
⚠️ ETH touched its 4-hour EMA 200 and was rejected: it’s trading at $2,240 today, down 7.6% over 6 candles.
It’s now below its 20, 50, and 200 EMAs, with the 4-hour RSI at 40 and volume at 1.4 times the average.
Key levels: support at the 20-candle low of $2,206; to recover, it must first break above the 20/50 EMAs at $2,310.
Will it defend $2,200? 👇
#ETH #Ethereum #Cripto #Tra100d
⚠️ For informational and educational purposes only; this is not financial advice. Cryptocurrencies are volatile: do your own research and trade with caution.
⚠️ ETH touched its 4-hour EMA 200 and was rejected: it’s trading at $2,240 today, down 7.6% over 6 candles.
It’s now below its 20, 50, and 200 EMAs, with the 4-hour RSI at 40 and volume at 1.4 times the average.
Key levels: support at the 20-candle low of $2,206; to recover, it must first break above the 20/50 EMAs at $2,310.
Will it defend $2,200? 👇
#ETH #Ethereum #Cripto #Tra100d
⚠️ For informational and educational purposes only; this is not financial advice. Cryptocurrencies are volatile: do your own research and trade with caution.
It’s now below its 20, 50, and 200 EMAs, with the 4-hour RSI at 40 and volume at 1.4 times the average.
Key levels: support at the 20-candle low of $2,206; to recover, it must first break above the 20/50 EMAs at $2,310.
Will it defend $2,200? 👇
#ETH #Ethereum #Cripto #Tra100d
⚠️ For informational and educational purposes only; this is not financial advice. Cryptocurrencies are volatile: do your own research and trade with caution.
1
1
1.2k
·
--
🧠 Today $ETH is exactly at its 4 h EMA 200: price $2,416, EMA 200 at $2,417. Why are so many people watching that line?
📘 What it is: The EMA 200 is the average price of the last 200 candles, giving more weight to recent ones. It summarizes the underlying trend.
• Price above the EMA 200 → underlying uptrend
• Price below → underlying downtrend
• Price right at it → decision zone
📊 Example using today's data:
• ETH 4 h: it has recovered the EMA 20 (2,334) and the EMA 50 (2,315), but is running into the EMA 200 (2,417).
• $BTC 4 h: $80,362 versus its EMA 200 at $80,956, less than 1% away.
• On the daily chart, however, both are above their EMA 200 (ETH 2,230 / BTC 74,436): the long-term trend remains healthy.
❌ Common mistake: thinking that touching the EMA 200 is an automatic buy or sell signal. It works as a zone, not an exact line, and carries more weight if the crossover comes with volume (today ETH's relative volume on the 4 h chart is only 0.54).
✅ In one line: the EMA 200 separates an underlying uptrend from a downtrend; the crossover matters when it holds and is accompanied by volume.
Do you use the EMA 200 on the 4 h or daily chart? 👇
#EMA #AnalisisTecnico #ETH #Cripto #Tra100d
⚠️ For informational and educational purposes only; this is not financial advice. Cryptocurrencies are volatile: do your own research and trade with caution.
🧠 Today $ETH is exactly at its 4 h EMA 200: price $2,416, EMA 200 at $2,417. Why are so many people watching that line?
📘 What it is: The EMA 200 is the average price of the last 200 candles, giving more weight to recent ones. It summarizes the underlying trend.
• Price above the EMA 200 → underlying uptrend
• Price below → underlying downtrend
• Price right at it → decision zone
📊 Example using today's data:
• ETH 4 h: it has recovered the EMA 20 (2,334) and the EMA 50 (2,315), but is running into the EMA 200 (2,417).
• $BTC 4 h: $80,362 versus its EMA 200 at $80,956, less than 1% away.
• On the daily chart, however, both are above their EMA 200 (ETH 2,230 / BTC 74,436): the long-term trend remains healthy.
❌ Common mistake: thinking that touching the EMA 200 is an automatic buy or sell signal. It works as a zone, not an exact line, and carries more weight if the crossover comes with volume (today ETH's relative volume on the 4 h chart is only 0.54).
✅ In one line: the EMA 200 separates an underlying uptrend from a downtrend; the crossover matters when it holds and is accompanied by volume.
Do you use the EMA 200 on the 4 h or daily chart? 👇
#EMA #AnalisisTecnico #ETH #Cripto #Tra100d
⚠️ For informational and educational purposes only; this is not financial advice. Cryptocurrencies are volatile: do your own research and trade with caution.
📘 What it is: The EMA 200 is the average price of the last 200 candles, giving more weight to recent ones. It summarizes the underlying trend.
• Price above the EMA 200 → underlying uptrend
• Price below → underlying downtrend
• Price right at it → decision zone
📊 Example using today's data:
• ETH 4 h: it has recovered the EMA 20 (2,334) and the EMA 50 (2,315), but is running into the EMA 200 (2,417).
• $BTC 4 h: $80,362 versus its EMA 200 at $80,956, less than 1% away.
• On the daily chart, however, both are above their EMA 200 (ETH 2,230 / BTC 74,436): the long-term trend remains healthy.
❌ Common mistake: thinking that touching the EMA 200 is an automatic buy or sell signal. It works as a zone, not an exact line, and carries more weight if the crossover comes with volume (today ETH's relative volume on the 4 h chart is only 0.54).
✅ In one line: the EMA 200 separates an underlying uptrend from a downtrend; the crossover matters when it holds and is accompanied by volume.
Do you use the EMA 200 on the 4 h or daily chart? 👇
#EMA #AnalisisTecnico #ETH #Cripto #Tra100d
⚠️ For informational and educational purposes only; this is not financial advice. Cryptocurrencies are volatile: do your own research and trade with caution.
78
·
--
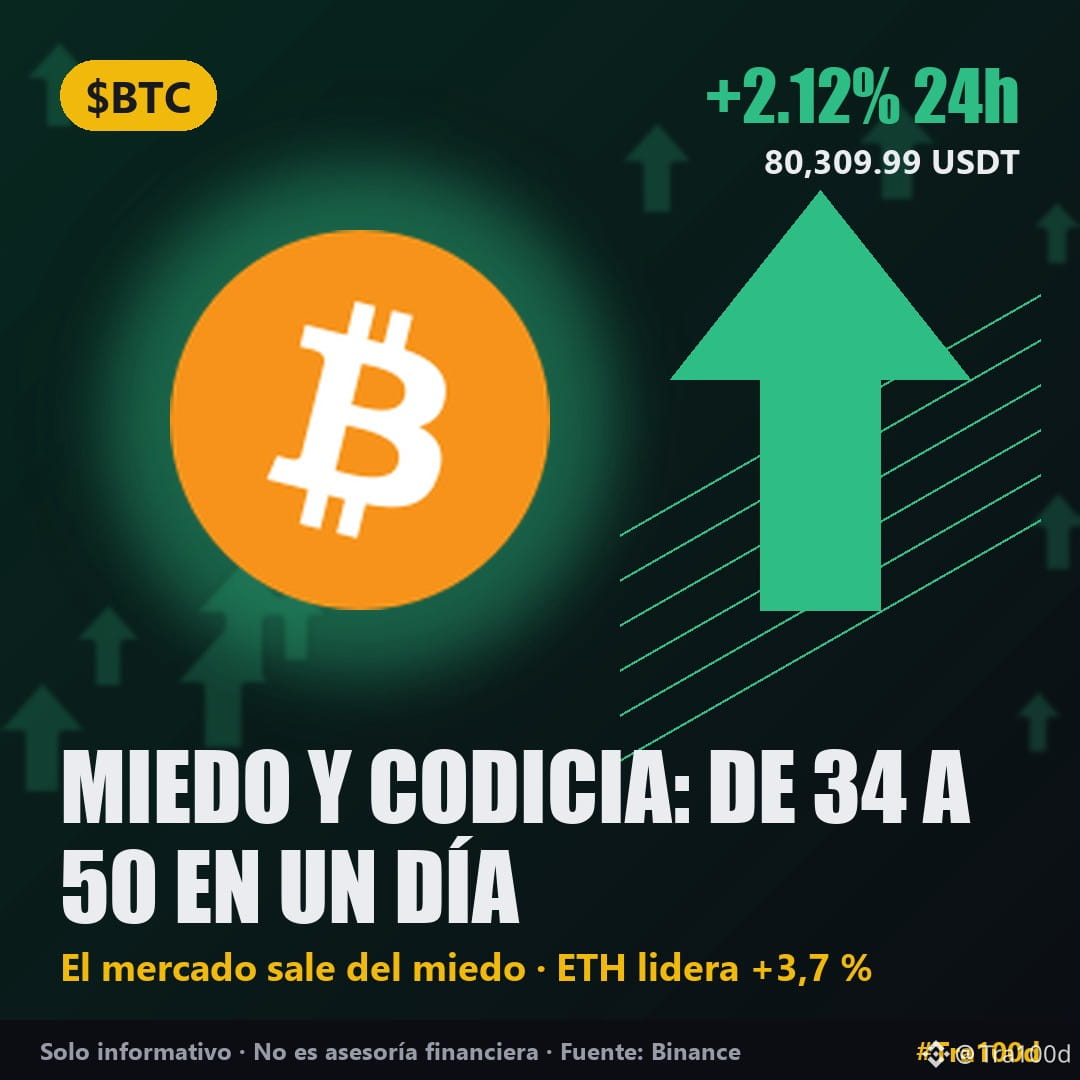
😮💨 In just 2 days, the Fear and Greed Index rose from 26 to 50. Today, the market officially exits “fear” and enters “neutral.”
📌 3 things to know today:
• $ETH leads among the majors: +3.7% to $2,419, with $715M in volume.
• $BTC is up +2.1% to $80,310 and $SOL is up +3.0% to $96.63.
• Not everything is green: TRUMP is down −15.1% and HYPE −5.5%.
🔍 Why it matters: sentiment shifted quickly, but price has yet to confirm the move. BTC remains just below its 4-hour 200 EMA ($80,956), and futures open interest fell −2.4%: the rise came more from position closures than from new money.
Will neutral turn into greed, or will fear return? 👇
#MiedoYCodicia #BTC #ETH #Cripto #Tra100d
⚠️ For informational and educational purposes only; this is not financial advice. Cryptocurrencies are volatile: do your own research and trade with caution.
😮💨 In just 2 days, the Fear and Greed Index rose from 26 to 50. Today, the market officially exits “fear” and enters “neutral.”
📌 3 things to know today:
• $ETH leads among the majors: +3.7% to $2,419, with $715M in volume.
• $BTC is up +2.1% to $80,310 and $SOL is up +3.0% to $96.63.
• Not everything is green: TRUMP is down −15.1% and HYPE −5.5%.
🔍 Why it matters: sentiment shifted quickly, but price has yet to confirm the move. BTC remains just below its 4-hour 200 EMA ($80,956), and futures open interest fell −2.4%: the rise came more from position closures than from new money.
Will neutral turn into greed, or will fear return? 👇
#MiedoYCodicia #BTC #ETH #Cripto #Tra100d
⚠️ For informational and educational purposes only; this is not financial advice. Cryptocurrencies are volatile: do your own research and trade with caution.
📌 3 things to know today:
• $ETH leads among the majors: +3.7% to $2,419, with $715M in volume.
• $BTC is up +2.1% to $80,310 and $SOL is up +3.0% to $96.63.
• Not everything is green: TRUMP is down −15.1% and HYPE −5.5%.
🔍 Why it matters: sentiment shifted quickly, but price has yet to confirm the move. BTC remains just below its 4-hour 200 EMA ($80,956), and futures open interest fell −2.4%: the rise came more from position closures than from new money.
Will neutral turn into greed, or will fear return? 👇
#MiedoYCodicia #BTC #ETH #Cripto #Tra100d
⚠️ For informational and educational purposes only; this is not financial advice. Cryptocurrencies are volatile: do your own research and trade with caution.
102
·
--
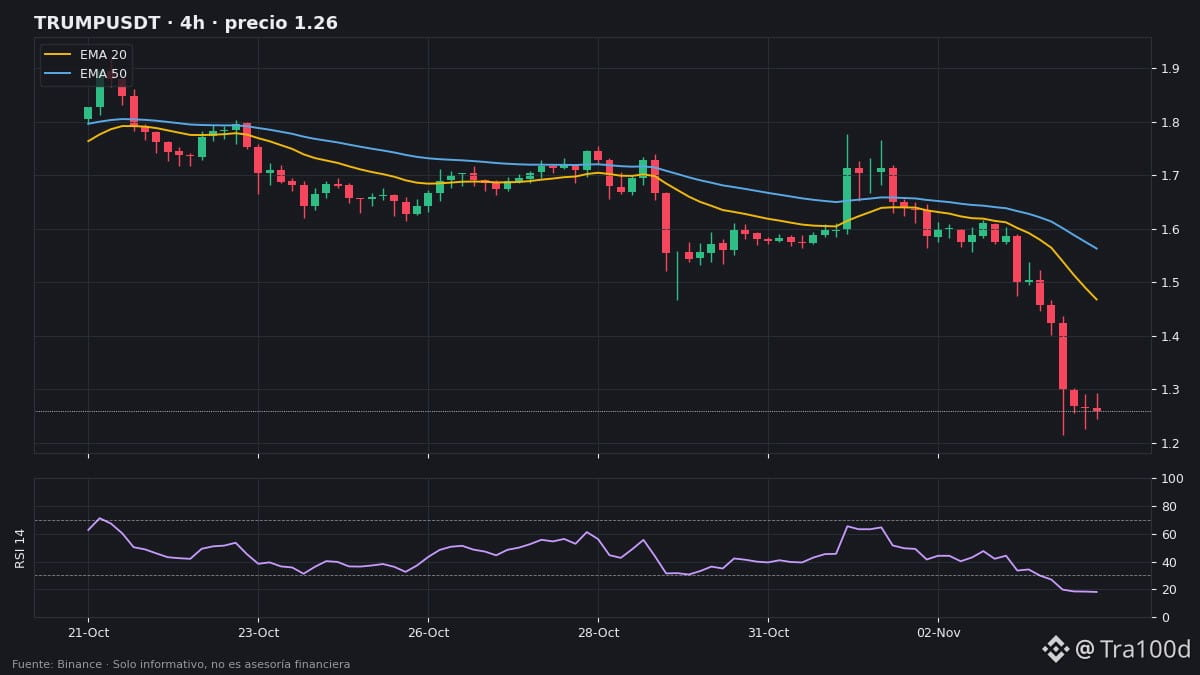
🚨 $TRUMP is the biggest loser on Binance today: −15,1 % in 24 h. And the futures market is betting it will keep falling.
📊 The data (Binance):
• Spot price: 1,263 $ (−15,06 % in 24 h) with 42,2 M$ in volume
• Daily volume: 5,2 times the average
• 4 h RSI: 18 (extremely oversold) · Daily RSI: 28
• Funding: −0,035 % → shorts pay longs
• Open interest: +24,8 % → many new positions entered as it fell
📉 On the 4 h chart, it is well below the EMA 20 (1,467), and the 20-candle low is at 1,215, less than 4 % below the price.
⚡ Watch out: with an RSI of 18, negative funding, and so many new shorts, a sharp bounce caused by short covering is possible, but the trend remains strongly bearish. Its daily ATR is 11,3 %: a move of 11 % in one day is normal for TRUMP.
A bounce from short covering, or does it break below 1,215? Reply "BOUNCE" or "BREAKS" 👇
#TRUMP #Memecoin #Futuros #Cripto #Tra100d
⚠️ For informational and educational purposes only; this is not financial advice. Cryptocurrencies are volatile: do your own research and trade with caution.
🚨 $TRUMP is the biggest loser on Binance today: −15,1 % in 24 h. And the futures market is betting it will keep falling.
📊 The data (Binance):
• Spot price: 1,263 $ (−15,06 % in 24 h) with 42,2 M$ in volume
• Daily volume: 5,2 times the average
• 4 h RSI: 18 (extremely oversold) · Daily RSI: 28
• Funding: −0,035 % → shorts pay longs
• Open interest: +24,8 % → many new positions entered as it fell
📉 On the 4 h chart, it is well below the EMA 20 (1,467), and the 20-candle low is at 1,215, less than 4 % below the price.
⚡ Watch out: with an RSI of 18, negative funding, and so many new shorts, a sharp bounce caused by short covering is possible, but the trend remains strongly bearish. Its daily ATR is 11,3 %: a move of 11 % in one day is normal for TRUMP.
A bounce from short covering, or does it break below 1,215? Reply "BOUNCE" or "BREAKS" 👇
#TRUMP #Memecoin #Futuros #Cripto #Tra100d
⚠️ For informational and educational purposes only; this is not financial advice. Cryptocurrencies are volatile: do your own research and trade with caution.
📊 The data (Binance):
• Spot price: 1,263 $ (−15,06 % in 24 h) with 42,2 M$ in volume
• Daily volume: 5,2 times the average
• 4 h RSI: 18 (extremely oversold) · Daily RSI: 28
• Funding: −0,035 % → shorts pay longs
• Open interest: +24,8 % → many new positions entered as it fell
📉 On the 4 h chart, it is well below the EMA 20 (1,467), and the 20-candle low is at 1,215, less than 4 % below the price.
⚡ Watch out: with an RSI of 18, negative funding, and so many new shorts, a sharp bounce caused by short covering is possible, but the trend remains strongly bearish. Its daily ATR is 11,3 %: a move of 11 % in one day is normal for TRUMP.
A bounce from short covering, or does it break below 1,215? Reply "BOUNCE" or "BREAKS" 👇
#TRUMP #Memecoin #Futuros #Cripto #Tra100d
⚠️ For informational and educational purposes only; this is not financial advice. Cryptocurrencies are volatile: do your own research and trade with caution.
81
Log in to explore more content
Join global crypto users on Binance Square
⚡️ Get latest and useful information about crypto.
💬 Trusted by the world’s largest crypto exchange.
👍 Discover real insights from verified creators.
Email / Phone number