

CRYPTOVISION _BNB
5.7k Posts

CRYPTOVISION _BNB
Report
Block User
Perspectivas del mercado. Configuraciones de trading. Oportunidades en criptomonedas.
Open Trade
Frequent Trader
2.8 Years
17 Following
3.7K+ Followers
6.7K+ Liked
Posts
Portfolio
All
Quotes
PINNED
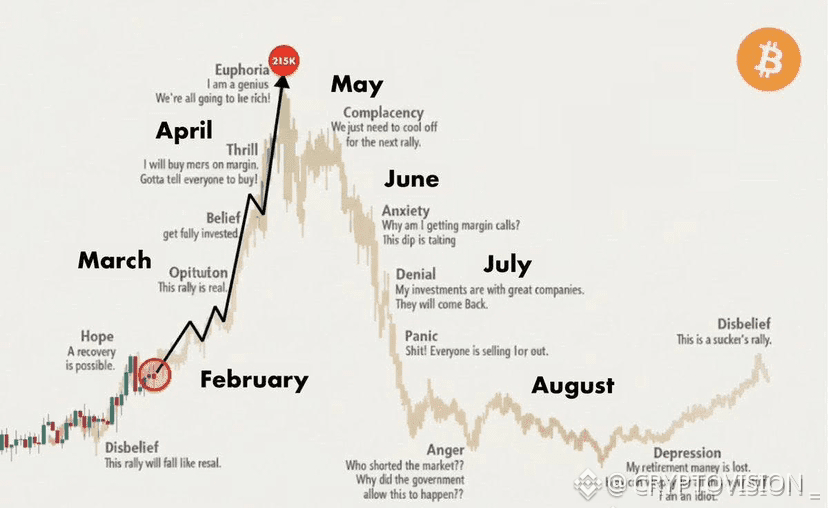
Predictions on the Bull Run of $BTC in 2026: A possible trajectory🎢
- February: Bear trap
- March: Gold/Silver drop -> Bitcoin skyrockets
- April: Altcoin season
- May: New All-Time High (ATH)
- June: Bull trap
- July: Mass liquidation
- August: Start of bear market
👉 These are speculative predictions and the market changes fast. Do you agree with this trajectory? 😂
trade down here ⬇️ with $BTC
{future}(BTCUSDT)
Predictions on the Bull Run of $BTC in 2026: A possible trajectory🎢
- February: Bear trap
- March: Gold/Silver drop -> Bitcoin skyrockets
- April: Altcoin season
- May: New All-Time High (ATH)
- June: Bull trap
- July: Mass liquidation
- August: Start of bear market
👉 These are speculative predictions and the market changes fast. Do you agree with this trajectory? 😂
trade down here ⬇️ with $BTC
- February: Bear trap
- March: Gold/Silver drop -> Bitcoin skyrockets
- April: Altcoin season
- May: New All-Time High (ATH)
- June: Bull trap
- July: Mass liquidation
- August: Start of bear market
👉 These are speculative predictions and the market changes fast. Do you agree with this trajectory? 😂
trade down here ⬇️ with $BTC
4
1
12
20.5k
·
--
Bearish
See translation
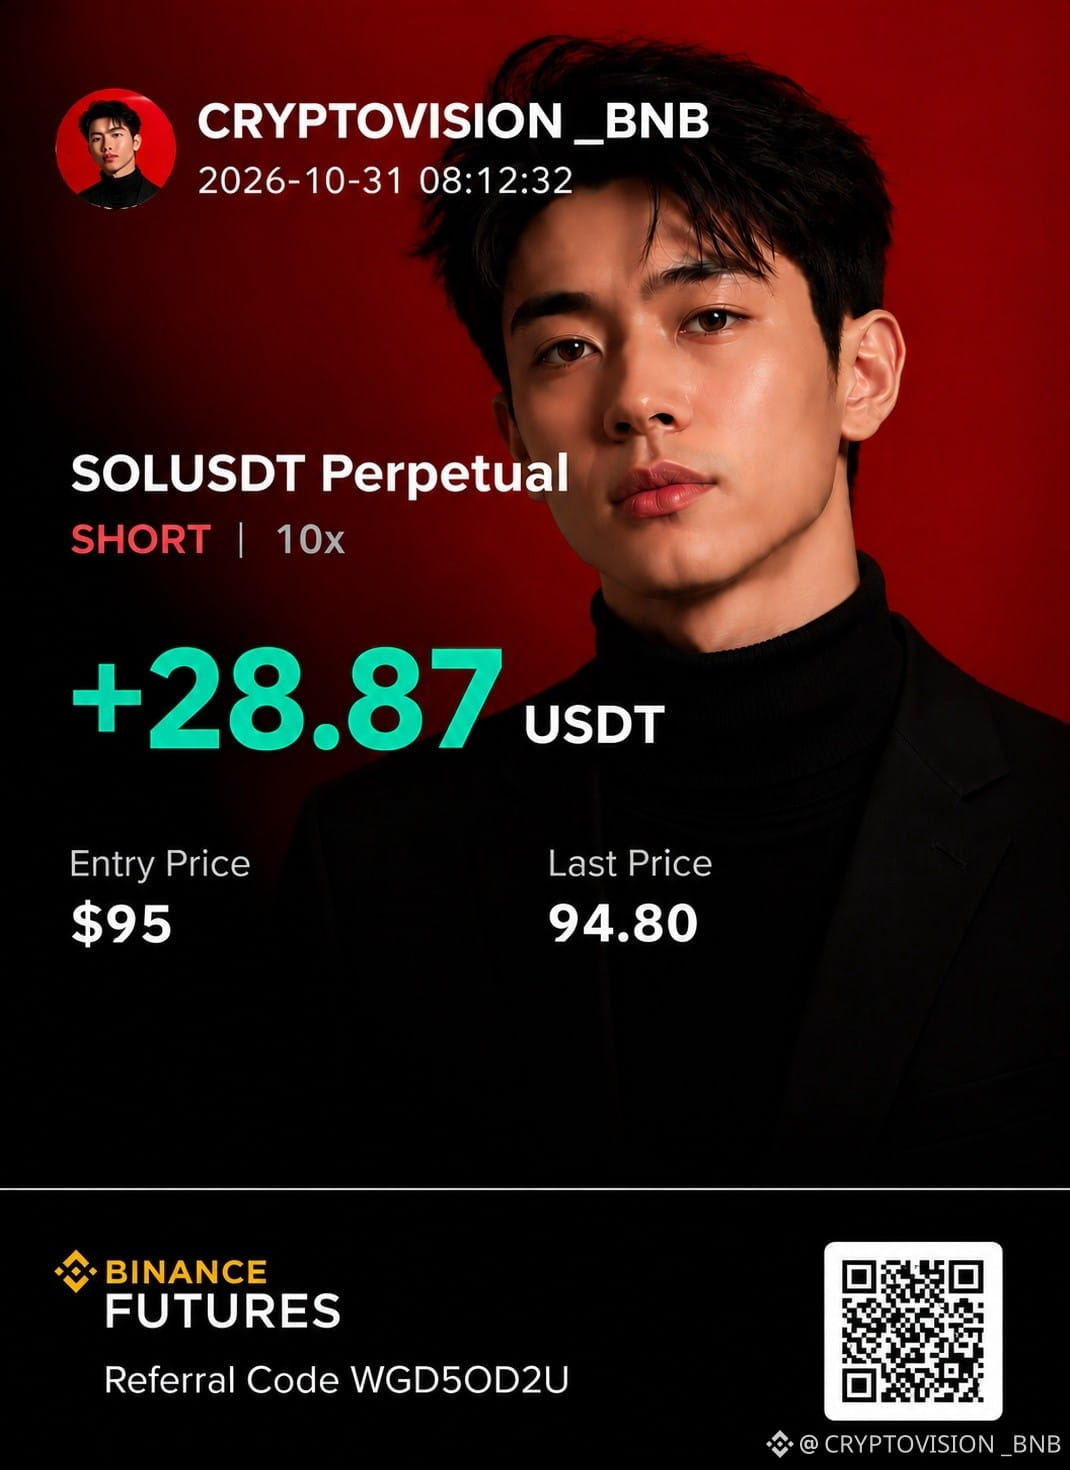
$SOL: A Strong Bearish Breakdown Could Be Coming
Sideways markets don't stay quiet forever. When support breaks and momentum shifts, a sharp move can follow.
Solana is showing a potential SHORT setup, with bearish signals across multiple timeframes.
SOL/USDT — SHORT Setup
- Entry: $94.00–$96.28
- TP1: $92.5653
- TP2: $91.4822
- TP3: $89.8576
- Stop Loss: $97.35
- Bias: Strong Bearish
Why I'm Watching This SHORT
- 4H and 1H trends are bearish, with price reportedly below EMA50 and EMA200.
- The reported 15-minute ADX of 33.6 suggests strong trend momentum.
- Six of twelve technical signals support the bearish scenario, while one opposes it.
- A confirmed breakdown below $94.19 could strengthen the downside case.
My Trading Plan
Enter only within the specified zone. Consider taking 50% profit at TP1, 25% at TP2, and the remaining 25% at TP3. After TP1, consider moving the stop to breakeven.
Important Risk: BTC is reportedly rising, and SOL's stated correlation of 0.86 could work against this SHORT setup. A move to $96.3562 invalidates the plan.
These technical readings are supplied estimates, not independently verified live data.
Will $SOL break toward $89.85, or will buyers defend the $94 area?
Share your outlook below and follow CryptoVision for more trading setups and technical analysis.
$SOL
{spot}(SOLUSDT)
$SOL : A Strong Bearish Breakdown Could Be Coming
Sideways markets don't stay quiet forever. When support breaks and momentum shifts, a sharp move can follow.
Solana is showing a potential SHORT setup, with bearish signals across multiple timeframes.
SOL/USDT — SHORT Setup
- Entry: $94.00–$96.28
- TP1: $92.5653
- TP2: $91.4822
- TP3: $89.8576
- Stop Loss: $97.35
- Bias: Strong Bearish
Why I'm Watching This SHORT
- 4H and 1H trends are bearish, with price reportedly below EMA50 and EMA200.
- The reported 15-minute ADX of 33.6 suggests strong trend momentum.
- Six of twelve technical signals support the bearish scenario, while one opposes it.
- A confirmed breakdown below $94.19 could strengthen the downside case.
My Trading Plan
Enter only within the specified zone. Consider taking 50% profit at TP1, 25% at TP2, and the remaining 25% at TP3. After TP1, consider moving the stop to breakeven.
Important Risk: BTC is reportedly rising, and SOL's stated correlation of 0.86 could work against this SHORT setup. A move to $96.3562 invalidates the plan.
These technical readings are supplied estimates, not independently verified live data.
Will $SOL break toward $89.85, or will buyers defend the $94 area?
Share your outlook below and follow CryptoVision for more trading setups and technical analysis.
$SOL
Sideways markets don't stay quiet forever. When support breaks and momentum shifts, a sharp move can follow.
Solana is showing a potential SHORT setup, with bearish signals across multiple timeframes.
SOL/USDT — SHORT Setup
- Entry: $94.00–$96.28
- TP1: $92.5653
- TP2: $91.4822
- TP3: $89.8576
- Stop Loss: $97.35
- Bias: Strong Bearish
Why I'm Watching This SHORT
- 4H and 1H trends are bearish, with price reportedly below EMA50 and EMA200.
- The reported 15-minute ADX of 33.6 suggests strong trend momentum.
- Six of twelve technical signals support the bearish scenario, while one opposes it.
- A confirmed breakdown below $94.19 could strengthen the downside case.
My Trading Plan
Enter only within the specified zone. Consider taking 50% profit at TP1, 25% at TP2, and the remaining 25% at TP3. After TP1, consider moving the stop to breakeven.
Important Risk: BTC is reportedly rising, and SOL's stated correlation of 0.86 could work against this SHORT setup. A move to $96.3562 invalidates the plan.
These technical readings are supplied estimates, not independently verified live data.
Will $SOL break toward $89.85, or will buyers defend the $94 area?
Share your outlook below and follow CryptoVision for more trading setups and technical analysis.
$SOL
227
·
--
Bullish
See translation
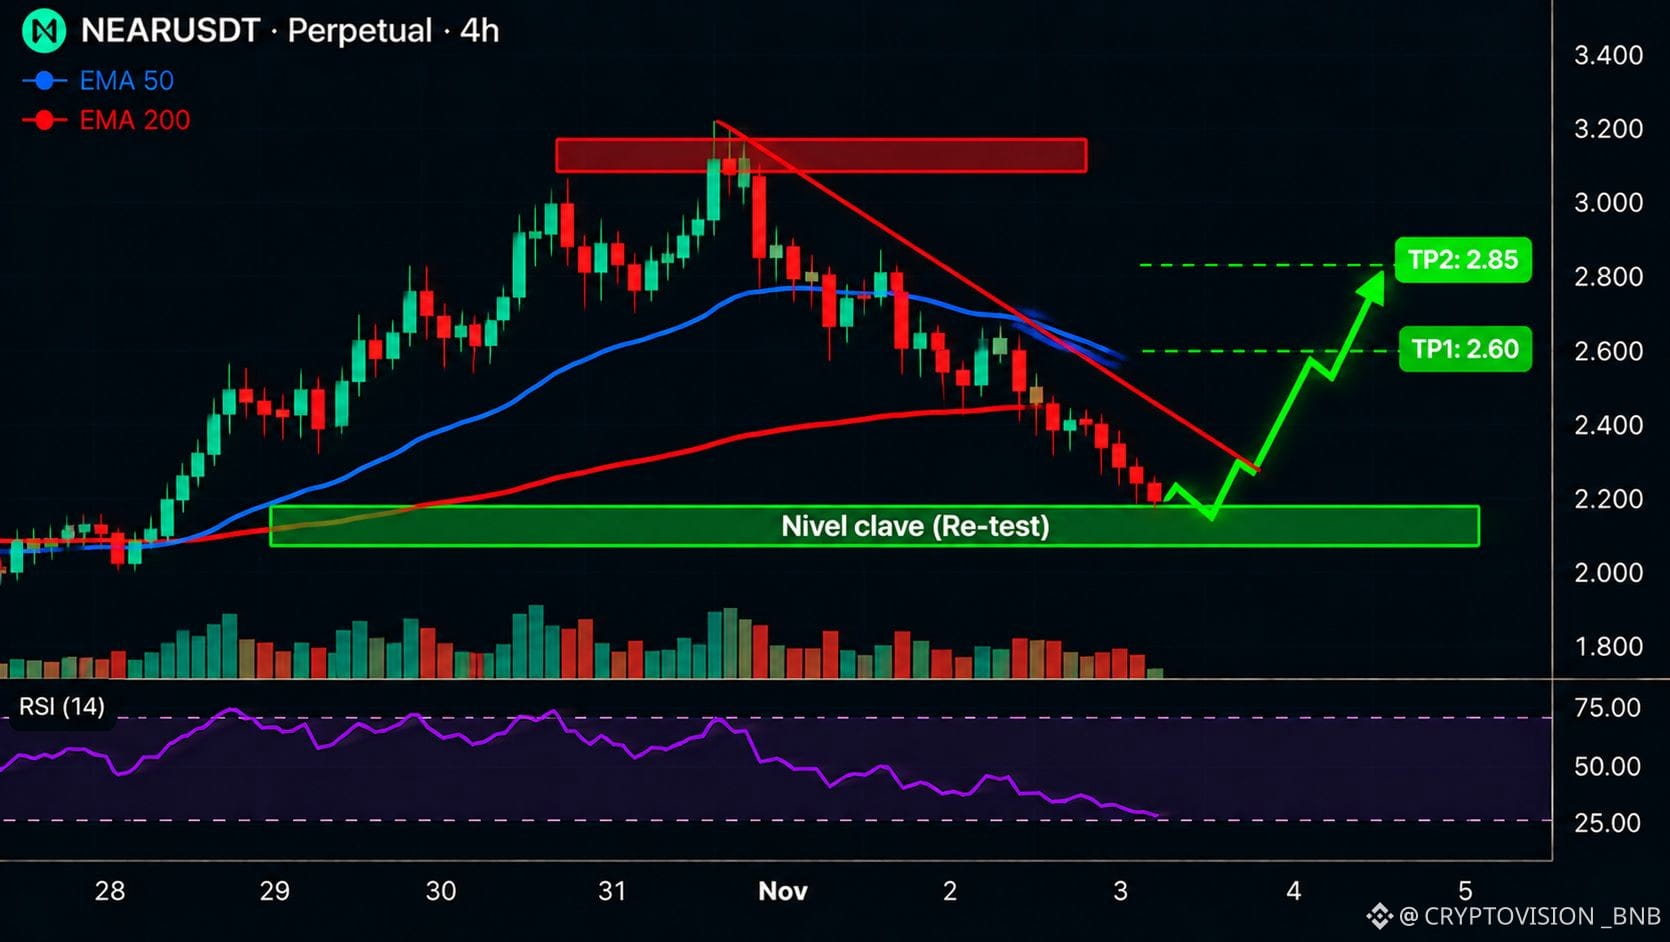
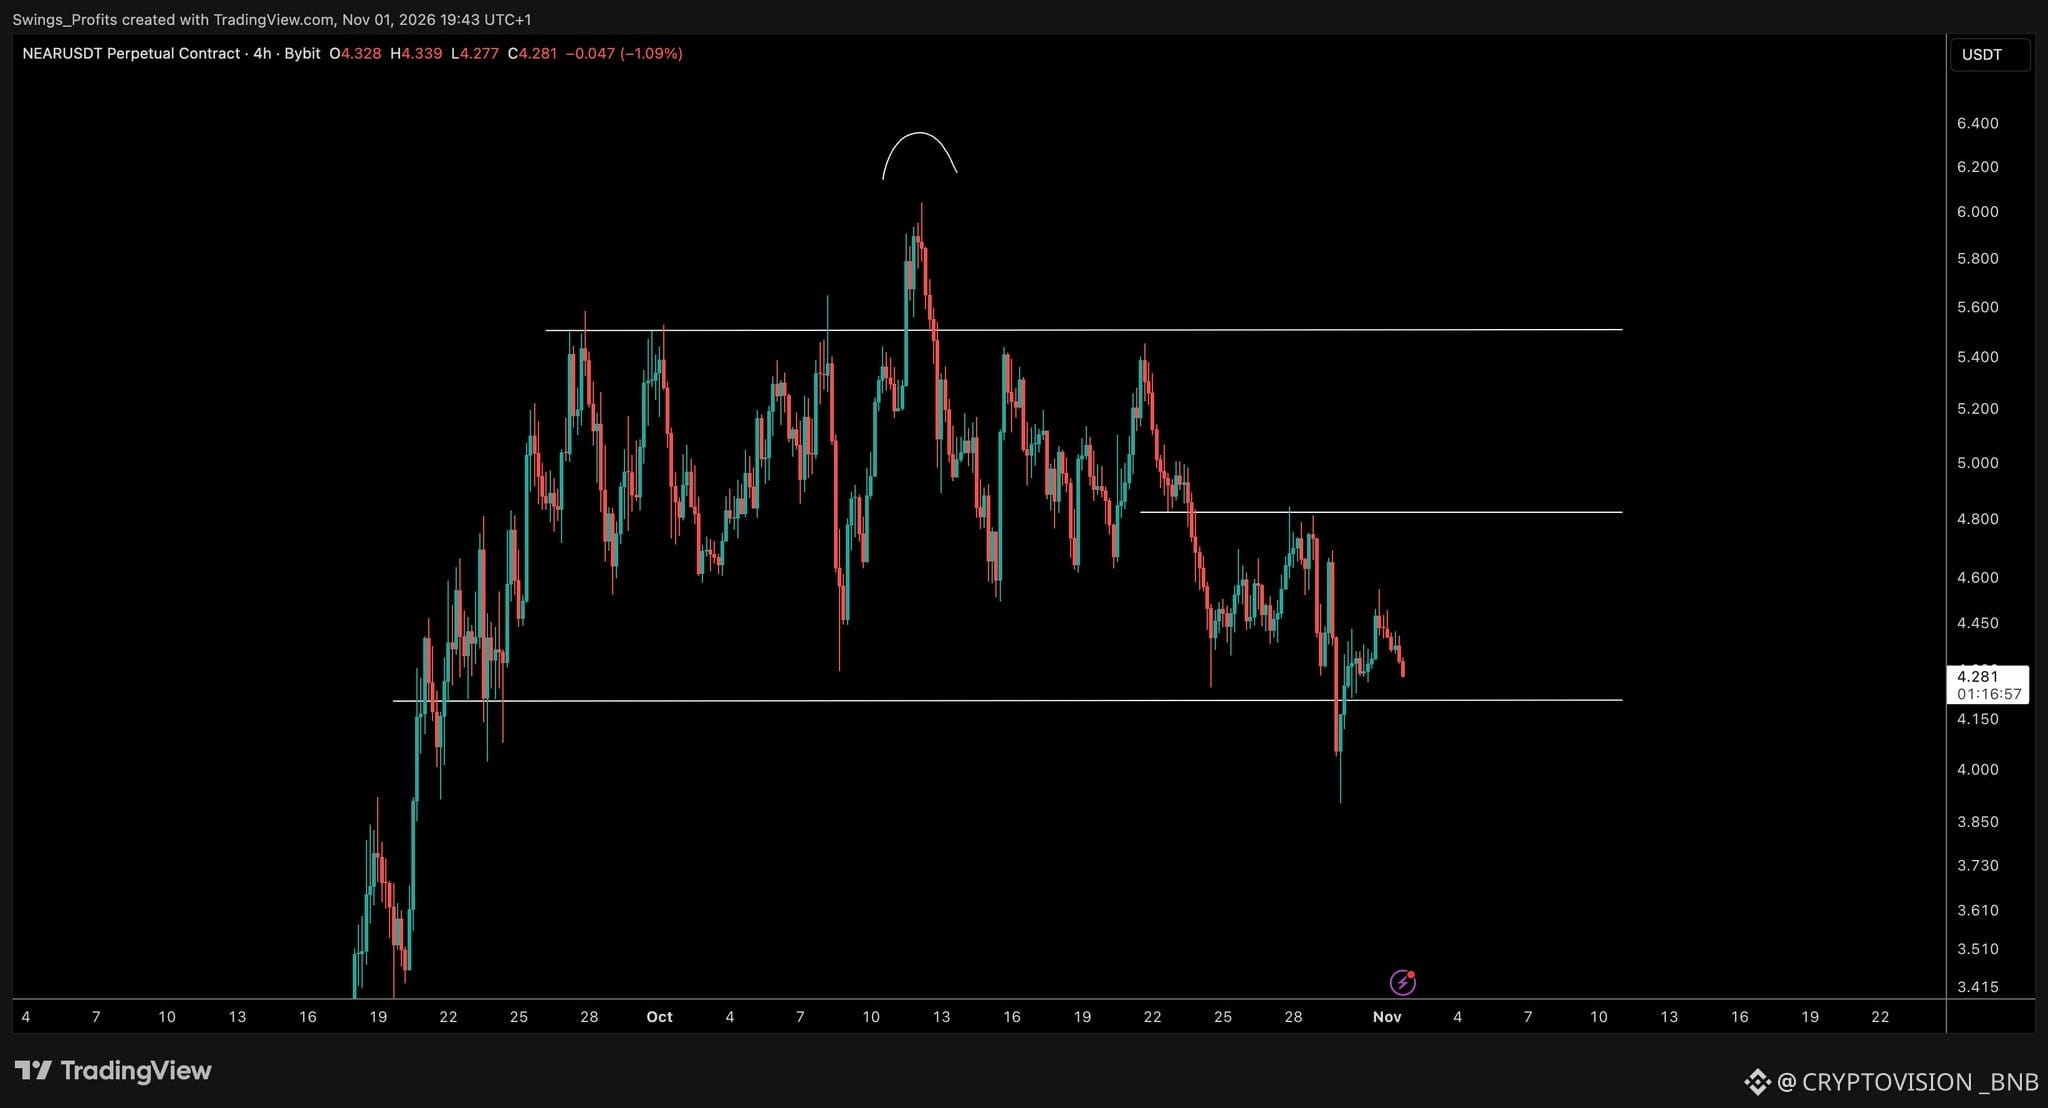
$NEAR: A Key Retest Could Set Up the Next Bullish Move
NEAR remains on my watchlist, but patience is essential at this stage.
Rather than chasing the price, I'm waiting for a retest of a key support level before considering a potential LONG opportunity.
What I'm Watching:
- A controlled pullback toward support.
- A successful retest with buyers defending the zone.
- Bullish confirmation before considering an entry.
If support holds and buying momentum returns, NEAR could offer an attractive rebound setup.
However, a confirmed breakdown below support would weaken the bullish scenario.
No rushed entries. No FOMO. Confirmation comes first.
Do you think $NEAR is preparing for a rebound, or is another correction coming?
Share your outlook below and follow CryptoVision for more technical analysis and trading updates.
$NEAR
{spot}(NEARUSDT)
$NEAR : A Key Retest Could Set Up the Next Bullish Move
NEAR remains on my watchlist, but patience is essential at this stage.
Rather than chasing the price, I'm waiting for a retest of a key support level before considering a potential LONG opportunity.
What I'm Watching:
- A controlled pullback toward support.
- A successful retest with buyers defending the zone.
- Bullish confirmation before considering an entry.
If support holds and buying momentum returns, NEAR could offer an attractive rebound setup.
However, a confirmed breakdown below support would weaken the bullish scenario.
No rushed entries. No FOMO. Confirmation comes first.
Do you think $NEAR is preparing for a rebound, or is another correction coming?
Share your outlook below and follow CryptoVision for more technical analysis and trading updates.
$NEAR
NEAR remains on my watchlist, but patience is essential at this stage.
Rather than chasing the price, I'm waiting for a retest of a key support level before considering a potential LONG opportunity.
What I'm Watching:
- A controlled pullback toward support.
- A successful retest with buyers defending the zone.
- Bullish confirmation before considering an entry.
If support holds and buying momentum returns, NEAR could offer an attractive rebound setup.
However, a confirmed breakdown below support would weaken the bullish scenario.
No rushed entries. No FOMO. Confirmation comes first.
Do you think $NEAR is preparing for a rebound, or is another correction coming?
Share your outlook below and follow CryptoVision for more technical analysis and trading updates.
$NEAR
221
·
--
Bullish
See translation
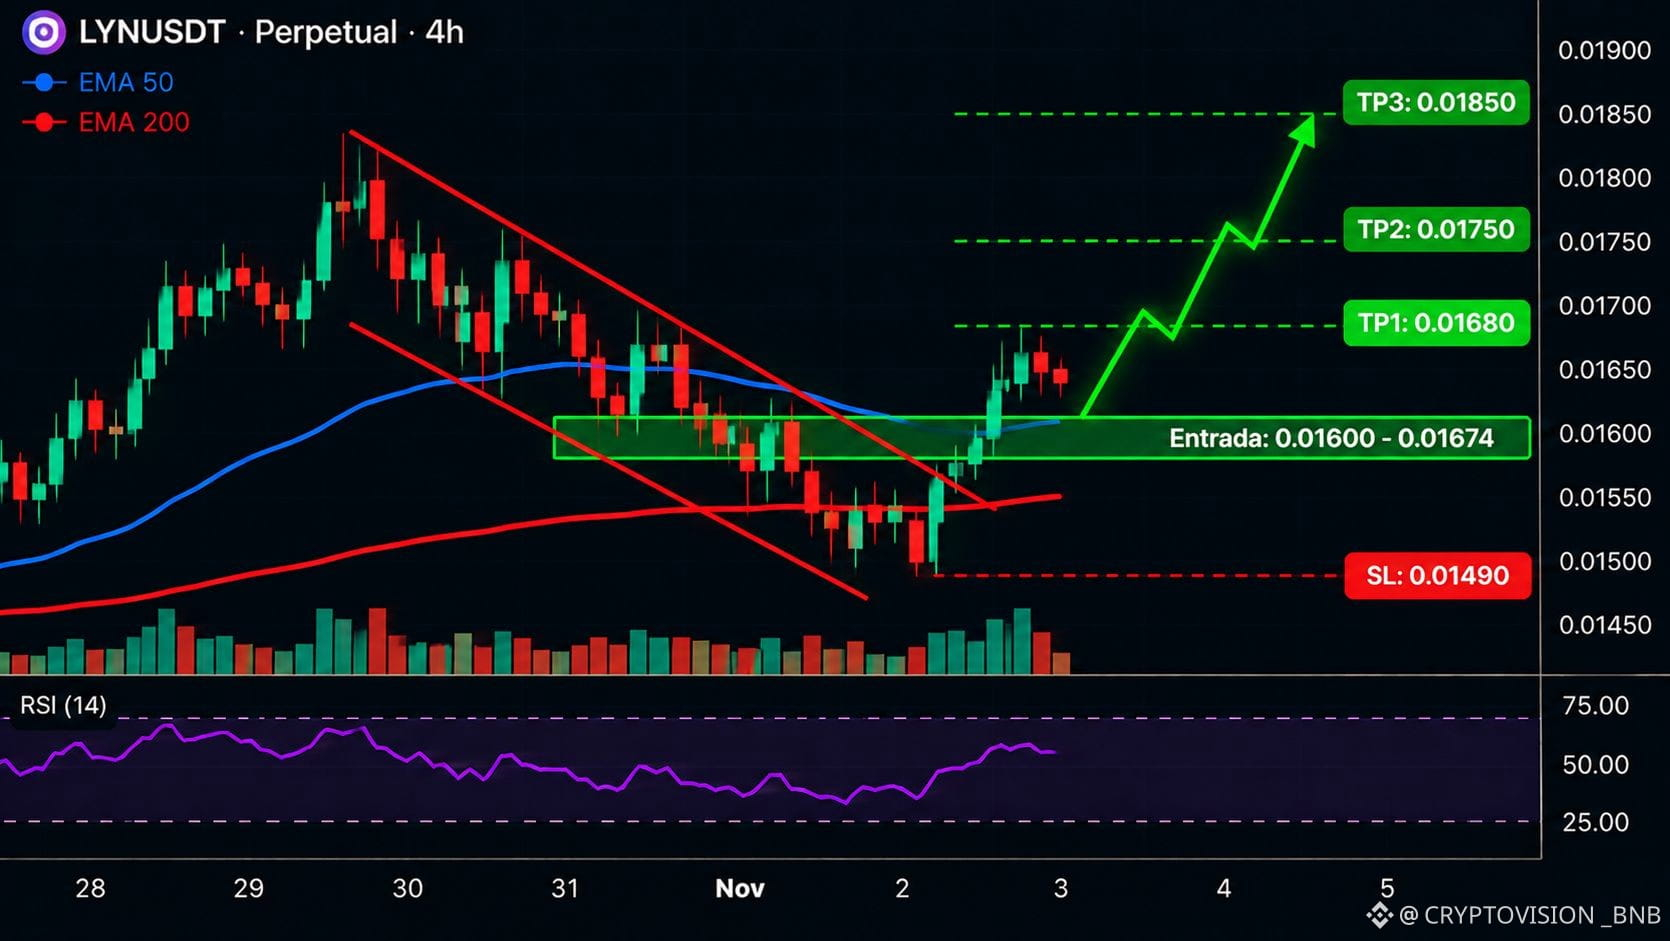
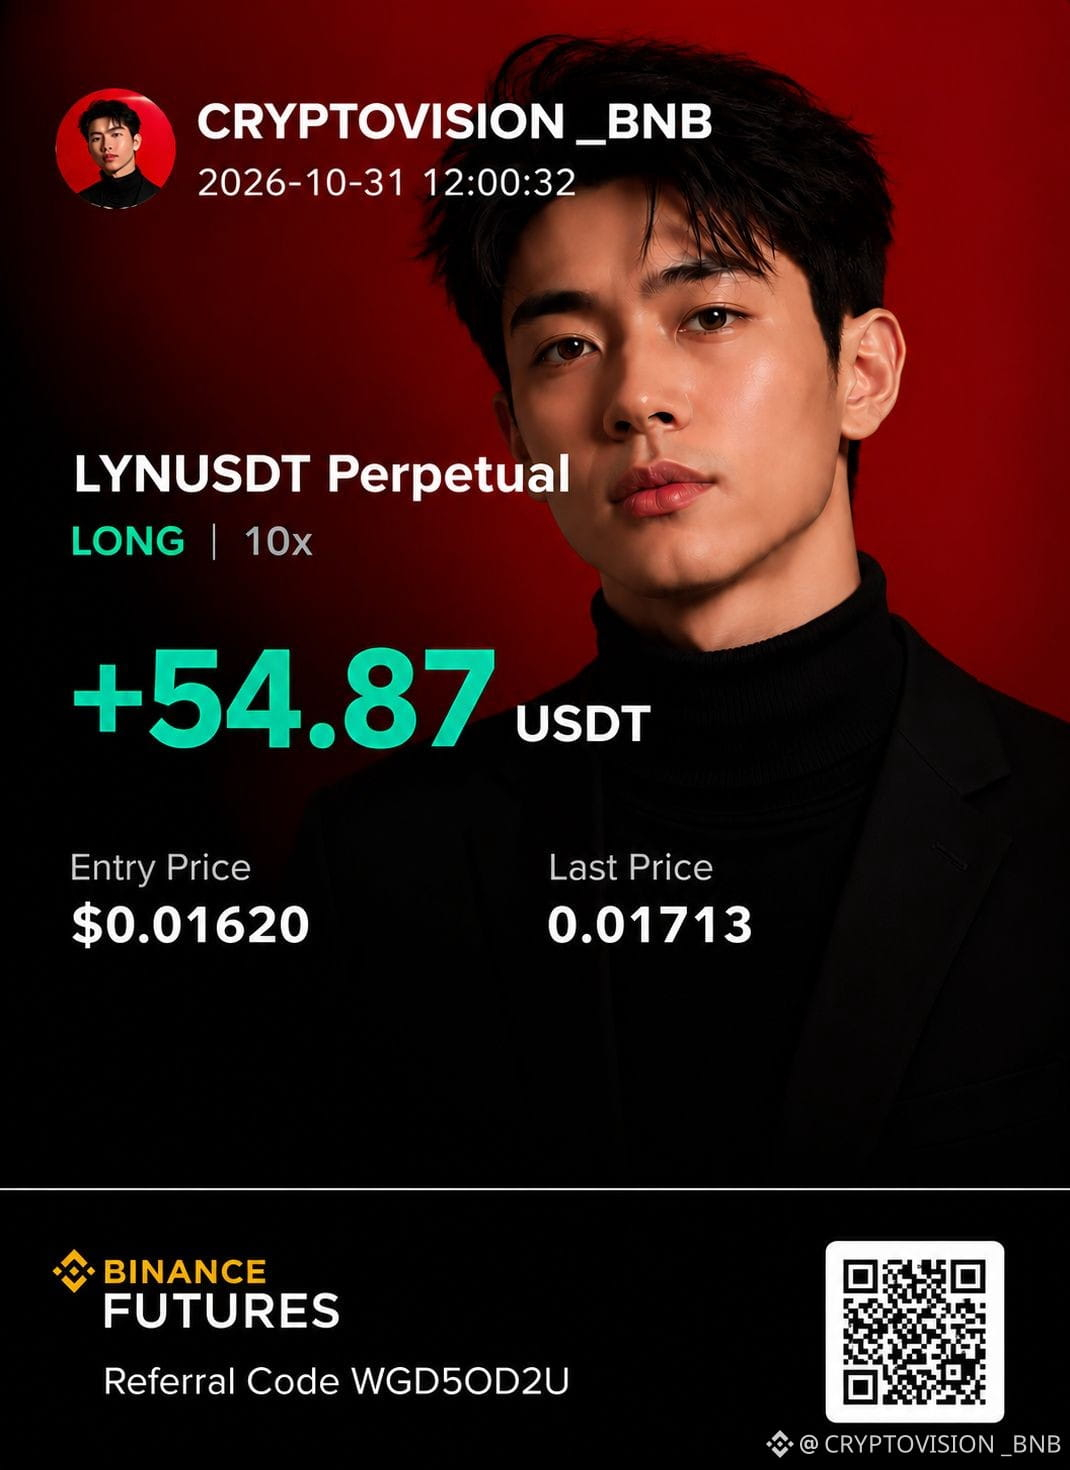
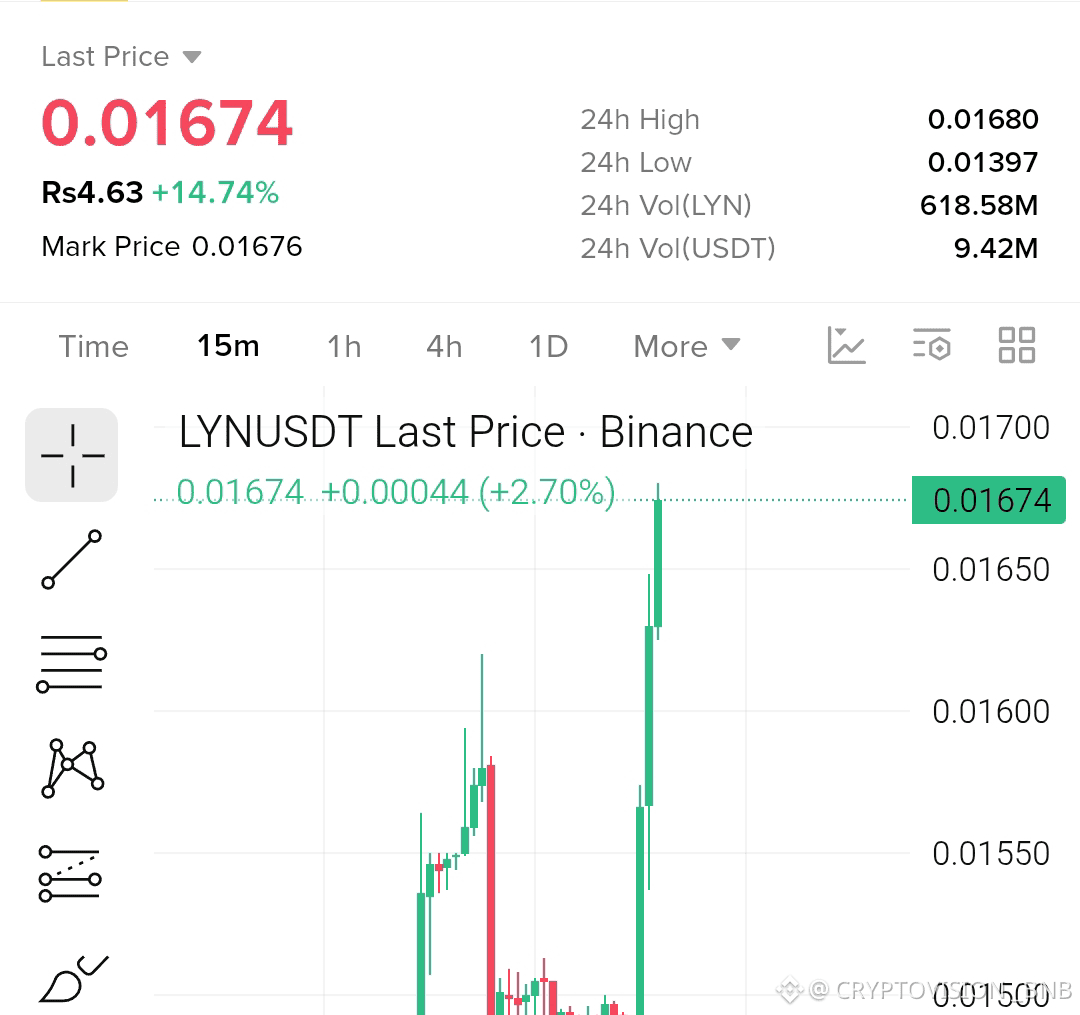
$LYN: Bullish Breakout Ahead? LONG Setup to Watch
LYN is on my radar for a potential bullish continuation, with three upside targets in focus.
LYN/USDT — LONG Setup
- Entry Zone: $0.01600–$0.01774
- TP1: $0.01880
- TP2: $0.01950
- TP3: $0.02050
- Stop Loss: $0.01490
Trading Strategy
I'm watching for buyers to defend the entry zone and confirm renewed bullish momentum.
If the setup develops as expected, consider taking partial profits at each target and adjusting the stop after TP1 to protect capital.
A sustained move below $0.01490 would invalidate this bullish scenario.
Risk Management: Keep position size controlled and avoid chasing the price above the entry zone.
Can $LYN reach $0.01850, or will resistance stop the rally?
Share your outlook below and follow CryptoVision for more trading setups and market analysis.
$LYN
{future}(LYNUSDT)
$LYN : Bullish Breakout Ahead? LONG Setup to Watch
LYN is on my radar for a potential bullish continuation, with three upside targets in focus.
LYN/USDT — LONG Setup
- Entry Zone: $0.01600–$0.01774
- TP1: $0.01880
- TP2: $0.01950
- TP3: $0.02050
- Stop Loss: $0.01490
Trading Strategy
I'm watching for buyers to defend the entry zone and confirm renewed bullish momentum.
If the setup develops as expected, consider taking partial profits at each target and adjusting the stop after TP1 to protect capital.
A sustained move below $0.01490 would invalidate this bullish scenario.
Risk Management: Keep position size controlled and avoid chasing the price above the entry zone.
Can $LYN reach $0.01850, or will resistance stop the rally?
Share your outlook below and follow CryptoVision for more trading setups and market analysis.
$LYN
LYN is on my radar for a potential bullish continuation, with three upside targets in focus.
LYN/USDT — LONG Setup
- Entry Zone: $0.01600–$0.01774
- TP1: $0.01880
- TP2: $0.01950
- TP3: $0.02050
- Stop Loss: $0.01490
Trading Strategy
I'm watching for buyers to defend the entry zone and confirm renewed bullish momentum.
If the setup develops as expected, consider taking partial profits at each target and adjusting the stop after TP1 to protect capital.
A sustained move below $0.01490 would invalidate this bullish scenario.
Risk Management: Keep position size controlled and avoid chasing the price above the entry zone.
Can $LYN reach $0.01850, or will resistance stop the rally?
Share your outlook below and follow CryptoVision for more trading setups and market analysis.
$LYN
52
·
--
Bearish
See translation
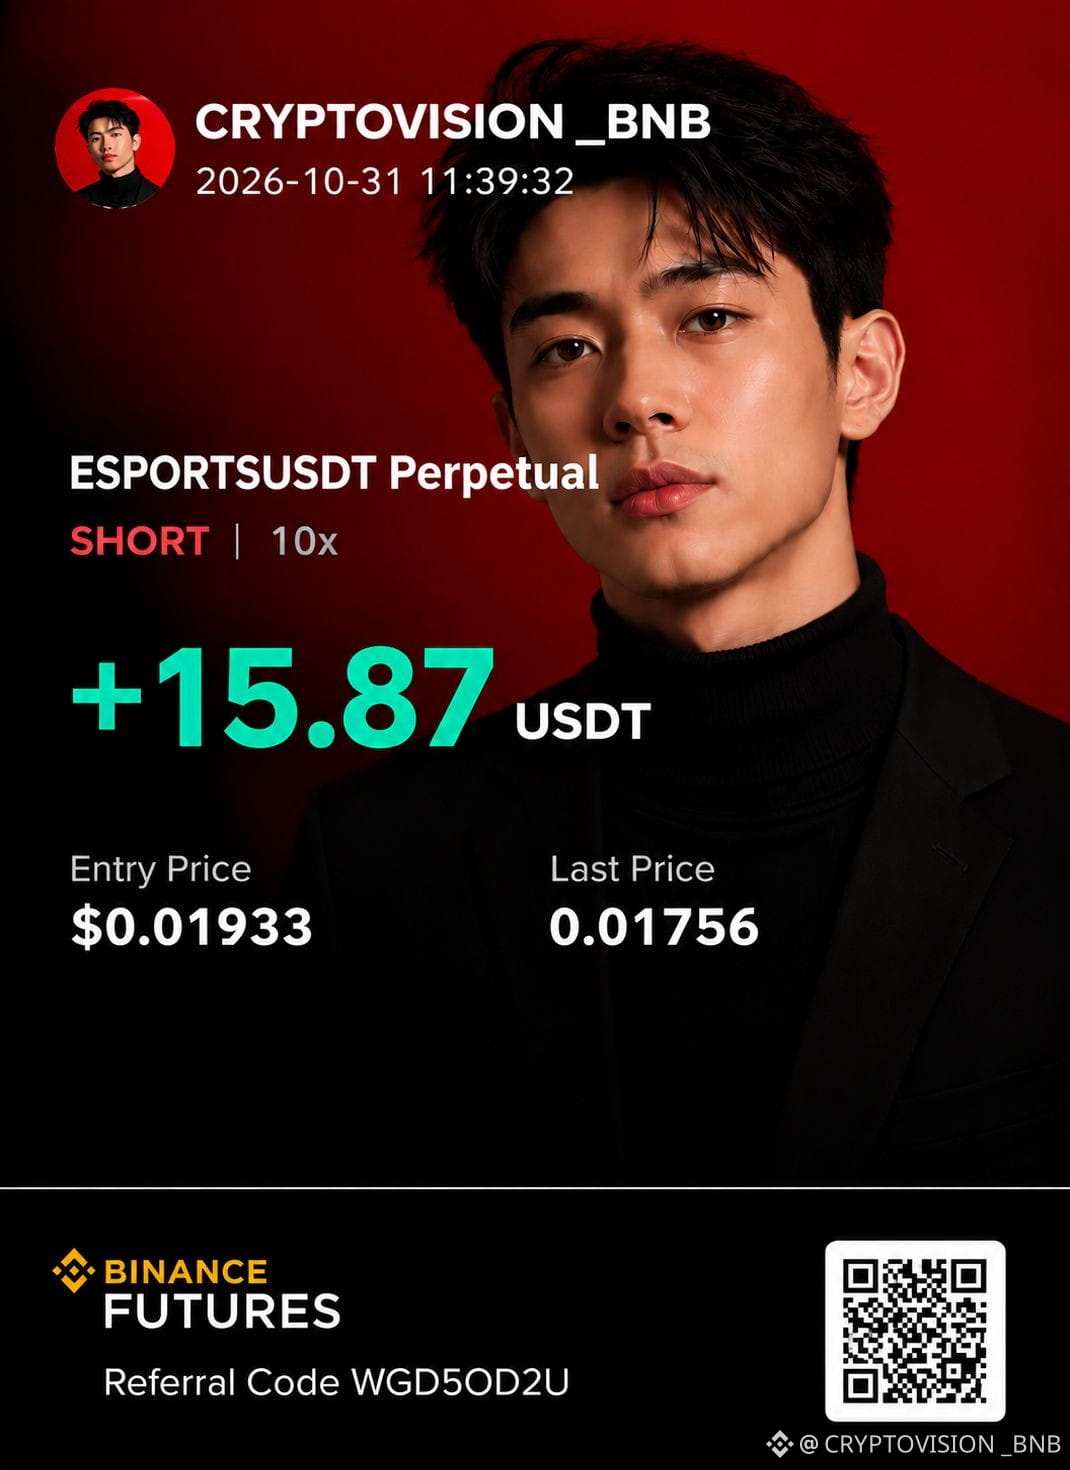
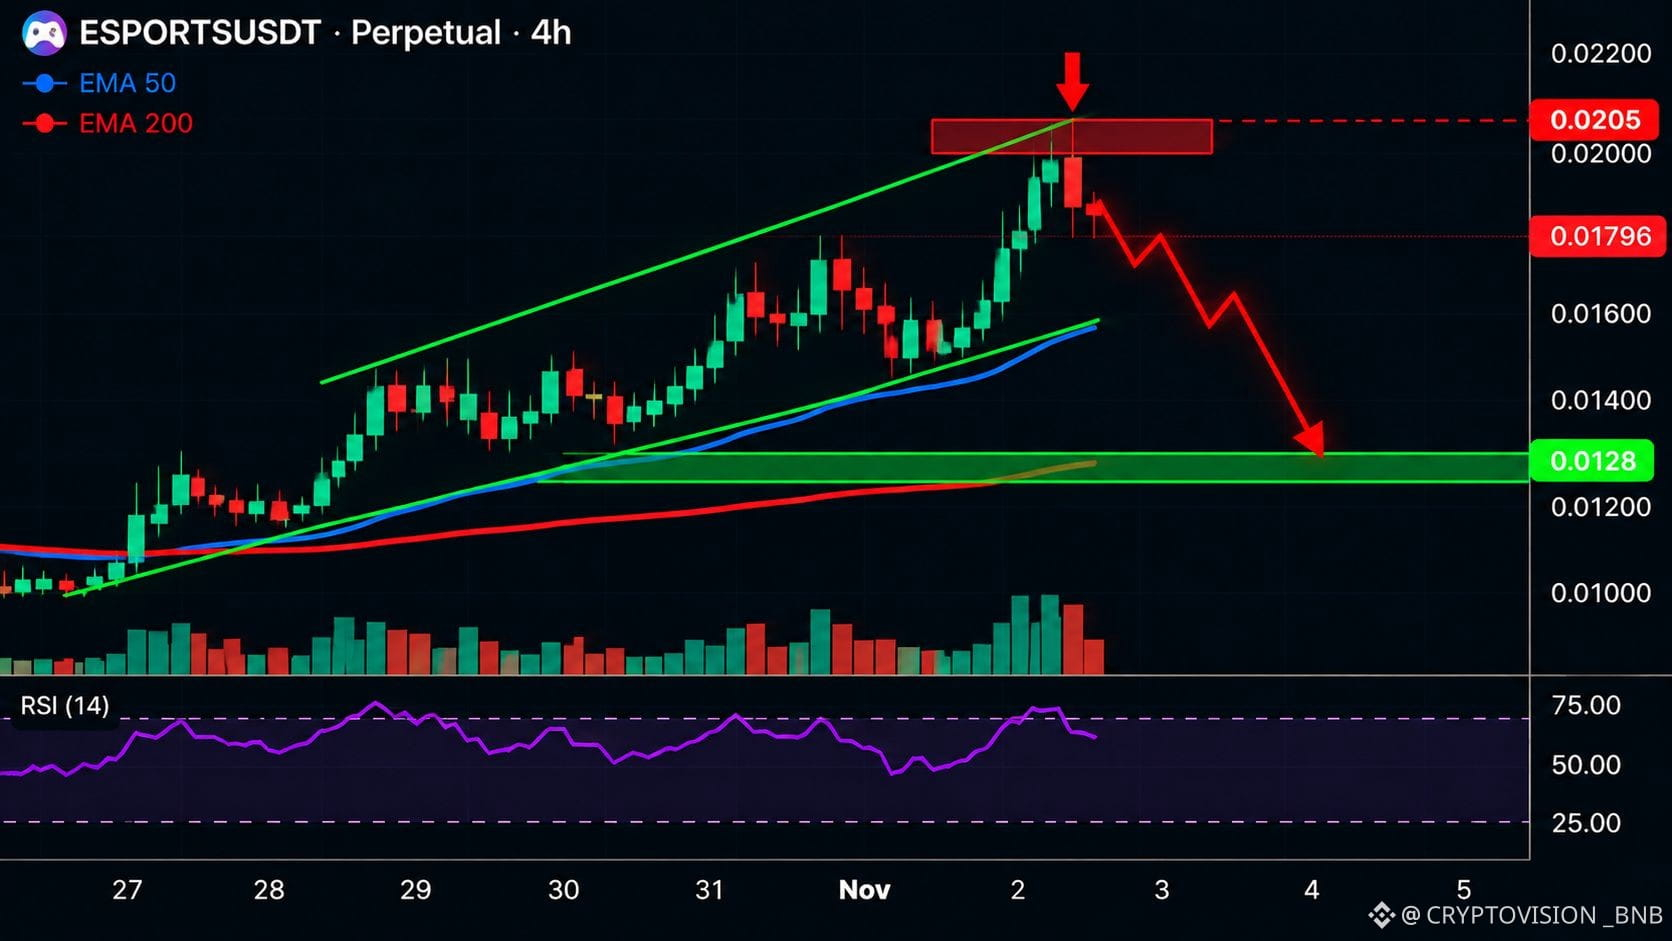
$ESPORTS: Is the Rally Running Out of Steam? A Major Correction Could Be Next
After an aggressive upward move, $ESPORTS is approaching what I consider a potential exhaustion zone.
The question now isn't how much higher it can go, but whether buyers can sustain this momentum.
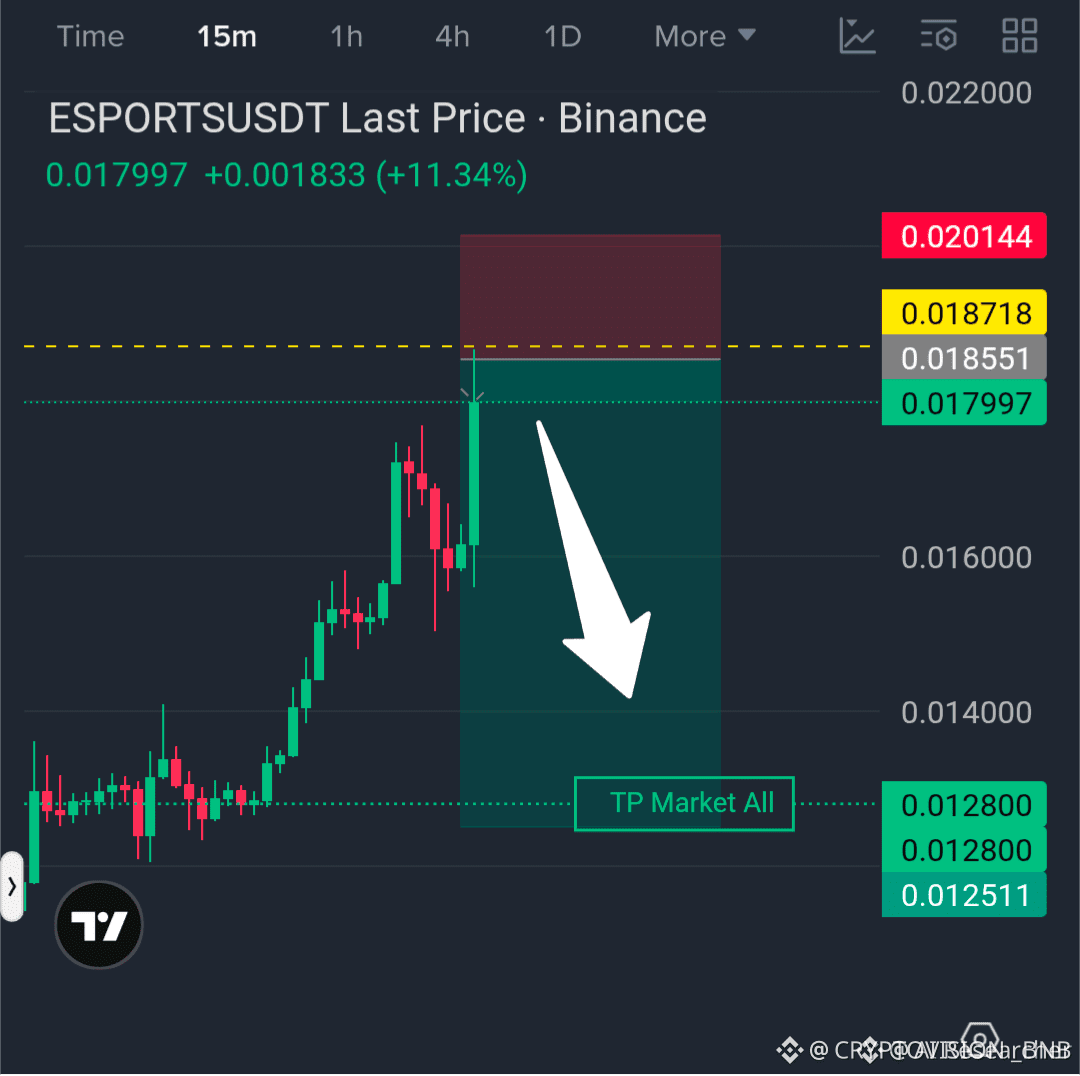
ESPORTSUSDT Perpetual — SHORT Setup
- Reference Price: $0.01796
- Take Profit: $0.01280
- Stop Loss: $0.02050
- Direction: SHORT
- Reported Return: +101.61% (unverified)
Why I'm Watching for a Reversal
A sharp rally can create significant downside risk if momentum fades and sellers regain control.
My bearish scenario targets $0.0128, but a sustained breakout above resistance could invalidate this outlook.
I'm watching for rejection and confirmation rather than assuming the exact top is already in.
Would you take profits on $ESPORTS now, or do you think another breakout is coming?
Share your outlook below and follow CryptoVision for more trading setups and market analysis.
$ESPORTS
{future}(ESPORTSUSDT)
$ESPORTS : Is the Rally Running Out of Steam? A Major Correction Could Be Next
After an aggressive upward move, $ESPORTS is approaching what I consider a potential exhaustion zone.
The question now isn't how much higher it can go, but whether buyers can sustain this momentum.
ESPORTSUSDT Perpetual — SHORT Setup
- Reference Price: $0.01796
- Take Profit: $0.01280
- Stop Loss: $0.02050
- Direction: SHORT
- Reported Return: +101.61% (unverified)
Why I'm Watching for a Reversal
A sharp rally can create significant downside risk if momentum fades and sellers regain control.
My bearish scenario targets $0.0128, but a sustained breakout above resistance could invalidate this outlook.
I'm watching for rejection and confirmation rather than assuming the exact top is already in.
Would you take profits on $ESPORTS now, or do you think another breakout is coming?
Share your outlook below and follow CryptoVision for more trading setups and market analysis.
$ESPORTS
After an aggressive upward move, $ESPORTS is approaching what I consider a potential exhaustion zone.
The question now isn't how much higher it can go, but whether buyers can sustain this momentum.
ESPORTSUSDT Perpetual — SHORT Setup
- Reference Price: $0.01796
- Take Profit: $0.01280
- Stop Loss: $0.02050
- Direction: SHORT
- Reported Return: +101.61% (unverified)
Why I'm Watching for a Reversal
A sharp rally can create significant downside risk if momentum fades and sellers regain control.
My bearish scenario targets $0.0128, but a sustained breakout above resistance could invalidate this outlook.
I'm watching for rejection and confirmation rather than assuming the exact top is already in.
Would you take profits on $ESPORTS now, or do you think another breakout is coming?
Share your outlook below and follow CryptoVision for more trading setups and market analysis.
$ESPORTS
552
·
--
Bearish
See translation
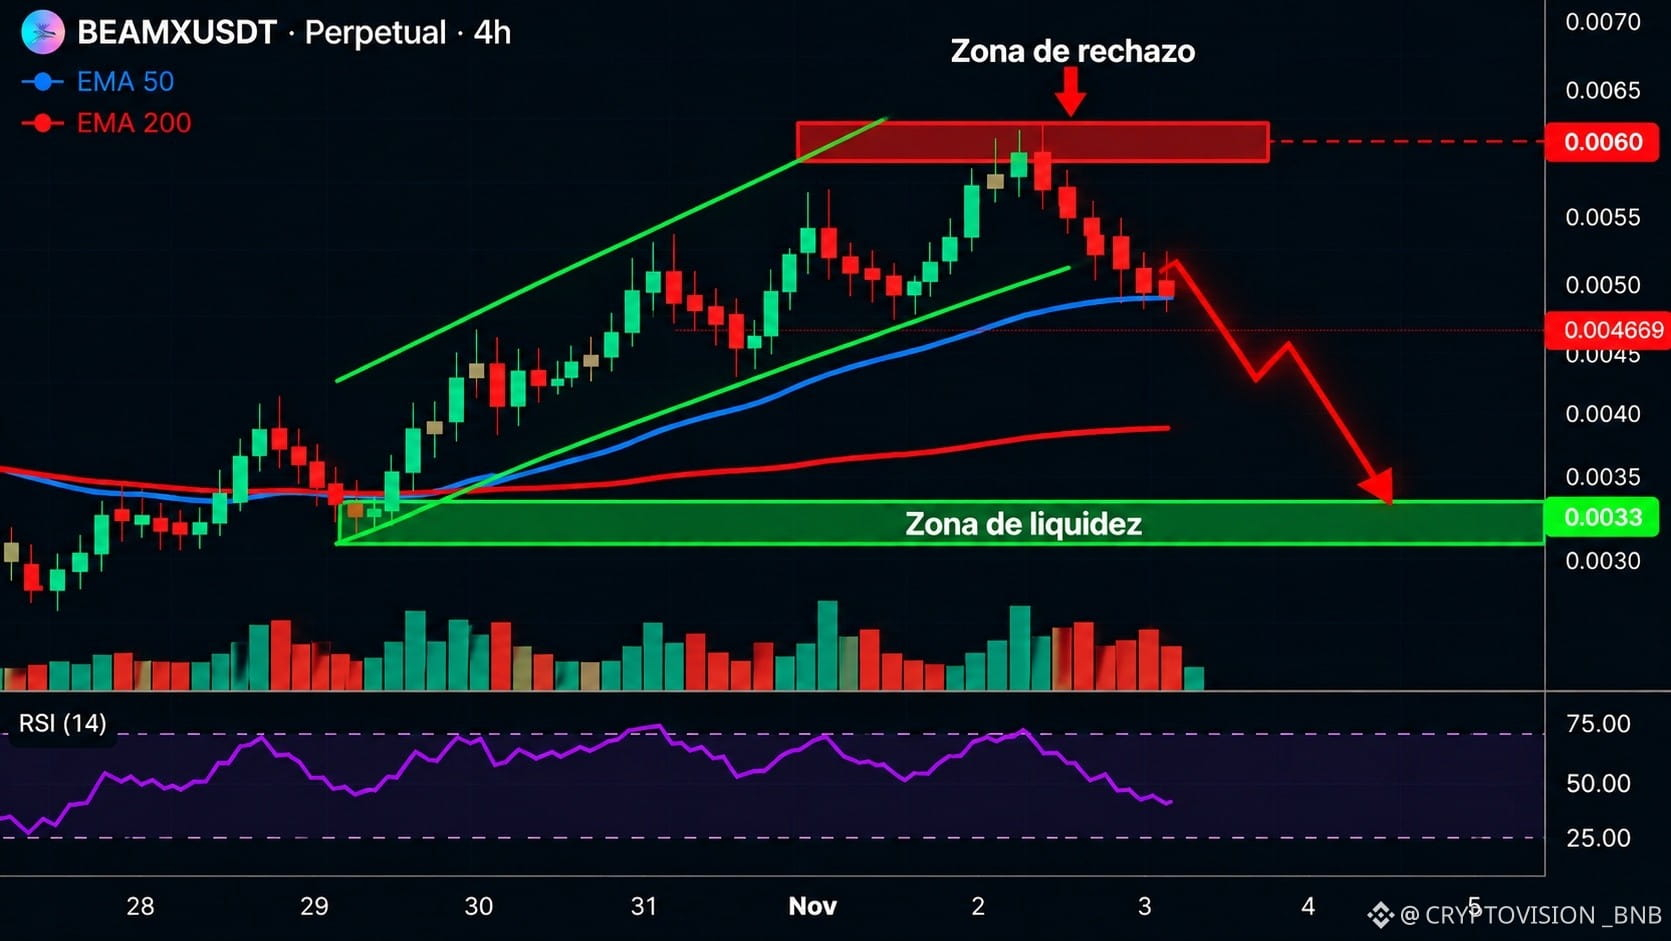
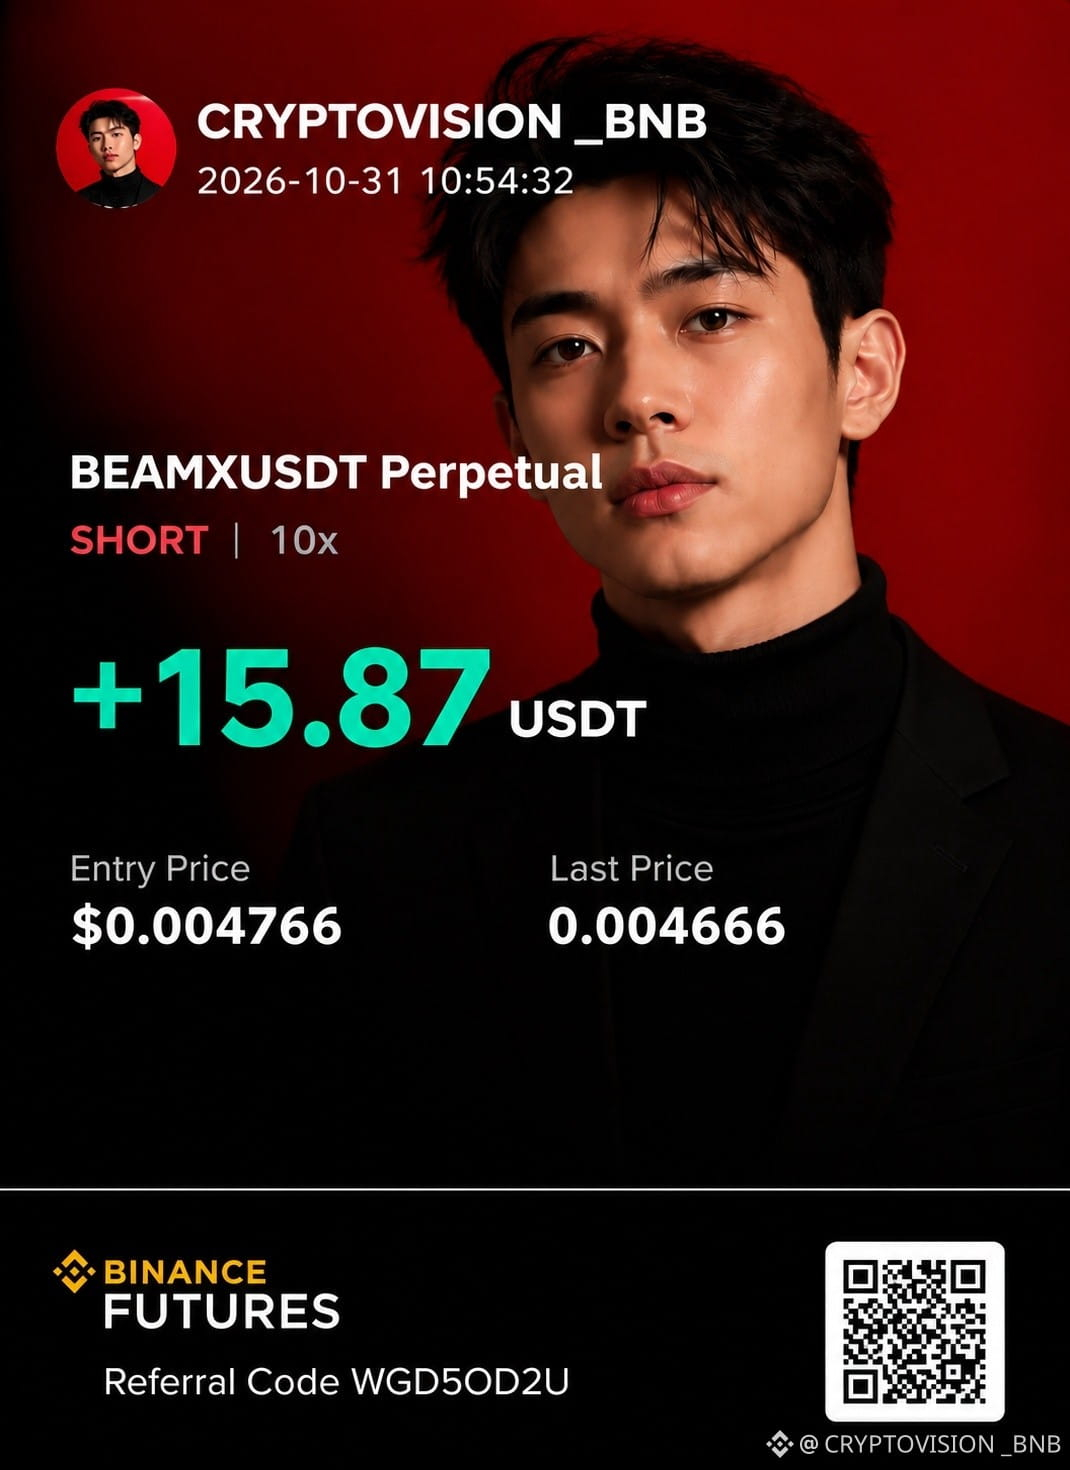
$BEAMX: Is the Rally Losing Strength? A SHORT Opportunity to Watch
After a strong upward move, BEAMX is beginning to show signs of weakness near its upper price zone.
Many traders are asking: Why consider a SHORT after such a powerful rally?
Because timing matters.
I wasn't interested in shorting while bullish momentum remained strong. I wanted to see price push higher, test resistance, and show signs of rejection first.
That rejection is now the focus of my bearish scenario.
BEAMXUSDT Perpetual — SHORT Setup
- Reference Price: $0.004669
- Take Profit: $0.003300
- Stop Loss: $0.006000
- Direction: SHORT
What I'm Watching
Buyers appear to be losing momentum, while a potential liquidity zone below could attract price if selling pressure increases.
The goal isn't to predict the exact top. It's to wait for evidence that the bullish move is weakening.
A sustained recovery above resistance would challenge this bearish outlook. The stop remains essential because a renewed rally could accelerate quickly.
Could $BEAMX fall toward $0.0033, or is another bullish breakout coming?
Share your analysis below and follow CryptoVision for more trading setups and market insights.
$BEAMX
{spot}(BEAMXUSDT)
$BEAMX : Is the Rally Losing Strength? A SHORT Opportunity to Watch
After a strong upward move, BEAMX is beginning to show signs of weakness near its upper price zone.
Many traders are asking: Why consider a SHORT after such a powerful rally?
Because timing matters.
I wasn't interested in shorting while bullish momentum remained strong. I wanted to see price push higher, test resistance, and show signs of rejection first.
That rejection is now the focus of my bearish scenario.
BEAMXUSDT Perpetual — SHORT Setup
- Reference Price: $0.004669
- Take Profit: $0.003300
- Stop Loss: $0.006000
- Direction: SHORT
What I'm Watching
Buyers appear to be losing momentum, while a potential liquidity zone below could attract price if selling pressure increases.
The goal isn't to predict the exact top. It's to wait for evidence that the bullish move is weakening.
A sustained recovery above resistance would challenge this bearish outlook. The stop remains essential because a renewed rally could accelerate quickly.
Could $BEAMX fall toward $0.0033, or is another bullish breakout coming?
Share your analysis below and follow CryptoVision for more trading setups and market insights.
$BEAMX
After a strong upward move, BEAMX is beginning to show signs of weakness near its upper price zone.
Many traders are asking: Why consider a SHORT after such a powerful rally?
Because timing matters.
I wasn't interested in shorting while bullish momentum remained strong. I wanted to see price push higher, test resistance, and show signs of rejection first.
That rejection is now the focus of my bearish scenario.
BEAMXUSDT Perpetual — SHORT Setup
- Reference Price: $0.004669
- Take Profit: $0.003300
- Stop Loss: $0.006000
- Direction: SHORT
What I'm Watching
Buyers appear to be losing momentum, while a potential liquidity zone below could attract price if selling pressure increases.
The goal isn't to predict the exact top. It's to wait for evidence that the bullish move is weakening.
A sustained recovery above resistance would challenge this bearish outlook. The stop remains essential because a renewed rally could accelerate quickly.
Could $BEAMX fall toward $0.0033, or is another bullish breakout coming?
Share your analysis below and follow CryptoVision for more trading setups and market insights.
$BEAMX
255
·
--
Bullish
See translation
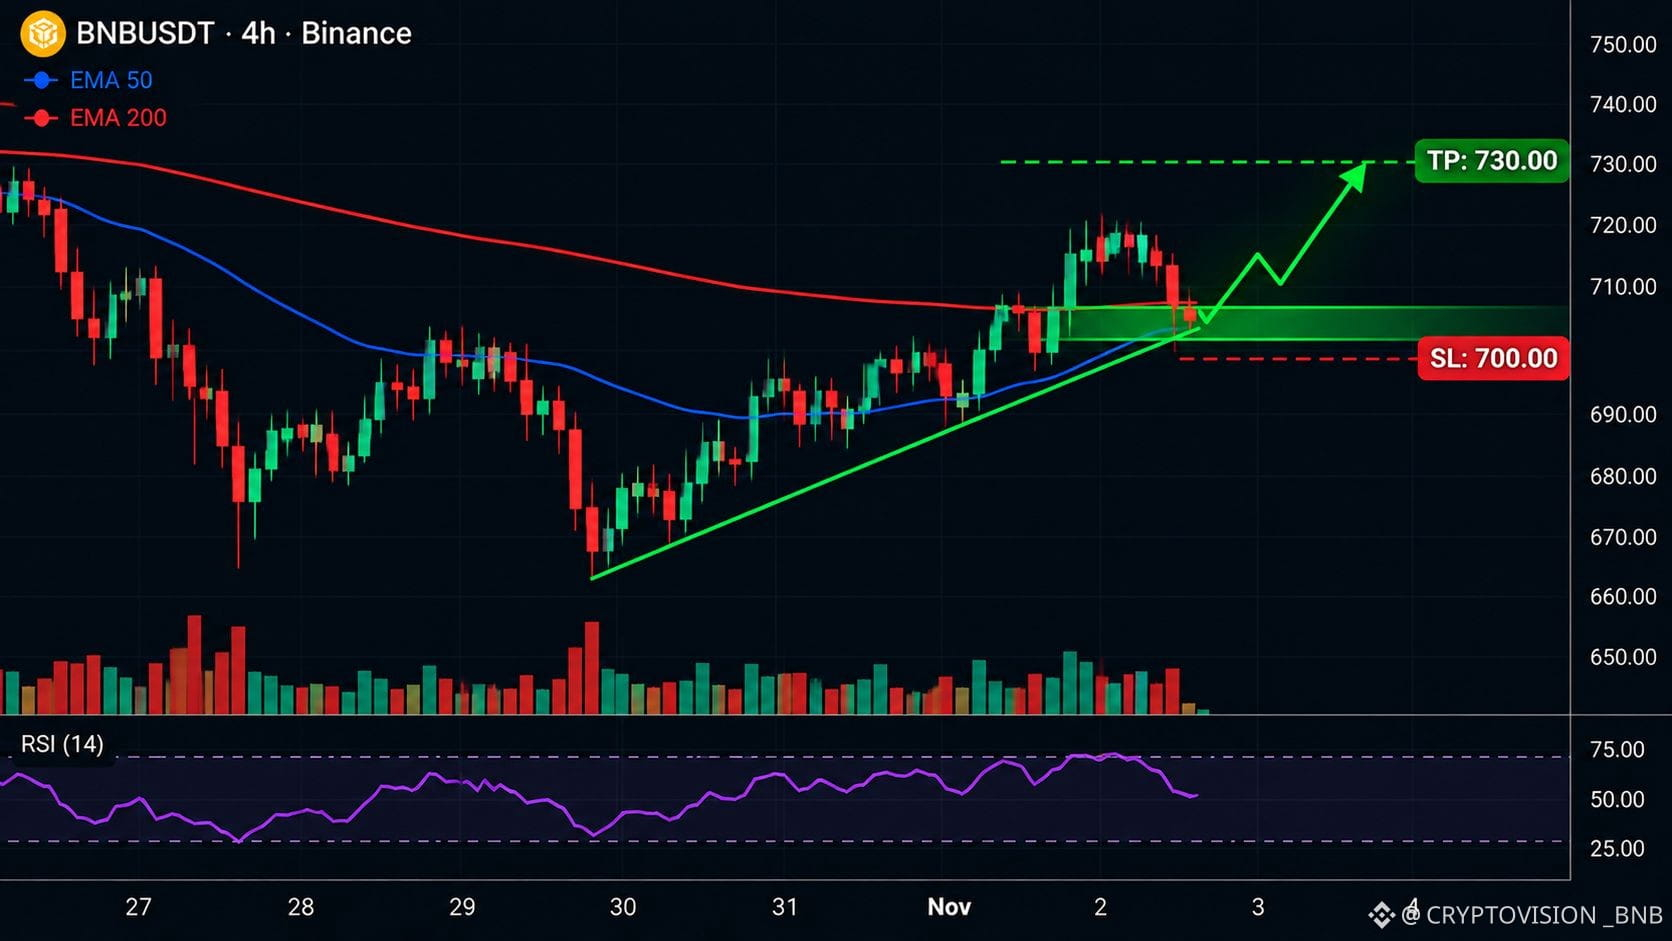
$BNB: Is Another Bullish Move Toward $730 Coming?
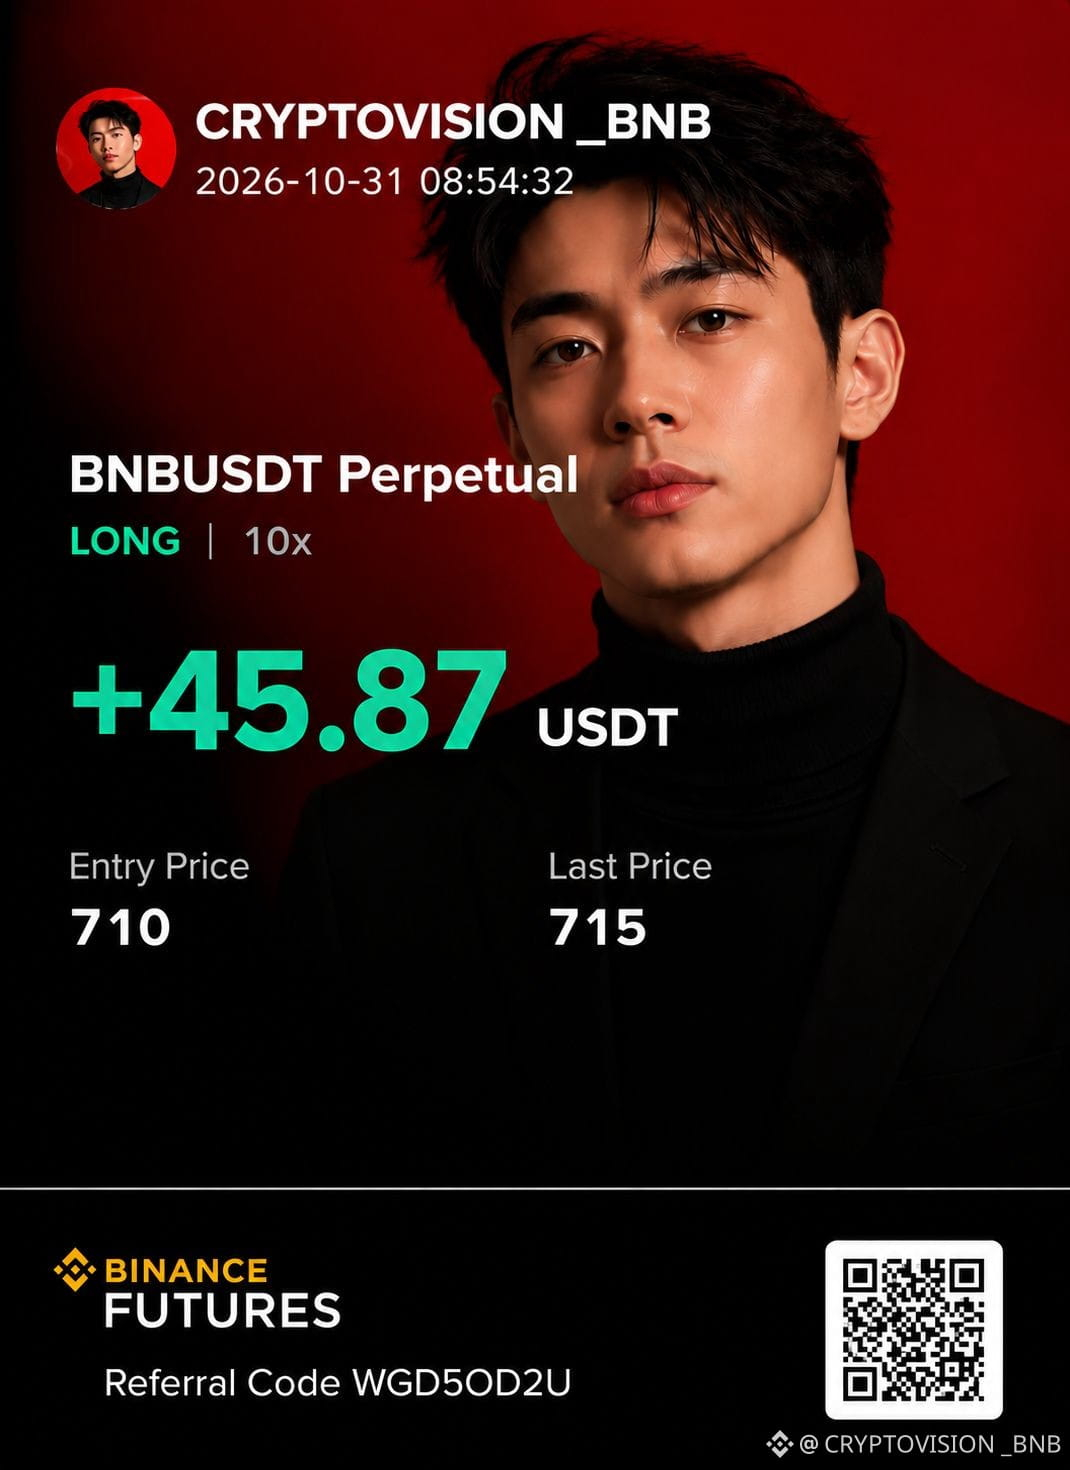
BNB is back on my watchlist for a potential LONG setup, with $730 as the upside target.
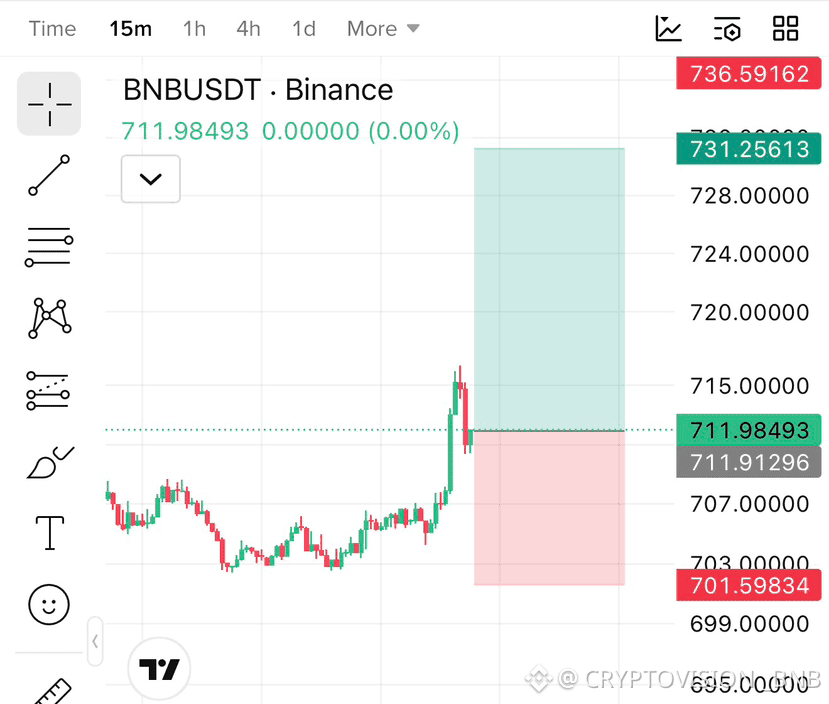
BNB/USDT — LONG Setup
- Direction: LONG
- Take Profit: $730
- Stop Loss: $700
- Entry: Wait for bullish confirmation
The key is whether buyers can maintain momentum and defend nearby support. A confirmed breakout could strengthen the bullish scenario, while a move below $700 would invalidate this trade plan.
Risk management matters: Avoid oversized positions, especially when using leverage. No setup guarantees a profit.
Do you think $BNB will reach $730, or will sellers take control first?
Share your outlook in the comments and follow CryptoVision for more trading setups and market analysis.
$BNB
{spot}(BNBUSDT)
$BNB : Is Another Bullish Move Toward $730 Coming?
BNB is back on my watchlist for a potential LONG setup, with $730 as the upside target.
BNB/USDT — LONG Setup
- Direction: LONG
- Take Profit: $730
- Stop Loss: $700
- Entry: Wait for bullish confirmation
The key is whether buyers can maintain momentum and defend nearby support. A confirmed breakout could strengthen the bullish scenario, while a move below $700 would invalidate this trade plan.
Risk management matters: Avoid oversized positions, especially when using leverage. No setup guarantees a profit.
Do you think $BNB will reach $730, or will sellers take control first?
Share your outlook in the comments and follow CryptoVision for more trading setups and market analysis.
$BNB
BNB is back on my watchlist for a potential LONG setup, with $730 as the upside target.
BNB/USDT — LONG Setup
- Direction: LONG
- Take Profit: $730
- Stop Loss: $700
- Entry: Wait for bullish confirmation
The key is whether buyers can maintain momentum and defend nearby support. A confirmed breakout could strengthen the bullish scenario, while a move below $700 would invalidate this trade plan.
Risk management matters: Avoid oversized positions, especially when using leverage. No setup guarantees a profit.
Do you think $BNB will reach $730, or will sellers take control first?
Share your outlook in the comments and follow CryptoVision for more trading setups and market analysis.
$BNB
85
·
--
Bullish
See translation
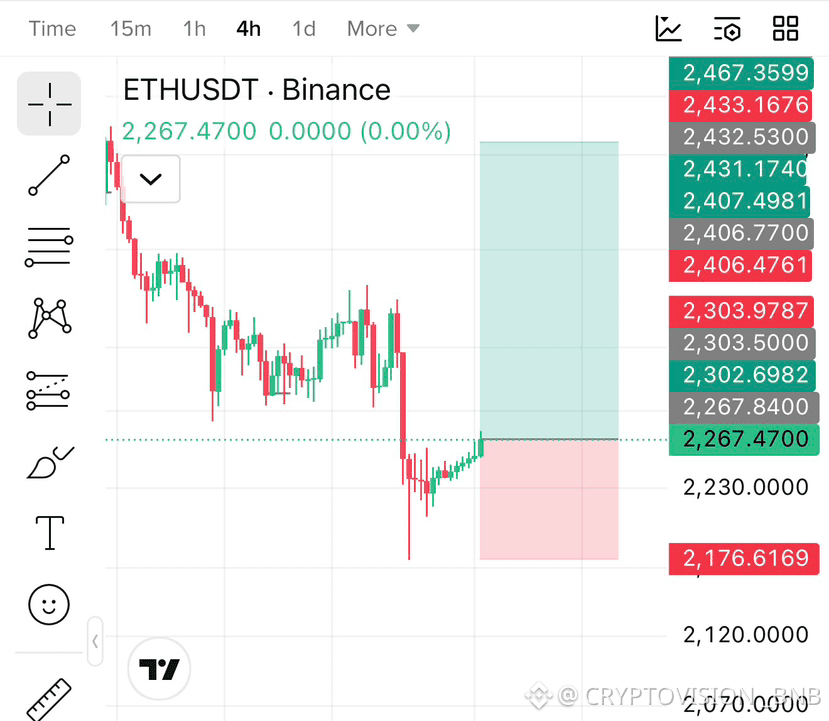
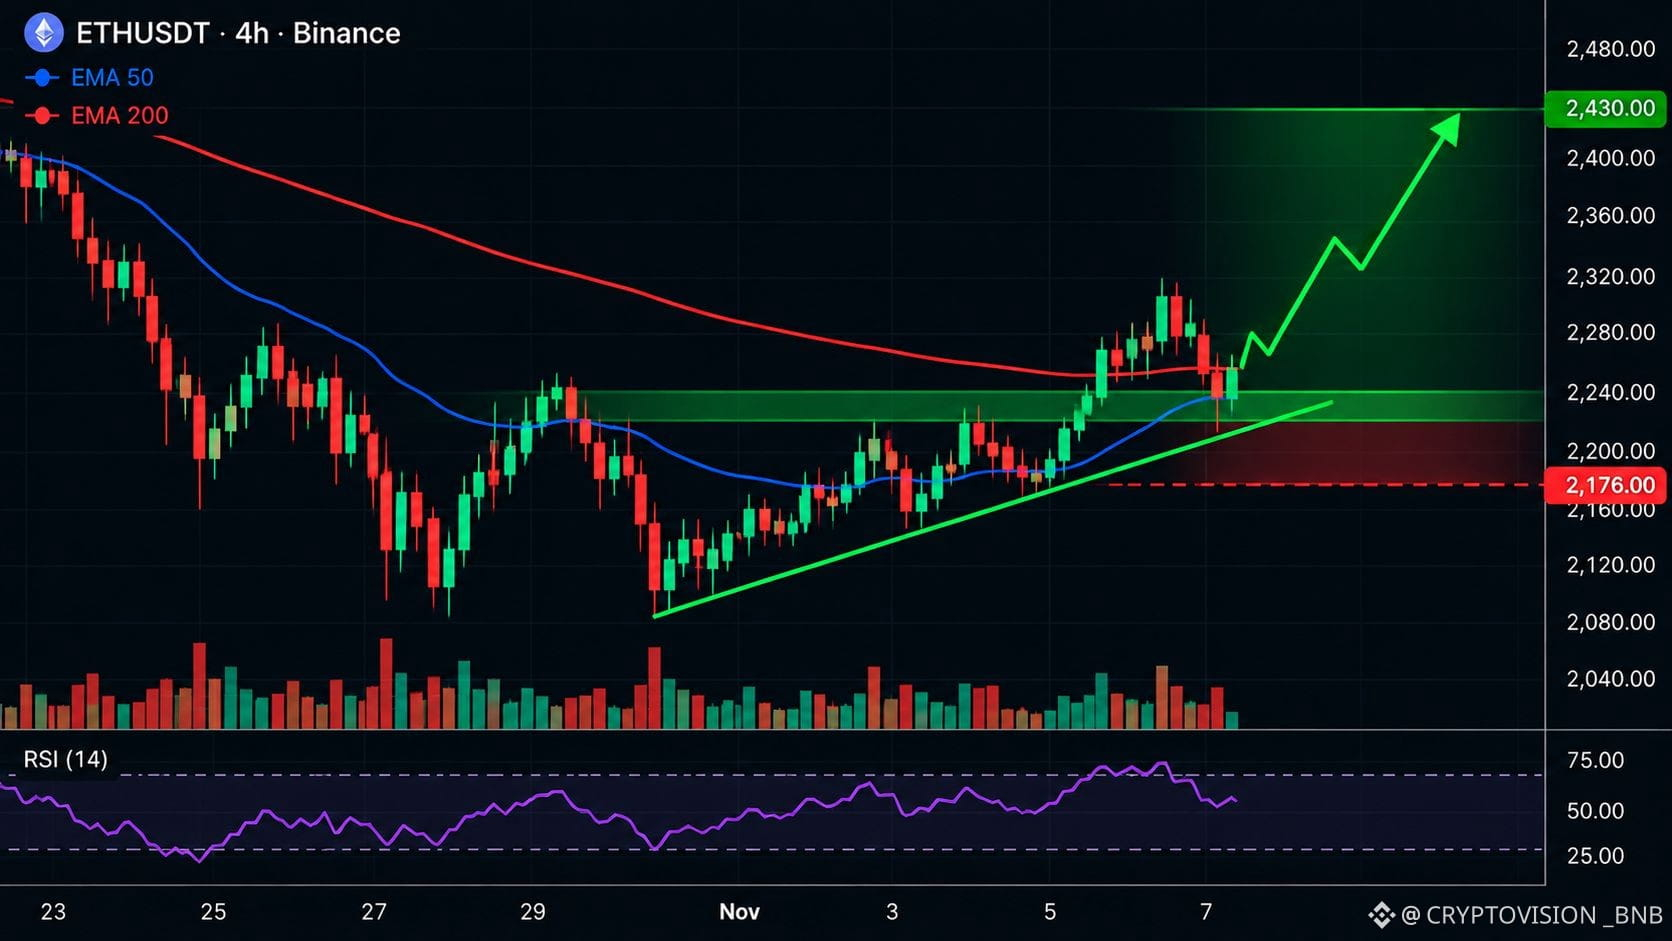
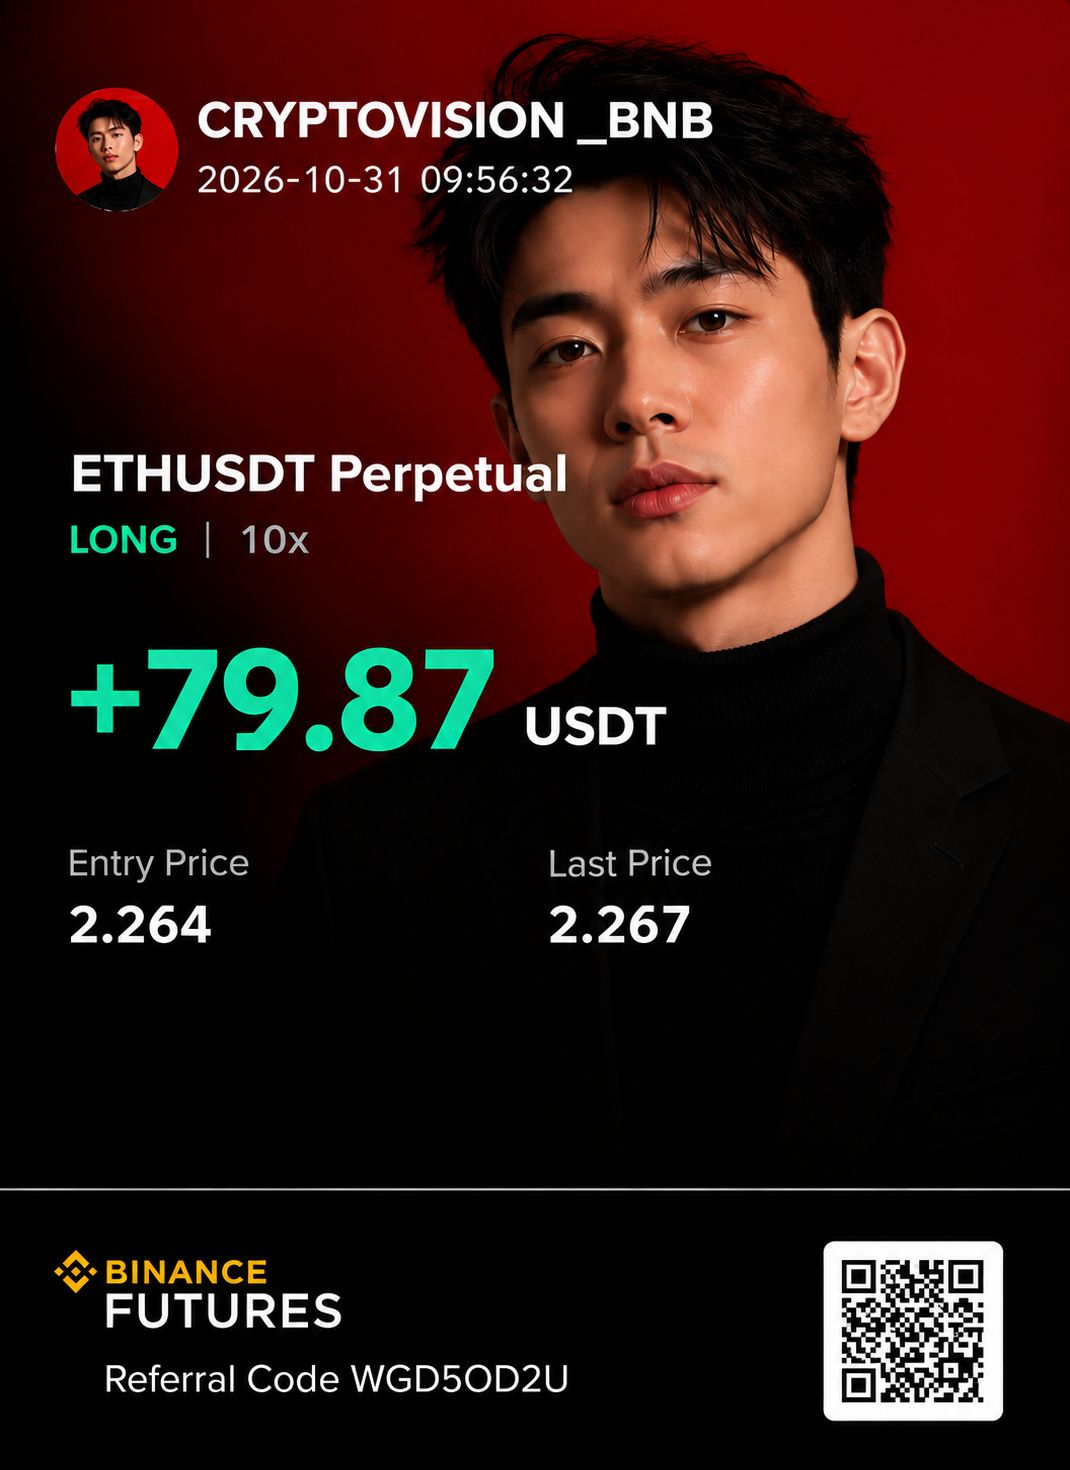
$ETH: Is Ethereum Preparing for Its Next Bullish Move?
Ethereum could be setting up for another LONG opportunity as buyers attempt to regain momentum.
ETH/USDT — Bullish Setup
- Direction: LONG
- Take Profit: $2,430
- Stop Loss: $2,176
- Entry: Wait for bullish confirmation
A sustained recovery above nearby resistance could strengthen the bullish scenario and open the door toward $2,430.
However, losing key support would weaken this setup. Position sizing and risk management remain essential.
Would you enter an ETH LONG now, or wait for a confirmed breakout?
Share your analysis below and follow CryptoVision for more trading setups and market updates.
$ETH
{spot}(ETHUSDT)
$ETH : Is Ethereum Preparing for Its Next Bullish Move?
Ethereum could be setting up for another LONG opportunity as buyers attempt to regain momentum.
ETH/USDT — Bullish Setup
- Direction: LONG
- Take Profit: $2,430
- Stop Loss: $2,176
- Entry: Wait for bullish confirmation
A sustained recovery above nearby resistance could strengthen the bullish scenario and open the door toward $2,430.
However, losing key support would weaken this setup. Position sizing and risk management remain essential.
Would you enter an ETH LONG now, or wait for a confirmed breakout?
Share your analysis below and follow CryptoVision for more trading setups and market updates.
$ETH
Ethereum could be setting up for another LONG opportunity as buyers attempt to regain momentum.
ETH/USDT — Bullish Setup
- Direction: LONG
- Take Profit: $2,430
- Stop Loss: $2,176
- Entry: Wait for bullish confirmation
A sustained recovery above nearby resistance could strengthen the bullish scenario and open the door toward $2,430.
However, losing key support would weaken this setup. Position sizing and risk management remain essential.
Would you enter an ETH LONG now, or wait for a confirmed breakout?
Share your analysis below and follow CryptoVision for more trading setups and market updates.
$ETH
45
See translation
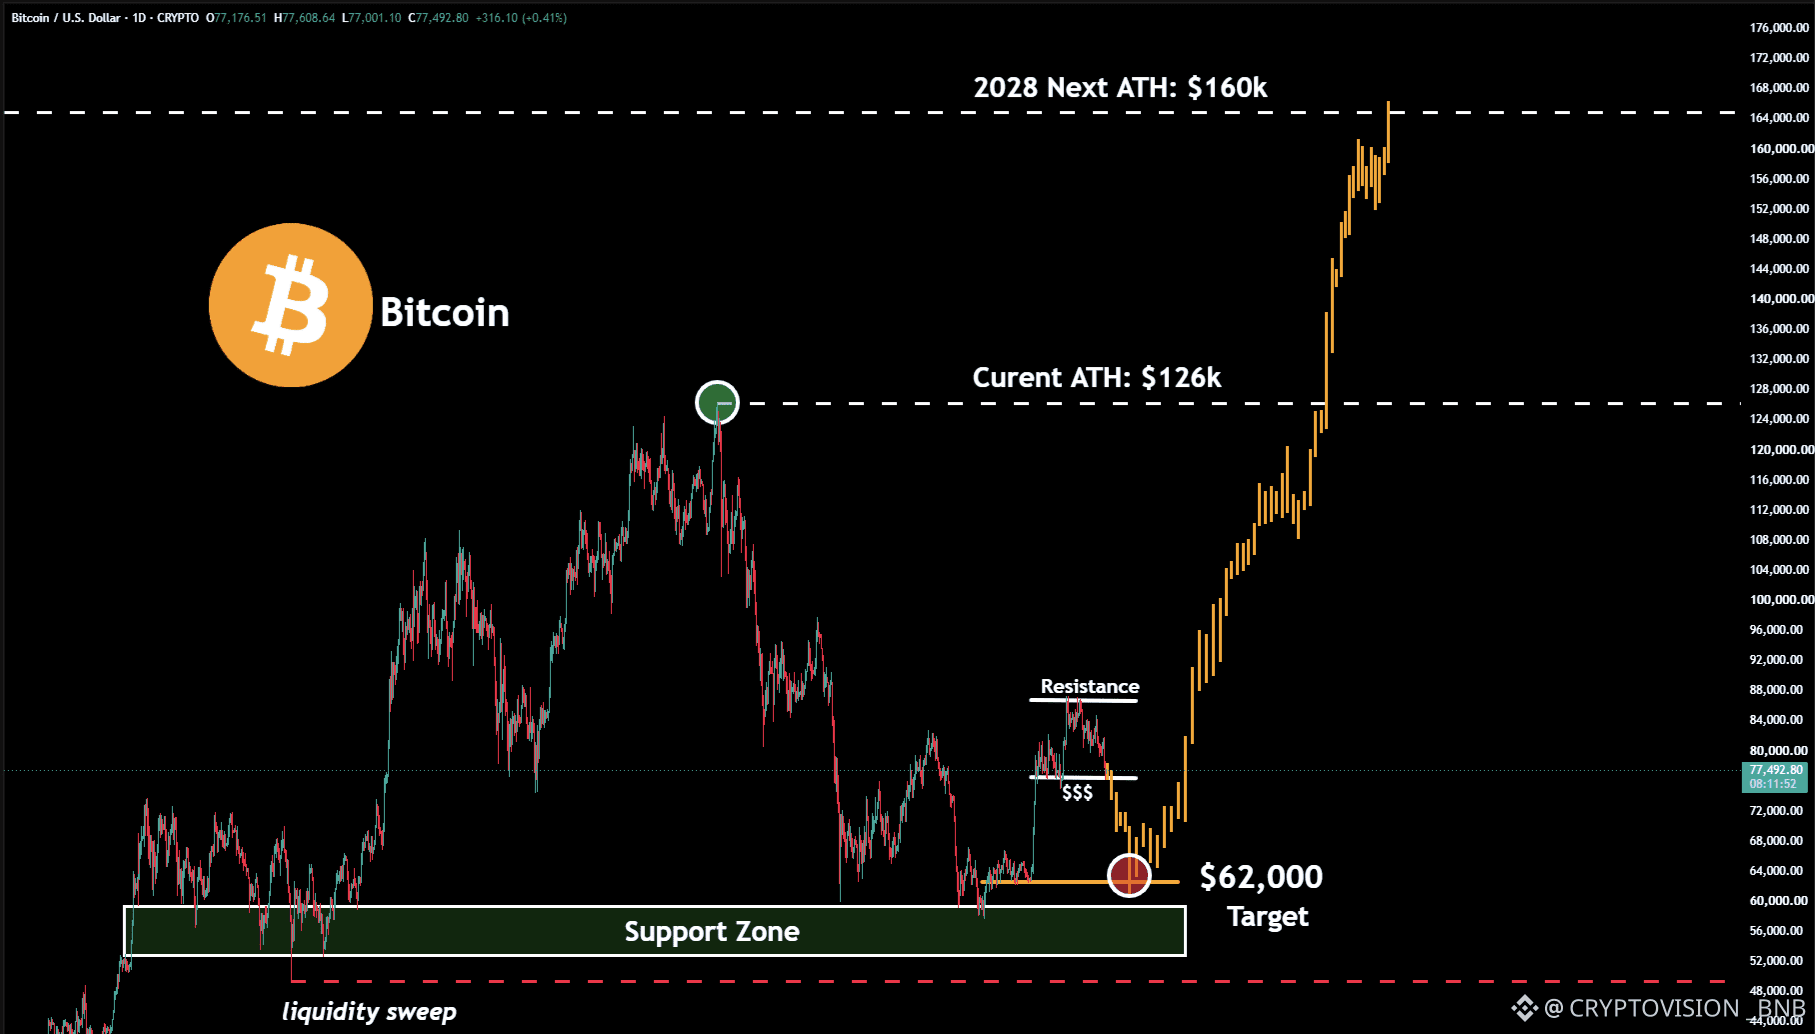
$BTC: Could Bitcoin Drop to $61,000 Next Week?
Bitcoin's recent relief rally could be losing momentum, and a deeper correction remains a scenario worth watching.
My bearish roadmap:
$77,000 → $72,000 → $67,000 → $61,000
If BTC fails to reclaim key resistance levels and selling pressure accelerates, these downside zones could come into focus.
A move toward $61K would represent a significant correction, potentially setting the stage for a future recovery. However, neither the timing nor the bottom is confirmed.
The key is to watch price confirmation, not chase short-term rebounds.
Save this analysis and revisit it next week.
Do you think Bitcoin will reach $61,000, or will buyers defend $72,000 first?
Follow CryptoVision for more BTC market analysis and technical updates.
$BTC
{spot}(BTCUSDT)
$BTC : Could Bitcoin Drop to $61,000 Next Week?
Bitcoin's recent relief rally could be losing momentum, and a deeper correction remains a scenario worth watching.
My bearish roadmap:
$77,000 → $72,000 → $67,000 → $61,000
If BTC fails to reclaim key resistance levels and selling pressure accelerates, these downside zones could come into focus.
A move toward $61K would represent a significant correction, potentially setting the stage for a future recovery. However, neither the timing nor the bottom is confirmed.
The key is to watch price confirmation, not chase short-term rebounds.
Save this analysis and revisit it next week.
Do you think Bitcoin will reach $61,000, or will buyers defend $72,000 first?
Follow CryptoVision for more BTC market analysis and technical updates.
$BTC
Bitcoin's recent relief rally could be losing momentum, and a deeper correction remains a scenario worth watching.
My bearish roadmap:
$77,000 → $72,000 → $67,000 → $61,000
If BTC fails to reclaim key resistance levels and selling pressure accelerates, these downside zones could come into focus.
A move toward $61K would represent a significant correction, potentially setting the stage for a future recovery. However, neither the timing nor the bottom is confirmed.
The key is to watch price confirmation, not chase short-term rebounds.
Save this analysis and revisit it next week.
Do you think Bitcoin will reach $61,000, or will buyers defend $72,000 first?
Follow CryptoVision for more BTC market analysis and technical updates.
$BTC
1
379
See translation
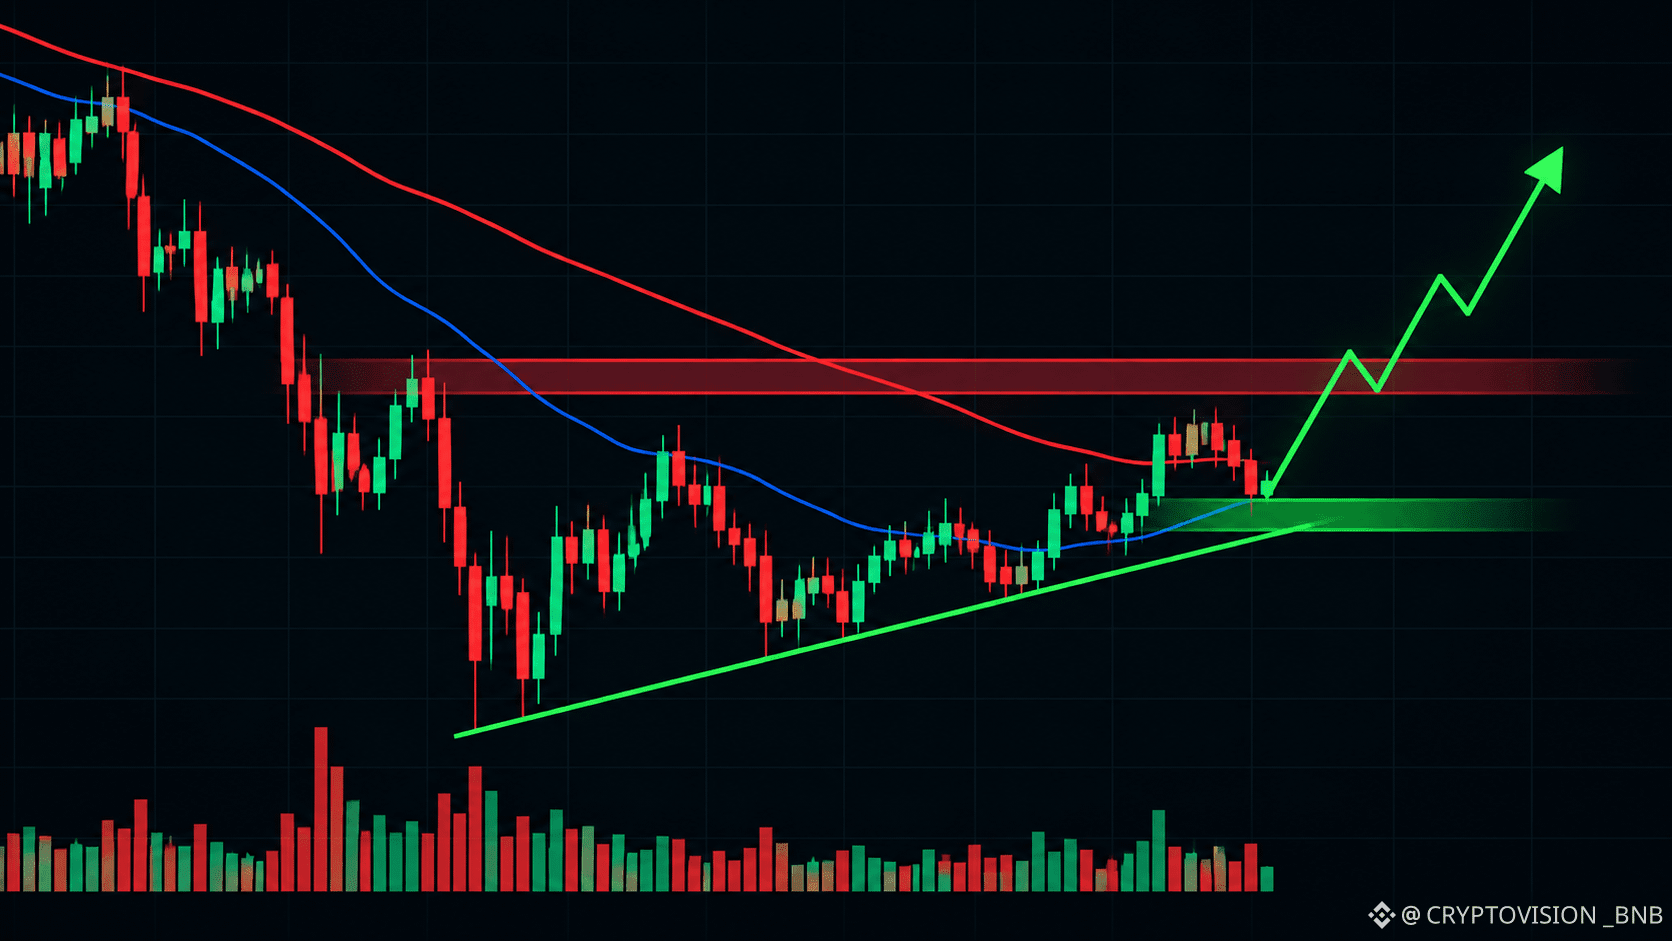
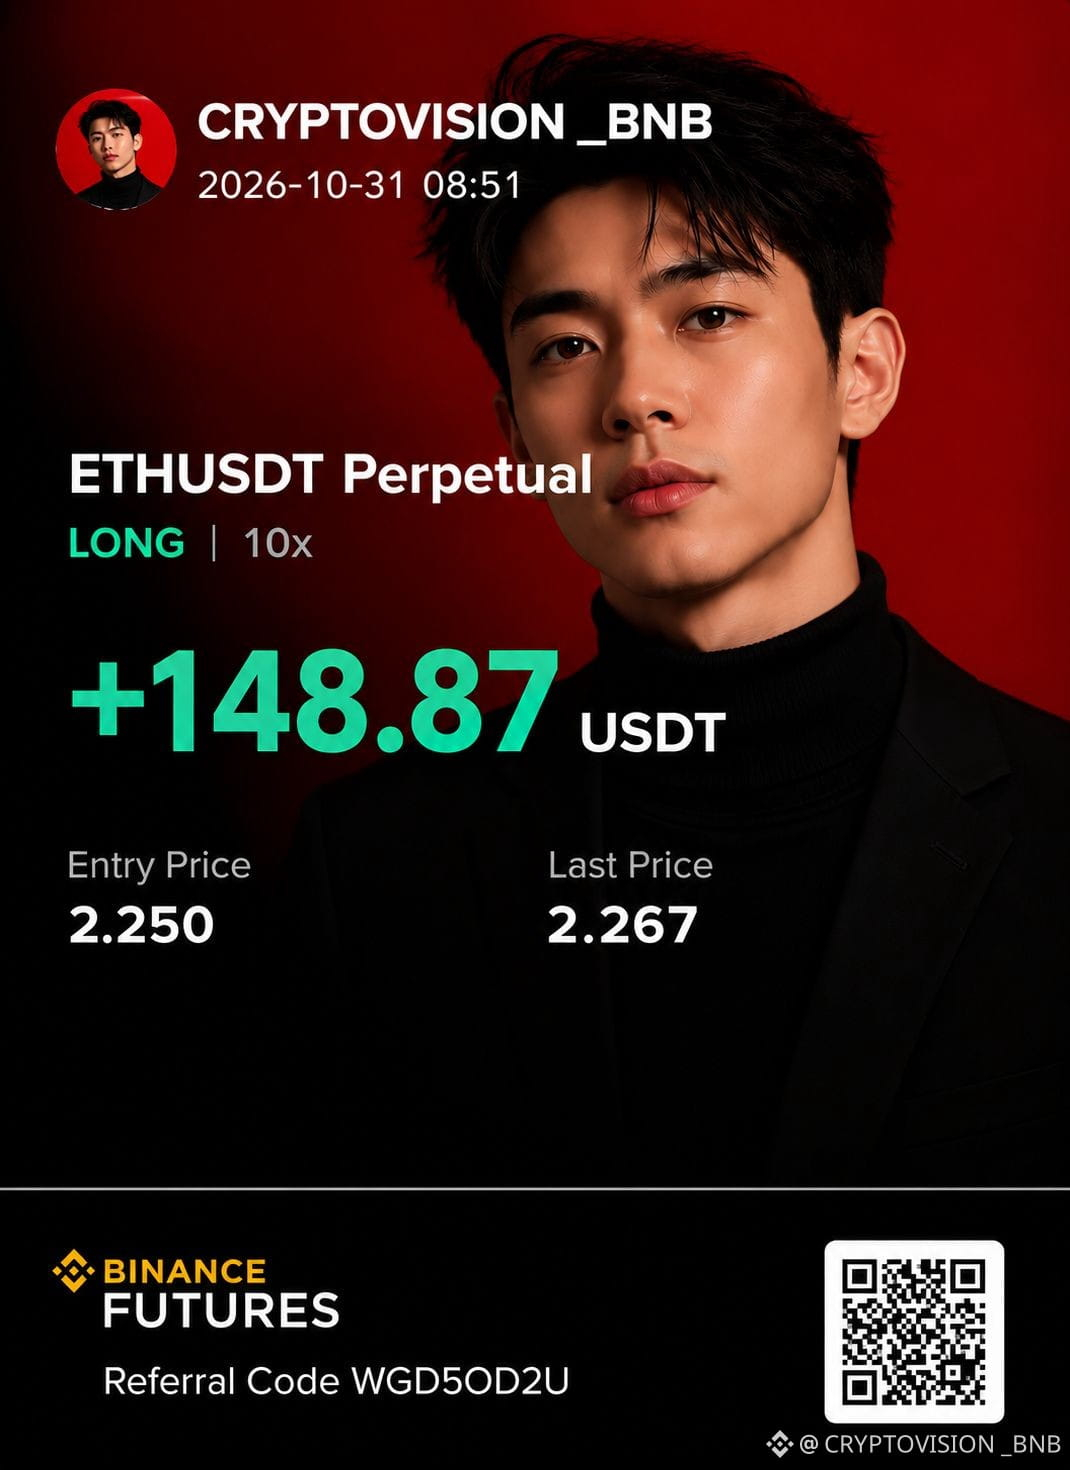
$ETH: Bullish Momentum Is Building, but There's a Catch
Ethereum is showing signs of short-term strength, yet the 4H trend remains bearish. That makes this potential LONG setup interesting, but not without risk.
ETH/USDT — LONG Setup
- Entry: $2,267.04–$2,268.64
- TP1: $2,275.09
- TP2: $2,286.58
- TP3: $2,303.83
- Stop Loss: $2,234.85
- Confidence: Moderate
Why I'm watching this trade:
The 1H RSI at 55.7 suggests buyers have a slight momentum advantage, while ETH's reported 0.65 correlation with BTC supports the bullish thesis.
However, only 3 of 12 signals align, with 2 opposing the trade. The bearish 4H structure remains a significant warning.
My plan: Take 50% profit at TP1, 25% at TP2, and 25% at TP3. Consider moving the stop to breakeven after TP1.
Small position size. Defined risk. No chasing candles.
Would you take this ETH LONG or wait for the 4H trend to turn bullish?
Share your view and follow CryptoVision for more trading setups and market analysis.
$ETH
{spot}(ETHUSDT)
$ETH : Bullish Momentum Is Building, but There's a Catch
Ethereum is showing signs of short-term strength, yet the 4H trend remains bearish. That makes this potential LONG setup interesting, but not without risk.
ETH/USDT — LONG Setup
- Entry: $2,267.04–$2,268.64
- TP1: $2,275.09
- TP2: $2,286.58
- TP3: $2,303.83
- Stop Loss: $2,234.85
- Confidence: Moderate
Why I'm watching this trade:
The 1H RSI at 55.7 suggests buyers have a slight momentum advantage, while ETH's reported 0.65 correlation with BTC supports the bullish thesis.
However, only 3 of 12 signals align, with 2 opposing the trade. The bearish 4H structure remains a significant warning.
My plan: Take 50% profit at TP1, 25% at TP2, and 25% at TP3. Consider moving the stop to breakeven after TP1.
Small position size. Defined risk. No chasing candles.
Would you take this ETH LONG or wait for the 4H trend to turn bullish?
Share your view and follow CryptoVision for more trading setups and market analysis.
$ETH
Ethereum is showing signs of short-term strength, yet the 4H trend remains bearish. That makes this potential LONG setup interesting, but not without risk.
ETH/USDT — LONG Setup
- Entry: $2,267.04–$2,268.64
- TP1: $2,275.09
- TP2: $2,286.58
- TP3: $2,303.83
- Stop Loss: $2,234.85
- Confidence: Moderate
Why I'm watching this trade:
The 1H RSI at 55.7 suggests buyers have a slight momentum advantage, while ETH's reported 0.65 correlation with BTC supports the bullish thesis.
However, only 3 of 12 signals align, with 2 opposing the trade. The bearish 4H structure remains a significant warning.
My plan: Take 50% profit at TP1, 25% at TP2, and 25% at TP3. Consider moving the stop to breakeven after TP1.
Small position size. Defined risk. No chasing candles.
Would you take this ETH LONG or wait for the 4H trend to turn bullish?
Share your view and follow CryptoVision for more trading setups and market analysis.
$ETH
55
See translation
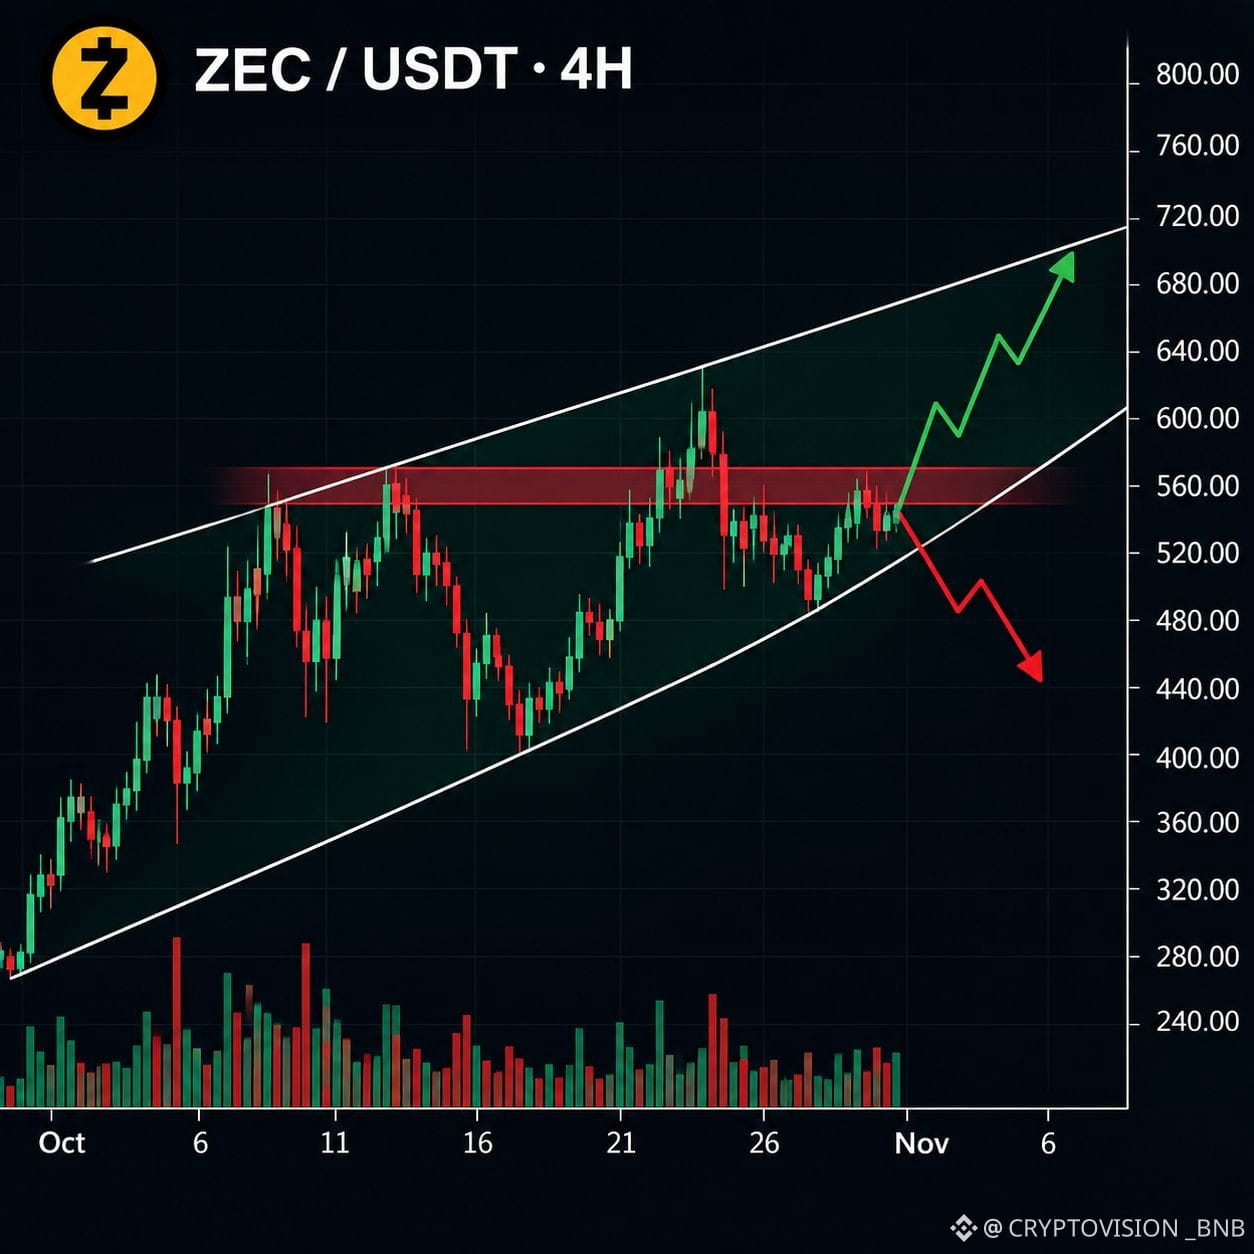
$ZEC: A Rising Wedge That Could Trap Both Bulls and Bears
Zcash is one of the most unpredictable assets in crypto. Sharp liquidity sweeps, aggressive wicks, and failed breakouts make traditional technical analysis particularly challenging.
Right now, I'm watching a larger rising wedge structure, with the 4H chart showing price struggling around a key resistance zone.
What matters most:
- Rising wedge structure remains in focus.
- Significant resistance and supply overhead.
- Extreme volatility and frequent liquidity sweeps.
- No confirmed bullish breakout yet.
The key takeaway: A strong green candle doesn't automatically mean a bullish breakout.
Until ZEC shows clear acceptance above resistance and sustained buying pressure, I'm cautious about chasing upside moves.
The bigger structure matters more than any single 10–20% rally.
Do you think $ZEC will break above resistance or reject and move toward the lower wedge boundary?
Share your analysis below.
Follow CryptoVision for more technical breakdowns, market insights, and trading setups.
$ZEC
{spot}(ZECUSDT)
$ZEC : A Rising Wedge That Could Trap Both Bulls and Bears
Zcash is one of the most unpredictable assets in crypto. Sharp liquidity sweeps, aggressive wicks, and failed breakouts make traditional technical analysis particularly challenging.
Right now, I'm watching a larger rising wedge structure, with the 4H chart showing price struggling around a key resistance zone.
What matters most:
- Rising wedge structure remains in focus.
- Significant resistance and supply overhead.
- Extreme volatility and frequent liquidity sweeps.
- No confirmed bullish breakout yet.
The key takeaway: A strong green candle doesn't automatically mean a bullish breakout.
Until ZEC shows clear acceptance above resistance and sustained buying pressure, I'm cautious about chasing upside moves.
The bigger structure matters more than any single 10–20% rally.
Do you think $ZEC will break above resistance or reject and move toward the lower wedge boundary?
Share your analysis below.
Follow CryptoVision for more technical breakdowns, market insights, and trading setups.
$ZEC
Zcash is one of the most unpredictable assets in crypto. Sharp liquidity sweeps, aggressive wicks, and failed breakouts make traditional technical analysis particularly challenging.
Right now, I'm watching a larger rising wedge structure, with the 4H chart showing price struggling around a key resistance zone.
What matters most:
- Rising wedge structure remains in focus.
- Significant resistance and supply overhead.
- Extreme volatility and frequent liquidity sweeps.
- No confirmed bullish breakout yet.
The key takeaway: A strong green candle doesn't automatically mean a bullish breakout.
Until ZEC shows clear acceptance above resistance and sustained buying pressure, I'm cautious about chasing upside moves.
The bigger structure matters more than any single 10–20% rally.
Do you think $ZEC will break above resistance or reject and move toward the lower wedge boundary?
Share your analysis below.
Follow CryptoVision for more technical breakdowns, market insights, and trading setups.
$ZEC
6
1.3k
·
--
Bullish
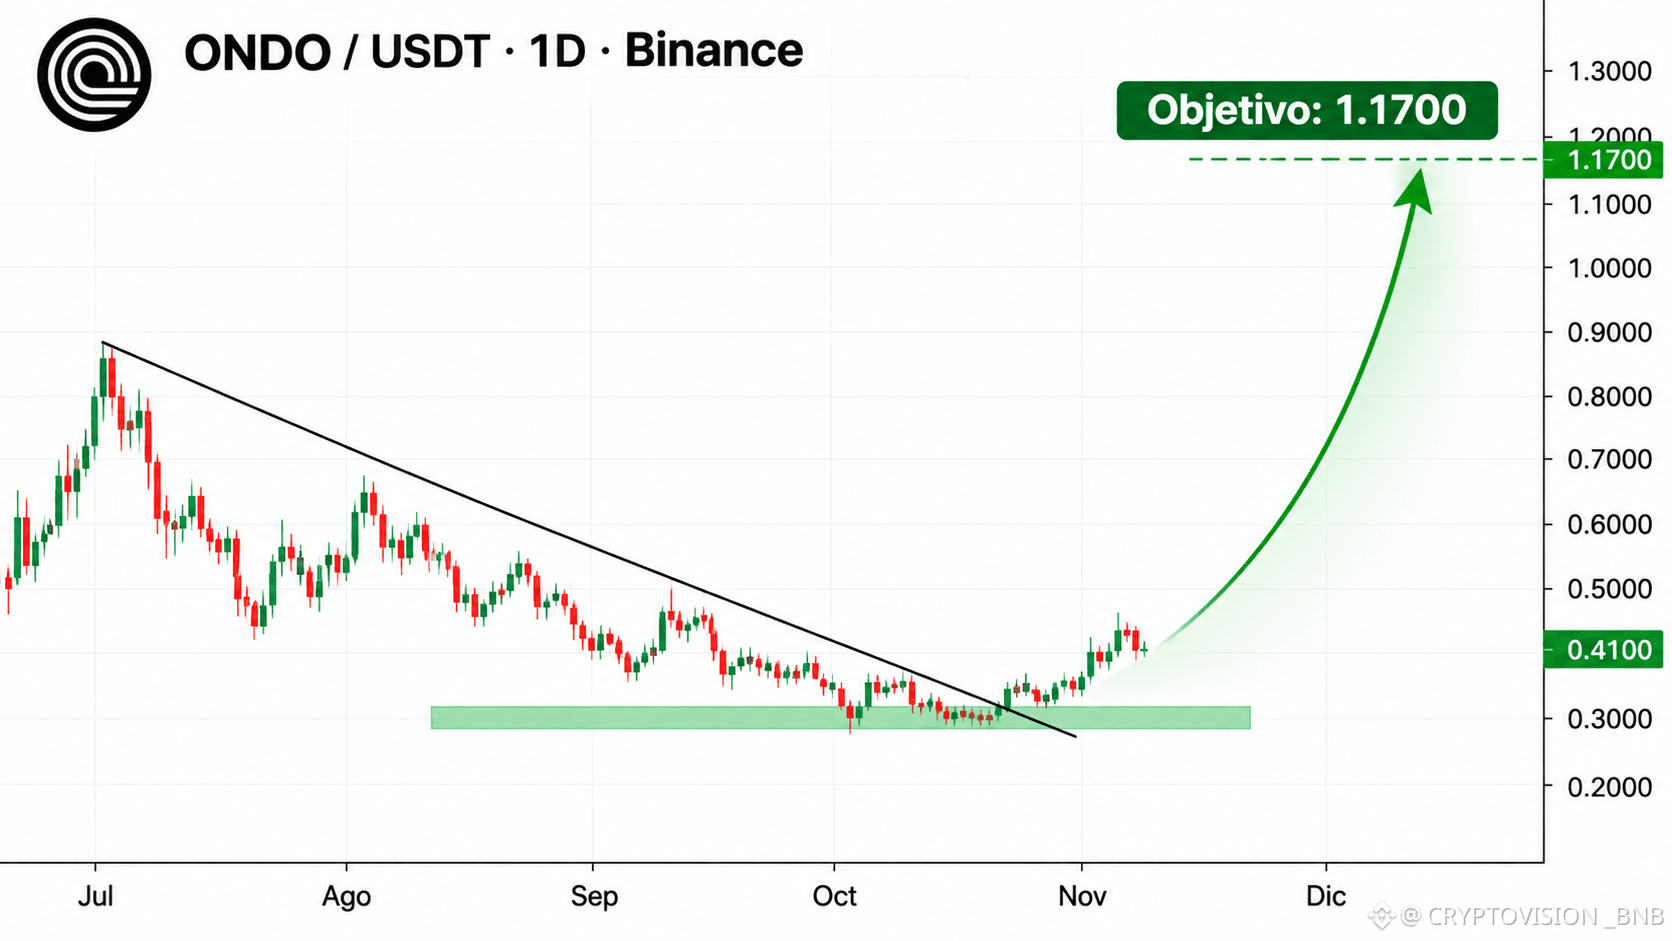
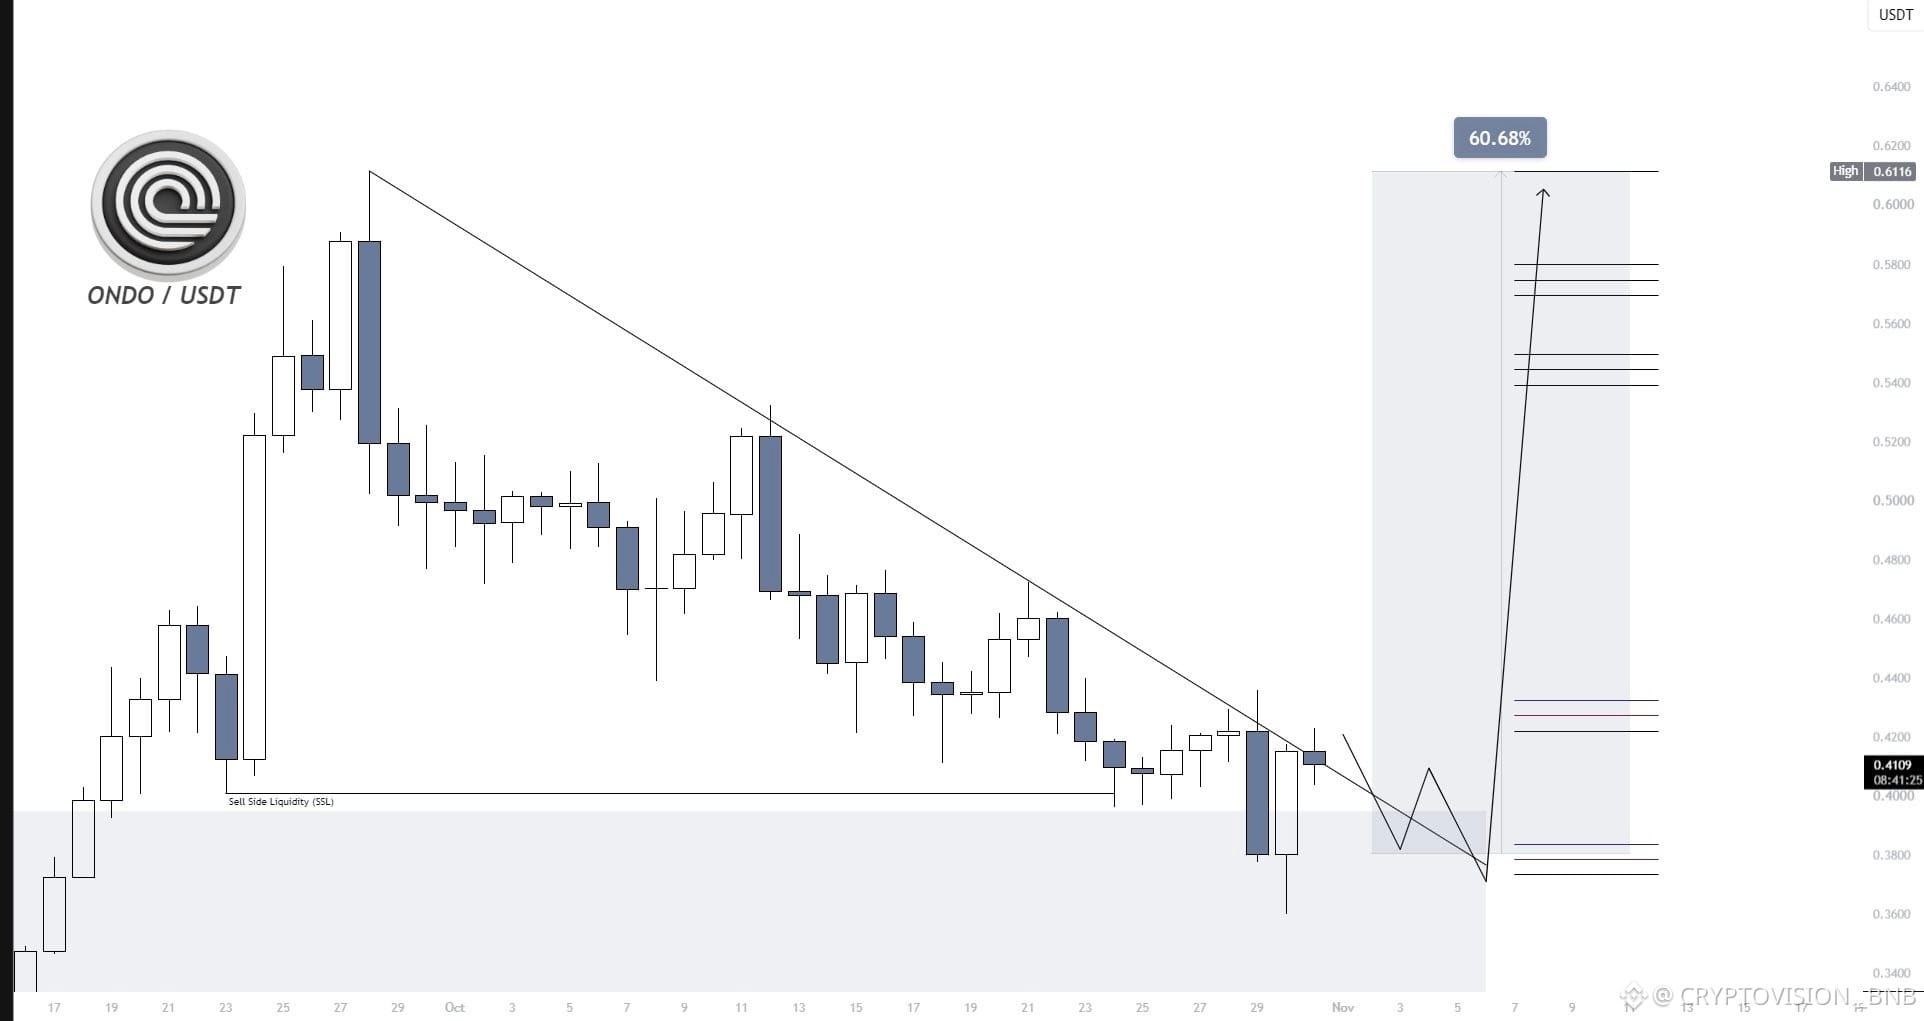
$ONDO: IS IT GETTING READY FOR A MOVE TOWARD $1.17?
The second limit order at $0.3781 has been executed, according to this strategy’s tracking.
ONDO is trading above $0.4100 in the shared scenario, an interesting sign of a buyer-led recovery.
My bullish outlook:
- Second entry: $0.3781
- Reference level: $0.4100
- Main target: $1.1700
From the second entry to the stated target, the upside potential would be approximately 209%, excluding fees. This is a projection, not a guaranteed gain.
The key will be to maintain a bullish structure and manage risk along the way.
Do you think $ONDO can reach $1.17, or does it need to consolidate first?
Comment with your target for ONDO and follow my posts for upcoming signals and updates.
$ONDO
{spot}(ONDOUSDT)
$ONDO : IS IT GETTING READY FOR A MOVE TOWARD $1.17?
The second limit order at $0.3781 has been executed, according to this strategy’s tracking.
ONDO is trading above $0.4100 in the shared scenario, an interesting sign of a buyer-led recovery.
My bullish outlook:
- Second entry: $0.3781
- Reference level: $0.4100
- Main target: $1.1700
From the second entry to the stated target, the upside potential would be approximately 209%, excluding fees. This is a projection, not a guaranteed gain.
The key will be to maintain a bullish structure and manage risk along the way.
Do you think $ONDO can reach $1.17, or does it need to consolidate first?
Comment with your target for ONDO and follow my posts for upcoming signals and updates.
$ONDO
The second limit order at $0.3781 has been executed, according to this strategy’s tracking.
ONDO is trading above $0.4100 in the shared scenario, an interesting sign of a buyer-led recovery.
My bullish outlook:
- Second entry: $0.3781
- Reference level: $0.4100
- Main target: $1.1700
From the second entry to the stated target, the upside potential would be approximately 209%, excluding fees. This is a projection, not a guaranteed gain.
The key will be to maintain a bullish structure and manage risk along the way.
Do you think $ONDO can reach $1.17, or does it need to consolidate first?
Comment with your target for ONDO and follow my posts for upcoming signals and updates.
$ONDO
226
·
--
Bearish
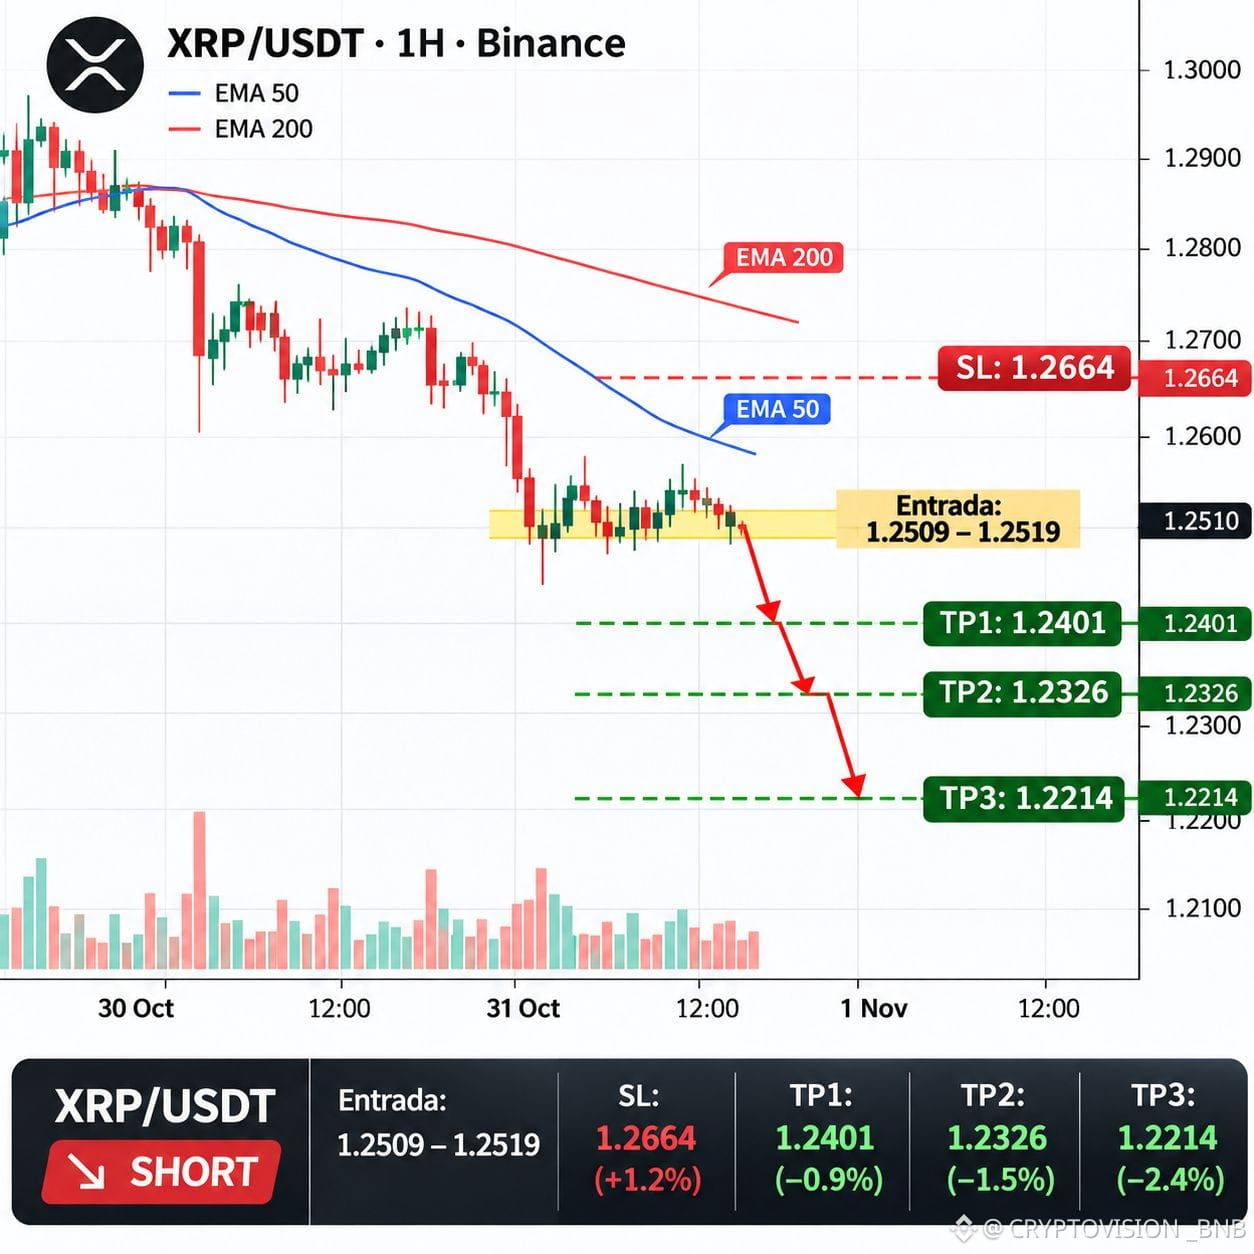
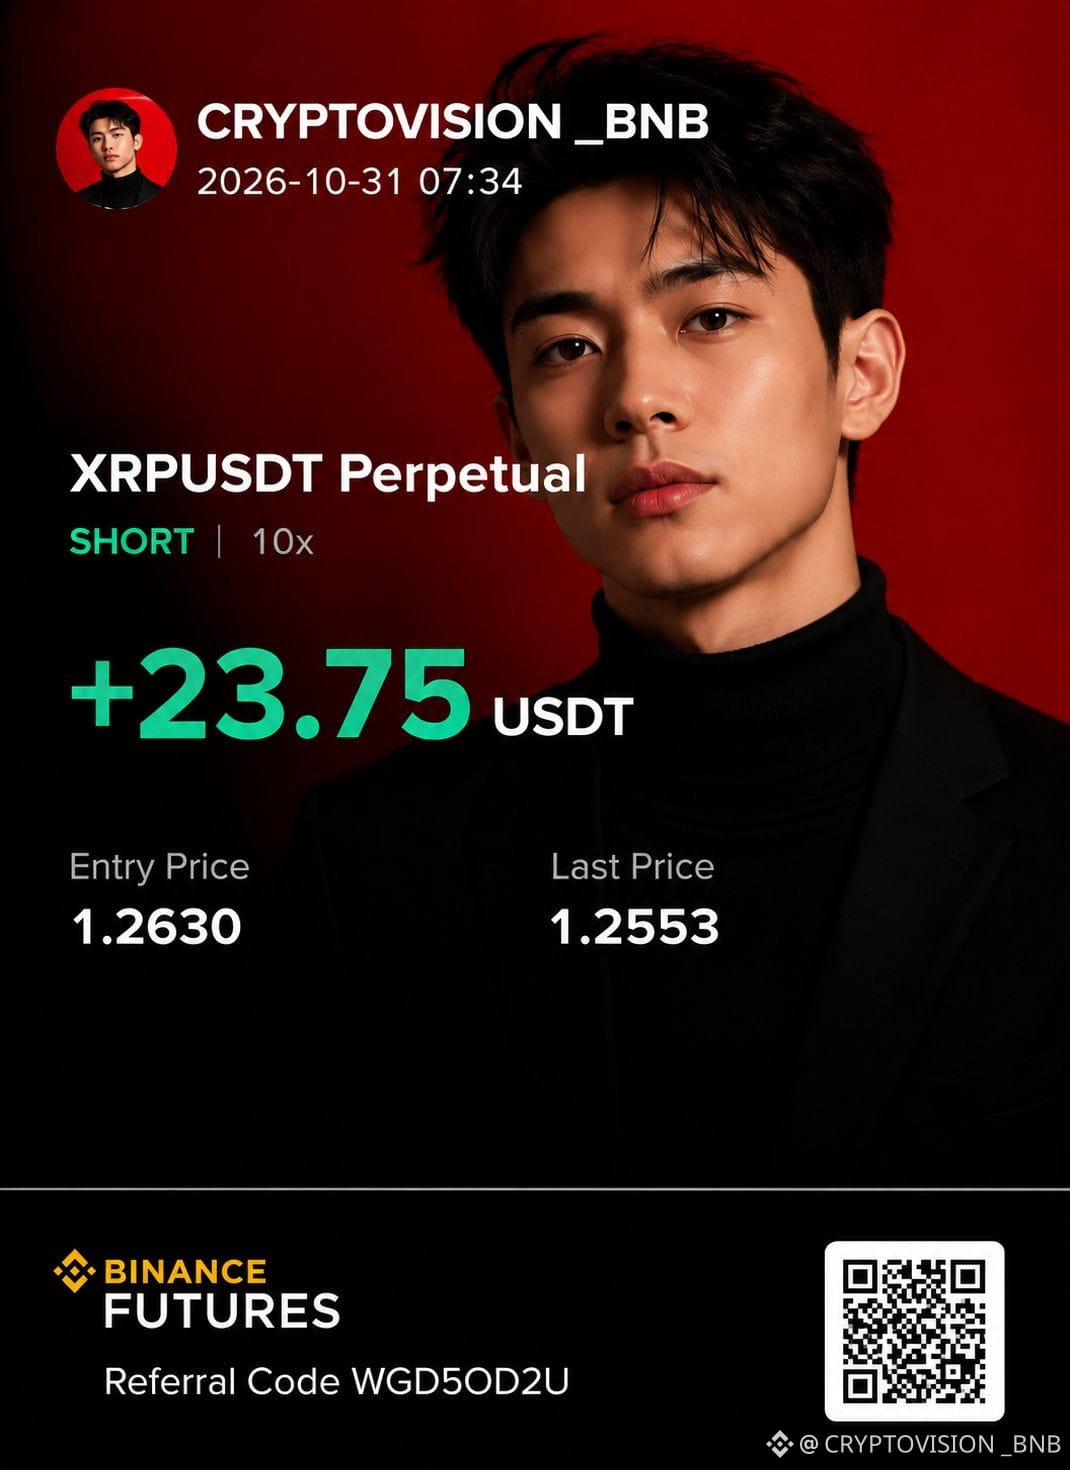
$XRP : IS A NEW DROP IN THE MAKING?
XRP shows a bearish structure on the 1H, 4H, and 1D timeframes, with the price below the EMA50 and EMA200, according to the analysis presented.
XRP/USDT — SHORT
- Entry: $1.2558–$1.2611
- TP1: $1.2401
- TP2: $1.2326
- TP3: $1.2214
- Stop Loss: $1.2664
- Conviction: moderate
My strategy: look for an entry only within the indicated zone, take partial profits of 50% at TP1, 25% at TP2, and 25% at TP3. After TP1, consider moving the stop to the entry price.
The 4H RSI at 40.5 reinforces the bearish hypothesis, although it does not guarantee a drop. A 1H close above $1.2664 would invalidate the scenario.
Would you enter a SHORT targeting $1.2214, or wait for further confirmation?
Share your analysis, follow my signals, and turn on notifications to learn about upcoming opportunities.
$XRP
{spot}(XRPUSDT)
$XRP : IS A NEW DROP IN THE MAKING?
XRP shows a bearish structure on the 1H, 4H, and 1D timeframes, with the price below the EMA50 and EMA200, according to the analysis presented.
XRP/USDT — SHORT
- Entry: $1.2558–$1.2611
- TP1: $1.2401
- TP2: $1.2326
- TP3: $1.2214
- Stop Loss: $1.2664
- Conviction: moderate
My strategy: look for an entry only within the indicated zone, take partial profits of 50% at TP1, 25% at TP2, and 25% at TP3. After TP1, consider moving the stop to the entry price.
The 4H RSI at 40.5 reinforces the bearish hypothesis, although it does not guarantee a drop. A 1H close above $1.2664 would invalidate the scenario.
Would you enter a SHORT targeting $1.2214, or wait for further confirmation?
Share your analysis, follow my signals, and turn on notifications to learn about upcoming opportunities.
$XRP
XRP shows a bearish structure on the 1H, 4H, and 1D timeframes, with the price below the EMA50 and EMA200, according to the analysis presented.
XRP/USDT — SHORT
- Entry: $1.2558–$1.2611
- TP1: $1.2401
- TP2: $1.2326
- TP3: $1.2214
- Stop Loss: $1.2664
- Conviction: moderate
My strategy: look for an entry only within the indicated zone, take partial profits of 50% at TP1, 25% at TP2, and 25% at TP3. After TP1, consider moving the stop to the entry price.
The 4H RSI at 40.5 reinforces the bearish hypothesis, although it does not guarantee a drop. A 1H close above $1.2664 would invalidate the scenario.
Would you enter a SHORT targeting $1.2214, or wait for further confirmation?
Share your analysis, follow my signals, and turn on notifications to learn about upcoming opportunities.
$XRP

152
·
--
Bearish
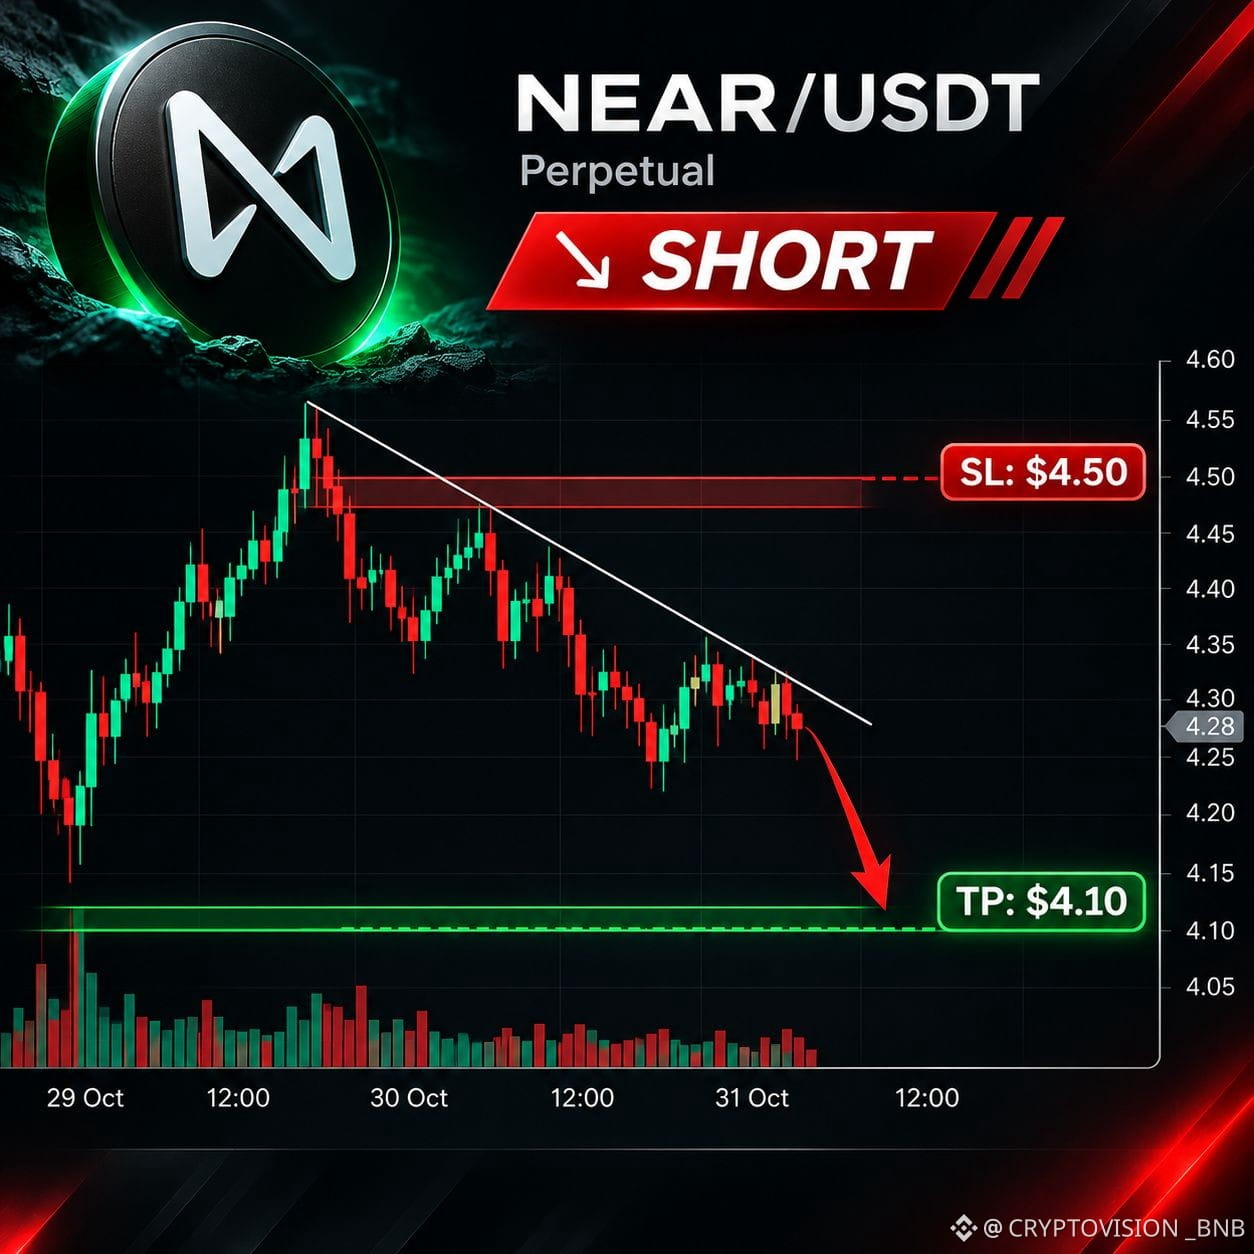
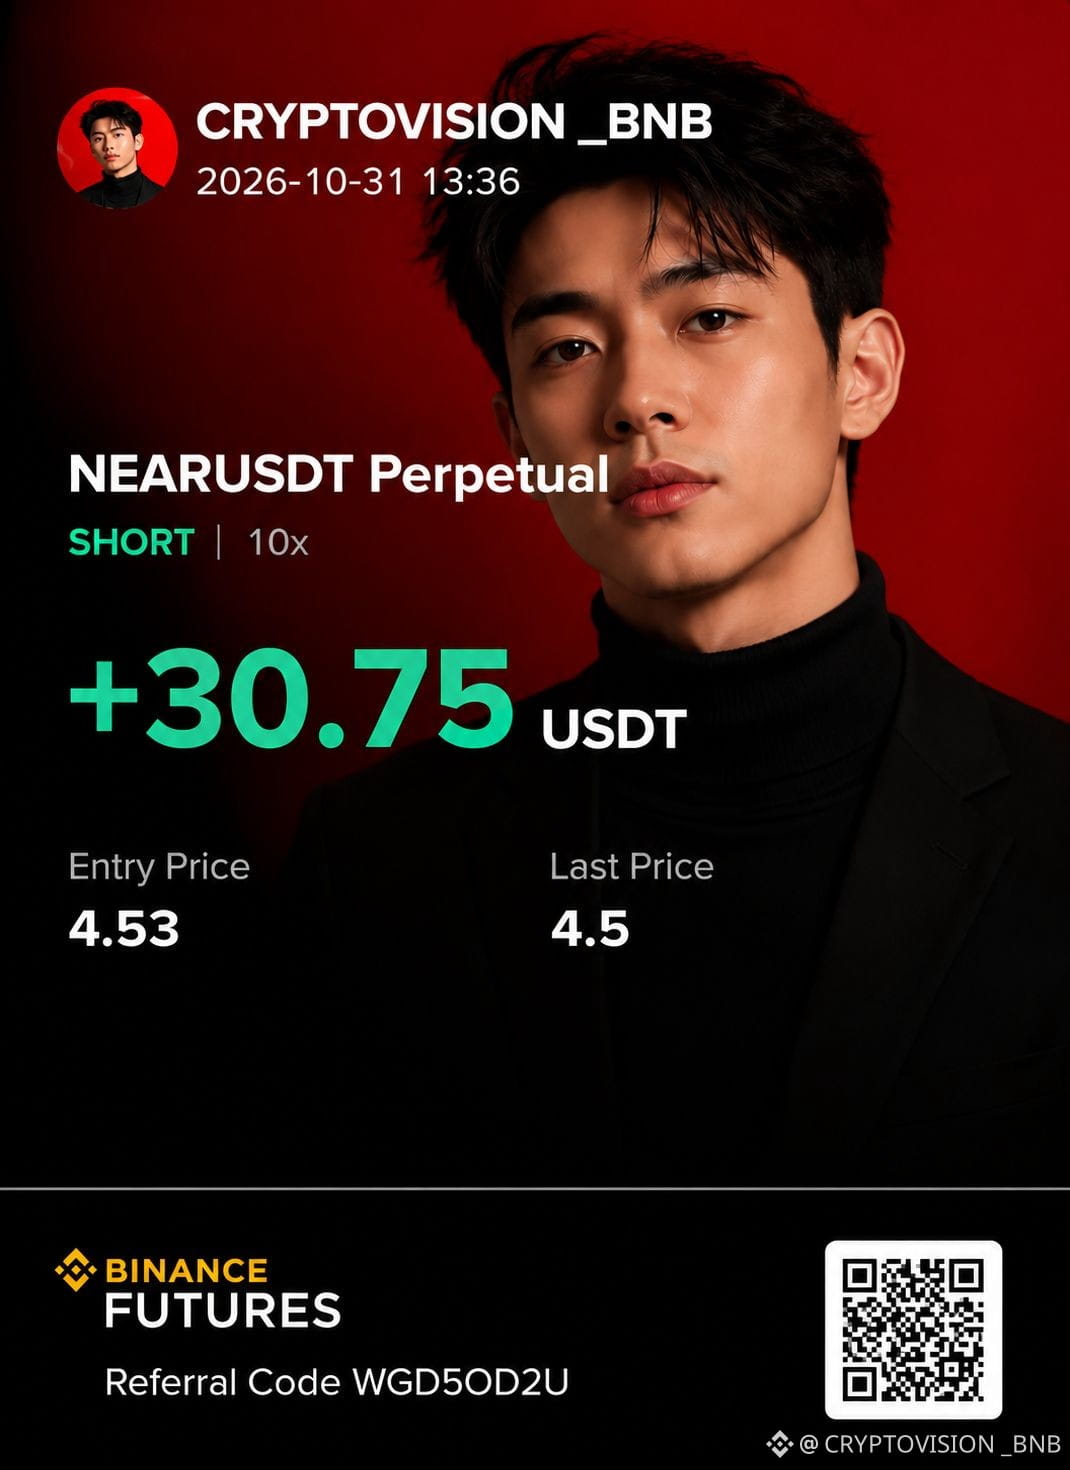
$NEAR: IS A CORRECTION TOWARD $4.10 IN THE WORKS?
NEAR is on my radar for a potential bearish trade. The key will be to confirm selling pressure before looking for an entry.
NEAR SHORT
- Take Profit: $4.10
- Stop Loss: $4.60
- Entry: awaiting confirmation
If sellers remain in control, we could see a move toward the target indicated.
What would you do: enter a SHORT or wait for better confirmation?
Share your analysis in the comments and follow my signals to learn about upcoming opportunities.
$NEAR
$NEAR : IS A CORRECTION TOWARD $4.10 IN THE WORKS?
NEAR is on my radar for a potential bearish trade. The key will be to confirm selling pressure before looking for an entry.
NEAR SHORT
- Take Profit: $4.10
- Stop Loss: $4.60
- Entry: awaiting confirmation
If sellers remain in control, we could see a move toward the target indicated.
What would you do: enter a SHORT or wait for better confirmation?
Share your analysis in the comments and follow my signals to learn about upcoming opportunities.
$NEAR
NEAR is on my radar for a potential bearish trade. The key will be to confirm selling pressure before looking for an entry.
NEAR SHORT
- Take Profit: $4.10
- Stop Loss: $4.60
- Entry: awaiting confirmation
If sellers remain in control, we could see a move toward the target indicated.
What would you do: enter a SHORT or wait for better confirmation?
Share your analysis in the comments and follow my signals to learn about upcoming opportunities.
$NEAR
170
·
--
Bullish
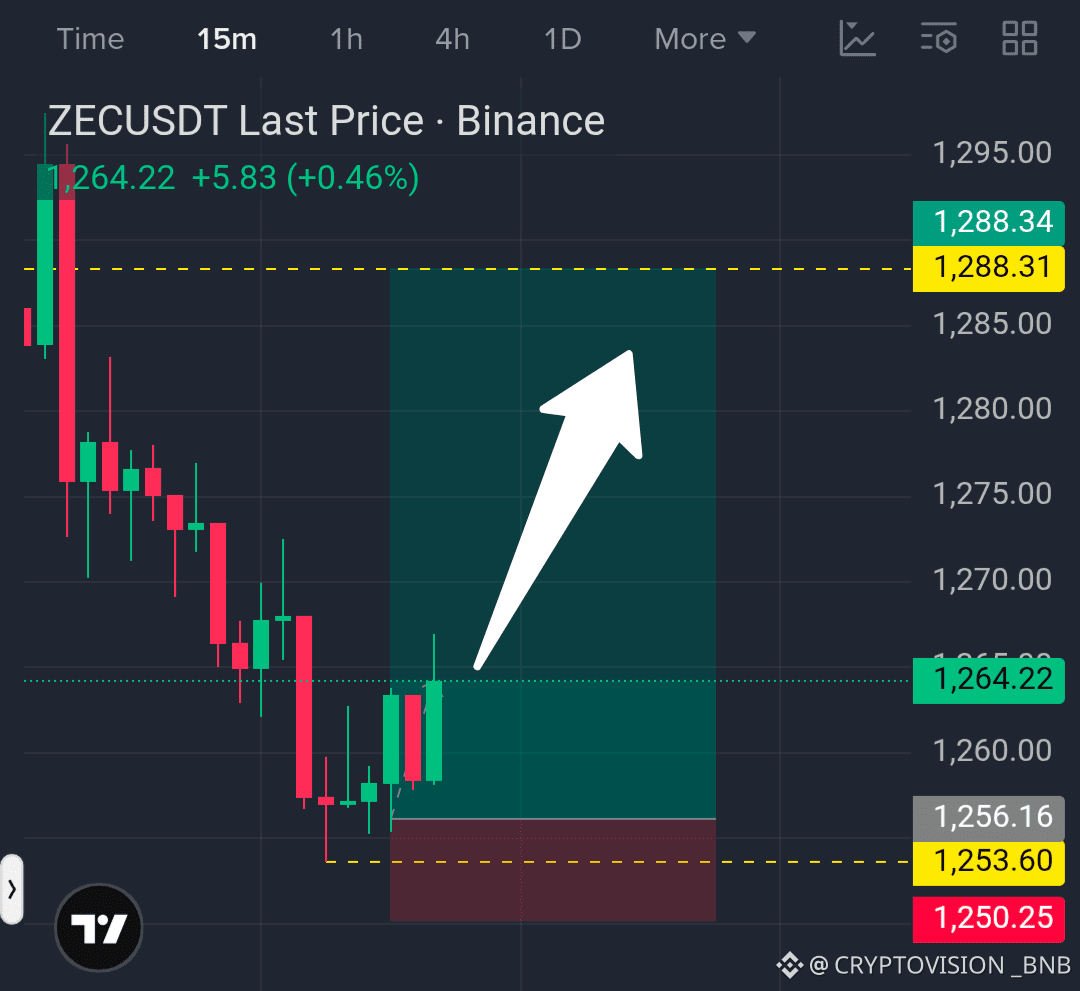
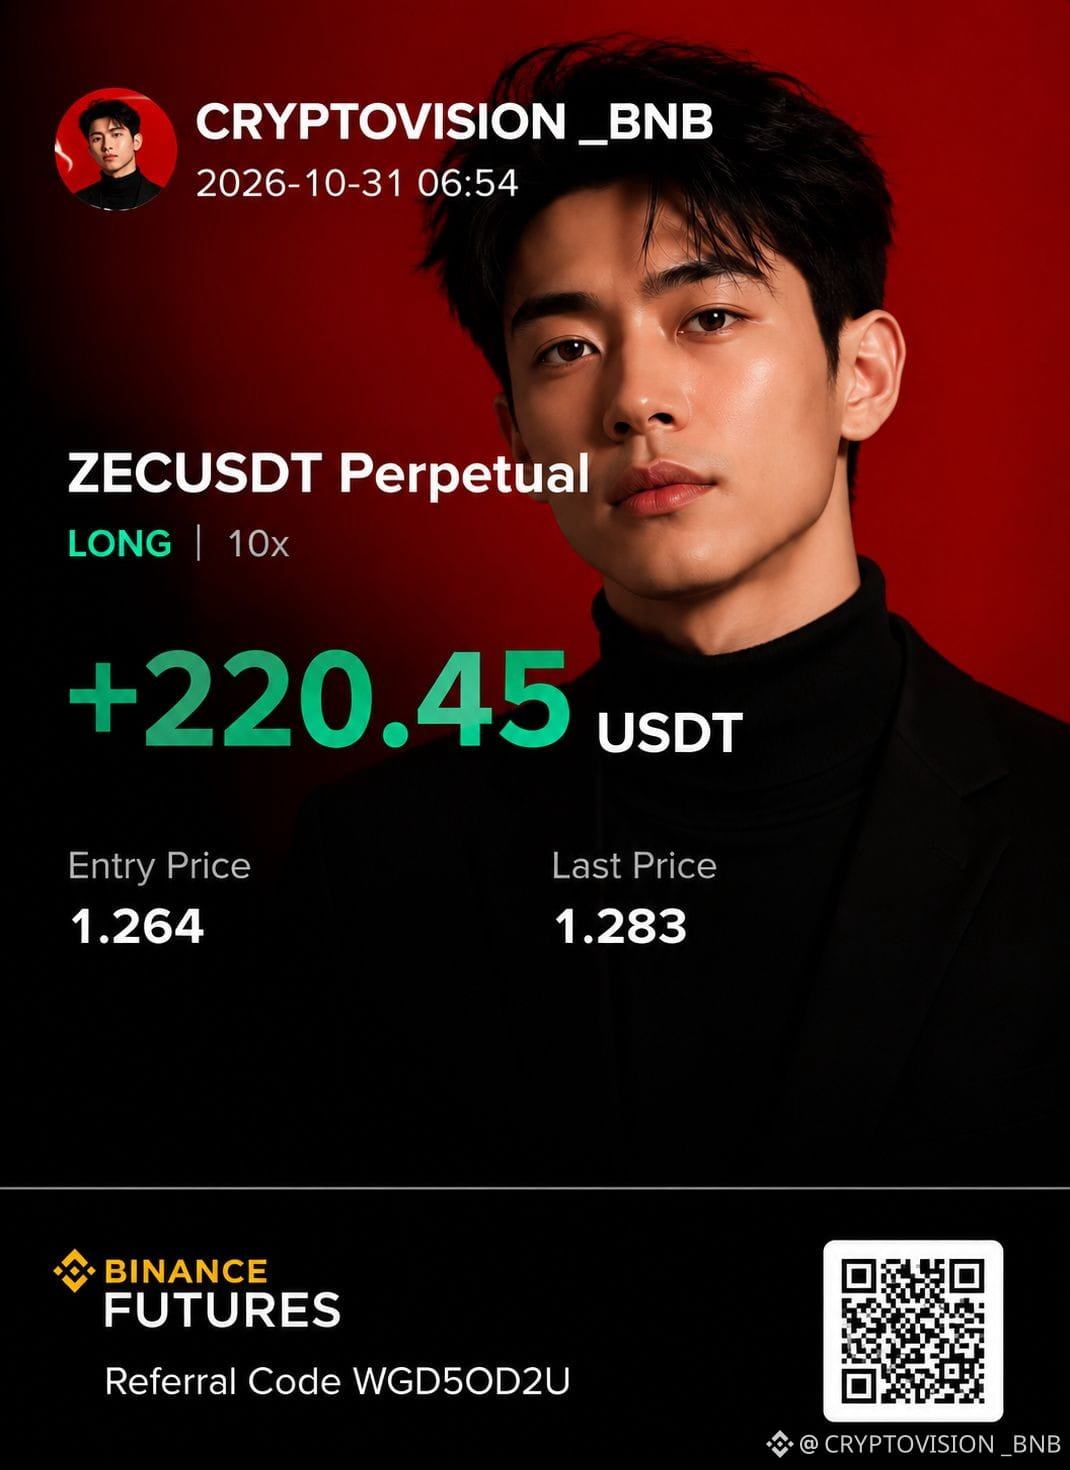
$ZEC: BULLISH BOUNCE FROM SUPPORT?
ZEC is showing signs of recovery after strong selling pressure. Buyers are trying to defend the $1,253–$1,256 zone, a key level for the next move.
ZEC LONG
- Reference price: $1,283.40
- Take Profit: $1,350
- Stop Loss: $1,252
- Key support: $1,253–$1,256
If buyers maintain control, ZEC could attempt to break above $1,288. However, losing support would weaken the bullish outlook.
The key is to trade with confirmation, not chase the price.
Do you think $ZEC will continue recovering, or will we see another drop?
Follow my posts and turn on notifications to get the next signals.
$ZEC
{spot}(ZECUSDT)
$ZEC : BULLISH BOUNCE FROM SUPPORT?
ZEC is showing signs of recovery after strong selling pressure. Buyers are trying to defend the $1,253–$1,256 zone, a key level for the next move.
ZEC LONG
- Reference price: $1,283.40
- Take Profit: $1,350
- Stop Loss: $1,252
- Key support: $1,253–$1,256
If buyers maintain control, ZEC could attempt to break above $1,288. However, losing support would weaken the bullish outlook.
The key is to trade with confirmation, not chase the price.
Do you think $ZEC will continue recovering, or will we see another drop?
Follow my posts and turn on notifications to get the next signals.
$ZEC
ZEC is showing signs of recovery after strong selling pressure. Buyers are trying to defend the $1,253–$1,256 zone, a key level for the next move.
ZEC LONG
- Reference price: $1,283.40
- Take Profit: $1,350
- Stop Loss: $1,252
- Key support: $1,253–$1,256
If buyers maintain control, ZEC could attempt to break above $1,288. However, losing support would weaken the bullish outlook.
The key is to trade with confirmation, not chase the price.
Do you think $ZEC will continue recovering, or will we see another drop?
Follow my posts and turn on notifications to get the next signals.
$ZEC
80
·
--
Bullish
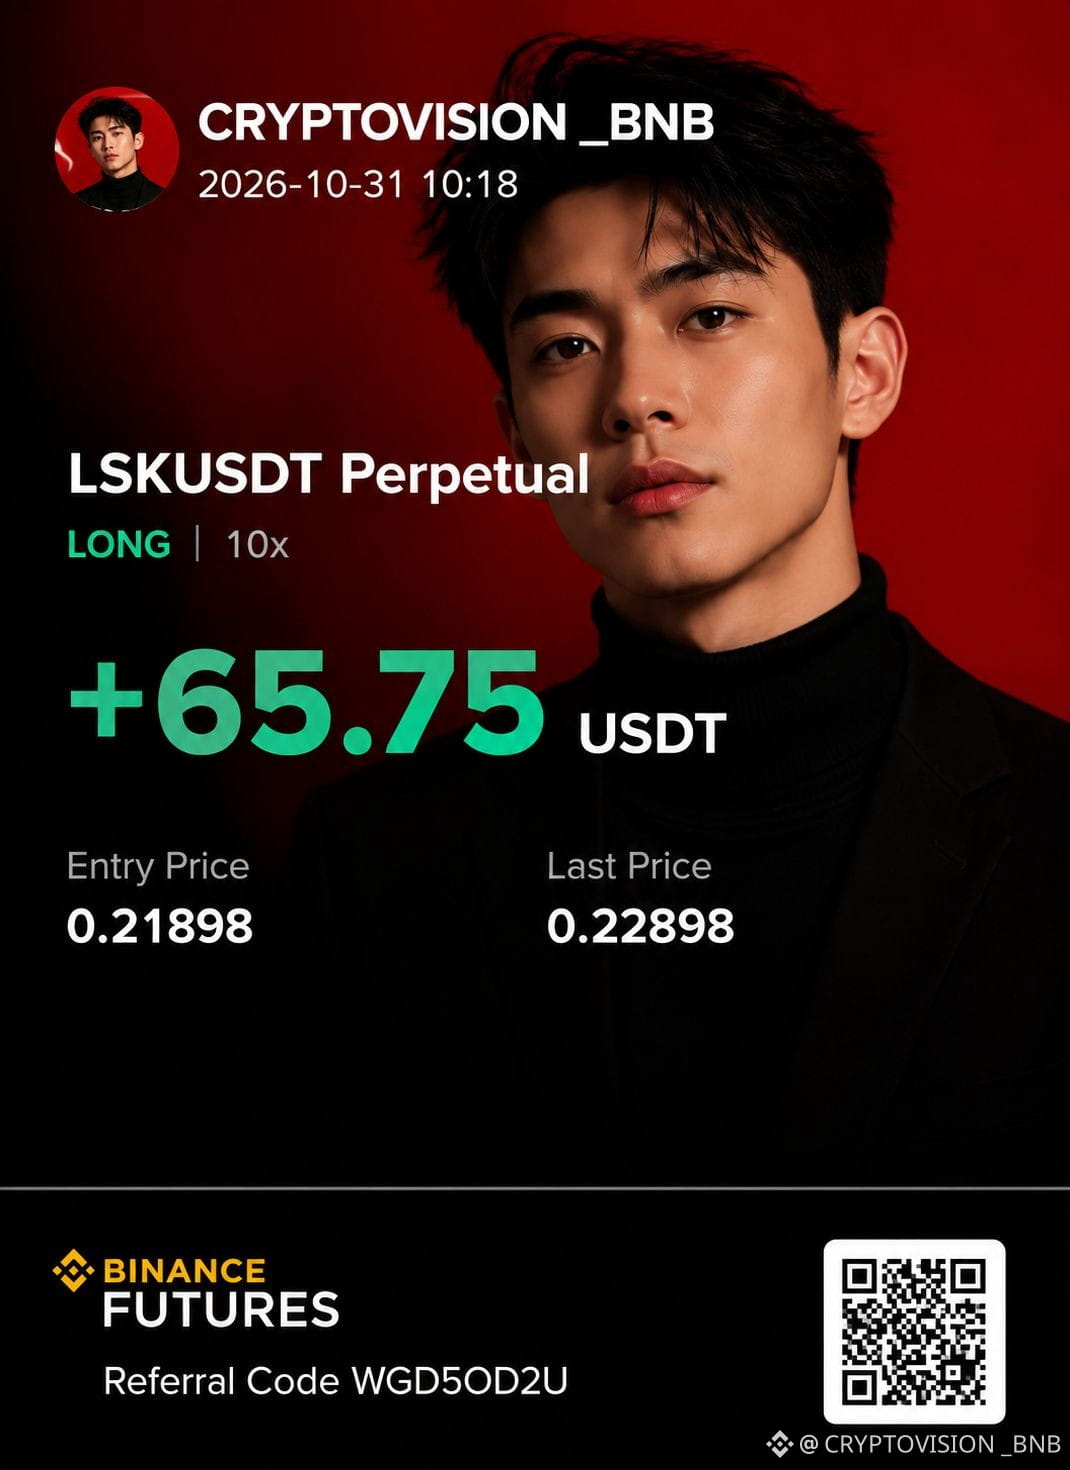
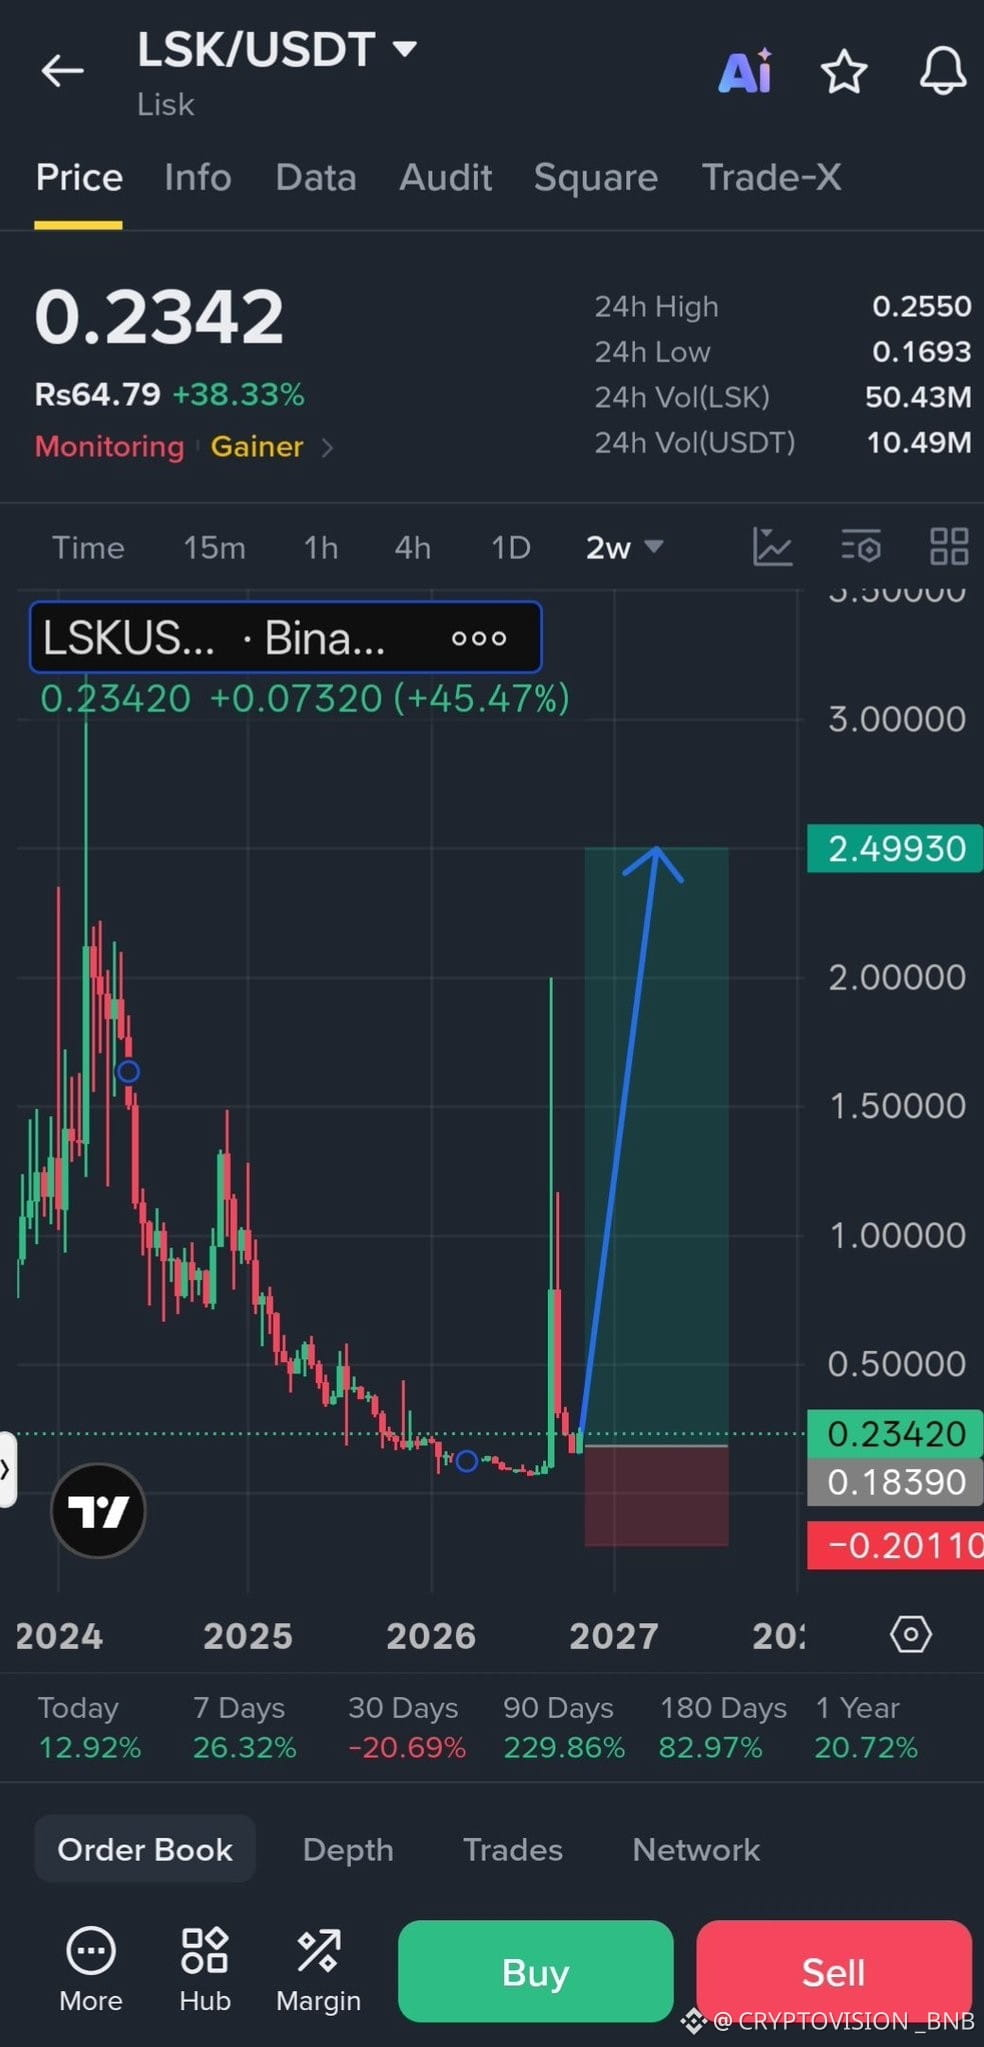
$LSK: BULLISH BREAKOUT TOWARD $0.2535?
LSK is showing strong momentum after a reported 34.34% gain in 24 hours. It is now approaching a resistance zone that could define its next move.
Key LSK levels:
- Reference price: $0.23014
- First target: $0.24800
- Main resistance: $0.24800–$0.25350
- Immediate support: $0.21200–$0.22000
- Main support: $0.19100–$0.20000
Bullish scenario: if it breaks above $0.24880 with volume, it could target $0.25350.
Bearish scenario: if it is rejected at resistance, it could pull back toward $0.220–$0.212.
After such a strong rally, avoiding chasing the price and waiting for confirmation will be essential.
Do you think $LSK will break $0.24880, or will we see a correction first?
Follow my posts and turn on notifications to learn about upcoming trading opportunities.
$LSK
{spot}(LSKUSDT)
$LSK : BULLISH BREAKOUT TOWARD $0.2535?
LSK is showing strong momentum after a reported 34.34% gain in 24 hours. It is now approaching a resistance zone that could define its next move.
Key LSK levels:
- Reference price: $0.23014
- First target: $0.24800
- Main resistance: $0.24800–$0.25350
- Immediate support: $0.21200–$0.22000
- Main support: $0.19100–$0.20000
Bullish scenario: if it breaks above $0.24880 with volume, it could target $0.25350.
Bearish scenario: if it is rejected at resistance, it could pull back toward $0.220–$0.212.
After such a strong rally, avoiding chasing the price and waiting for confirmation will be essential.
Do you think $LSK will break $0.24880, or will we see a correction first?
Follow my posts and turn on notifications to learn about upcoming trading opportunities.
$LSK
LSK is showing strong momentum after a reported 34.34% gain in 24 hours. It is now approaching a resistance zone that could define its next move.
Key LSK levels:
- Reference price: $0.23014
- First target: $0.24800
- Main resistance: $0.24800–$0.25350
- Immediate support: $0.21200–$0.22000
- Main support: $0.19100–$0.20000
Bullish scenario: if it breaks above $0.24880 with volume, it could target $0.25350.
Bearish scenario: if it is rejected at resistance, it could pull back toward $0.220–$0.212.
After such a strong rally, avoiding chasing the price and waiting for confirmation will be essential.
Do you think $LSK will break $0.24880, or will we see a correction first?
Follow my posts and turn on notifications to learn about upcoming trading opportunities.
$LSK
118
·
--
Bearish
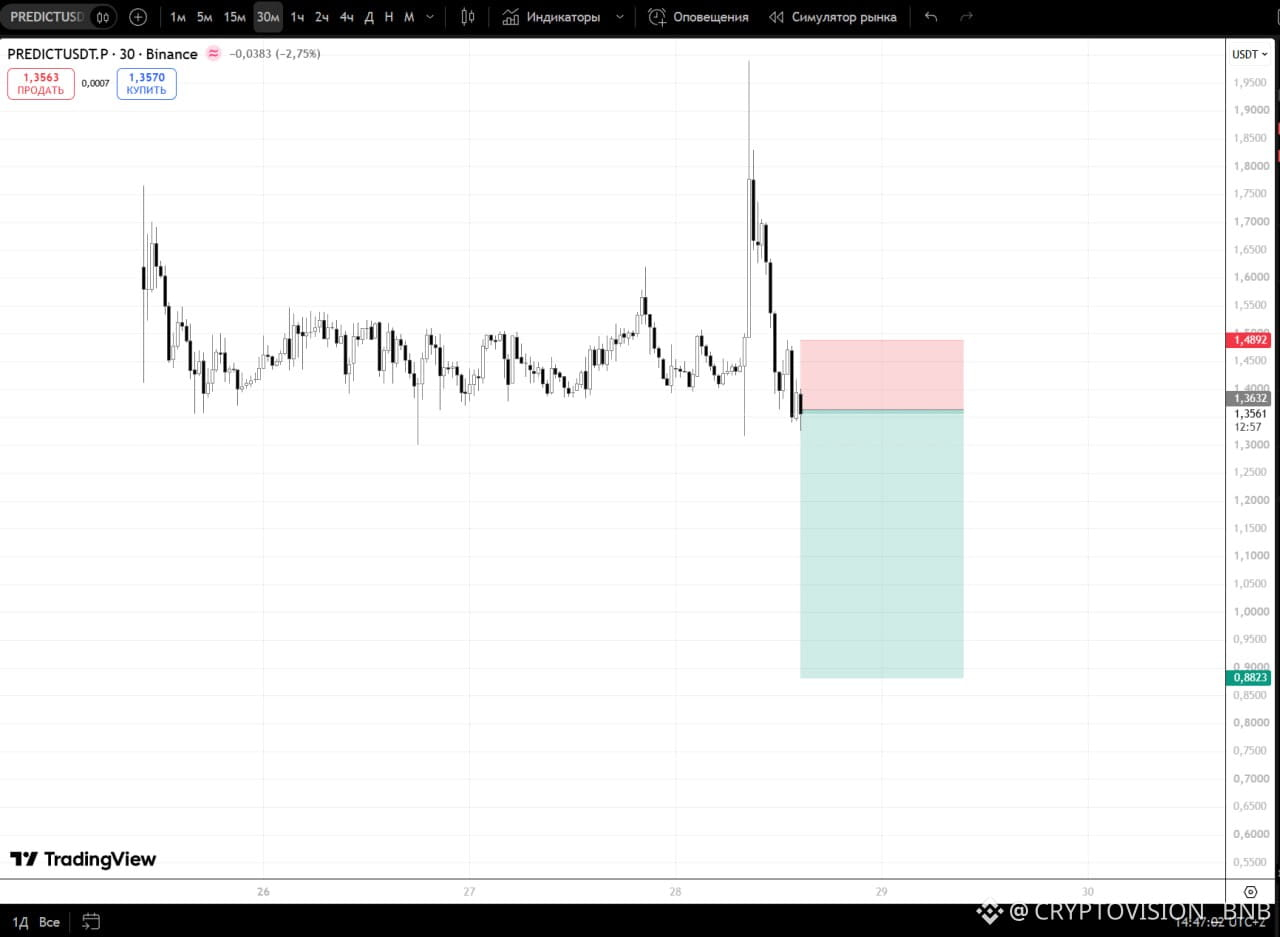
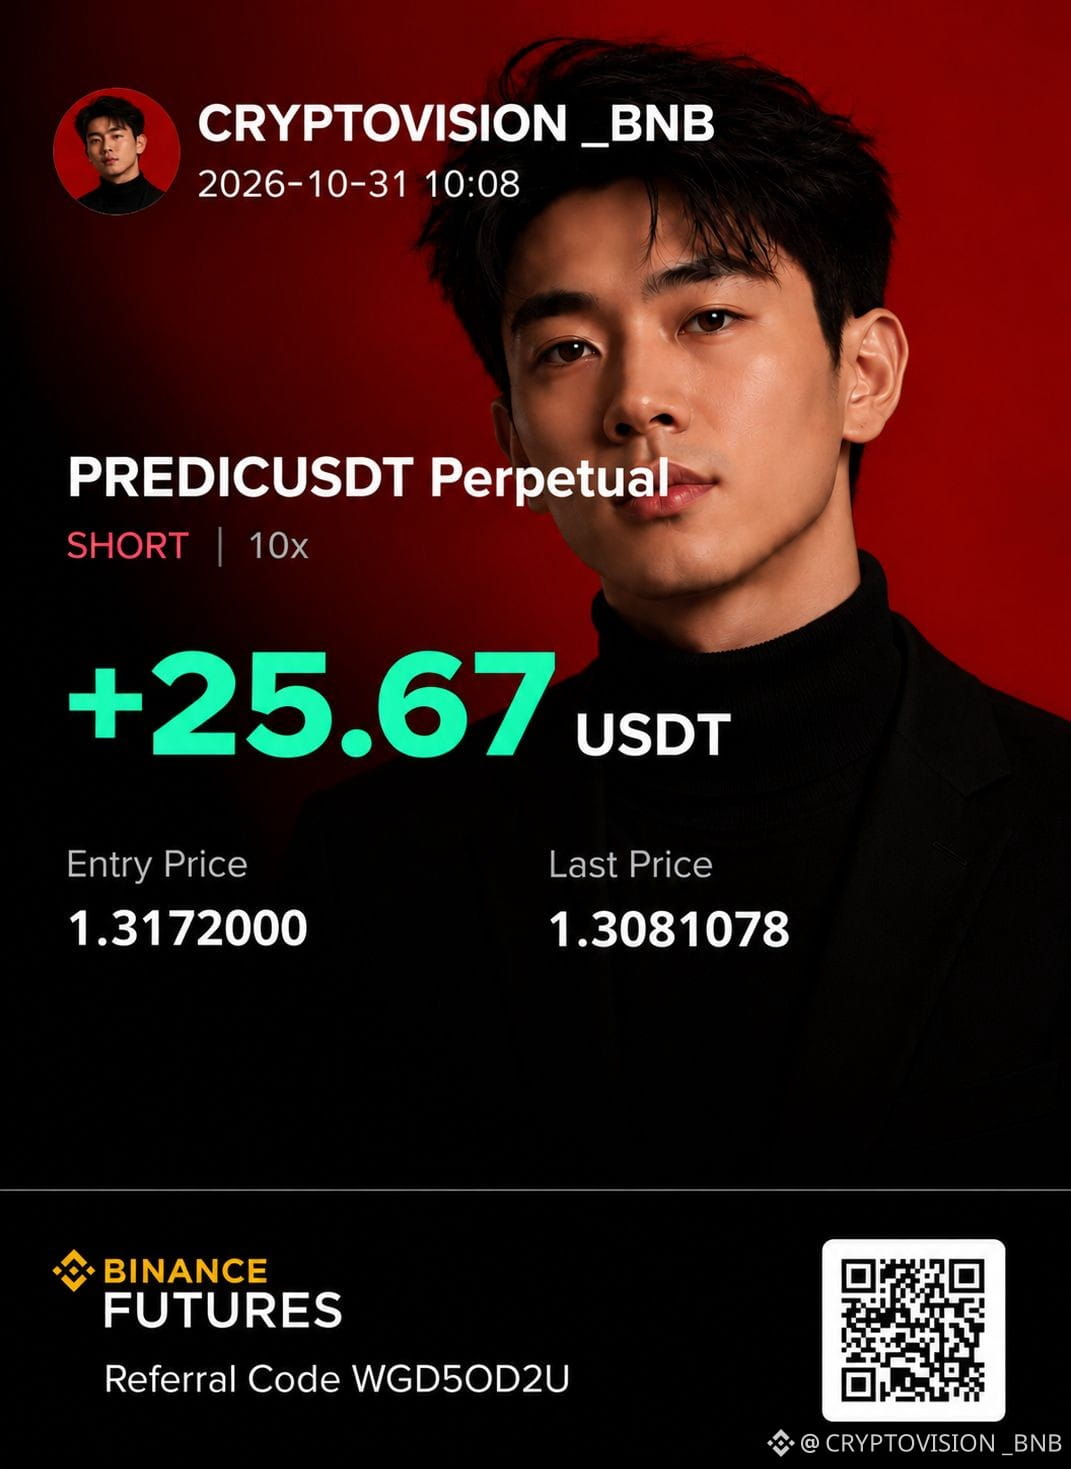
$PREDICT: IS A MAJOR CORRECTION APPROACHING?
PREDICT is on my radar for a potential short trade.
If sellers take control and the price confirms a bearish breakout, we could see an interesting correction.
PREDICT SHORT
- Direction: bearish
- Entry: awaiting confirmation
- TP and SL: to be determined based on price structure
Patience and risk management will be essential. This isn't about anticipating a drop, but identifying an entry with confirmation.
Do you think $PREDICT is ready to fall, or does it still have the strength to rise?
Follow my signals and turn on notifications to learn about upcoming opportunities.
$PREDICT
{future}(PREDICTUSDT)
$PREDICT : IS A MAJOR CORRECTION APPROACHING?
PREDICT is on my radar for a potential short trade.
If sellers take control and the price confirms a bearish breakout, we could see an interesting correction.
PREDICT SHORT
- Direction: bearish
- Entry: awaiting confirmation
- TP and SL: to be determined based on price structure
Patience and risk management will be essential. This isn't about anticipating a drop, but identifying an entry with confirmation.
Do you think $PREDICT is ready to fall, or does it still have the strength to rise?
Follow my signals and turn on notifications to learn about upcoming opportunities.
$PREDICT
PREDICT is on my radar for a potential short trade.
If sellers take control and the price confirms a bearish breakout, we could see an interesting correction.
PREDICT SHORT
- Direction: bearish
- Entry: awaiting confirmation
- TP and SL: to be determined based on price structure
Patience and risk management will be essential. This isn't about anticipating a drop, but identifying an entry with confirmation.
Do you think $PREDICT is ready to fall, or does it still have the strength to rise?
Follow my signals and turn on notifications to learn about upcoming opportunities.
$PREDICT
2
416
·
--
Bullish
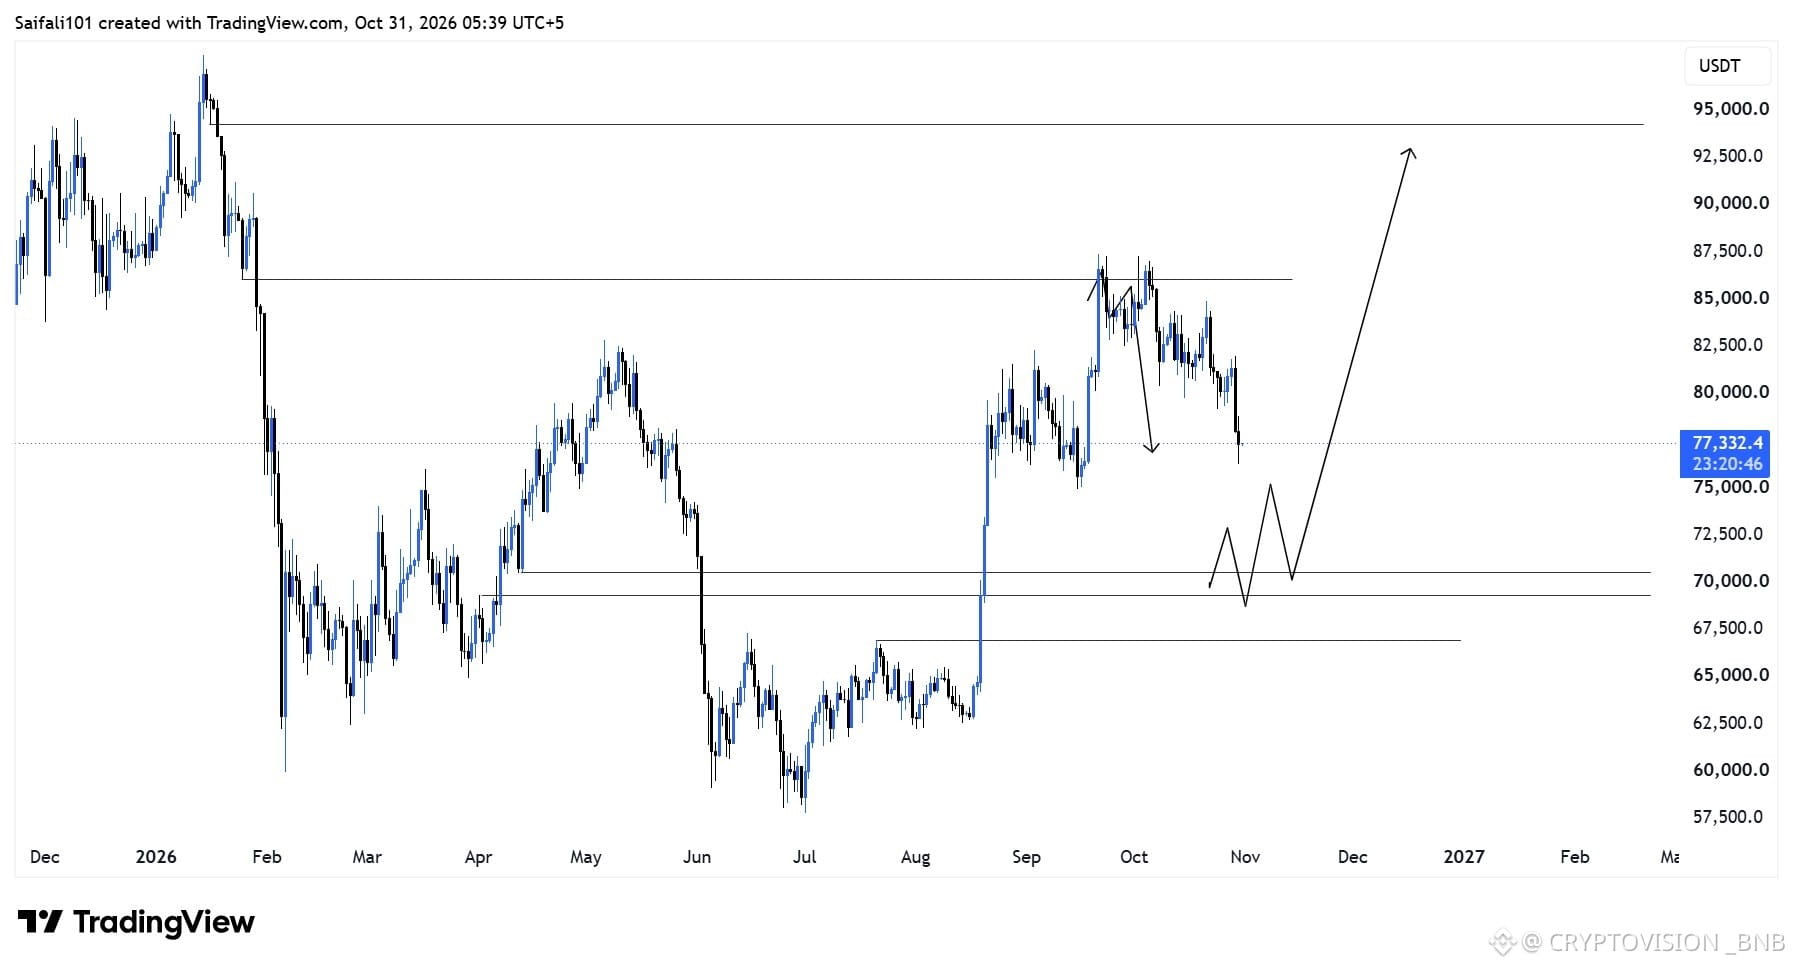
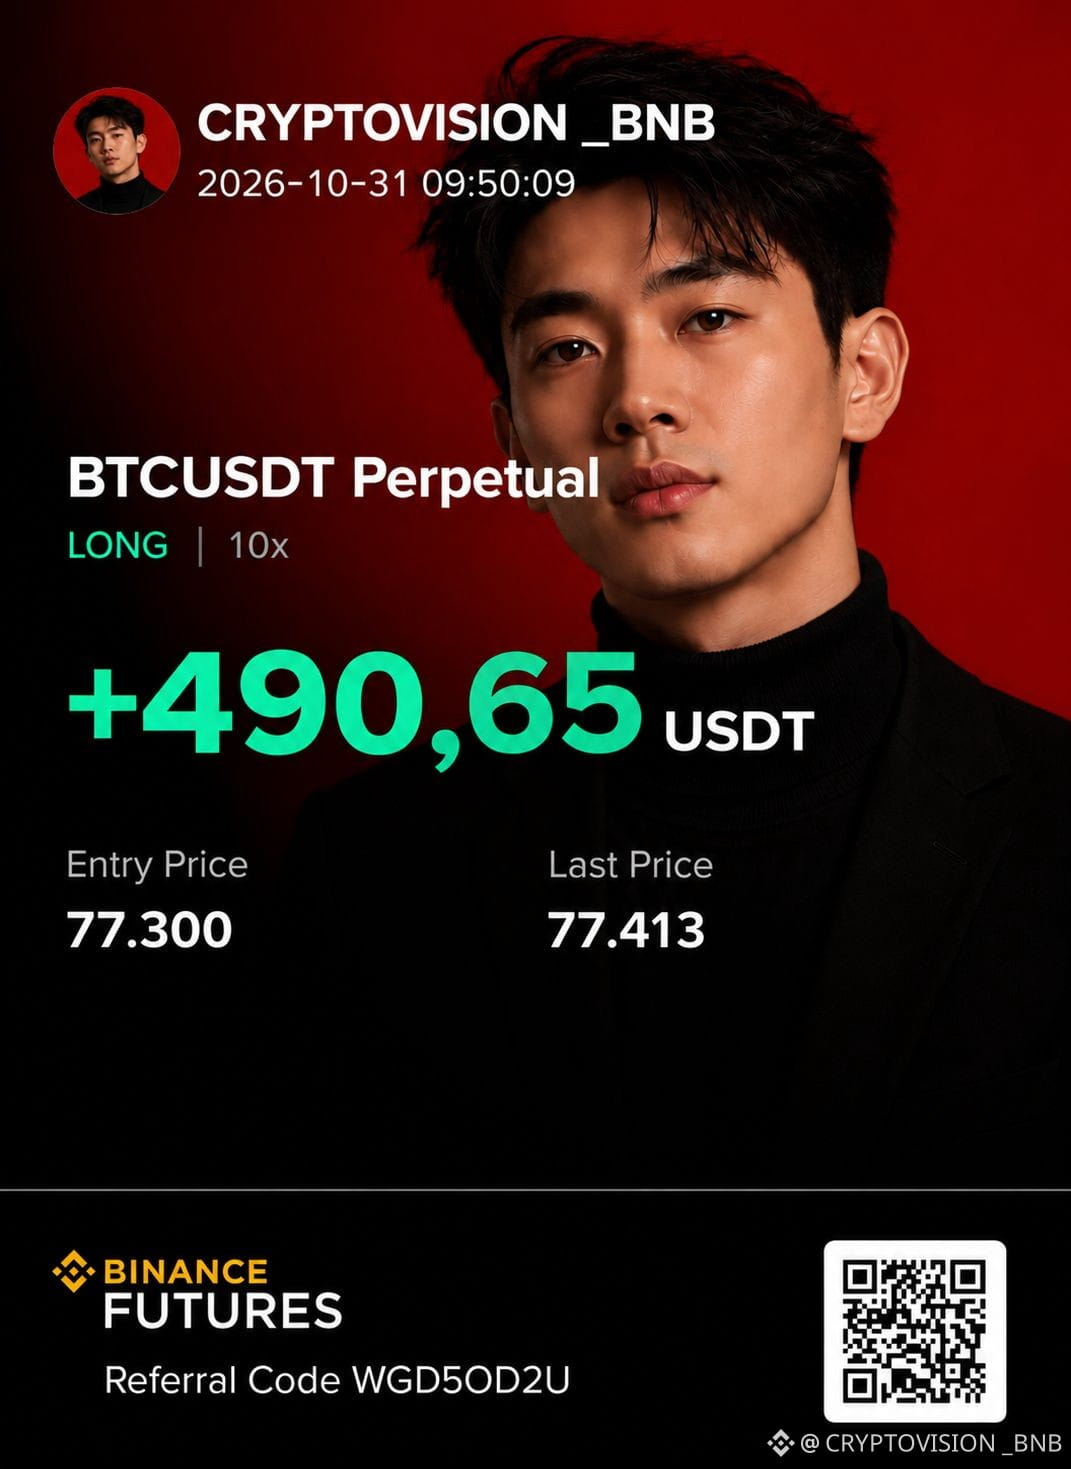
$BTC: BOUNCE TOWARD $80,000?
Bitcoin is back on the radar for a possible quick long trade.
BTC LONG
- TP1: $78,000
- TP2: $79,000
- TP3: $80,000
- Stop Loss: $76,000
If buyers regain control, BTC could gradually work its way toward these targets.
Strategy: consider taking partial profits at each target and adjusting the stop loss based on price action.
The key is to wait for confirmation and manage risk. No target is guaranteed.
Do you think BTC will reach $80,000 or fall again?
Follow my signals and turn on notifications to hear about upcoming opportunities.
$BTC
{spot}(BTCUSDT)
$BTC : BOUNCE TOWARD $80,000?
Bitcoin is back on the radar for a possible quick long trade.
BTC LONG
- TP1: $78,000
- TP2: $79,000
- TP3: $80,000
- Stop Loss: $76,000
If buyers regain control, BTC could gradually work its way toward these targets.
Strategy: consider taking partial profits at each target and adjusting the stop loss based on price action.
The key is to wait for confirmation and manage risk. No target is guaranteed.
Do you think BTC will reach $80,000 or fall again?
Follow my signals and turn on notifications to hear about upcoming opportunities.
$BTC
Bitcoin is back on the radar for a possible quick long trade.
BTC LONG
- TP1: $78,000
- TP2: $79,000
- TP3: $80,000
- Stop Loss: $76,000
If buyers regain control, BTC could gradually work its way toward these targets.
Strategy: consider taking partial profits at each target and adjusting the stop loss based on price action.
The key is to wait for confirmation and manage risk. No target is guaranteed.
Do you think BTC will reach $80,000 or fall again?
Follow my signals and turn on notifications to hear about upcoming opportunities.
$BTC
2
176
·
--
Bearish
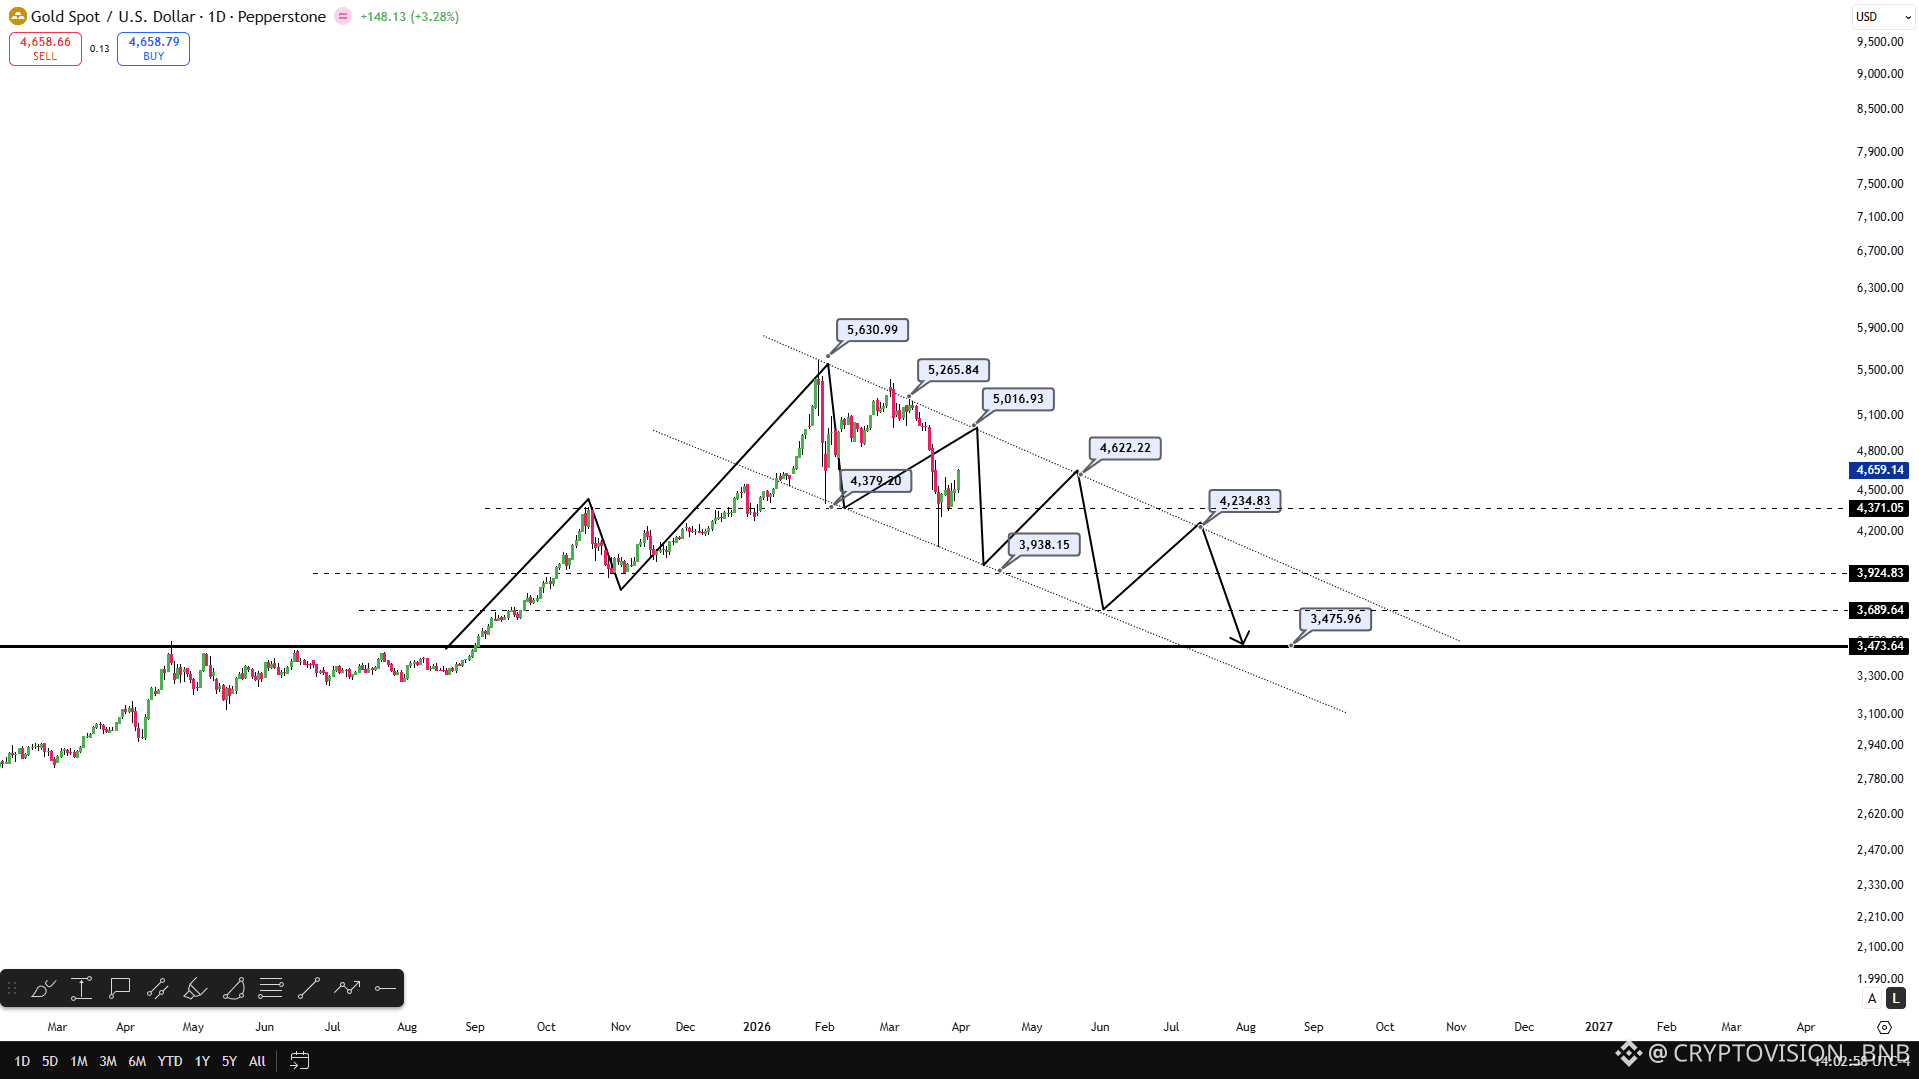
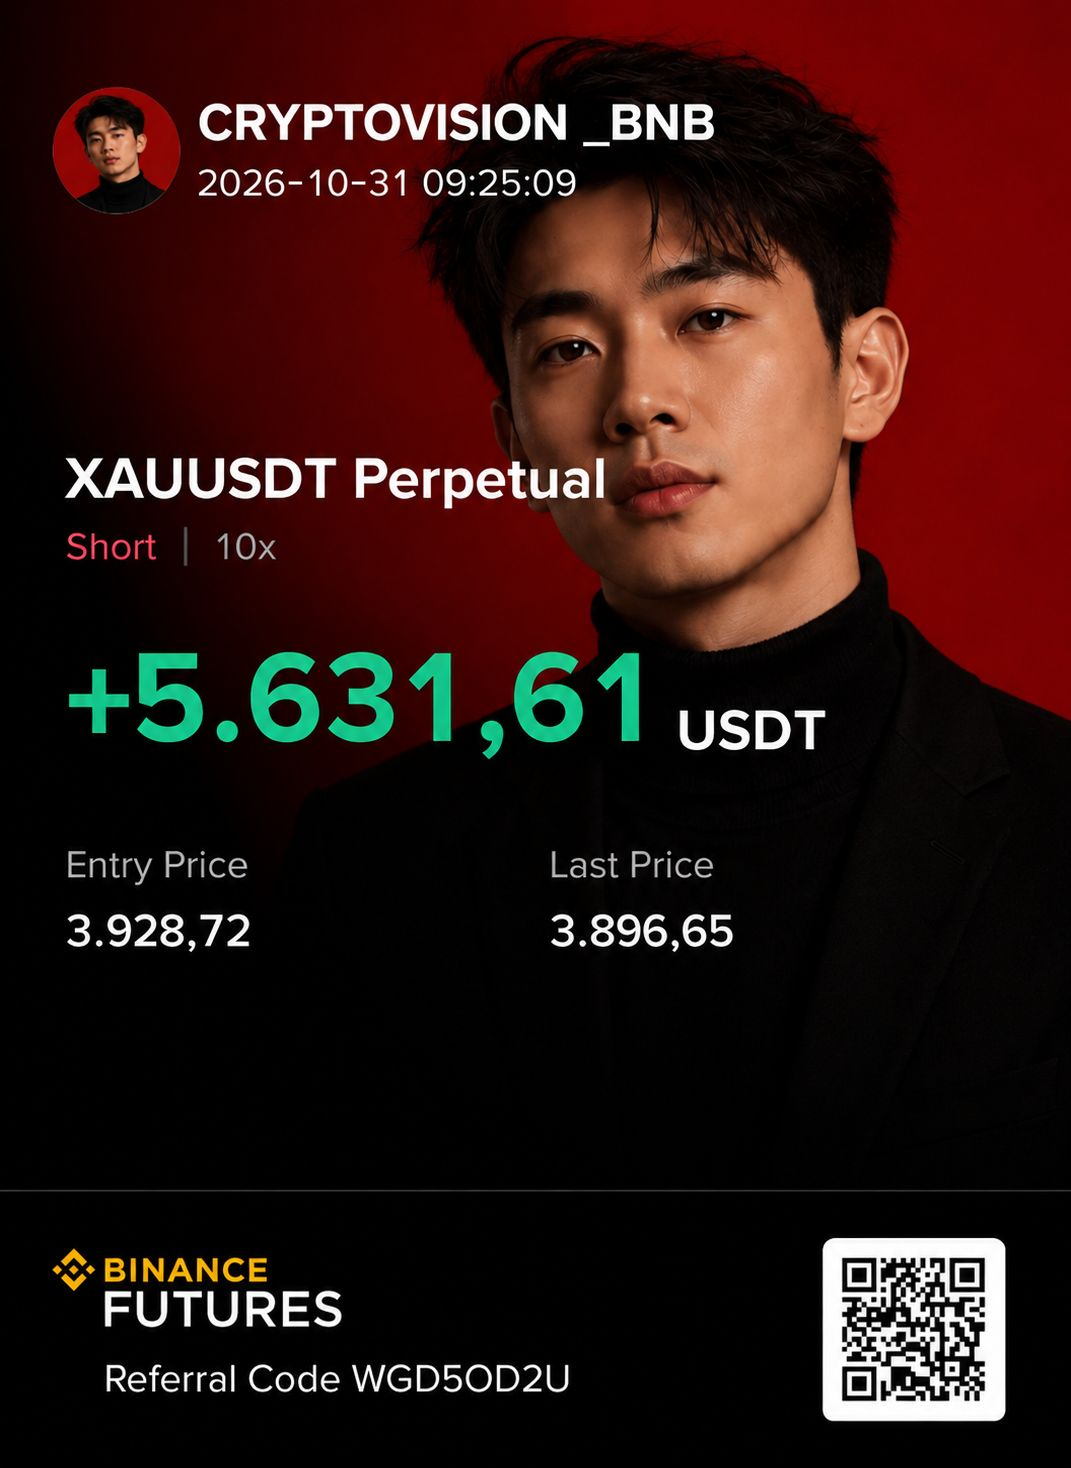
$XAU $CL $ZEC | TRADES CLOSED
24 winning trades and only 2 losing ones in the reported balance.
Another day following the market, seizing opportunities, and managing risk.
Discipline and patience remain essential. Not every trade goes well, but every result counts.
Who was following my signals? How did it go for you?
If you enjoy these analyses, leave a like, follow me, and turn on notifications so you don't miss the next opportunities.
$XAU
{future}(XAUUSDT)
$XAU $CL $ZEC | TRADES CLOSED
24 winning trades and only 2 losing ones in the reported balance.
Another day following the market, seizing opportunities, and managing risk.
Discipline and patience remain essential. Not every trade goes well, but every result counts.
Who was following my signals? How did it go for you?
If you enjoy these analyses, leave a like, follow me, and turn on notifications so you don't miss the next opportunities.
$XAU
24 winning trades and only 2 losing ones in the reported balance.
Another day following the market, seizing opportunities, and managing risk.
Discipline and patience remain essential. Not every trade goes well, but every result counts.
Who was following my signals? How did it go for you?
If you enjoy these analyses, leave a like, follow me, and turn on notifications so you don't miss the next opportunities.
$XAU
169
·
--
Bullish
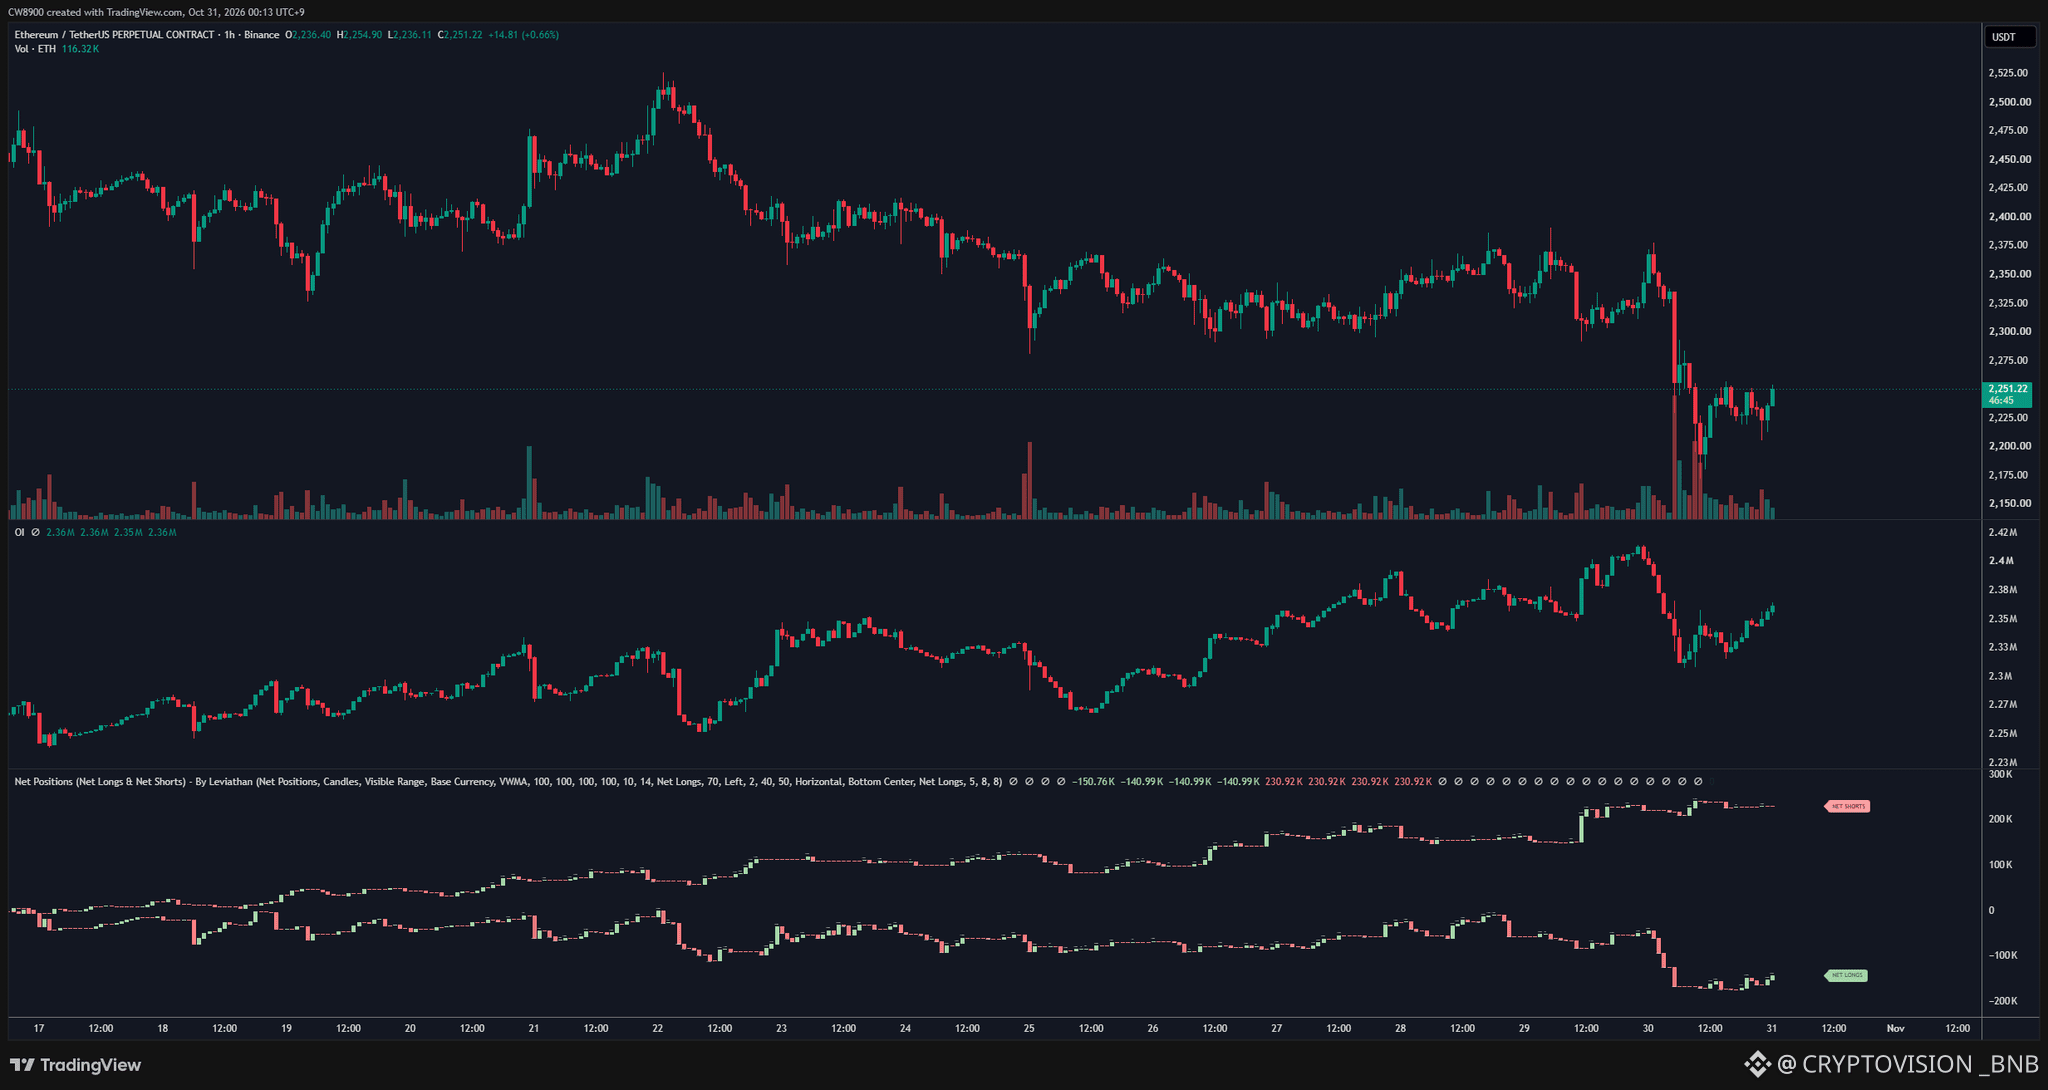
After a drop, buying pressure from long positions has resurfaced in $ETH.
There is some bullish pressure, while short positions remain steady at certain levels. However, short positions still have the advantage.
$ETH
{spot}(ETHUSDT)
After a drop, buying pressure from long positions has resurfaced in $ETH .
There is some bullish pressure, while short positions remain steady at certain levels. However, short positions still have the advantage.
$ETH
There is some bullish pressure, while short positions remain steady at certain levels. However, short positions still have the advantage.
$ETH
183
Log in to explore more content
Join global crypto users on Binance Square
⚡️ Get latest and useful information about crypto.
💬 Trusted by the world’s largest crypto exchange.
👍 Discover real insights from verified creators.
Email / Phone number
Trending Topics
BinanceRestores28FiatWithdrawals
12,480 views
313 Discussing
Binance Restores Fiat Withdrawals for USD, AED and Three Asian Currencies, Bringing the Total to 28
Binance News
·11 Likes
·5.2k views
BinanceProcesses$4.65BWithdrawals
66,795 views
292 Discussing
ETHFalls16.1%InOctober
2,851 views
100 Discussing