

CRYPTOMOJO_TA
1.6k Posts

CRYPTOMOJO_TA
Report
Block User
#Bitcoin and #Ethereum Learning Technical Analysis sharing margin or sport trades.
Occasional Trader
8 Years
17 Following
10.3K+ Followers
5.1K+ Liked
Posts
All
Quotes
Videos
·
--
Bearish
See translation
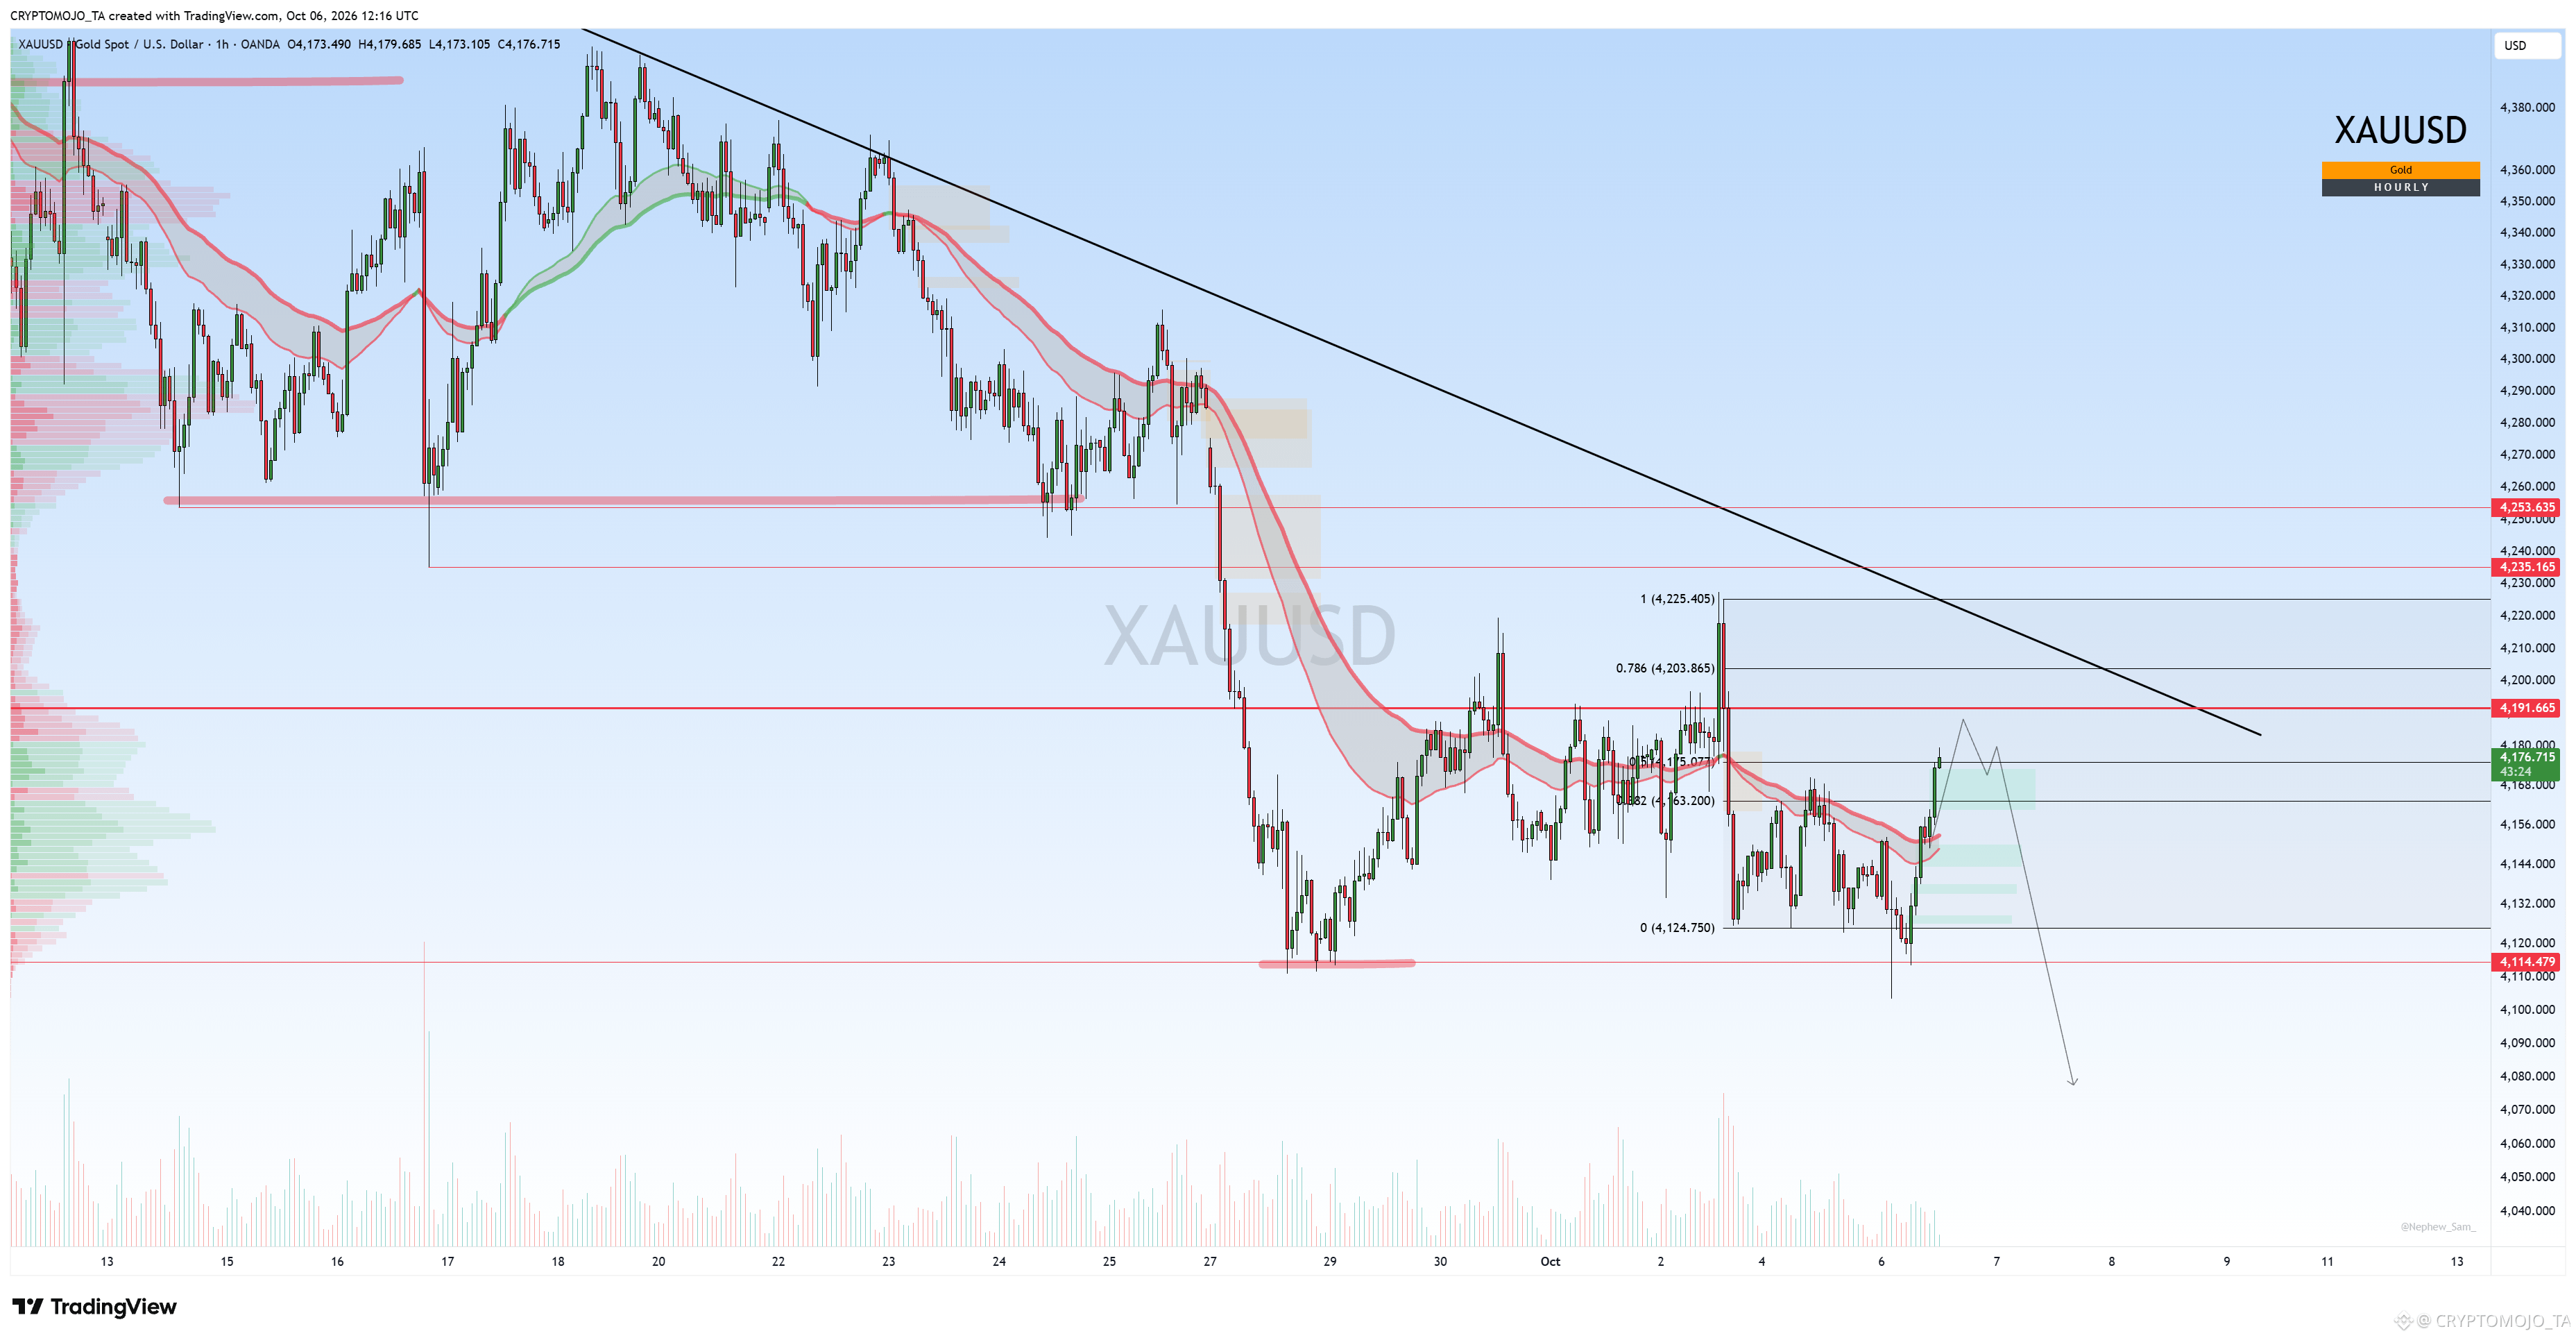
#GOLD remains under pressure.
Gold is still trading inside a bearish structure, with the descending trendline continuing to cap the upside.
Price is currently bouncing from the $4,110 support, but the $4,170–$4,220 zone remains a strong resistance area. Unless we see a clean breakout above this zone, any bounce could simply be a relief move.
A rejection here could send Gold back toward $4,110 → $4,065, with $4,000 coming into play if the support breaks.
For now, sellers still have the upper hand.
#GOLD remains under pressure.
Gold is still trading inside a bearish structure, with the descending trendline continuing to cap the upside.
Price is currently bouncing from the $4,110 support, but the $4,170–$4,220 zone remains a strong resistance area. Unless we see a clean breakout above this zone, any bounce could simply be a relief move.
A rejection here could send Gold back toward $4,110 → $4,065, with $4,000 coming into play if the support breaks.
For now, sellers still have the upper hand.
Gold is still trading inside a bearish structure, with the descending trendline continuing to cap the upside.
Price is currently bouncing from the $4,110 support, but the $4,170–$4,220 zone remains a strong resistance area. Unless we see a clean breakout above this zone, any bounce could simply be a relief move.
A rejection here could send Gold back toward $4,110 → $4,065, with $4,000 coming into play if the support breaks.
For now, sellers still have the upper hand.
1
380
See translation
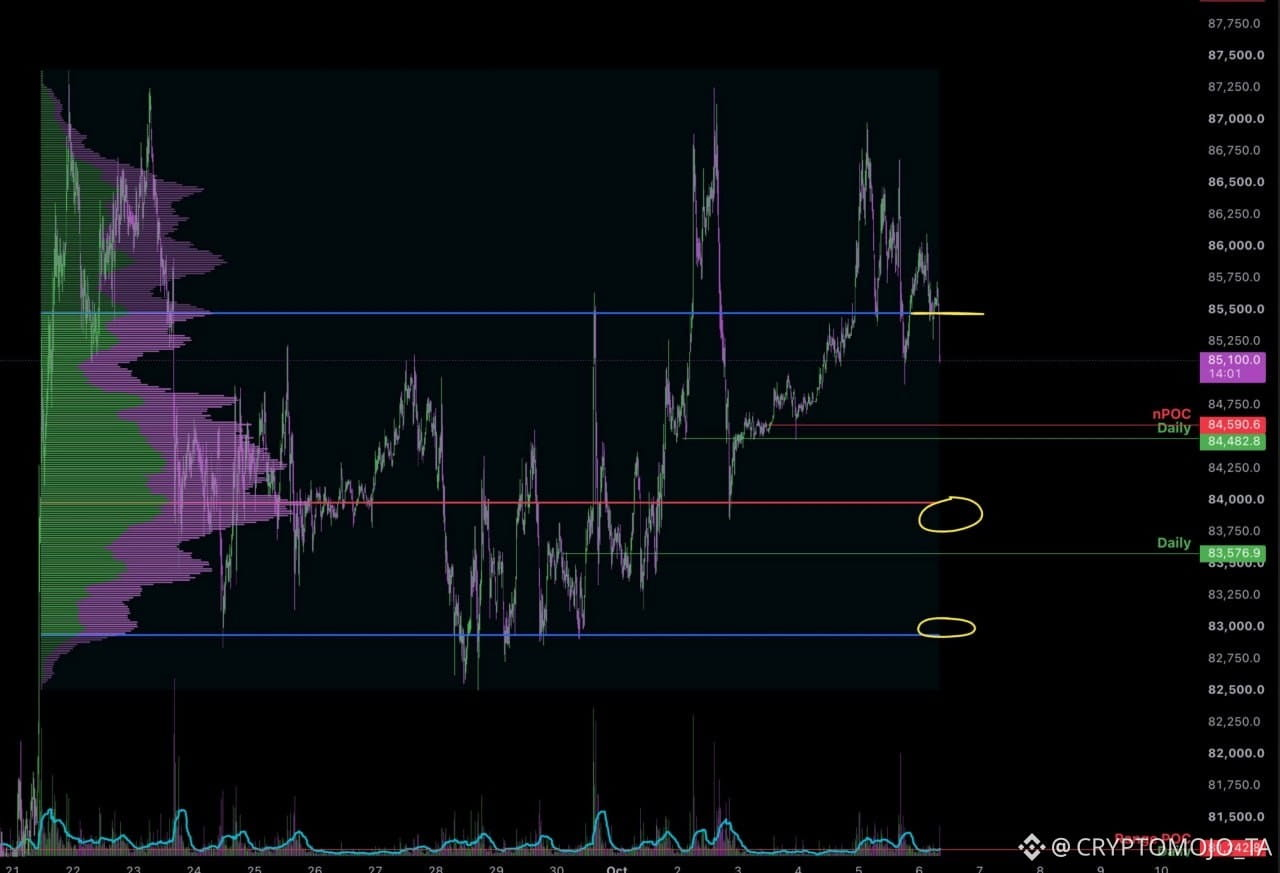
$BTC Update
BTC is losing the VAH (Value Area High) of the current range, which is an important shift in the short-term structure.
With price now moving below the VAH, I’d avoid forcing longs in the middle of the range. The POC around $84.6K and VAL around $83.6K are the two areas I’d be more interested in for potential long setups.
Anything between the VAH and POC is more of a scalp zone for me rather than an area to take a bigger position.
If BTC reclaims the VAH, the structure improves again. But if the VAH continues to act as resistance, I’d rather wait for price to come toward the POC or VAL.
For me: POC/VAL = areas of interest for longs.
Middle of the range = scalps only.
#Bitcoin
$BTC Update
BTC is losing the VAH (Value Area High) of the current range, which is an important shift in the short-term structure.
With price now moving below the VAH, I’d avoid forcing longs in the middle of the range. The POC around $84.6K and VAL around $83.6K are the two areas I’d be more interested in for potential long setups.
Anything between the VAH and POC is more of a scalp zone for me rather than an area to take a bigger position.
If BTC reclaims the VAH, the structure improves again. But if the VAH continues to act as resistance, I’d rather wait for price to come toward the POC or VAL.
For me: POC/VAL = areas of interest for longs.
Middle of the range = scalps only.
#Bitcoin
BTC is losing the VAH (Value Area High) of the current range, which is an important shift in the short-term structure.
With price now moving below the VAH, I’d avoid forcing longs in the middle of the range. The POC around $84.6K and VAL around $83.6K are the two areas I’d be more interested in for potential long setups.
Anything between the VAH and POC is more of a scalp zone for me rather than an area to take a bigger position.
If BTC reclaims the VAH, the structure improves again. But if the VAH continues to act as resistance, I’d rather wait for price to come toward the POC or VAL.
For me: POC/VAL = areas of interest for longs.
Middle of the range = scalps only.
#Bitcoin
1
152
·
--
Bearish
See translation
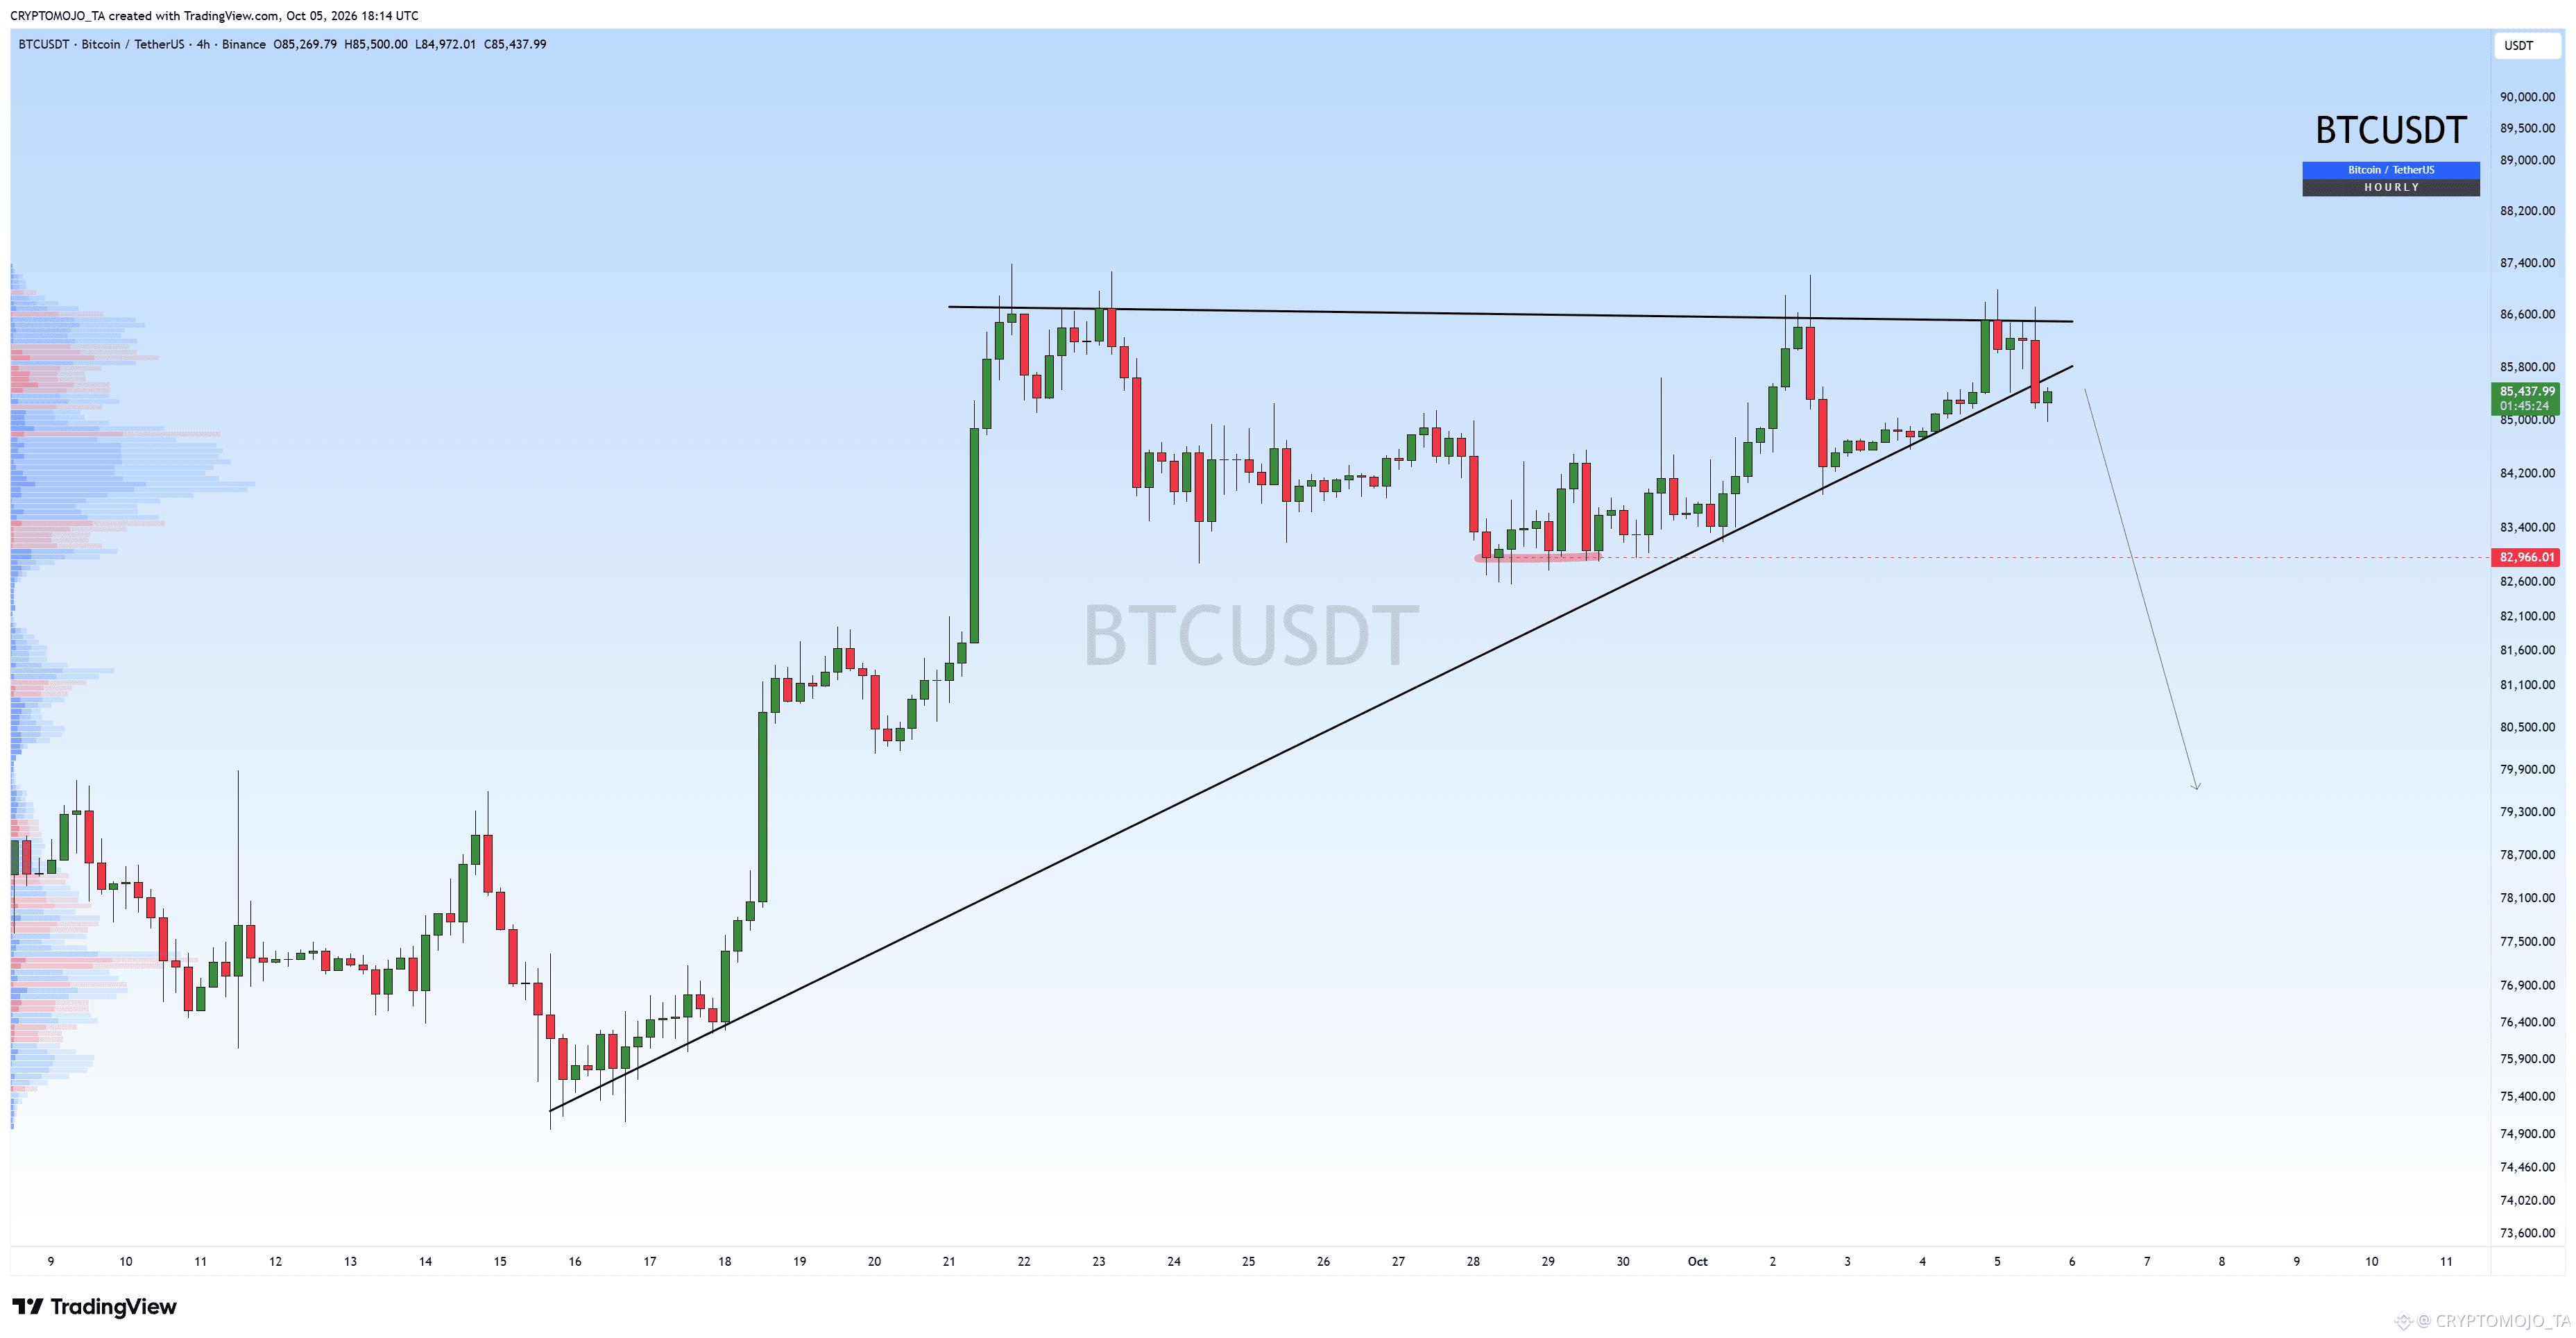
$BTC Breakdown Done🚨
After multiple attempts at $86.5K–$86.8K, BTC is now losing the ascending trendline.
If the breakdown confirms, we could see a move toward $83K first, with $80K coming into play after that.
Is this the start of a deeper pullback?
$BTC Breakdown Done🚨
After multiple attempts at $86.5K–$86.8K, BTC is now losing the ascending trendline.
If the breakdown confirms, we could see a move toward $83K first, with $80K coming into play after that.
Is this the start of a deeper pullback?
After multiple attempts at $86.5K–$86.8K, BTC is now losing the ascending trendline.
If the breakdown confirms, we could see a move toward $83K first, with $80K coming into play after that.
Is this the start of a deeper pullback?
1
145
See translation
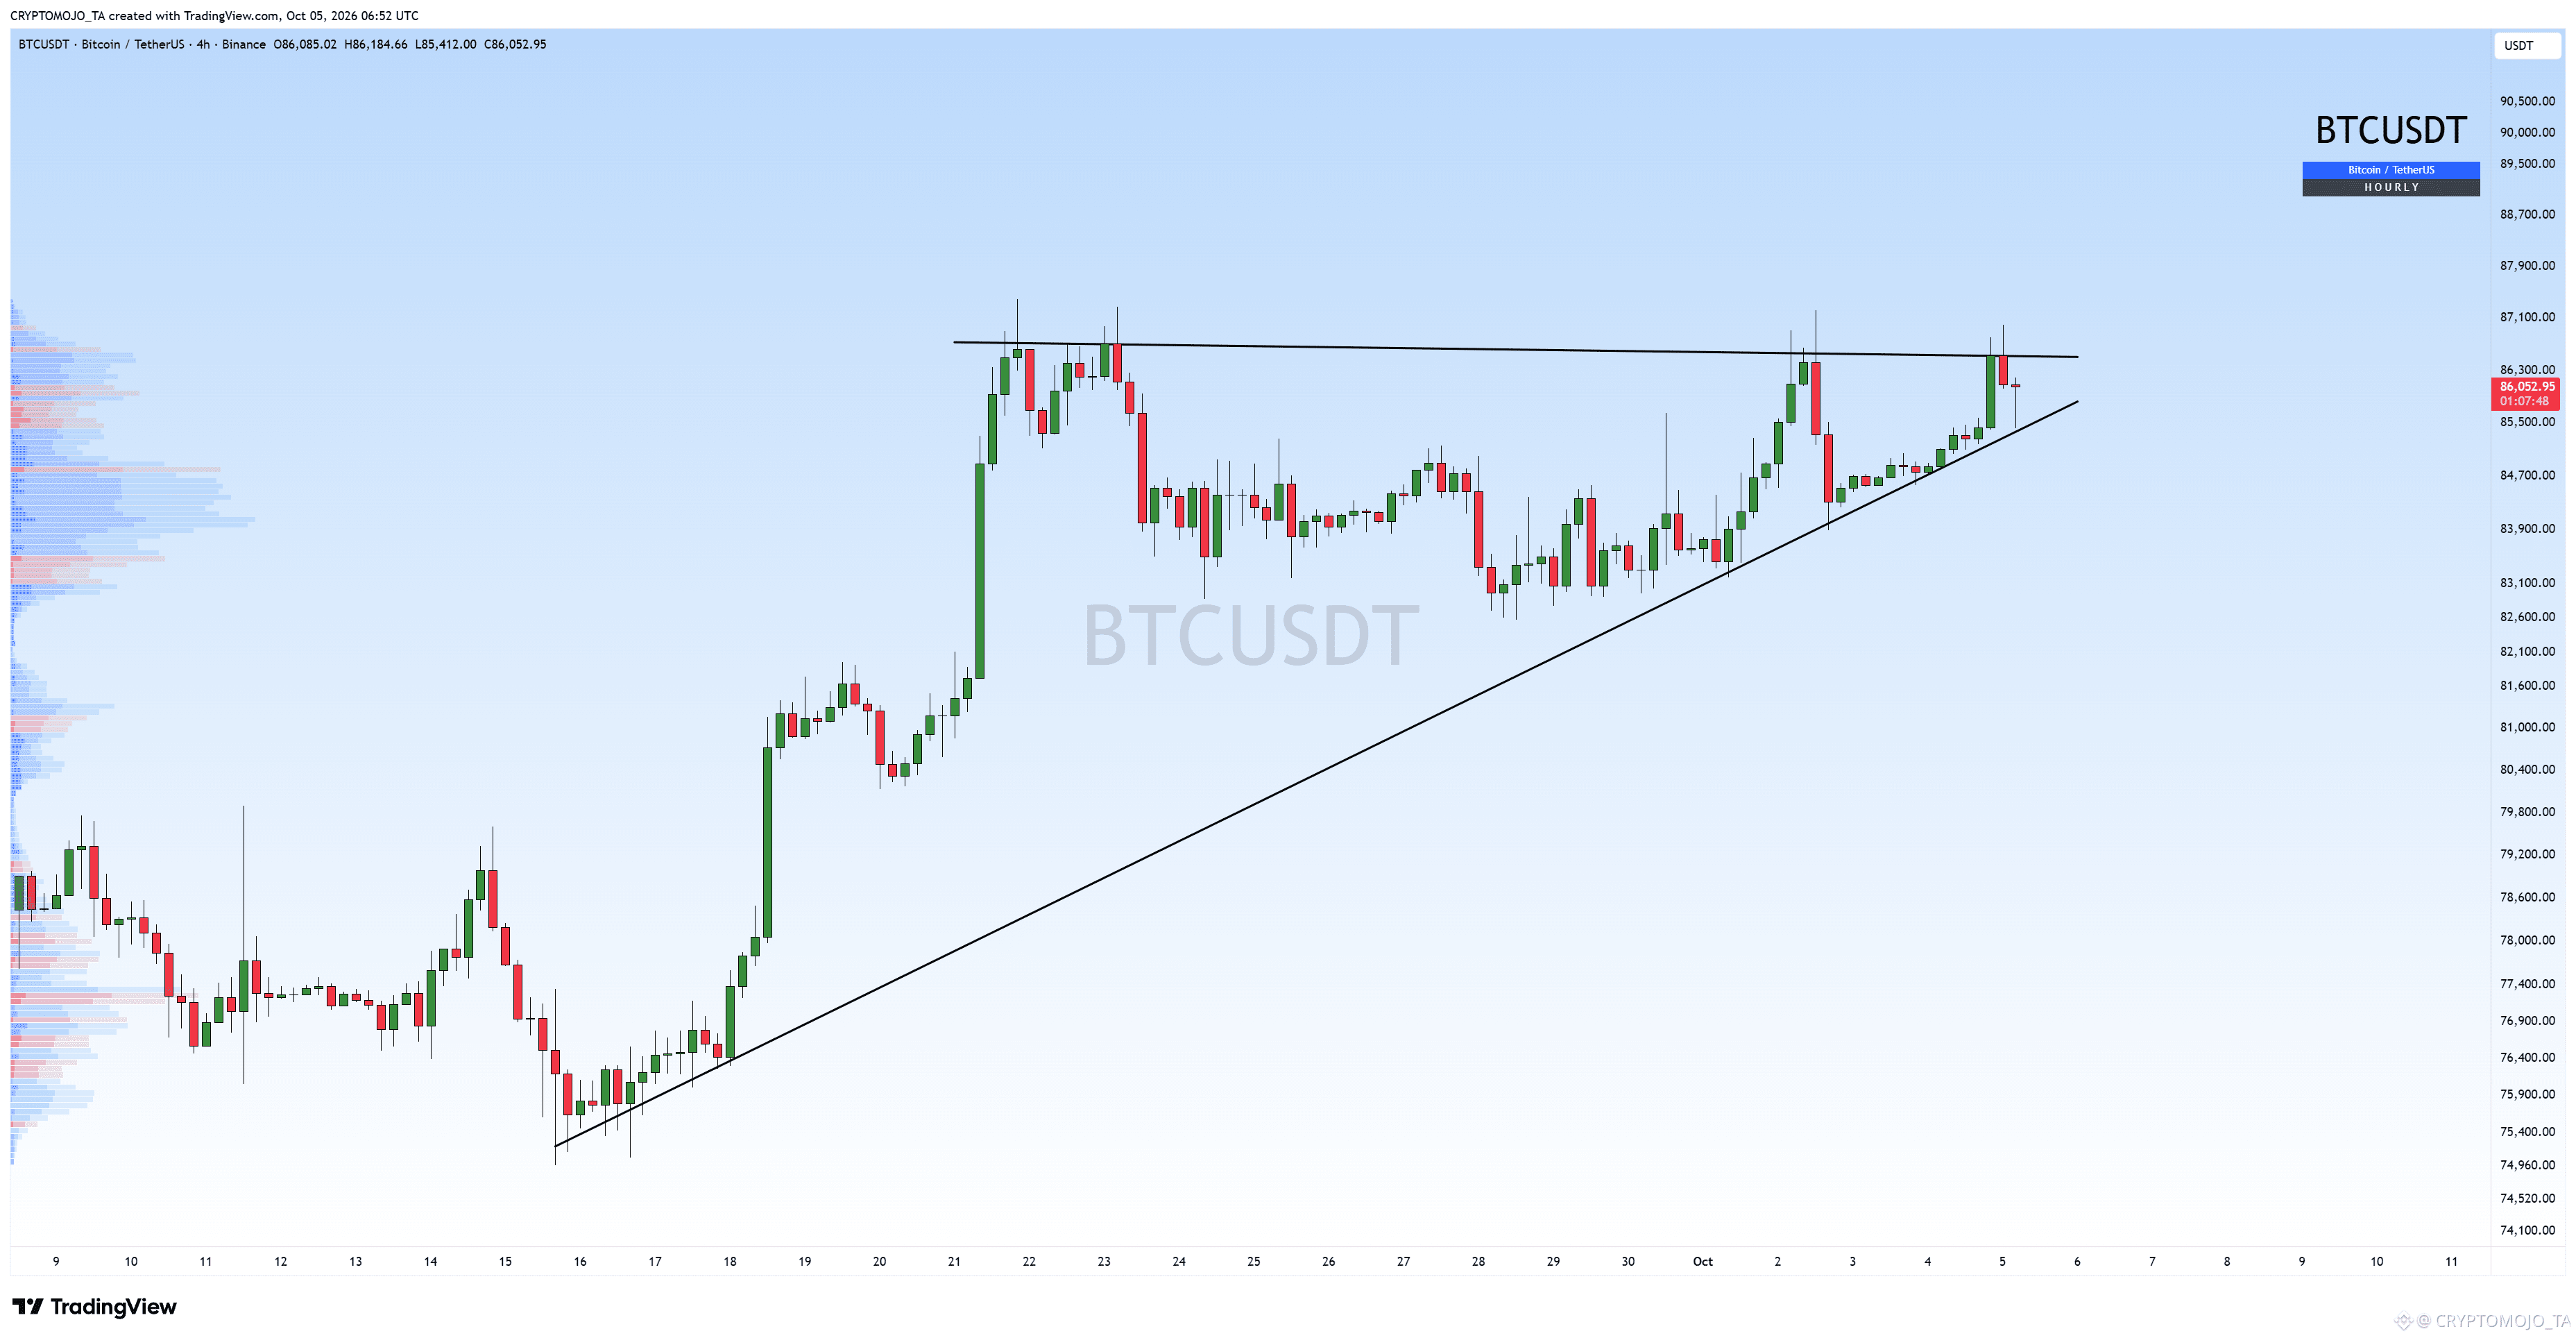
$BTC is back at the top of this structure. 👀
Price is once again testing the $86.5K–$86.8K resistance, while the ascending trendline continues to support the move.
A clean breakout above this zone could trigger the next leg higher. But another rejection could send BTC back toward the lower trendline.
Breakout or another rejection?
$BTC is back at the top of this structure. 👀
Price is once again testing the $86.5K–$86.8K resistance, while the ascending trendline continues to support the move.
A clean breakout above this zone could trigger the next leg higher. But another rejection could send BTC back toward the lower trendline.
Breakout or another rejection?
Price is once again testing the $86.5K–$86.8K resistance, while the ascending trendline continues to support the move.
A clean breakout above this zone could trigger the next leg higher. But another rejection could send BTC back toward the lower trendline.
Breakout or another rejection?
186
See translation
The biggest regret in life might not be failing.
It might be knowing you never became the person you were capable of becoming.
You delay.
You stay comfortable.
You keep saying "later."
Then years pass.
One day, you look back and wonder:
"What could I have become if I had actually tried?"
Don't wait for that question.
Start now.
#SelfImprovement #Mindset
The biggest regret in life might not be failing.
It might be knowing you never became the person you were capable of becoming.
You delay.
You stay comfortable.
You keep saying "later."
Then years pass.
One day, you look back and wonder:
"What could I have become if I had actually tried?"
Don't wait for that question.
Start now.
#SelfImprovement #Mindset
It might be knowing you never became the person you were capable of becoming.
You delay.
You stay comfortable.
You keep saying "later."
Then years pass.
One day, you look back and wonder:
"What could I have become if I had actually tried?"
Don't wait for that question.
Start now.
#SelfImprovement #Mindset
2
161
·
--
Bearish
See translation
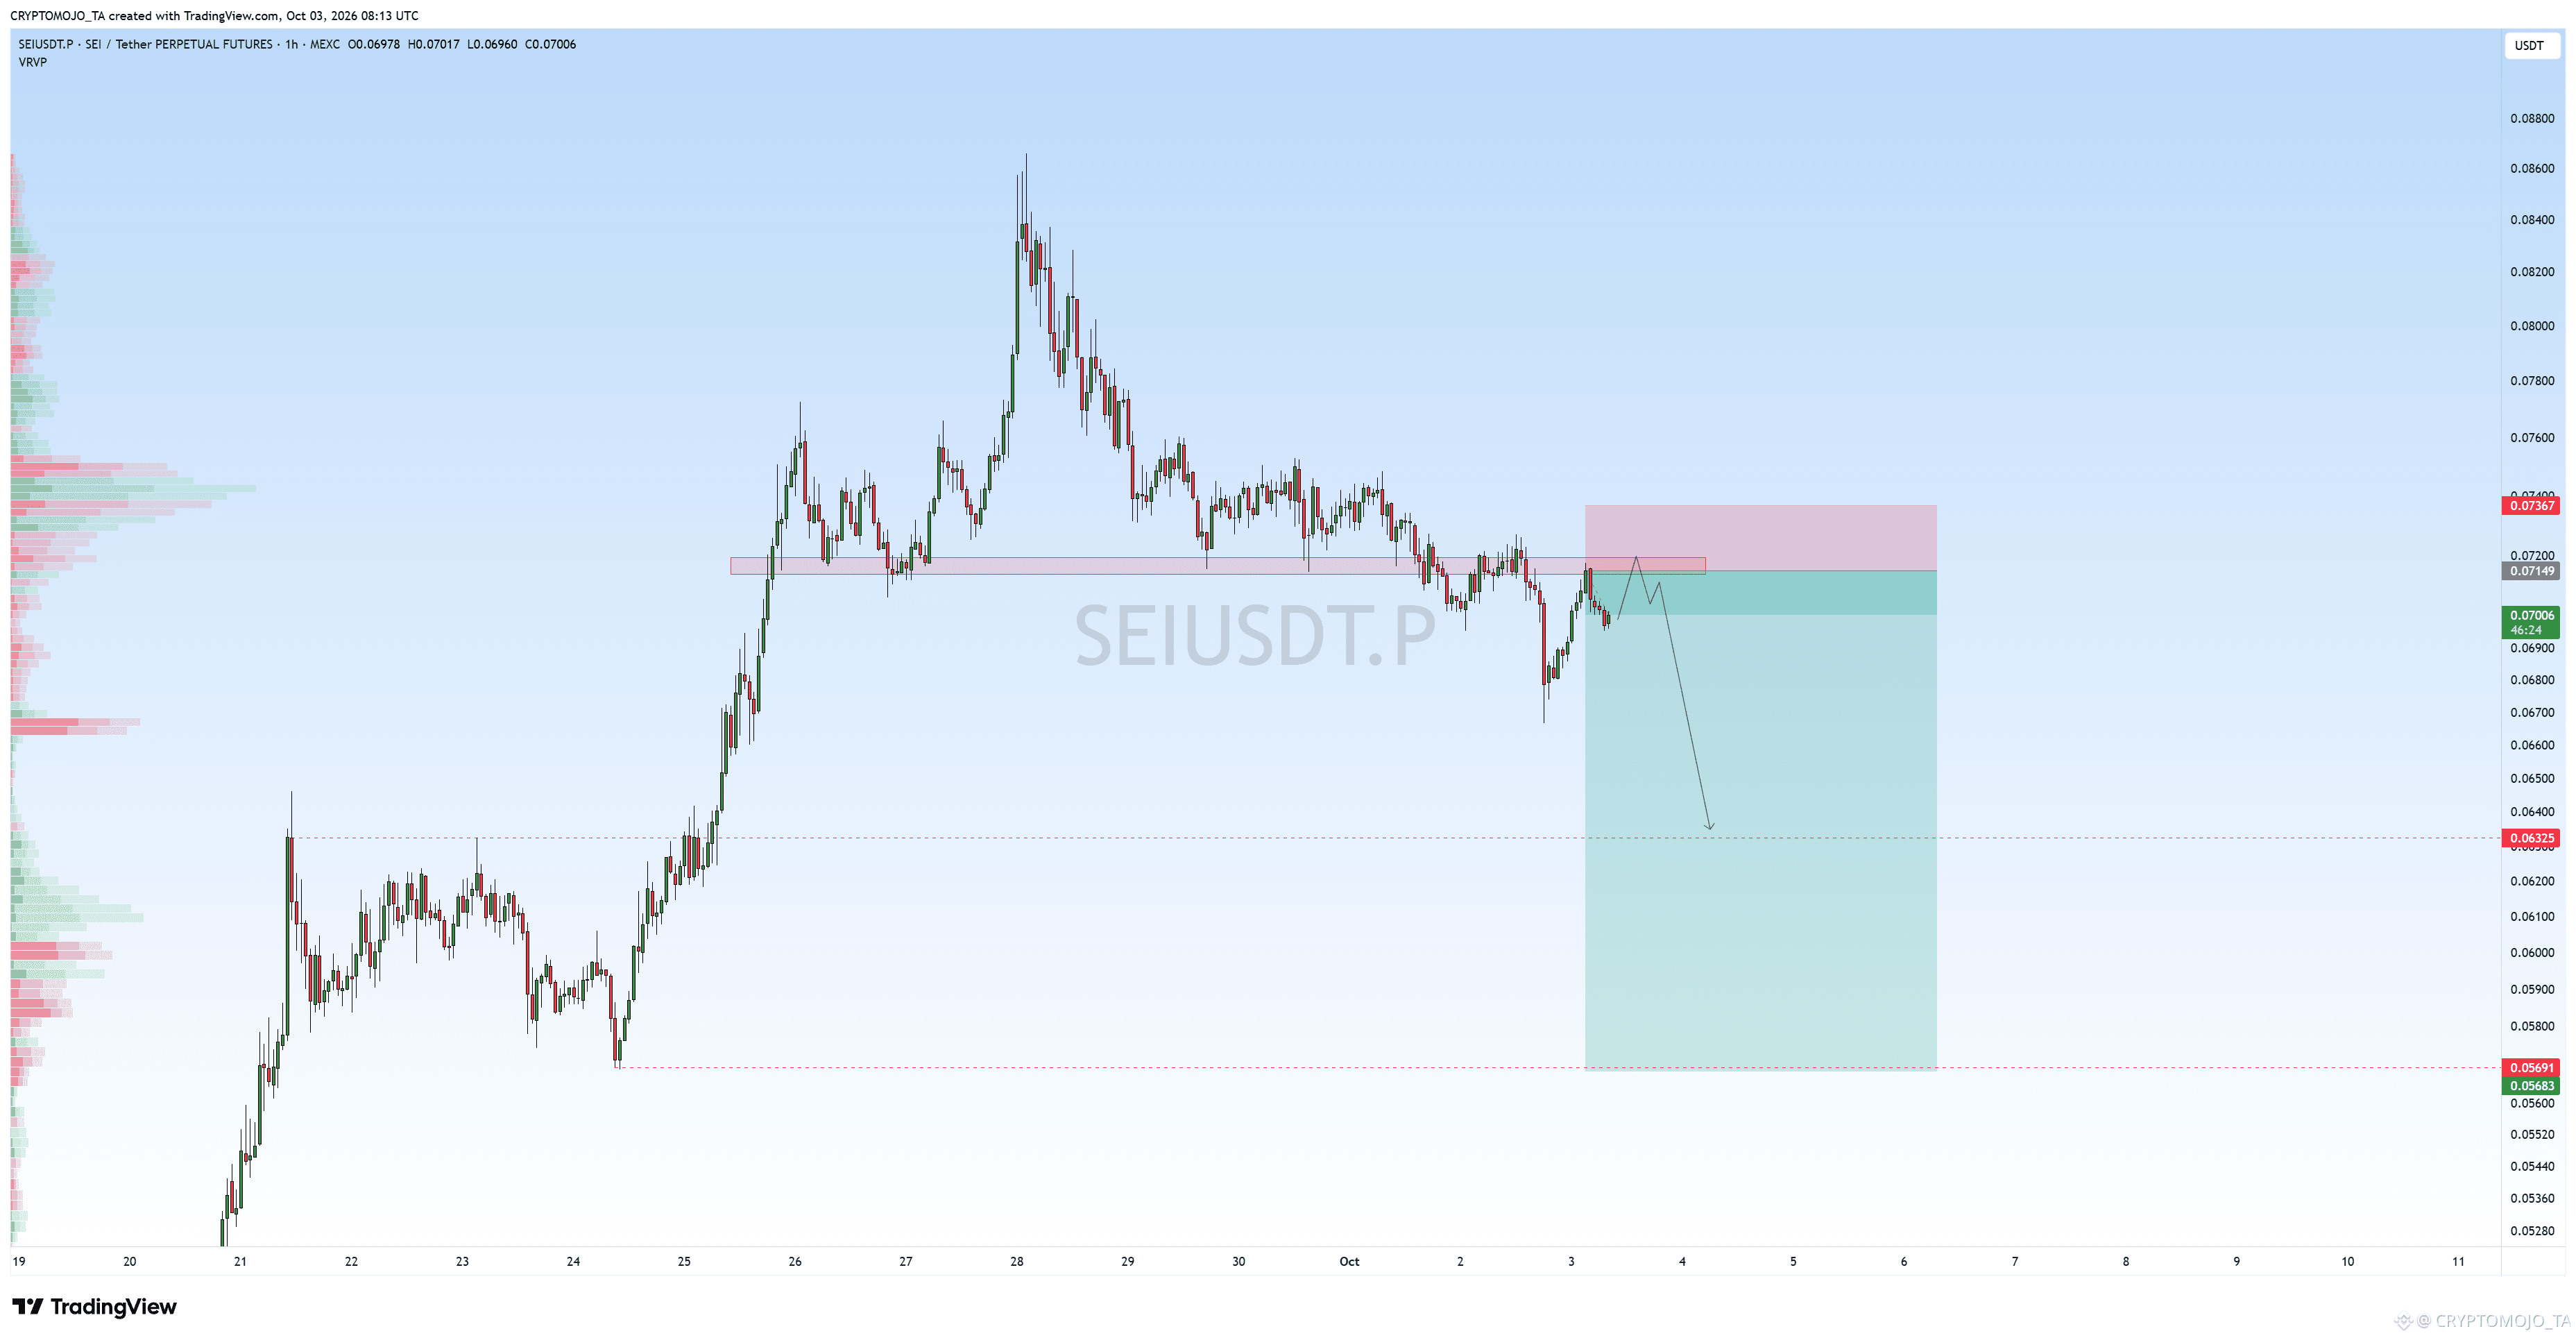
$SEI Short Setup
This looks good for a short here, with the SL around $0.0737.
Price has broken down below the previous support and is now retesting that same zone as resistance.
With the invalidation above the resistance area and downside targets around $0.0633, the setup offers a good risk-to-reward ratio.
Short: ~$0.0710–$0.0715
SL: $0.0737
Watching the retest closely.
$SEI Short Setup
This looks good for a short here, with the SL around $0.0737.
Price has broken down below the previous support and is now retesting that same zone as resistance.
With the invalidation above the resistance area and downside targets around $0.0633, the setup offers a good risk-to-reward ratio.
Short: ~$0.0710–$0.0715
SL: $0.0737
Watching the retest closely.
This looks good for a short here, with the SL around $0.0737.
Price has broken down below the previous support and is now retesting that same zone as resistance.
With the invalidation above the resistance area and downside targets around $0.0633, the setup offers a good risk-to-reward ratio.
Short: ~$0.0710–$0.0715
SL: $0.0737
Watching the retest closely.
183
See translation
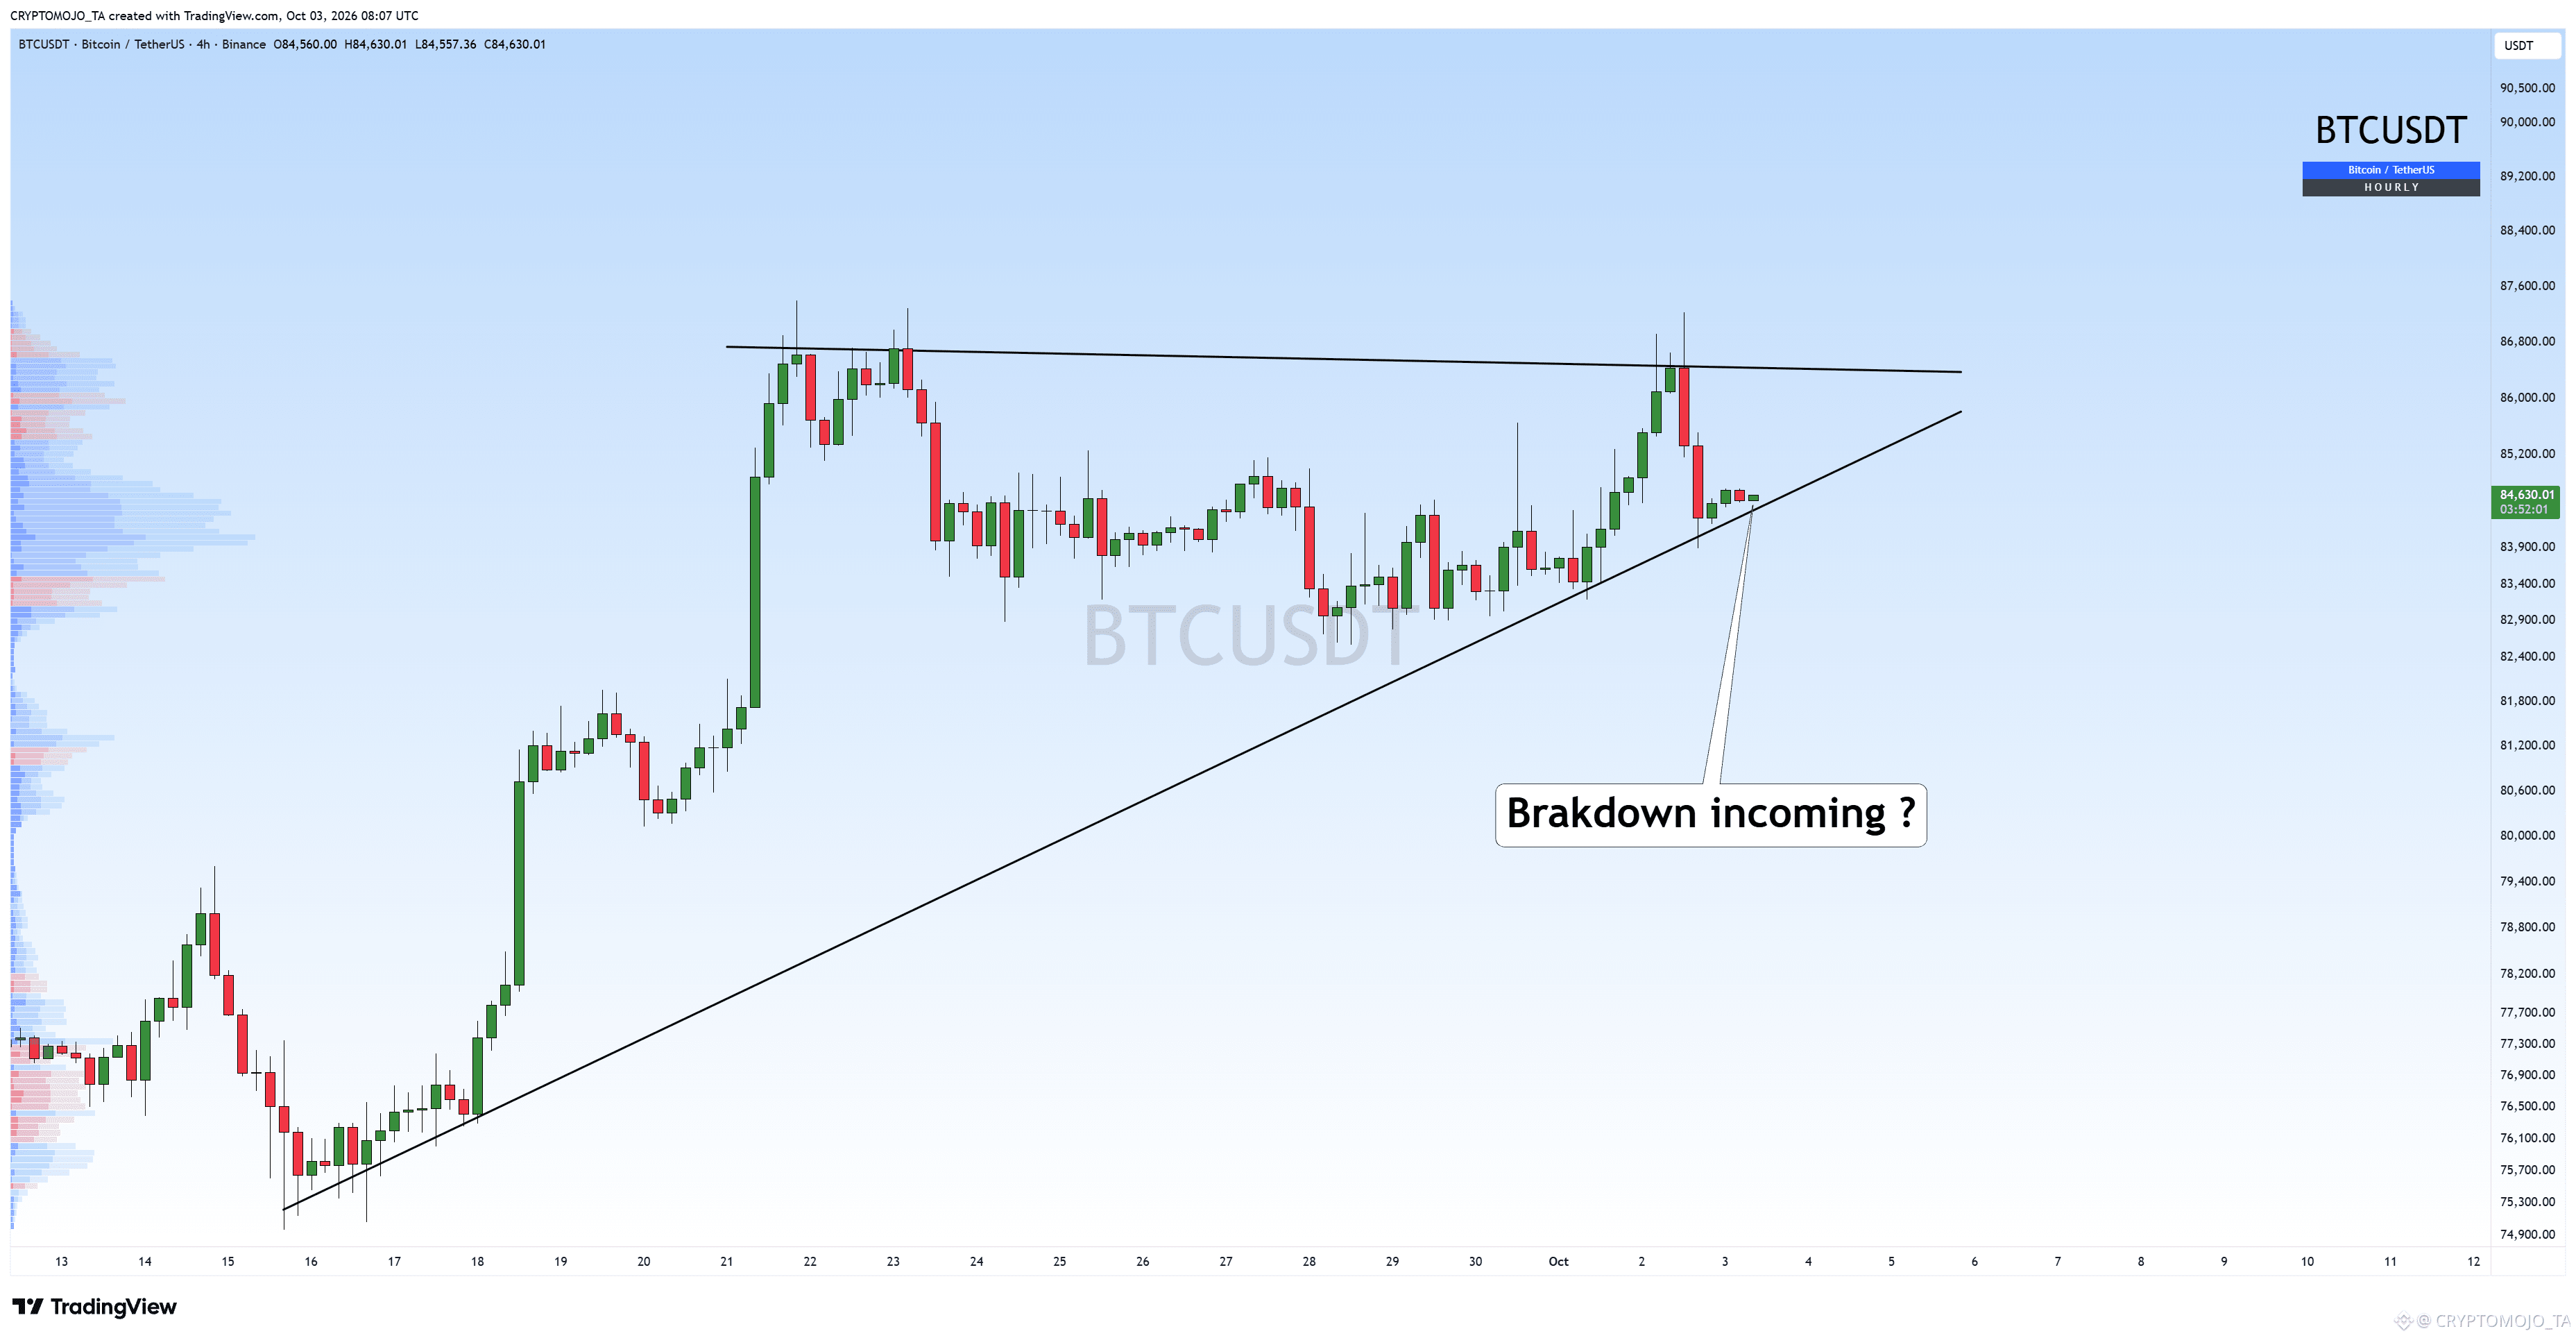
$BTC at a critical point here. 👀
Price is compressing inside this structure, with the ascending trendline getting tested again.
A breakdown below this trendline could trigger a sharper move lower, while holding it could keep #BTC inside the range.
Breakdown incoming or another bounce?
$BTC at a critical point here. 👀
Price is compressing inside this structure, with the ascending trendline getting tested again.
A breakdown below this trendline could trigger a sharper move lower, while holding it could keep #BTC inside the range.
Breakdown incoming or another bounce?
Price is compressing inside this structure, with the ascending trendline getting tested again.
A breakdown below this trendline could trigger a sharper move lower, while holding it could keep #BTC inside the range.
Breakdown incoming or another bounce?
105
·
--
Bearish
See translation
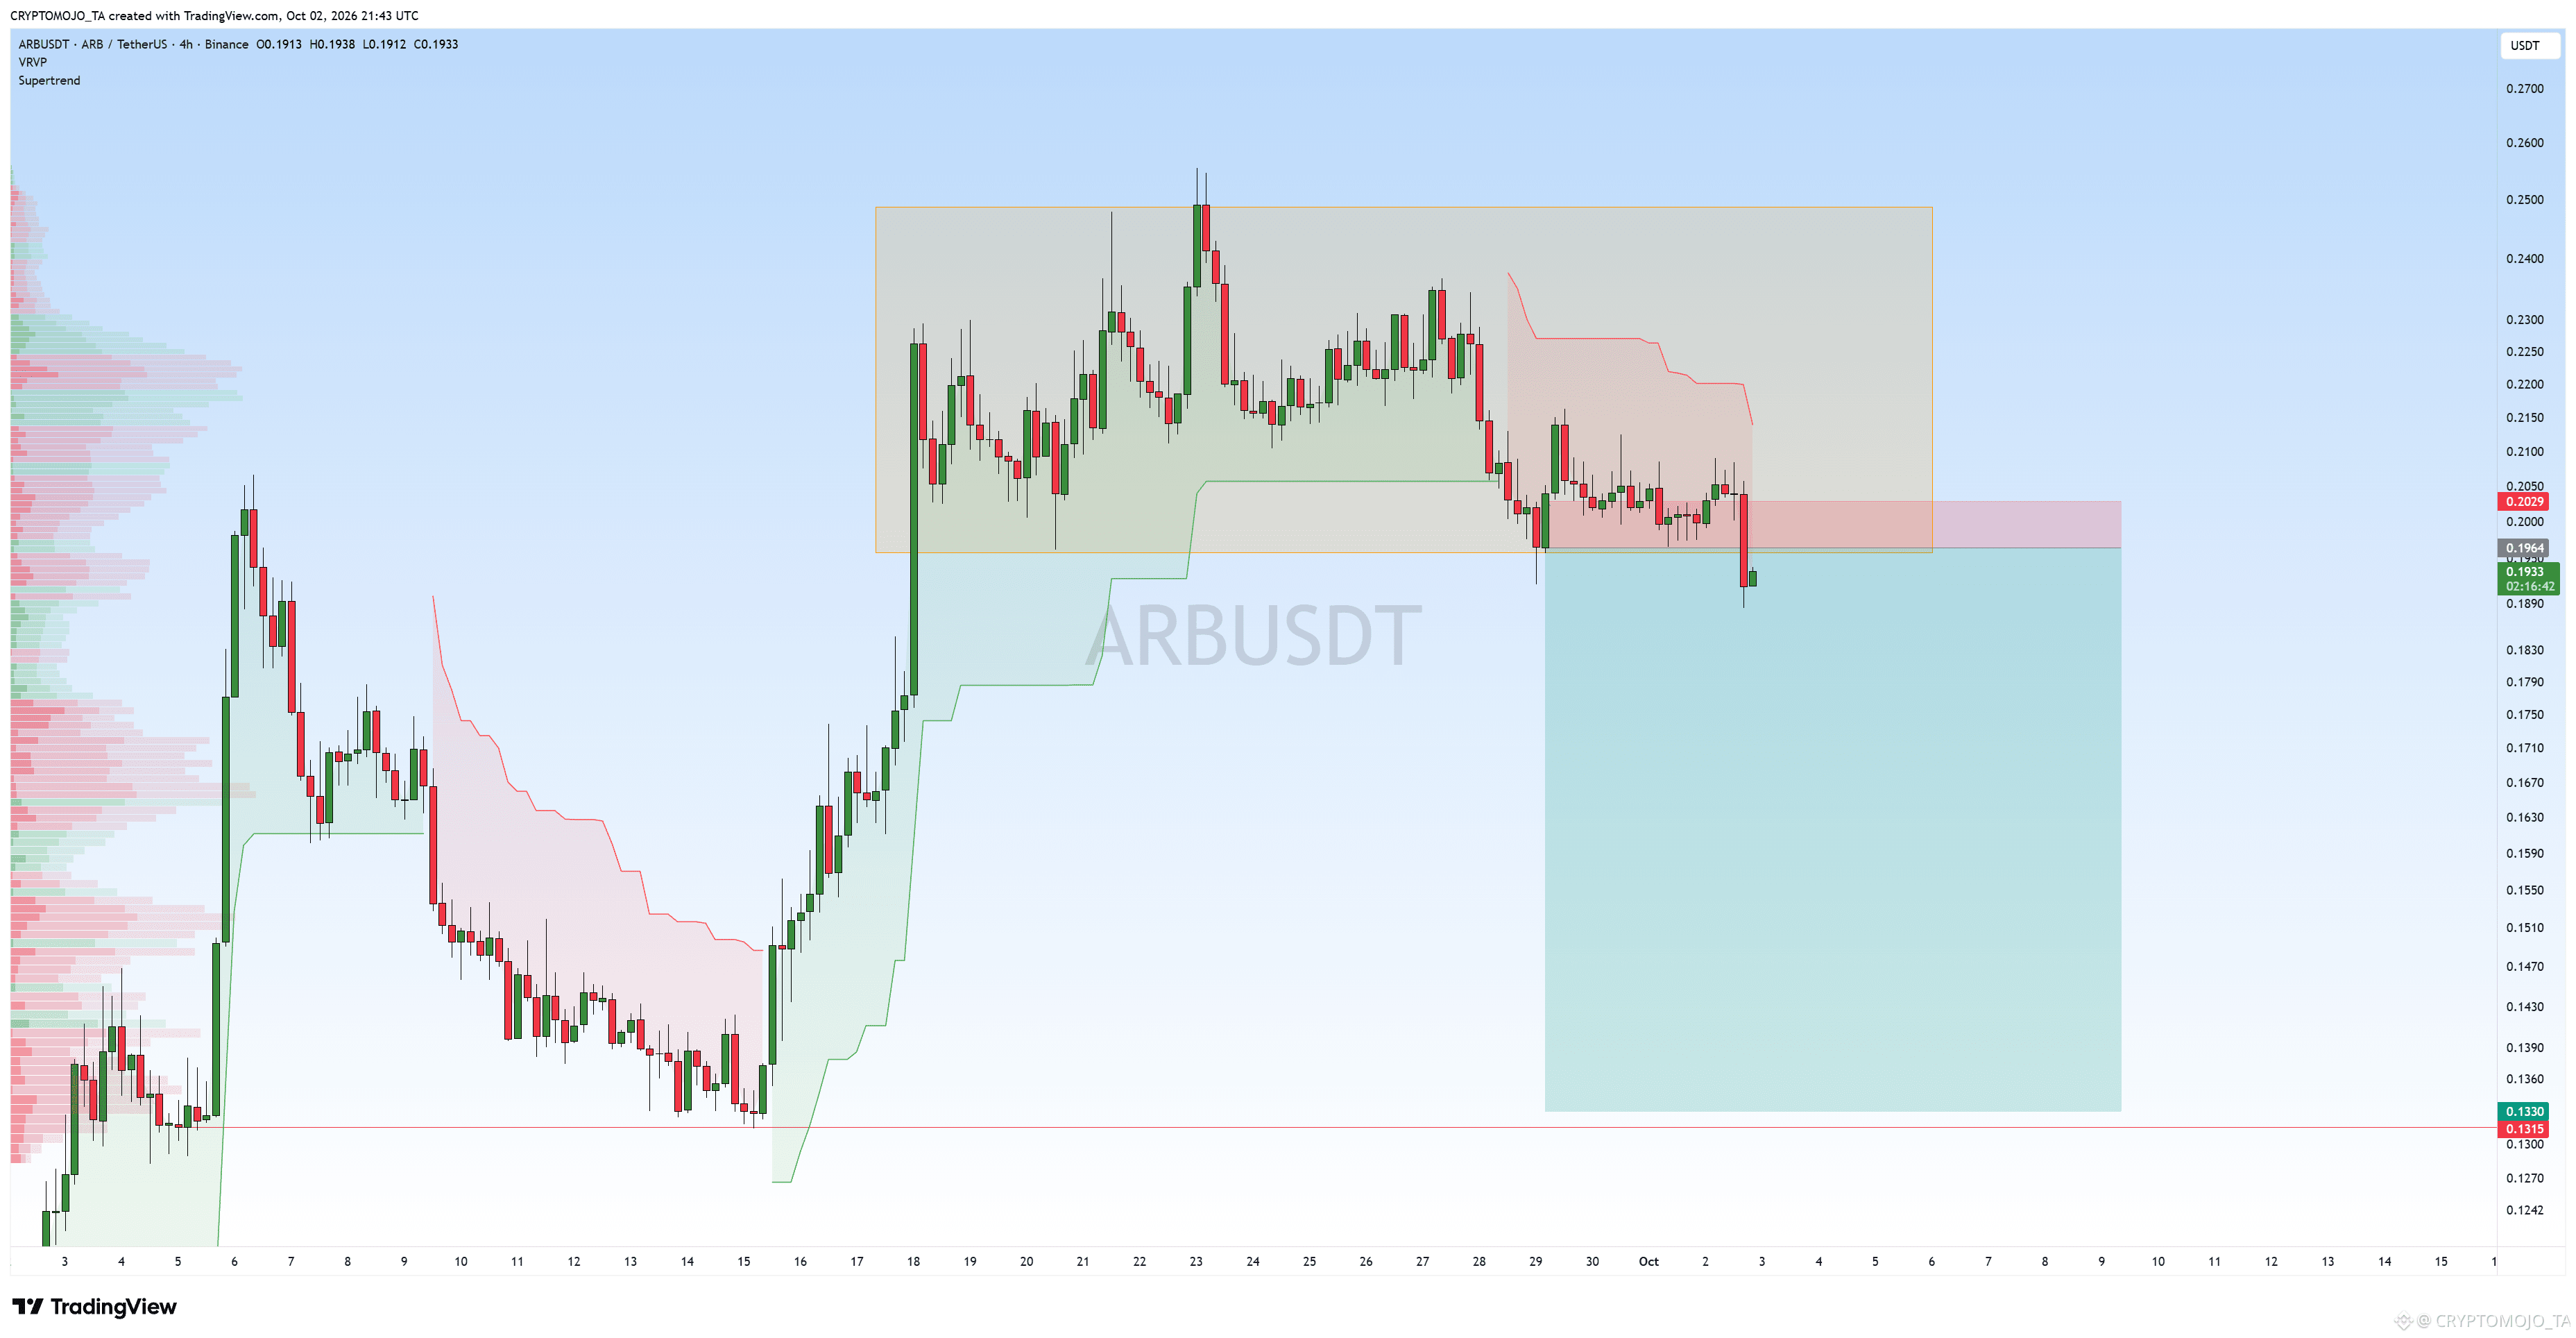
$ARB is looking weak here.
Price has broken below the $0.196 support after spending days consolidating above it.
If this breakdown holds, we could see a move toward the $0.15–$0.14 zone.
The structure is turning bearish, watching for a retest of the breakdown level. 👀
$ARB is looking weak here.
Price has broken below the $0.196 support after spending days consolidating above it.
If this breakdown holds, we could see a move toward the $0.15–$0.14 zone.
The structure is turning bearish, watching for a retest of the breakdown level. 👀
Price has broken below the $0.196 support after spending days consolidating above it.
If this breakdown holds, we could see a move toward the $0.15–$0.14 zone.
The structure is turning bearish, watching for a retest of the breakdown level. 👀
117
See translation
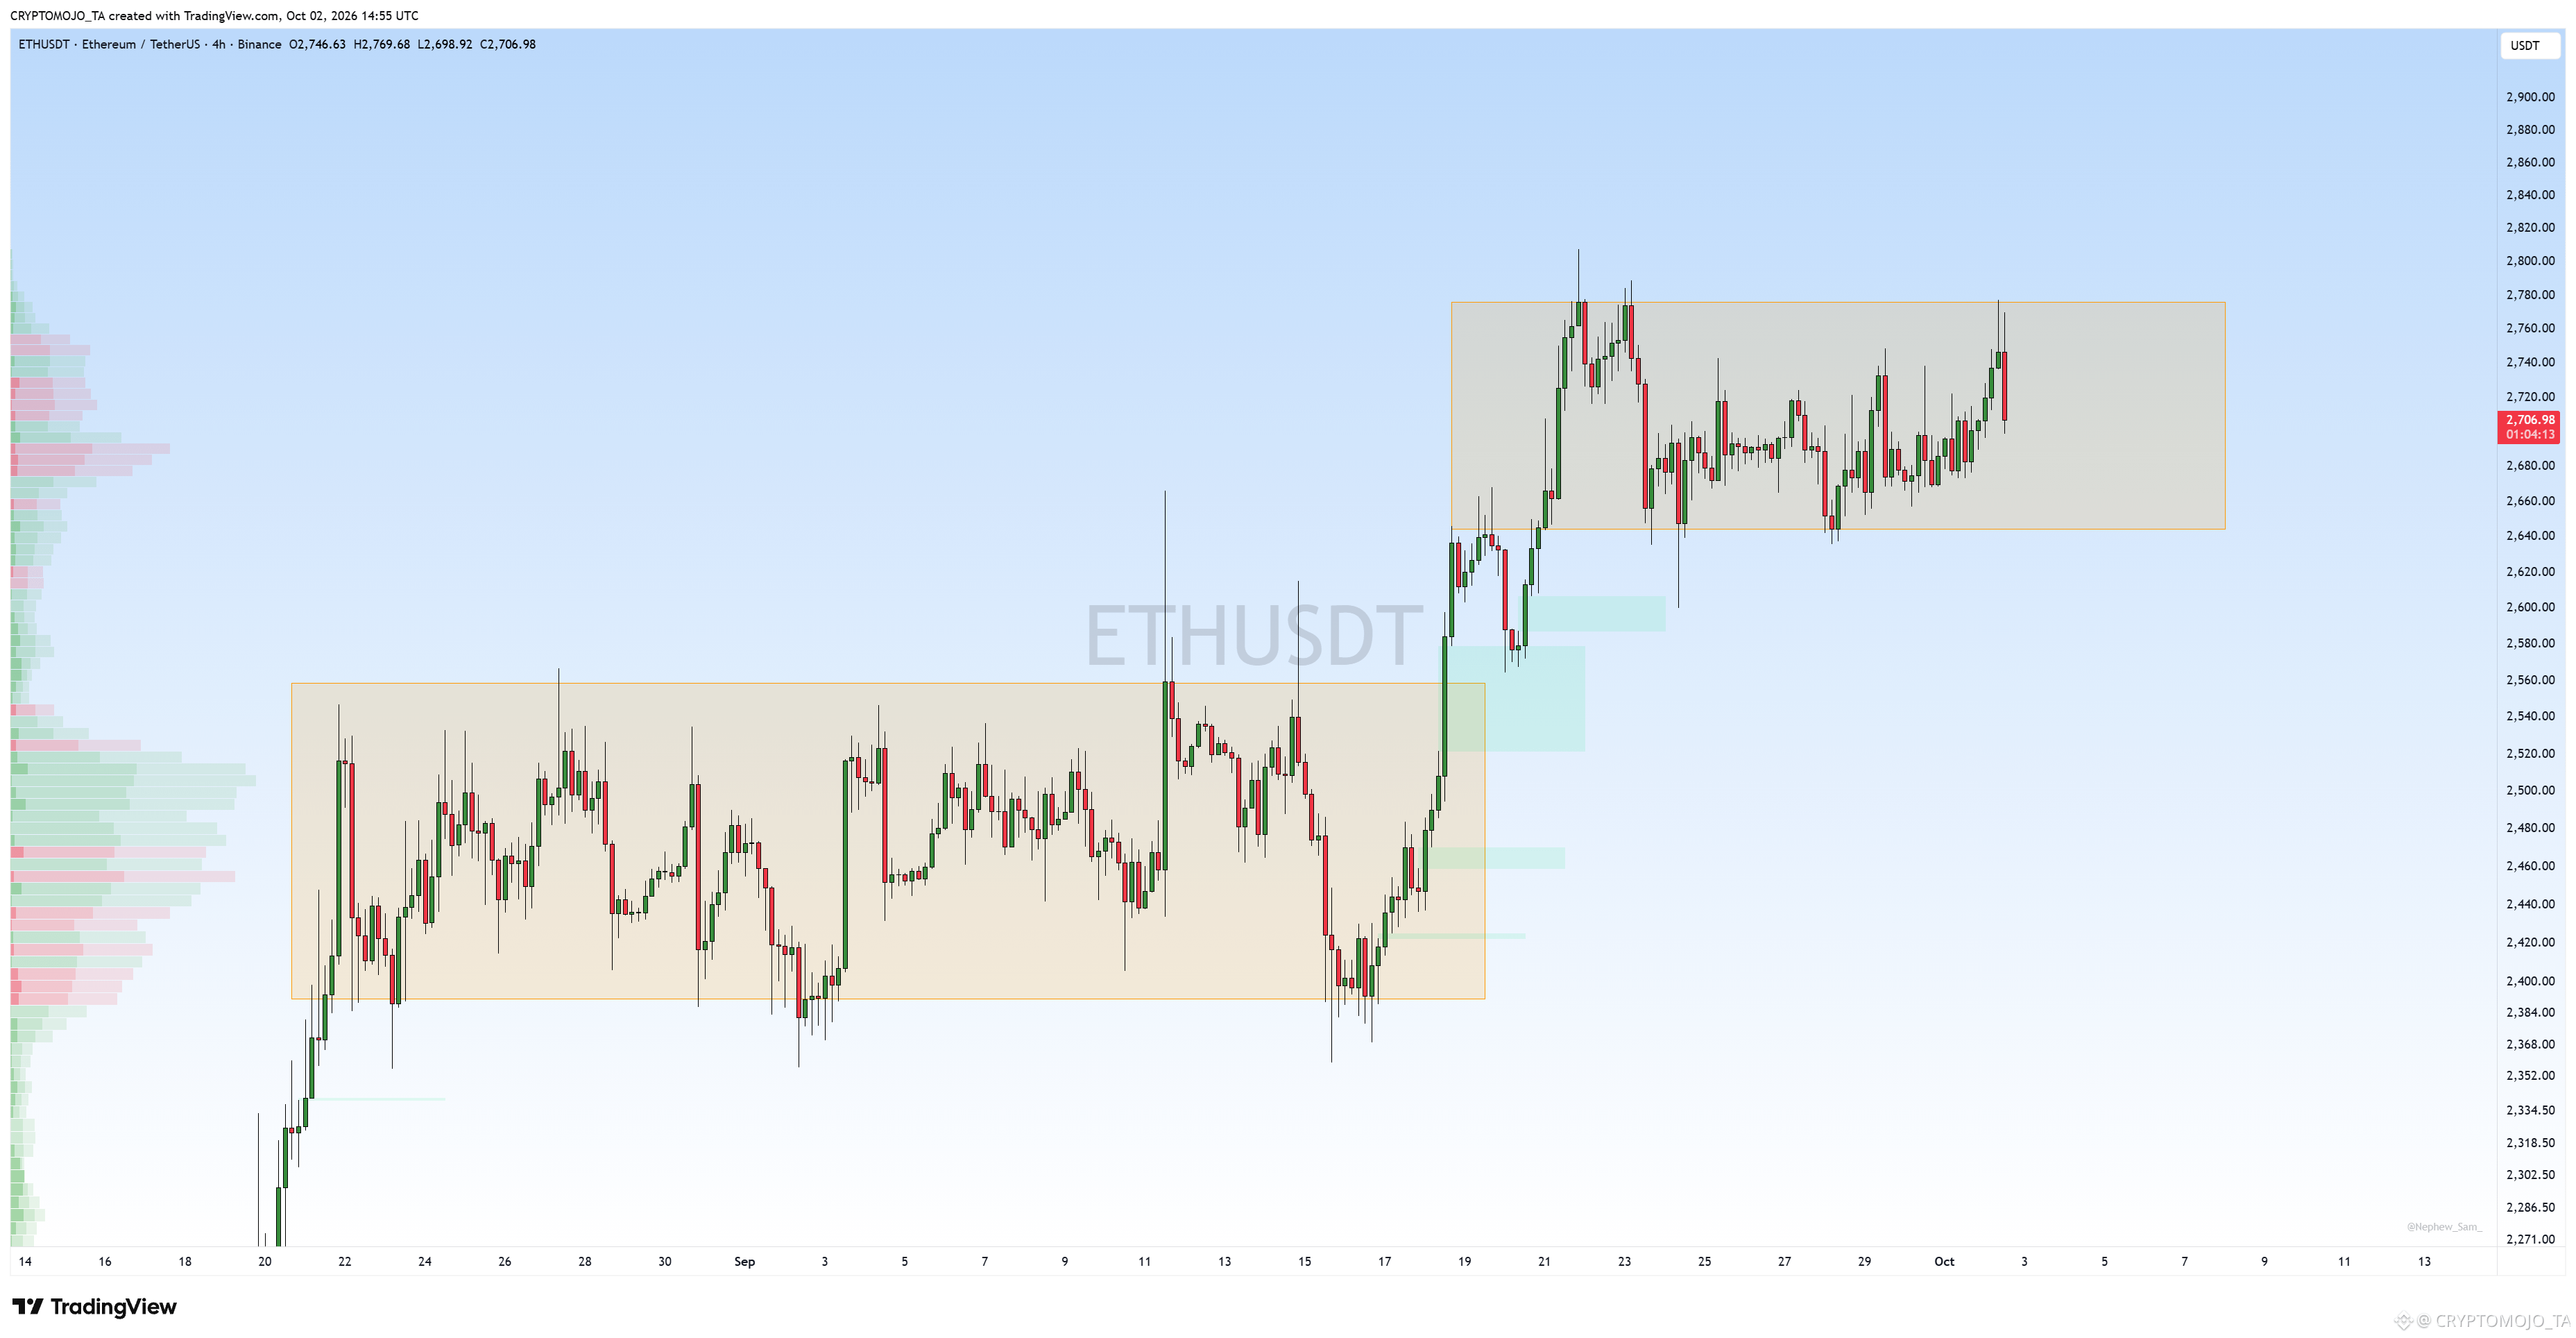
#ETH is still consolidating inside this range, between roughly $2,640–$2,780.
Price is again moving toward the upper range resistance around $2,780. A clean breakout above this level could open the way toward $2,850–$2,900.
On the other hand, if ETH gets rejected again, $2,640–$2,650 remains the key support zone.
So far, the range is still intact.
$2,780 for the breakout, $2,650 for the breakdown. Let’s see which side breaks first. 👀
#ETH is still consolidating inside this range, between roughly $2,640–$2,780.
Price is again moving toward the upper range resistance around $2,780. A clean breakout above this level could open the way toward $2,850–$2,900.
On the other hand, if ETH gets rejected again, $2,640–$2,650 remains the key support zone.
So far, the range is still intact.
$2,780 for the breakout, $2,650 for the breakdown. Let’s see which side breaks first. 👀
Price is again moving toward the upper range resistance around $2,780. A clean breakout above this level could open the way toward $2,850–$2,900.
On the other hand, if ETH gets rejected again, $2,640–$2,650 remains the key support zone.
So far, the range is still intact.
$2,780 for the breakout, $2,650 for the breakdown. Let’s see which side breaks first. 👀
160
See translation
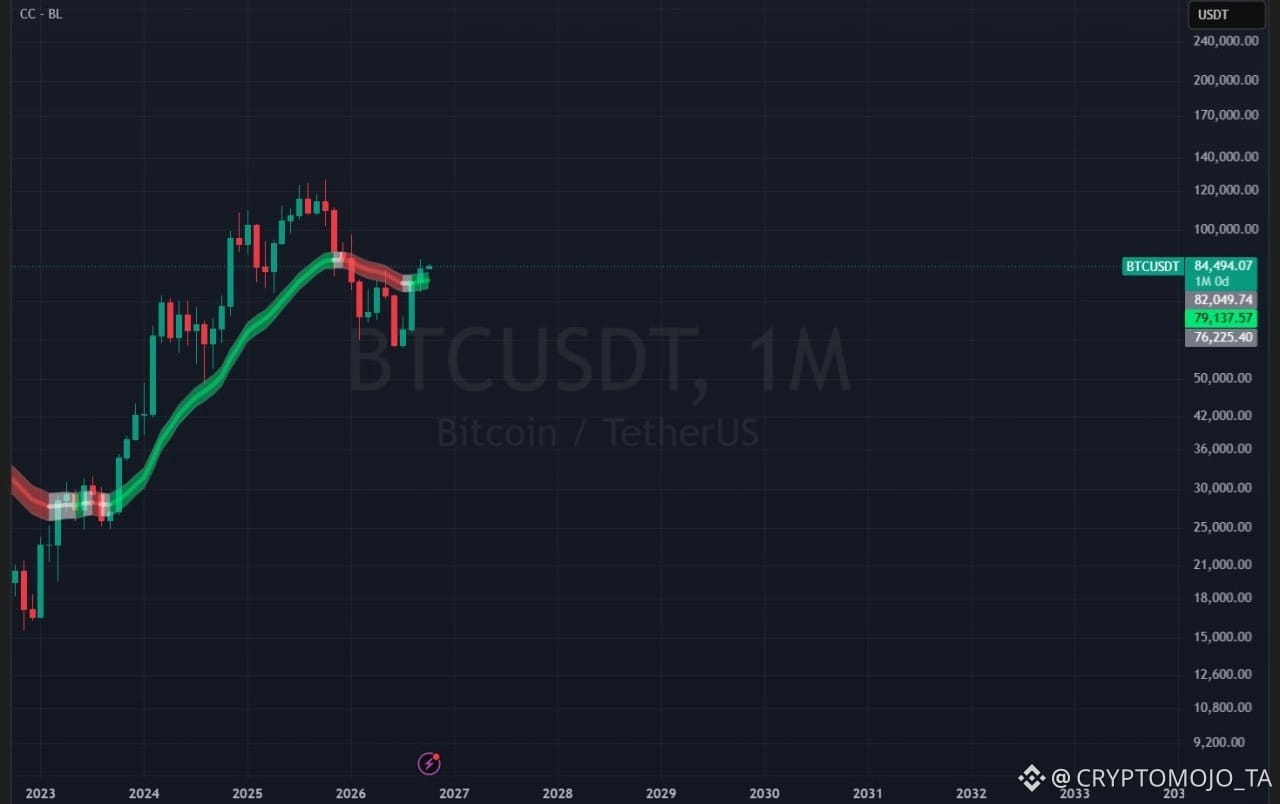
#Bitcoin has closed back above its 21-month EMA after losing it in January a meaningful improvement in the higher-timeframe picture.
For me, this strengthens the case for a push toward $100,000 into year-end. Reclaiming the EMA is an encouraging first step; holding it as support and seeing continued upside follow-through would give this move more credibility.
As long as that reclaim holds, my bias remains bullish. A monthly close back below the EMA would weaken the thesis.
#Bitcoin has closed back above its 21-month EMA after losing it in January a meaningful improvement in the higher-timeframe picture.
For me, this strengthens the case for a push toward $100,000 into year-end. Reclaiming the EMA is an encouraging first step; holding it as support and seeing continued upside follow-through would give this move more credibility.
As long as that reclaim holds, my bias remains bullish. A monthly close back below the EMA would weaken the thesis.
For me, this strengthens the case for a push toward $100,000 into year-end. Reclaiming the EMA is an encouraging first step; holding it as support and seeing continued upside follow-through would give this move more credibility.
As long as that reclaim holds, my bias remains bullish. A monthly close back below the EMA would weaken the thesis.
1
149
·
--
Bearish
See translation
$GOLD Update 👀
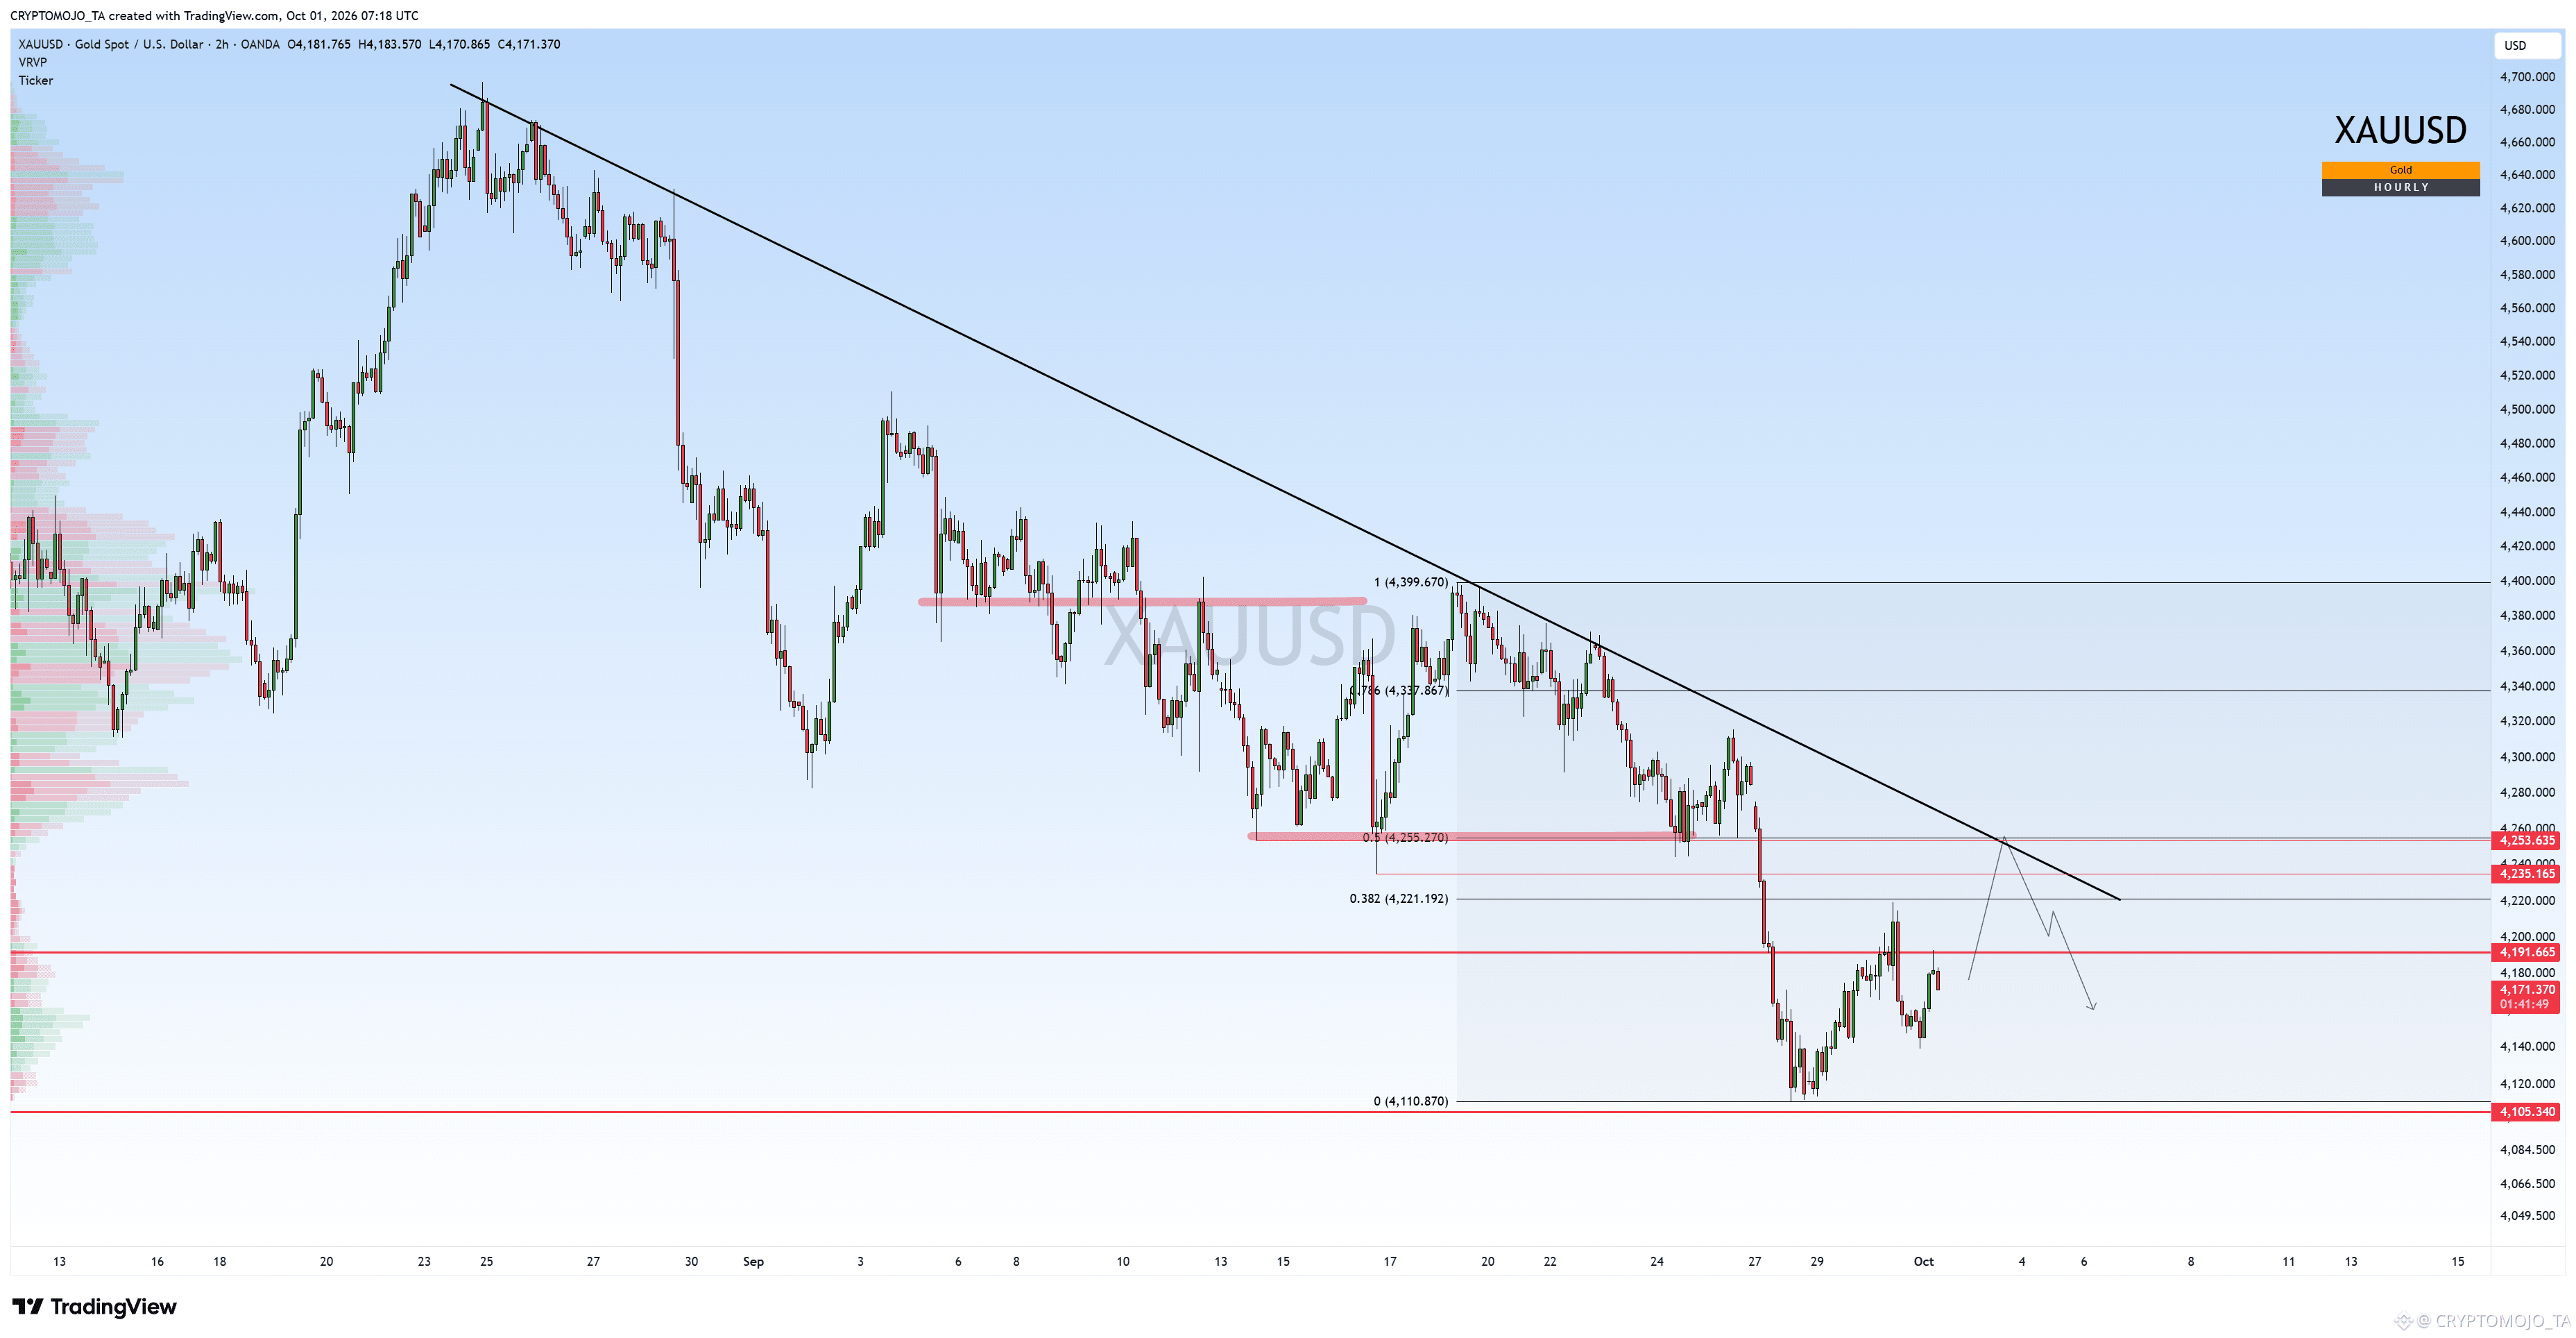
Gold is bouncing from the $4,140 area after the sharp breakdown, but for now this looks more like a counter-trend correction within the broader bearish structure.
The Fibonacci levels on the chart are also lining up well with the resistance areas:
0.382 Fib: ~$4,221
Key horizontal resistance: ~$4,235
0.5 Fib: ~$4,255
So the $4,220–$4,255 zone is a very important area for this bounce. It also lines up with the previous breakdown and the descending trendline, making it a strong area to watch for a possible rejection.
If Gold reaches this zone and fails to reclaim it, the downside levels remain $4,140, followed by the 0 Fib around $4,111 and the $4,100 area.
The broader fundamental backdrop also remains a headwind, with a stronger dollar, elevated yields and strong US data keeping pressure on gold. With important US economic data ahead, volatility could increase.
But if Gold manages to reclaim $4,255 and breaks back above the descending trendline, the bearish setup would start to weaken.
For now, $4,220–$4,255 is the main zone I’m watching. The reaction here could decide whether this is just a relief bounce or the start of a bigger recovery.
#GOLD
$GOLD Update 👀
Gold is bouncing from the $4,140 area after the sharp breakdown, but for now this looks more like a counter-trend correction within the broader bearish structure.
The Fibonacci levels on the chart are also lining up well with the resistance areas:
0.382 Fib: ~$4,221
Key horizontal resistance: ~$4,235
0.5 Fib: ~$4,255
So the $4,220–$4,255 zone is a very important area for this bounce. It also lines up with the previous breakdown and the descending trendline, making it a strong area to watch for a possible rejection.
If Gold reaches this zone and fails to reclaim it, the downside levels remain $4,140, followed by the 0 Fib around $4,111 and the $4,100 area.
The broader fundamental backdrop also remains a headwind, with a stronger dollar, elevated yields and strong US data keeping pressure on gold. With important US economic data ahead, volatility could increase.
But if Gold manages to reclaim $4,255 and breaks back above the descending trendline, the bearish setup would start to weaken.
For now, $4,220–$4,255 is the main zone I’m watching. The reaction here could decide whether this is just a relief bounce or the start of a bigger recovery.
#GOLD
Gold is bouncing from the $4,140 area after the sharp breakdown, but for now this looks more like a counter-trend correction within the broader bearish structure.
The Fibonacci levels on the chart are also lining up well with the resistance areas:
0.382 Fib: ~$4,221
Key horizontal resistance: ~$4,235
0.5 Fib: ~$4,255
So the $4,220–$4,255 zone is a very important area for this bounce. It also lines up with the previous breakdown and the descending trendline, making it a strong area to watch for a possible rejection.
If Gold reaches this zone and fails to reclaim it, the downside levels remain $4,140, followed by the 0 Fib around $4,111 and the $4,100 area.
The broader fundamental backdrop also remains a headwind, with a stronger dollar, elevated yields and strong US data keeping pressure on gold. With important US economic data ahead, volatility could increase.
But if Gold manages to reclaim $4,255 and breaks back above the descending trendline, the bearish setup would start to weaken.
For now, $4,220–$4,255 is the main zone I’m watching. The reaction here could decide whether this is just a relief bounce or the start of a bigger recovery.
#GOLD
354
See translation
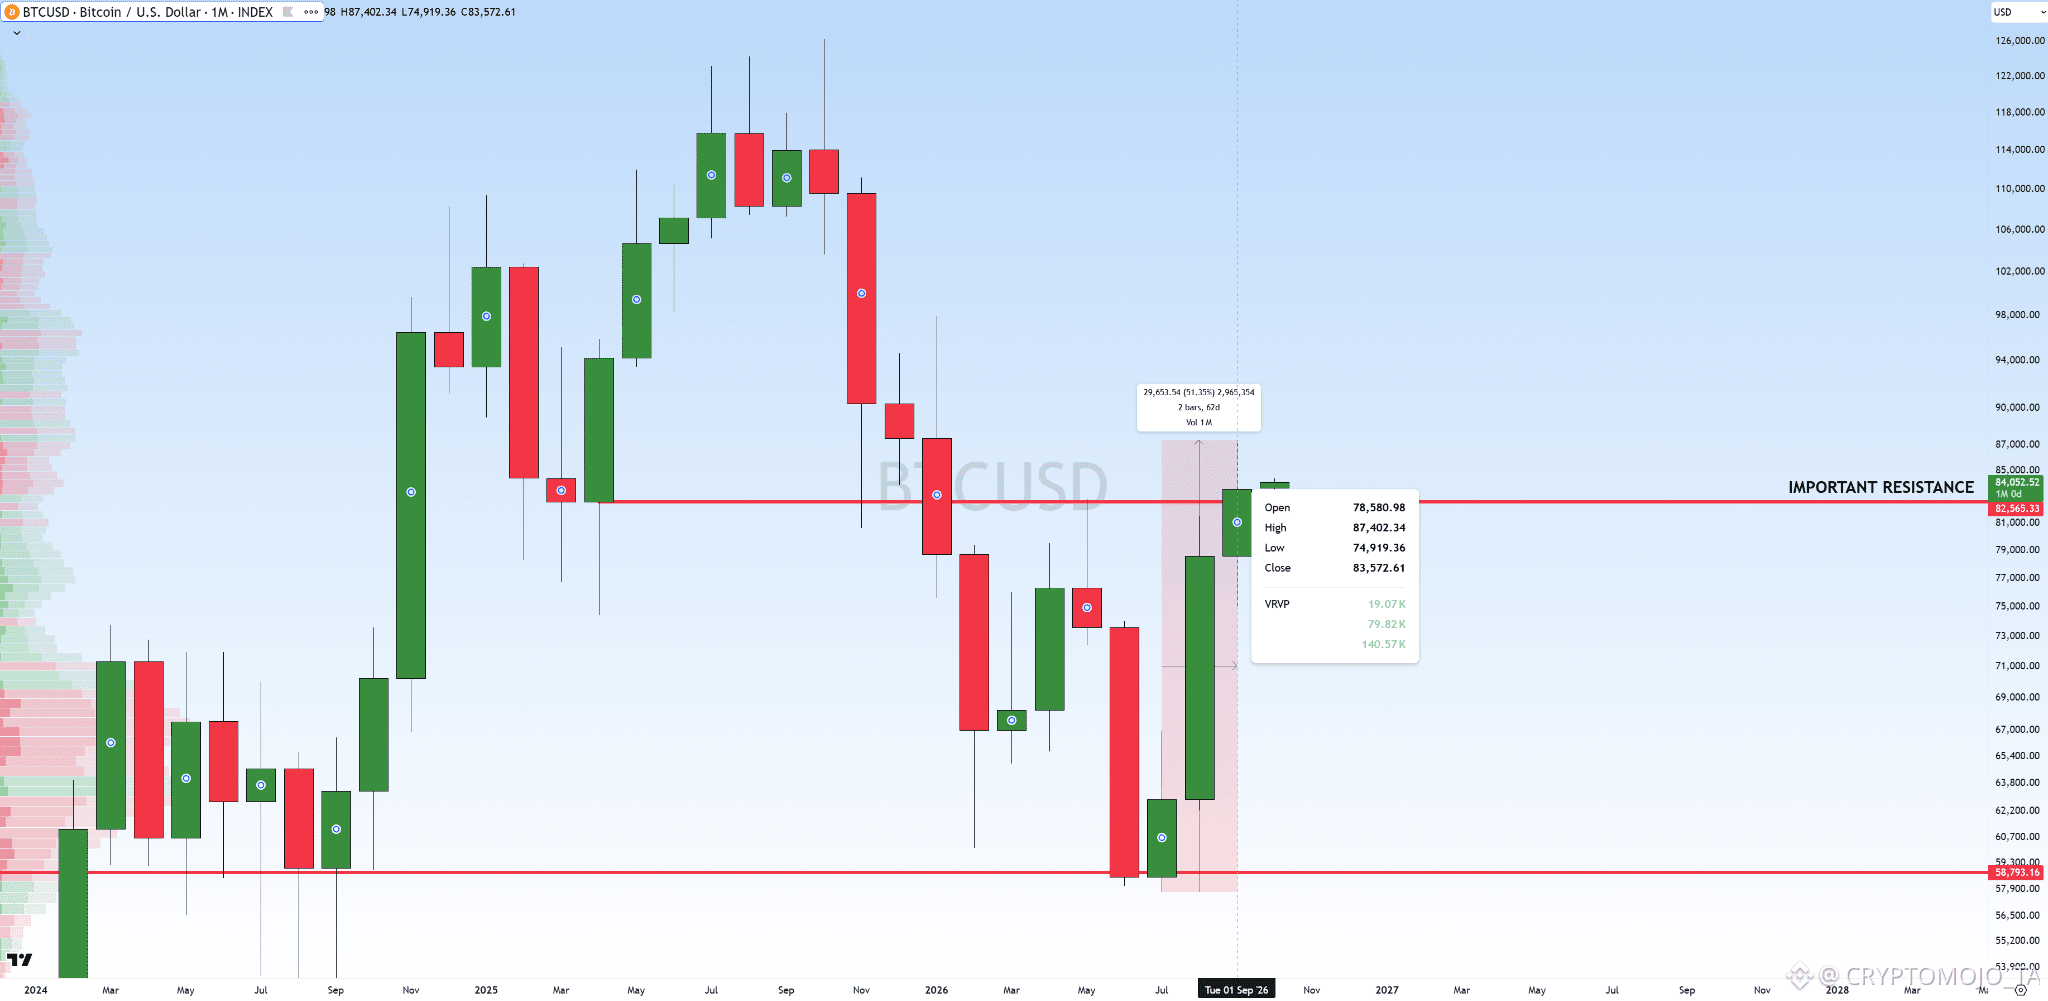
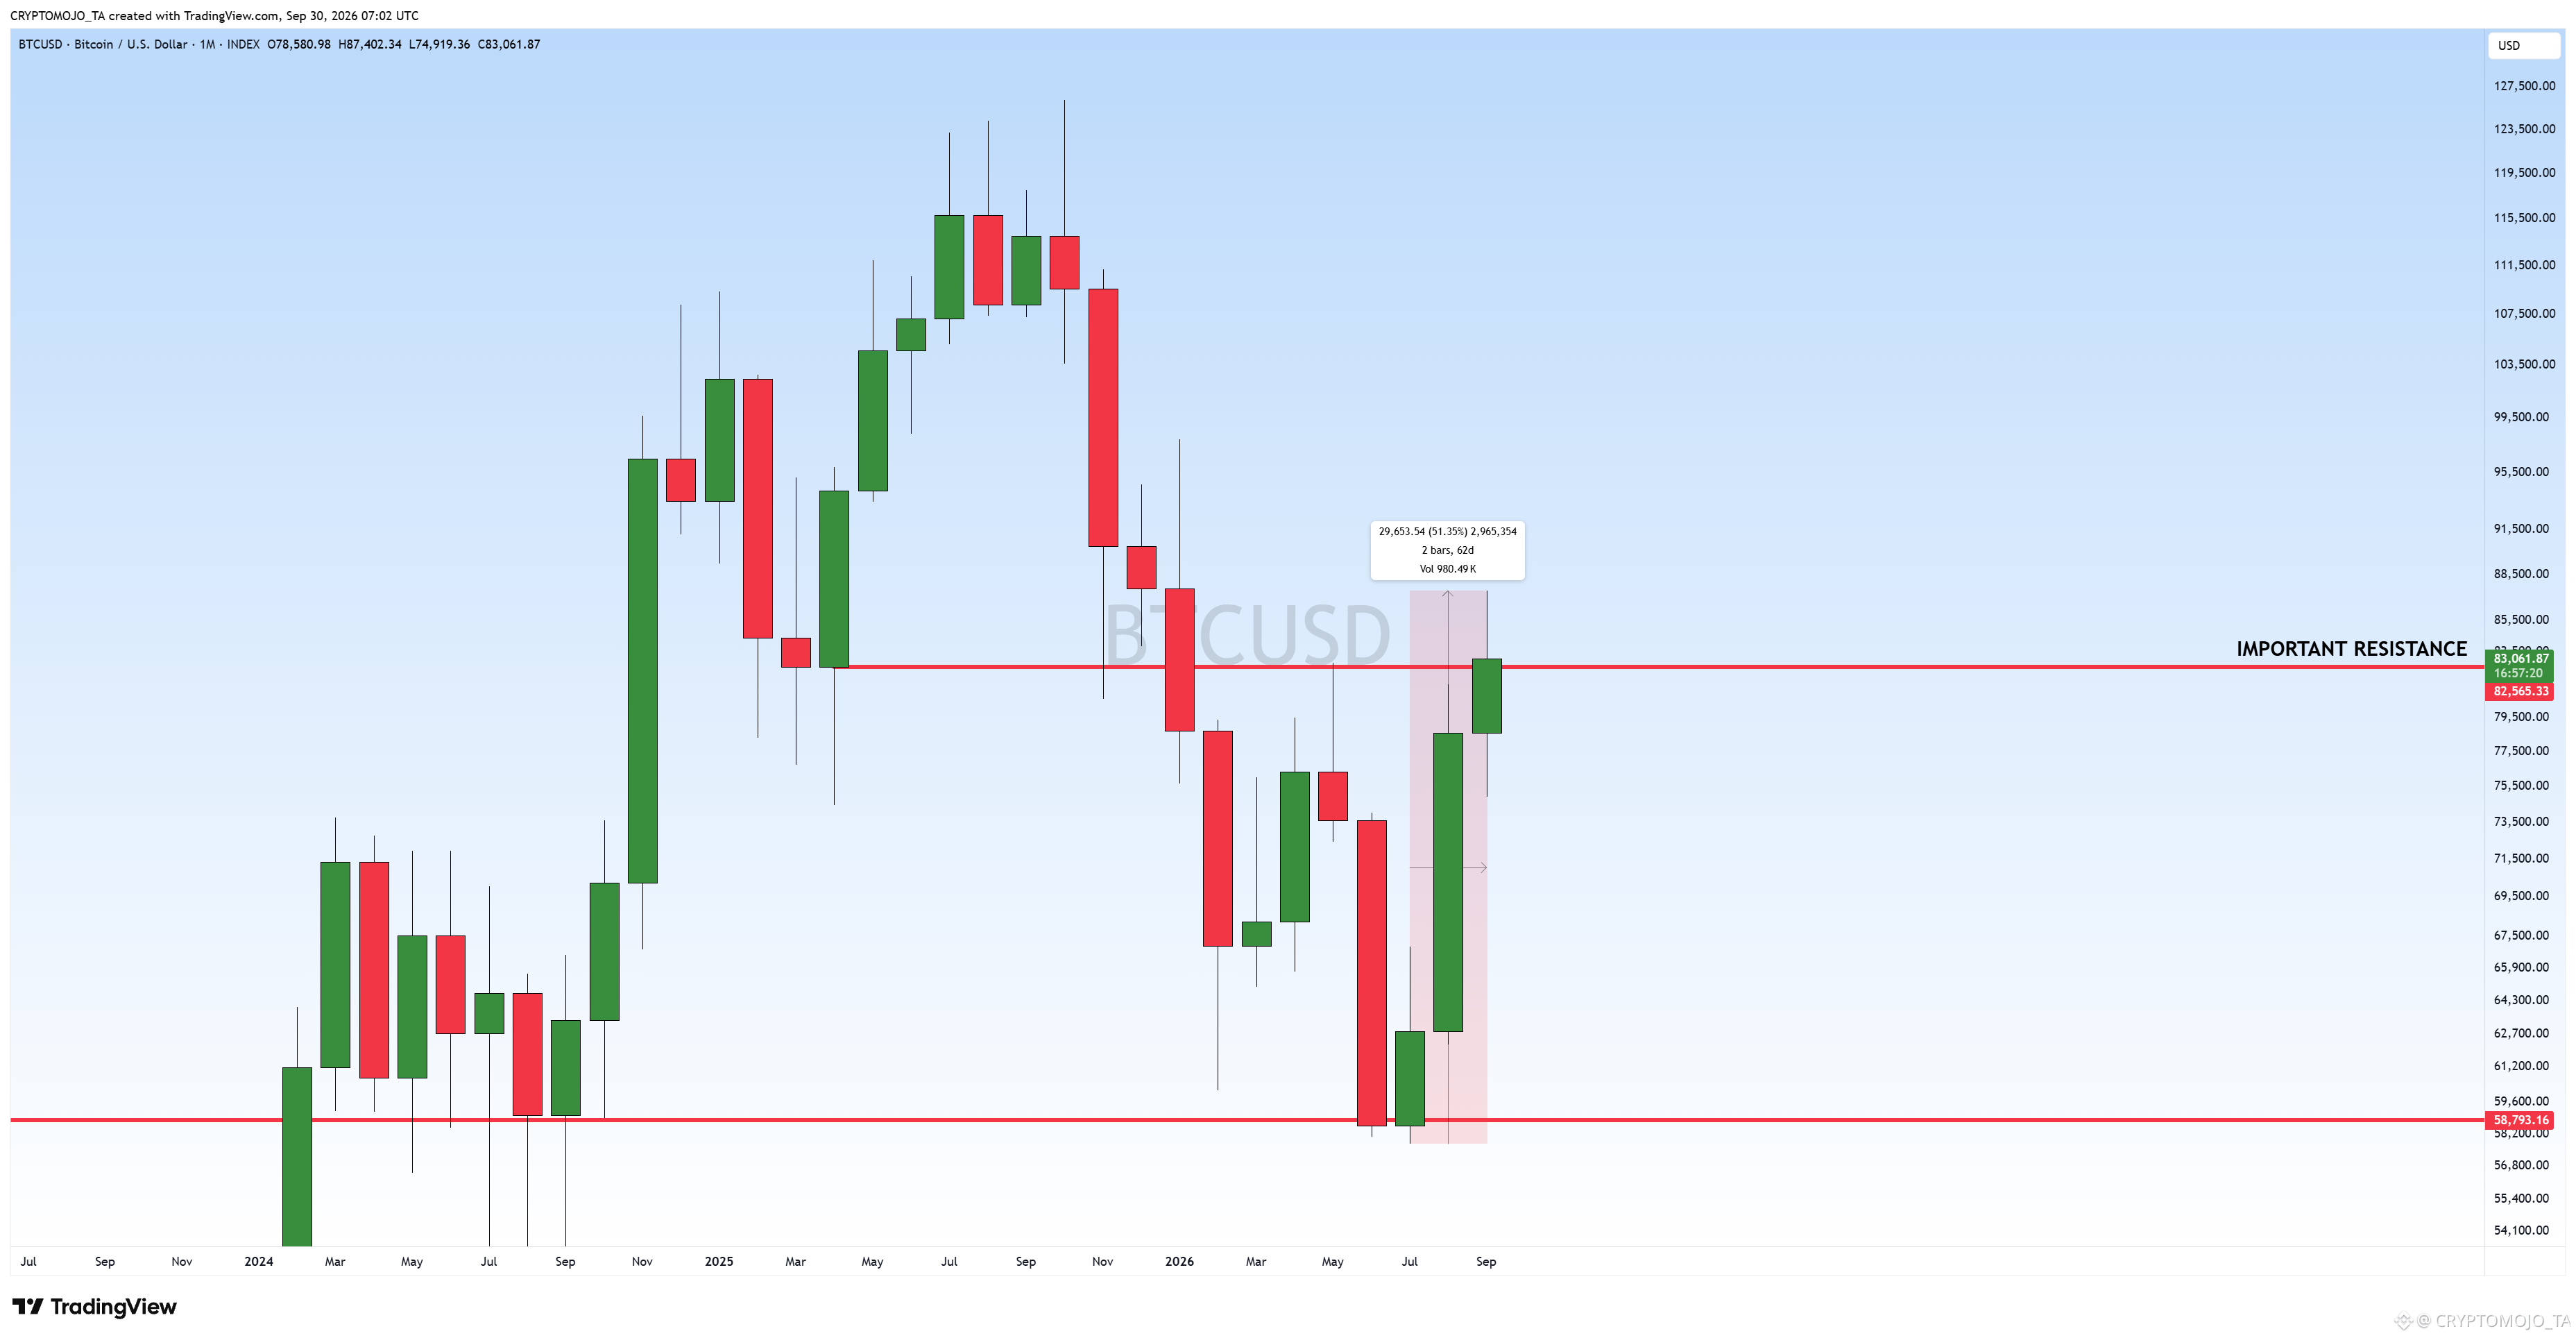
$BTC monthly breakout confirmed? 👀
BTC has now closed 3 consecutive monthly candles green, with the latest candle closing above the key $82.5K resistance.
After bouncing nearly 43% from the $58.8K low, BTC is showing strong momentum.
Now the key is whether we can hold above $82.5K and continue higher.
Next major zone: $87K–$9
$BTC monthly breakout confirmed? 👀
BTC has now closed 3 consecutive monthly candles green, with the latest candle closing above the key $82.5K resistance.
After bouncing nearly 43% from the $58.8K low, BTC is showing strong momentum.
Now the key is whether we can hold above $82.5K and continue higher.
Next major zone: $87K–$9
BTC has now closed 3 consecutive monthly candles green, with the latest candle closing above the key $82.5K resistance.
After bouncing nearly 43% from the $58.8K low, BTC is showing strong momentum.
Now the key is whether we can hold above $82.5K and continue higher.
Next major zone: $87K–$9
135
See translation
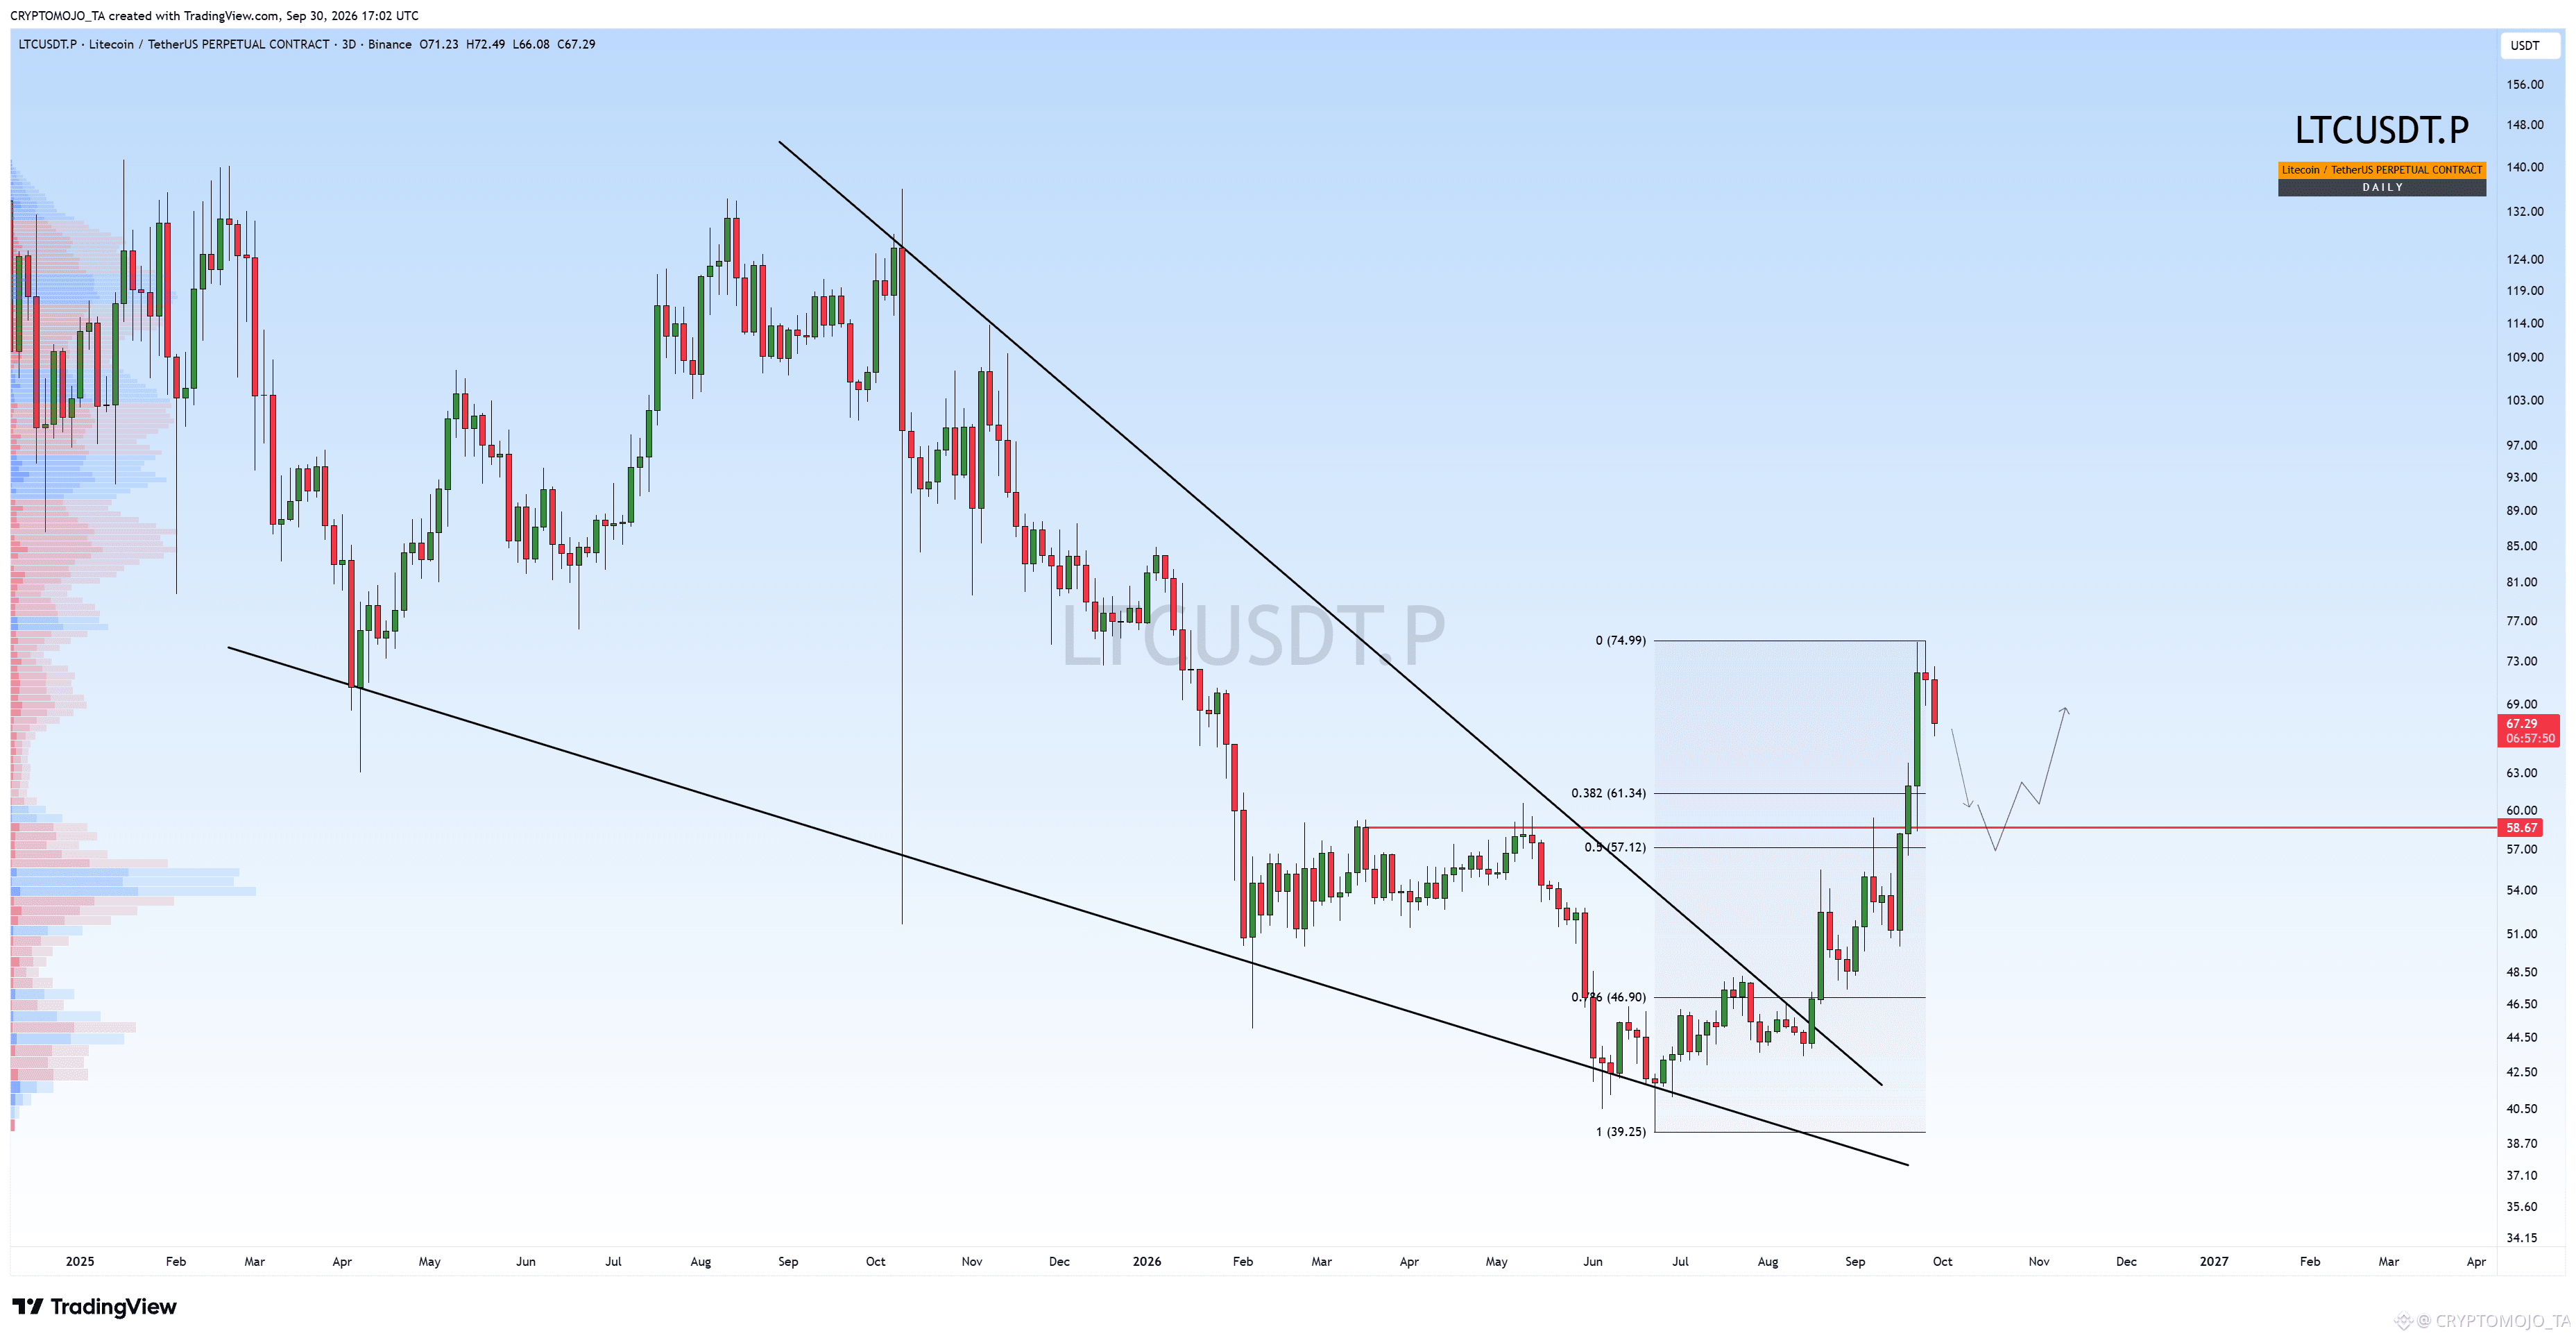
$LTC has made a strong breakout from the long-term descending trendline and rallied from around $39 to $75, giving us a major shift in structure.
After reaching $74.99, price is now pulling back, which is completely normal after such a strong move. The important part is whether the breakout area can hold.
The key support zone is around $61.3–$58.7, which lines up with the 0.382 Fibonacci level at $61.34 and the previous horizontal resistance around $58.67.
If LTC holds this zone and forms a higher low, I’d be watching for another move toward $69–$75, with a break above $74.99 potentially opening the way for further upside.
But if $58.67 is lost, the structure could weaken and the $57.12 area becomes the next level to watch.
For now, the breakout is intact. The key question is whether this pullback turns into a healthy retest or something deeper.
$LTC has made a strong breakout from the long-term descending trendline and rallied from around $39 to $75, giving us a major shift in structure.
After reaching $74.99, price is now pulling back, which is completely normal after such a strong move. The important part is whether the breakout area can hold.
The key support zone is around $61.3–$58.7, which lines up with the 0.382 Fibonacci level at $61.34 and the previous horizontal resistance around $58.67.
If LTC holds this zone and forms a higher low, I’d be watching for another move toward $69–$75, with a break above $74.99 potentially opening the way for further upside.
But if $58.67 is lost, the structure could weaken and the $57.12 area becomes the next level to watch.
For now, the breakout is intact. The key question is whether this pullback turns into a healthy retest or something deeper.
After reaching $74.99, price is now pulling back, which is completely normal after such a strong move. The important part is whether the breakout area can hold.
The key support zone is around $61.3–$58.7, which lines up with the 0.382 Fibonacci level at $61.34 and the previous horizontal resistance around $58.67.
If LTC holds this zone and forms a higher low, I’d be watching for another move toward $69–$75, with a break above $74.99 potentially opening the way for further upside.
But if $58.67 is lost, the structure could weaken and the $57.12 area becomes the next level to watch.
For now, the breakout is intact. The key question is whether this pullback turns into a healthy retest or something deeper.
122
See translation
$BTC KEEP AN EYE ON THE MONTHLY CANDLE CLOSE!!!
$BTC KEEP AN EYE ON THE MONTHLY CANDLE CLOSE!!!
196
See translation
$ETH Update
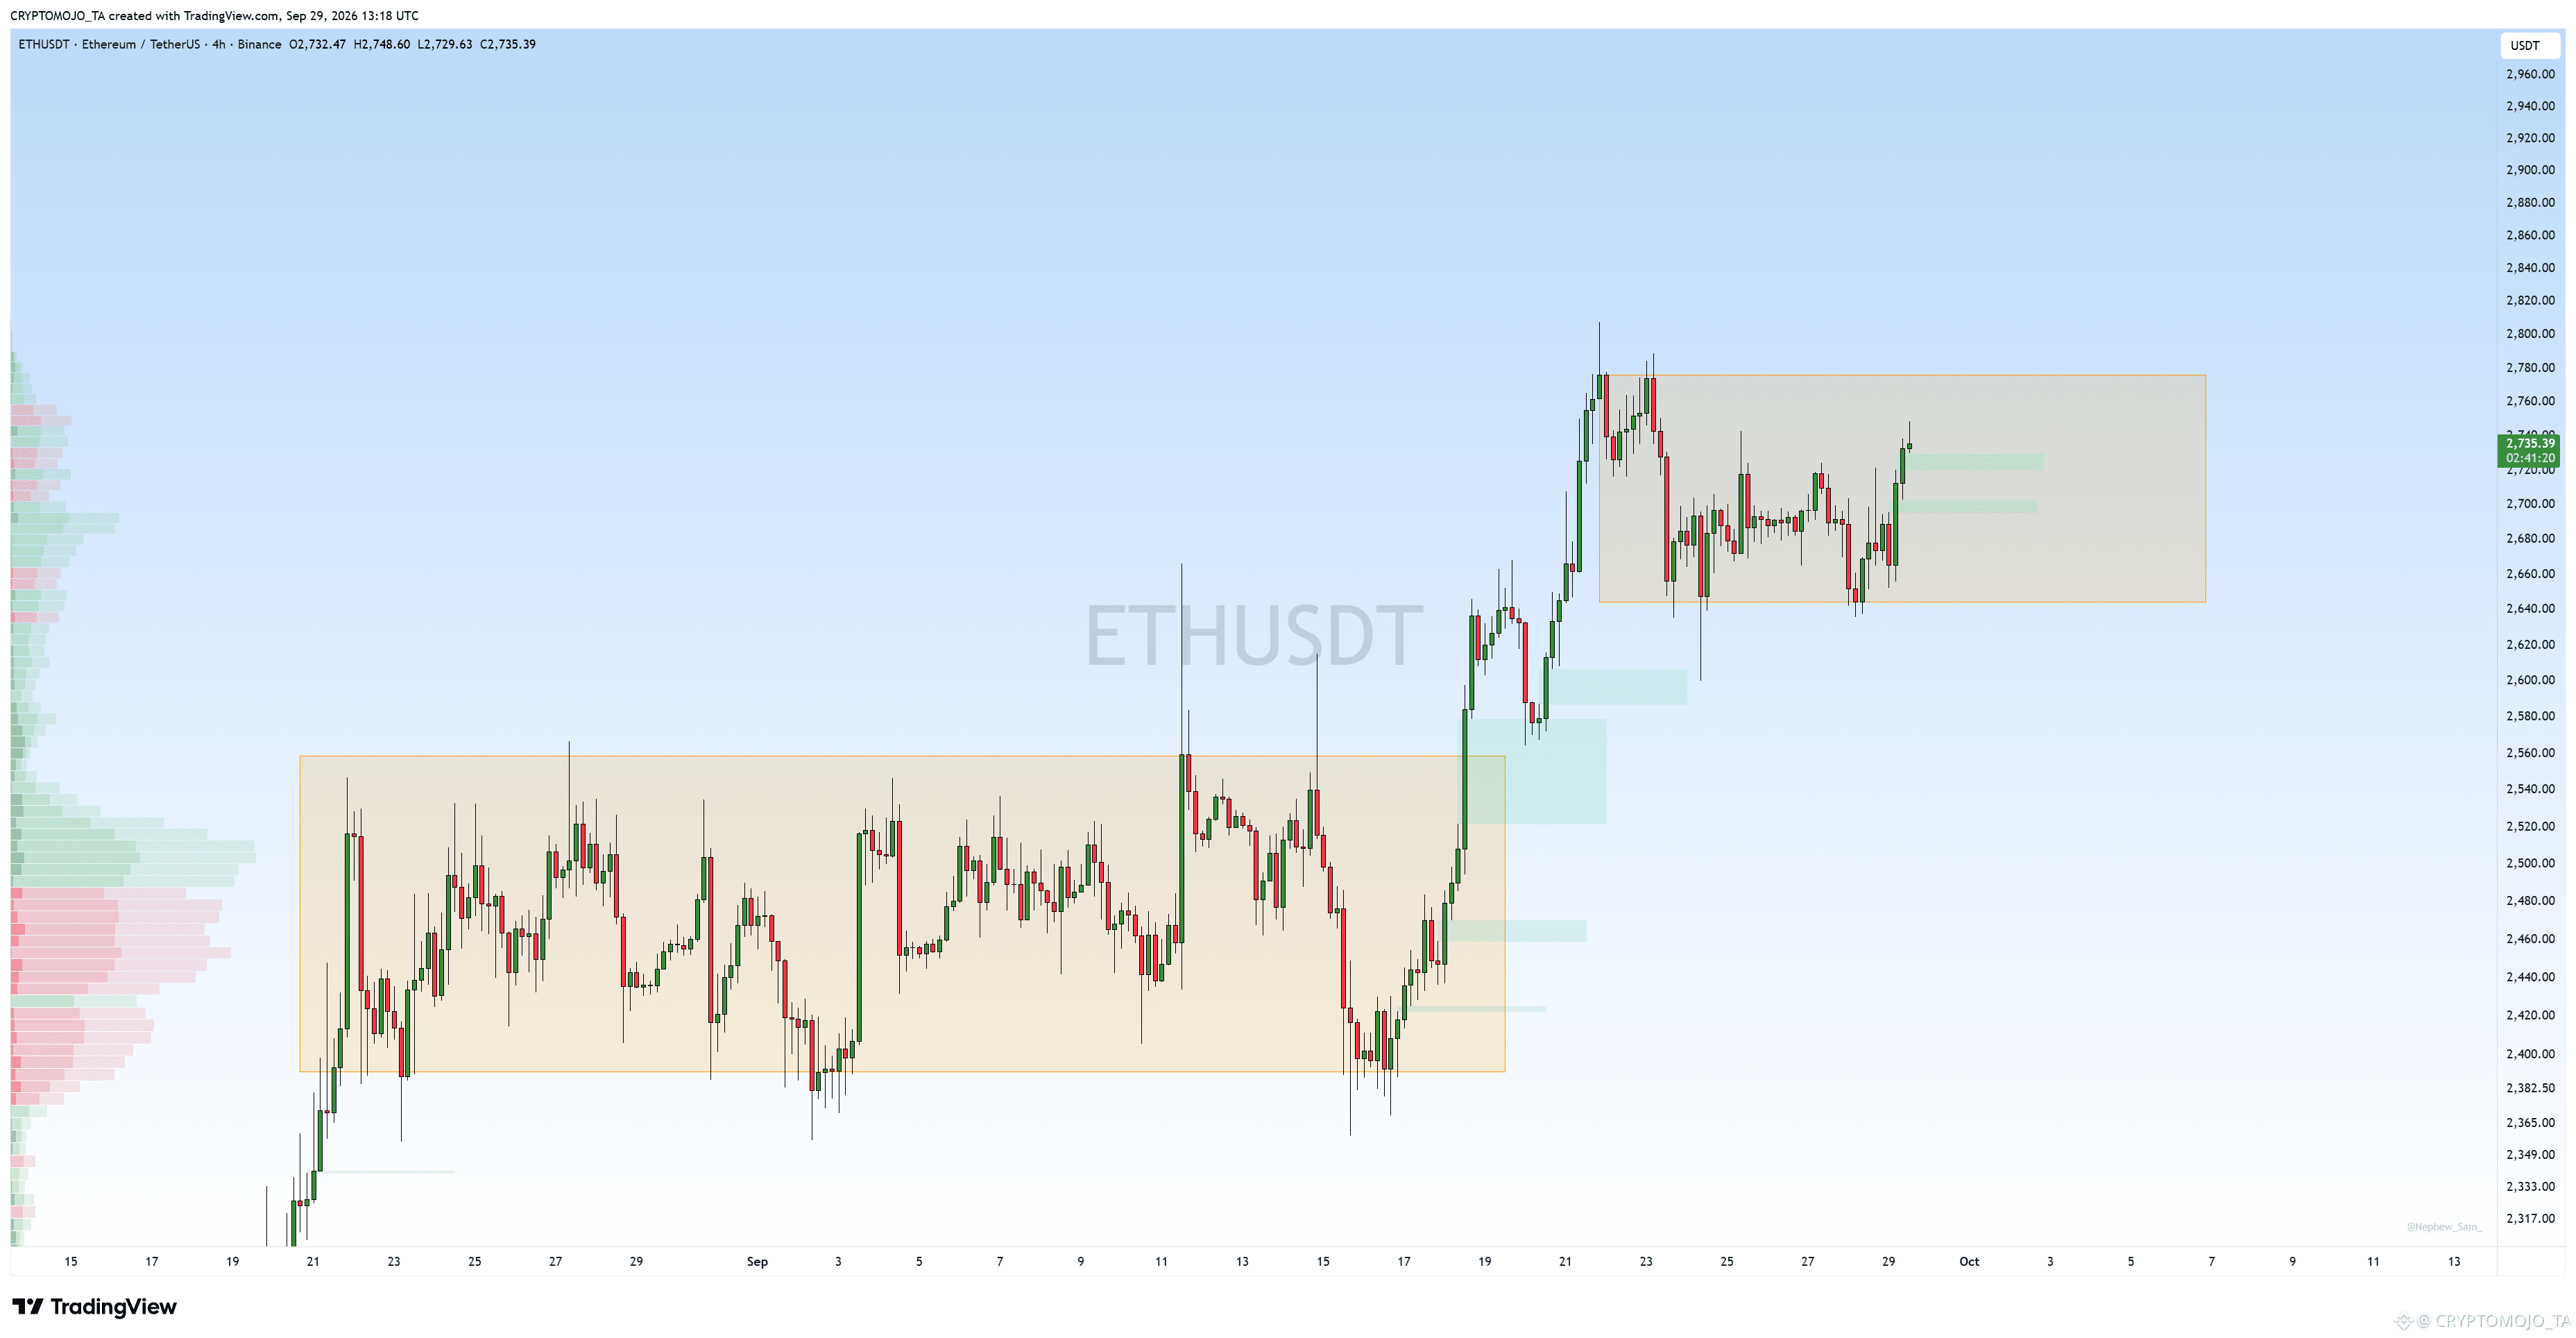
ETH is currently trading around $2,735 and has been consolidating inside a new range after the strong breakout from the previous range.
The previous range was roughly $2,390–$2,560. ETH eventually broke above it and pushed toward $2,780, creating a new consolidation zone around $2,650–$2,780.
Now the important part is the range breakout:
Above $2,780: could open the way toward $2,850–$2,900.
Below $2,650: the current structure would weaken and a deeper pullback could start.
$2,700–$2,730: short-term area to watch for support.
So far, ETH is holding the upper range well. A clean breakout above $2,780 would be the next major confirmation.
$ETH Update
ETH is currently trading around $2,735 and has been consolidating inside a new range after the strong breakout from the previous range.
The previous range was roughly $2,390–$2,560. ETH eventually broke above it and pushed toward $2,780, creating a new consolidation zone around $2,650–$2,780.
Now the important part is the range breakout:
Above $2,780: could open the way toward $2,850–$2,900.
Below $2,650: the current structure would weaken and a deeper pullback could start.
$2,700–$2,730: short-term area to watch for support.
So far, ETH is holding the upper range well. A clean breakout above $2,780 would be the next major confirmation.
ETH is currently trading around $2,735 and has been consolidating inside a new range after the strong breakout from the previous range.
The previous range was roughly $2,390–$2,560. ETH eventually broke above it and pushed toward $2,780, creating a new consolidation zone around $2,650–$2,780.
Now the important part is the range breakout:
Above $2,780: could open the way toward $2,850–$2,900.
Below $2,650: the current structure would weaken and a deeper pullback could start.
$2,700–$2,730: short-term area to watch for support.
So far, ETH is holding the upper range well. A clean breakout above $2,780 would be the next major confirmation.
108
See translation
#Bitcoin If this support breaks, we’re done with this setup.
#Bitcoin If this support breaks, we’re done with this setup.
1
221
See translation
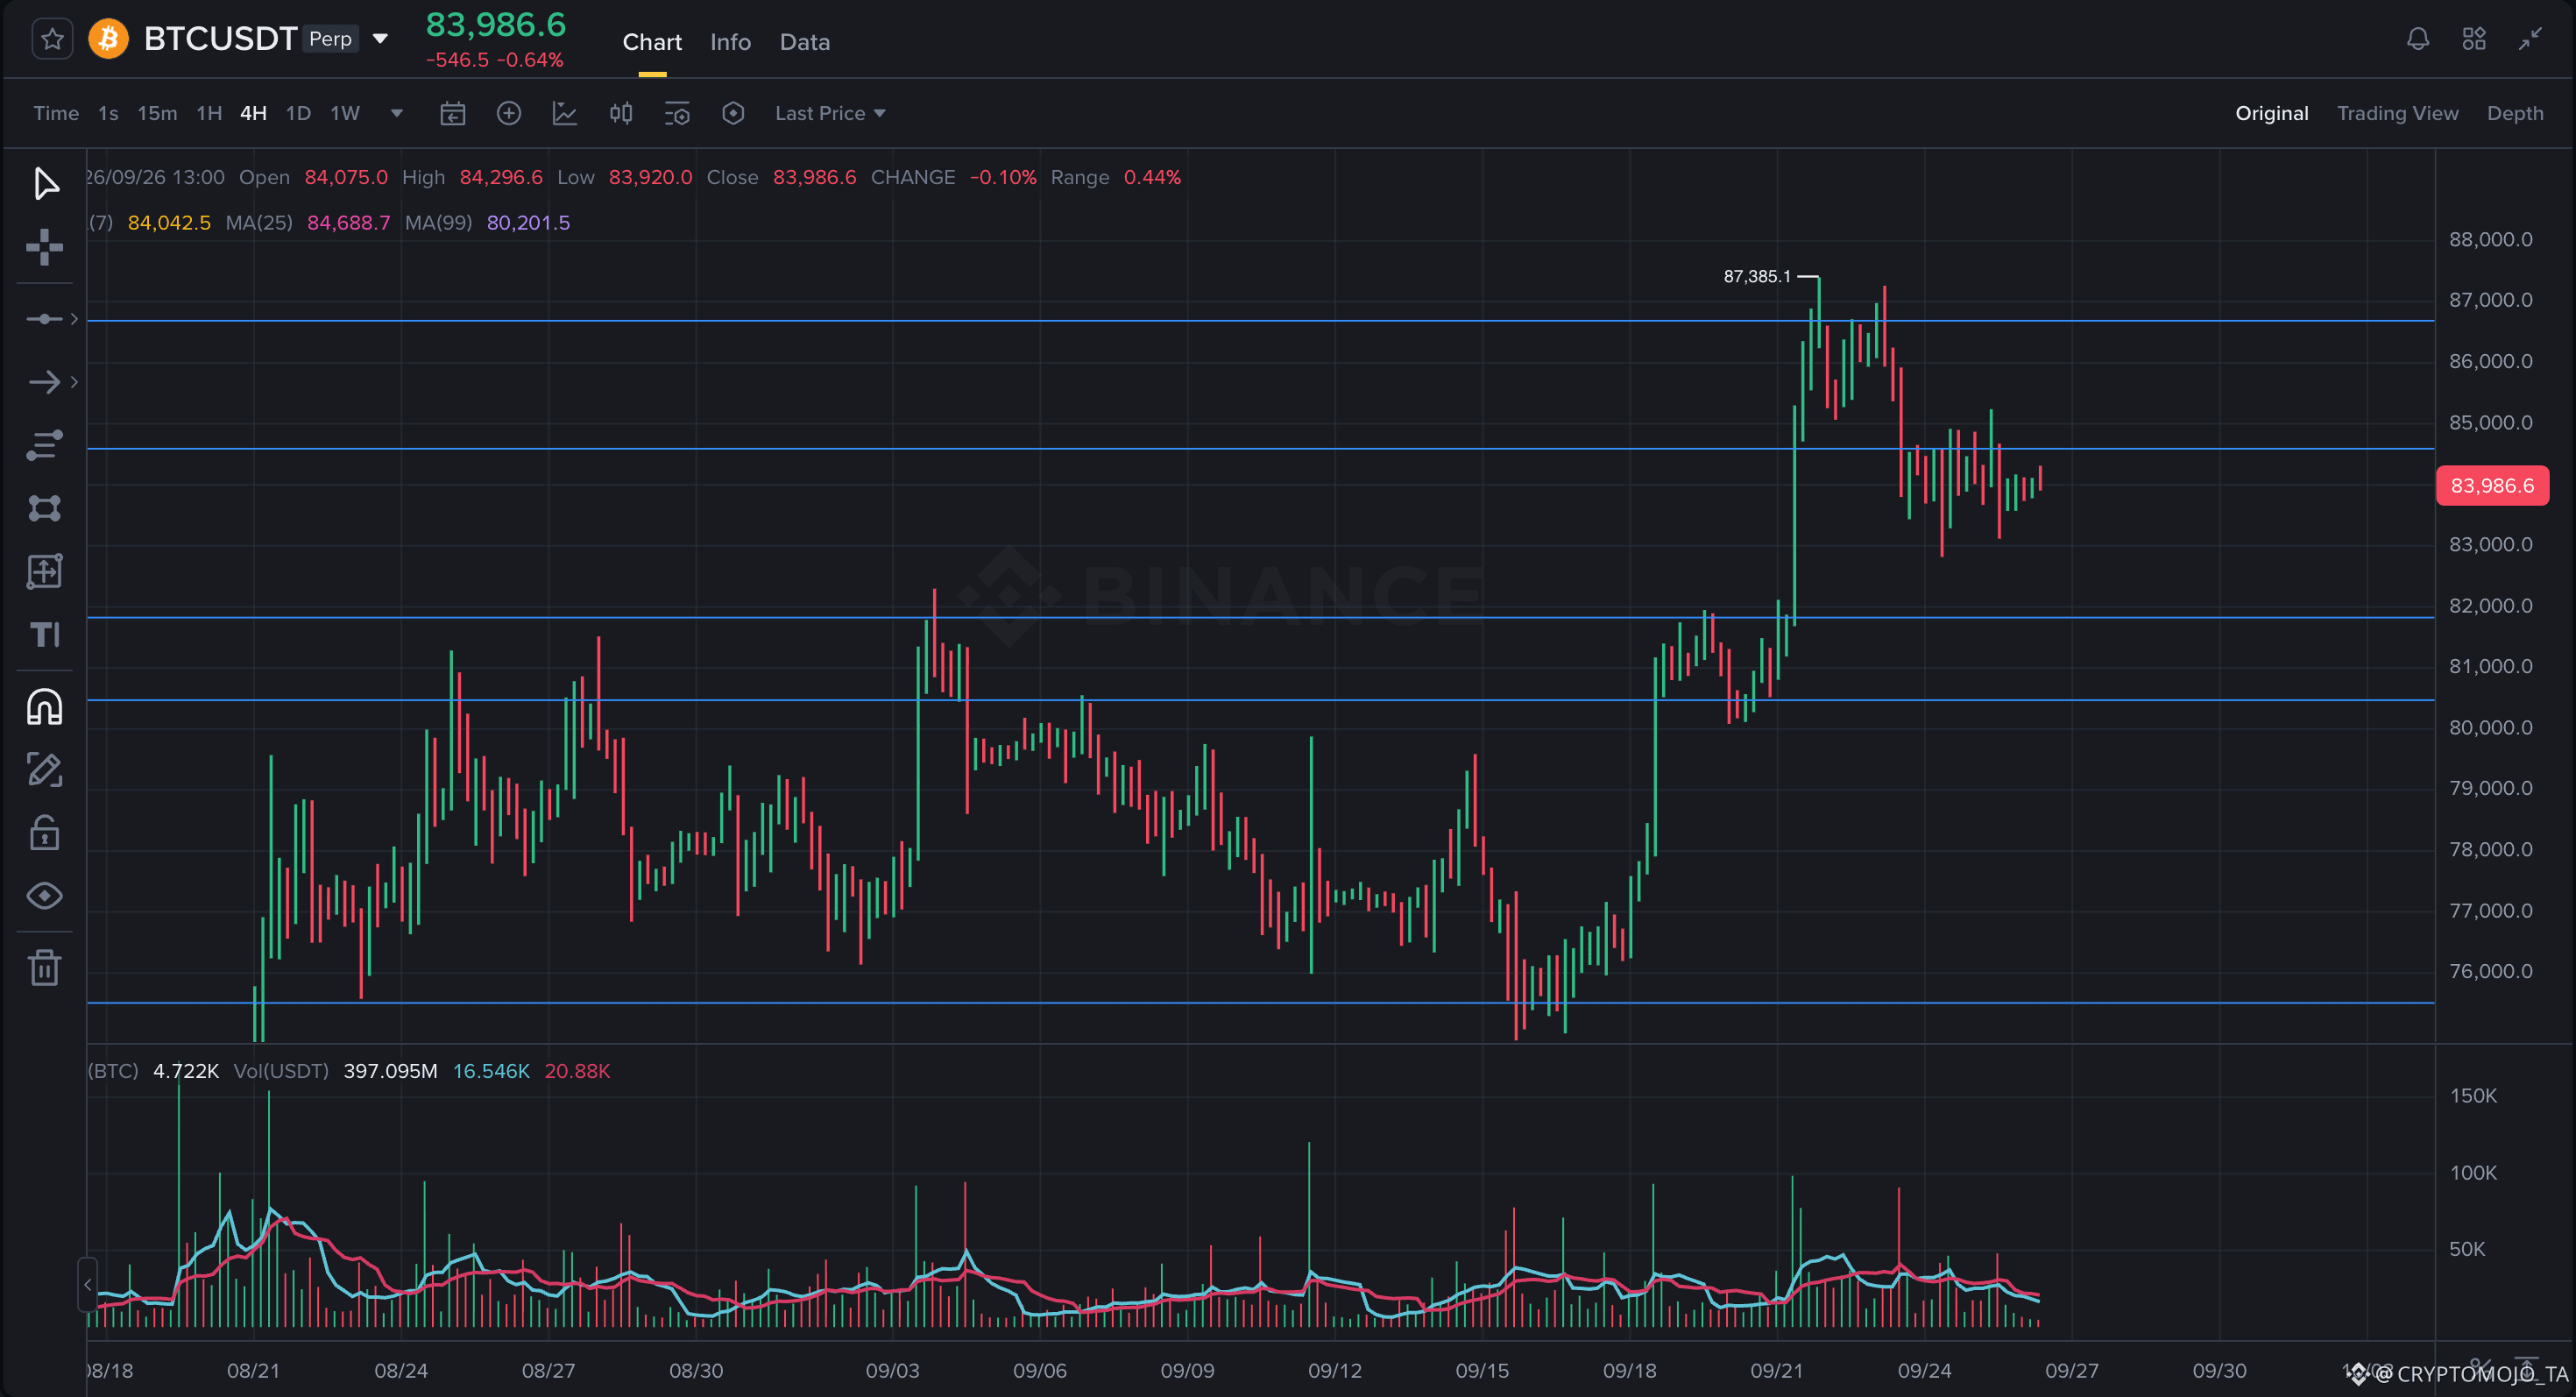
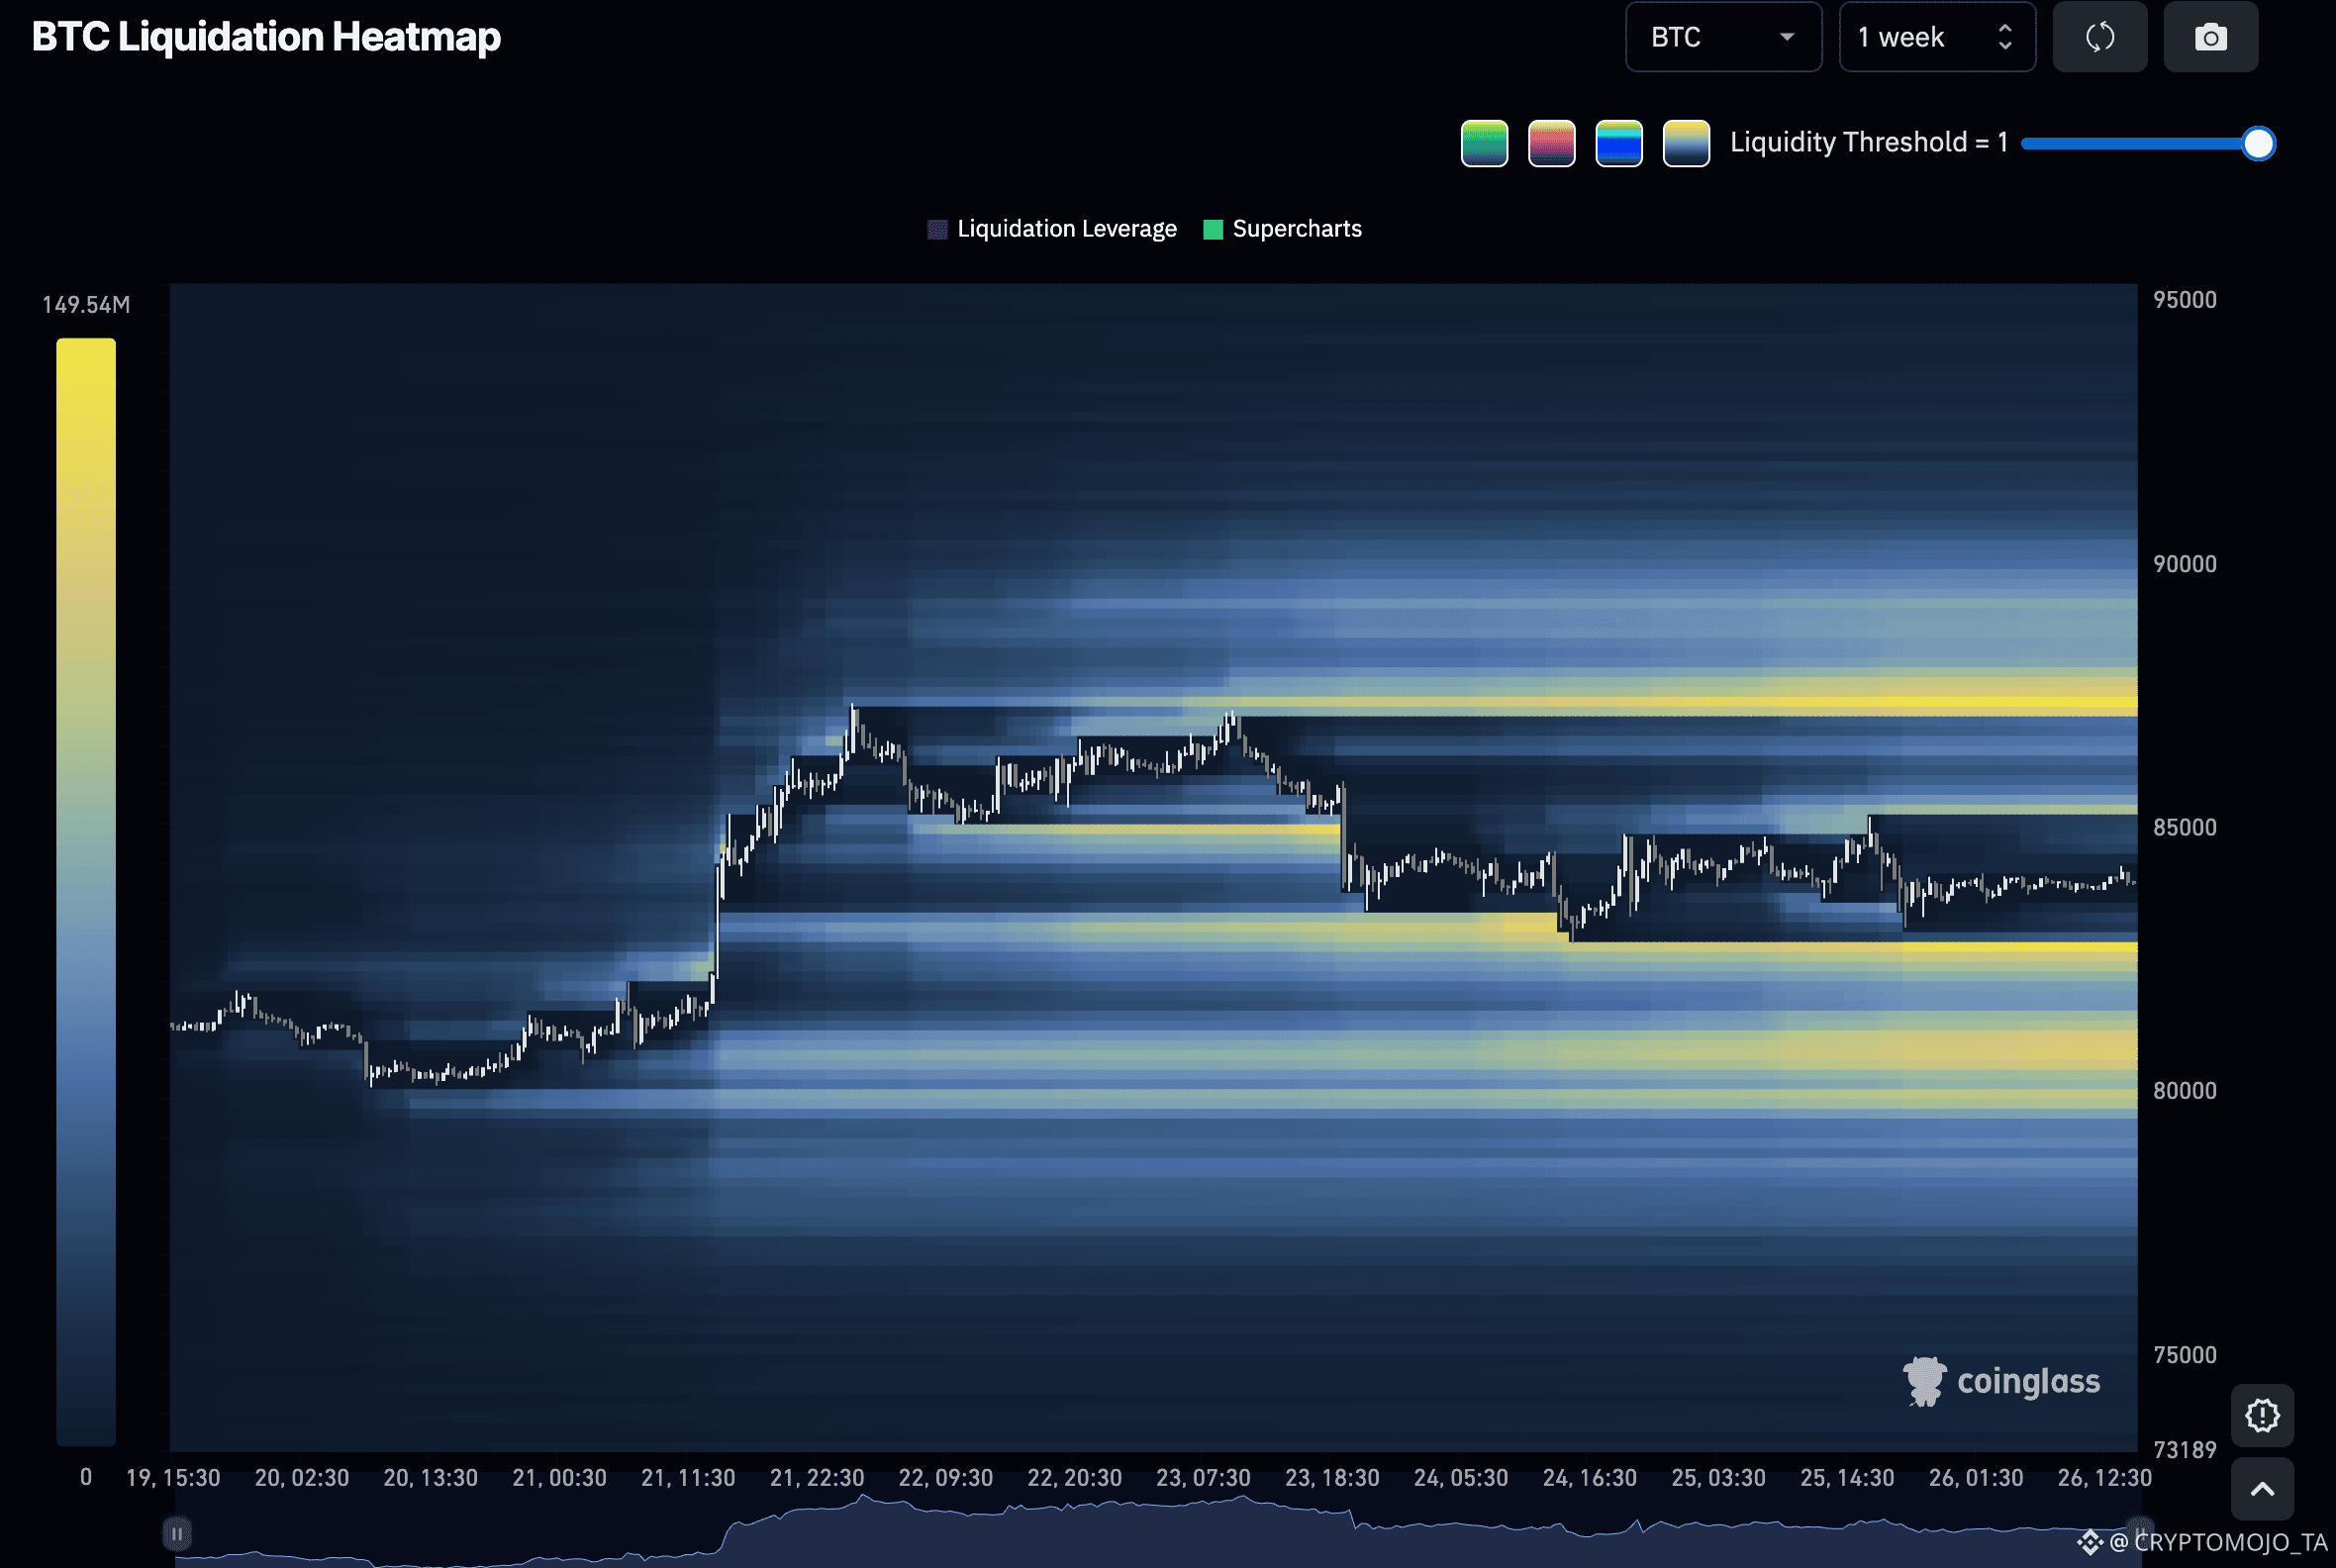
$BTC Short-Term Outlook
#BTC has been chopping sideways for the last few days after the recent bearish divergence.
This is actually a common outcome after bearish divergence, not necessarily an immediate crash, but sideways/choppy price action or a mild pullback.
I expect this type of price action to continue over the coming days, possibly into next week.
Key levels I’m watching:
$82.7K–$82.8K → key liquidity target
$80.8K–$81K → secondary liquidity
$80K → important support
If we see a pullback, I’d be watching the $80K–$82K region for a potential reaction before BTC tries to resume the larger bullish trend.
These are the levels I’m watching closely.
$BTC Short-Term Outlook
#BTC has been chopping sideways for the last few days after the recent bearish divergence.
This is actually a common outcome after bearish divergence, not necessarily an immediate crash, but sideways/choppy price action or a mild pullback.
I expect this type of price action to continue over the coming days, possibly into next week.
Key levels I’m watching:
$82.7K–$82.8K → key liquidity target
$80.8K–$81K → secondary liquidity
$80K → important support
If we see a pullback, I’d be watching the $80K–$82K region for a potential reaction before BTC tries to resume the larger bullish trend.
These are the levels I’m watching closely.
#BTC has been chopping sideways for the last few days after the recent bearish divergence.
This is actually a common outcome after bearish divergence, not necessarily an immediate crash, but sideways/choppy price action or a mild pullback.
I expect this type of price action to continue over the coming days, possibly into next week.
Key levels I’m watching:
$82.7K–$82.8K → key liquidity target
$80.8K–$81K → secondary liquidity
$80K → important support
If we see a pullback, I’d be watching the $80K–$82K region for a potential reaction before BTC tries to resume the larger bullish trend.
These are the levels I’m watching closely.
142
See translation
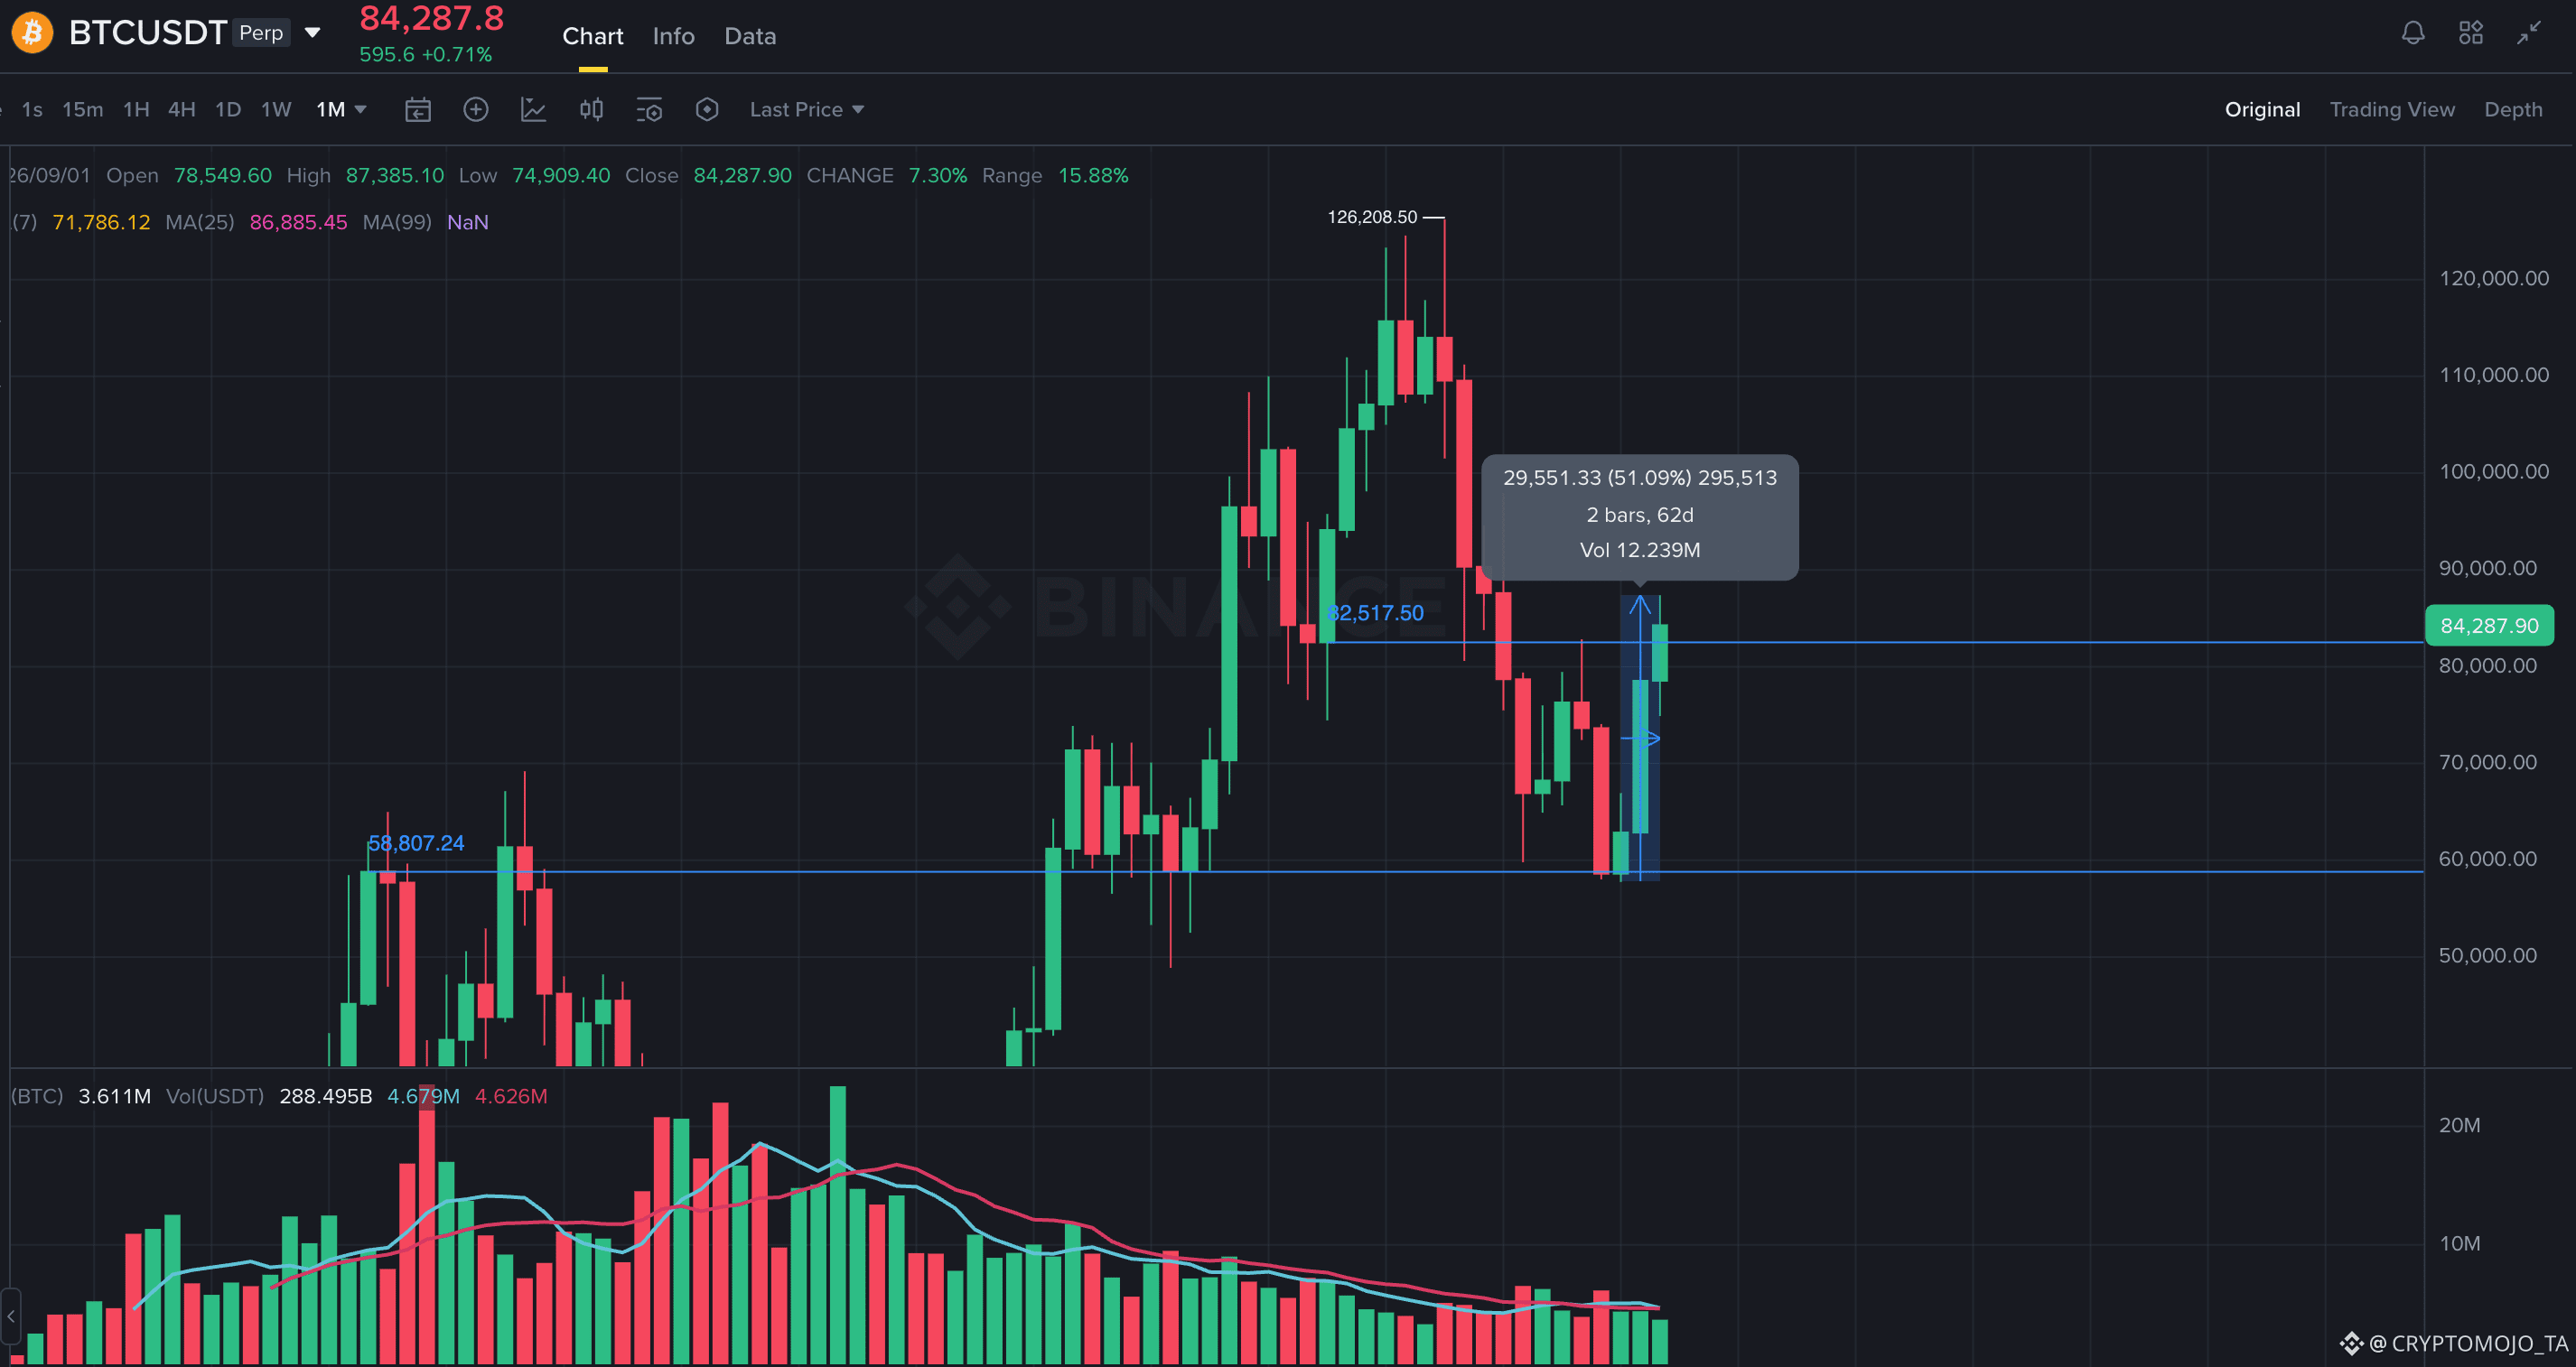
#BTC monthly chart is getting very interesting.
From the $58.8K low, BTC has already bounced nearly 43% and has now broken above the $82.5K horizontal resistance.
But there are only ~5 days left before the monthly candle closes.
The big question is: Can BTC hold above this breakout into the monthly close?
This monthly candle could be very important for the bigger-picture structure. Let’s see how it closes. 🔥
#bitcoin $BTC
#BTC monthly chart is getting very interesting.
From the $58.8K low, BTC has already bounced nearly 43% and has now broken above the $82.5K horizontal resistance.
But there are only ~5 days left before the monthly candle closes.
The big question is: Can BTC hold above this breakout into the monthly close?
This monthly candle could be very important for the bigger-picture structure. Let’s see how it closes. 🔥
#bitcoin $BTC
From the $58.8K low, BTC has already bounced nearly 43% and has now broken above the $82.5K horizontal resistance.
But there are only ~5 days left before the monthly candle closes.
The big question is: Can BTC hold above this breakout into the monthly close?
This monthly candle could be very important for the bigger-picture structure. Let’s see how it closes. 🔥
#bitcoin $BTC
1
1
171
·
--
Bearish
See translation
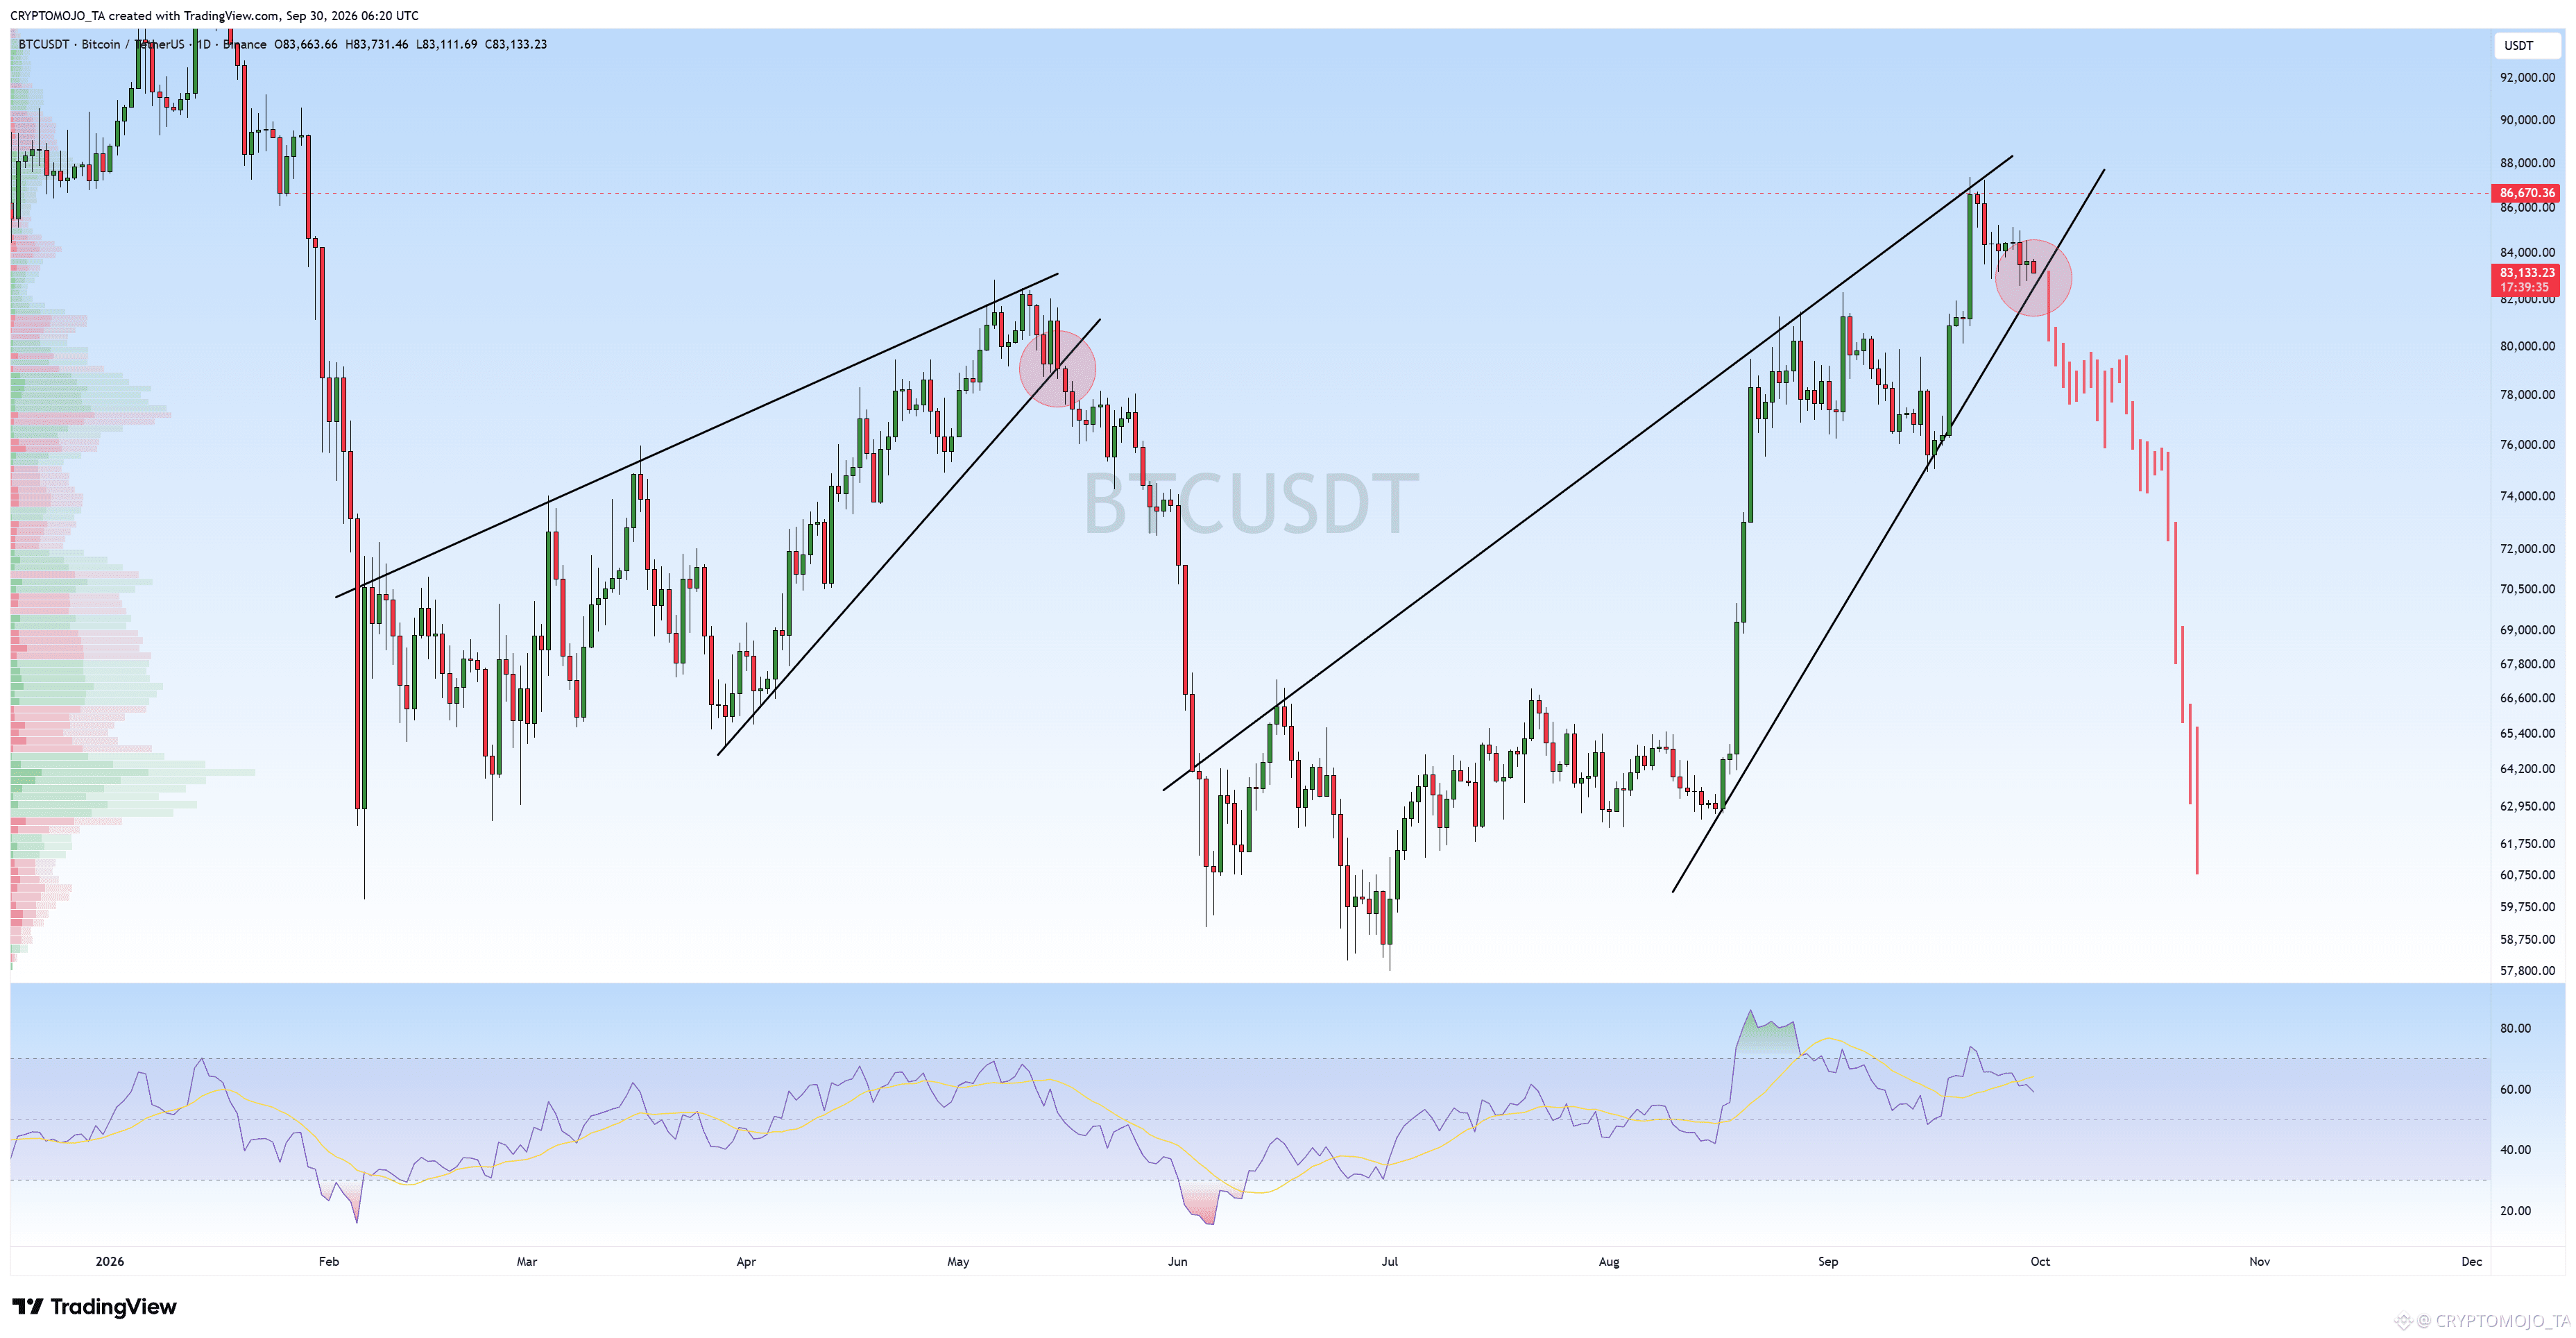
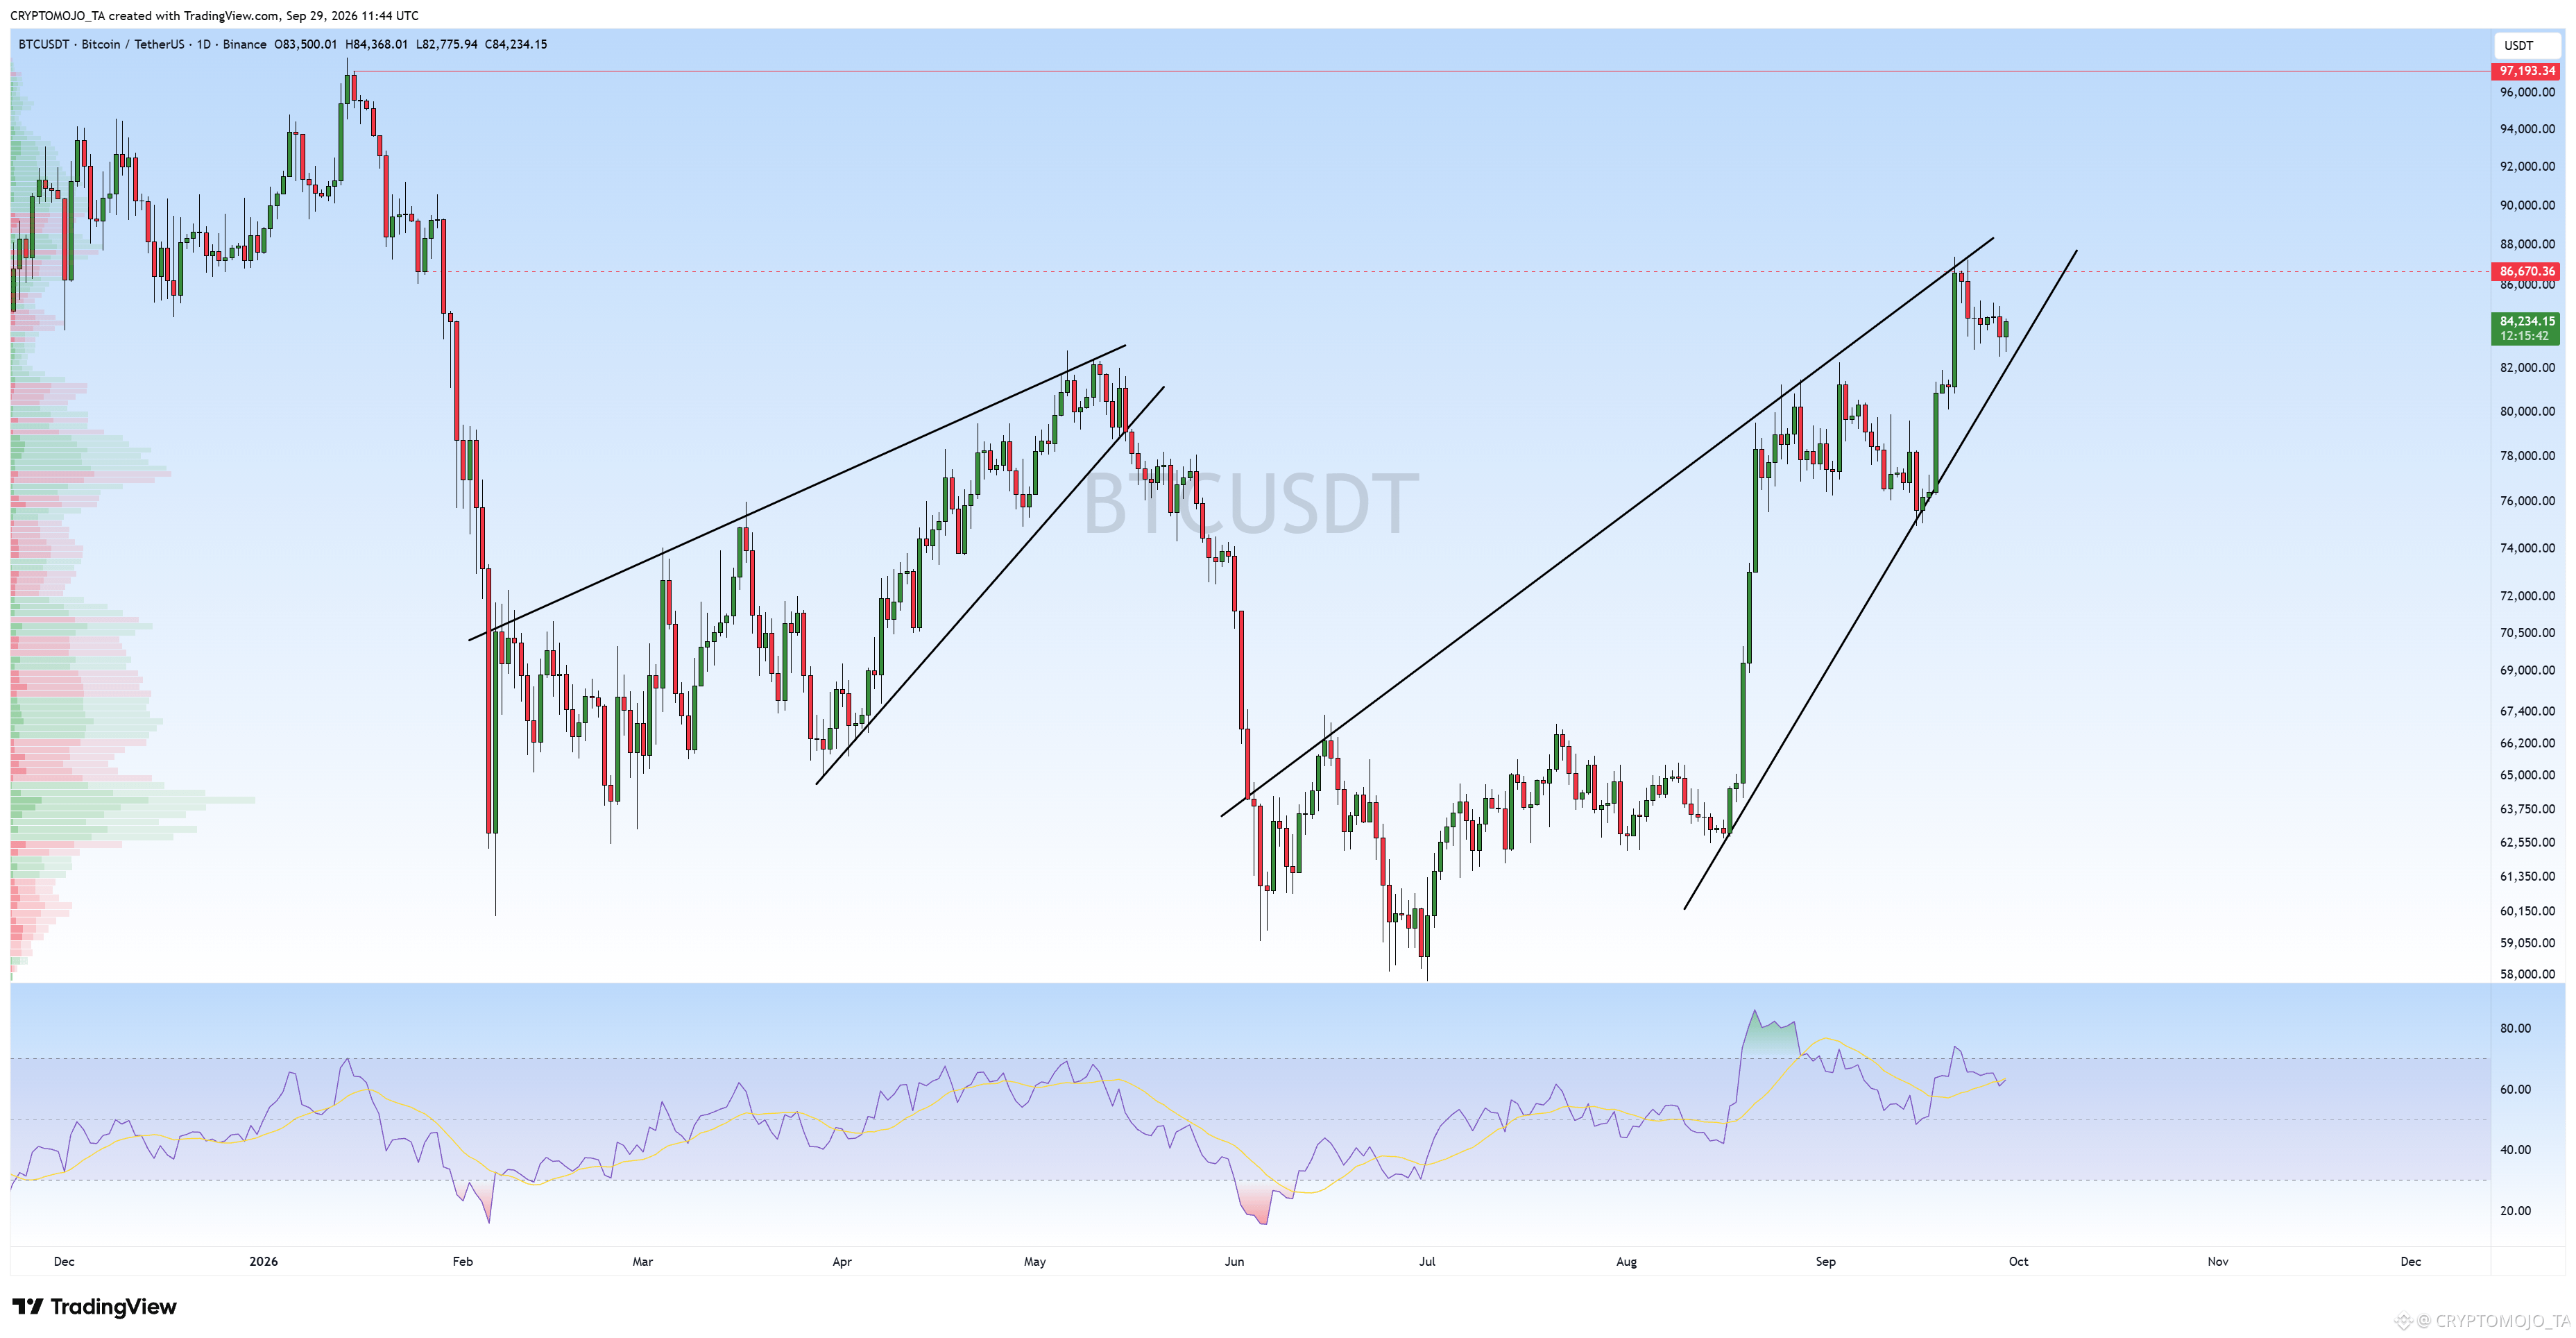
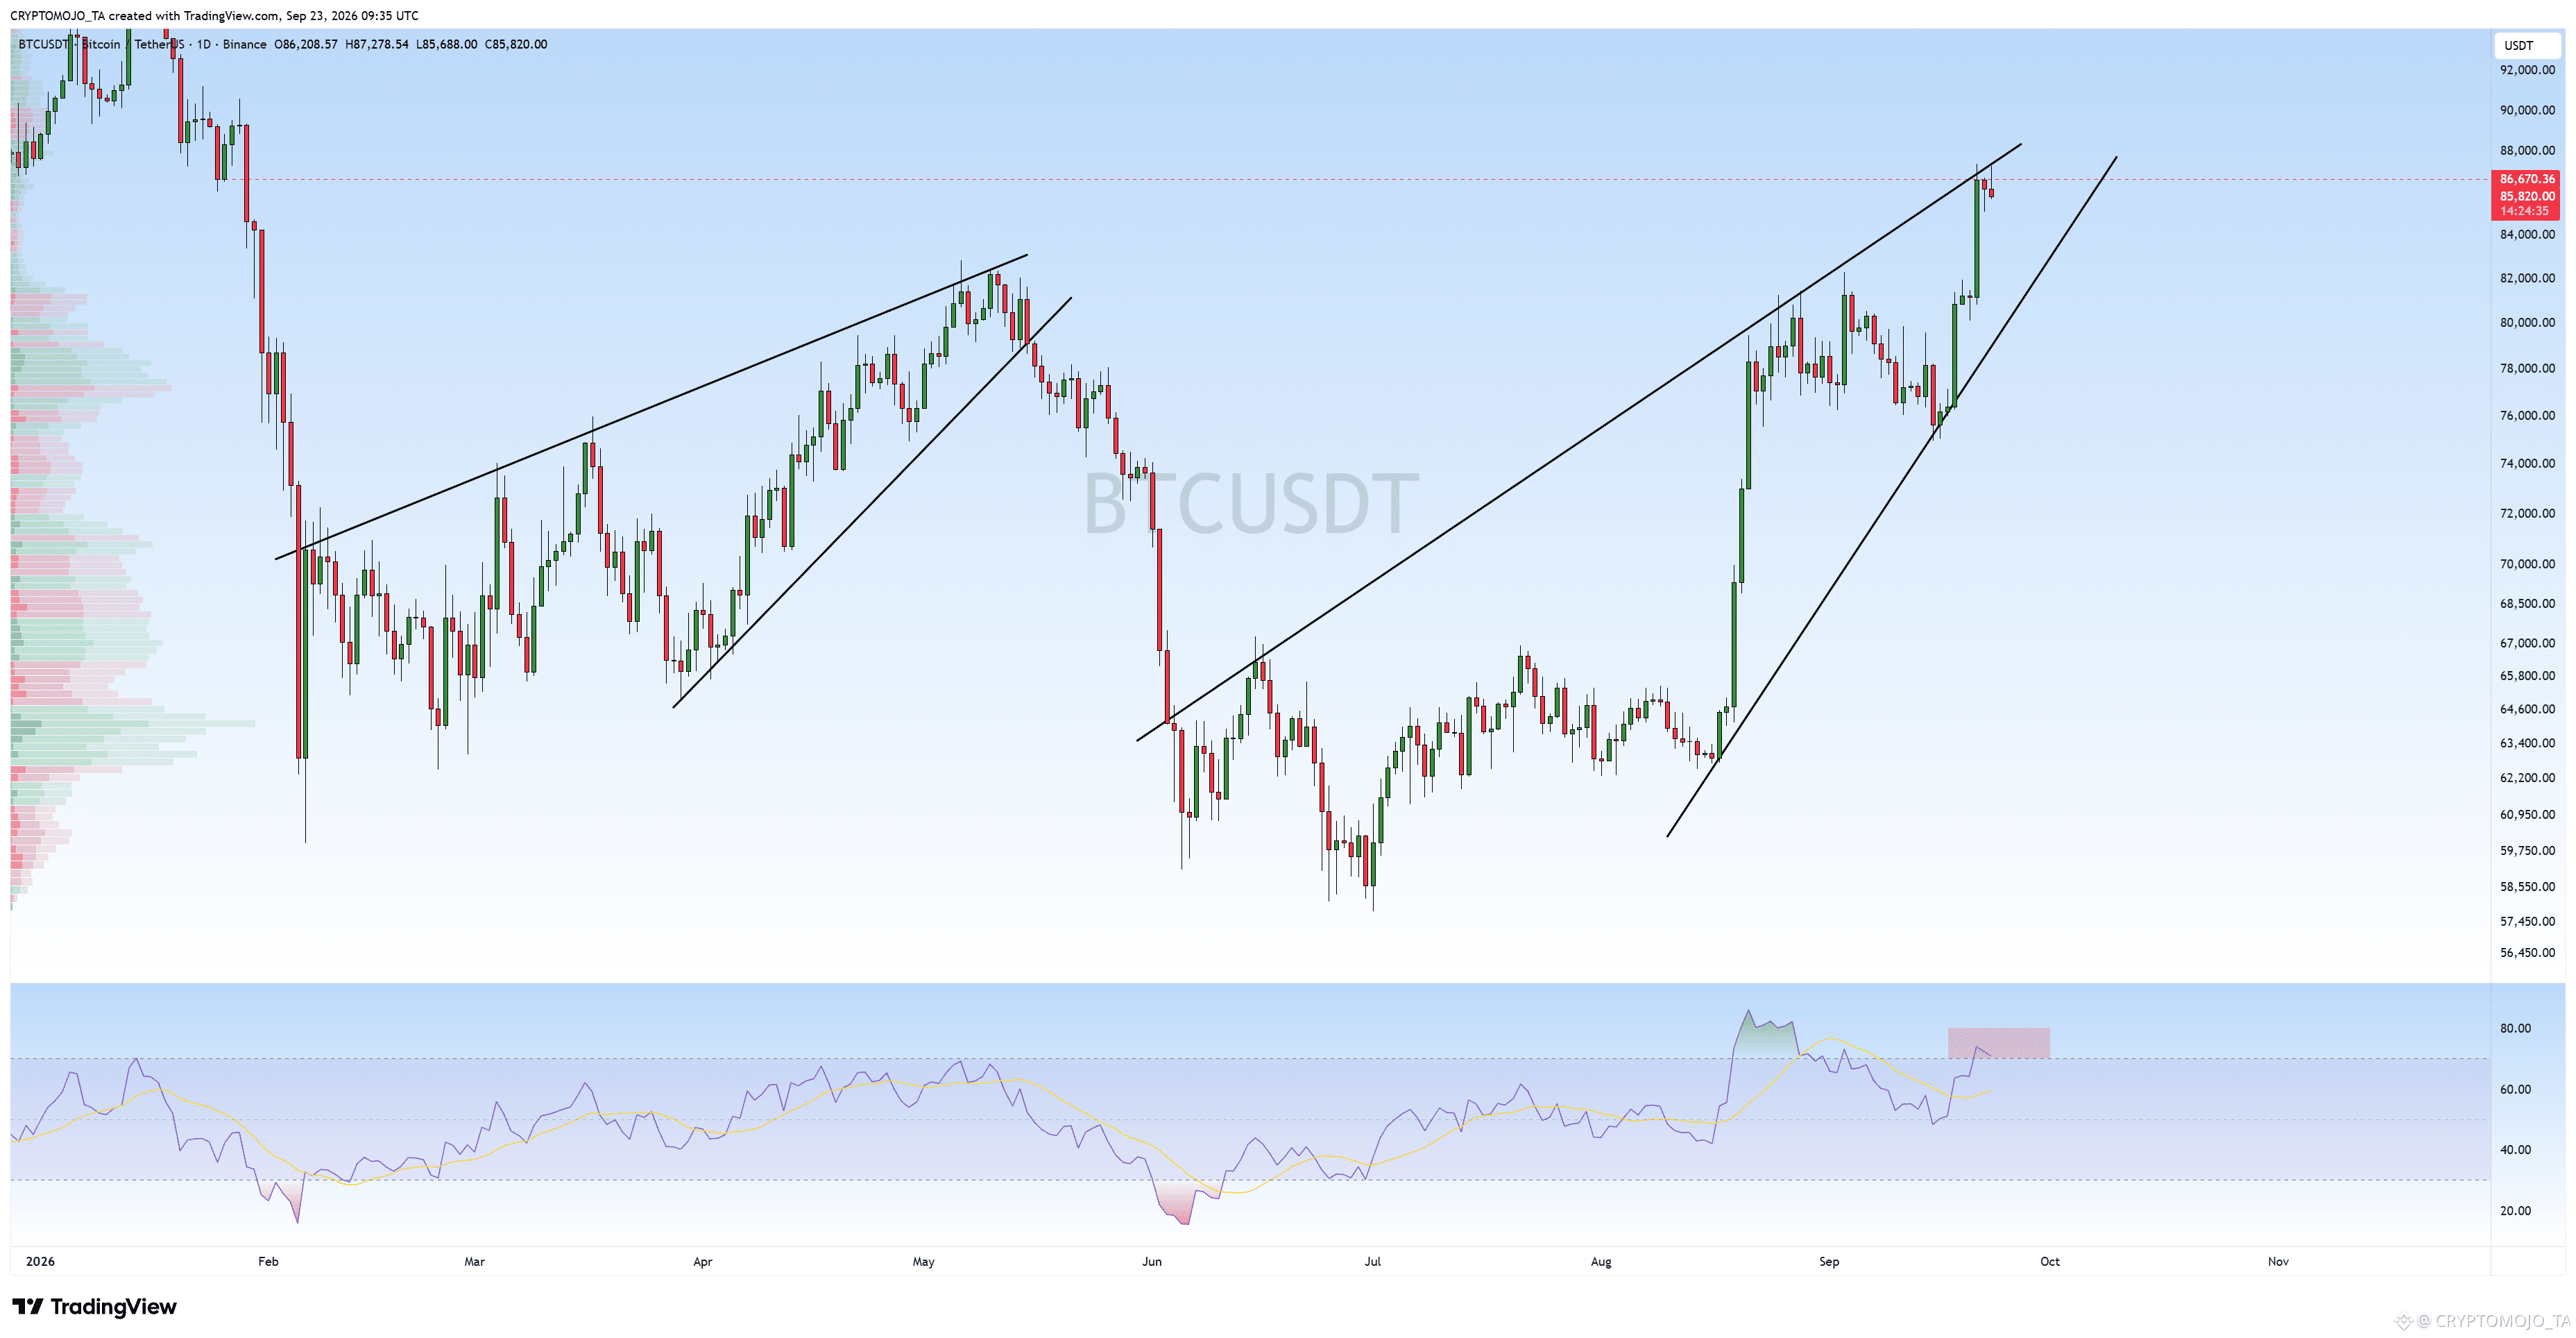
$BTC Update!!
BTC is testing a major resistance zone around $86.5K–$87K on the daily timeframe.
Price has been moving inside a rising structure since the June low, and we can see a similar ascending pattern from the previous move earlier this year. BTC is now approaching the upper trendline of the current structure.
The interesting part is the daily RSI, which has moved back above 70 and is showing signs of becoming stretched. We’re also seeing a small rejection from the $86.7K area.
If BTC breaks and closes cleanly above $87K, the next area to watch would be around $88K+.
But if this resistance holds, a pullback toward the lower trendline could come into play before another attempt higher.
$86.5K–$87K is the key zone right now. I’m watching the reaction here closely.
#bitcoin
$BTC Update!!
BTC is testing a major resistance zone around $86.5K–$87K on the daily timeframe.
Price has been moving inside a rising structure since the June low, and we can see a similar ascending pattern from the previous move earlier this year. BTC is now approaching the upper trendline of the current structure.
The interesting part is the daily RSI, which has moved back above 70 and is showing signs of becoming stretched. We’re also seeing a small rejection from the $86.7K area.
If BTC breaks and closes cleanly above $87K, the next area to watch would be around $88K+.
But if this resistance holds, a pullback toward the lower trendline could come into play before another attempt higher.
$86.5K–$87K is the key zone right now. I’m watching the reaction here closely.
#bitcoin
BTC is testing a major resistance zone around $86.5K–$87K on the daily timeframe.
Price has been moving inside a rising structure since the June low, and we can see a similar ascending pattern from the previous move earlier this year. BTC is now approaching the upper trendline of the current structure.
The interesting part is the daily RSI, which has moved back above 70 and is showing signs of becoming stretched. We’re also seeing a small rejection from the $86.7K area.
If BTC breaks and closes cleanly above $87K, the next area to watch would be around $88K+.
But if this resistance holds, a pullback toward the lower trendline could come into play before another attempt higher.
$86.5K–$87K is the key zone right now. I’m watching the reaction here closely.
#bitcoin
1
89
Log in to explore more content
Join global crypto users on Binance Square
⚡️ Get latest and useful information about crypto.
💬 Trusted by the world’s largest crypto exchange.
👍 Discover real insights from verified creators.
Email / Phone number
Trending Topics
BinanceLaunchesBinanceIntelligence
684,640 views
4,245 Discussing
#binancelaunchesbinanceintelligence 🚨 WHAT IF THE NEXT BIG EXCHANGE BATTLE ISN’T ABOUT FEES? 👀
Binance just made a bigger move than adding another AI chatbot.
With Binance Intelligence, AI is moving deeper into the exchange — from understanding market data to building trading workflows. 🤖⚡
The real question is:
Who has the best liquidity?
Or who has the smartest AI layer?
If users can research, test ideas and manage trading workflows without switching between different tools, the exchange itself could become a financial assistant.
That could be a much bigger shift than it looks today.
If Binance Intelligence drives more users, more strategies and more trading activity, $BNB could become one of the tokens to watch. 👀
Is Binance building the future of AI-powered finance?
$BNB
#binancelaunchesbinanceintelligence #BinanceAI #CryptoAI #AITrading
Suleman Khan Haqqani
·14 Likes
·20.6k views
BTCFallsBelow$84K
19,239 views
77 Discussing
DubaiVARAIssuesReserveAssetAuditCircular
1,694 views
165 Discussing