

ChartScout
2.3k Posts

ChartScout
Report
Block User
You cannot watch every chart, on every timeframe, 24/7. ChartScout can. Set up your watchers once and get instant alerts when patterns form across pairs.
2 Following
974 Followers
2.8K+ Liked
Posts
All
Videos
PINNED
·
--
See translation
Tired of checking crypto charts one by one?
ChartScout helps traders monitor multiple charts, identify market opportunities, and save valuable time. Watch the short to see how it works.
#crypto #trading #ChartScout #CryptoCharts
Tired of checking crypto charts one by one?
ChartScout helps traders monitor multiple charts, identify market opportunities, and save valuable time. Watch the short to see how it works.
#crypto #trading #ChartScout #CryptoCharts
ChartScout helps traders monitor multiple charts, identify market opportunities, and save valuable time. Watch the short to see how it works.
#crypto #trading #ChartScout #CryptoCharts
3
267
·
--
See translation
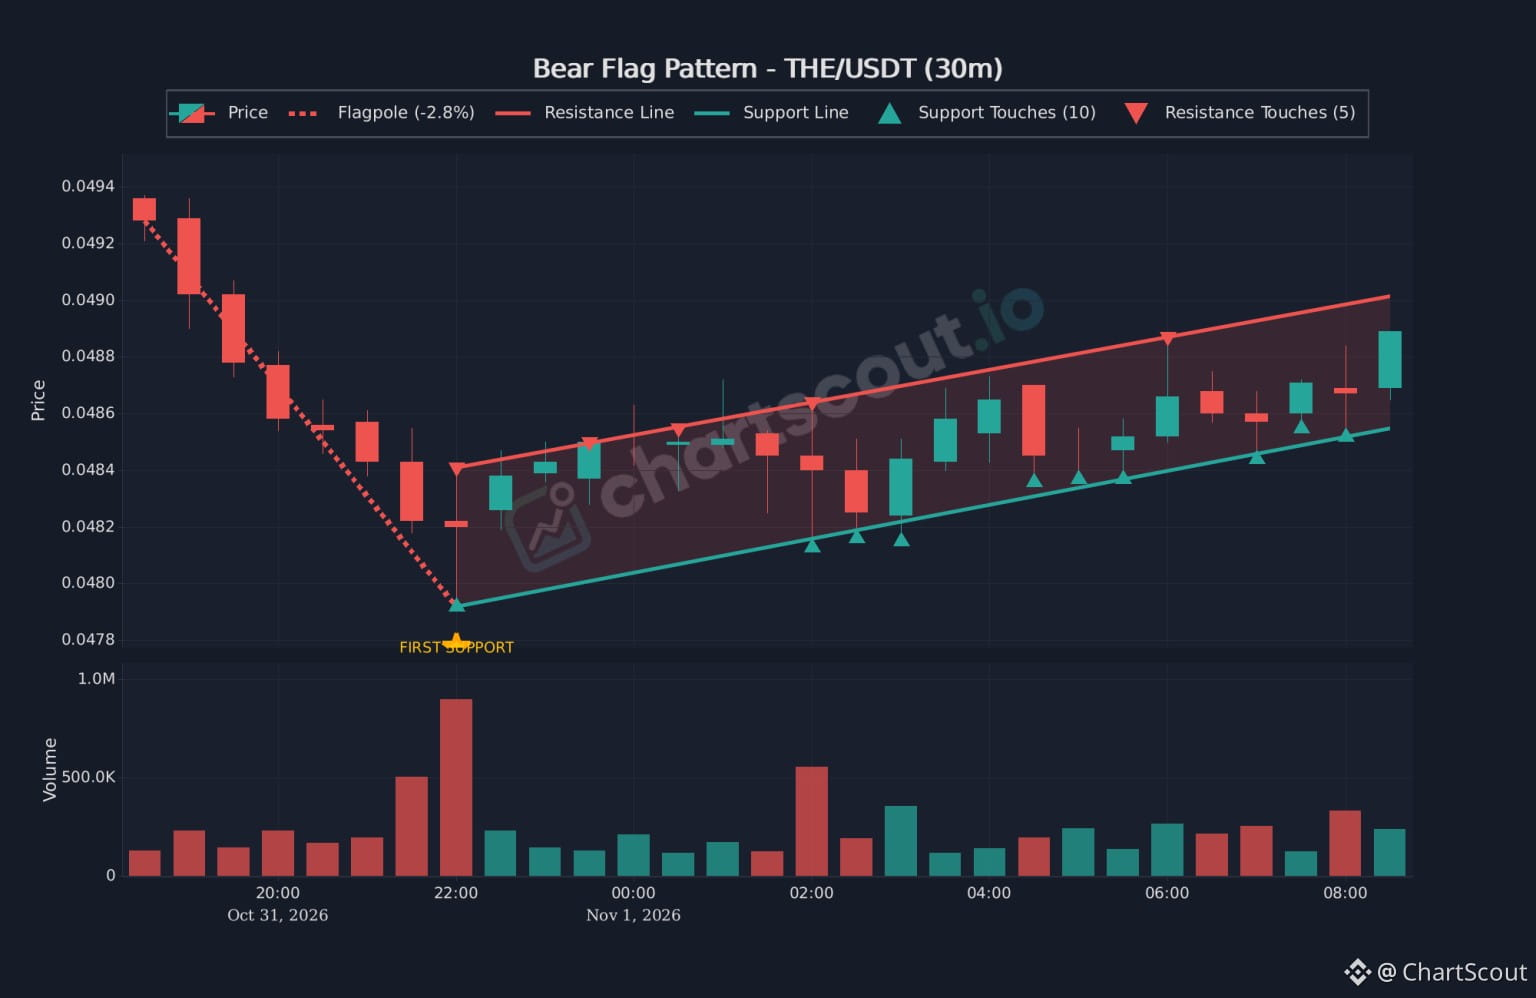
THE/USDT 30m: possible bear flag. 🔍
After a ~2.8% drop, price has been climbing inside a rising channel with 10 touches on the lower line and 5 on the upper. It's now near the top at about 0.0488–0.0490.
A bear flag only matters if price breaks the lower line, and a push above the upper line would invalidate the idea, so neither side is confirmed yet.
Spotted with ChartScout's pattern scanner (free trial in our profile).
#the #chartpatterns #TechnicalAnalysis
194
·
--
See translation
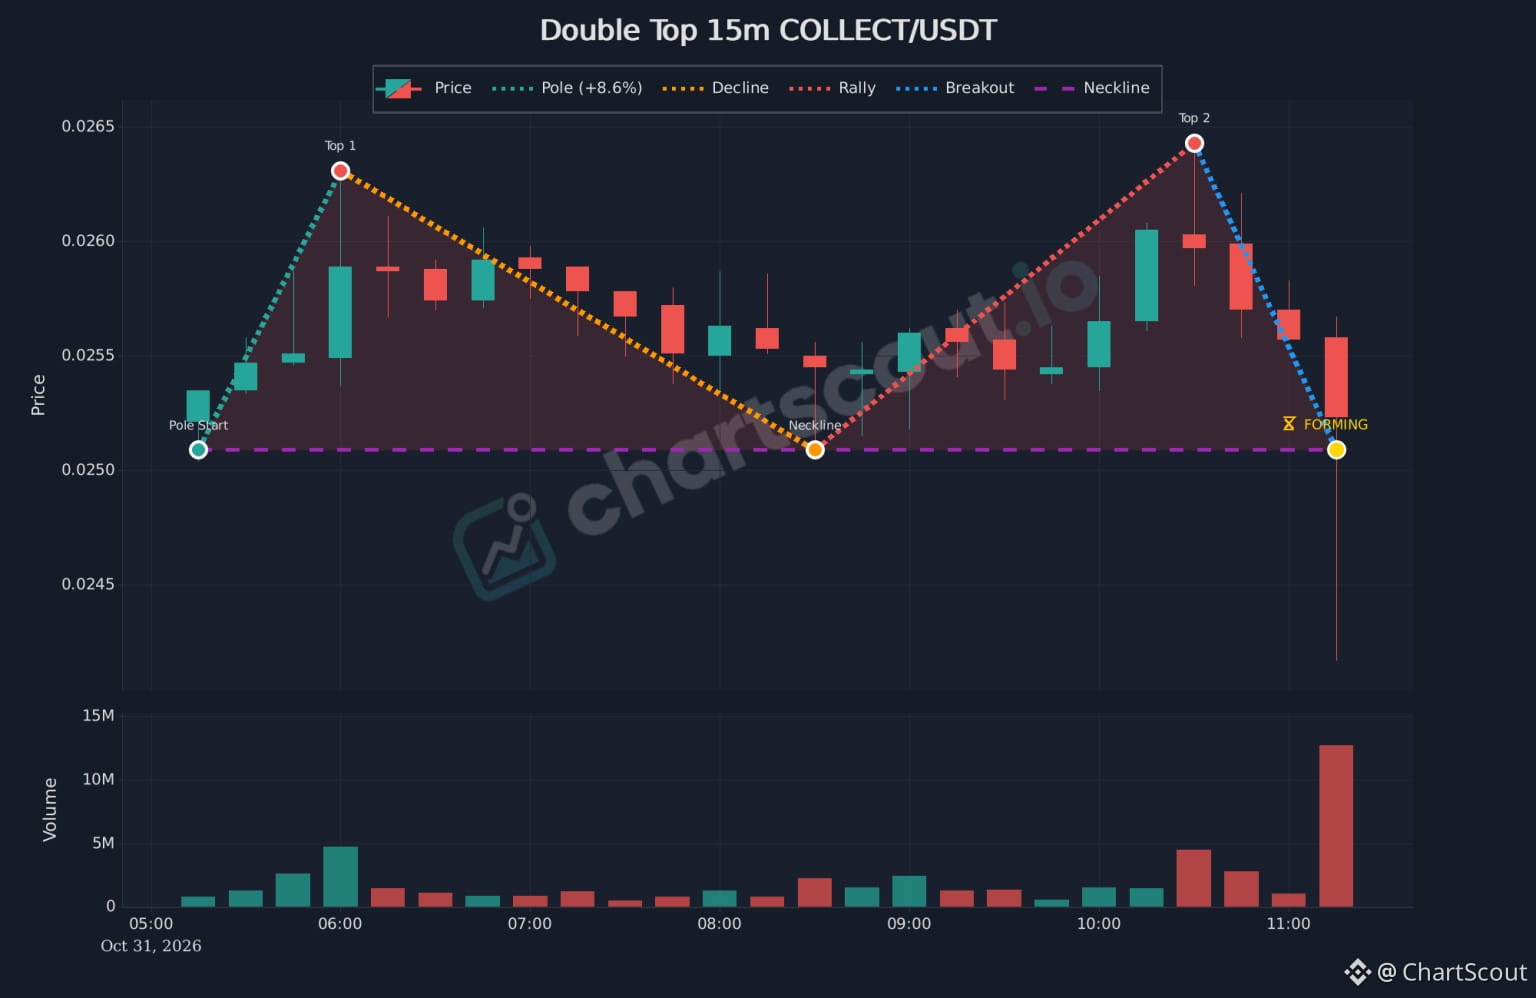
COLLECT/USDT 15m: double top forming. 🔍
After an 8.6% rise, price made two tops near 0.0263–0.0264 and is now testing the neckline around 0.0251. The latest candle printed heavy volume with a long wick below the line.
A double top isn't confirmed until a candle closes below the neckline, so a wick alone isn't enough.
Spotted with ChartScout's pattern scanner (free trial in our profile).
#collect #chartpatterns #TechnicalAnalysis #COLLECTUSDT
537
·
--
See translation
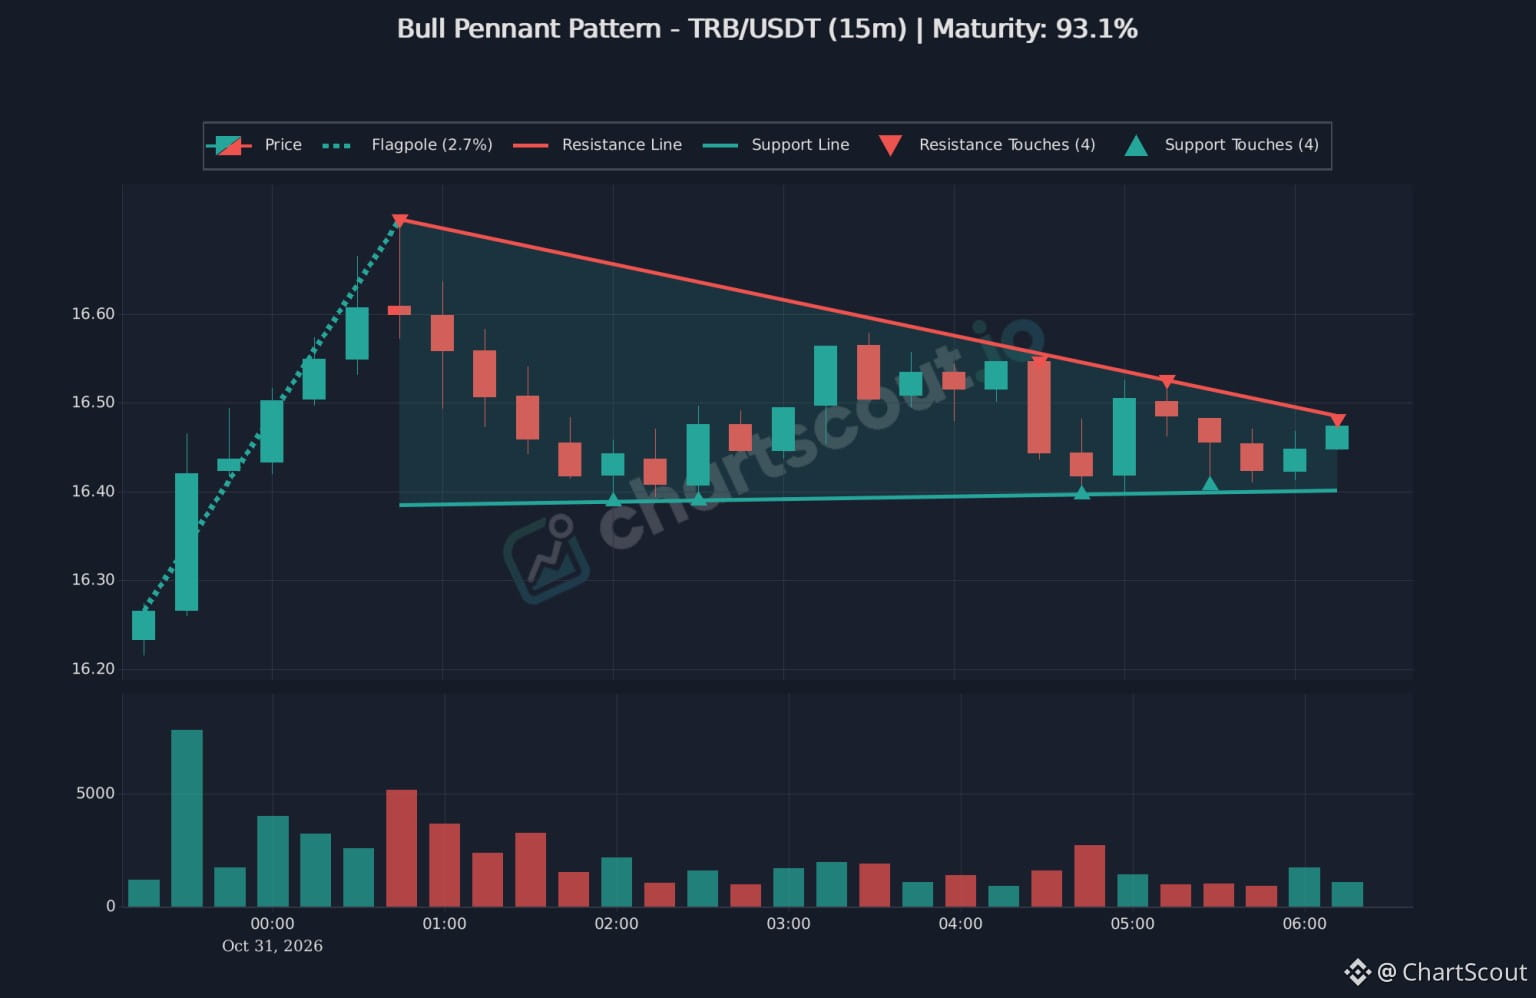
TRB/USDT 15m : bull pennant tightening. 🔍
A +2.7% pole, then a converging pennant with 4 touches on both lines. Price is pressing the upper line near 16.48 while support holds around 16.40.
A pennant is only a pattern, so watch for a clean 15m close beyond either line before drawing conclusions.
Spotted with ChartScout's pattern scanner (free trial in our profile).
#TRB #chartpatterns #TechnicalAnalysis
1
559
·
--
See translation
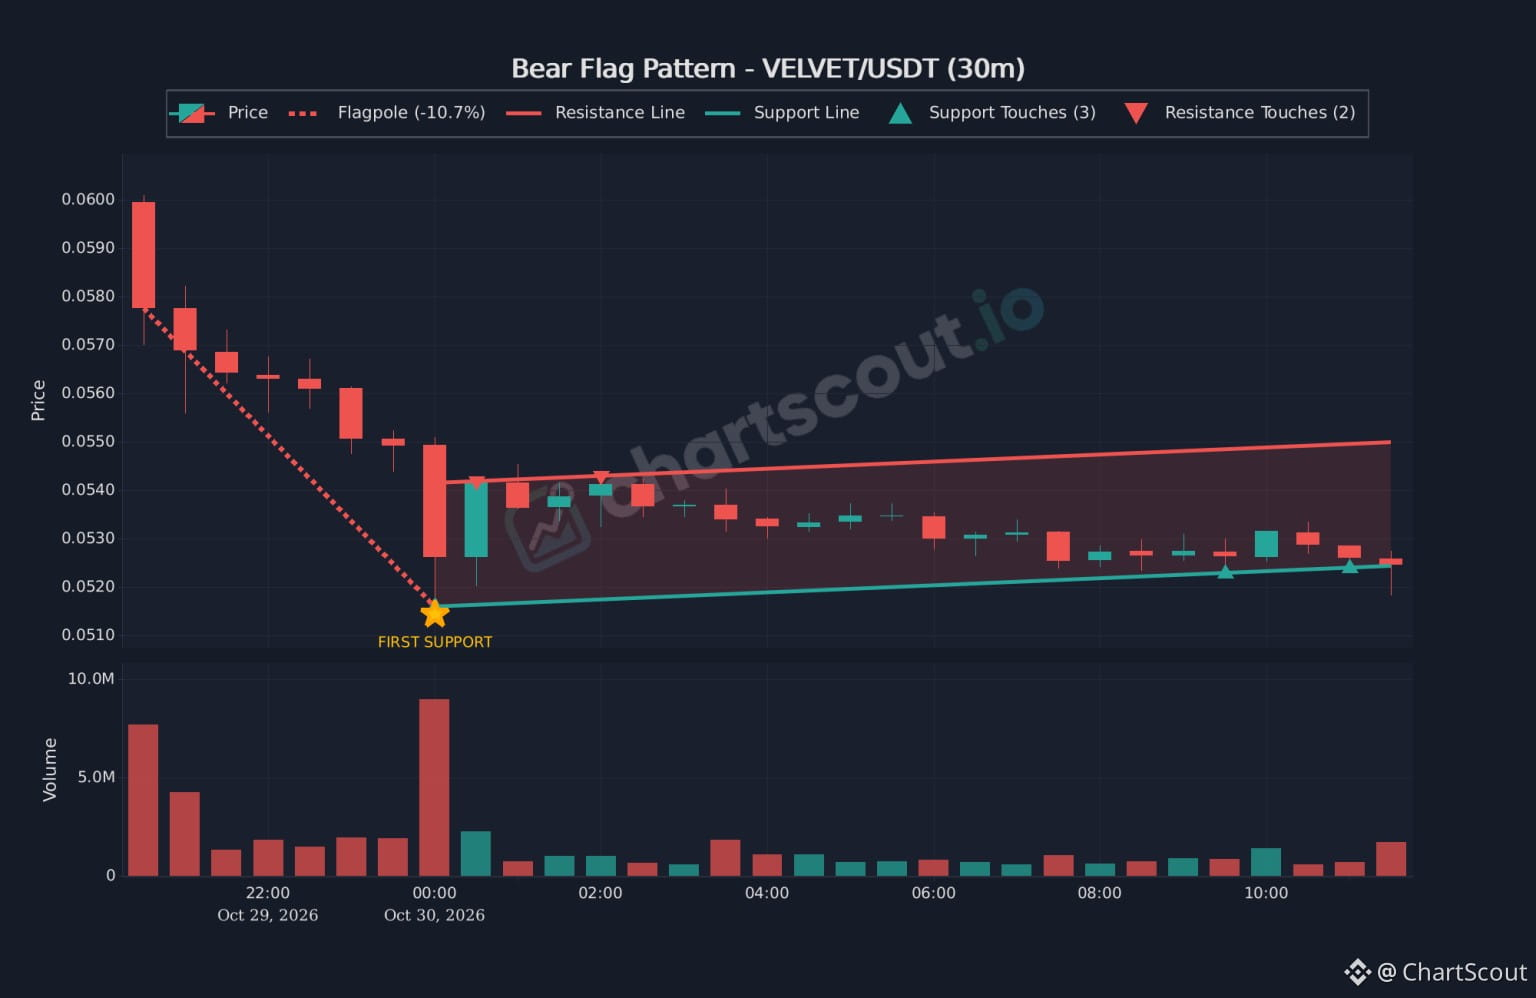
◈ ALGO BEACON | VELVET/USDT (30m) ◈
A 30m Bear Flag consolidation is actively testing channel support on VELVET/USDT detected by ChartScout.
[ STRUCTURE PROFILE ]
▶ Asset: VELVET/USDT (30m Timeframe)
▶ Pattern : Bear Flag (Continuation Setup)
▶ Impulse Drop : -10.7% Flagpole
▶ Support Floor : $0.0524 USDT (3 Retests)
▶ Resistance Ceiling : $0.0548 USDT (2 Retests)
▶ Current Tape : $0.0525 USDT (Testing Floor)
[ EXECUTION DYNAMICS ]
Following an initial -10.7% sell-off down to $0.0516, price action has drifted upward inside a tight consolidation channel. Lower support has been tested 3 times. Watch for volume expansion on a 30m candle close below $0.0524 to confirm potential downward continuation.
Discover real-time automated pattern recognition on ChartScout.
⚠️ DYOR - Not Financial Advice.
#ChartScout #Velvet #velvetustd #TradingTopics
3
2.2k
·
--
See translation
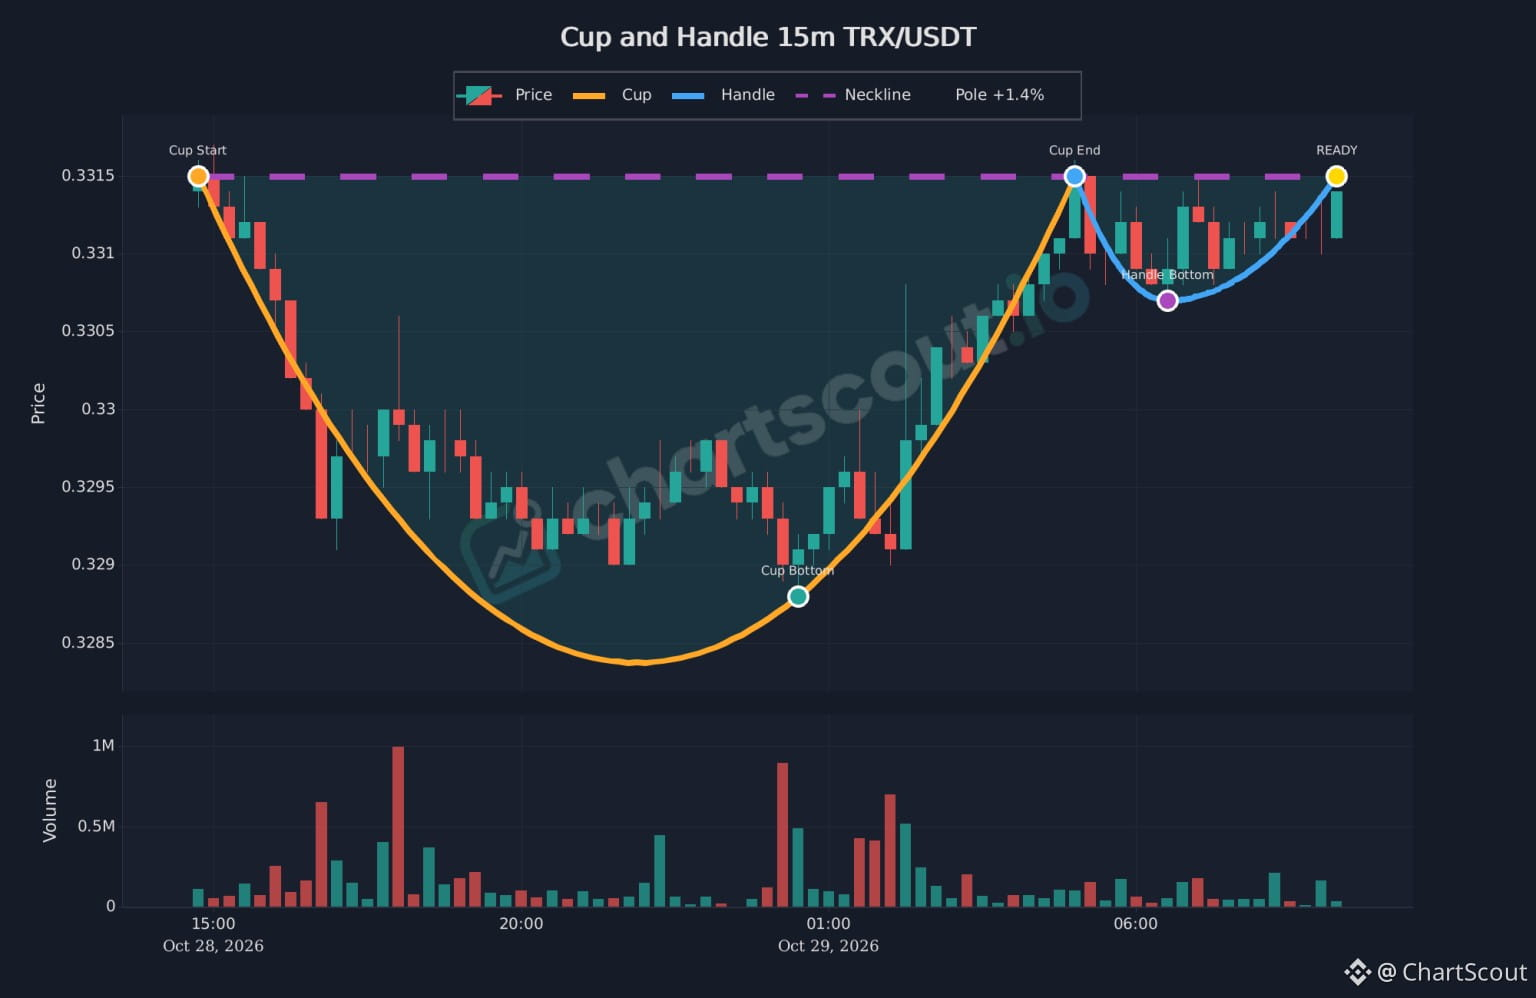
◈ ALGO BEACON | TRX/USDT (15m) ◈
A 15m Cup and Handle pattern has reached READY status on TRON ($TRX) detected by ChartScout.
[ STRUCTURE PROFILE ]
▶ Asset : TRX/USDT (15m Timeframe)
▶ Pattern : Cup & Handle (Bullish Continuation)
▶ Structural Impulse : +1.4%
▶ Base Support (Cup) : $0.3288 USDT
▶ Handle Pivot : $0.3307 USDT
▶ Trigger Ceiling : $0.3315 USDT
▶ Current State : Testing Neckline
[ EXECUTION DYNAMICS ]
Price rounded out an accumulation base from $0.3288, followed by a shallow handle consolidated above $0.3307. Buyers have pushed price back to the $0.3315 neckline. Watch for volume confirmation on a 15m candle close above resistance to signal breakout execution.
Discover real-time automated pattern recognition on ChartScout.
⚠️ DYOR - Not Financial Advice.
#ChartScout #TRX #TRX✅ #Trxusdt
1
184
·
--
See translation
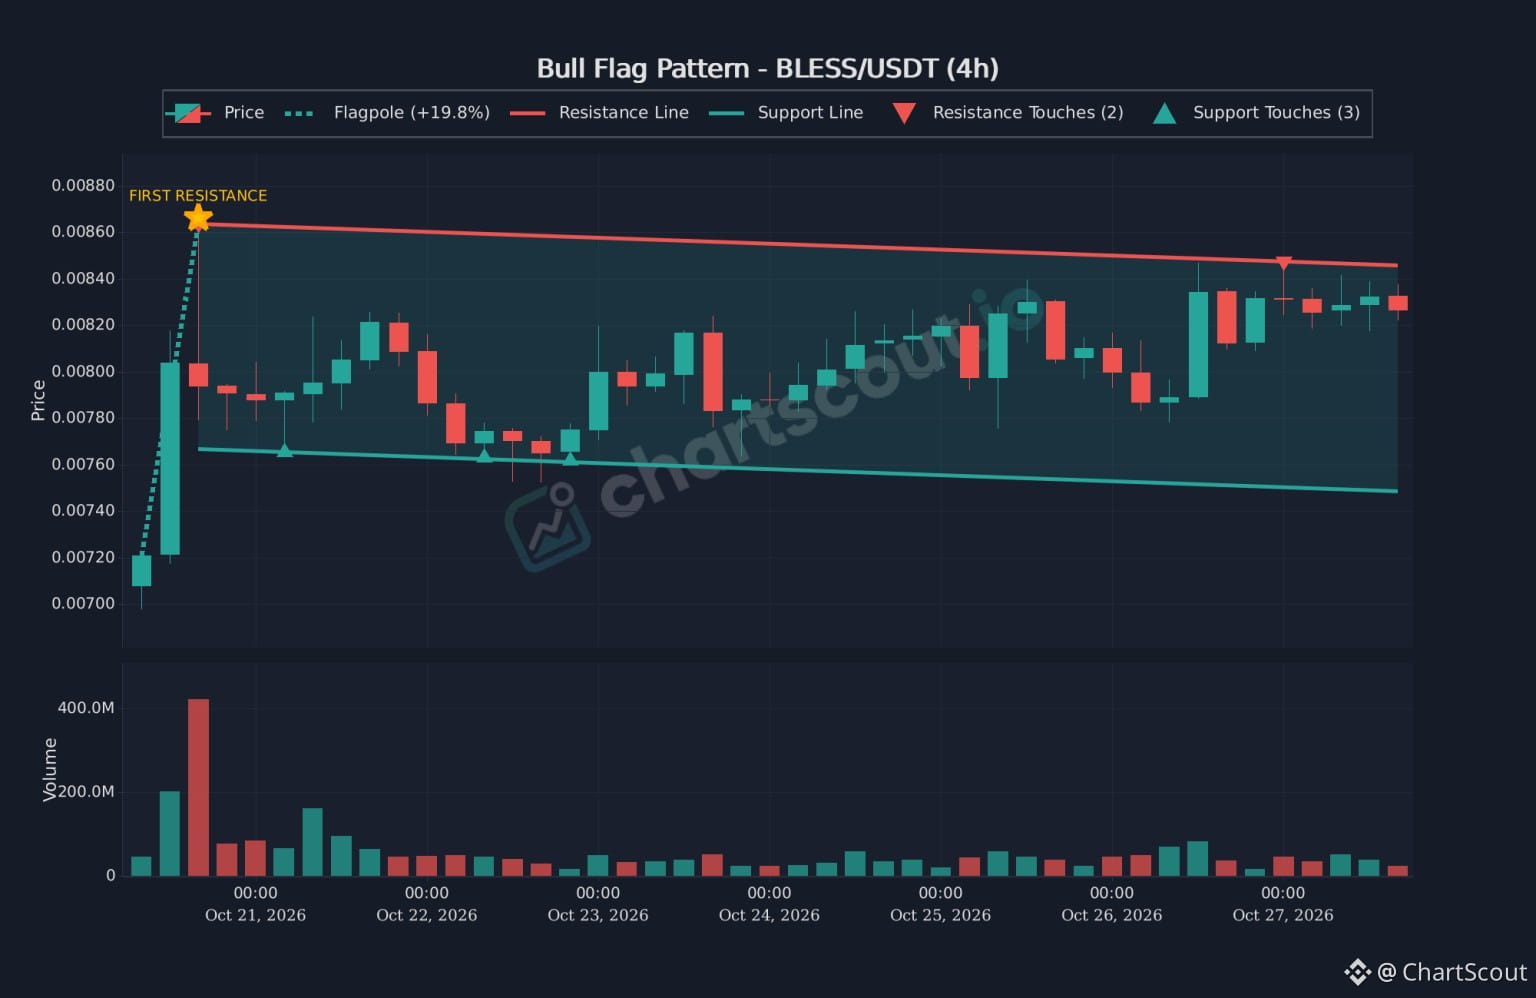
◈ ALGO BEACON | BLESS/USDT (4h) ◈
A multi-day Bull Flag structure is testing upper resistance on BLESS/USDT after a +19.8% rally detected by ChartScout.
[ STRUCTURE PROFILE ]
▶ Asset: BLESS/USDT (4h Timeframe)
▶ Pattern: Bull Flag (Continuation Setup)
▶ Macro Impulse: +19.8% Flagpole
▶ Upper Resistance Ceiling: $0.00845 USDT (2 Retests)
▶ Lower Support Floor: $0.00750 USDT (3 Retests)
▶ Current Tape: $0.00832 USDT (Testing Ceiling)
[ EXECUTION DYNAMICS ]
Following a massive +19.8% surge up to $0.00865, price action has consolidated inside a downward-sloping flag channel. Buyers are currently testing upper flag resistance. Watch for volume expansion on a 4h candle close above $0.00845 to confirm potential trend continuation.
Discover real-time automated pattern recognition on ChartScout.
⚠️ DYOR - Not Financial Advice.
#ChartScout #dyor #Bless #BİNANCESQUARE #cryptotrading
1
287
·
--
See translation
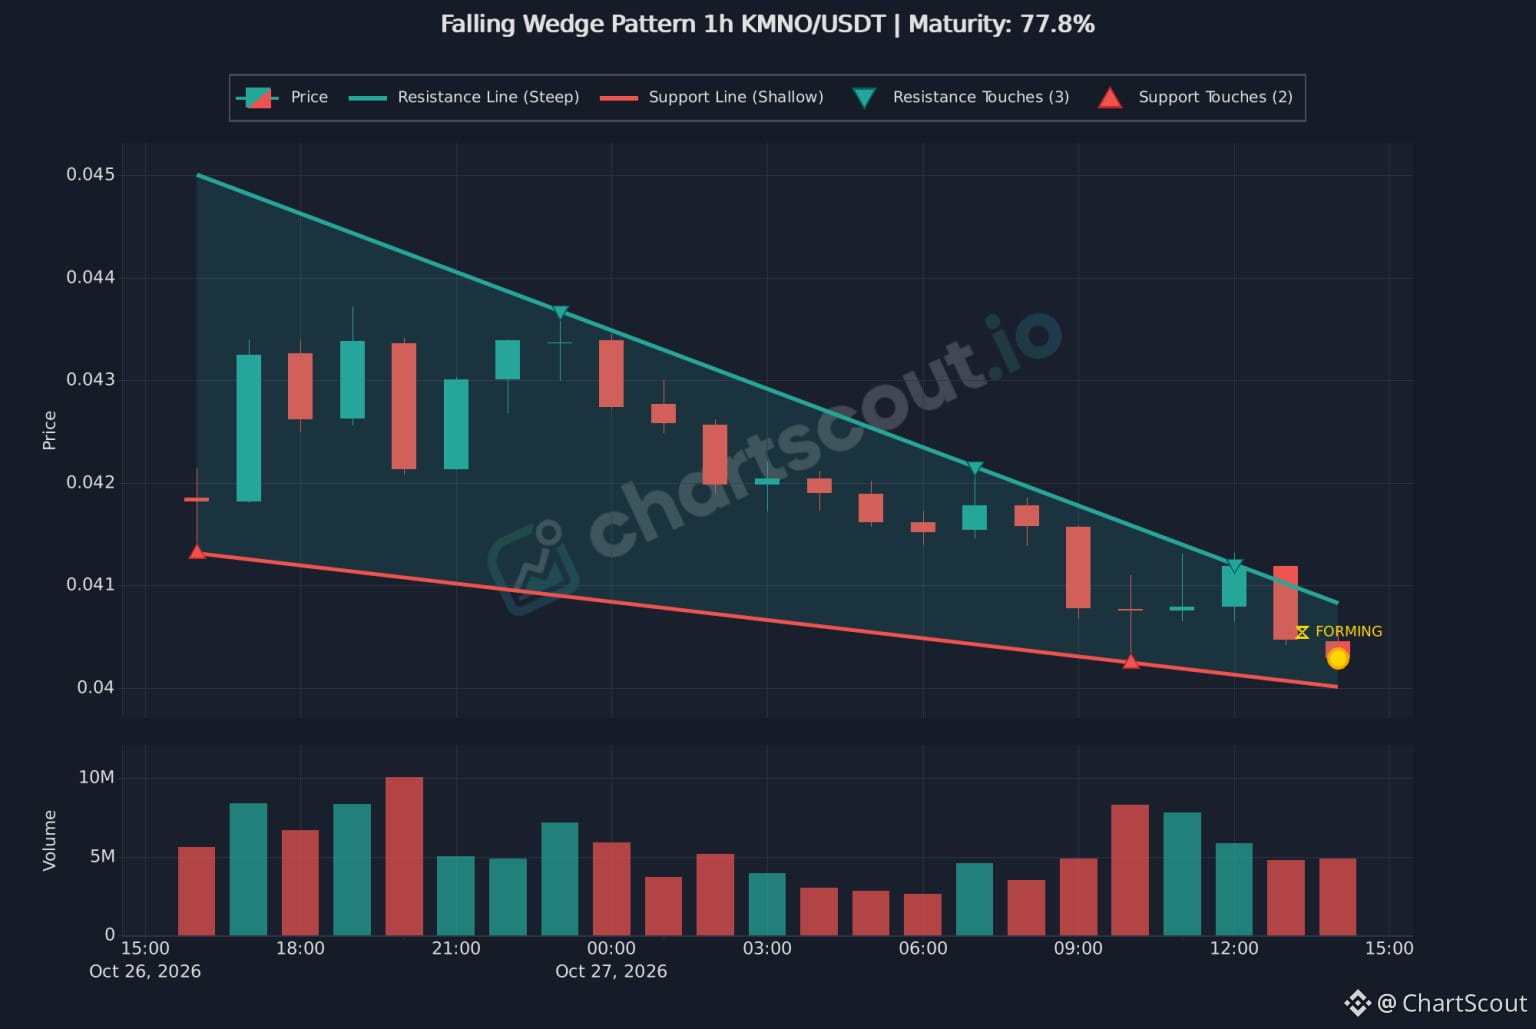
◈ QUANT RADAR | KMNO/USDT (1h) ◈
A 1h Falling Wedge reversal structure is compressing near its apex at 77.8% maturity on Kamino ($KMNO) detected by ChartScout.
[ STRUCTURAL MATRIX ]
▶ Asset: KMNO/USDT (1h Timeframe)
▶ Pattern: Falling Wedge (Reversal Bias)
▶ Pattern Maturity: 77.8%
▶ Steep Ceiling: $0.0408 USDT (3 Retests)
▶ Shallow Floor: $0.0400 USDT (2 Retests)
▶ Current Tape: $0.0404 USDT (Compressing)
[ EXECUTION DYNAMICS ]
Selling pressure has steadily dried up as price action narrows near $0.0400 support. Watch for volume expansion on a 1h candle close above steep resistance (~$0.0408) to confirm potential bullish reversal momentum.
Discover automated technical pattern scans on ChartScout.
⚠️ DYOR - Not Financial Advice.
#ChartScout #cryptotrading #KMNO #KMNOUSDC
228
·
--
See translation
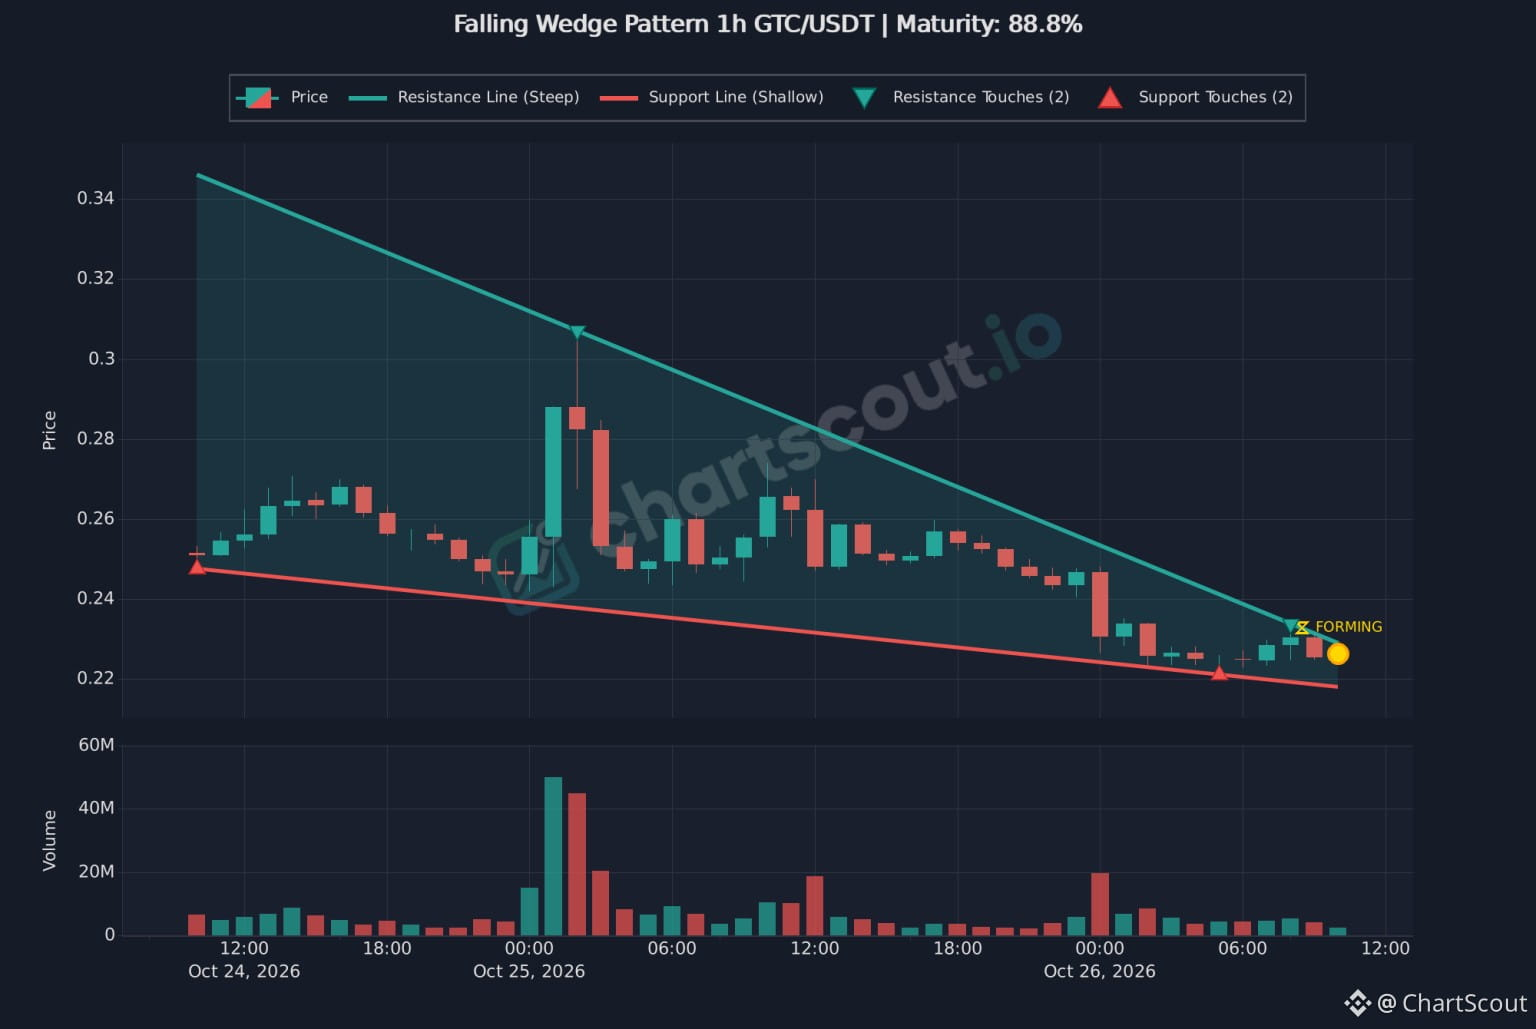
◈ QUANT RADAR | GTC/USDT (1h) ◈
A high-conviction Falling Wedge reversal setup is approaching its apex at 88.8% maturity on Gitcoin ($GTC) detected by ChartScout.
[ STRUCTURAL MATRIX ]
▶ Asset: GTC/USDT (1h Timeframe)
▶ Pattern: Falling Wedge (Reversal Bias)
▶ Pattern Maturity : 88.8% (At Apex)
▶ Steep Ceiling : $0.2320 USDT (2 Retests)
▶ Shallow Floor : $0.2180 USDT (2 Retests)
▶ Current Tape : $0.2260 USDT (Compressing)
[ EXECUTION DYNAMICS ]
Downside volatility has dried up significantly as price reaches the tip of the wedge structure. Watch for volume expansion on a 1h candle close above steep resistance to confirm potential bullish reversal momentum.
Discover automated technical pattern scans on ChartScout.
⚠️ DYOR - Not Financial Advice.
#ChartScout #GTC #GTCUSDT
557
·
--
See translation
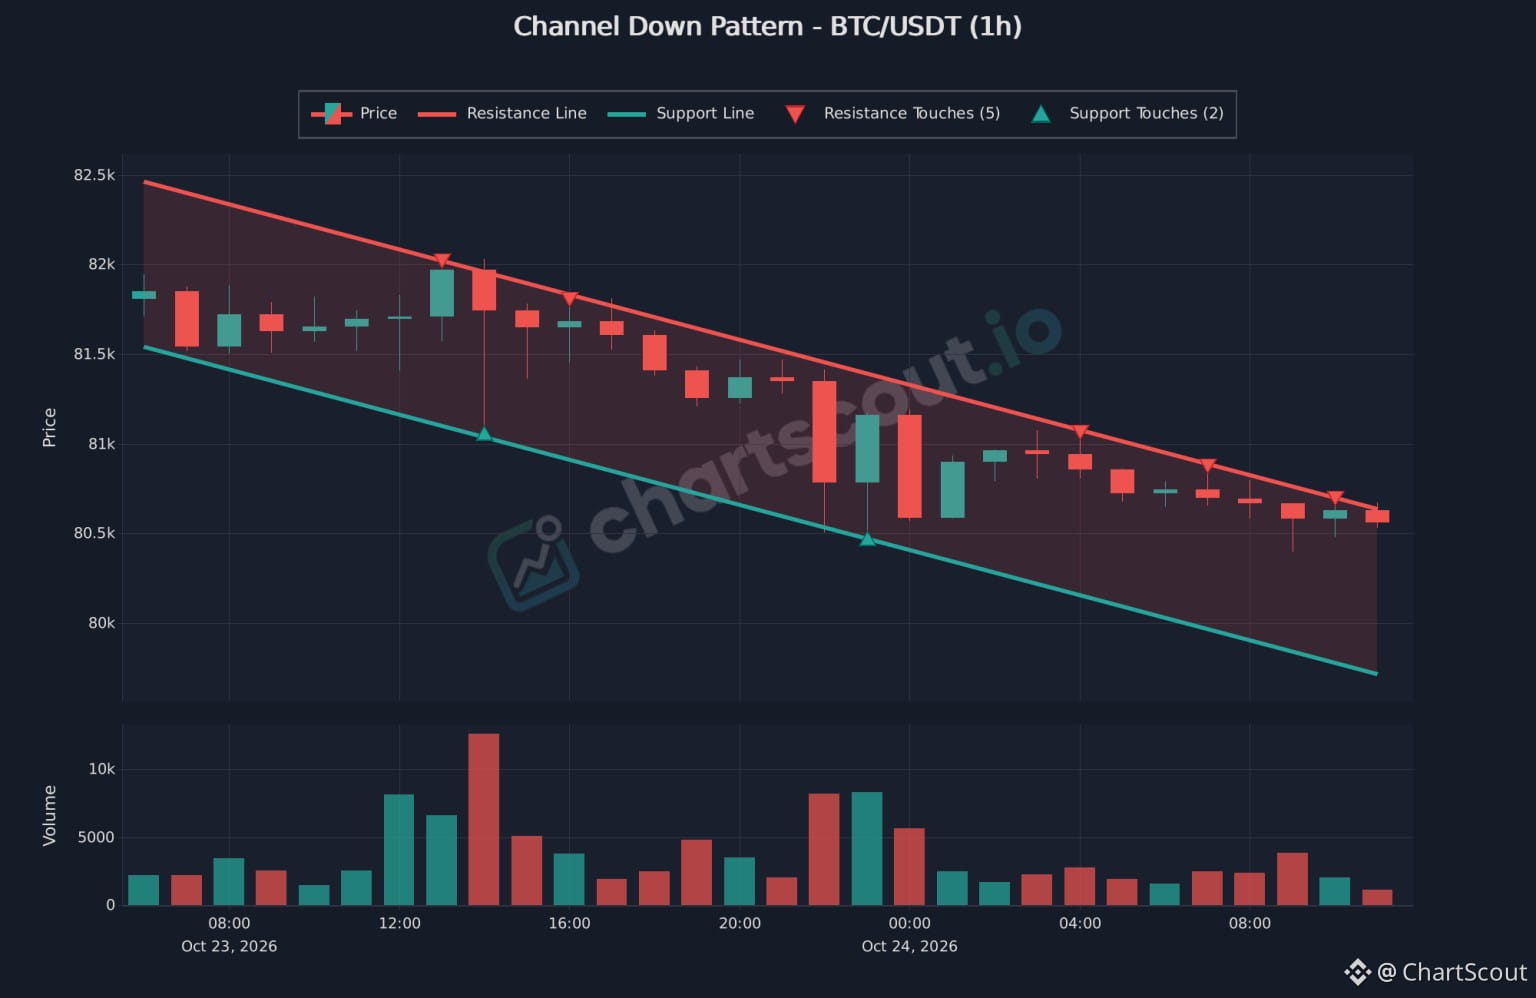
⚡ [MACRO TACTICAL WIRE] BTC/USDT (1h)
Bitcoin ($BTC) is testing the upper boundary of a 1h Descending Channel detected by ChartScout.
[ STRUCTURAL MATRIX ]
• Asset: BTC/USDT (1-Hour Timeframe)
• Setup: Channel Down (Descending Channel)
• Overhead Ceiling: $80,650 USDT (5 Retests)
• Channel Floor: $79,700 USDT (2 Retests)
• Current Tape: $80,600 USDT (Pressing Resistance)
[ EXECUTION THESIS ]
Bitcoin continues to print lower highs inside a steady descending slope, challenging upper resistance for the 5th time. A volume-backed 1h candle close above $80,650 signals potential trend reversal momentum, while a rejection keeps the downward channel intact toward lower support.
Discover live algorithmic pattern scanning on ChartScout.
⚠️ DYOR - Not Financial Advice.
#ChartScout #BTC #BTC☀️ #BTCUSDT
130
·
--
See translation
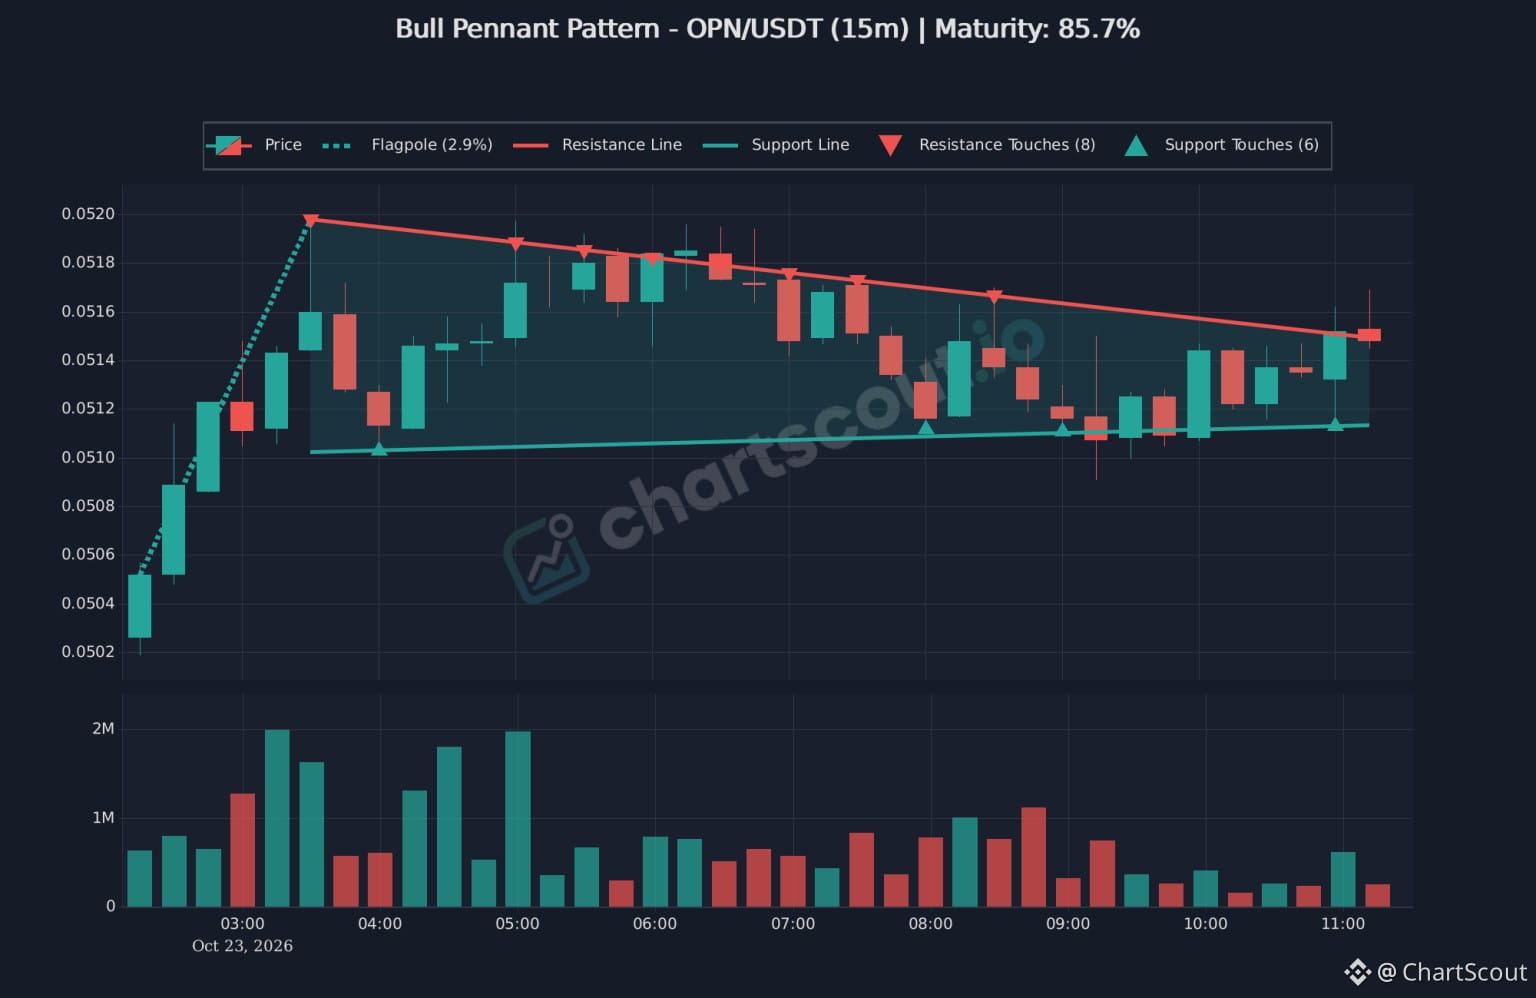
⚡ [QUANT BRIEF] OPN/USDT (15m) - Bull Pennant
An 85.7% mature Bull Pennant structure is testing overhead resistance on OPN/USDT detected by ChartScout.
[ STRUCTURAL MATRIX ]
• Setup: Bull Pennant (Continuation Setup)
• Impulse Wave: +2.9% Flagpole
• Upper Boundary: $0.0515 USDT (8 Retests)
• Lower Boundary: $0.0511 USDT (6 Retests)
• Current Tape: $0.0515 USDT (At Resistance)
[ EXECUTION DYNAMICS ]
Following a +2.9% initial impulse, price action has compressed into converging trendlines, testing upper resistance 8 times. Watch for volume confirmation on a 15m candle close above $0.0515 to confirm potential trend continuation.
Discover automated technical pattern scans on ChartScout.
⚠️ DYOR - Not Financial Advice.
#ChartScout #OPN #BİNANCESQUARE #CryptoTradingInsights
1.1k
·
--
See translation
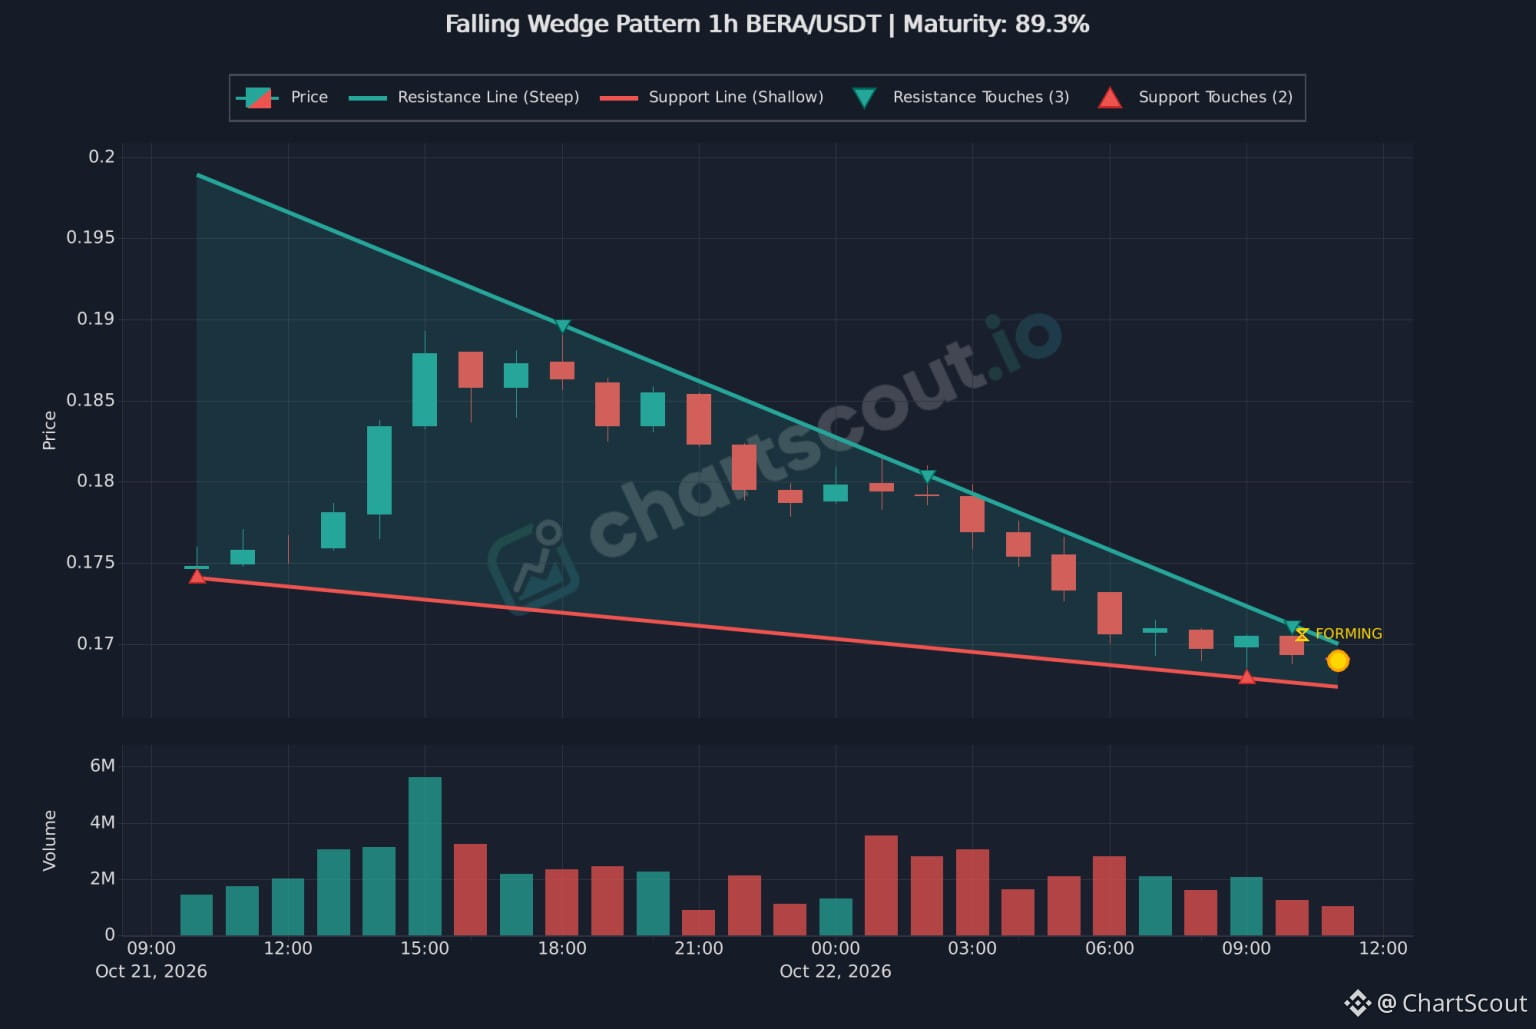
◈ ALGO BEACON | BERA/USDT (1h) ◈
A 1h Falling Wedge structure is compressing near its apex at 89.3% maturity on BERA/USDT detected by ChartScout.
[ STRUCTURE PROFILE ]
▶ Asset: BERA/USDT (1h Timeframe)
▶ Pattern: Falling Wedge (Reversal Bias)
▶ Pattern Maturity: 89.3% (At Apex)
▶ Steep Resistance Ceiling: $0.1710 USDT (3 Retests)
▶ Shallow Support Floor: $0.1675 USDT (2 Retests)
▶ Current Tape: $0.1695 USDT (Compressing)
[ EXECUTION DYNAMICS ]
Downside volatility has contracted after multiple retests along steep resistance. Price is squeezed near $0.1695. Watch for volume expansion on a 1h candle close above steep resistance to signal potential bullish reversal momentum.
Discover real-time automated pattern recognition on ChartScout.
⚠️ DYOR - Not Financial Advice.
#ChartScout #dyor #BERA #BİNANCESQUARE #cryptotrading
116
·
--
See translation
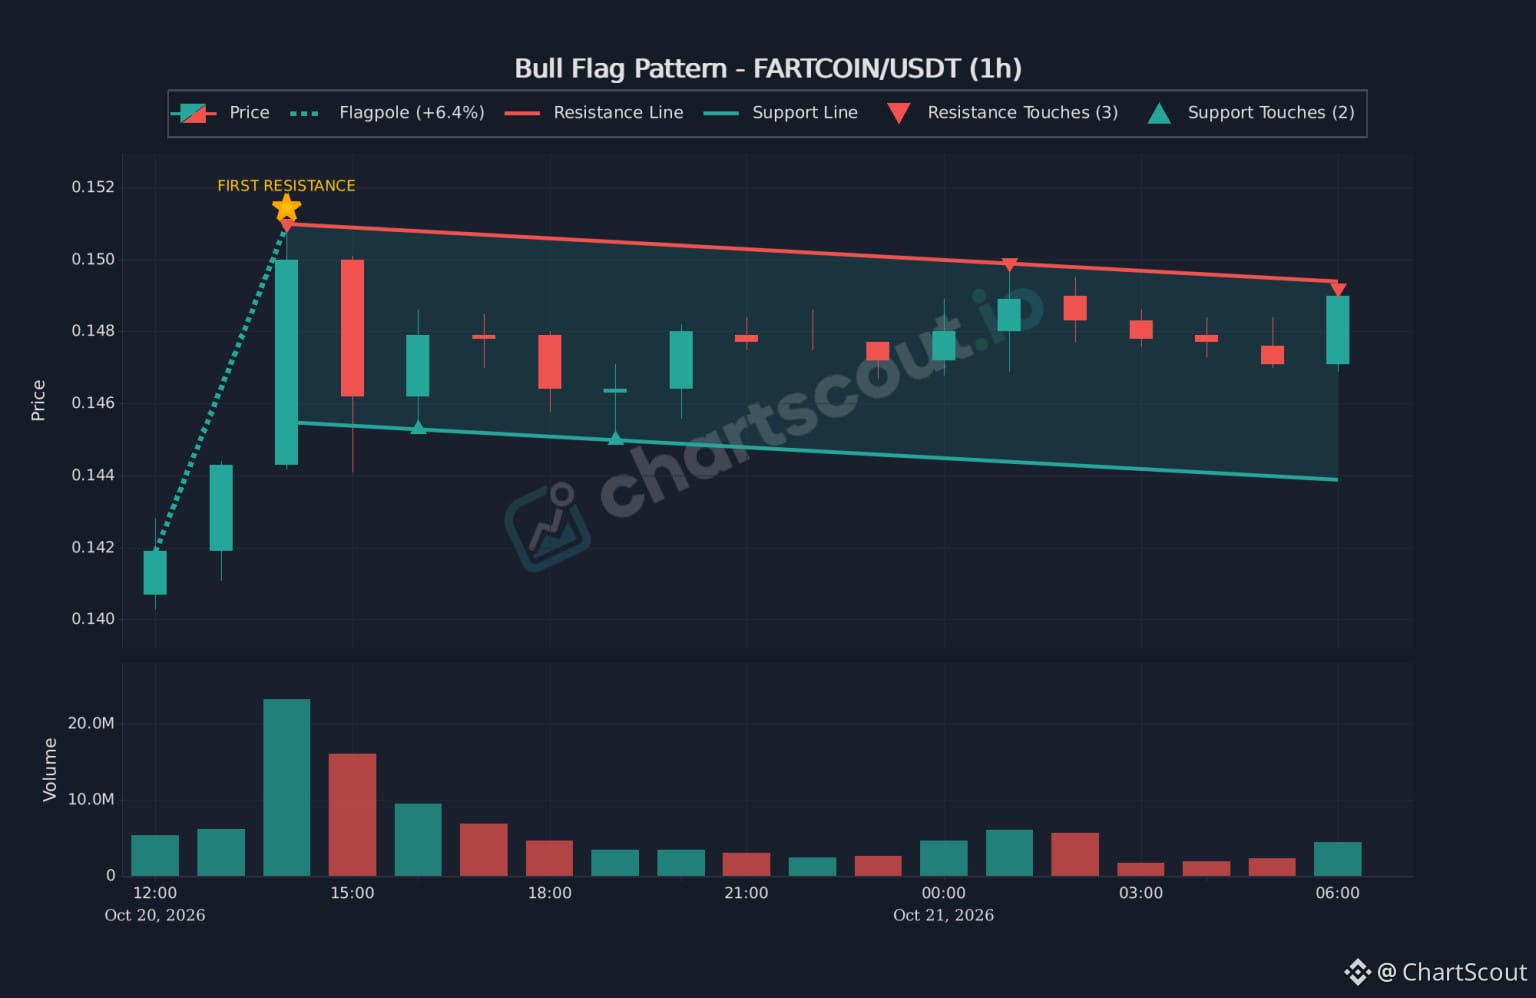
◈ ALGO BEACON | FARTCOIN/USDT (1h) ◈
A 1h Bull Flag continuation structure is testing resistance on FARTCOIN/USDT detected by ChartScout.
[ STRUCTURE PROFILE ]
▶ Asset: FARTCOIN/USDT (1h Timeframe)
▶ Pattern: Bull Flag (Continuation)
▶ Structural Impulse: +6.4% (Flagpole)
▶ Resistance Ceiling: $0.1495 USDT (3 Retests)
▶ Support Floor: $0.1440 USDT (2 Retests)
▶ Current Tape: $0.1488 USDT (Testing Ceiling)
[ EXECUTION DYNAMICS ]
Following an initial +6.4% impulse rally to $0.1510, price action has consolidated inside a downward-sloping flag channel. Buyers are now testing upper flag resistance for the 3rd time. Watch for volume expansion on a 1h candle close above $0.1495 to confirm potential trend continuation.
Discover real-time automated pattern recognition on ChartScout.
⚠️ DYOR - Not Financial Advice.
#ChartScout #Fartcoin #FARTCOİN
330
·
--
See translation
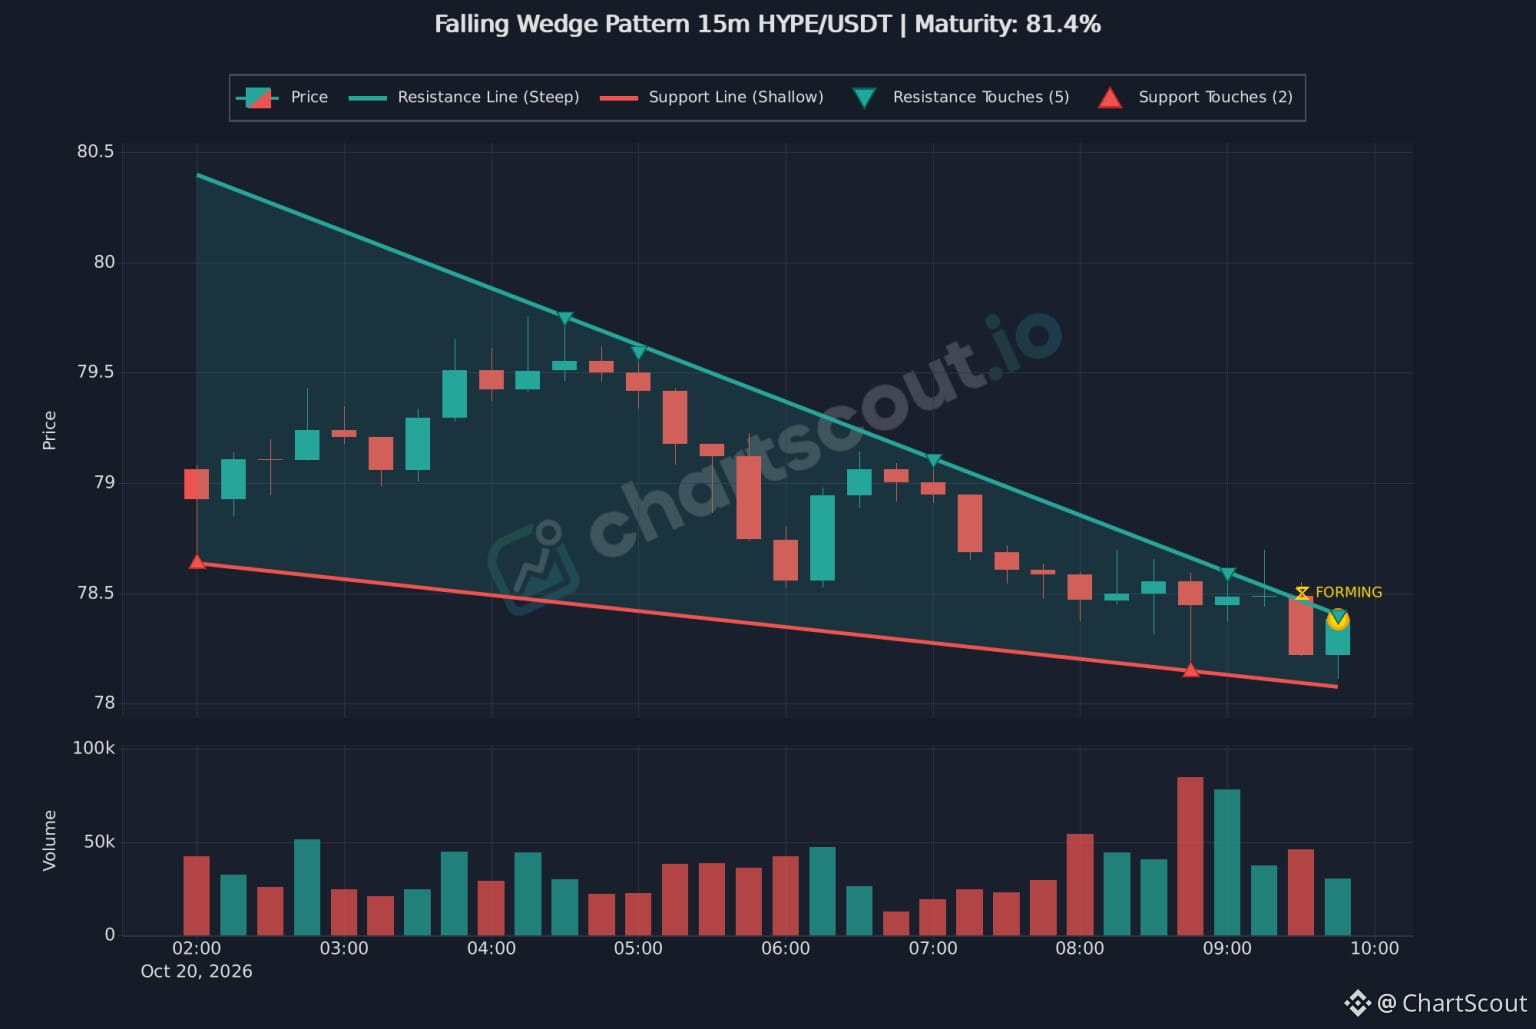
◈ ALGO BEACON | HYPE/USDT (15m) ◈
A 15m Falling Wedge structure is compressing near its apex at 81.4% maturity on HYPE/USDT detected by ChartScout.
[ STRUCTURE PROFILE ]
▶ Asset: HYPE/USDT (15m Timeframe)
▶ Pattern: Falling Wedge (Reversal Bias)
▶ Pattern Maturity: 81.4% (Near Apex)
▶ Steep Resistance Ceiling: $78.45 USDT (5 Retests)
▶ Shallow Support Floor: $78.10 USDT (2 Retests)
▶ Current Tape: $78.30 USDT (Compressing)
[ EXECUTION DYNAMICS ]
Downside volatility has contracted after 5 retests along steep resistance. Price is squeezed near $78.30. Watch for volume expansion on a 15m candle close above steep resistance to signal potential bullish reversal momentum.
Discover real-time automated pattern recognition on ChartScout.
⚠️ DYOR - Not Financial Advice.
#ChartScout #hype #Hyperliquid #hypeusdt
212
·
--
See translation
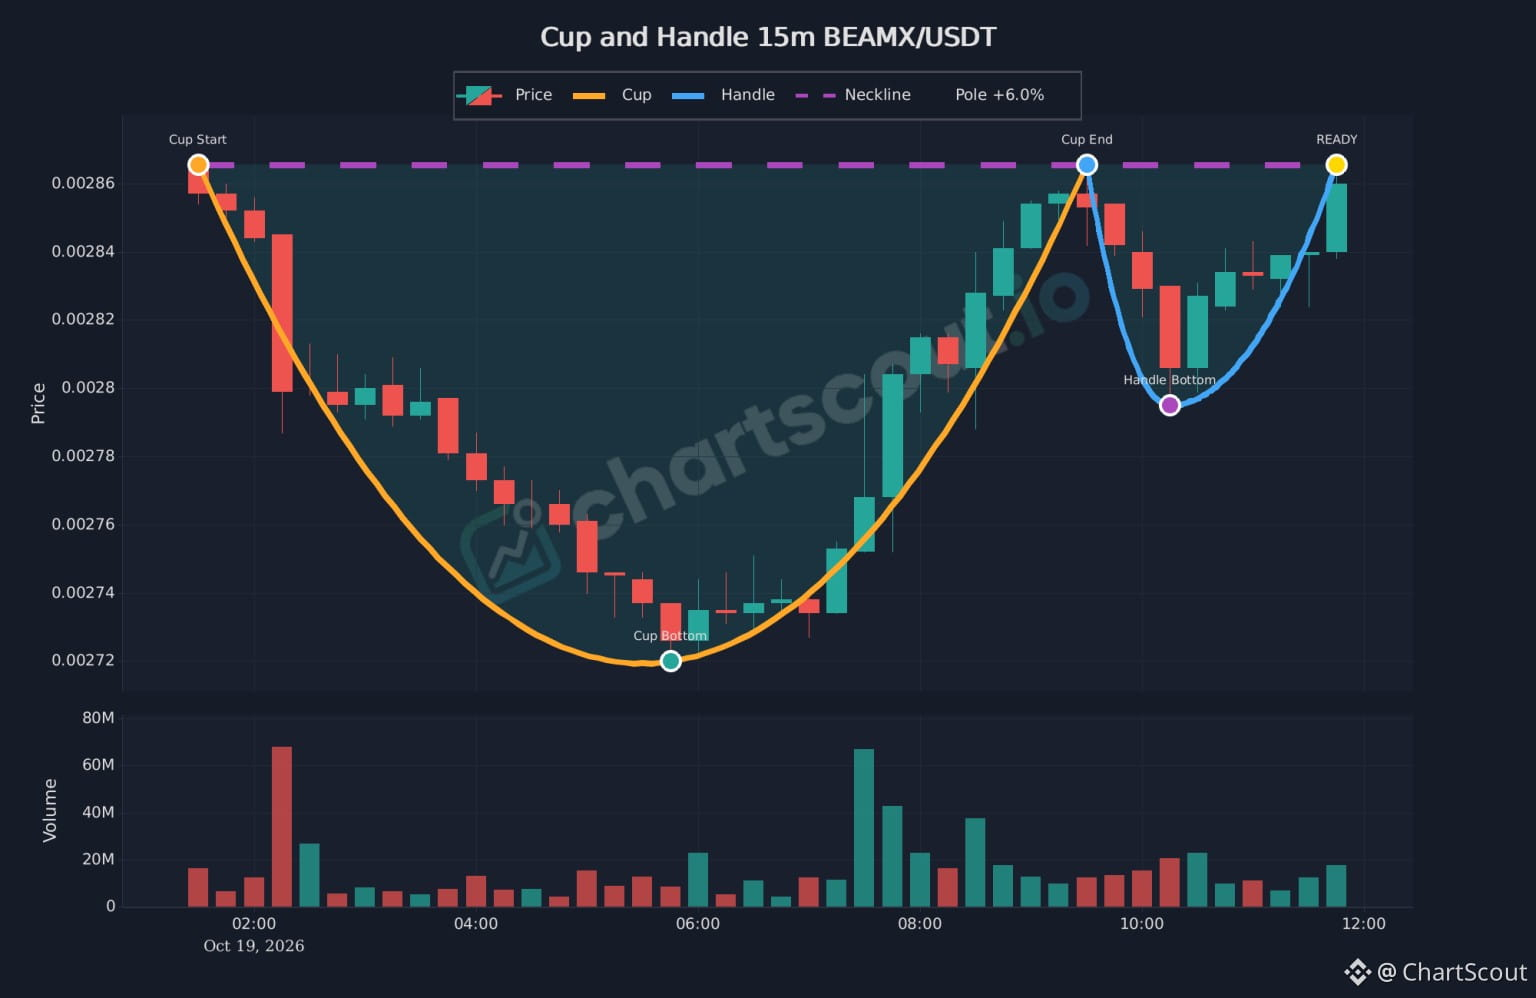
◈ ALGO BEACON | BEAMX/USDT (15m) ◈
A textbook Cup and Handle structure has reached "READY" status on BEAMX/USDT detected by ChartScout.
[ STRUCTURE PROFILE ]
▶ Asset: BEAMX/USDT (15m Timeframe)
▶ Pattern: Cup & Handle (Bullish Continuation)
▶ Structural Impulse: +6.0%
▶ Base Support (Cup): $0.00272 USDT
▶ Handle Pivot: $0.002795 USDT
▶ Trigger Ceiling: $0.002865 USDT
▶ Current State: Testing Neckline
[ EXECUTION DYNAMICS ]
After printing a rounded recovery from $0.00272, price consolidated inside a shallow handle holding above $0.002795. Buyers have pushed price back to the $0.002865 neckline. Watch for volume confirmation on a 15m candle close above resistance to signal breakout execution.
Discover real-time automated pattern recognition on ChartScout.
⚠️ DYOR - Not Financial Advice.
#ChartScout #BEAMX #BEAMXUSDT #cupandhandle
1
383
·
--
See translation
━━━━━━━━━━━━━━━━━━━━━━━━━━━━
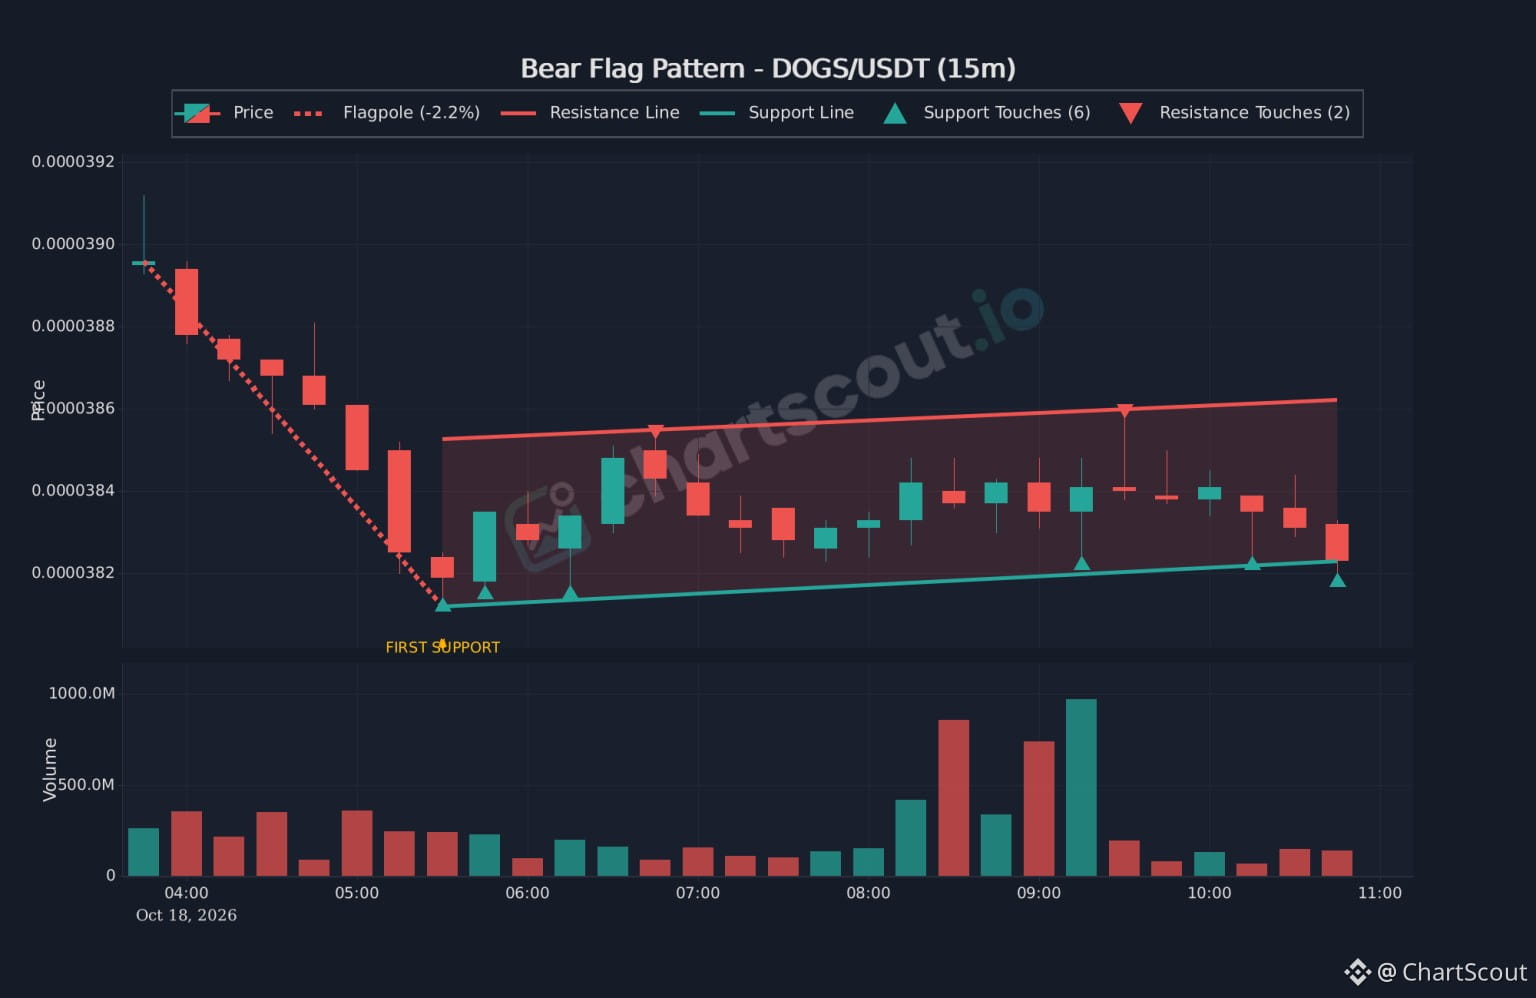
⚡ CHARTSCOUT RADAR | DOGS/USDT (15m)
━━━━━━━━━━━━━━━━━━━━━━━━━━━━
A 15m Bear Flag consolidation is actively testing channel support on DOGS/USDT detected by ChartScout.
[ STRUCTURAL MATRIX ]
• Setup: Bear Flag (Continuation Setup)
• Impulse Drop: -2.2% Flagpole
• Support Floor: $0.0000382 USDT (6 Retests)
• Resistance Ceiling: $0.0000386 USDT (2 Retests)
• Current Tape: $0.00003825 USDT (Testing Floor)
[ BREAKOUT FRAMEWORK ]
Following a -2.2% drop to $0.0000381, price action has drifted upward inside an ascending channel. Lower support has been tested 6 times. Watch for volume expansion on a 15m candle close below $0.0000382 to confirm potential downward continuation.
Discover automated technical pattern scans on ChartScout.
⚠️ DYOR - Not Financial Advice.
#ChartScout #Dogs #BinanceSquareTalks #CryptoTradingTips
━━━━━━━━━━━━━━━━━━━━━━━━━━━━
⚡ CHARTSCOUT RADAR | DOGS/USDT (15m)
━━━━━━━━━━━━━━━━━━━━━━━━━━━━
A 15m Bear Flag consolidation is actively testing channel support on DOGS/USDT detected by ChartScout.
[ STRUCTURAL MATRIX ]
• Setup: Bear Flag (Continuation Setup)
• Impulse Drop: -2.2% Flagpole
• Support Floor: $0.0000382 USDT (6 Retests)
• Resistance Ceiling: $0.0000386 USDT (2 Retests)
• Current Tape: $0.00003825 USDT (Testing Floor)
[ BREAKOUT FRAMEWORK ]
Following a -2.2% drop to $0.0000381, price action has drifted upward inside an ascending channel. Lower support has been tested 6 times. Watch for volume expansion on a 15m candle close below $0.0000382 to confirm potential downward continuation.
Discover automated technical pattern scans on ChartScout.
⚠️ DYOR - Not Financial Advice.
#ChartScout #Dogs #BinanceSquareTalks #CryptoTradingTips
250
·
--
See translation
━━━━━━━━━━━━━━━━━━━━━━━━━━━━
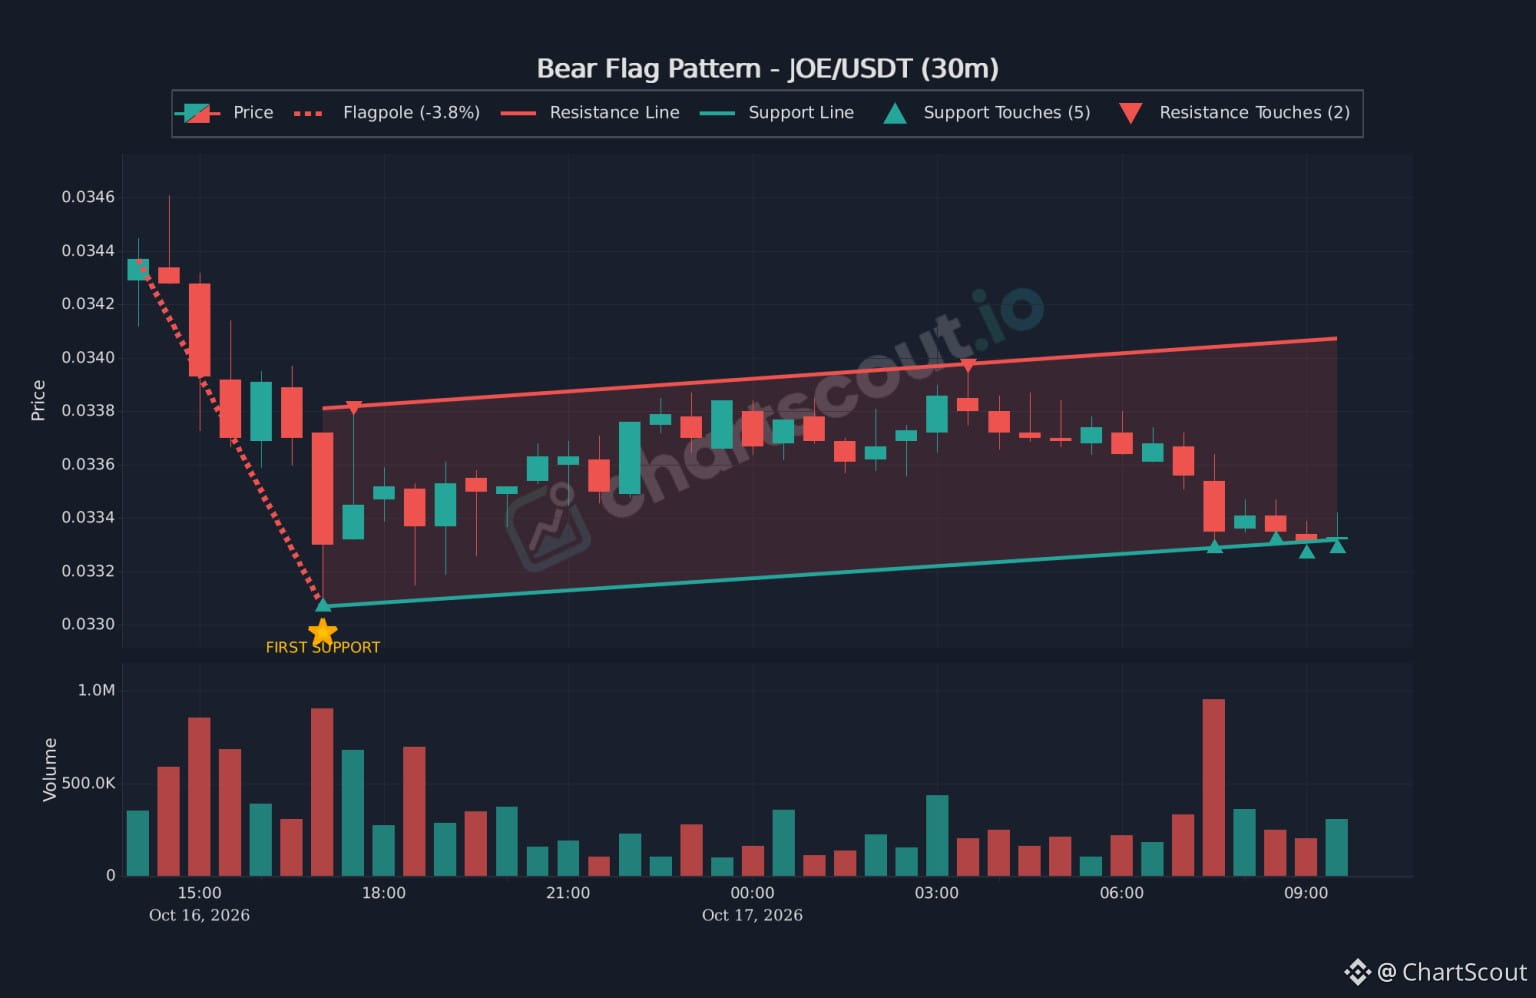
⚡ CHARTSCOUT RADAR | JOE/USDT (30m)
━━━━━━━━━━━━━━━━━━━━━━━━━━━━
A 30m Bear Flag consolidation is actively testing channel support on Trader Joe ($JOE) detected by ChartScout.
[ STRUCTURAL MATRIX ]
• Setup: Bear Flag (Continuation Setup)
• Impulse Drop: -3.8% Flagpole
• Support Floor: $0.0333 USDT (5 Retests)
• Resistance Ceiling: $0.0340 USDT (2 Retests)
• Current Tape: $0.0333 USDT (Testing Floor)
[ BREAKOUT FRAMEWORK ]
Following an initial -3.8% drop to $0.03305, price action has drifted upward inside an ascending channel. Lower support has been tested 5 times. Watch for volume expansion on a 30m candle close below $0.0333 to confirm potential downward continuation.
Discover automated technical pattern scans on ChartScout.
⚠️ DYOR - Not Financial Advice.
#ChartScout #joe #BİNANCESQUARE #cryptotrading
━━━━━━━━━━━━━━━━━━━━━━━━━━━━
⚡ CHARTSCOUT RADAR | JOE/USDT (30m)
━━━━━━━━━━━━━━━━━━━━━━━━━━━━
A 30m Bear Flag consolidation is actively testing channel support on Trader Joe ($JOE) detected by ChartScout.
[ STRUCTURAL MATRIX ]
• Setup: Bear Flag (Continuation Setup)
• Impulse Drop: -3.8% Flagpole
• Support Floor: $0.0333 USDT (5 Retests)
• Resistance Ceiling: $0.0340 USDT (2 Retests)
• Current Tape: $0.0333 USDT (Testing Floor)
[ BREAKOUT FRAMEWORK ]
Following an initial -3.8% drop to $0.03305, price action has drifted upward inside an ascending channel. Lower support has been tested 5 times. Watch for volume expansion on a 30m candle close below $0.0333 to confirm potential downward continuation.
Discover automated technical pattern scans on ChartScout.
⚠️ DYOR - Not Financial Advice.
#ChartScout #joe #BİNANCESQUARE #cryptotrading
1
532
·
--
See translation
━━━━━━━━━━━━━━━━━━━━━━━━━━━━
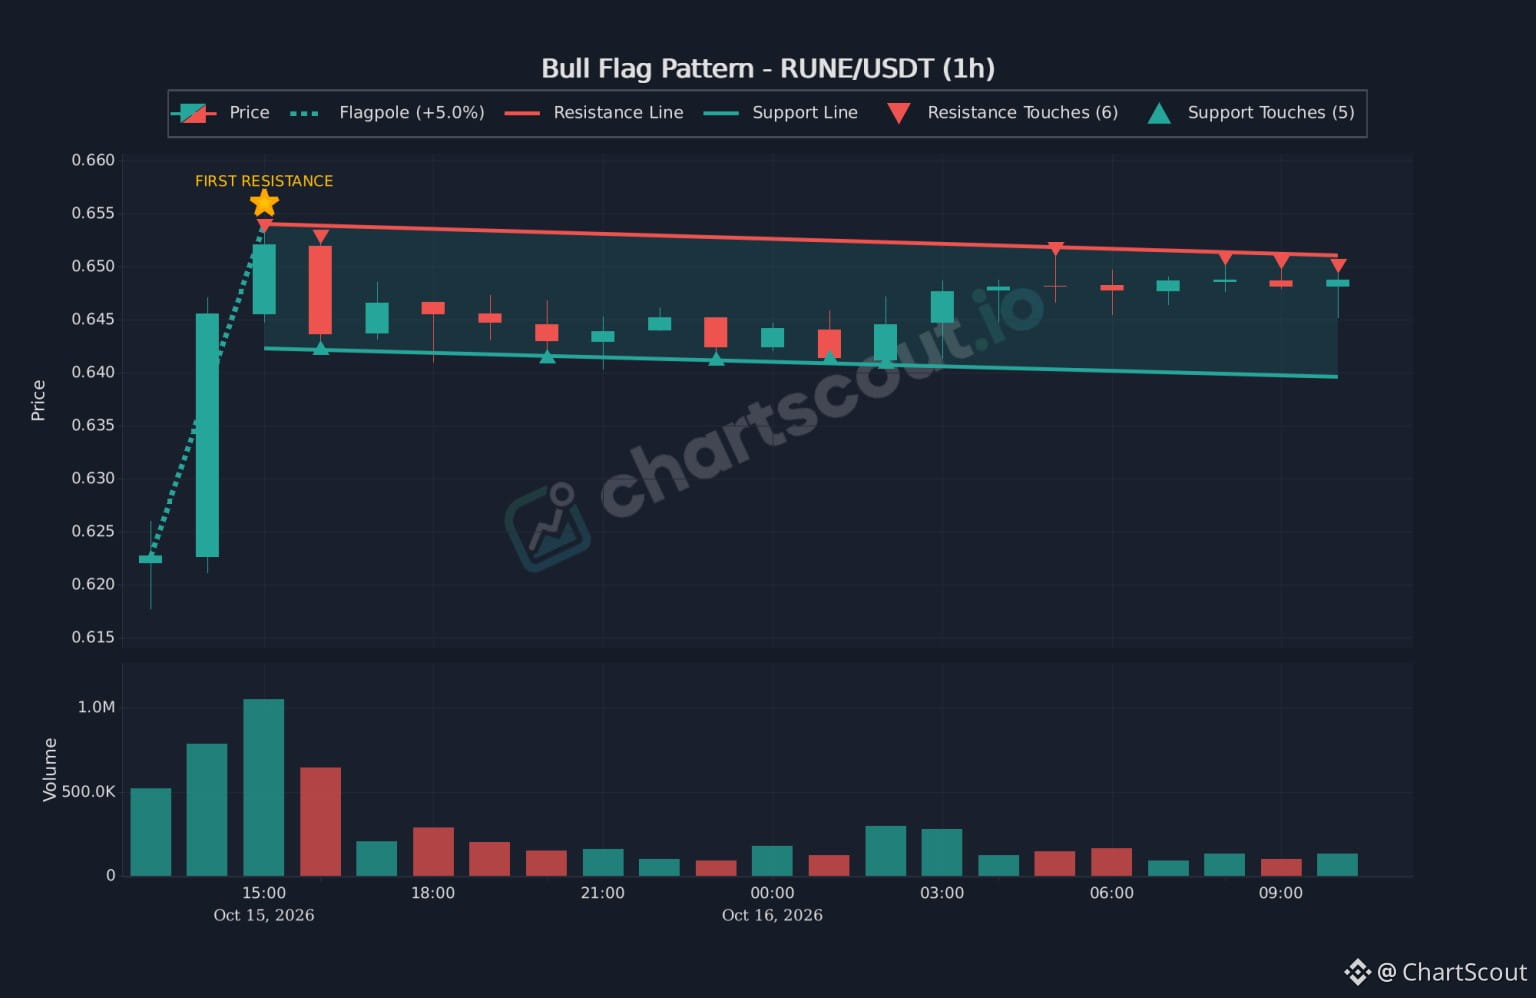
⚡ CHARTSCOUT RADAR | RUNE/USDT (1h)
━━━━━━━━━━━━━━━━━━━━━━━━━━━━
A Bull Flag continuation pattern is actively testing resistance on THORChain ($RUNE) detected by ChartScout.
[ STRUCTURAL MATRIX ]
• Setup: Bull Flag (Continuation)
• Impulse Rally: +5.0% Flagpole
• Resistance Ceiling: $0.6510 USDT (6 Retests)
• Support Floor: $0.6400 USDT (5 Retests)
• Current Tape: $0.6485 USDT (Testing Ceiling)
[ BREAKOUT FRAMEWORK ]
Following an initial +5.0% advance up to $0.6540, price action has consolidated inside a downward-sloping flag channel. Upper resistance has been tested 6 times and support 5 times. Watch for volume expansion on a 1h candle close above $0.6510 to confirm potential trend continuation.
Discover automated technical pattern scans on ChartScout.
⚠️ DYOR - Not Financial Advice.
#ChartScout #Rune #THORChain
━━━━━━━━━━━━━━━━━━━━━━━━━━━━
⚡ CHARTSCOUT RADAR | RUNE/USDT (1h)
━━━━━━━━━━━━━━━━━━━━━━━━━━━━
A Bull Flag continuation pattern is actively testing resistance on THORChain ($RUNE) detected by ChartScout.
[ STRUCTURAL MATRIX ]
• Setup: Bull Flag (Continuation)
• Impulse Rally: +5.0% Flagpole
• Resistance Ceiling: $0.6510 USDT (6 Retests)
• Support Floor: $0.6400 USDT (5 Retests)
• Current Tape: $0.6485 USDT (Testing Ceiling)
[ BREAKOUT FRAMEWORK ]
Following an initial +5.0% advance up to $0.6540, price action has consolidated inside a downward-sloping flag channel. Upper resistance has been tested 6 times and support 5 times. Watch for volume expansion on a 1h candle close above $0.6510 to confirm potential trend continuation.
Discover automated technical pattern scans on ChartScout.
⚠️ DYOR - Not Financial Advice.
#ChartScout #Rune #THORChain
200
·
--
See translation
━━━━━━━━━━━━━━━━━━━━━━━━━━━━
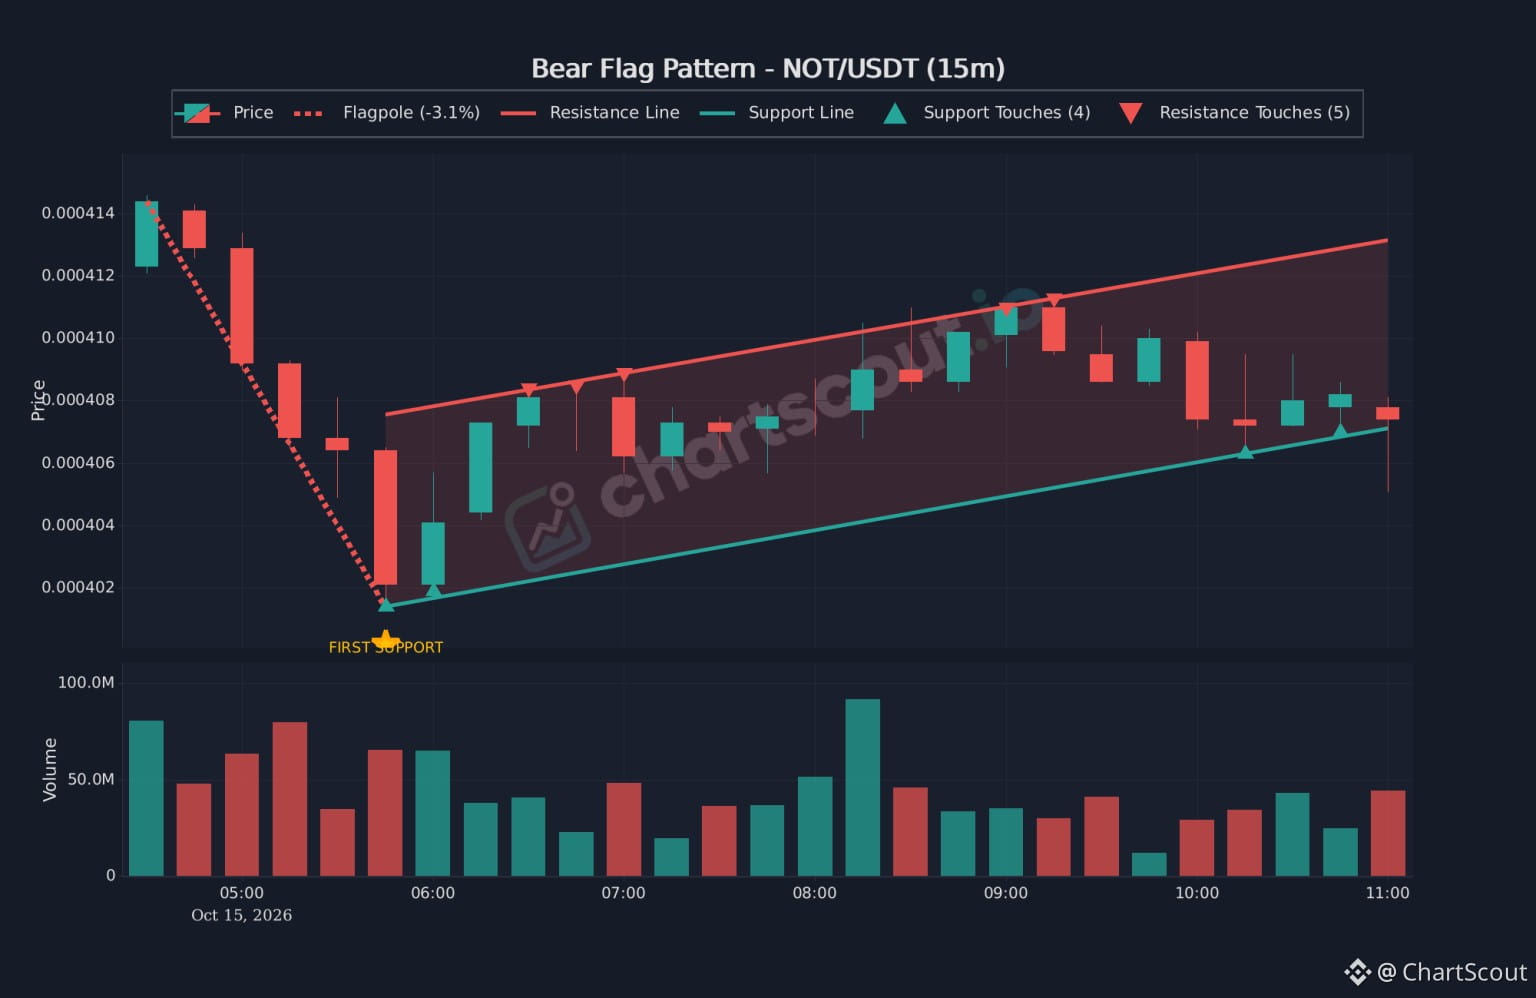
⚡ CHARTSCOUT RADAR | NOT/USDT (15m)
━━━━━━━━━━━━━━━━━━━━━━━━━━━━
A 15m Bear Flag consolidation is actively testing channel support on Notcoin ($NOT) detected by ChartScout.
[ STRUCTURAL MATRIX ]
• Setup: Bear Flag (Continuation Setup)
• Impulse Drop: -3.1% Flagpole
• Support Floor: $0.000407 USDT (4 Retests)
• Resistance Ceiling: $0.000413 USDT (5 Retests)
• Current Tape: $0.0004075 USDT (Testing Support)
[ BREAKOUT FRAMEWORK ]
Following an initial -3.1% drop to $0.0004015, price action has drifted upward inside an ascending channel. Lower support has been tested 4 times. Watch for volume expansion on a 15m candle close below $0.000407 to confirm potential downward continuation.
Discover automated technical pattern scans on ChartScout.
⚠️ DYOR - Not Financial Advice.
#ChartScout #NOT #Notcoin👀🔥 #NOTUSDT🚨
━━━━━━━━━━━━━━━━━━━━━━━━━━━━
⚡ CHARTSCOUT RADAR | NOT/USDT (15m)
━━━━━━━━━━━━━━━━━━━━━━━━━━━━
A 15m Bear Flag consolidation is actively testing channel support on Notcoin ($NOT) detected by ChartScout.
[ STRUCTURAL MATRIX ]
• Setup: Bear Flag (Continuation Setup)
• Impulse Drop: -3.1% Flagpole
• Support Floor: $0.000407 USDT (4 Retests)
• Resistance Ceiling: $0.000413 USDT (5 Retests)
• Current Tape: $0.0004075 USDT (Testing Support)
[ BREAKOUT FRAMEWORK ]
Following an initial -3.1% drop to $0.0004015, price action has drifted upward inside an ascending channel. Lower support has been tested 4 times. Watch for volume expansion on a 15m candle close below $0.000407 to confirm potential downward continuation.
Discover automated technical pattern scans on ChartScout.
⚠️ DYOR - Not Financial Advice.
#ChartScout #NOT #Notcoin👀🔥 #NOTUSDT🚨
110
·
--
See translation
━━━━━━━━━━━━━━━━━━━━━━━━━━━━
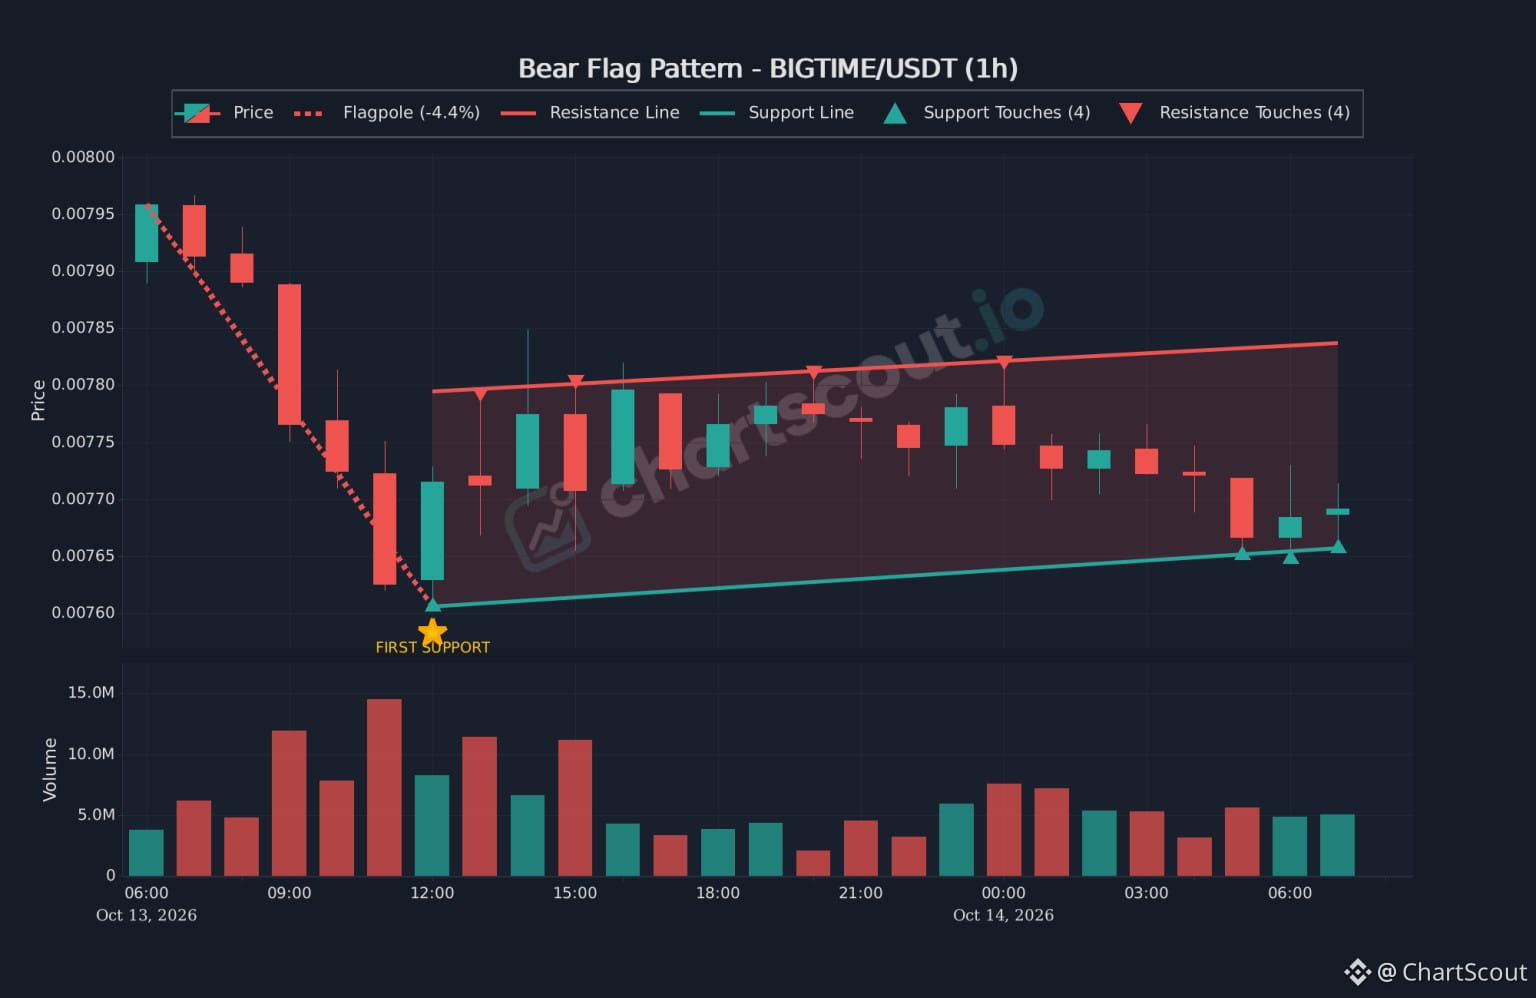
⚡ CHARTSCOUT RADAR | BIGTIME/USDT (1h)
━━━━━━━━━━━━━━━━━━━━━━━━━━━━
A 1h Bear Flag consolidation is actively testing channel support on BIGTIME/USDT detected by ChartScout.
[ STRUCTURAL MATRIX ]
• Setup: Bear Flag (Continuation Setup)
• Impulse Drop: -4.4% Flagpole
• Support Floor: $0.00766 USDT (4 Retests)
• Resistance Ceiling: $0.00783 USDT (4 Retests)
• Current Tape: $0.00768 USDT (Testing Support)
[ BREAKOUT FRAMEWORK ]
Following an initial -4.4% drop to $0.00760, price action has drifted upward inside an ascending channel. Lower support has been tested 4 times. Watch for volume expansion on a 1h candle close below $0.00766 to confirm potential downward continuation.
Discover automated technical pattern scans on ChartScout.
⚠️ DYOR - Not Financial Advice.
#ChartScout #Bigtime #BIGTIME/USDT #BIGTIMEUSDT
━━━━━━━━━━━━━━━━━━━━━━━━━━━━
⚡ CHARTSCOUT RADAR | BIGTIME/USDT (1h)
━━━━━━━━━━━━━━━━━━━━━━━━━━━━
A 1h Bear Flag consolidation is actively testing channel support on BIGTIME/USDT detected by ChartScout.
[ STRUCTURAL MATRIX ]
• Setup: Bear Flag (Continuation Setup)
• Impulse Drop: -4.4% Flagpole
• Support Floor: $0.00766 USDT (4 Retests)
• Resistance Ceiling: $0.00783 USDT (4 Retests)
• Current Tape: $0.00768 USDT (Testing Support)
[ BREAKOUT FRAMEWORK ]
Following an initial -4.4% drop to $0.00760, price action has drifted upward inside an ascending channel. Lower support has been tested 4 times. Watch for volume expansion on a 1h candle close below $0.00766 to confirm potential downward continuation.
Discover automated technical pattern scans on ChartScout.
⚠️ DYOR - Not Financial Advice.
#ChartScout #Bigtime #BIGTIME/USDT #BIGTIMEUSDT
365
Log in to explore more content
Join global crypto users on Binance Square
⚡️ Get latest and useful information about crypto.
💬 Trusted by the world’s largest crypto exchange.
👍 Discover real insights from verified creators.
Email / Phone number
Trending Topics
BinanceProcesses$4.65BWithdrawals
5,281 views
60 Discussing
Binance Processes $4.65 Billion in Withdrawals After Reopening, Net Outflow of $3.64 Billion Equals 2.1% of Its $171 Billion in Assets
Binance News
·31 Likes
·7.5k views
WithdrawalsBack: 15 networks live
4,591 views
103 Discussing
BinanceUpdatesProofofReservesAddresses
87,735 views
1,316 Discussing