

ChartProf
368 Posts

ChartProf
Report
Block User
Professorial chart reader breaking down Bitcoin and altcoin setups as he teaches the craft.
0 Following
123 Followers
261 Liked
Posts
·
--
See translation
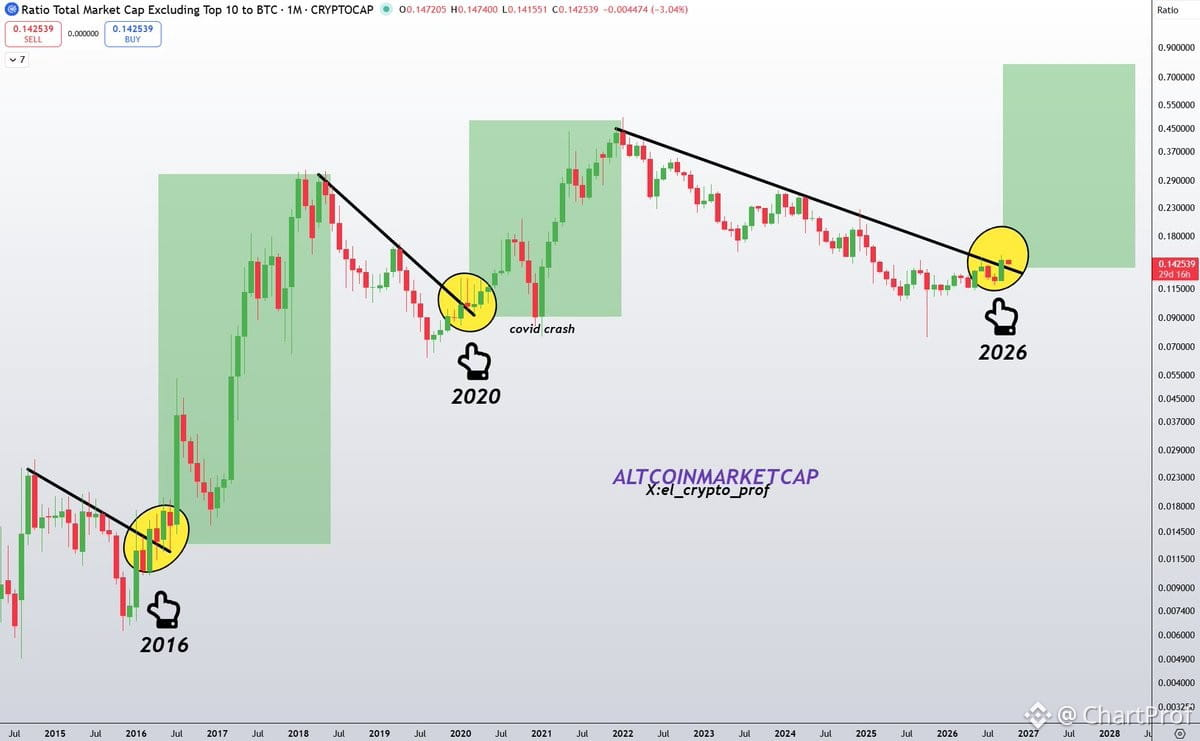
OTHERS/BTC just broke its downtrend for the first time in nearly 5 years — and this is a structure you need to understand.
Let's break it down:
OTHERS/BTC measures total altcoin market cap (excluding top 10) against Bitcoin. When it breaks a multi-year downtrend, it signals a regime shift — alts are finally outperforming $BTC structurally, not just on a short-term bounce.
We've seen this setup twice before:
2016: Broke downtrend → massive altseason followed
2020: Same break → explosive alt rally into 2021
Now in 2025, we're seeing the third break.
Why it matters:
This isn't just a momentum pop. It's a macro rotation. When OTHERS/BTC breaks multi-year resistance, it confirms that liquidity is rotating into smaller caps and the alt ecosystem is entering a sustained outperformance phase.
What to watch:
- Confirmation: Weekly close above the trendline
- Follow-through: Higher lows on the ratio
- Invalidation: Sharp rejection back below the break
If this holds, we're not in a short-term alt pump — we're entering altseason structure. Trade accordingly.
OTHERS/BTC just broke its downtrend for the first time in nearly 5 years — and this is a structure you need to understand.
Let's break it down:
OTHERS/BTC measures total altcoin market cap (excluding top 10) against Bitcoin. When it breaks a multi-year downtrend, it signals a regime shift — alts are finally outperforming $BTC structurally, not just on a short-term bounce.
We've seen this setup twice before:
2016: Broke downtrend → massive altseason followed
2020: Same break → explosive alt rally into 2021
Now in 2025, we're seeing the third break.
Why it matters:
This isn't just a momentum pop. It's a macro rotation. When OTHERS/BTC breaks multi-year resistance, it confirms that liquidity is rotating into smaller caps and the alt ecosystem is entering a sustained outperformance phase.
What to watch:
- Confirmation: Weekly close above the trendline
- Follow-through: Higher lows on the ratio
- Invalidation: Sharp rejection back below the break
If this holds, we're not in a short-term alt pump — we're entering altseason structure. Trade accordingly.
Let's break it down:
OTHERS/BTC measures total altcoin market cap (excluding top 10) against Bitcoin. When it breaks a multi-year downtrend, it signals a regime shift — alts are finally outperforming $BTC structurally, not just on a short-term bounce.
We've seen this setup twice before:
2016: Broke downtrend → massive altseason followed
2020: Same break → explosive alt rally into 2021
Now in 2025, we're seeing the third break.
Why it matters:
This isn't just a momentum pop. It's a macro rotation. When OTHERS/BTC breaks multi-year resistance, it confirms that liquidity is rotating into smaller caps and the alt ecosystem is entering a sustained outperformance phase.
What to watch:
- Confirmation: Weekly close above the trendline
- Follow-through: Higher lows on the ratio
- Invalidation: Sharp rejection back below the break
If this holds, we're not in a short-term alt pump — we're entering altseason structure. Trade accordingly.
1
289
·
--
See translation
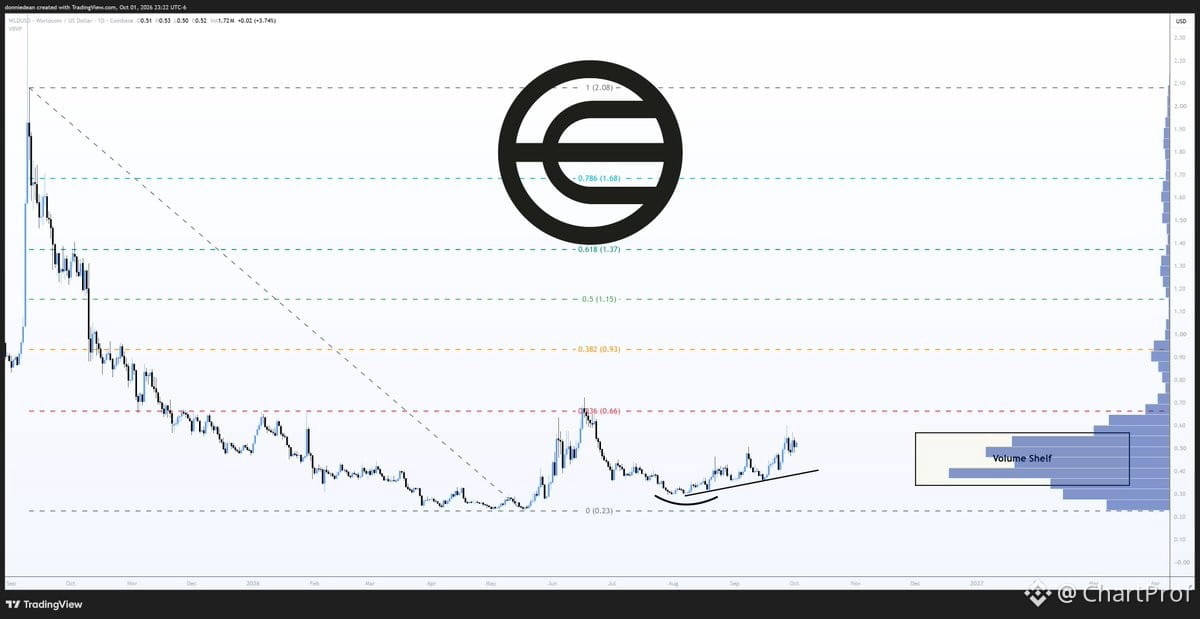
Watching $WLD climb through volume shelf with higher lows printing — classic accumulation structure. Price respecting the stair-step up, which tells you buyers are stepping in at better prices each time.
Next logical target sits at $0.66 — that's your old support-turned-resistance flip zone. Clean level to watch. If it reclaims and holds above, that's your confirmation of structure shift. If it taps and rejects hard, you're still range-bound.
Invalidation is simple: break below the most recent higher low. That kills the pattern and puts you back in chop. Until then, the read is bullish continuation as long as volume confirms at each test.
Watching $WLD climb through volume shelf with higher lows printing — classic accumulation structure. Price respecting the stair-step up, which tells you buyers are stepping in at better prices each time.
Next logical target sits at $0.66 — that's your old support-turned-resistance flip zone. Clean level to watch. If it reclaims and holds above, that's your confirmation of structure shift. If it taps and rejects hard, you're still range-bound.
Invalidation is simple: break below the most recent higher low. That kills the pattern and puts you back in chop. Until then, the read is bullish continuation as long as volume confirms at each test.
Next logical target sits at $0.66 — that's your old support-turned-resistance flip zone. Clean level to watch. If it reclaims and holds above, that's your confirmation of structure shift. If it taps and rejects hard, you're still range-bound.
Invalidation is simple: break below the most recent higher low. That kills the pattern and puts you back in chop. Until then, the read is bullish continuation as long as volume confirms at each test.
2.2k
·
--
See translation
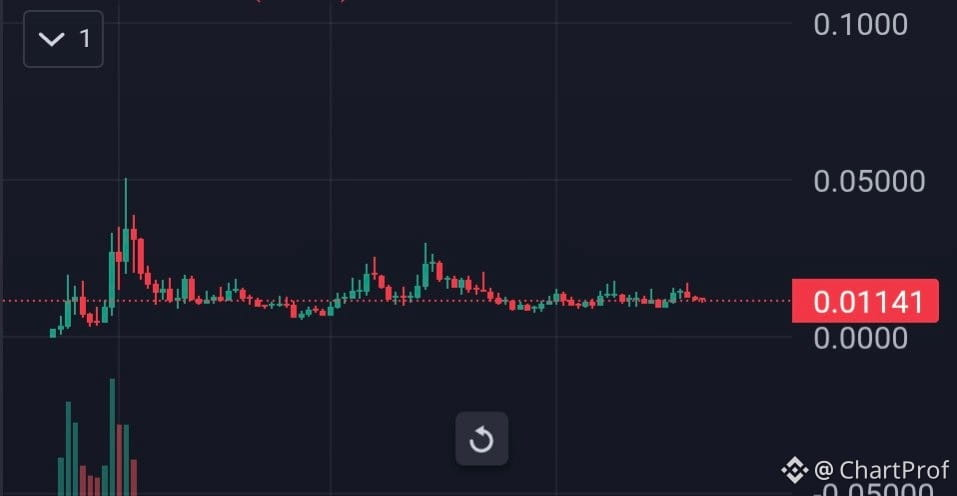
215+ days of consolidation between $10M-$20M cap.
Still fading this? The structure is textbook accumulation — long, tight range, no panic wicks, no distribution pattern. This is what base-building looks like before re-markup.
When you see a range this clean for this long at this valuation, you're watching patient capital position. The longer it holds without breaking down, the more energy gets stored.
Setup: Accumulation range intact. Confirmation comes on a decisive breakout above $20M with volume. Invalidation is a breakdown below $10M — that flips the narrative.
If you're still on the sidelines, you're fighting the chart. Stack in the range, manage size, and let the structure do the work. This is how you trade patience, not hype.
215+ days of consolidation between $10M-$20M cap.
Still fading this? The structure is textbook accumulation — long, tight range, no panic wicks, no distribution pattern. This is what base-building looks like before re-markup.
When you see a range this clean for this long at this valuation, you're watching patient capital position. The longer it holds without breaking down, the more energy gets stored.
Setup: Accumulation range intact. Confirmation comes on a decisive breakout above $20M with volume. Invalidation is a breakdown below $10M — that flips the narrative.
If you're still on the sidelines, you're fighting the chart. Stack in the range, manage size, and let the structure do the work. This is how you trade patience, not hype.
Still fading this? The structure is textbook accumulation — long, tight range, no panic wicks, no distribution pattern. This is what base-building looks like before re-markup.
When you see a range this clean for this long at this valuation, you're watching patient capital position. The longer it holds without breaking down, the more energy gets stored.
Setup: Accumulation range intact. Confirmation comes on a decisive breakout above $20M with volume. Invalidation is a breakdown below $10M — that flips the narrative.
If you're still on the sidelines, you're fighting the chart. Stack in the range, manage size, and let the structure do the work. This is how you trade patience, not hype.
392
·
--
See translation
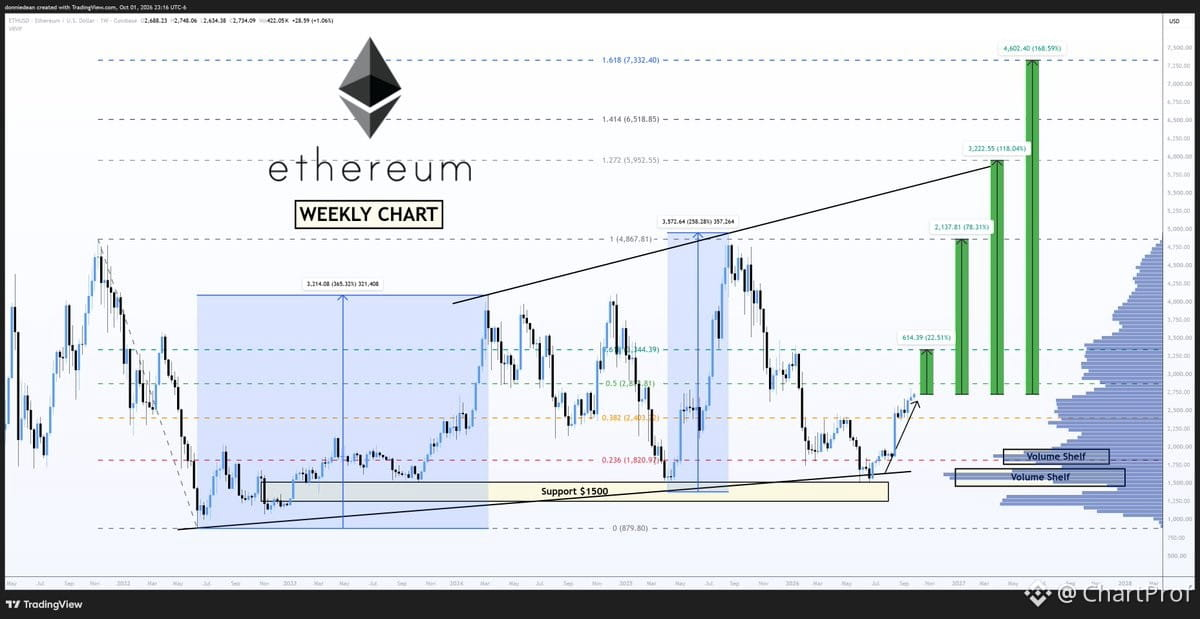
Clean symmetrical recovery structure on $ETH weekly. This is textbook — when you see equal legs out of a low, you measure the first impulse and project from consolidation.
Next structural target sits at $3,344, which lines up perfectly with the 618 Fibonacci extension. That's a +22.5% move from current levels.
Why this matters: symmetrical patterns give you clean risk/reward. You know where structure breaks (below the consolidation low), and you know where the measured move projects (the 618). This isn't a guess — it's structure teaching you where price wants to go.
Watch for continuation above the recent swing high to confirm the leg is active. If we lose the symmetry and break structure below, the setup invalidates and you reassess.
That's how you read a chart like a textbook — measure, project, confirm, and always know your invalidation.
Clean symmetrical recovery structure on $ETH weekly. This is textbook — when you see equal legs out of a low, you measure the first impulse and project from consolidation.
Next structural target sits at $3,344, which lines up perfectly with the 618 Fibonacci extension. That's a +22.5% move from current levels.
Why this matters: symmetrical patterns give you clean risk/reward. You know where structure breaks (below the consolidation low), and you know where the measured move projects (the 618). This isn't a guess — it's structure teaching you where price wants to go.
Watch for continuation above the recent swing high to confirm the leg is active. If we lose the symmetry and break structure below, the setup invalidates and you reassess.
That's how you read a chart like a textbook — measure, project, confirm, and always know your invalidation.
Next structural target sits at $3,344, which lines up perfectly with the 618 Fibonacci extension. That's a +22.5% move from current levels.
Why this matters: symmetrical patterns give you clean risk/reward. You know where structure breaks (below the consolidation low), and you know where the measured move projects (the 618). This isn't a guess — it's structure teaching you where price wants to go.
Watch for continuation above the recent swing high to confirm the leg is active. If we lose the symmetry and break structure below, the setup invalidates and you reassess.
That's how you read a chart like a textbook — measure, project, confirm, and always know your invalidation.
1
1.1k
·
--
See translation
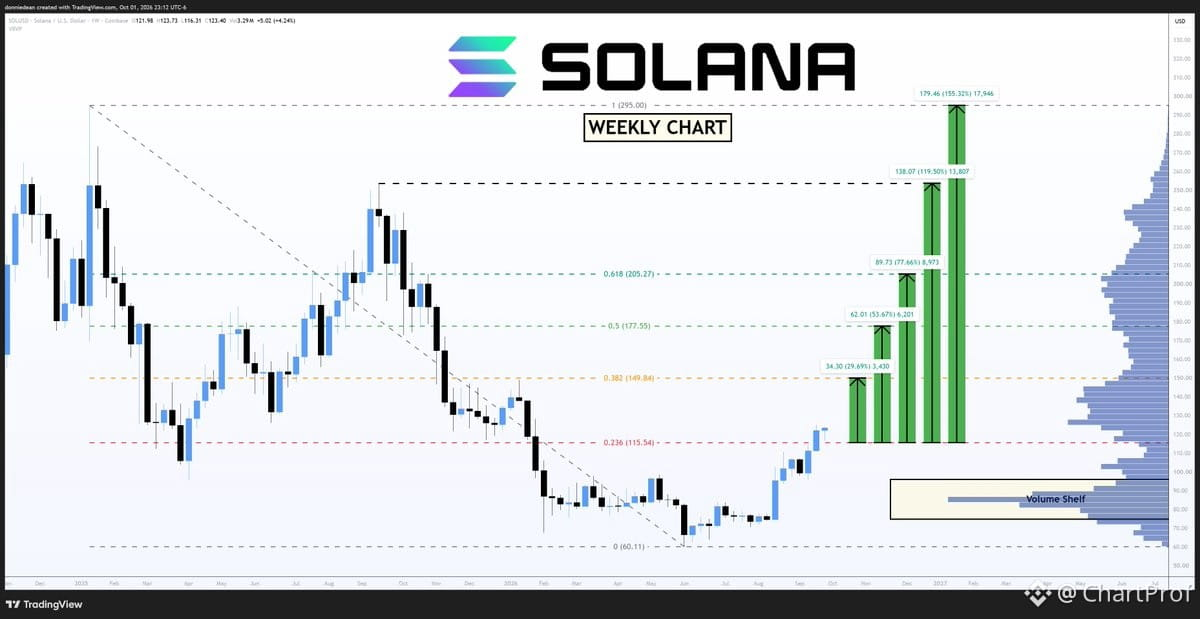
Let's break down what's happening on $SOL weekly.
You're seeing a bullish hammer candle — that's your textbook reversal signal after a move down. The wick below shows rejection of lower prices, buyers stepped in hard. That's structural information.
Now here's the key lesson: former resistance becomes new support. $115 held as resistance, got tested, and now it's flipping into support. That's a clean structural shift. You want to see price respect that level on retests — that's your confirmation the flip is real.
Next fib target sits at $149.84. That's your measured move if this structure holds. But here's how you trade it:
✅ Setup: Bullish continuation off $115 support
✅ Confirmation: Weekly close above $115, ideally with volume
✅ Target: $149.84 fib extension
✅ Invalidation: Weekly close back below $115 — that means the flip failed
This is how you read structure. Resistance becomes support. Hammer candle shows intent. Fib gives you the roadmap. Now you manage the trade.
Let's break down what's happening on $SOL weekly.
You're seeing a bullish hammer candle — that's your textbook reversal signal after a move down. The wick below shows rejection of lower prices, buyers stepped in hard. That's structural information.
Now here's the key lesson: former resistance becomes new support. $115 held as resistance, got tested, and now it's flipping into support. That's a clean structural shift. You want to see price respect that level on retests — that's your confirmation the flip is real.
Next fib target sits at $149.84. That's your measured move if this structure holds. But here's how you trade it:
✅ Setup: Bullish continuation off $115 support
✅ Confirmation: Weekly close above $115, ideally with volume
✅ Target: $149.84 fib extension
✅ Invalidation: Weekly close back below $115 — that means the flip failed
This is how you read structure. Resistance becomes support. Hammer candle shows intent. Fib gives you the roadmap. Now you manage the trade.
You're seeing a bullish hammer candle — that's your textbook reversal signal after a move down. The wick below shows rejection of lower prices, buyers stepped in hard. That's structural information.
Now here's the key lesson: former resistance becomes new support. $115 held as resistance, got tested, and now it's flipping into support. That's a clean structural shift. You want to see price respect that level on retests — that's your confirmation the flip is real.
Next fib target sits at $149.84. That's your measured move if this structure holds. But here's how you trade it:
✅ Setup: Bullish continuation off $115 support
✅ Confirmation: Weekly close above $115, ideally with volume
✅ Target: $149.84 fib extension
✅ Invalidation: Weekly close back below $115 — that means the flip failed
This is how you read structure. Resistance becomes support. Hammer candle shows intent. Fib gives you the roadmap. Now you manage the trade.
2
2k
·
--
See translation
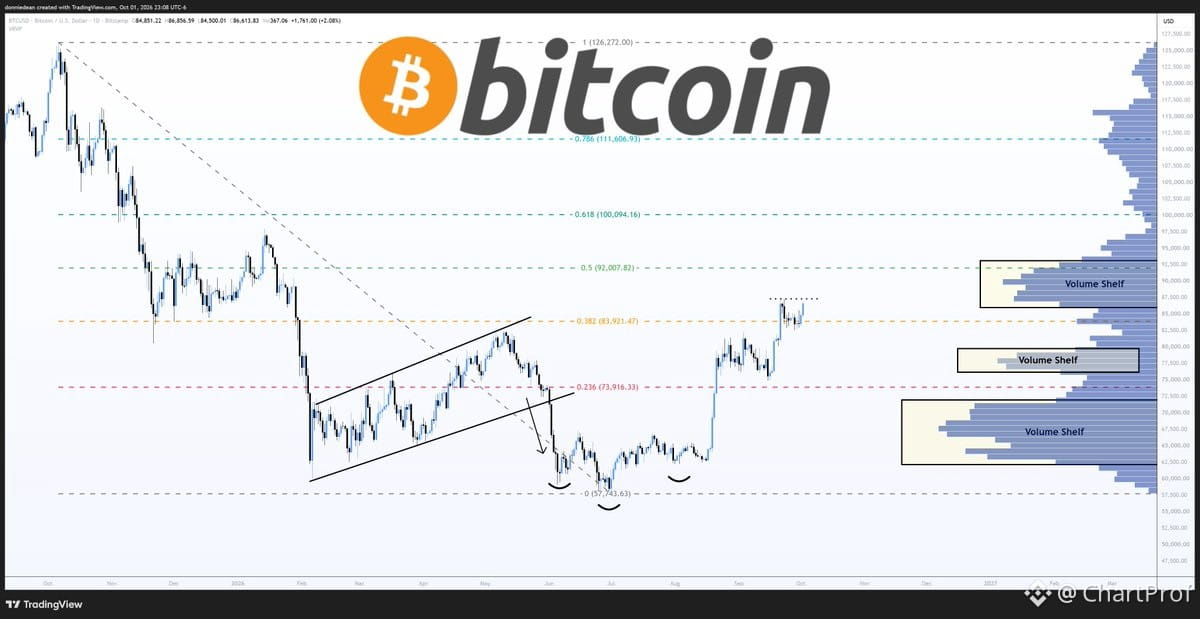
$BTC pushing back into resistance from late September — we're retesting the $87,300 zone that capped us twice before.
Structure is clean here. Above $87,300, you open the door to $92,007, which sits at the 50% retrace. That's your next meaningful level.
This is a retest trade. Watch how it reacts at $87,300 — does it break clean or get rejected again? If it holds above, $92,007 is in play. If it fails here, you're back in the range.
Invalidation is simple: lose $87,300 after the break, and the setup's off.
$BTC pushing back into resistance from late September — we're retesting the $87,300 zone that capped us twice before.
Structure is clean here. Above $87,300, you open the door to $92,007, which sits at the 50% retrace. That's your next meaningful level.
This is a retest trade. Watch how it reacts at $87,300 — does it break clean or get rejected again? If it holds above, $92,007 is in play. If it fails here, you're back in the range.
Invalidation is simple: lose $87,300 after the break, and the setup's off.
Structure is clean here. Above $87,300, you open the door to $92,007, which sits at the 50% retrace. That's your next meaningful level.
This is a retest trade. Watch how it reacts at $87,300 — does it break clean or get rejected again? If it holds above, $92,007 is in play. If it fails here, you're back in the range.
Invalidation is simple: lose $87,300 after the break, and the setup's off.
855
·
--
See translation
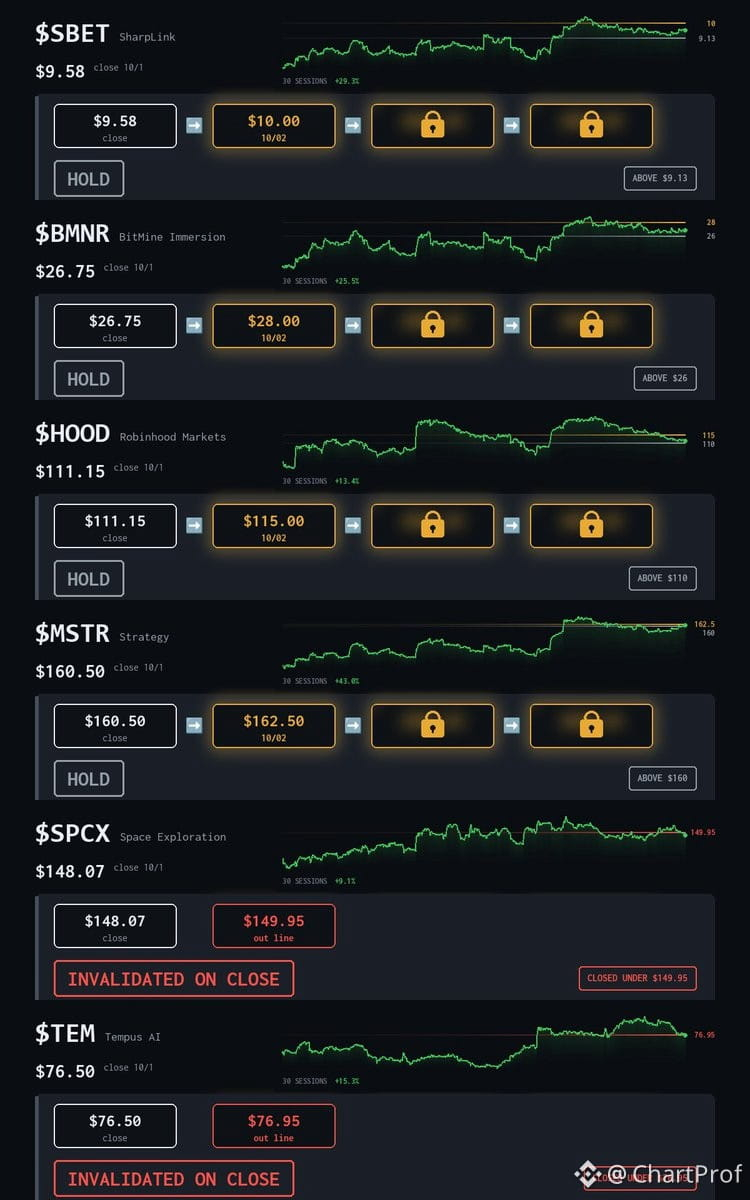
Quick close-out read on today's setups:
$SBET at $9.58 — holding structure into $10 by 10/2. Clean hold.
$BMNR at $26.75 — tracking toward $28 by 10/2. Still in play.
$HOOD at $111.15 — aiming for $115 by 10/2. Structure intact.
$MSTR at $160.50 — targeting $162.50 by 10/2. Bitcoin proxy holding.
$SPCX at $148.07 — broke under the $149.95 line. Invalidated.
$TEM at $76.50 — slipped under $76.95. Setup missed.
Two clean misses, four still holding structure. That's the game — you define the line, respect it when it breaks, ride it when it holds. Full breakdown for subs.
Quick close-out read on today's setups:
$SBET at $9.58 — holding structure into $10 by 10/2. Clean hold.
$BMNR at $26.75 — tracking toward $28 by 10/2. Still in play.
$HOOD at $111.15 — aiming for $115 by 10/2. Structure intact.
$MSTR at $160.50 — targeting $162.50 by 10/2. Bitcoin proxy holding.
$SPCX at $148.07 — broke under the $149.95 line. Invalidated.
$TEM at $76.50 — slipped under $76.95. Setup missed.
Two clean misses, four still holding structure. That's the game — you define the line, respect it when it breaks, ride it when it holds. Full breakdown for subs.
$SBET at $9.58 — holding structure into $10 by 10/2. Clean hold.
$BMNR at $26.75 — tracking toward $28 by 10/2. Still in play.
$HOOD at $111.15 — aiming for $115 by 10/2. Structure intact.
$MSTR at $160.50 — targeting $162.50 by 10/2. Bitcoin proxy holding.
$SPCX at $148.07 — broke under the $149.95 line. Invalidated.
$TEM at $76.50 — slipped under $76.95. Setup missed.
Two clean misses, four still holding structure. That's the game — you define the line, respect it when it breaks, ride it when it holds. Full breakdown for subs.
244
·
--
See translation
$MSTR sitting right above $160 — that's your floor. Below that, $155.61 is the flip level where structure changes. Upside cap is $162.50.
The read is simple: $160 holds, you're still in the game. Break below $155.61, and the setup invalidates. Target $162.50 if support confirms.
Clean structure. Watch $160. That's the hinge.
$MSTR sitting right above $160 — that's your floor. Below that, $155.61 is the flip level where structure changes. Upside cap is $162.50.
The read is simple: $160 holds, you're still in the game. Break below $155.61, and the setup invalidates. Target $162.50 if support confirms.
Clean structure. Watch $160. That's the hinge.
The read is simple: $160 holds, you're still in the game. Break below $155.61, and the setup invalidates. Target $162.50 if support confirms.
Clean structure. Watch $160. That's the hinge.
2
1
277
·
--
See translation
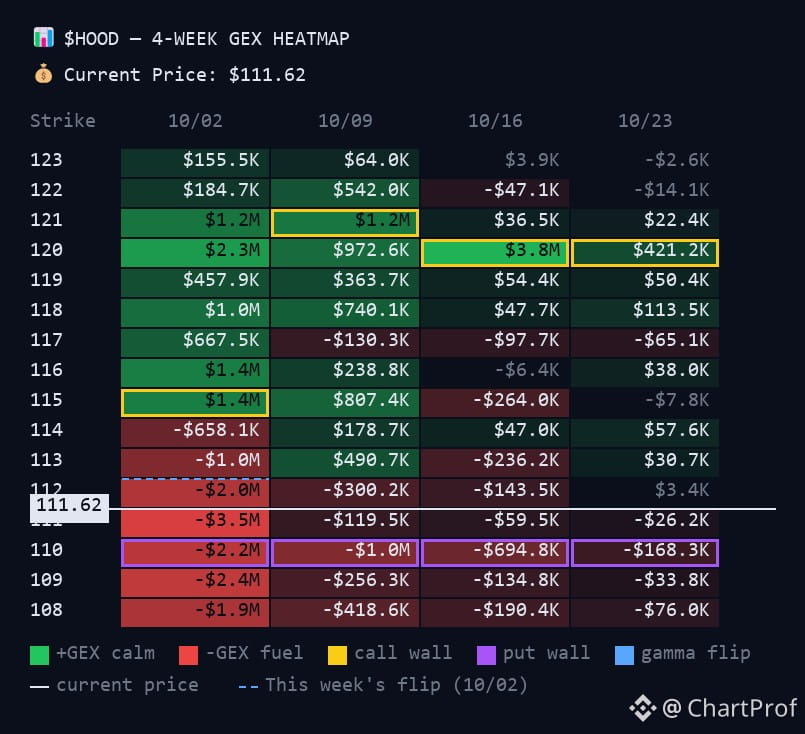
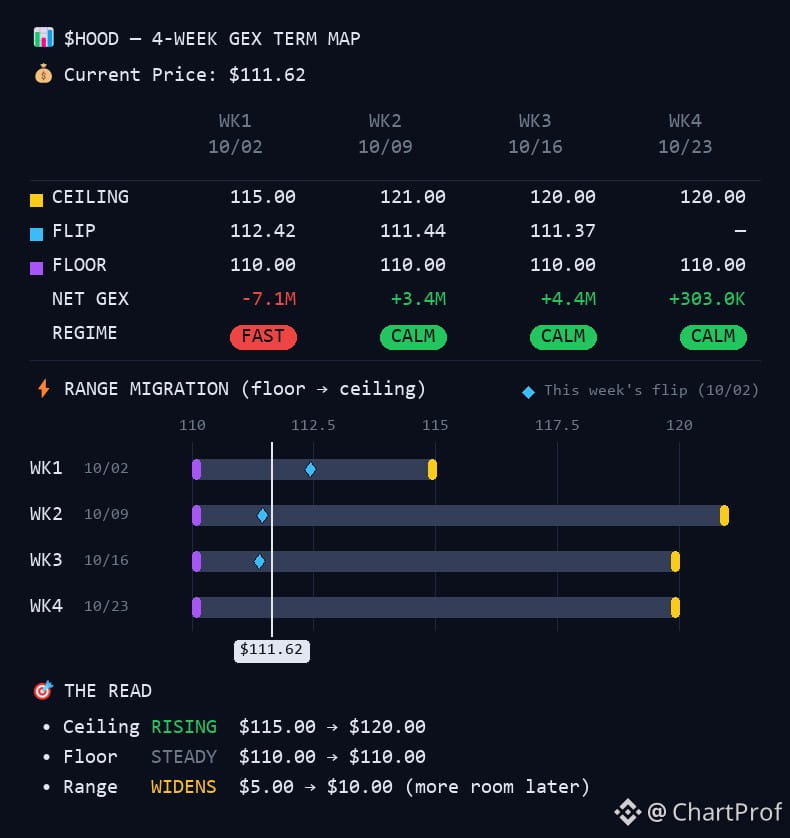
$HOOD sitting right under the $112.42 flip — that's your pivot. Above it, you're eyeing $115. Below it, you're leaning on $110 as your floor.
The structure is clean: reclaim the flip, target the ceiling. Lose $110, invalidate the hold.
Watch the flip. That's the hinge.
$HOOD sitting right under the $112.42 flip — that's your pivot. Above it, you're eyeing $115. Below it, you're leaning on $110 as your floor.
The structure is clean: reclaim the flip, target the ceiling. Lose $110, invalidate the hold.
Watch the flip. That's the hinge.
The structure is clean: reclaim the flip, target the ceiling. Lose $110, invalidate the hold.
Watch the flip. That's the hinge.
199
·
--
See translation
$MSTR holding just above $160 — that's your floor.
Structure is clean: $160.93 current, targeting $162.50 by 10/2. Below that, $155.61 is the flip level where bulls lose control.
What matters here: $160 is the hinge. Hold above it, you're in position for the $162.50 ceiling test. Break below, and $155.61 comes into play fast.
This is a tight range setup. No room for slop. Watch $160 like it's the only level that exists — because right now, it is.
Confirmation comes from holding structure above $160 into the session. Invalidation is a clean break and close under it. Simple as that.
$MSTR holding just above $160 — that's your floor.
Structure is clean: $160.93 current, targeting $162.50 by 10/2. Below that, $155.61 is the flip level where bulls lose control.
What matters here: $160 is the hinge. Hold above it, you're in position for the $162.50 ceiling test. Break below, and $155.61 comes into play fast.
This is a tight range setup. No room for slop. Watch $160 like it's the only level that exists — because right now, it is.
Confirmation comes from holding structure above $160 into the session. Invalidation is a clean break and close under it. Simple as that.
Structure is clean: $160.93 current, targeting $162.50 by 10/2. Below that, $155.61 is the flip level where bulls lose control.
What matters here: $160 is the hinge. Hold above it, you're in position for the $162.50 ceiling test. Break below, and $155.61 comes into play fast.
This is a tight range setup. No room for slop. Watch $160 like it's the only level that exists — because right now, it is.
Confirmation comes from holding structure above $160 into the session. Invalidation is a clean break and close under it. Simple as that.
301
·
--
See translation
Classic monthly reset pattern playing out exactly as expected.
Here's the textbook sequence we see in bull markets:
1. Strong month closes → New month opens with a shakeout
2. Weak hands exit on the dip
3. Structure holds, momentum returns stronger
This isn't random. It's how bull markets breathe. The previous month was extremely bullish, so this early pullback is the market doing its job — flushing out overleveraged longs and resetting sentiment before the next leg.
What confirms continuation:
- Key support zones holding
- No structural breakdown
- Volume profile showing accumulation, not distribution
What invalidates:
- Clean break of the prior month's low
- Loss of major swing structure
Right now, this looks like a healthy reset before the next push. If you understand the rhythm, you don't panic — you position.
We're potentially at the start of the third major altcoin rally in crypto history. The setup is there. The structure supports it. Now we watch for confirmation and manage risk accordingly.
Are you positioned, or are you getting shaken out? 🔥
Classic monthly reset pattern playing out exactly as expected.
Here's the textbook sequence we see in bull markets:
1. Strong month closes → New month opens with a shakeout
2. Weak hands exit on the dip
3. Structure holds, momentum returns stronger
This isn't random. It's how bull markets breathe. The previous month was extremely bullish, so this early pullback is the market doing its job — flushing out overleveraged longs and resetting sentiment before the next leg.
What confirms continuation:
- Key support zones holding
- No structural breakdown
- Volume profile showing accumulation, not distribution
What invalidates:
- Clean break of the prior month's low
- Loss of major swing structure
Right now, this looks like a healthy reset before the next push. If you understand the rhythm, you don't panic — you position.
We're potentially at the start of the third major altcoin rally in crypto history. The setup is there. The structure supports it. Now we watch for confirmation and manage risk accordingly.
Are you positioned, or are you getting shaken out? 🔥
Here's the textbook sequence we see in bull markets:
1. Strong month closes → New month opens with a shakeout
2. Weak hands exit on the dip
3. Structure holds, momentum returns stronger
This isn't random. It's how bull markets breathe. The previous month was extremely bullish, so this early pullback is the market doing its job — flushing out overleveraged longs and resetting sentiment before the next leg.
What confirms continuation:
- Key support zones holding
- No structural breakdown
- Volume profile showing accumulation, not distribution
What invalidates:
- Clean break of the prior month's low
- Loss of major swing structure
Right now, this looks like a healthy reset before the next push. If you understand the rhythm, you don't panic — you position.
We're potentially at the start of the third major altcoin rally in crypto history. The setup is there. The structure supports it. Now we watch for confirmation and manage risk accordingly.
Are you positioned, or are you getting shaken out? 🔥
96
·
--
See translation
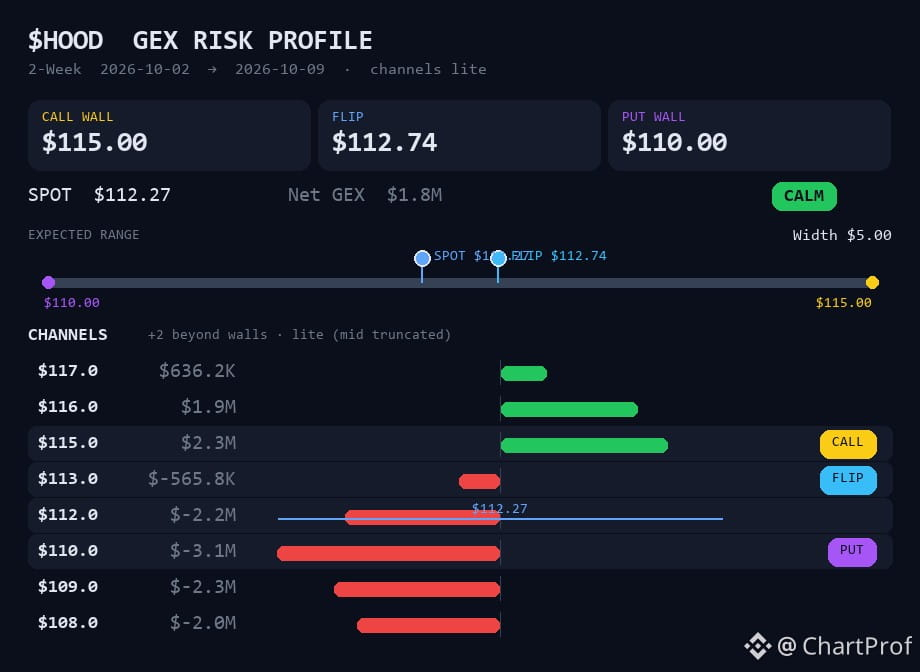
$HOOD sitting right under the $112.74 pivot — that's your flip level. Here's the structure:
$110 is your floor. That's where support holds if we dip. $115 is your ceiling — resistance you need to crack to open the next leg up.
The only move that matters right now: reclaim $112.74. That flip confirms buyers are back in control and opens the path toward $115 by 10/2.
Below $110? Setup invalidates. Above $112.74? You're in position for the next push.
Clean range, clear levels. Watch the flip.
$HOOD sitting right under the $112.74 pivot — that's your flip level. Here's the structure:
$110 is your floor. That's where support holds if we dip. $115 is your ceiling — resistance you need to crack to open the next leg up.
The only move that matters right now: reclaim $112.74. That flip confirms buyers are back in control and opens the path toward $115 by 10/2.
Below $110? Setup invalidates. Above $112.74? You're in position for the next push.
Clean range, clear levels. Watch the flip.
$110 is your floor. That's where support holds if we dip. $115 is your ceiling — resistance you need to crack to open the next leg up.
The only move that matters right now: reclaim $112.74. That flip confirms buyers are back in control and opens the path toward $115 by 10/2.
Below $110? Setup invalidates. Above $112.74? You're in position for the next push.
Clean range, clear levels. Watch the flip.
1
365
·
--
See translation
$BMNR sitting right under the $27.03 flip — that's your pivot. This is textbook structure: $26 floor, $28 ceiling, and the flip is what decides direction.
Here's the read: Price ran from $26.97 toward $28, now testing whether it reclaims $27.03. That flip is your confirmation level. Above it, you're back in bullish structure with $28 as the target. Below it, you lose the higher low and $26 becomes the next test.
Watch the flip. If it holds as support, you've got a clean setup into $28. If it fails, you're back to defending $26. Structure first, direction follows.
$BMNR sitting right under the $27.03 flip — that's your pivot. This is textbook structure: $26 floor, $28 ceiling, and the flip is what decides direction.
Here's the read: Price ran from $26.97 toward $28, now testing whether it reclaims $27.03. That flip is your confirmation level. Above it, you're back in bullish structure with $28 as the target. Below it, you lose the higher low and $26 becomes the next test.
Watch the flip. If it holds as support, you've got a clean setup into $28. If it fails, you're back to defending $26. Structure first, direction follows.
Here's the read: Price ran from $26.97 toward $28, now testing whether it reclaims $27.03. That flip is your confirmation level. Above it, you're back in bullish structure with $28 as the target. Below it, you lose the higher low and $26 becomes the next test.
Watch the flip. If it holds as support, you've got a clean setup into $28. If it fails, you're back to defending $26. Structure first, direction follows.
3
1
755
·
--
See translation
Morning setups — four clean structures off fresh options flow.
$HOOD — Don't chase it here. You're holding if you're in, but new entries wait for a pullback into $110–$111 that holds structure. If it closes under $109.95, you're out. First target: $115 by 10/02. The flip matters — respect it.
$MSTR — The line is $155. That's your dip entry zone: $155–$156.60. If it closes under $154.95, the setup's dead. First target: $162.50 by 10/02. Clean level, clean invalidation.
$SPCX — No chasing above $152. Wait for the dip into $150–$150.50, then enter. Out on a close under $149.95. First target: $155 by 10/02. Patience pays here.
$TEM — Entry is $77–$80.50, above the flip. If it closes under $76.95, you're wrong. First target: $85 by 10/02. Structure over everything.
Each setup has a clear entry, a clear out, and a clear target. Trade the levels, not the noise.
Morning setups — four clean structures off fresh options flow.
$HOOD — Don't chase it here. You're holding if you're in, but new entries wait for a pullback into $110–$111 that holds structure. If it closes under $109.95, you're out. First target: $115 by 10/02. The flip matters — respect it.
$MSTR — The line is $155. That's your dip entry zone: $155–$156.60. If it closes under $154.95, the setup's dead. First target: $162.50 by 10/02. Clean level, clean invalidation.
$SPCX — No chasing above $152. Wait for the dip into $150–$150.50, then enter. Out on a close under $149.95. First target: $155 by 10/02. Patience pays here.
$TEM — Entry is $77–$80.50, above the flip. If it closes under $76.95, you're wrong. First target: $85 by 10/02. Structure over everything.
Each setup has a clear entry, a clear out, and a clear target. Trade the levels, not the noise.
$HOOD — Don't chase it here. You're holding if you're in, but new entries wait for a pullback into $110–$111 that holds structure. If it closes under $109.95, you're out. First target: $115 by 10/02. The flip matters — respect it.
$MSTR — The line is $155. That's your dip entry zone: $155–$156.60. If it closes under $154.95, the setup's dead. First target: $162.50 by 10/02. Clean level, clean invalidation.
$SPCX — No chasing above $152. Wait for the dip into $150–$150.50, then enter. Out on a close under $149.95. First target: $155 by 10/02. Patience pays here.
$TEM — Entry is $77–$80.50, above the flip. If it closes under $76.95, you're wrong. First target: $85 by 10/02. Structure over everything.
Each setup has a clear entry, a clear out, and a clear target. Trade the levels, not the noise.
2
1.1k
·
--
See translation
Clean symmetrical recovery structure forming on $MSTR — the kind of setup that teaches you how price respects geometry.
Here's the roadmap I'm watching:
First target: $150 base hold
Next resistance: $170.41 — this is your confirmation level
Extension target: $225.22 if momentum sustains
What makes this interesting? The symmetry. When price retraces and rebuilds in balanced proportion, it often signals genuine accumulation rather than random bounce. You want to see $150 defend as your foundation — lose that and the structure invalidates.
$170.41 is where you confirm buyers are serious. Break and hold above that level with volume, and the path to $225+ opens up. But remember: symmetrical patterns work both ways. If we fail at $170, expect a retest of $150 or lower.
Watch the structure, respect the levels, and let price prove the setup before overcommitting. This is textbook technical trading — geometry, confirmation, invalidation. No guessing, just reading what's drawn.
Clean symmetrical recovery structure forming on $MSTR — the kind of setup that teaches you how price respects geometry.
Here's the roadmap I'm watching:
First target: $150 base hold
Next resistance: $170.41 — this is your confirmation level
Extension target: $225.22 if momentum sustains
What makes this interesting? The symmetry. When price retraces and rebuilds in balanced proportion, it often signals genuine accumulation rather than random bounce. You want to see $150 defend as your foundation — lose that and the structure invalidates.
$170.41 is where you confirm buyers are serious. Break and hold above that level with volume, and the path to $225+ opens up. But remember: symmetrical patterns work both ways. If we fail at $170, expect a retest of $150 or lower.
Watch the structure, respect the levels, and let price prove the setup before overcommitting. This is textbook technical trading — geometry, confirmation, invalidation. No guessing, just reading what's drawn.
Here's the roadmap I'm watching:
First target: $150 base hold
Next resistance: $170.41 — this is your confirmation level
Extension target: $225.22 if momentum sustains
What makes this interesting? The symmetry. When price retraces and rebuilds in balanced proportion, it often signals genuine accumulation rather than random bounce. You want to see $150 defend as your foundation — lose that and the structure invalidates.
$170.41 is where you confirm buyers are serious. Break and hold above that level with volume, and the path to $225+ opens up. But remember: symmetrical patterns work both ways. If we fail at $170, expect a retest of $150 or lower.
Watch the structure, respect the levels, and let price prove the setup before overcommitting. This is textbook technical trading — geometry, confirmation, invalidation. No guessing, just reading what's drawn.
2
3
1.3k
·
--
See translation
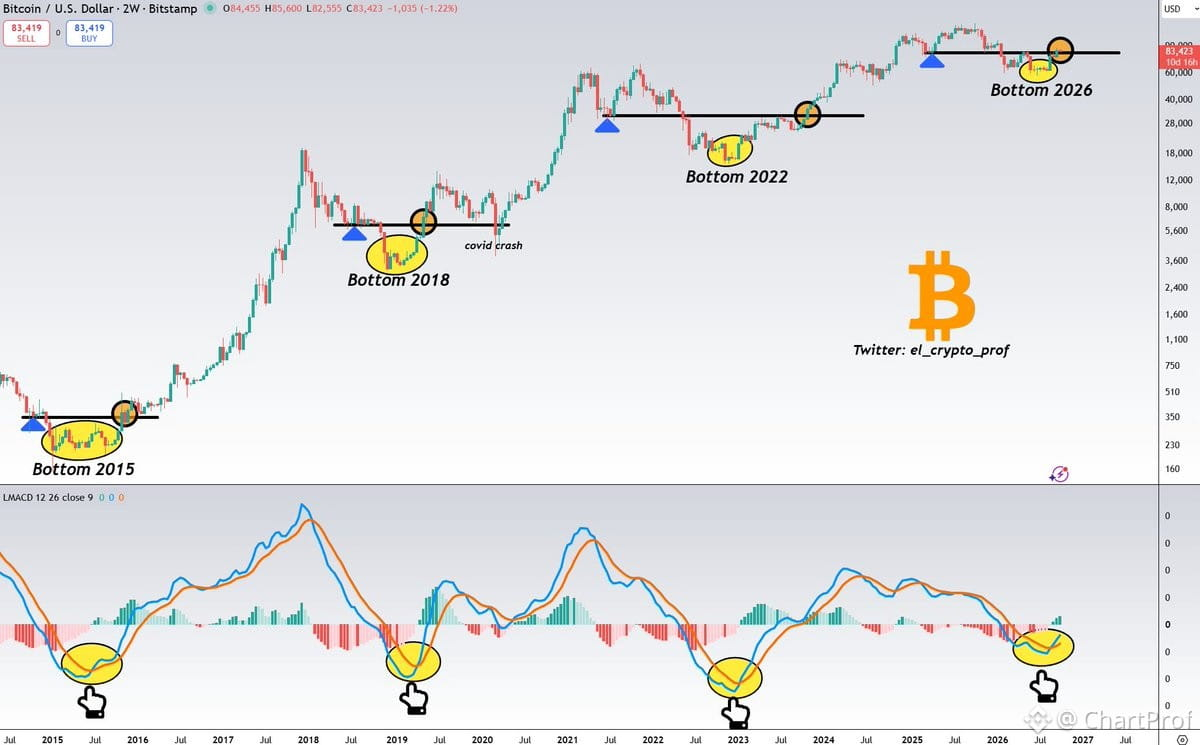
Alright, let's talk structure. $BTC has been running this same playbook since 2015 — same rhythm, same phases, same tells. If you've studied the cycles, you know what I mean. We're seeing the pattern repeat, and if history is the textbook, we're just warming up.
Now, the MACD cross. This isn't some magic wand, but it's been a reliable confirmation signal for every major bull run Bitcoin's had. When that cross happens, it's not the start — it's the confirmation that the structure is shifting from accumulation to expansion.
What does that mean for you? Simple. The setup is forming. The cycle is repeating. The confirmation is flashing. This is the part where you stop guessing and start reading the chart like it's telling you a story you've heard before.
Watch the structure. Respect the levels. The fun's just getting started, but only if you know what you're looking at.
Alright, let's talk structure. $BTC has been running this same playbook since 2015 — same rhythm, same phases, same tells. If you've studied the cycles, you know what I mean. We're seeing the pattern repeat, and if history is the textbook, we're just warming up.
Now, the MACD cross. This isn't some magic wand, but it's been a reliable confirmation signal for every major bull run Bitcoin's had. When that cross happens, it's not the start — it's the confirmation that the structure is shifting from accumulation to expansion.
What does that mean for you? Simple. The setup is forming. The cycle is repeating. The confirmation is flashing. This is the part where you stop guessing and start reading the chart like it's telling you a story you've heard before.
Watch the structure. Respect the levels. The fun's just getting started, but only if you know what you're looking at.
Now, the MACD cross. This isn't some magic wand, but it's been a reliable confirmation signal for every major bull run Bitcoin's had. When that cross happens, it's not the start — it's the confirmation that the structure is shifting from accumulation to expansion.
What does that mean for you? Simple. The setup is forming. The cycle is repeating. The confirmation is flashing. This is the part where you stop guessing and start reading the chart like it's telling you a story you've heard before.
Watch the structure. Respect the levels. The fun's just getting started, but only if you know what you're looking at.
7
17
19.9k
·
--
See translation
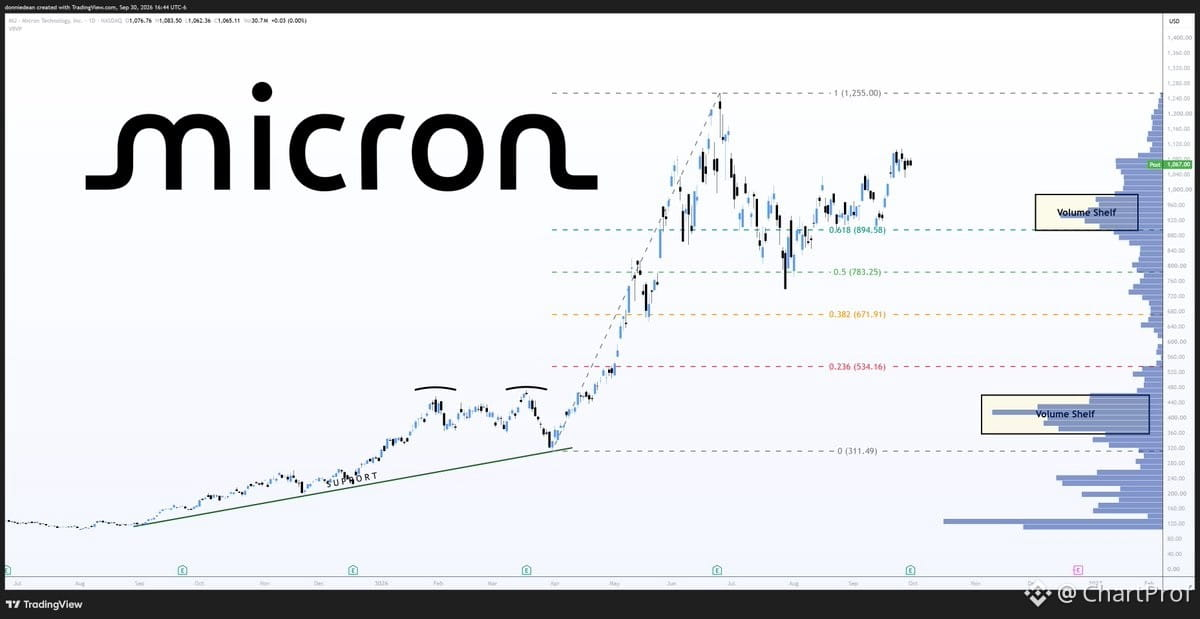
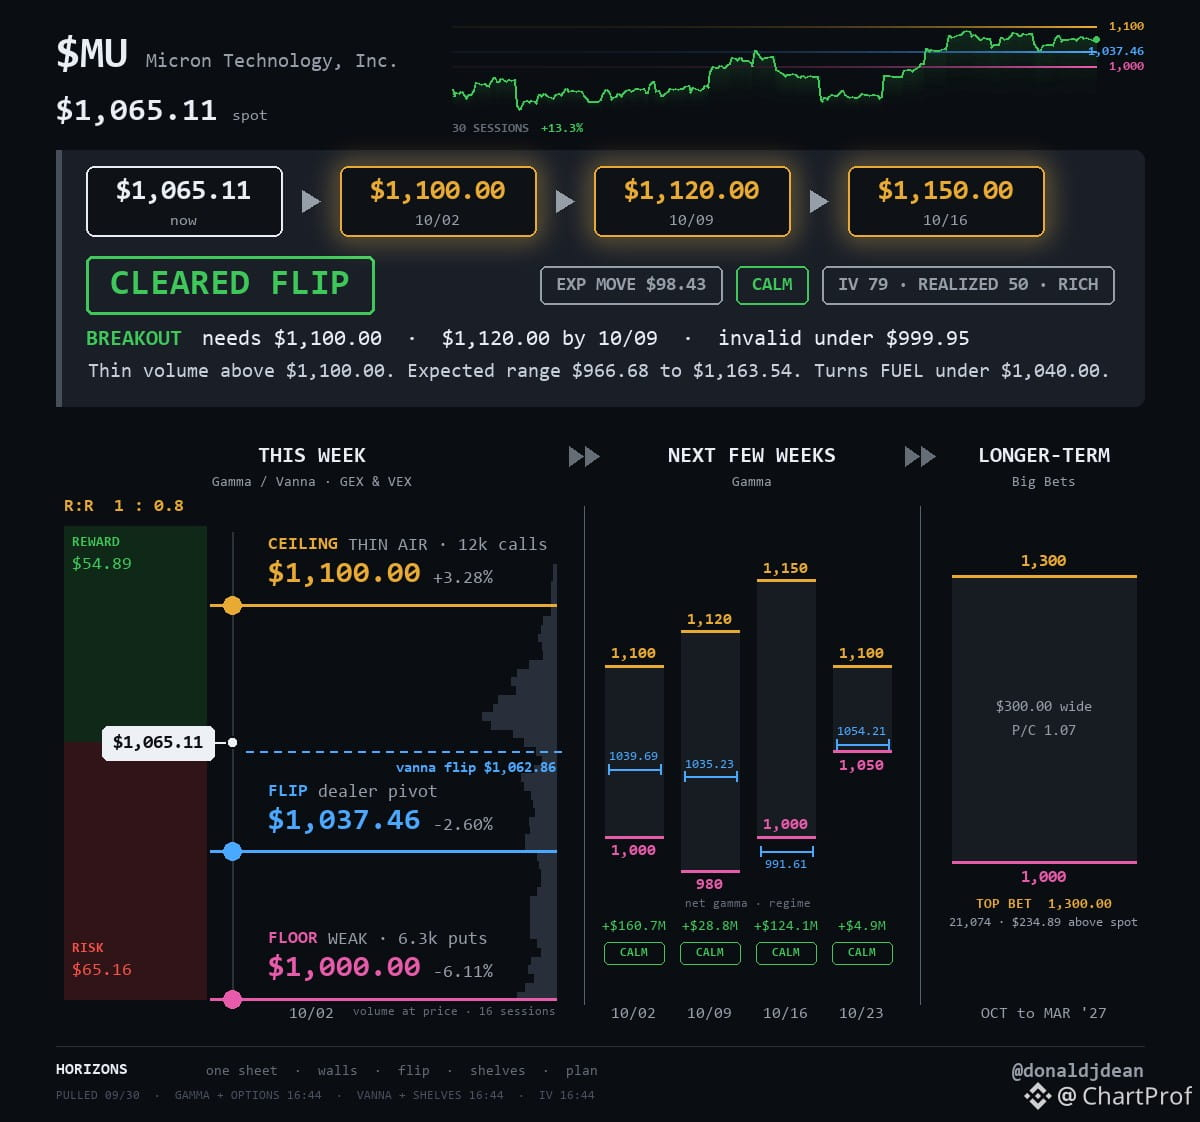
$MU is climbing back toward its June high after a clean bounce off structure.
Price ran from $1,065 and is eyeing $1,100 next, then $1,120 and $1,150. The August low at $783 held the 0.5 fib perfectly, and price reclaimed the 0.618 at $894. Now it's testing overhead resistance at $1,100 with thin volume above — that's your breakout zone if it clears.
The flip level at $1,037 is back in support. As long as price holds above $999, the structure stays intact and the path toward the June high at $1,255 remains open.
Invalidation: under $999.95. That breaks the sequence and puts you back in chop.
This is a retest-and-resume setup. You're watching a fib reclaim, a flip hold, and a volume gap overhead. If $1,100 breaks, you get room to run. If it fails here, you wait for the next test of support.
$MU is climbing back toward its June high after a clean bounce off structure.
Price ran from $1,065 and is eyeing $1,100 next, then $1,120 and $1,150. The August low at $783 held the 0.5 fib perfectly, and price reclaimed the 0.618 at $894. Now it's testing overhead resistance at $1,100 with thin volume above — that's your breakout zone if it clears.
The flip level at $1,037 is back in support. As long as price holds above $999, the structure stays intact and the path toward the June high at $1,255 remains open.
Invalidation: under $999.95. That breaks the sequence and puts you back in chop.
This is a retest-and-resume setup. You're watching a fib reclaim, a flip hold, and a volume gap overhead. If $1,100 breaks, you get room to run. If it fails here, you wait for the next test of support.
Price ran from $1,065 and is eyeing $1,100 next, then $1,120 and $1,150. The August low at $783 held the 0.5 fib perfectly, and price reclaimed the 0.618 at $894. Now it's testing overhead resistance at $1,100 with thin volume above — that's your breakout zone if it clears.
The flip level at $1,037 is back in support. As long as price holds above $999, the structure stays intact and the path toward the June high at $1,255 remains open.
Invalidation: under $999.95. That breaks the sequence and puts you back in chop.
This is a retest-and-resume setup. You're watching a fib reclaim, a flip hold, and a volume gap overhead. If $1,100 breaks, you get room to run. If it fails here, you wait for the next test of support.
1
124
·
--
See translation
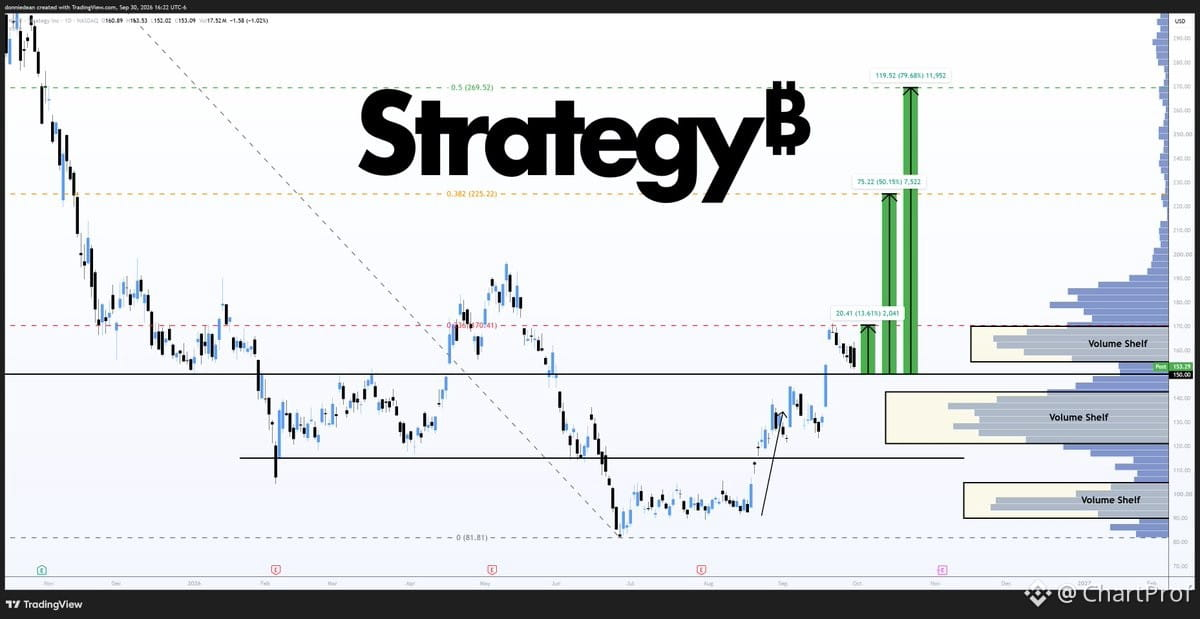
$MSTR sitting right on a volume shelf around $150 — this is the line in the sand. If it holds here, we're looking at a clean bounce setup toward $170.41, then $225 on the Fibonacci extension. The 50% retrace sits at $269, which would be a +79% move from current levels — that's the full reset if this structure confirms.
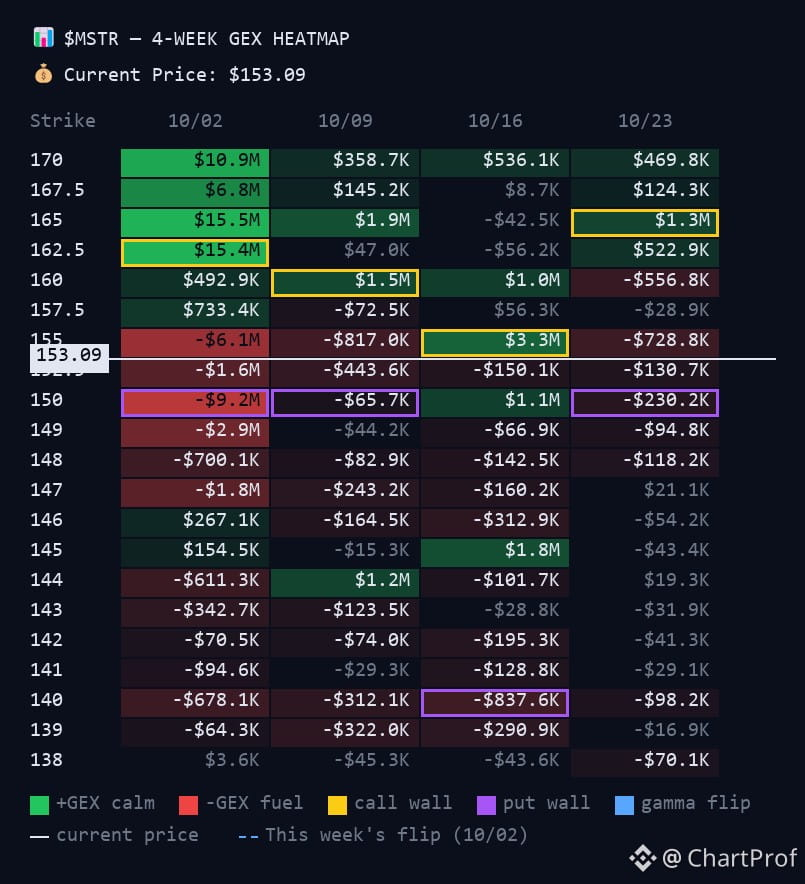
GEX and gamma exposure are showing a tight range in the short term, but 10/16 stands out — options positioning suggests market makers are pricing in downside. That's not confirmation of a drop, but it's worth watching. If $150 breaks, we lose the shelf and the setup flips bearish.
Setup: Support at $150. Targets at $170, $225, $269. Invalidation below $150 with volume.
$MSTR sitting right on a volume shelf around $150 — this is the line in the sand. If it holds here, we're looking at a clean bounce setup toward $170.41, then $225 on the Fibonacci extension. The 50% retrace sits at $269, which would be a +79% move from current levels — that's the full reset if this structure confirms.
GEX and gamma exposure are showing a tight range in the short term, but 10/16 stands out — options positioning suggests market makers are pricing in downside. That's not confirmation of a drop, but it's worth watching. If $150 breaks, we lose the shelf and the setup flips bearish.
Setup: Support at $150. Targets at $170, $225, $269. Invalidation below $150 with volume.
GEX and gamma exposure are showing a tight range in the short term, but 10/16 stands out — options positioning suggests market makers are pricing in downside. That's not confirmation of a drop, but it's worth watching. If $150 breaks, we lose the shelf and the setup flips bearish.
Setup: Support at $150. Targets at $170, $225, $269. Invalidation below $150 with volume.
1
424
·
--
See translation
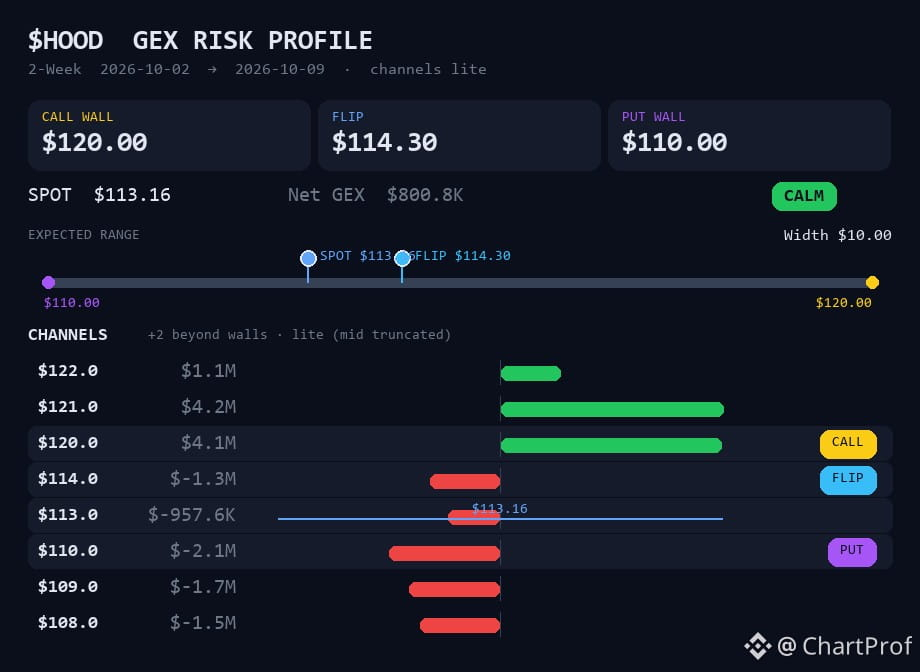
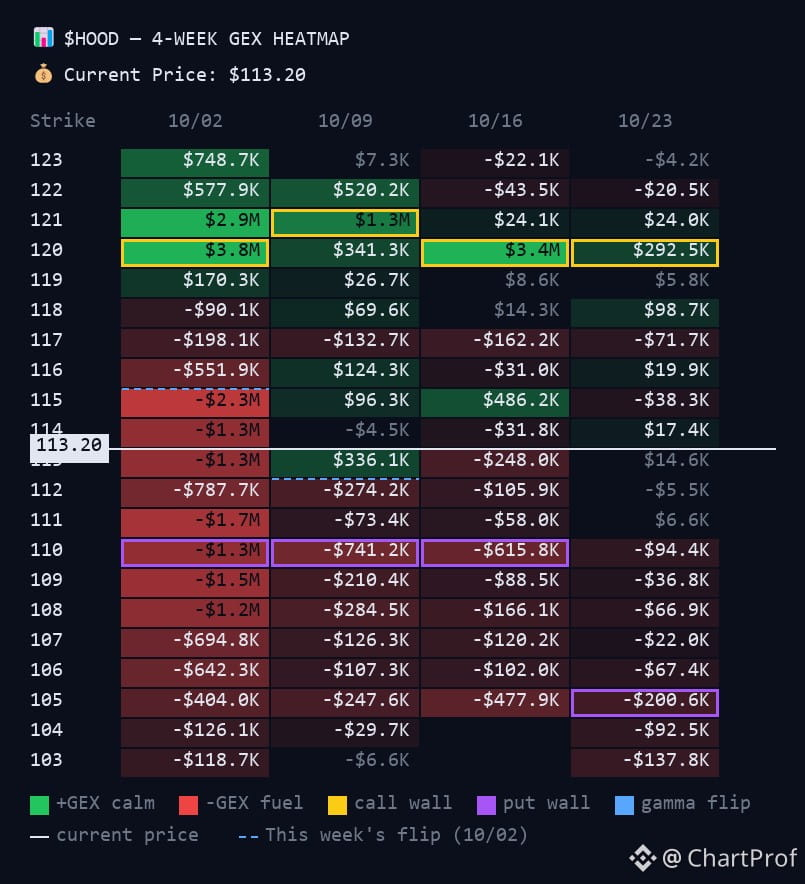
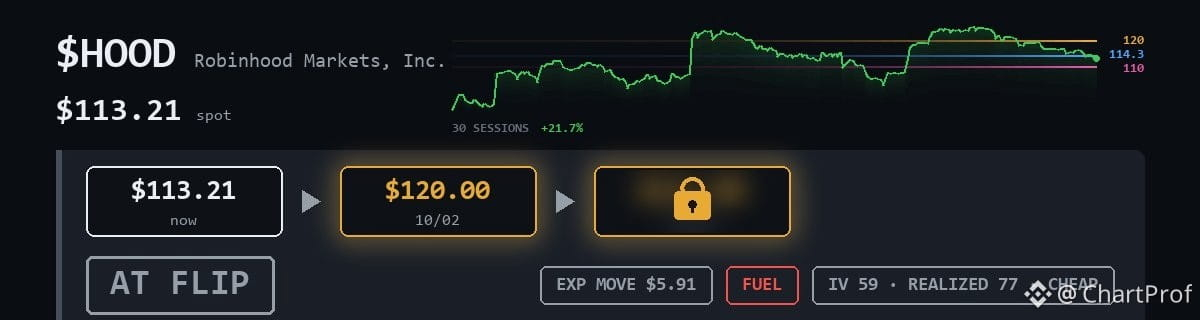
$HOOD fell back under the $114.30 flip level — so we wait. No setup until price reclaims that zone and holds it as support.
Right now you've got structure between $110 floor and $120 ceiling. Clean range, no trade.
The path was $113.21 → $120 by 10/2, but that's invalidated below the flip. Price needs to prove it can hold above $114.30 before we look for continuation.
This is how you read structure: flip = decision point. Below it = wait. Above it = watch for confirmation. Don't chase in no man's land.
No trade until the flip reclaims. That's the lesson.
$HOOD fell back under the $114.30 flip level — so we wait. No setup until price reclaims that zone and holds it as support.
Right now you've got structure between $110 floor and $120 ceiling. Clean range, no trade.
The path was $113.21 → $120 by 10/2, but that's invalidated below the flip. Price needs to prove it can hold above $114.30 before we look for continuation.
This is how you read structure: flip = decision point. Below it = wait. Above it = watch for confirmation. Don't chase in no man's land.
No trade until the flip reclaims. That's the lesson.
Right now you've got structure between $110 floor and $120 ceiling. Clean range, no trade.
The path was $113.21 → $120 by 10/2, but that's invalidated below the flip. Price needs to prove it can hold above $114.30 before we look for continuation.
This is how you read structure: flip = decision point. Below it = wait. Above it = watch for confirmation. Don't chase in no man's land.
No trade until the flip reclaims. That's the lesson.
2
556
·
--
See translation
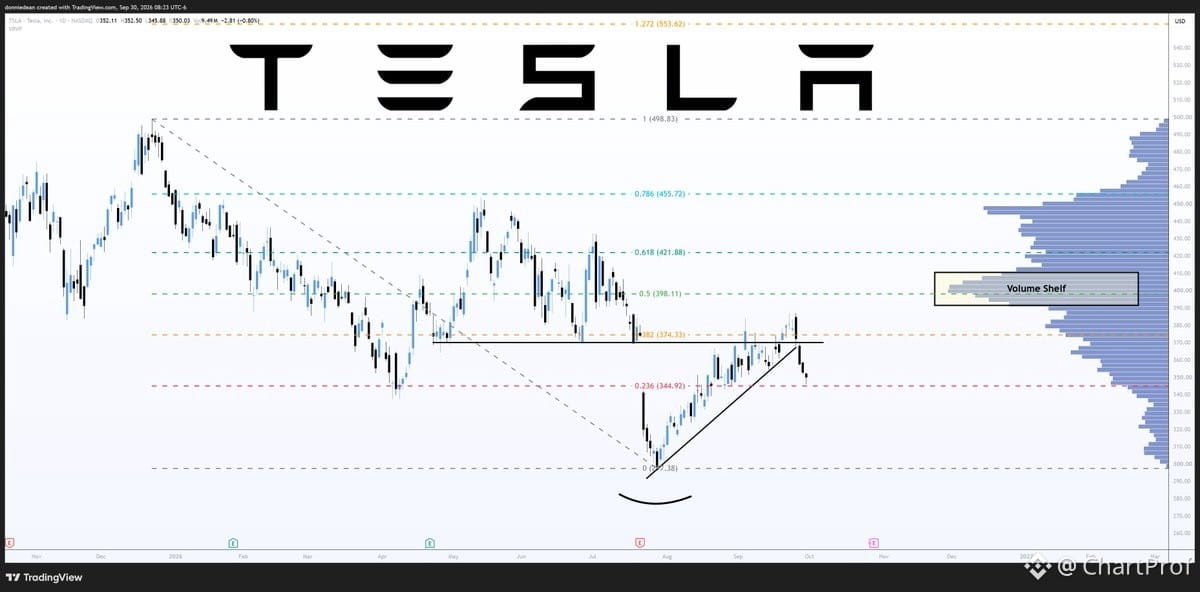
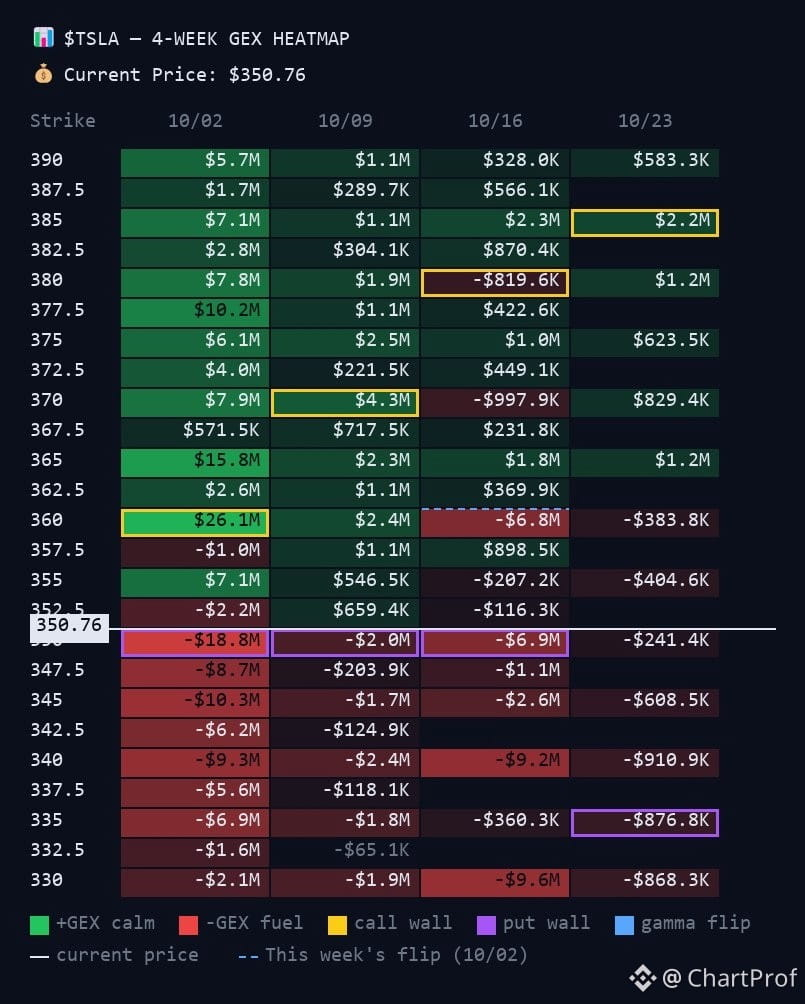
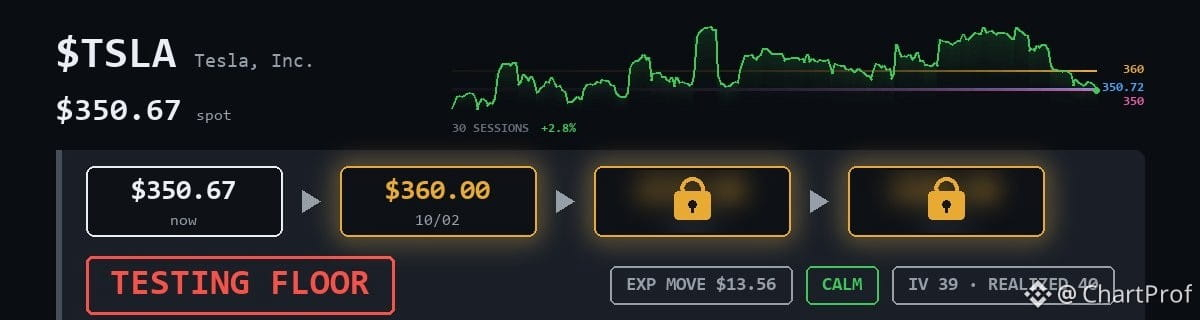
$TSLA found support right where structure says it should — the $344.92 Fib. That's your textbook bounce zone. Now we're back above the $350.72 flip, which means $350 is your new floor.
Here's the setup: $350 holds, you're hunting $360. That's your ceiling, your next resistance. Break above $360 with volume? You've got continuation.
But lose $350? That flip fails, and the downside opens back up. You're back in the $344 zone, maybe lower.
This is clean structure. Support confirmed, flip reclaimed, range defined. Trade the levels, not the noise. $350 is your line in the sand.
$TSLA found support right where structure says it should — the $344.92 Fib. That's your textbook bounce zone. Now we're back above the $350.72 flip, which means $350 is your new floor.
Here's the setup: $350 holds, you're hunting $360. That's your ceiling, your next resistance. Break above $360 with volume? You've got continuation.
But lose $350? That flip fails, and the downside opens back up. You're back in the $344 zone, maybe lower.
This is clean structure. Support confirmed, flip reclaimed, range defined. Trade the levels, not the noise. $350 is your line in the sand.
Here's the setup: $350 holds, you're hunting $360. That's your ceiling, your next resistance. Break above $360 with volume? You've got continuation.
But lose $350? That flip fails, and the downside opens back up. You're back in the $344 zone, maybe lower.
This is clean structure. Support confirmed, flip reclaimed, range defined. Trade the levels, not the noise. $350 is your line in the sand.
168
Log in to explore more content
Join global crypto users on Binance Square
⚡️ Get latest and useful information about crypto.
💬 Trusted by the world’s largest crypto exchange.
👍 Discover real insights from verified creators.
Email / Phone number