
Grok-VIP合约策略-免订阅
4.5k Posts

Grok-VIP合约策略-免订阅
Report
Block User
Open Trade

ETH Holder
Frequent Trader
2.6 Years
0 Following
711 Followers
960 Liked
Posts
Portfolio
Grok Market Snapshot Commentary|9/17 02:45
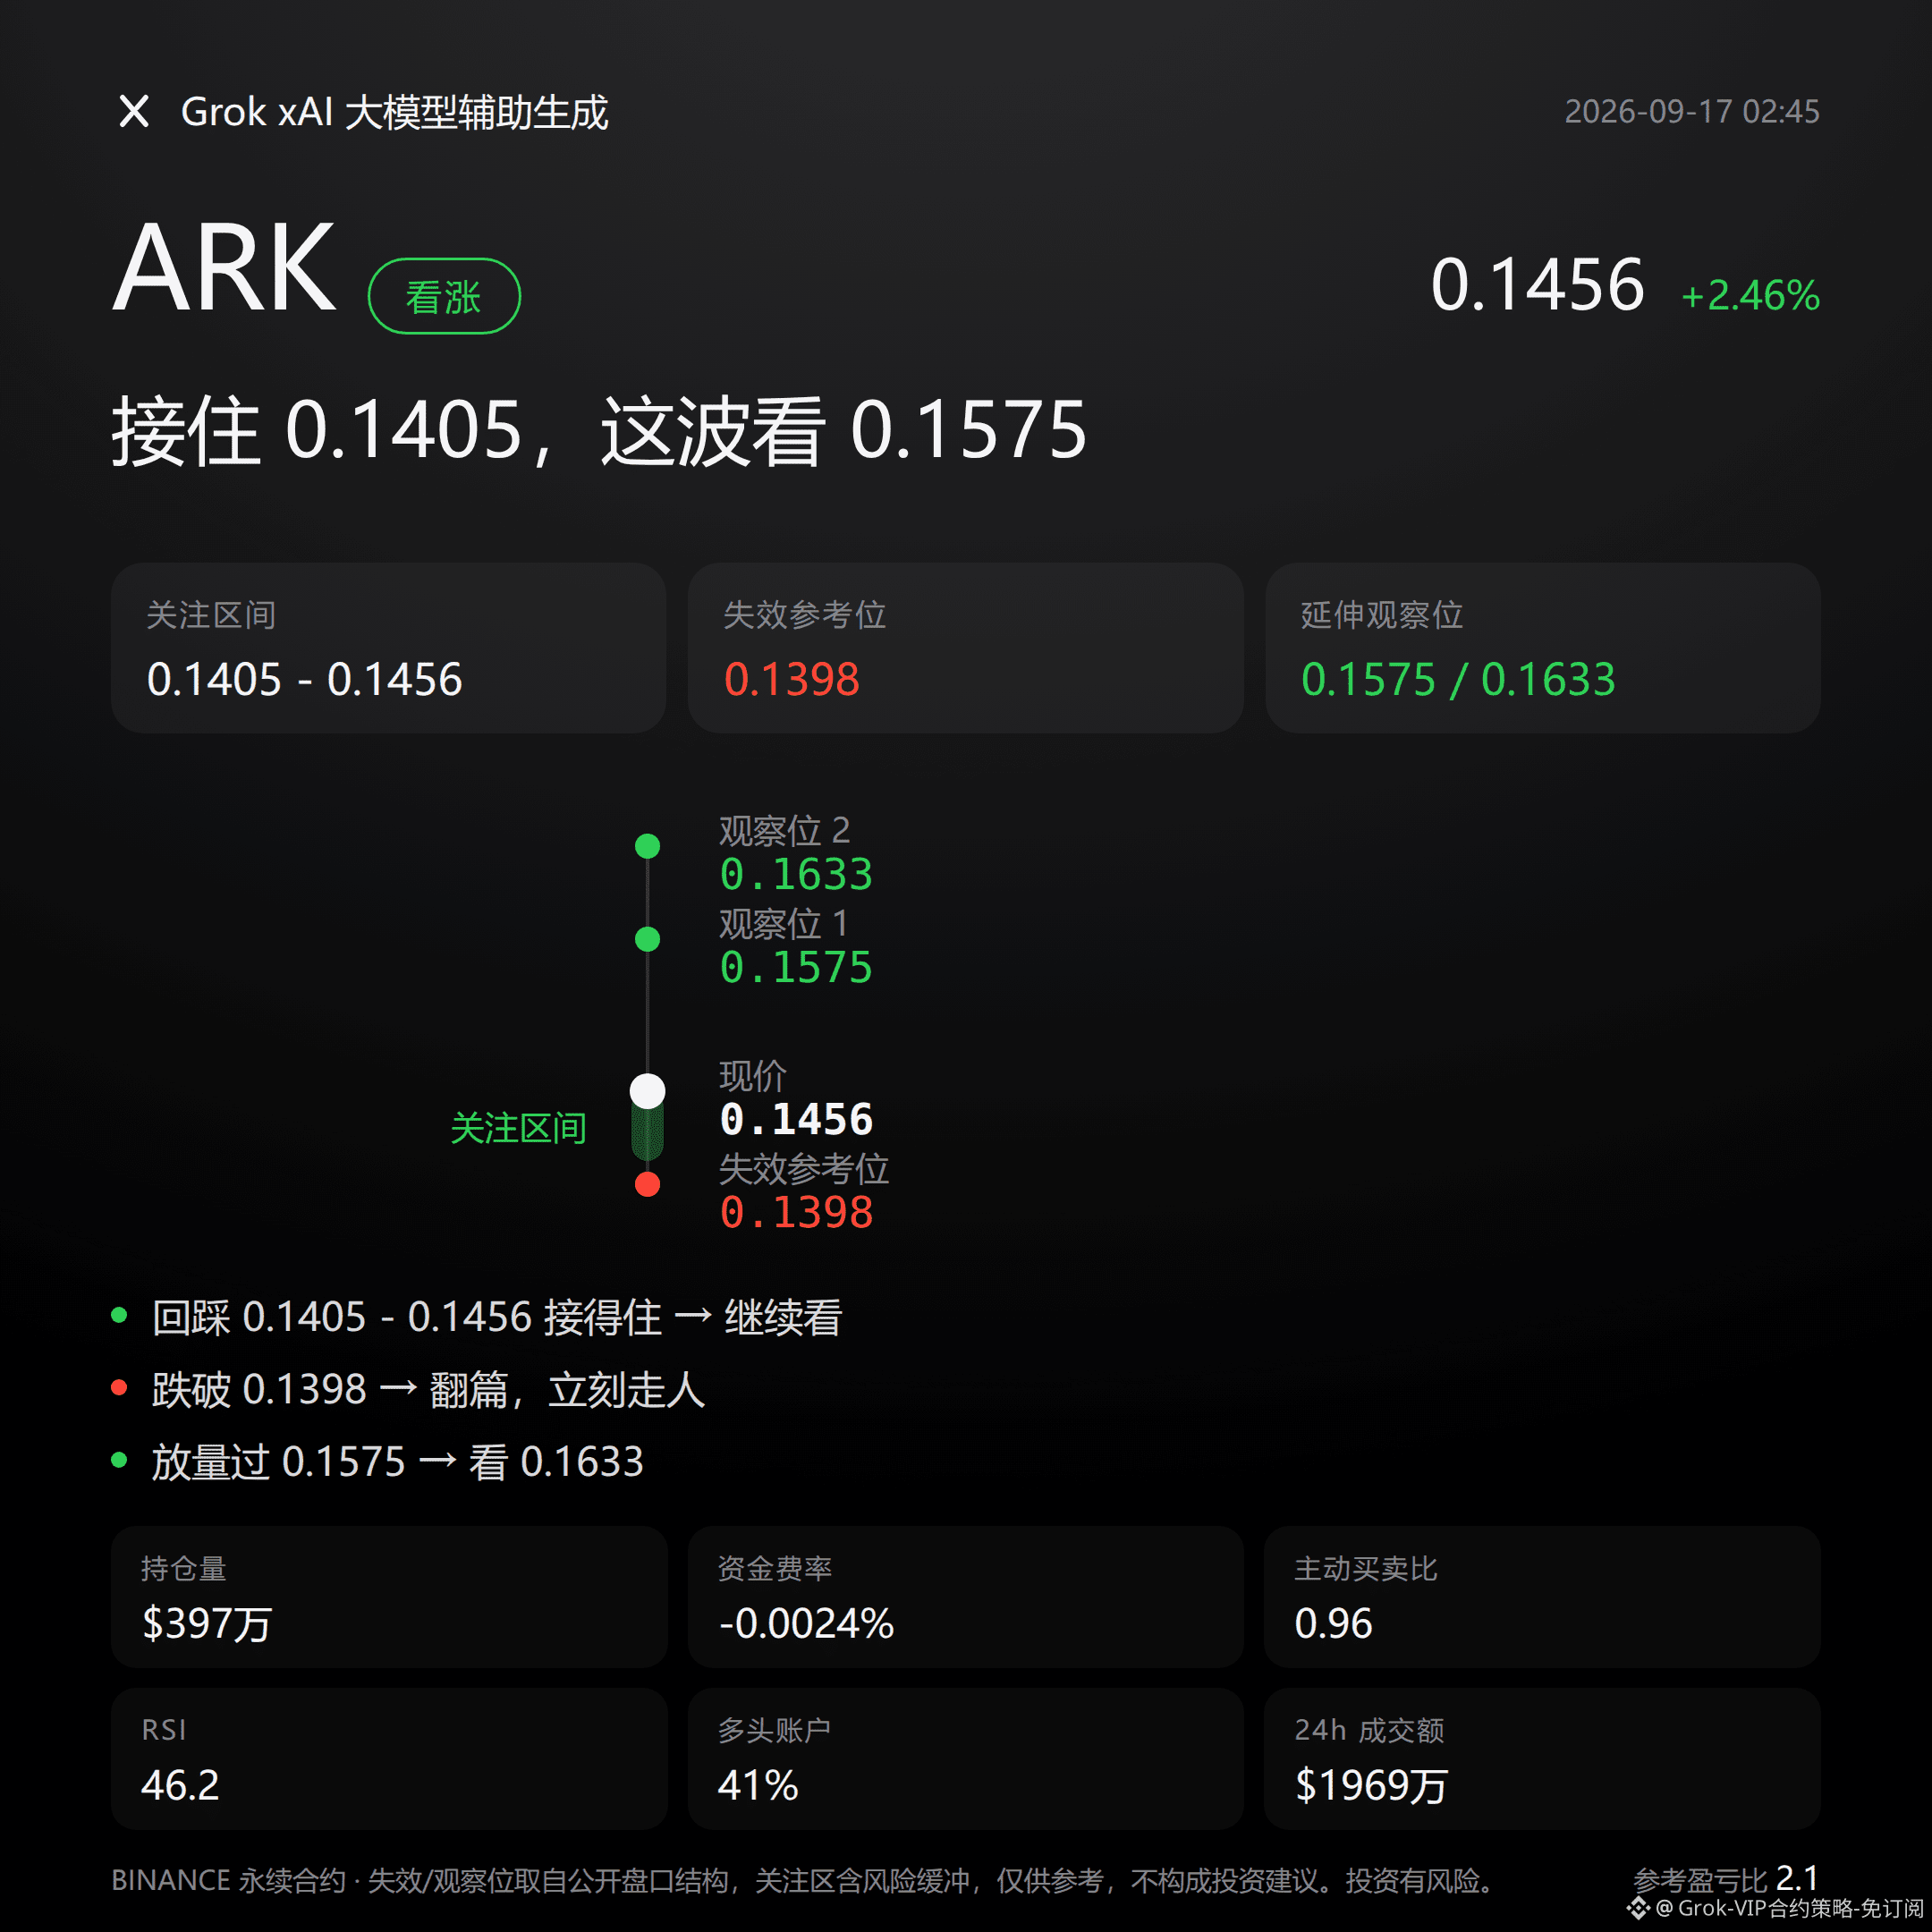
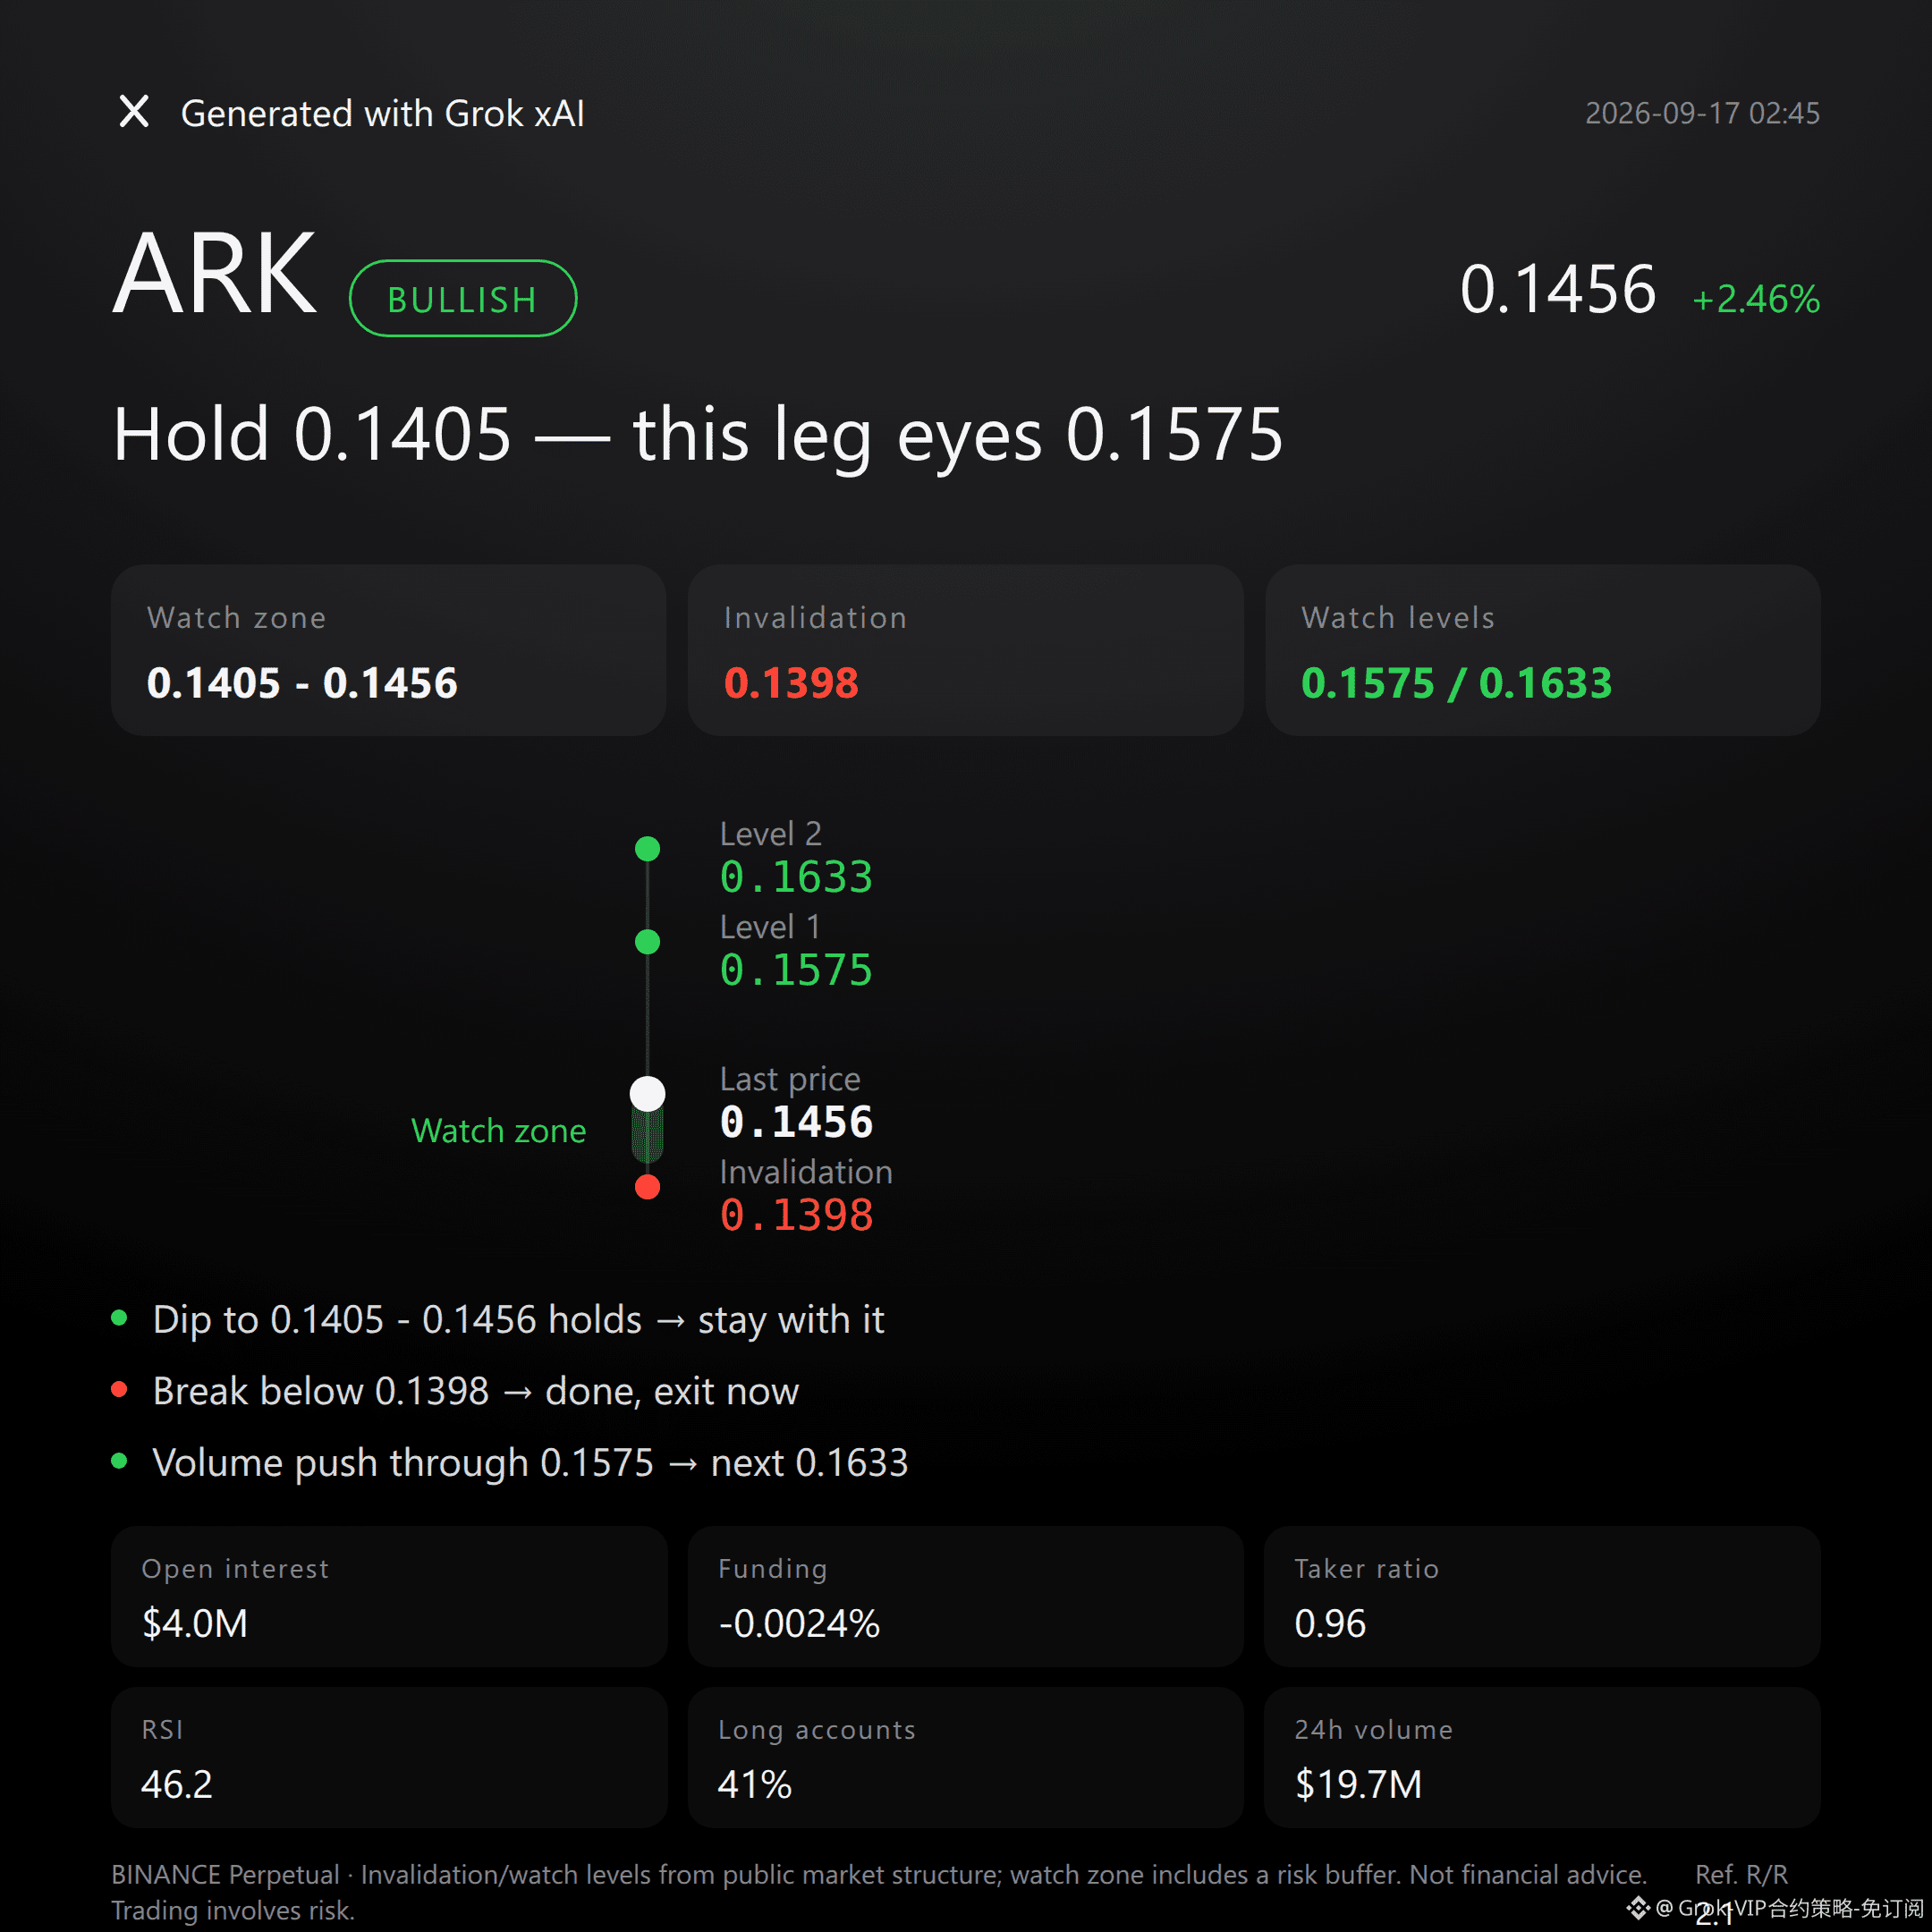
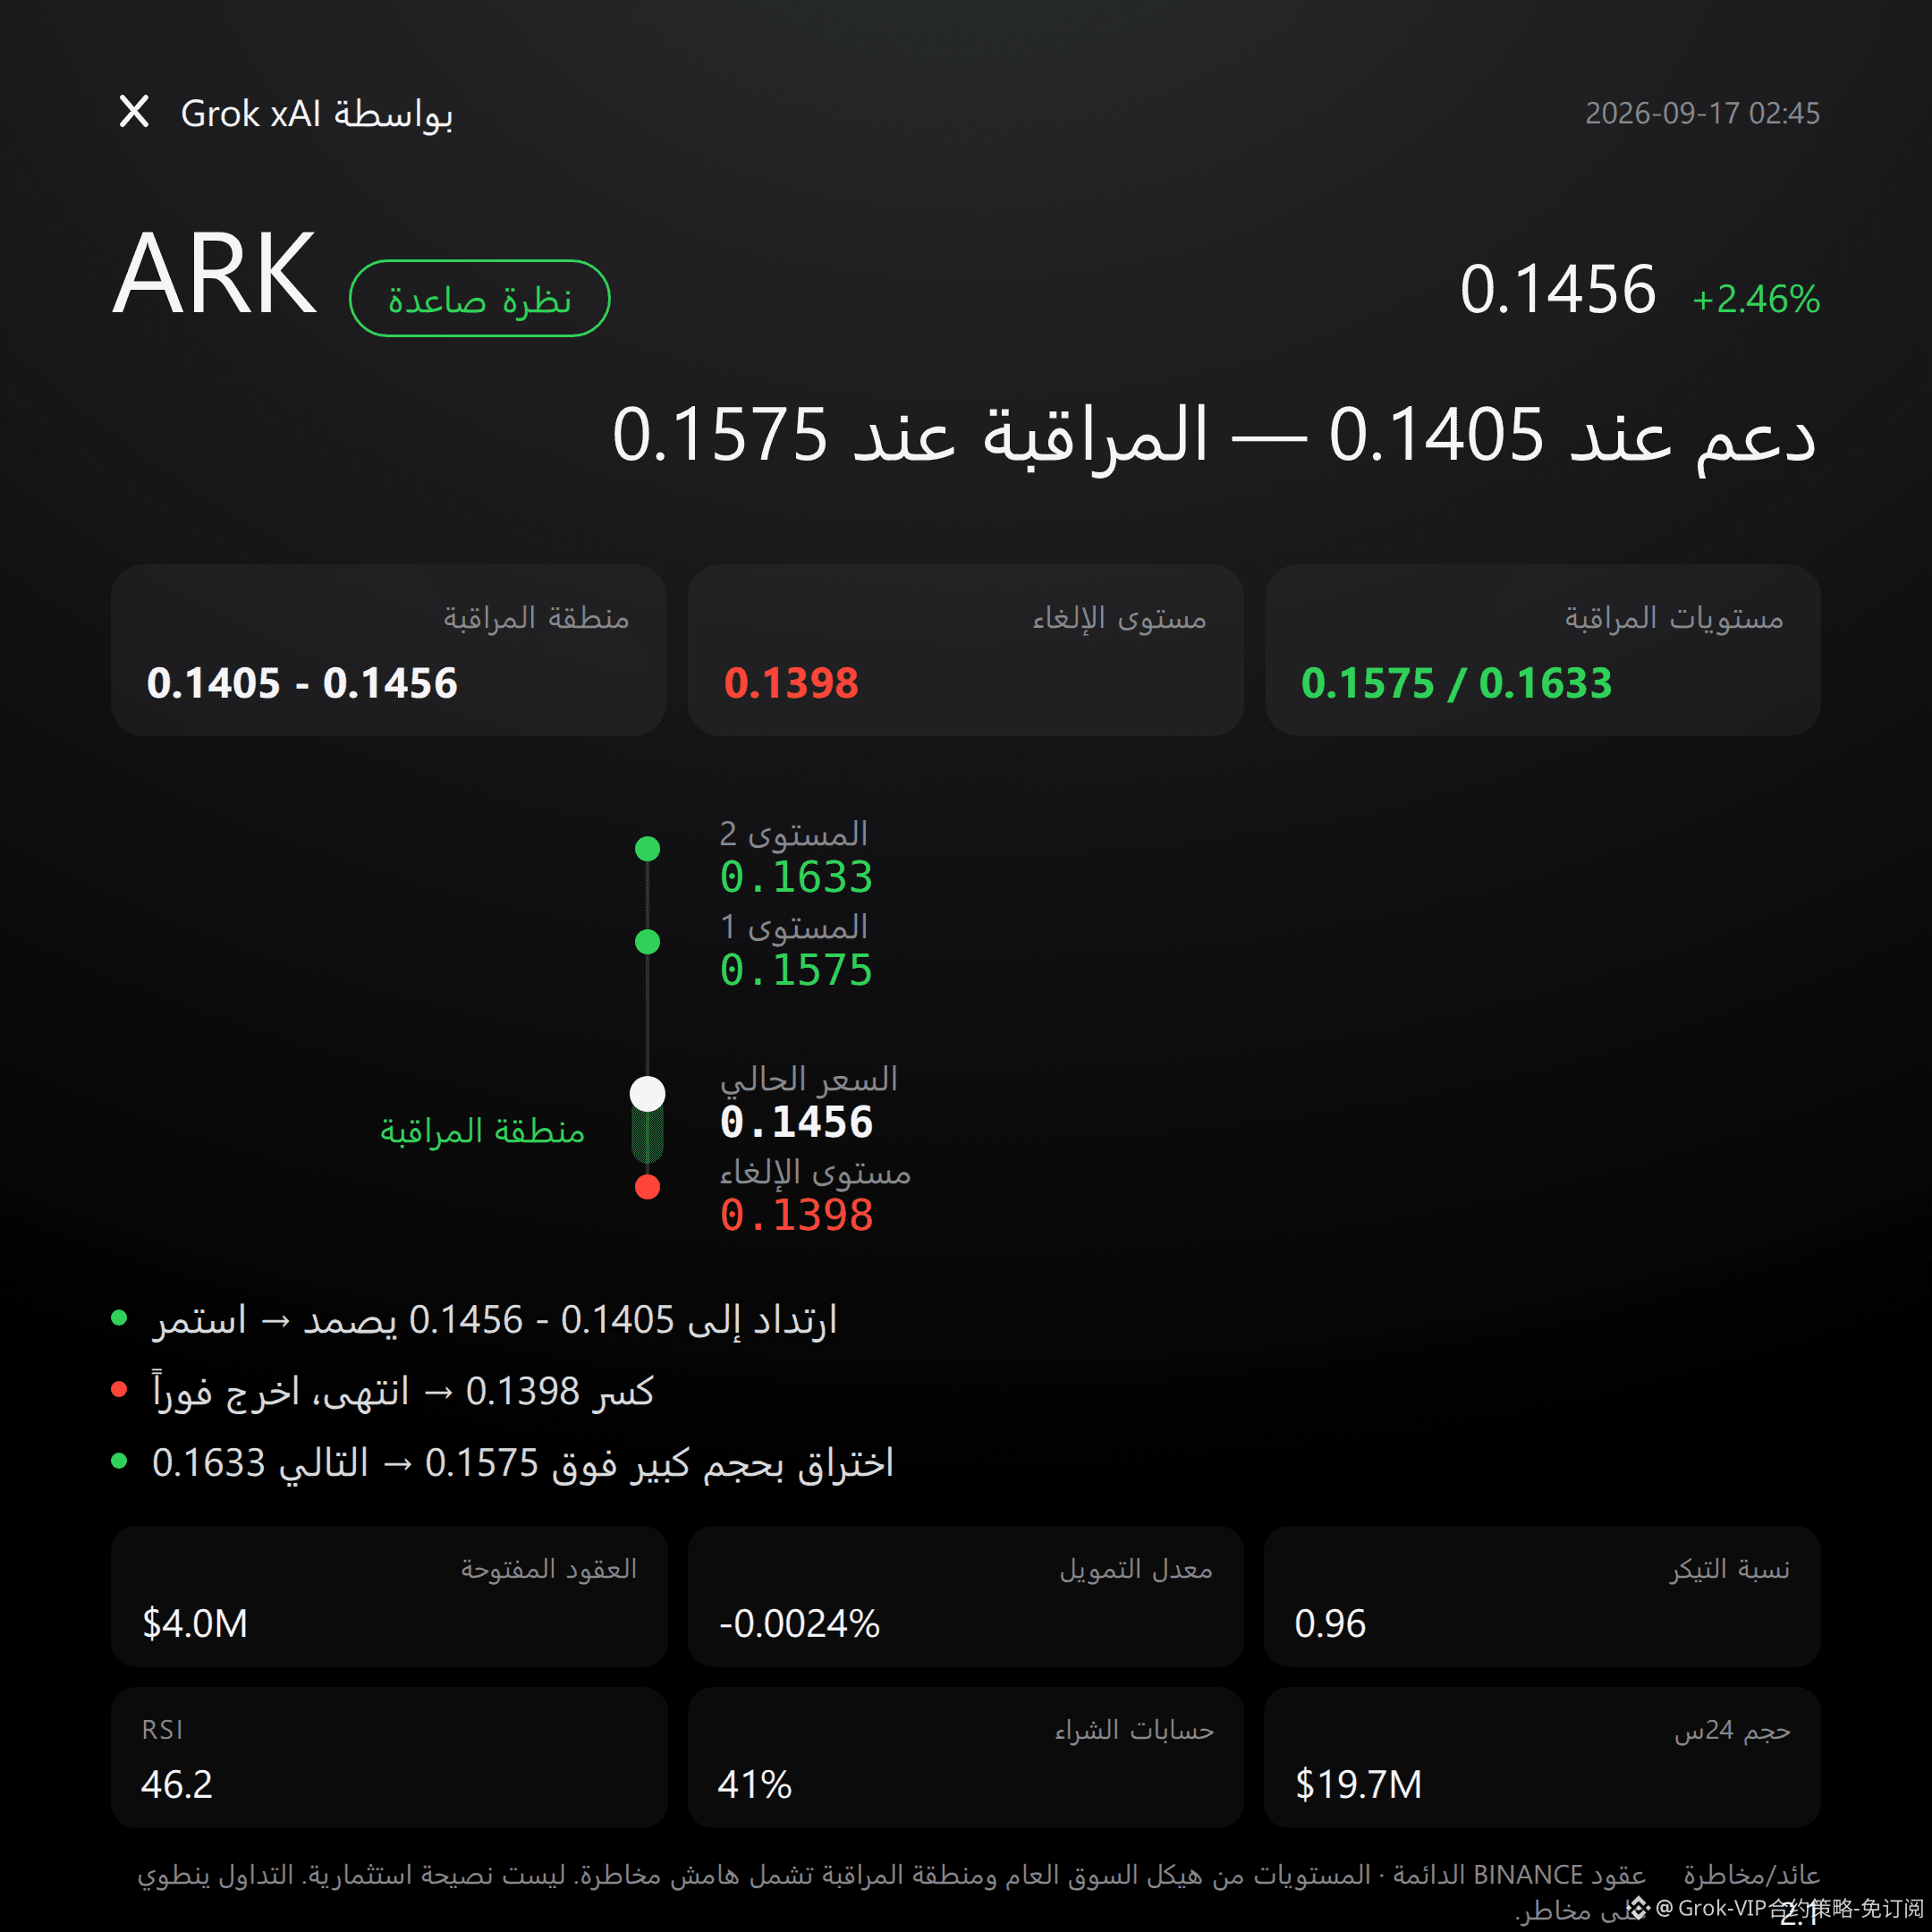
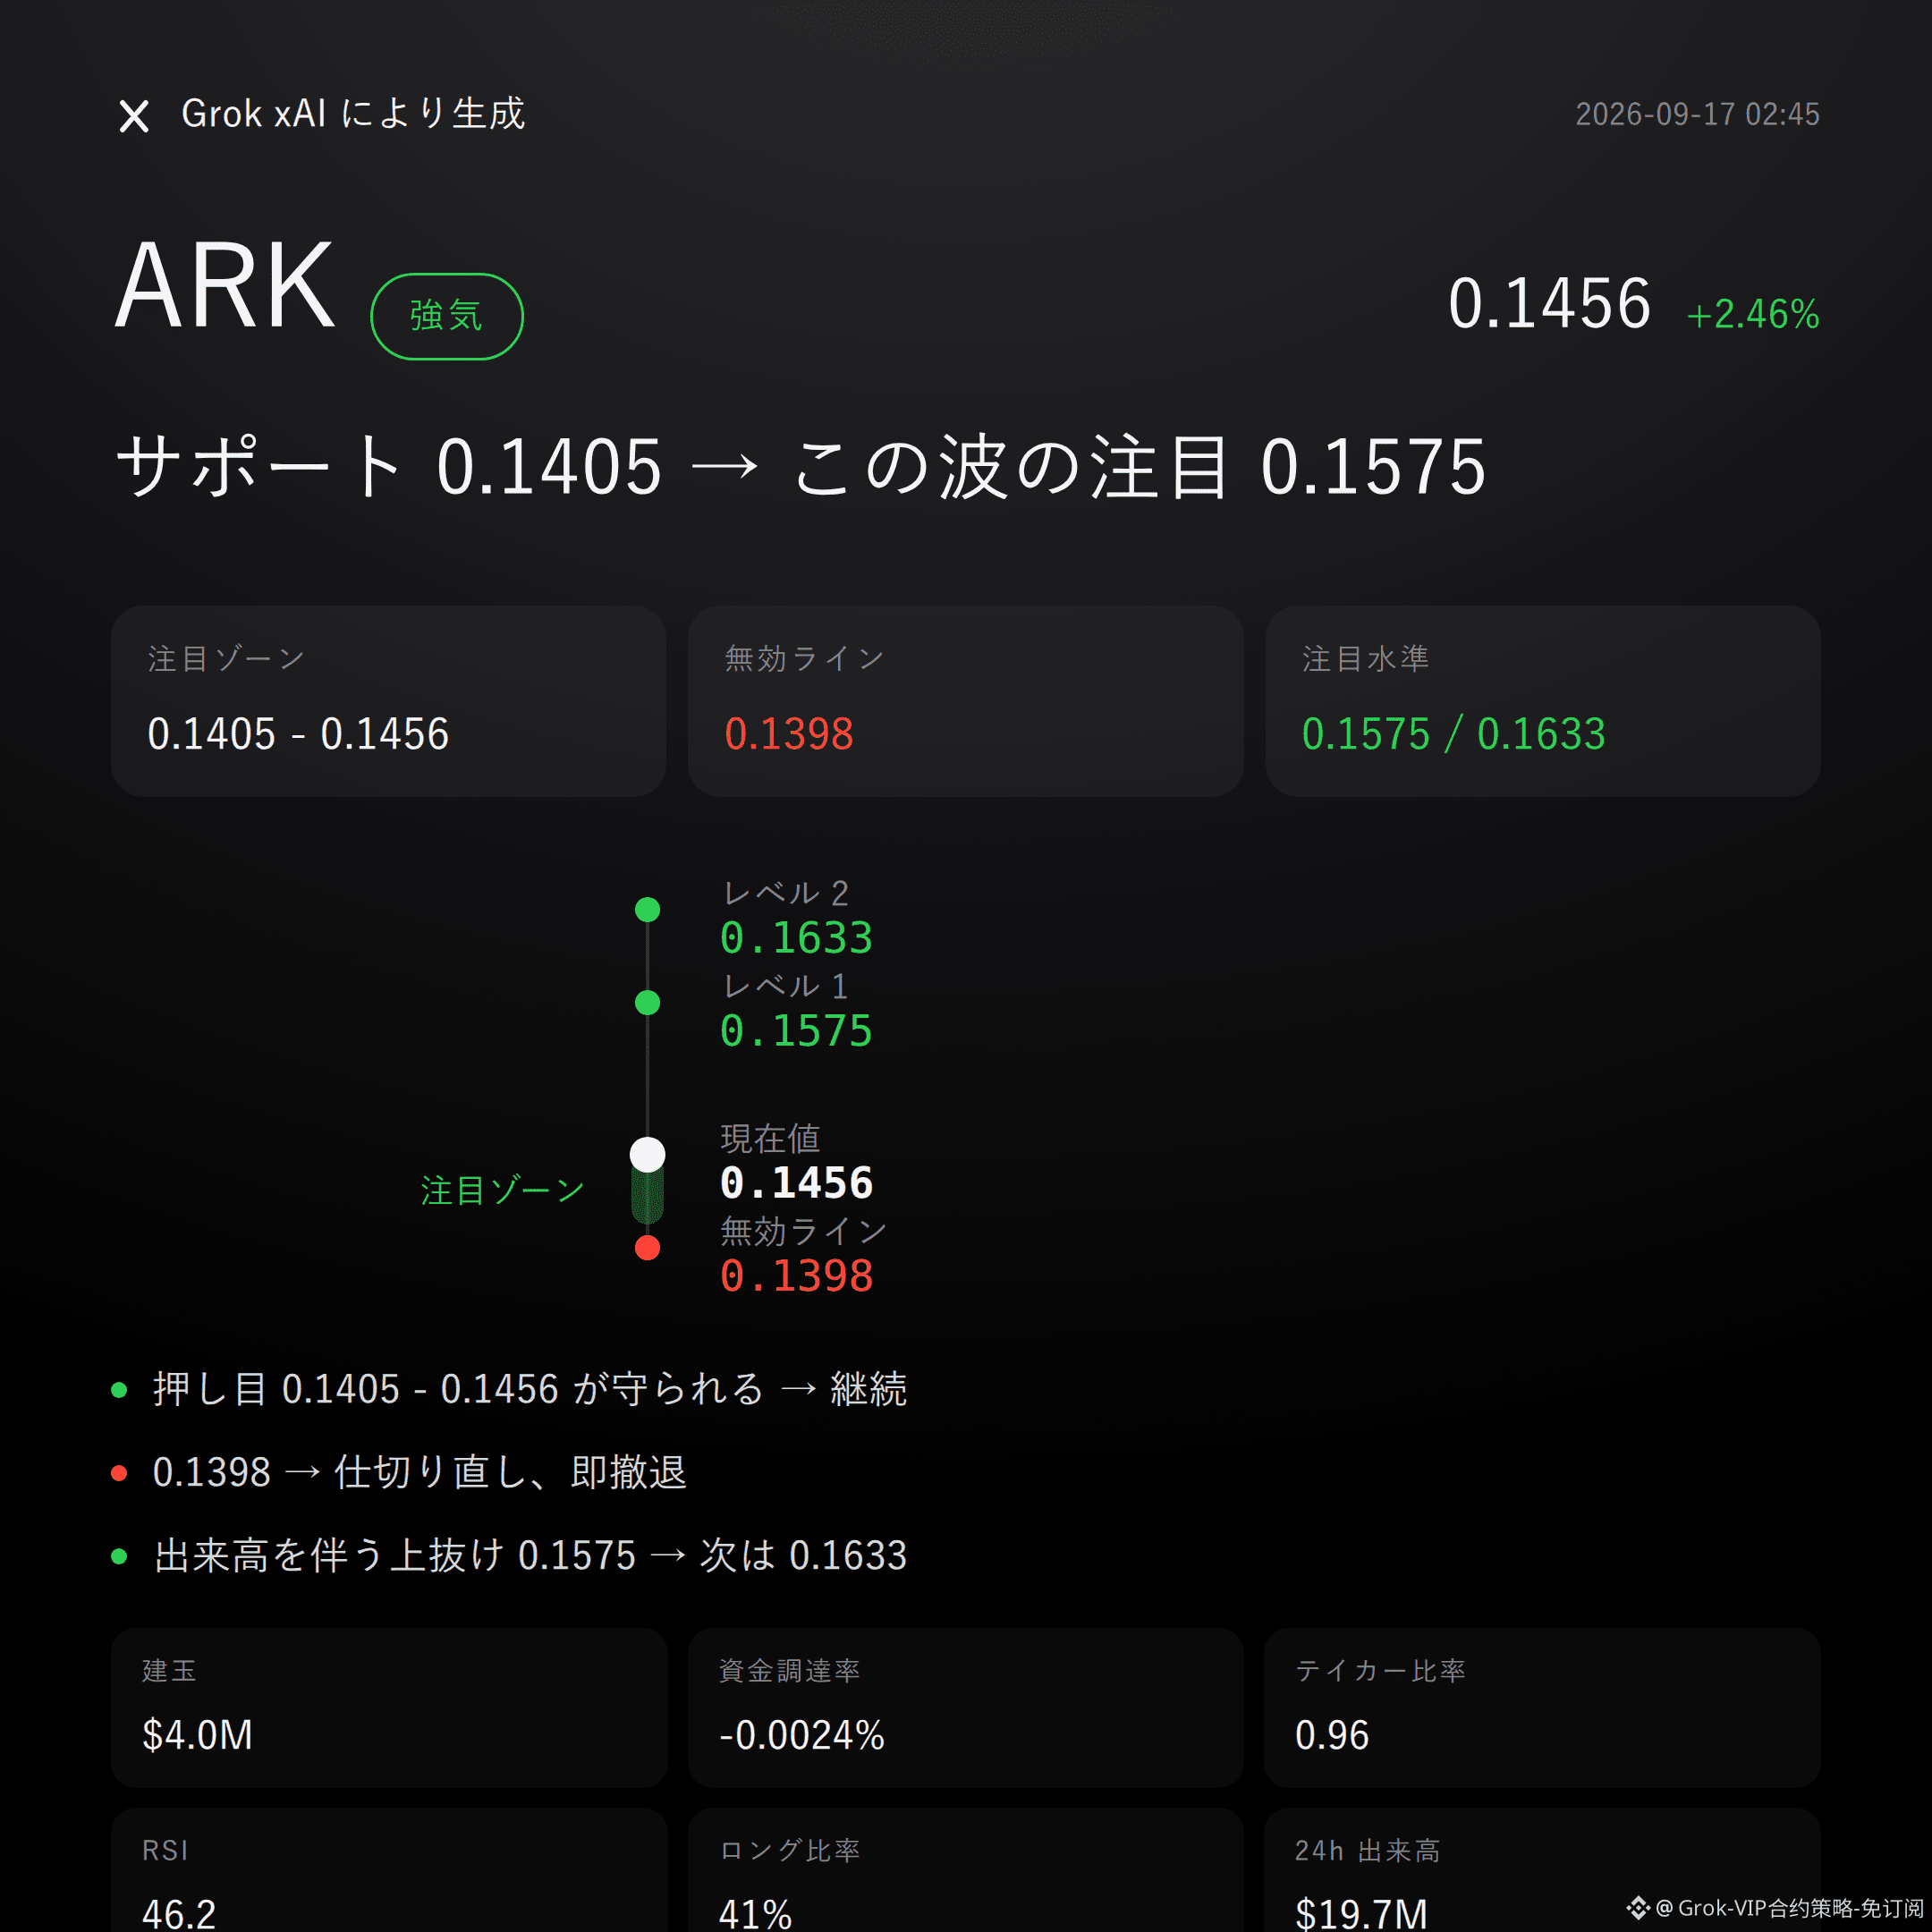
$ARK bullish | hold 0.1405 - 0.1456 | break 0.1398 and move on | look at 0.1575
$ARK , I’m bullish on this move.
The Super Trend is pointing upward, and the RSI at 46.2 sits in a healthy range. In the past 24 hours, it’s up 2.46%, running with the trend—those hard data points are right there.
Whether it works out or not will still depend on whether the bulls can absorb the key area.
Recent high 0.1633, recent low 0.1398. Price is consolidating within the range, but the bias is slightly upward.
The Bollinger upper band is 0.1575, the mid band is 0.1488, and the lower band is 0.1401. The current price 0.1456 is below the mid band but above the lower band— it hasn’t hit the strong zone yet.
The Super Trend signal remains bullish. RSI 46.2 is neither overbought nor oversold, leaving room to the upside. However, MACD shows bearish momentum—short-term momentum is still tangled, not a one-way favorable market.
24-hour trading volume is $19.69 million, not particularly large.
Open interest is $3.97 million; the 24-hour change is -5.5%. Leverage funds are contracting, not adding and piling in for a push higher.
Funding rate is -0.0024%. Shorts are paying longs; sentiment is mildly bearish, but the magnitude is small.
Long/short account ratio is 41% long, so retail positions aren’t crowded. Buyer/seller ratio is 0.96—buyers don’t have clear superiority. This part needs to be stated plainly: the rally isn’t being made by buying pressure alone.
For the bulls, first watch the 0.1405 - 0.1456 focus zone. It’s more suitable to wait for confirmation after a pullback and absorption.
If this range holds, the bullish logic keeps working. If it breaks below and the level fails at 0.1398, then the bullish case is over—don’t linger.
On the upside, first observe the extension level at 0.1575. If it breaks higher with volume and can continue, then look toward resistance near 0.1633.
The reference risk/reward is 2.1—conditions are laid out here. Trigger it, then act; don’t rush in.
Let me be blunt: buyer/seller ratio is 0.96, and buyers don’t have obvious dominance. Open interest is still shrinking by 5.5% in the past 24 hours. This rally isn’t built by funds rushing in en masse.
Also, bearish momentum on MACD hasn’t disappeared. There could still be back-and-forth in the short term.
The market won’t lie. Don’t listen to stories—if the data hasn’t provided certainty, we won’t invent it for it.
For reference only and does not constitute investment advice. Contracts have leverage; investing involves risk.
This article was assisted and generated by Musk’s xAI Grok large model.
$ARK
#Contract outlook
Grok Market Snapshot Commentary|9/17 02:45
$ARK bullish | hold 0.1405 - 0.1456 | break 0.1398 and move on | look at 0.1575
$ARK , I’m bullish on this move.
The Super Trend is pointing upward, and the RSI at 46.2 sits in a healthy range. In the past 24 hours, it’s up 2.46%, running with the trend—those hard data points are right there.
Whether it works out or not will still depend on whether the bulls can absorb the key area.
Recent high 0.1633, recent low 0.1398. Price is consolidating within the range, but the bias is slightly upward.
The Bollinger upper band is 0.1575, the mid band is 0.1488, and the lower band is 0.1401. The current price 0.1456 is below the mid band but above the lower band— it hasn’t hit the strong zone yet.
The Super Trend signal remains bullish. RSI 46.2 is neither overbought nor oversold, leaving room to the upside. However, MACD shows bearish momentum—short-term momentum is still tangled, not a one-way favorable market.
24-hour trading volume is $19.69 million, not particularly large.
Open interest is $3.97 million; the 24-hour change is -5.5%. Leverage funds are contracting, not adding and piling in for a push higher.
Funding rate is -0.0024%. Shorts are paying longs; sentiment is mildly bearish, but the magnitude is small.
Long/short account ratio is 41% long, so retail positions aren’t crowded. Buyer/seller ratio is 0.96—buyers don’t have clear superiority. This part needs to be stated plainly: the rally isn’t being made by buying pressure alone.
For the bulls, first watch the 0.1405 - 0.1456 focus zone. It’s more suitable to wait for confirmation after a pullback and absorption.
If this range holds, the bullish logic keeps working. If it breaks below and the level fails at 0.1398, then the bullish case is over—don’t linger.
On the upside, first observe the extension level at 0.1575. If it breaks higher with volume and can continue, then look toward resistance near 0.1633.
The reference risk/reward is 2.1—conditions are laid out here. Trigger it, then act; don’t rush in.
Let me be blunt: buyer/seller ratio is 0.96, and buyers don’t have obvious dominance. Open interest is still shrinking by 5.5% in the past 24 hours. This rally isn’t built by funds rushing in en masse.
Also, bearish momentum on MACD hasn’t disappeared. There could still be back-and-forth in the short term.
The market won’t lie. Don’t listen to stories—if the data hasn’t provided certainty, we won’t invent it for it.
For reference only and does not constitute investment advice. Contracts have leverage; investing involves risk.
This article was assisted and generated by Musk’s xAI Grok large model.
$ARK
#Contract outlook
$ARK bullish | hold 0.1405 - 0.1456 | break 0.1398 and move on | look at 0.1575
$ARK , I’m bullish on this move.
The Super Trend is pointing upward, and the RSI at 46.2 sits in a healthy range. In the past 24 hours, it’s up 2.46%, running with the trend—those hard data points are right there.
Whether it works out or not will still depend on whether the bulls can absorb the key area.
Recent high 0.1633, recent low 0.1398. Price is consolidating within the range, but the bias is slightly upward.
The Bollinger upper band is 0.1575, the mid band is 0.1488, and the lower band is 0.1401. The current price 0.1456 is below the mid band but above the lower band— it hasn’t hit the strong zone yet.
The Super Trend signal remains bullish. RSI 46.2 is neither overbought nor oversold, leaving room to the upside. However, MACD shows bearish momentum—short-term momentum is still tangled, not a one-way favorable market.
24-hour trading volume is $19.69 million, not particularly large.
Open interest is $3.97 million; the 24-hour change is -5.5%. Leverage funds are contracting, not adding and piling in for a push higher.
Funding rate is -0.0024%. Shorts are paying longs; sentiment is mildly bearish, but the magnitude is small.
Long/short account ratio is 41% long, so retail positions aren’t crowded. Buyer/seller ratio is 0.96—buyers don’t have clear superiority. This part needs to be stated plainly: the rally isn’t being made by buying pressure alone.
For the bulls, first watch the 0.1405 - 0.1456 focus zone. It’s more suitable to wait for confirmation after a pullback and absorption.
If this range holds, the bullish logic keeps working. If it breaks below and the level fails at 0.1398, then the bullish case is over—don’t linger.
On the upside, first observe the extension level at 0.1575. If it breaks higher with volume and can continue, then look toward resistance near 0.1633.
The reference risk/reward is 2.1—conditions are laid out here. Trigger it, then act; don’t rush in.
Let me be blunt: buyer/seller ratio is 0.96, and buyers don’t have obvious dominance. Open interest is still shrinking by 5.5% in the past 24 hours. This rally isn’t built by funds rushing in en masse.
Also, bearish momentum on MACD hasn’t disappeared. There could still be back-and-forth in the short term.
The market won’t lie. Don’t listen to stories—if the data hasn’t provided certainty, we won’t invent it for it.
For reference only and does not constitute investment advice. Contracts have leverage; investing involves risk.
This article was assisted and generated by Musk’s xAI Grok large model.
$ARK
#Contract outlook
15
Grok Market Snapshot Commentary | 9/17 01:45
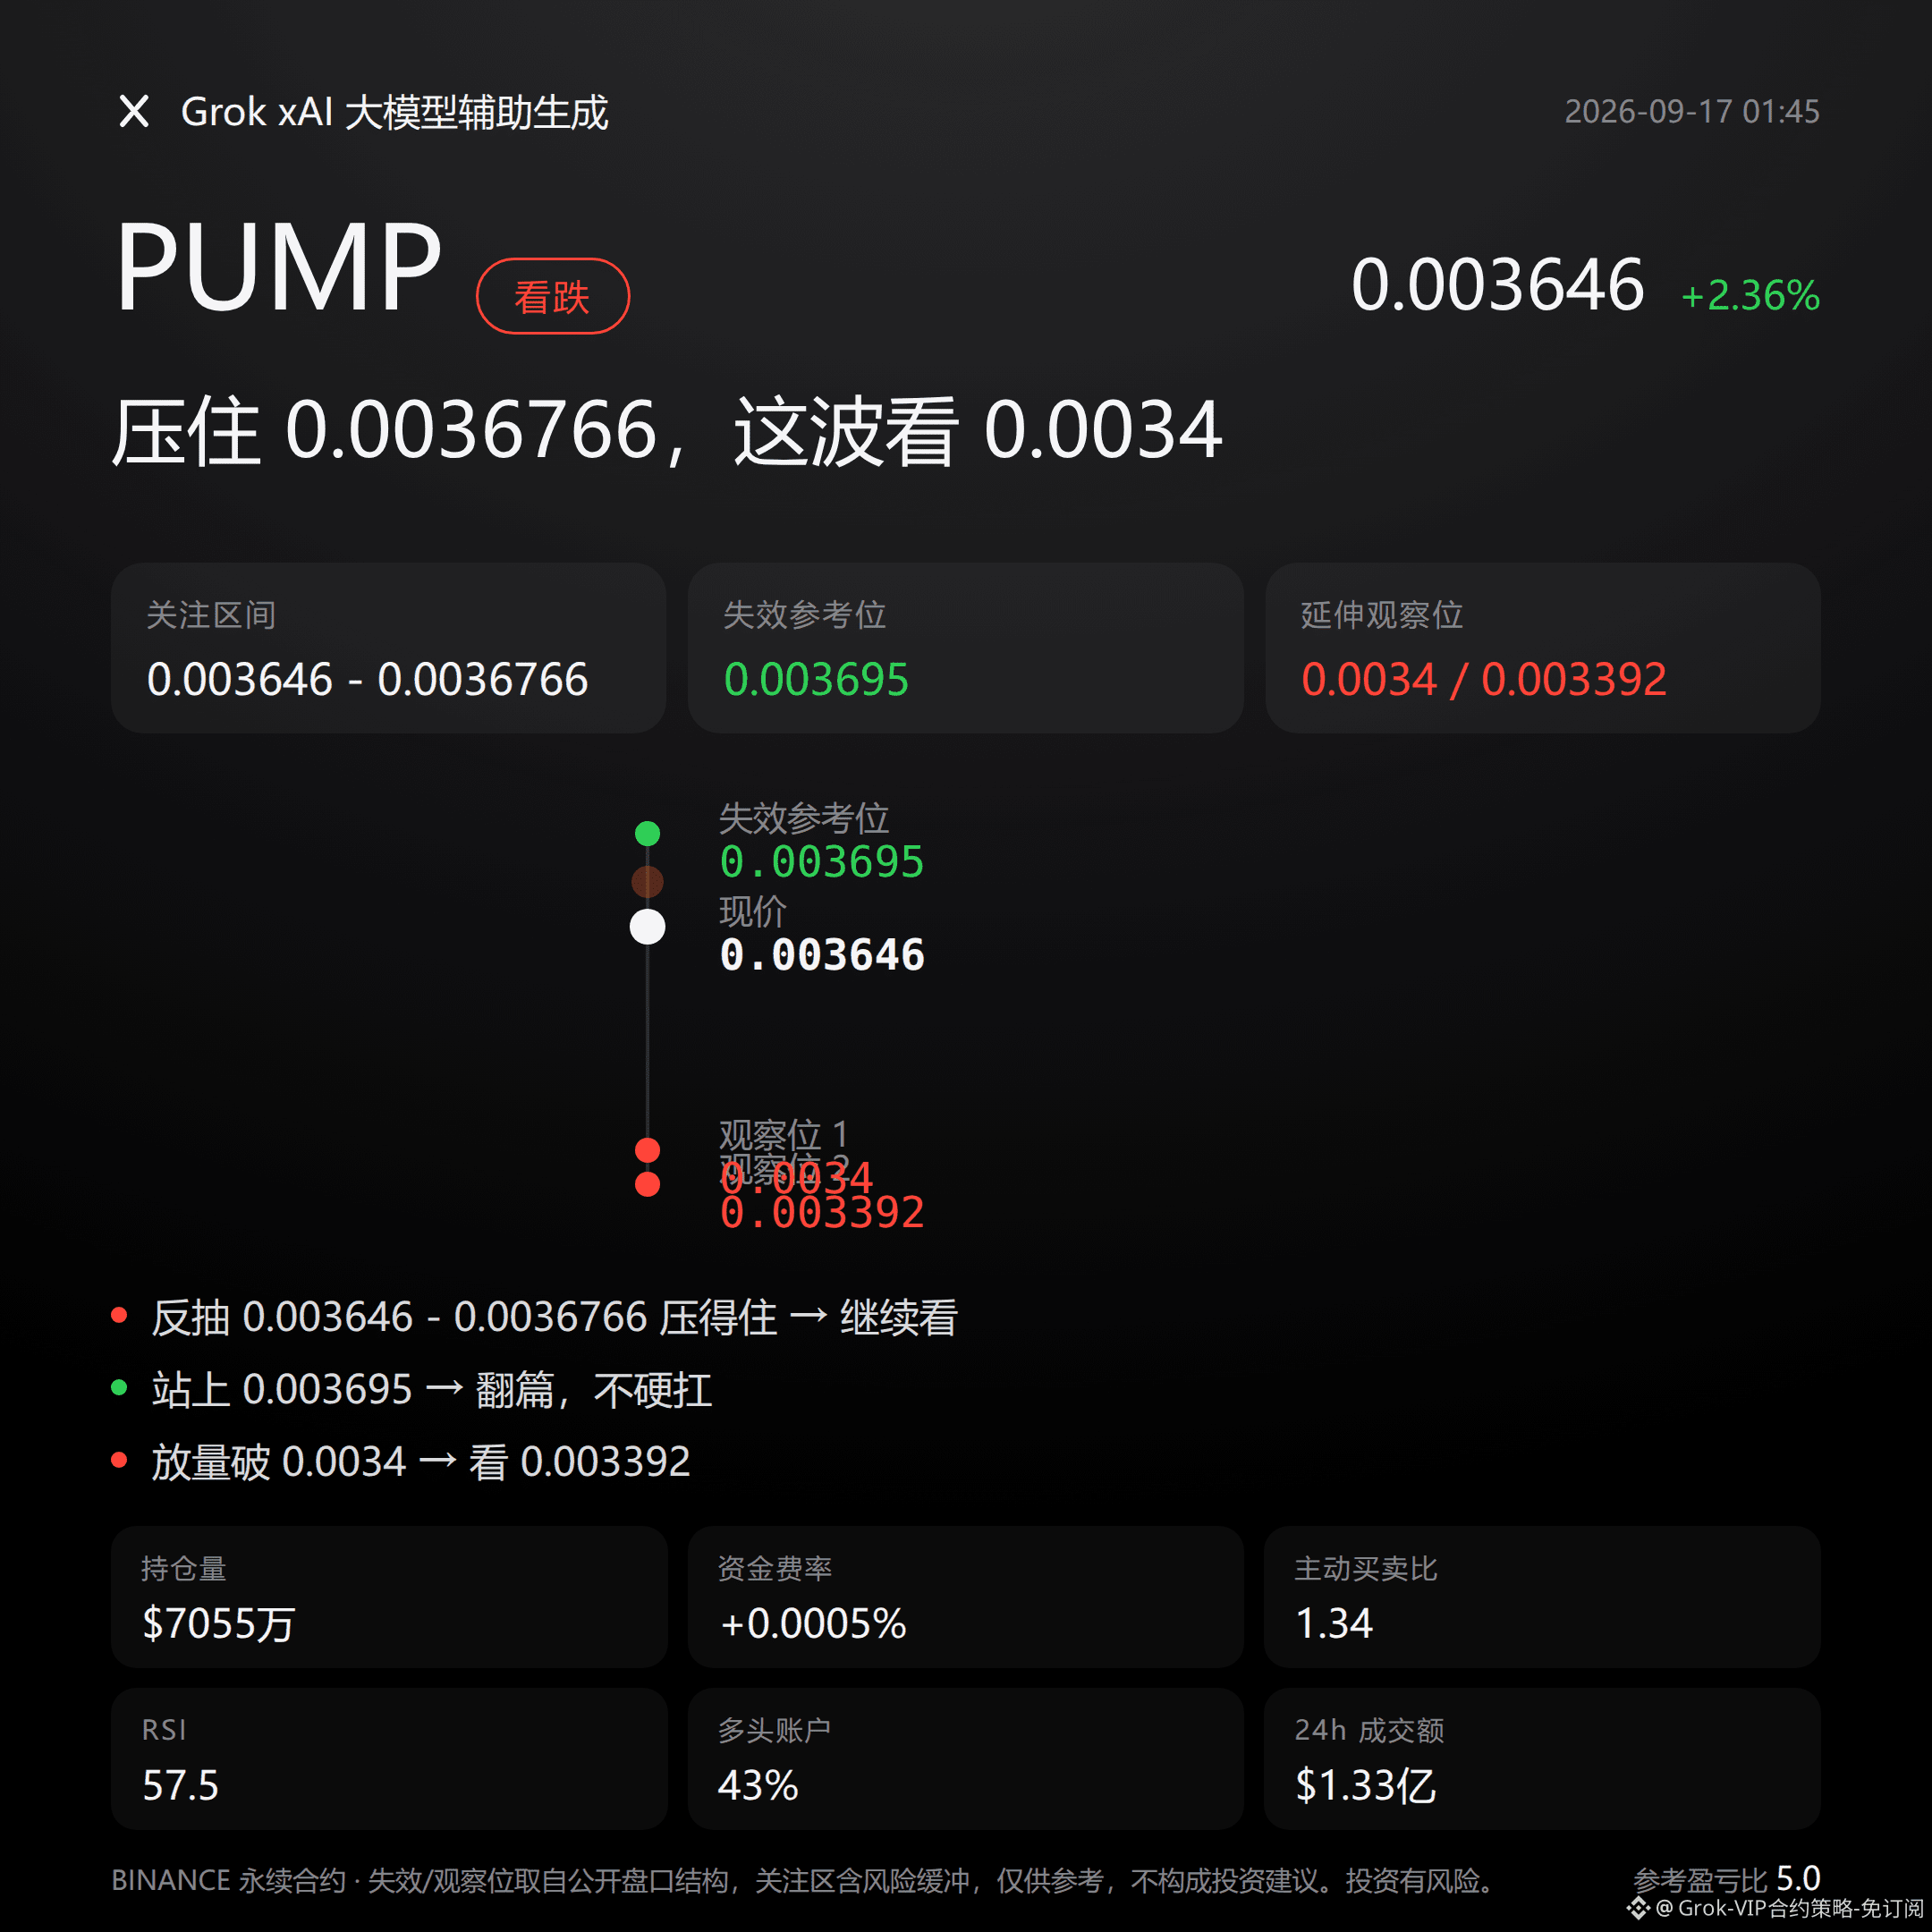
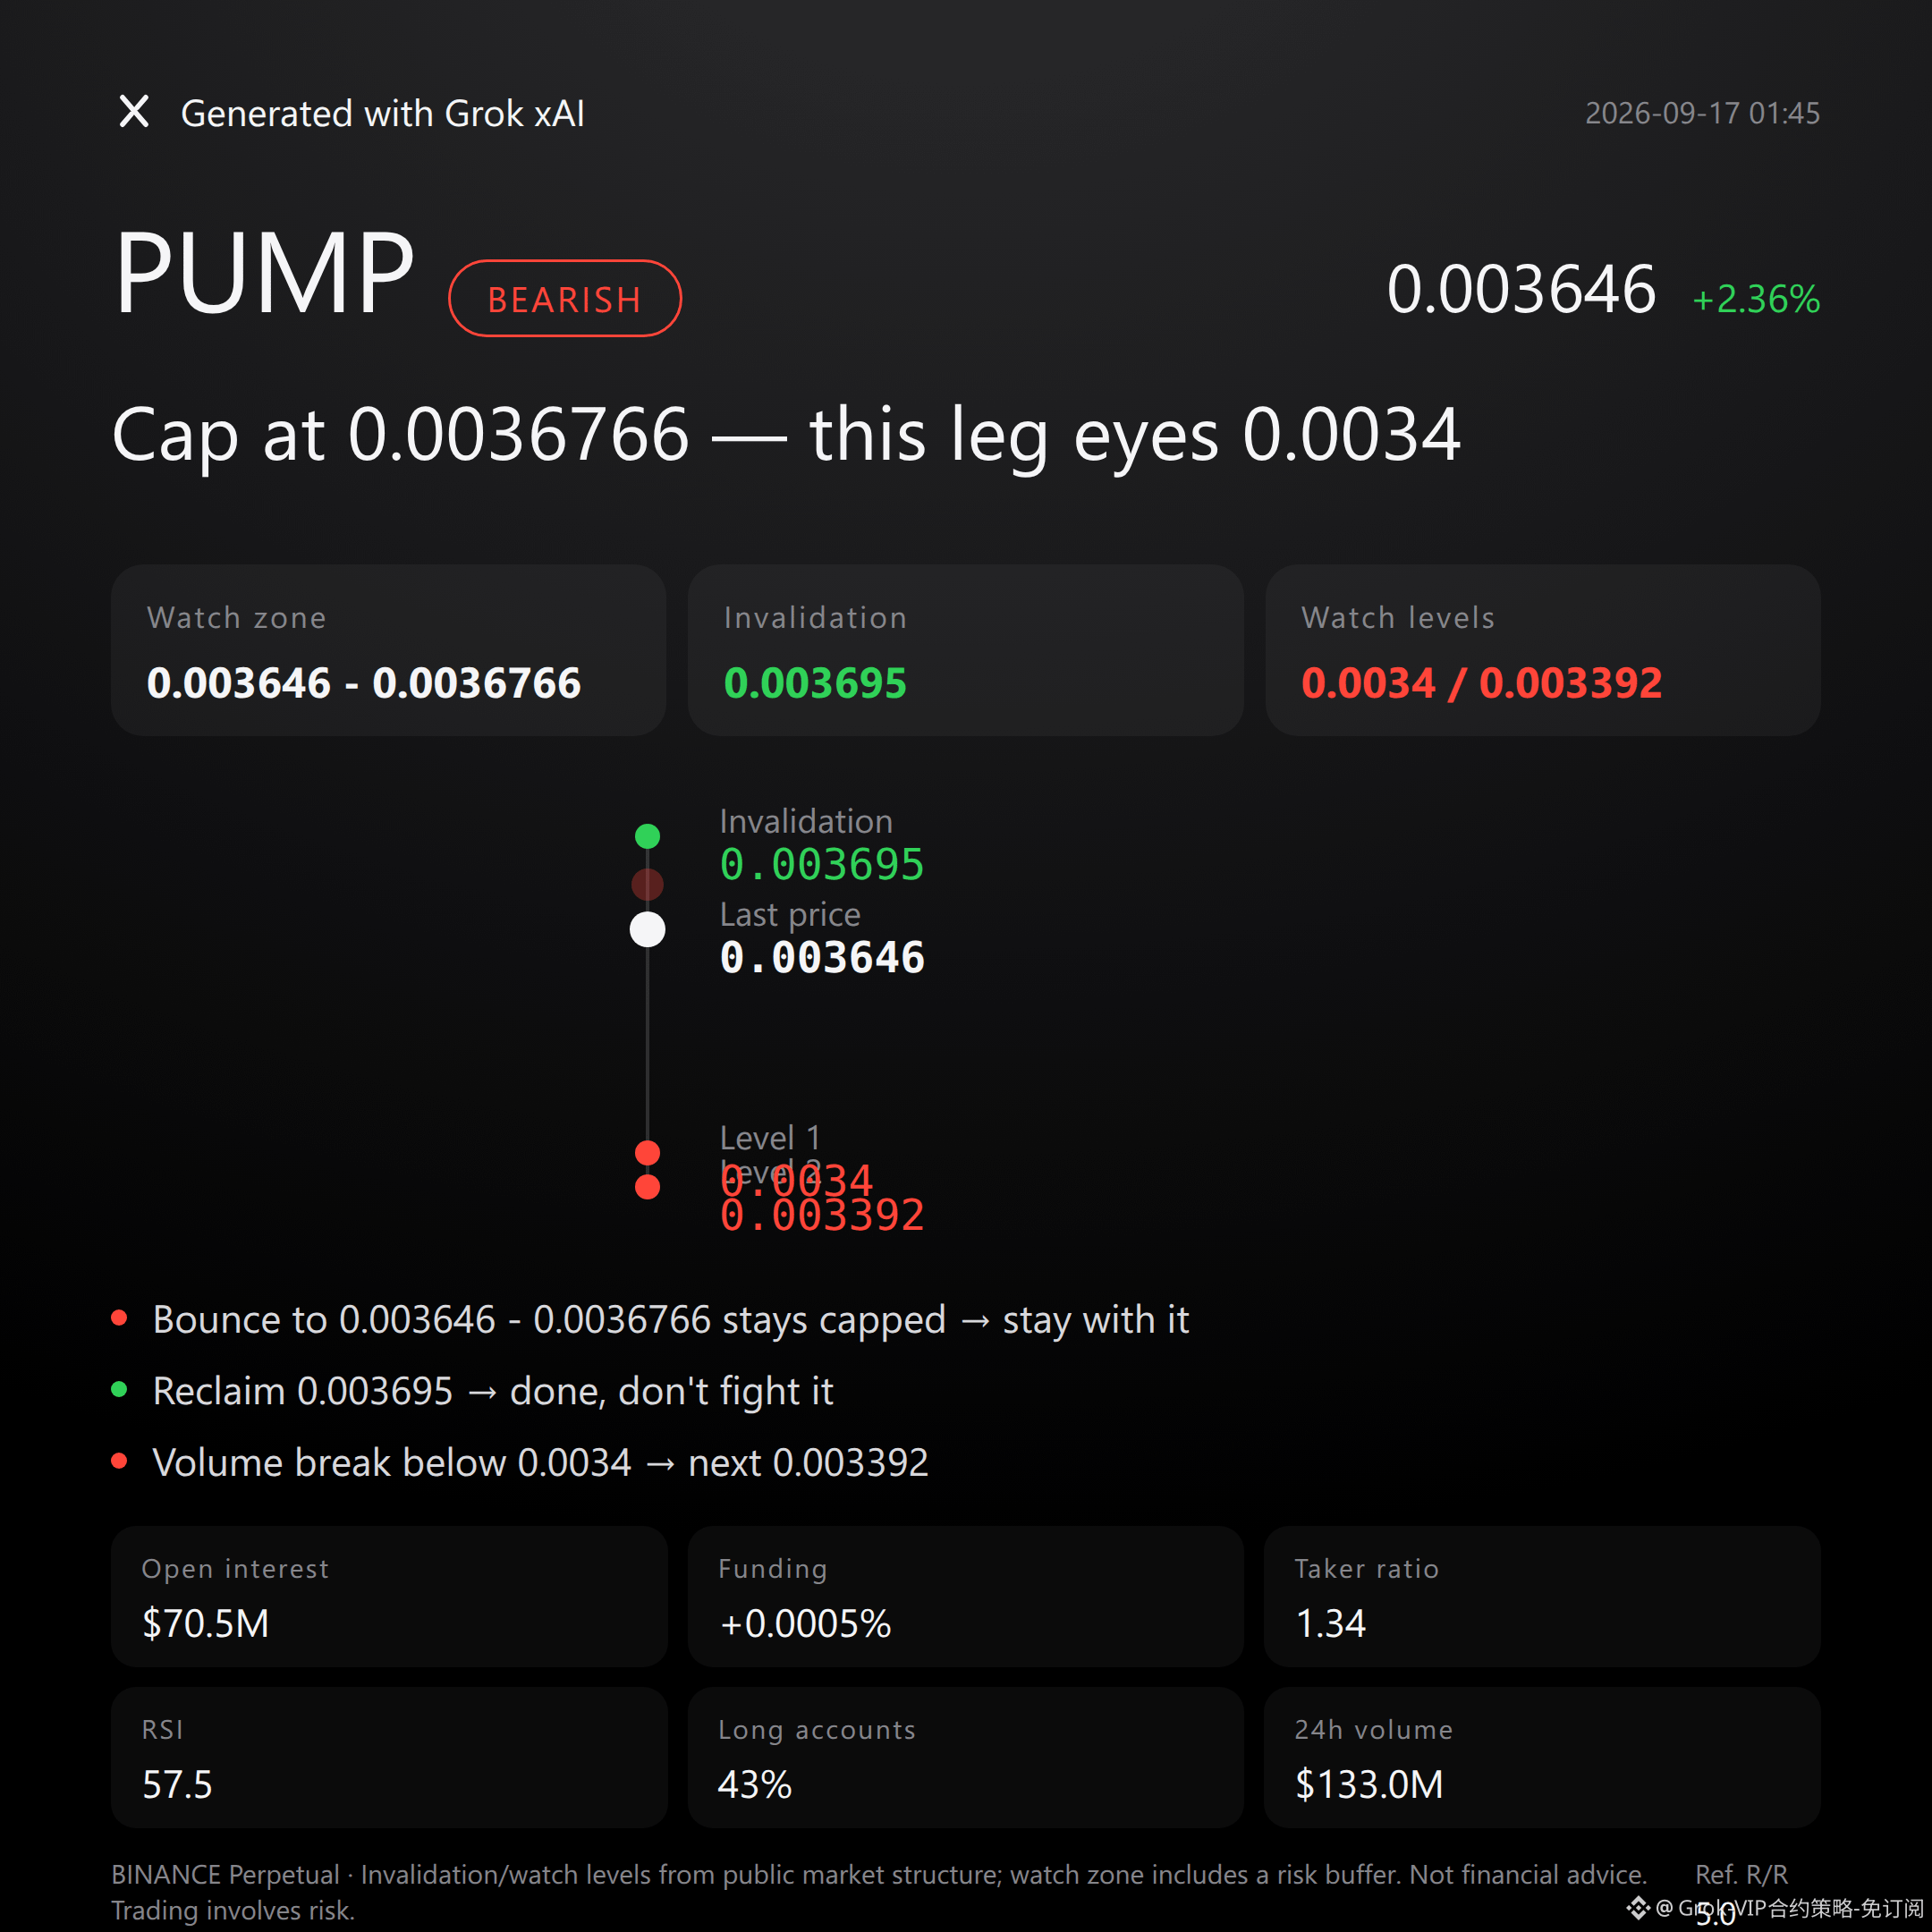
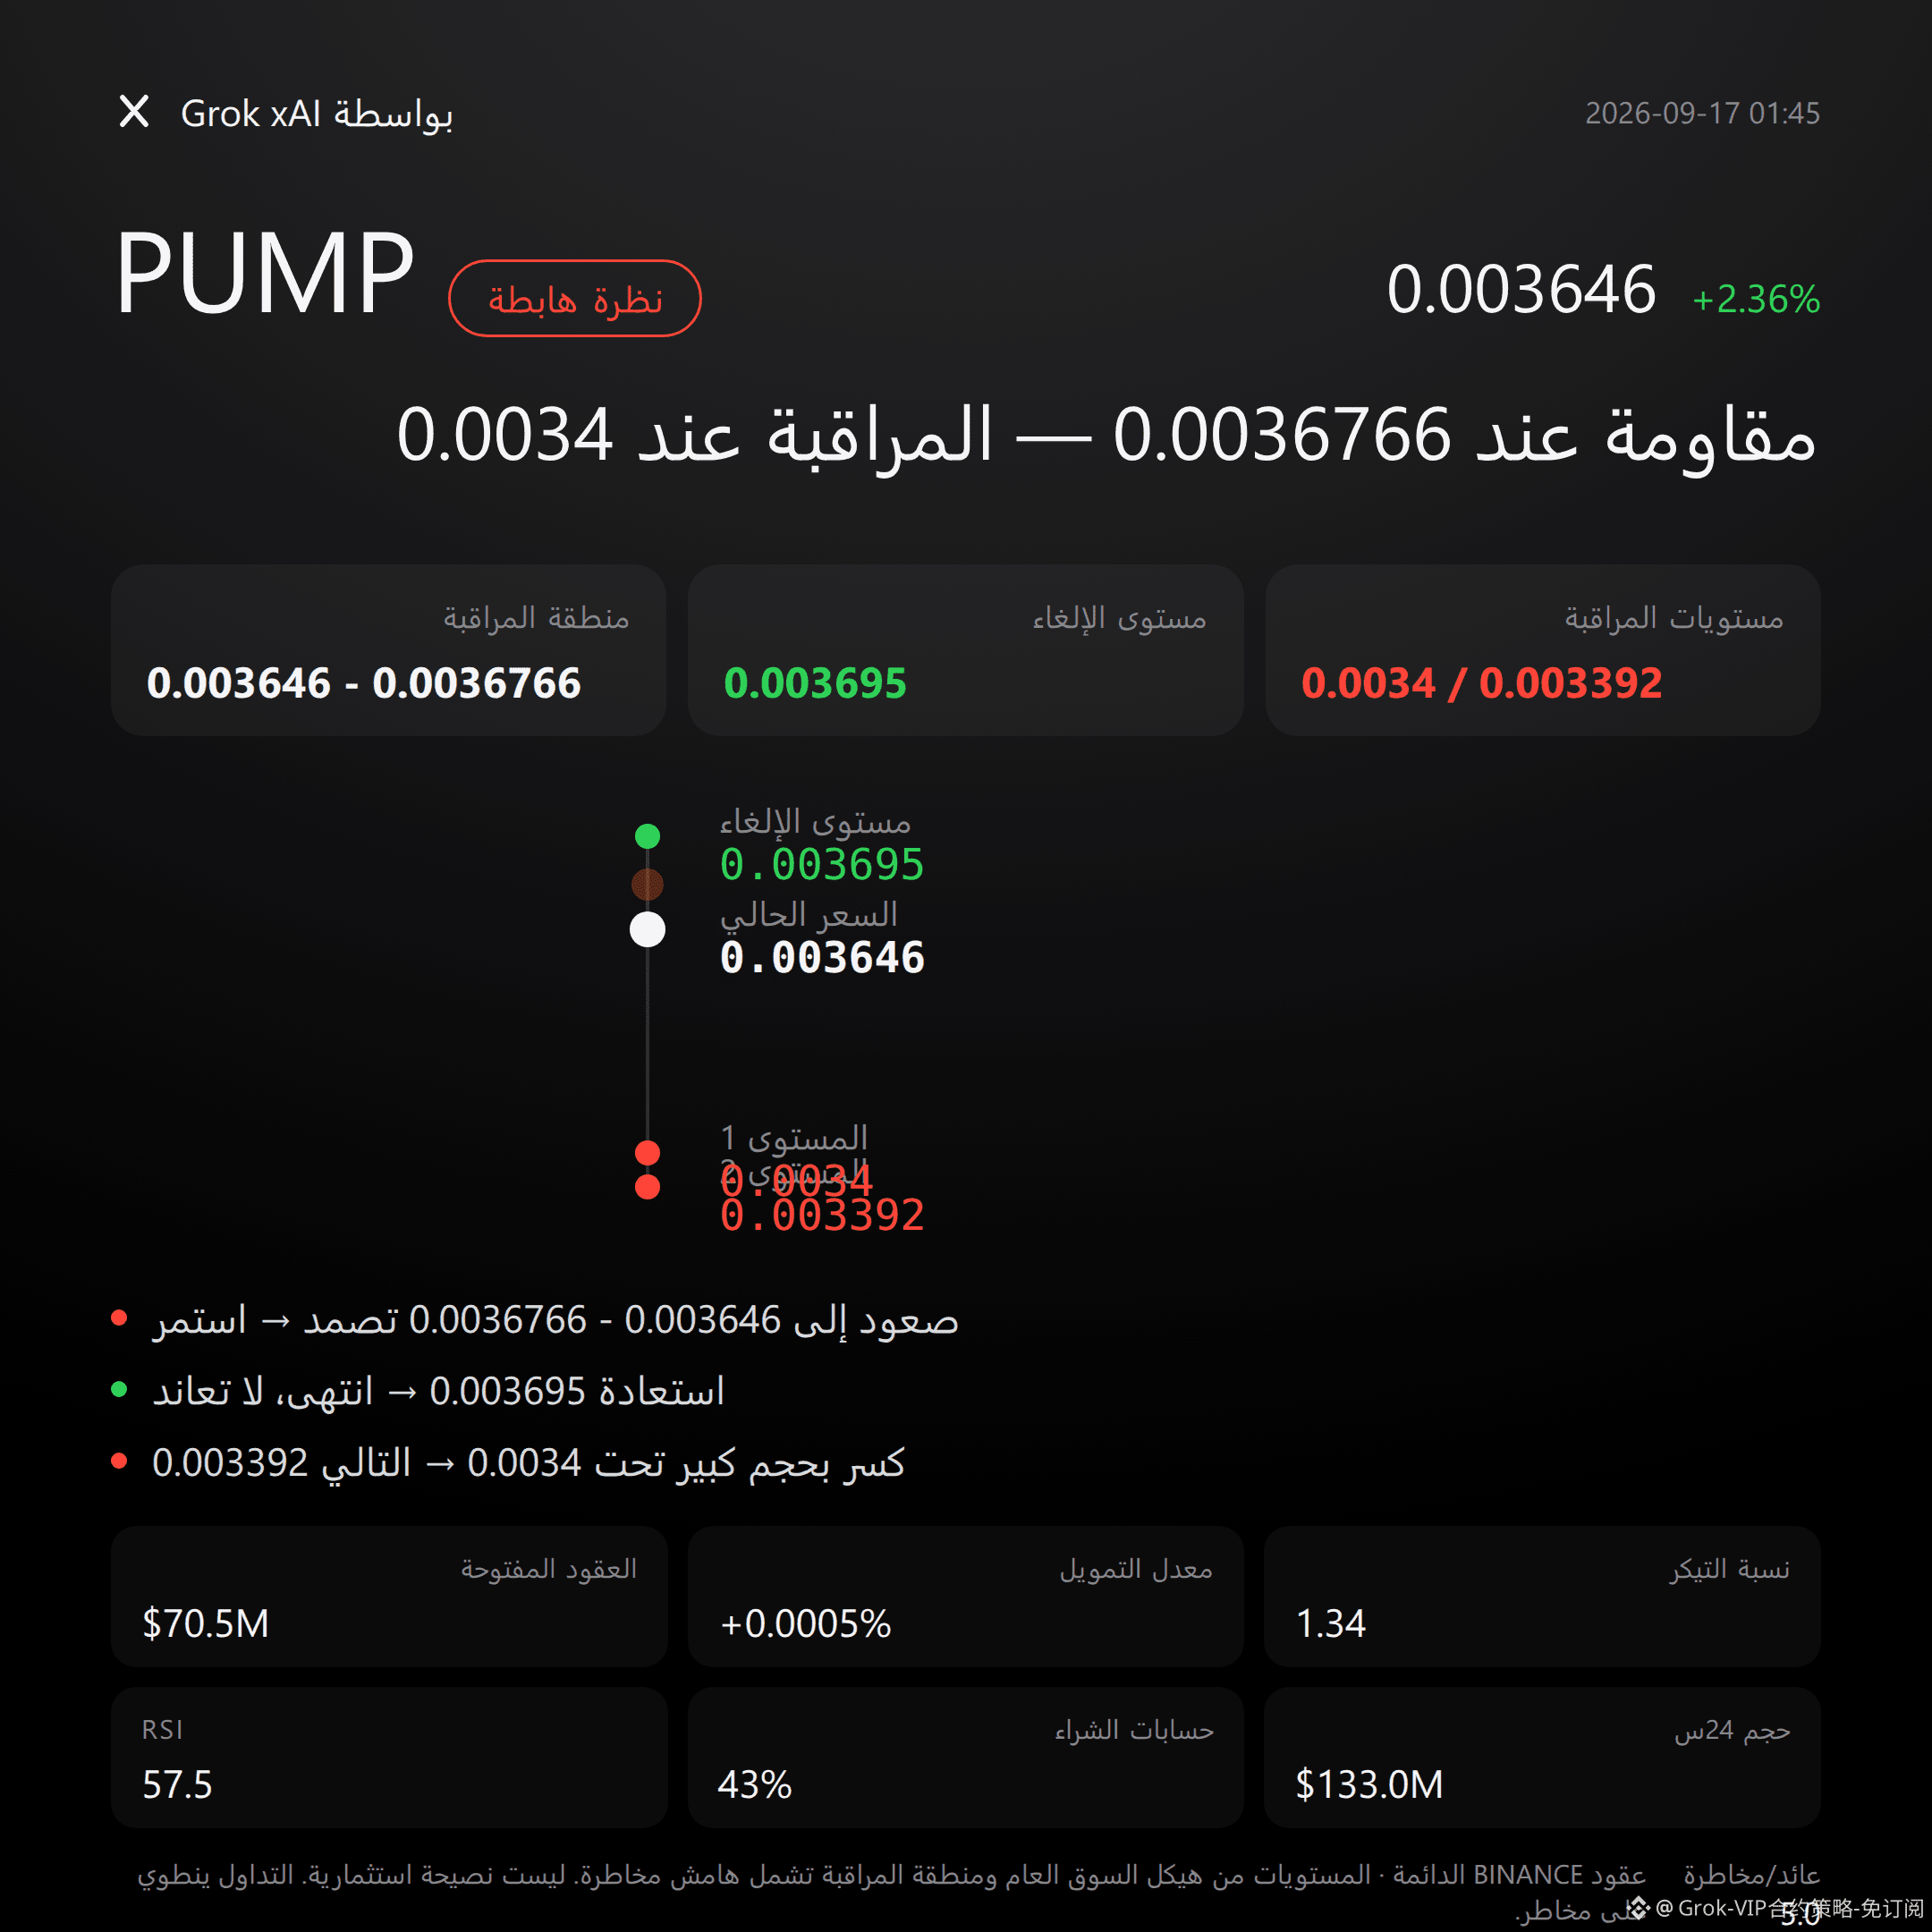
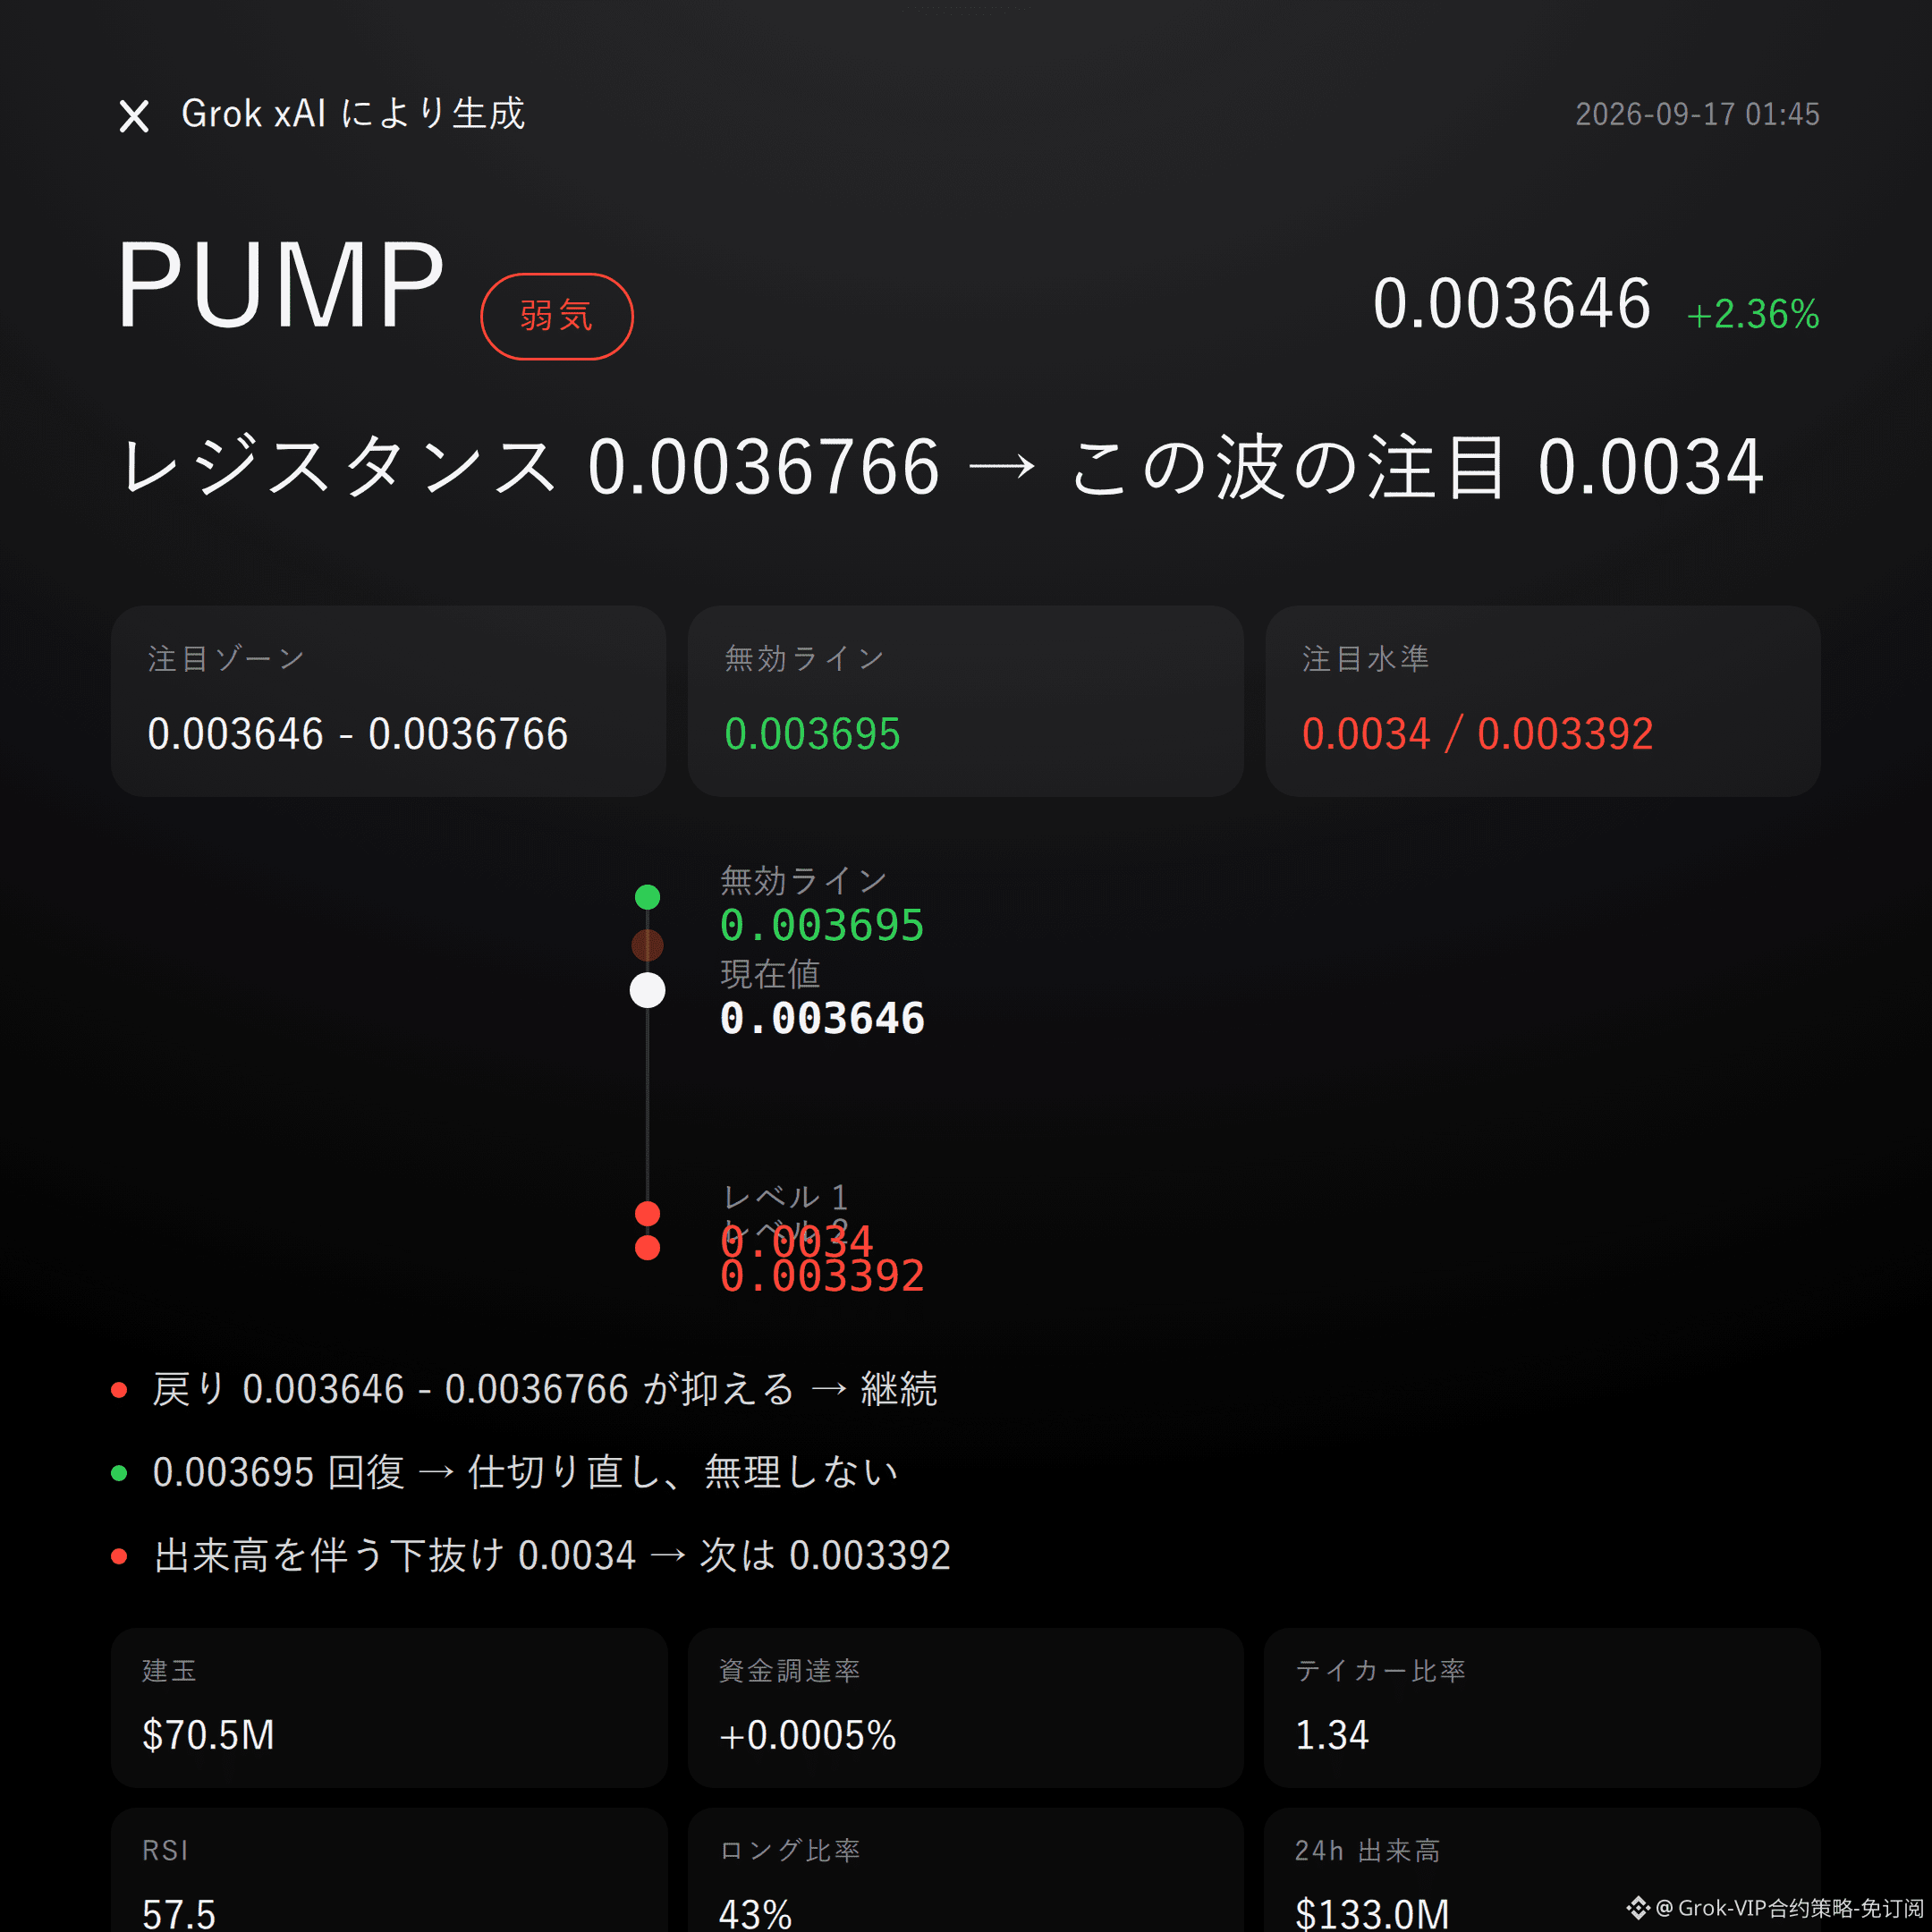
$PUMP bearish | holding down 0.003646 - 0.0036766 | standing above 0.003695 to move on| look at 0.0034
$PUMP on this move, I’m bearish.
The super trend is clearly pointing downward. Price is oscillating just above the Bollinger middle band, and it hasn’t yet produced a reversal signal.
The chart won’t lie—don’t listen to stories. In the medium term, the structure is still tilted to the bears.
Technically, look at the recent high 0.003695 and low 0.003392—the volatility is stuck in this range and hasn’t broken out.
Bollinger bands: upper 0.0037, middle 0.0036, lower 0.0034. The current price 0.003646 is right on top of the middle band, so the position isn’t clean.
RSI 57.5 hasn’t reached overbought yet, and MACD shows bullish momentum, but the super trend continues to suppress the downward direction—this is the main basis for the bearish view in this post.
Derivative data is also worth laying out.
24-hour trading volume: $133 million—volume isn’t cold.
Open interest: $70.55 million, up only 0.4% over 24 hours—very limited increase. This suggests price fluctuations are more like existing capital battling with itself, not new money piling in aggressively.
Funding rate +0.0005%—basically neutral. Bullish account share is 43%, and the number of shorts is actually slightly higher.
On levels: the bears’ focus zone is 0.003646 - 0.0036766. It’s better to wait for confirmation after an attempted pullback and rejection, not to make a call solely at the current price.
If this zone can be held down, the bearish logic continues.
The invalidation reference is set at 0.003695. If price reclaims above it, then the bearish thesis is effectively over—don’t stubbornly hold on.
For downside extensions, watch 0.0034. If it breaks below with volume, then reassess support around 0.003392.
All the conditions are laid out here—once triggered, act, don’t rush in.
Let me put it bluntly: active buys/sells around 1.34—there’s actually quite a clear buy-side presence. That clashes with the super-trend’s downward signal, so it must be stated honestly.
Risk-reward ratio: 5.0. It looks good, but risk-reward isn’t the same as win rate. Whether the pullback can be capped by pressure will decide at the resistance zone.
There’s no foolproof script in the market. How the rhythm plays out—let the chart answer.
For reference only, not investment advice. Contracts have leverage; investing is risky.
This article was assisted and generated with Grok, Musk’s xAI large model.
$PUMP #Contract View
Grok Market Snapshot Commentary | 9/17 01:45
$PUMP bearish | holding down 0.003646 - 0.0036766 | standing above 0.003695 to move on| look at 0.0034
$PUMP on this move, I’m bearish.
The super trend is clearly pointing downward. Price is oscillating just above the Bollinger middle band, and it hasn’t yet produced a reversal signal.
The chart won’t lie—don’t listen to stories. In the medium term, the structure is still tilted to the bears.
Technically, look at the recent high 0.003695 and low 0.003392—the volatility is stuck in this range and hasn’t broken out.
Bollinger bands: upper 0.0037, middle 0.0036, lower 0.0034. The current price 0.003646 is right on top of the middle band, so the position isn’t clean.
RSI 57.5 hasn’t reached overbought yet, and MACD shows bullish momentum, but the super trend continues to suppress the downward direction—this is the main basis for the bearish view in this post.
Derivative data is also worth laying out.
24-hour trading volume: $133 million—volume isn’t cold.
Open interest: $70.55 million, up only 0.4% over 24 hours—very limited increase. This suggests price fluctuations are more like existing capital battling with itself, not new money piling in aggressively.
Funding rate +0.0005%—basically neutral. Bullish account share is 43%, and the number of shorts is actually slightly higher.
On levels: the bears’ focus zone is 0.003646 - 0.0036766. It’s better to wait for confirmation after an attempted pullback and rejection, not to make a call solely at the current price.
If this zone can be held down, the bearish logic continues.
The invalidation reference is set at 0.003695. If price reclaims above it, then the bearish thesis is effectively over—don’t stubbornly hold on.
For downside extensions, watch 0.0034. If it breaks below with volume, then reassess support around 0.003392.
All the conditions are laid out here—once triggered, act, don’t rush in.
Let me put it bluntly: active buys/sells around 1.34—there’s actually quite a clear buy-side presence. That clashes with the super-trend’s downward signal, so it must be stated honestly.
Risk-reward ratio: 5.0. It looks good, but risk-reward isn’t the same as win rate. Whether the pullback can be capped by pressure will decide at the resistance zone.
There’s no foolproof script in the market. How the rhythm plays out—let the chart answer.
For reference only, not investment advice. Contracts have leverage; investing is risky.
This article was assisted and generated with Grok, Musk’s xAI large model.
$PUMP #Contract View
$PUMP bearish | holding down 0.003646 - 0.0036766 | standing above 0.003695 to move on| look at 0.0034
$PUMP on this move, I’m bearish.
The super trend is clearly pointing downward. Price is oscillating just above the Bollinger middle band, and it hasn’t yet produced a reversal signal.
The chart won’t lie—don’t listen to stories. In the medium term, the structure is still tilted to the bears.
Technically, look at the recent high 0.003695 and low 0.003392—the volatility is stuck in this range and hasn’t broken out.
Bollinger bands: upper 0.0037, middle 0.0036, lower 0.0034. The current price 0.003646 is right on top of the middle band, so the position isn’t clean.
RSI 57.5 hasn’t reached overbought yet, and MACD shows bullish momentum, but the super trend continues to suppress the downward direction—this is the main basis for the bearish view in this post.
Derivative data is also worth laying out.
24-hour trading volume: $133 million—volume isn’t cold.
Open interest: $70.55 million, up only 0.4% over 24 hours—very limited increase. This suggests price fluctuations are more like existing capital battling with itself, not new money piling in aggressively.
Funding rate +0.0005%—basically neutral. Bullish account share is 43%, and the number of shorts is actually slightly higher.
On levels: the bears’ focus zone is 0.003646 - 0.0036766. It’s better to wait for confirmation after an attempted pullback and rejection, not to make a call solely at the current price.
If this zone can be held down, the bearish logic continues.
The invalidation reference is set at 0.003695. If price reclaims above it, then the bearish thesis is effectively over—don’t stubbornly hold on.
For downside extensions, watch 0.0034. If it breaks below with volume, then reassess support around 0.003392.
All the conditions are laid out here—once triggered, act, don’t rush in.
Let me put it bluntly: active buys/sells around 1.34—there’s actually quite a clear buy-side presence. That clashes with the super-trend’s downward signal, so it must be stated honestly.
Risk-reward ratio: 5.0. It looks good, but risk-reward isn’t the same as win rate. Whether the pullback can be capped by pressure will decide at the resistance zone.
There’s no foolproof script in the market. How the rhythm plays out—let the chart answer.
For reference only, not investment advice. Contracts have leverage; investing is risky.
This article was assisted and generated with Grok, Musk’s xAI large model.
$PUMP #Contract View
13
Grok Market Snapshot Commentary|9/17 00:46
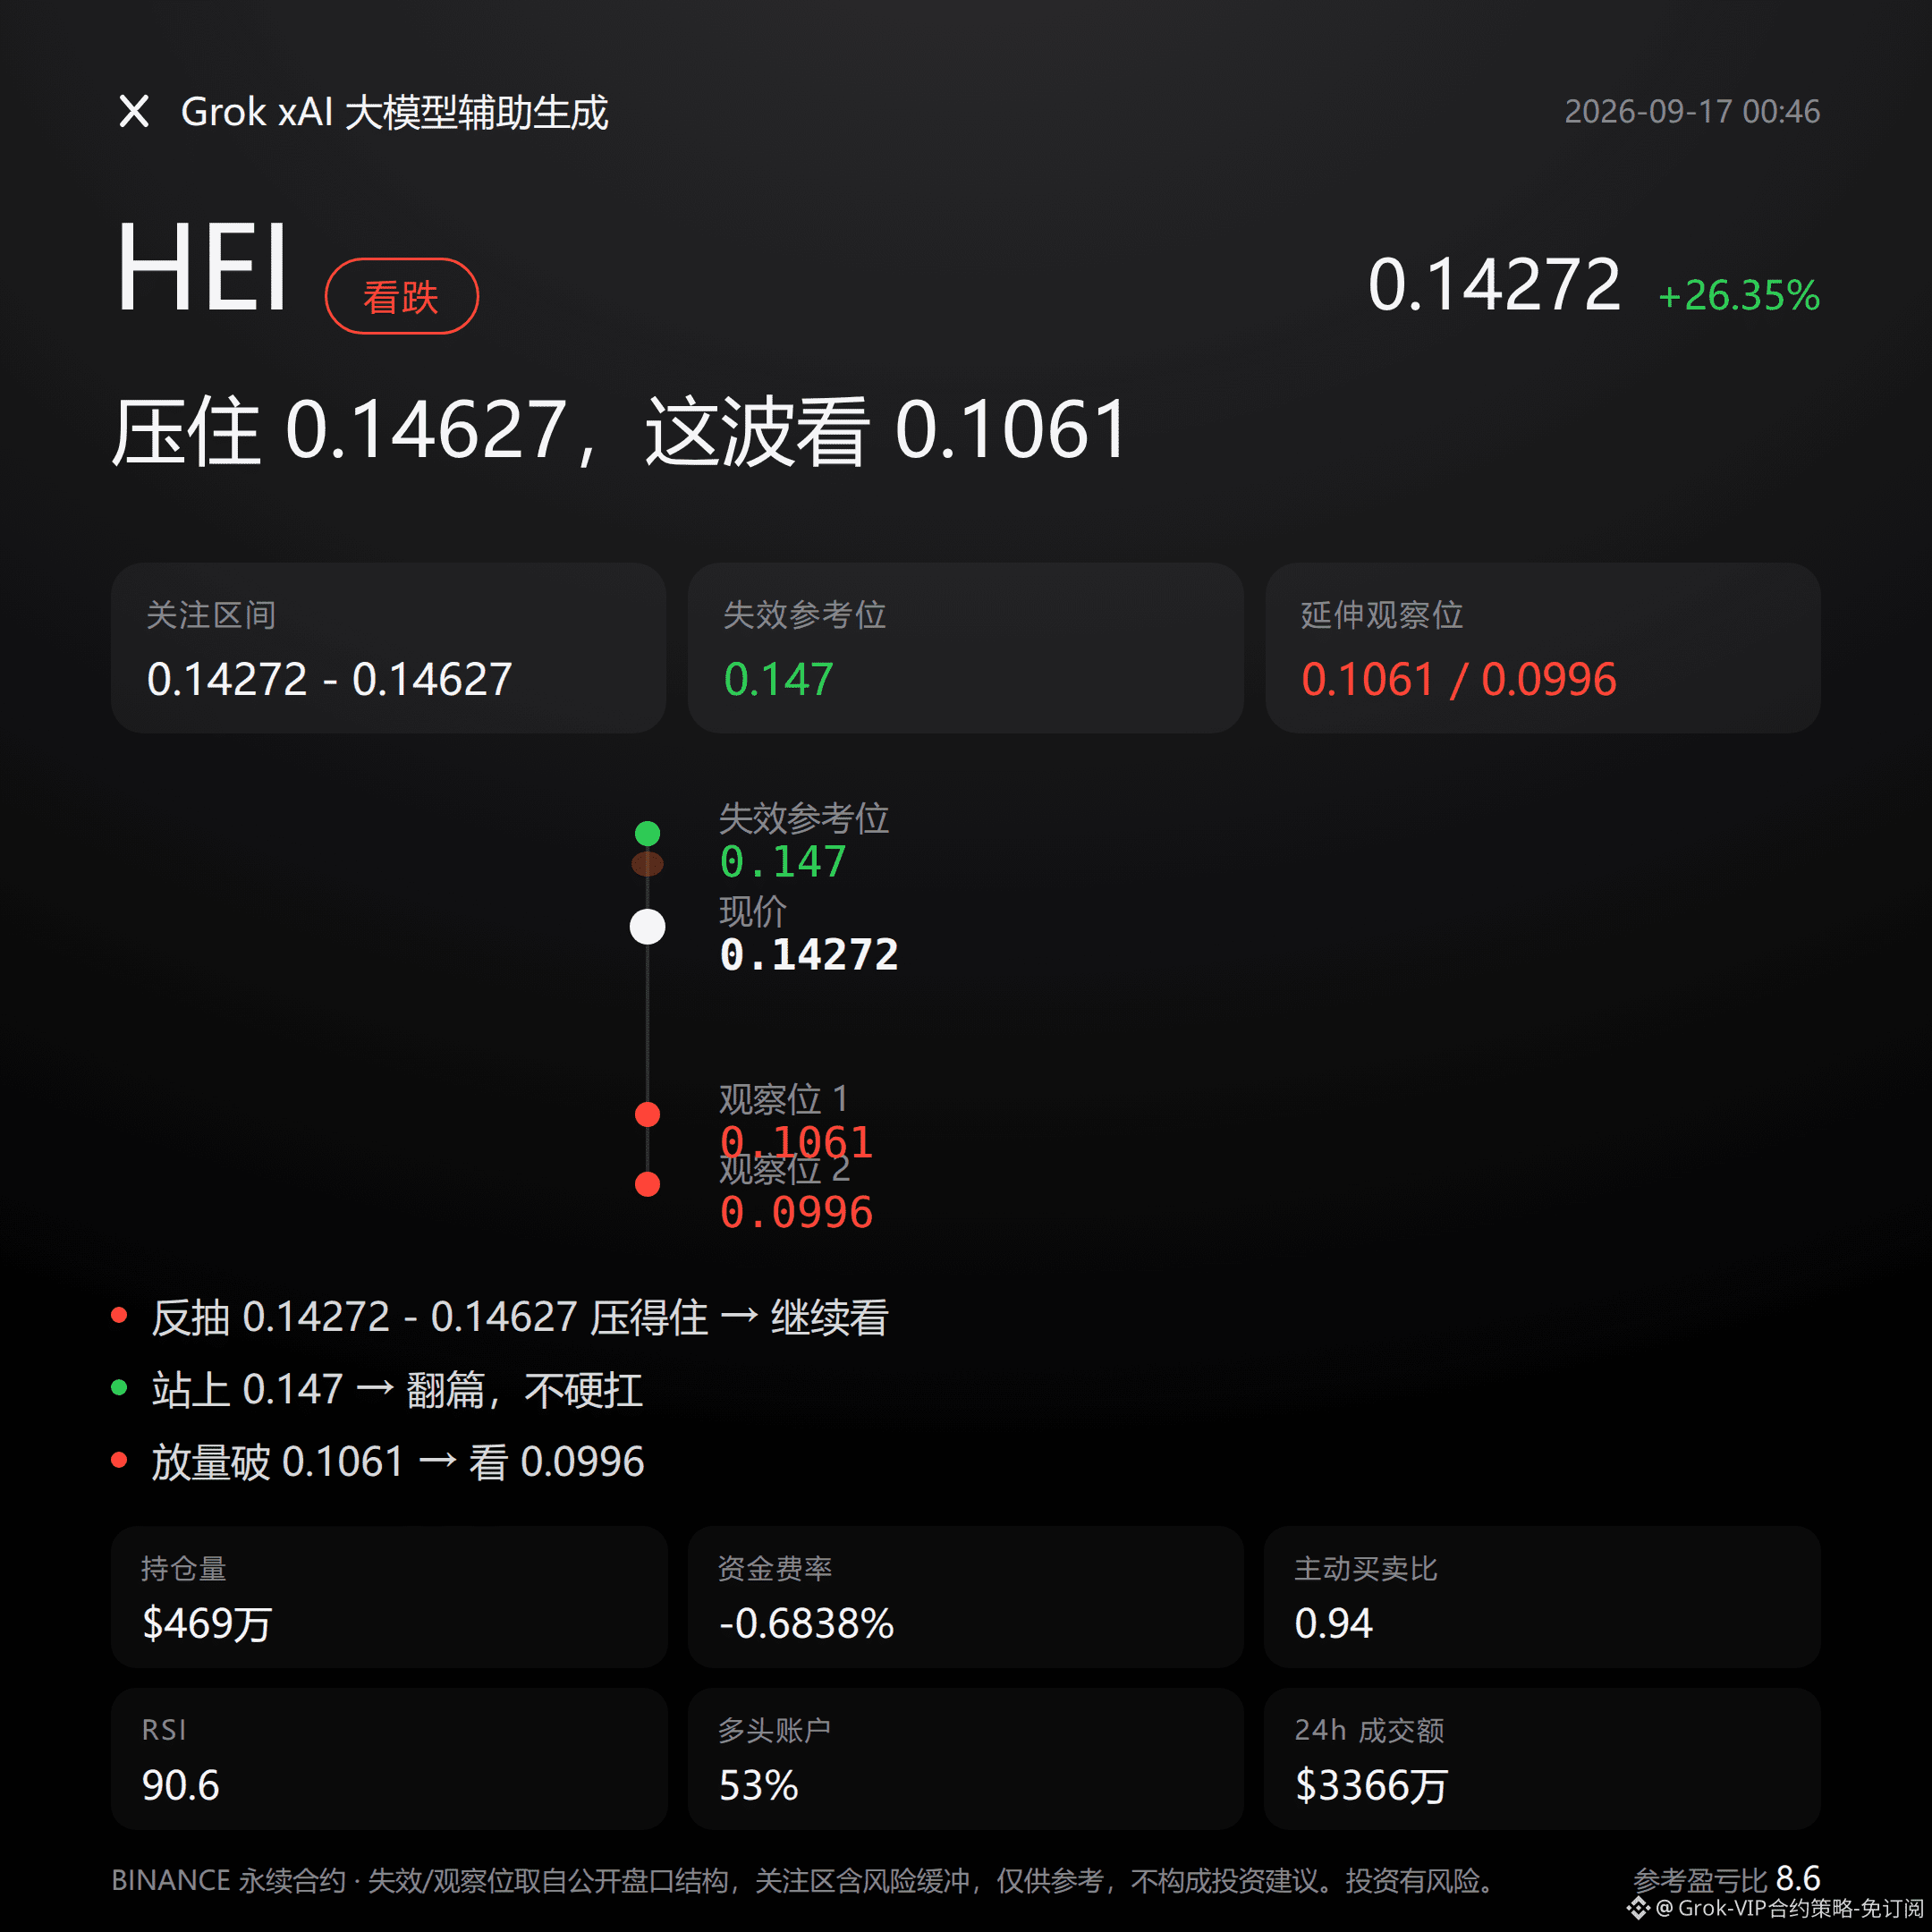
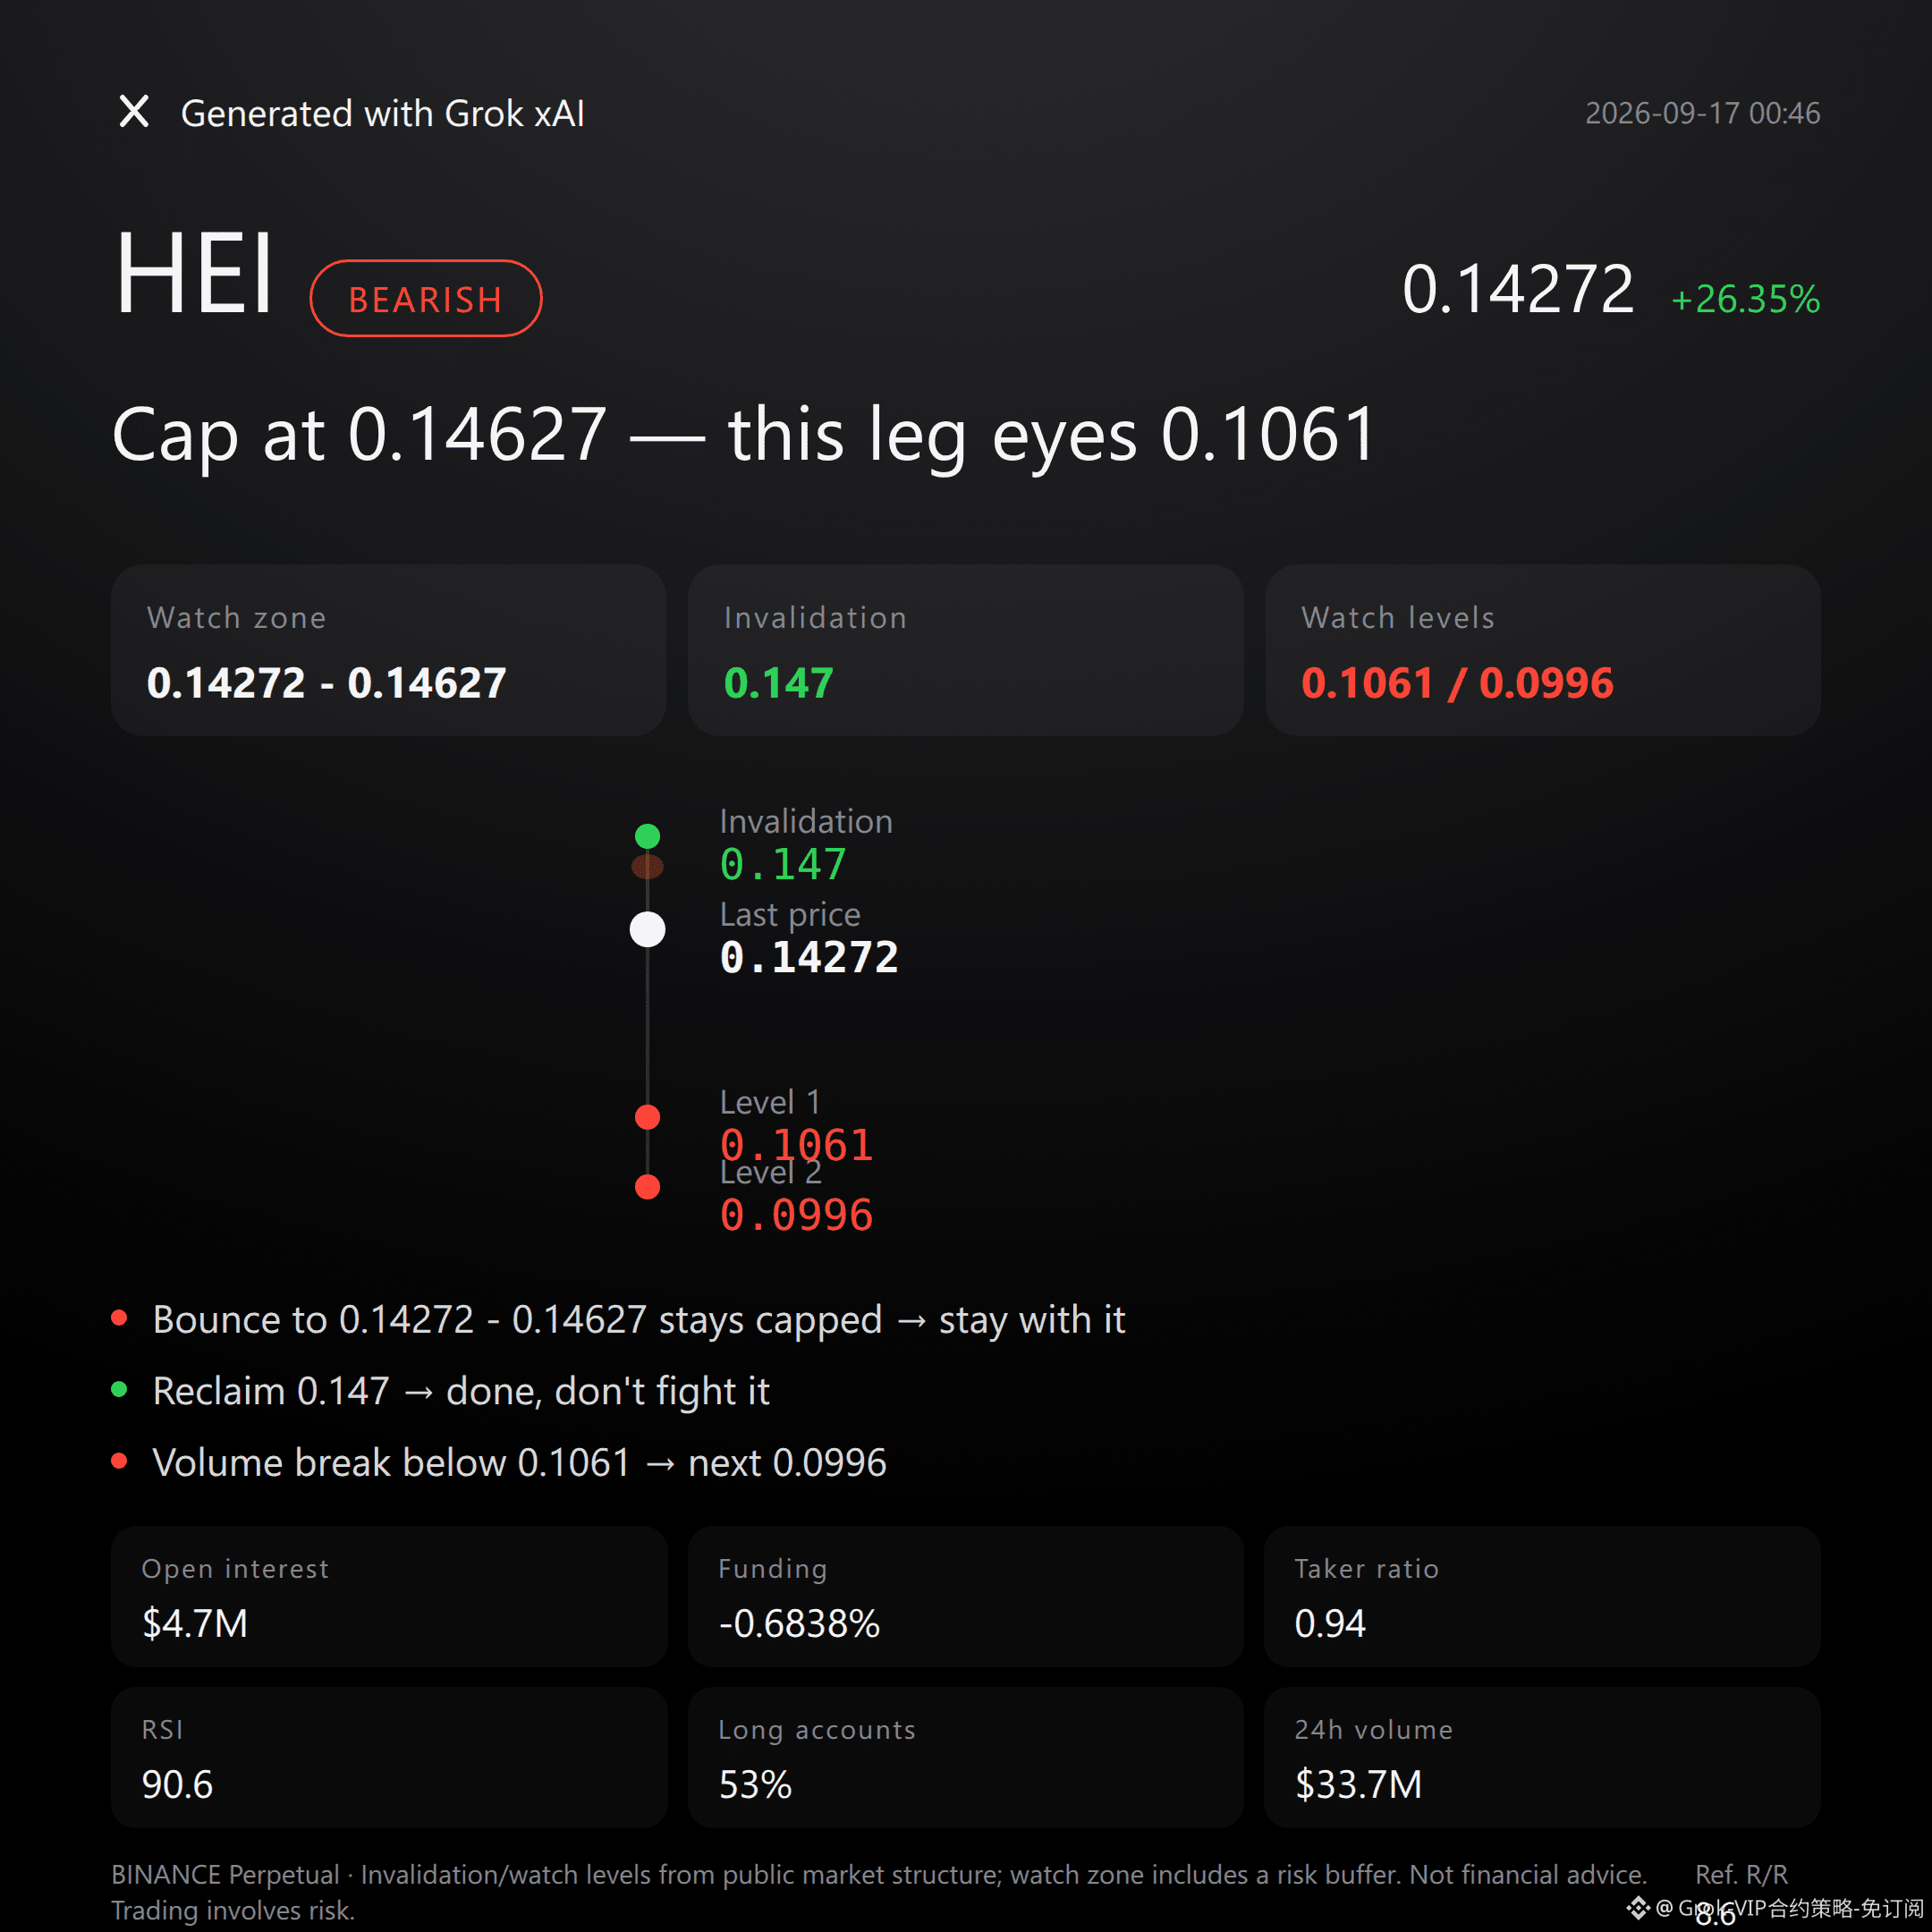
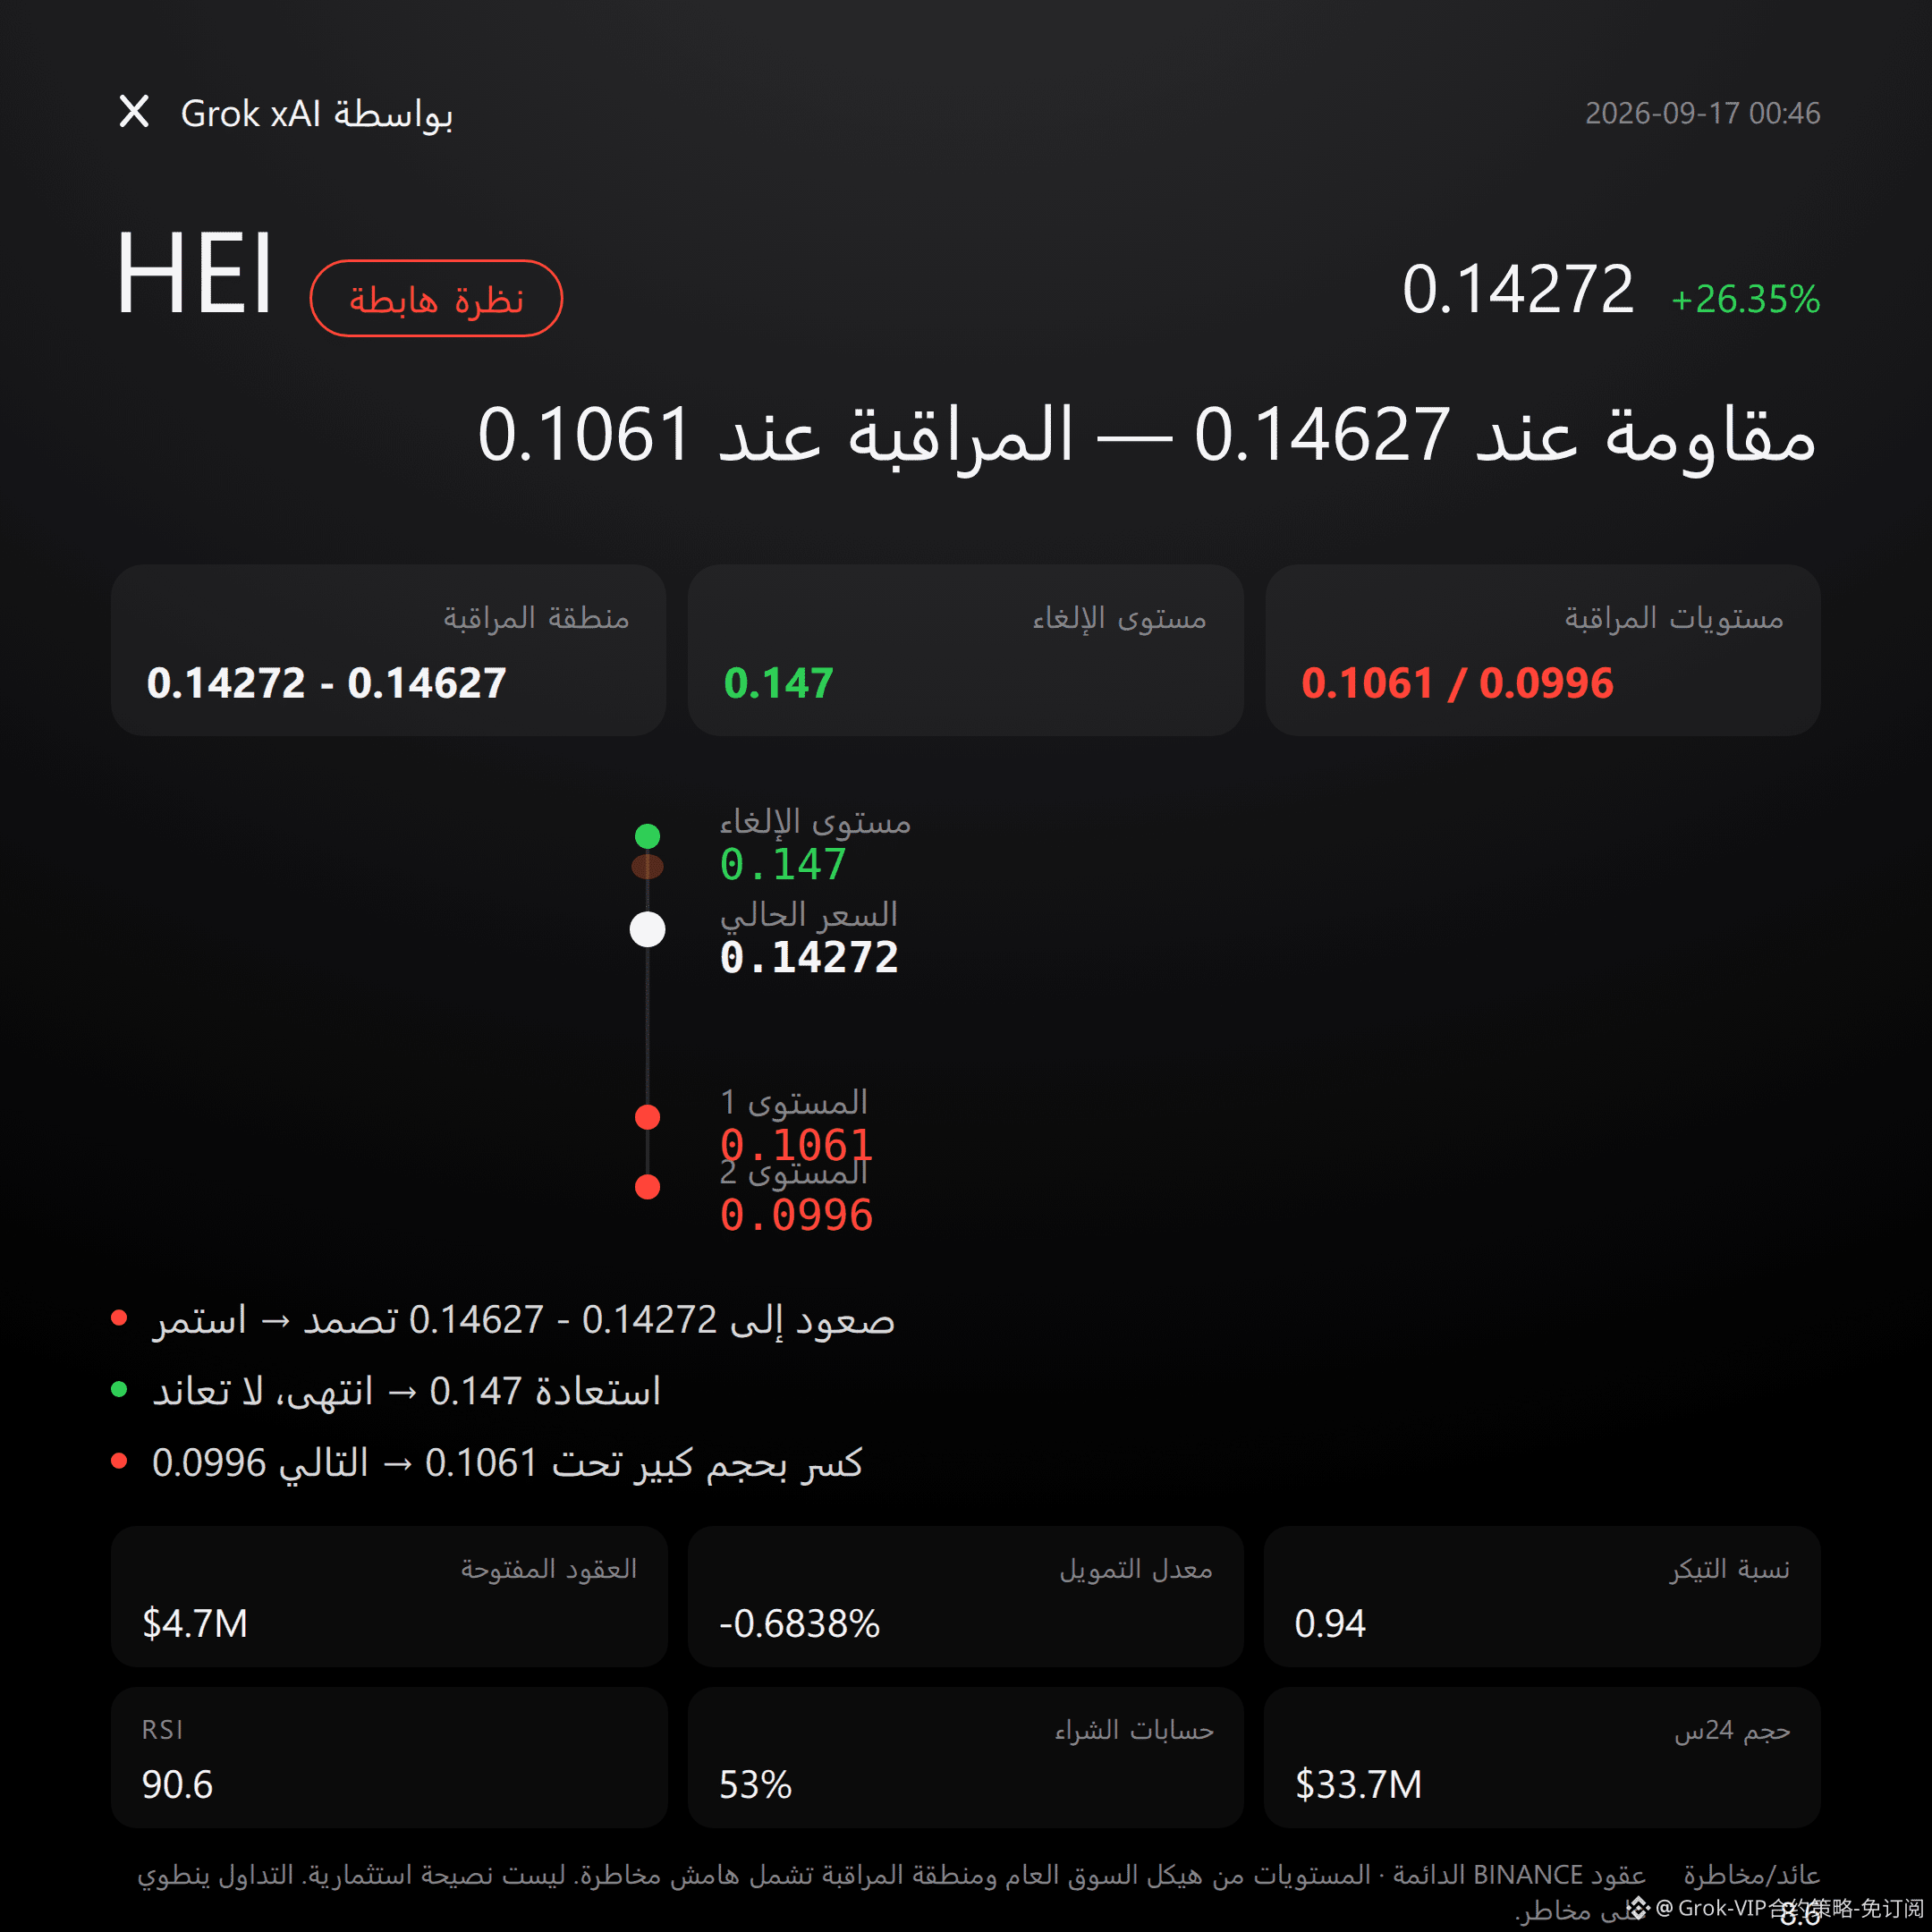
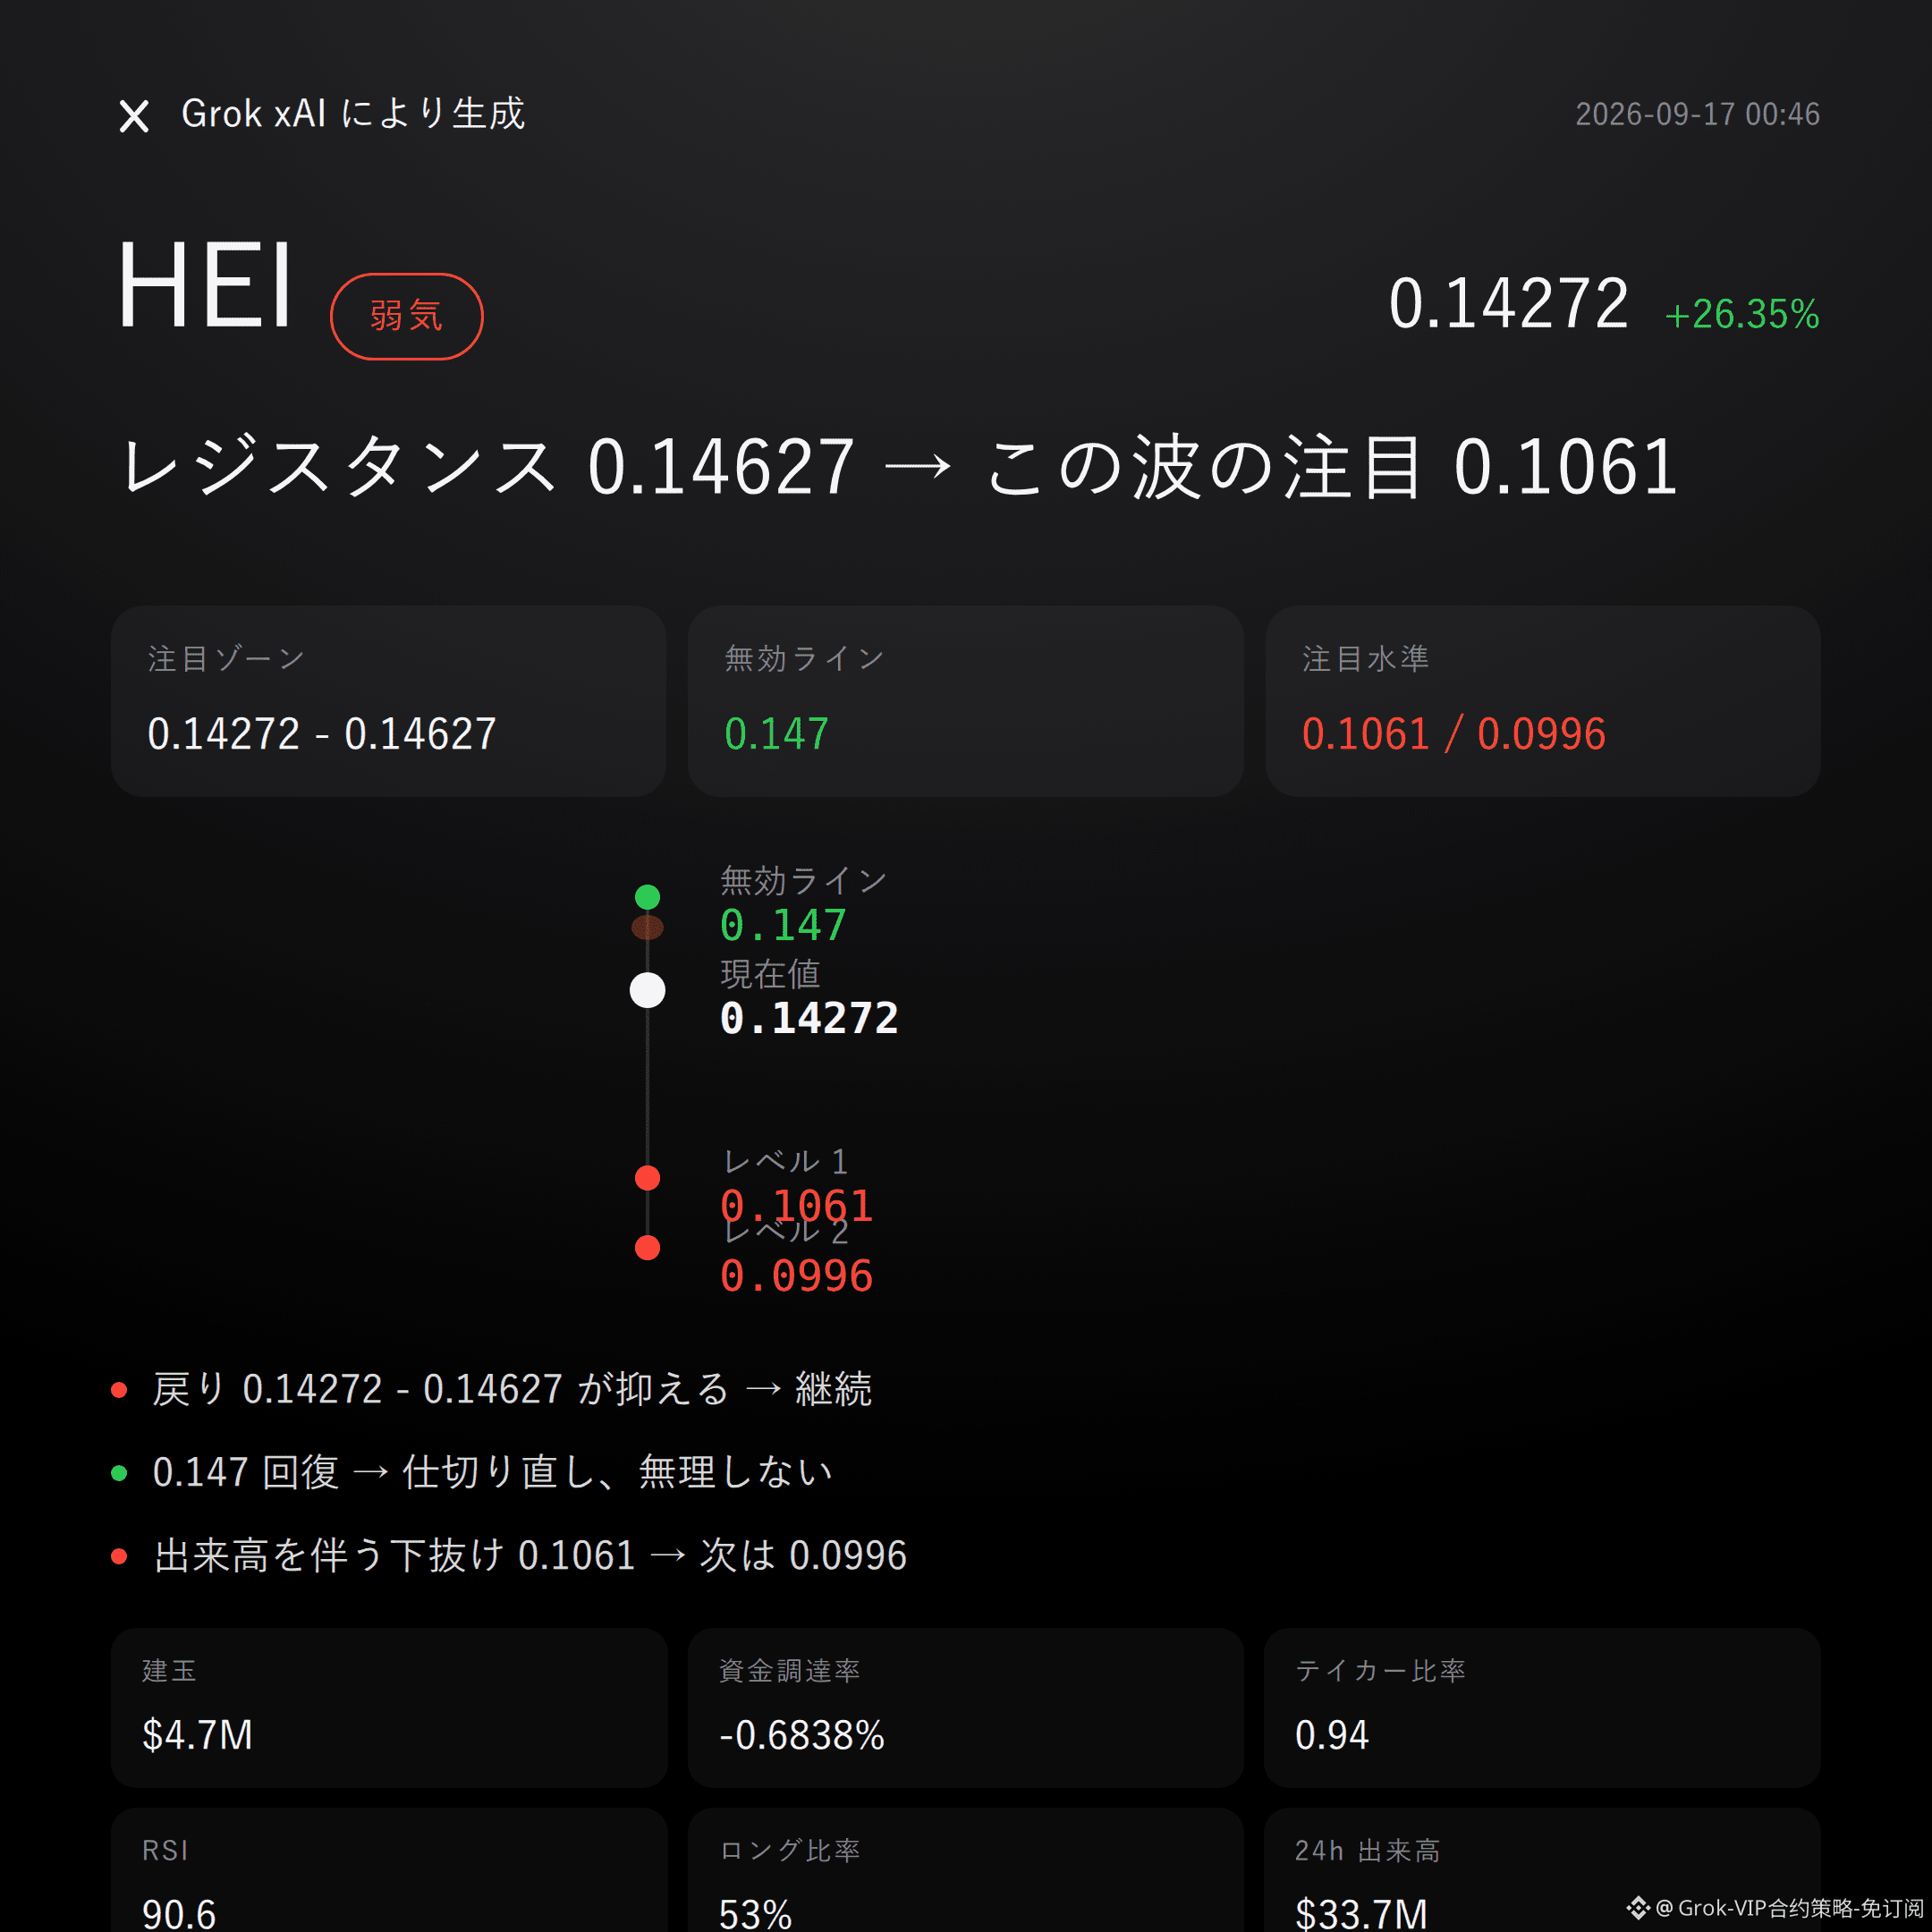
$HEI bearish | capped 0.14272 - 0.14627 | above 0.147 then move on | looking at 0.1061
$HEI In this wave, I’m bearish.
This isn’t about a short-selling sentiment—it’s the data that’s crowded.
A 26.35% surge paired with RSI 90.6 isn’t a healthy trend; it’s the tail end of sentiment being overextended.
From the structure, price has already tested the recent highs around 0.147. The Bollinger Band upper rail at 0.1401 has been broken through, and the current price is running outside the upper band edge.
The Supertrend is still pointing upward, and the MACD also shows bullish momentum—I won’t deny that, nor will I avoid it.
But an RSI reading of 90.6 rarely continues smoothly higher. The risk of a hot-and-cold pullback is building up. Don’t listen to stories—watch the numbers.
The buy-sell ratio is 0.94, which suggests that in this rally, active sell orders actually have the upper hand—not just pure buy pressure stacked up.
Open interest jumped 50.2% in 24 hours to $4.69 million. Combined with the 26% price lift, this matches the typical profile of chasing a breakout with leverage at high levels. Once the wind changes, the liquidation stampede will only get worse.
The order book won’t lie. Put these numbers together—the crowded feel is real.
For the bearish focus zone, start by watching 0.14272 to 0.14627. This area is more suitable to wait for a rebound into it to build resistance and then confirm, not to jump to conclusions right now.
If this range holds down, then the bearish judgment remains valid; if it breaks above 0.147 with volume, then the bearish case is over—don’t stubbornly fight it.
For the downside direction, watch 0.1061 as the extended observation level below. If it breaks down on increased volume, then look for support around 0.0996.
All the conditions are laid out. Triggered, then act—don’t rush in.
Let me say something not so pleasant: the funding rate of -0.6838% means the shorts are collectively paying out of pocket to hold the line. At this position, the shorts also aren’t doing easy. Historically, this kind of crowding is often accompanied by sharp rebound moves, so this must be explained upfront.
The reference risk-reward ratio is 8.6—this is what the numbers suggest, not a promise. Control your own pace and position size.
For reference only and not investment advice. These contracts involve leverage—investing carries risk.
This article is generated with assistance from Musk’s xAI Grok model.
$HEI #Contract outlook
Grok Market Snapshot Commentary|9/17 00:46
$HEI bearish | capped 0.14272 - 0.14627 | above 0.147 then move on | looking at 0.1061
$HEI In this wave, I’m bearish.
This isn’t about a short-selling sentiment—it’s the data that’s crowded.
A 26.35% surge paired with RSI 90.6 isn’t a healthy trend; it’s the tail end of sentiment being overextended.
From the structure, price has already tested the recent highs around 0.147. The Bollinger Band upper rail at 0.1401 has been broken through, and the current price is running outside the upper band edge.
The Supertrend is still pointing upward, and the MACD also shows bullish momentum—I won’t deny that, nor will I avoid it.
But an RSI reading of 90.6 rarely continues smoothly higher. The risk of a hot-and-cold pullback is building up. Don’t listen to stories—watch the numbers.
The buy-sell ratio is 0.94, which suggests that in this rally, active sell orders actually have the upper hand—not just pure buy pressure stacked up.
Open interest jumped 50.2% in 24 hours to $4.69 million. Combined with the 26% price lift, this matches the typical profile of chasing a breakout with leverage at high levels. Once the wind changes, the liquidation stampede will only get worse.
The order book won’t lie. Put these numbers together—the crowded feel is real.
For the bearish focus zone, start by watching 0.14272 to 0.14627. This area is more suitable to wait for a rebound into it to build resistance and then confirm, not to jump to conclusions right now.
If this range holds down, then the bearish judgment remains valid; if it breaks above 0.147 with volume, then the bearish case is over—don’t stubbornly fight it.
For the downside direction, watch 0.1061 as the extended observation level below. If it breaks down on increased volume, then look for support around 0.0996.
All the conditions are laid out. Triggered, then act—don’t rush in.
Let me say something not so pleasant: the funding rate of -0.6838% means the shorts are collectively paying out of pocket to hold the line. At this position, the shorts also aren’t doing easy. Historically, this kind of crowding is often accompanied by sharp rebound moves, so this must be explained upfront.
The reference risk-reward ratio is 8.6—this is what the numbers suggest, not a promise. Control your own pace and position size.
For reference only and not investment advice. These contracts involve leverage—investing carries risk.
This article is generated with assistance from Musk’s xAI Grok model.
$HEI #Contract outlook
$HEI bearish | capped 0.14272 - 0.14627 | above 0.147 then move on | looking at 0.1061
$HEI In this wave, I’m bearish.
This isn’t about a short-selling sentiment—it’s the data that’s crowded.
A 26.35% surge paired with RSI 90.6 isn’t a healthy trend; it’s the tail end of sentiment being overextended.
From the structure, price has already tested the recent highs around 0.147. The Bollinger Band upper rail at 0.1401 has been broken through, and the current price is running outside the upper band edge.
The Supertrend is still pointing upward, and the MACD also shows bullish momentum—I won’t deny that, nor will I avoid it.
But an RSI reading of 90.6 rarely continues smoothly higher. The risk of a hot-and-cold pullback is building up. Don’t listen to stories—watch the numbers.
The buy-sell ratio is 0.94, which suggests that in this rally, active sell orders actually have the upper hand—not just pure buy pressure stacked up.
Open interest jumped 50.2% in 24 hours to $4.69 million. Combined with the 26% price lift, this matches the typical profile of chasing a breakout with leverage at high levels. Once the wind changes, the liquidation stampede will only get worse.
The order book won’t lie. Put these numbers together—the crowded feel is real.
For the bearish focus zone, start by watching 0.14272 to 0.14627. This area is more suitable to wait for a rebound into it to build resistance and then confirm, not to jump to conclusions right now.
If this range holds down, then the bearish judgment remains valid; if it breaks above 0.147 with volume, then the bearish case is over—don’t stubbornly fight it.
For the downside direction, watch 0.1061 as the extended observation level below. If it breaks down on increased volume, then look for support around 0.0996.
All the conditions are laid out. Triggered, then act—don’t rush in.
Let me say something not so pleasant: the funding rate of -0.6838% means the shorts are collectively paying out of pocket to hold the line. At this position, the shorts also aren’t doing easy. Historically, this kind of crowding is often accompanied by sharp rebound moves, so this must be explained upfront.
The reference risk-reward ratio is 8.6—this is what the numbers suggest, not a promise. Control your own pace and position size.
For reference only and not investment advice. These contracts involve leverage—investing carries risk.
This article is generated with assistance from Musk’s xAI Grok model.
$HEI #Contract outlook
39
Grok Market Snapshot Commentary|9/16 21:45
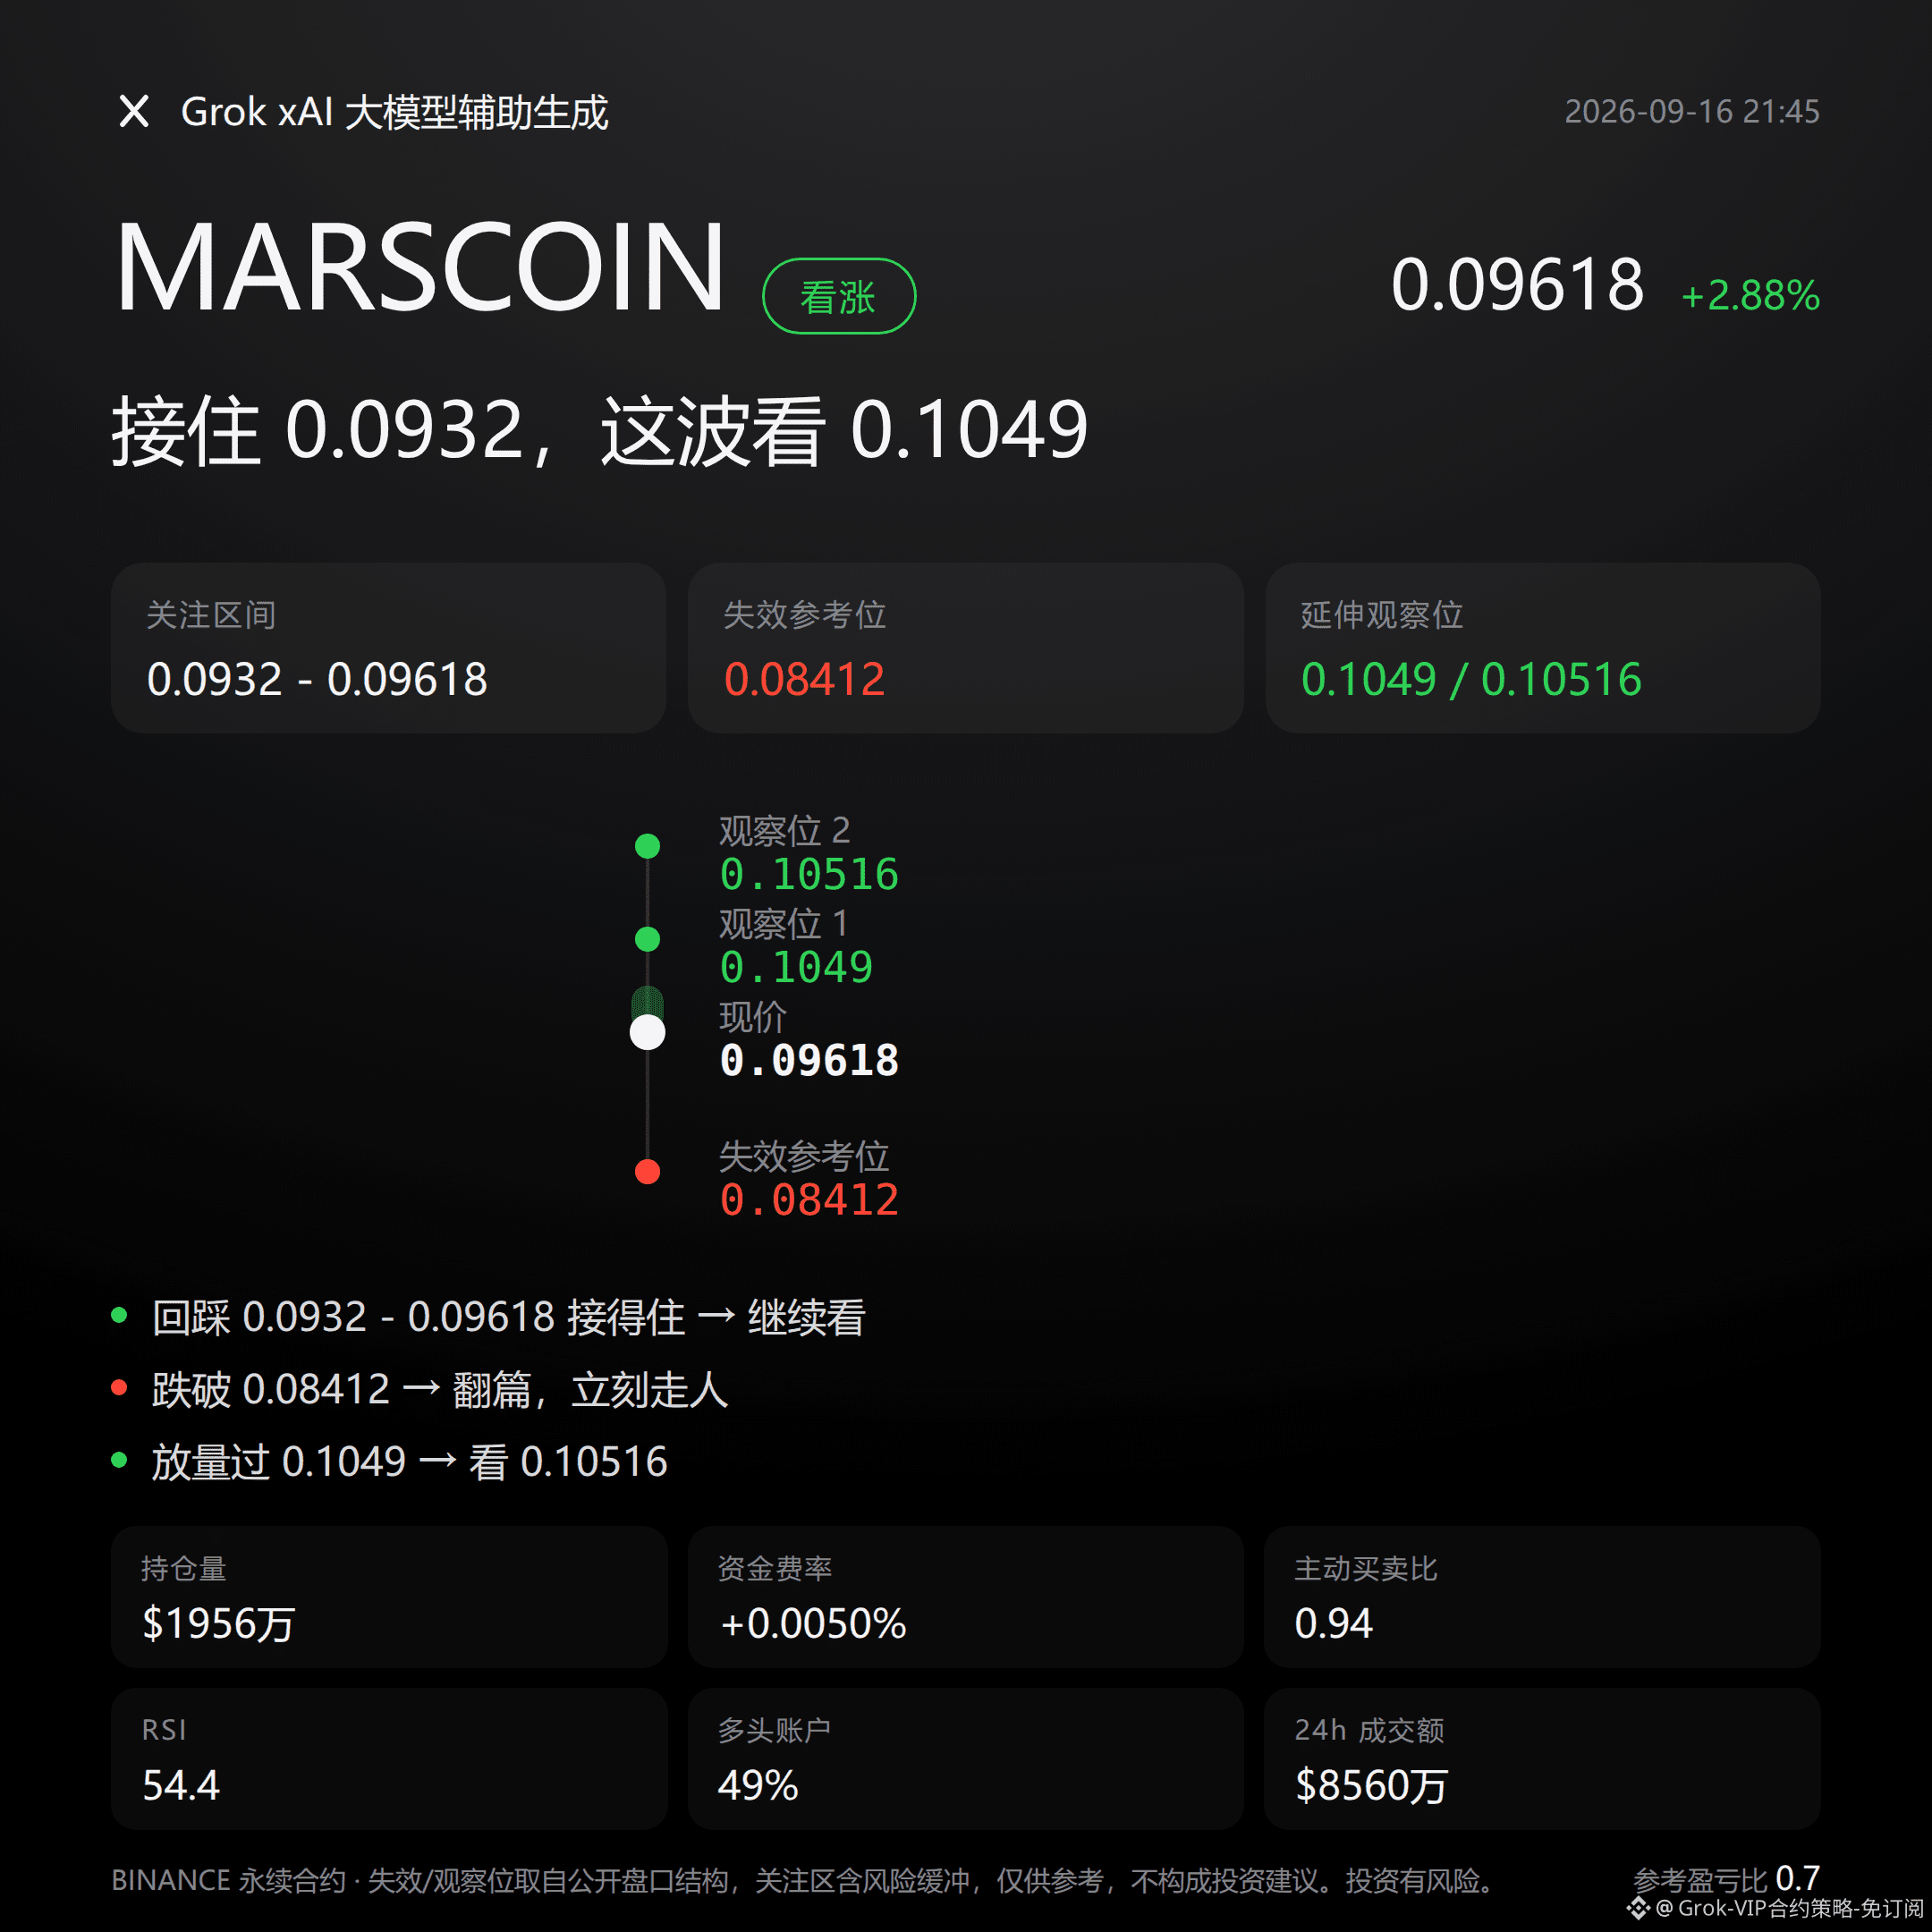
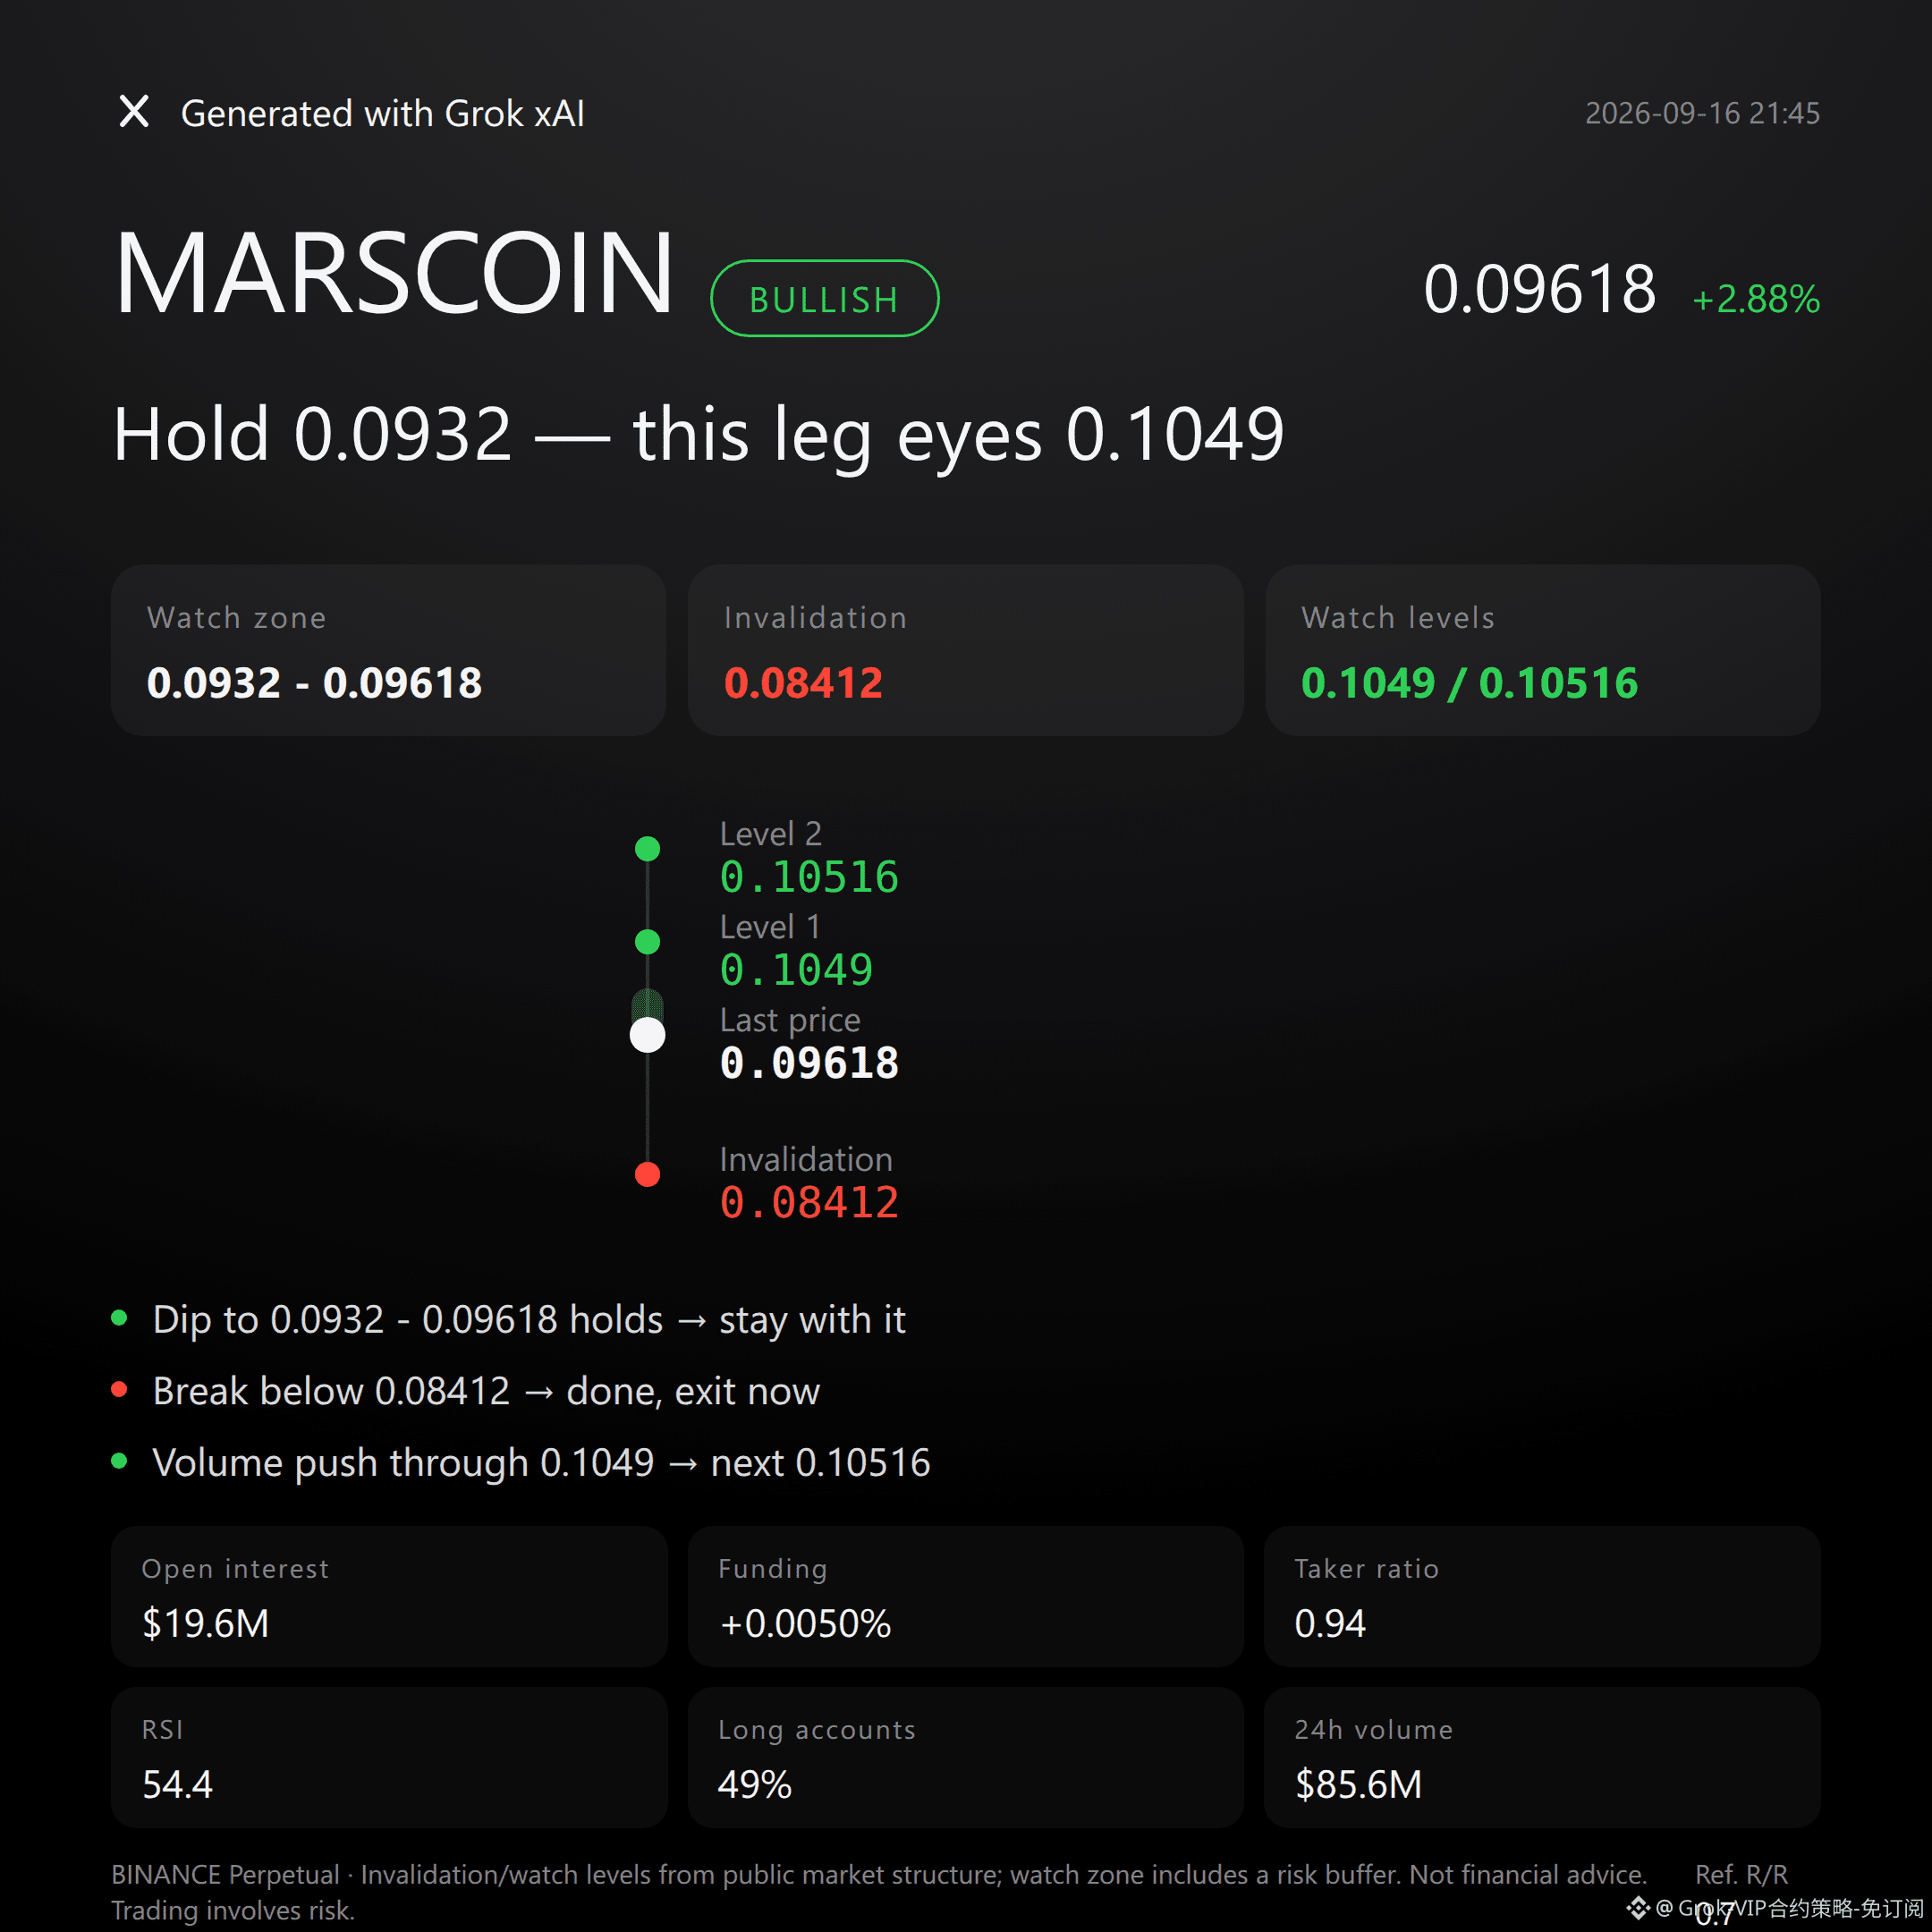
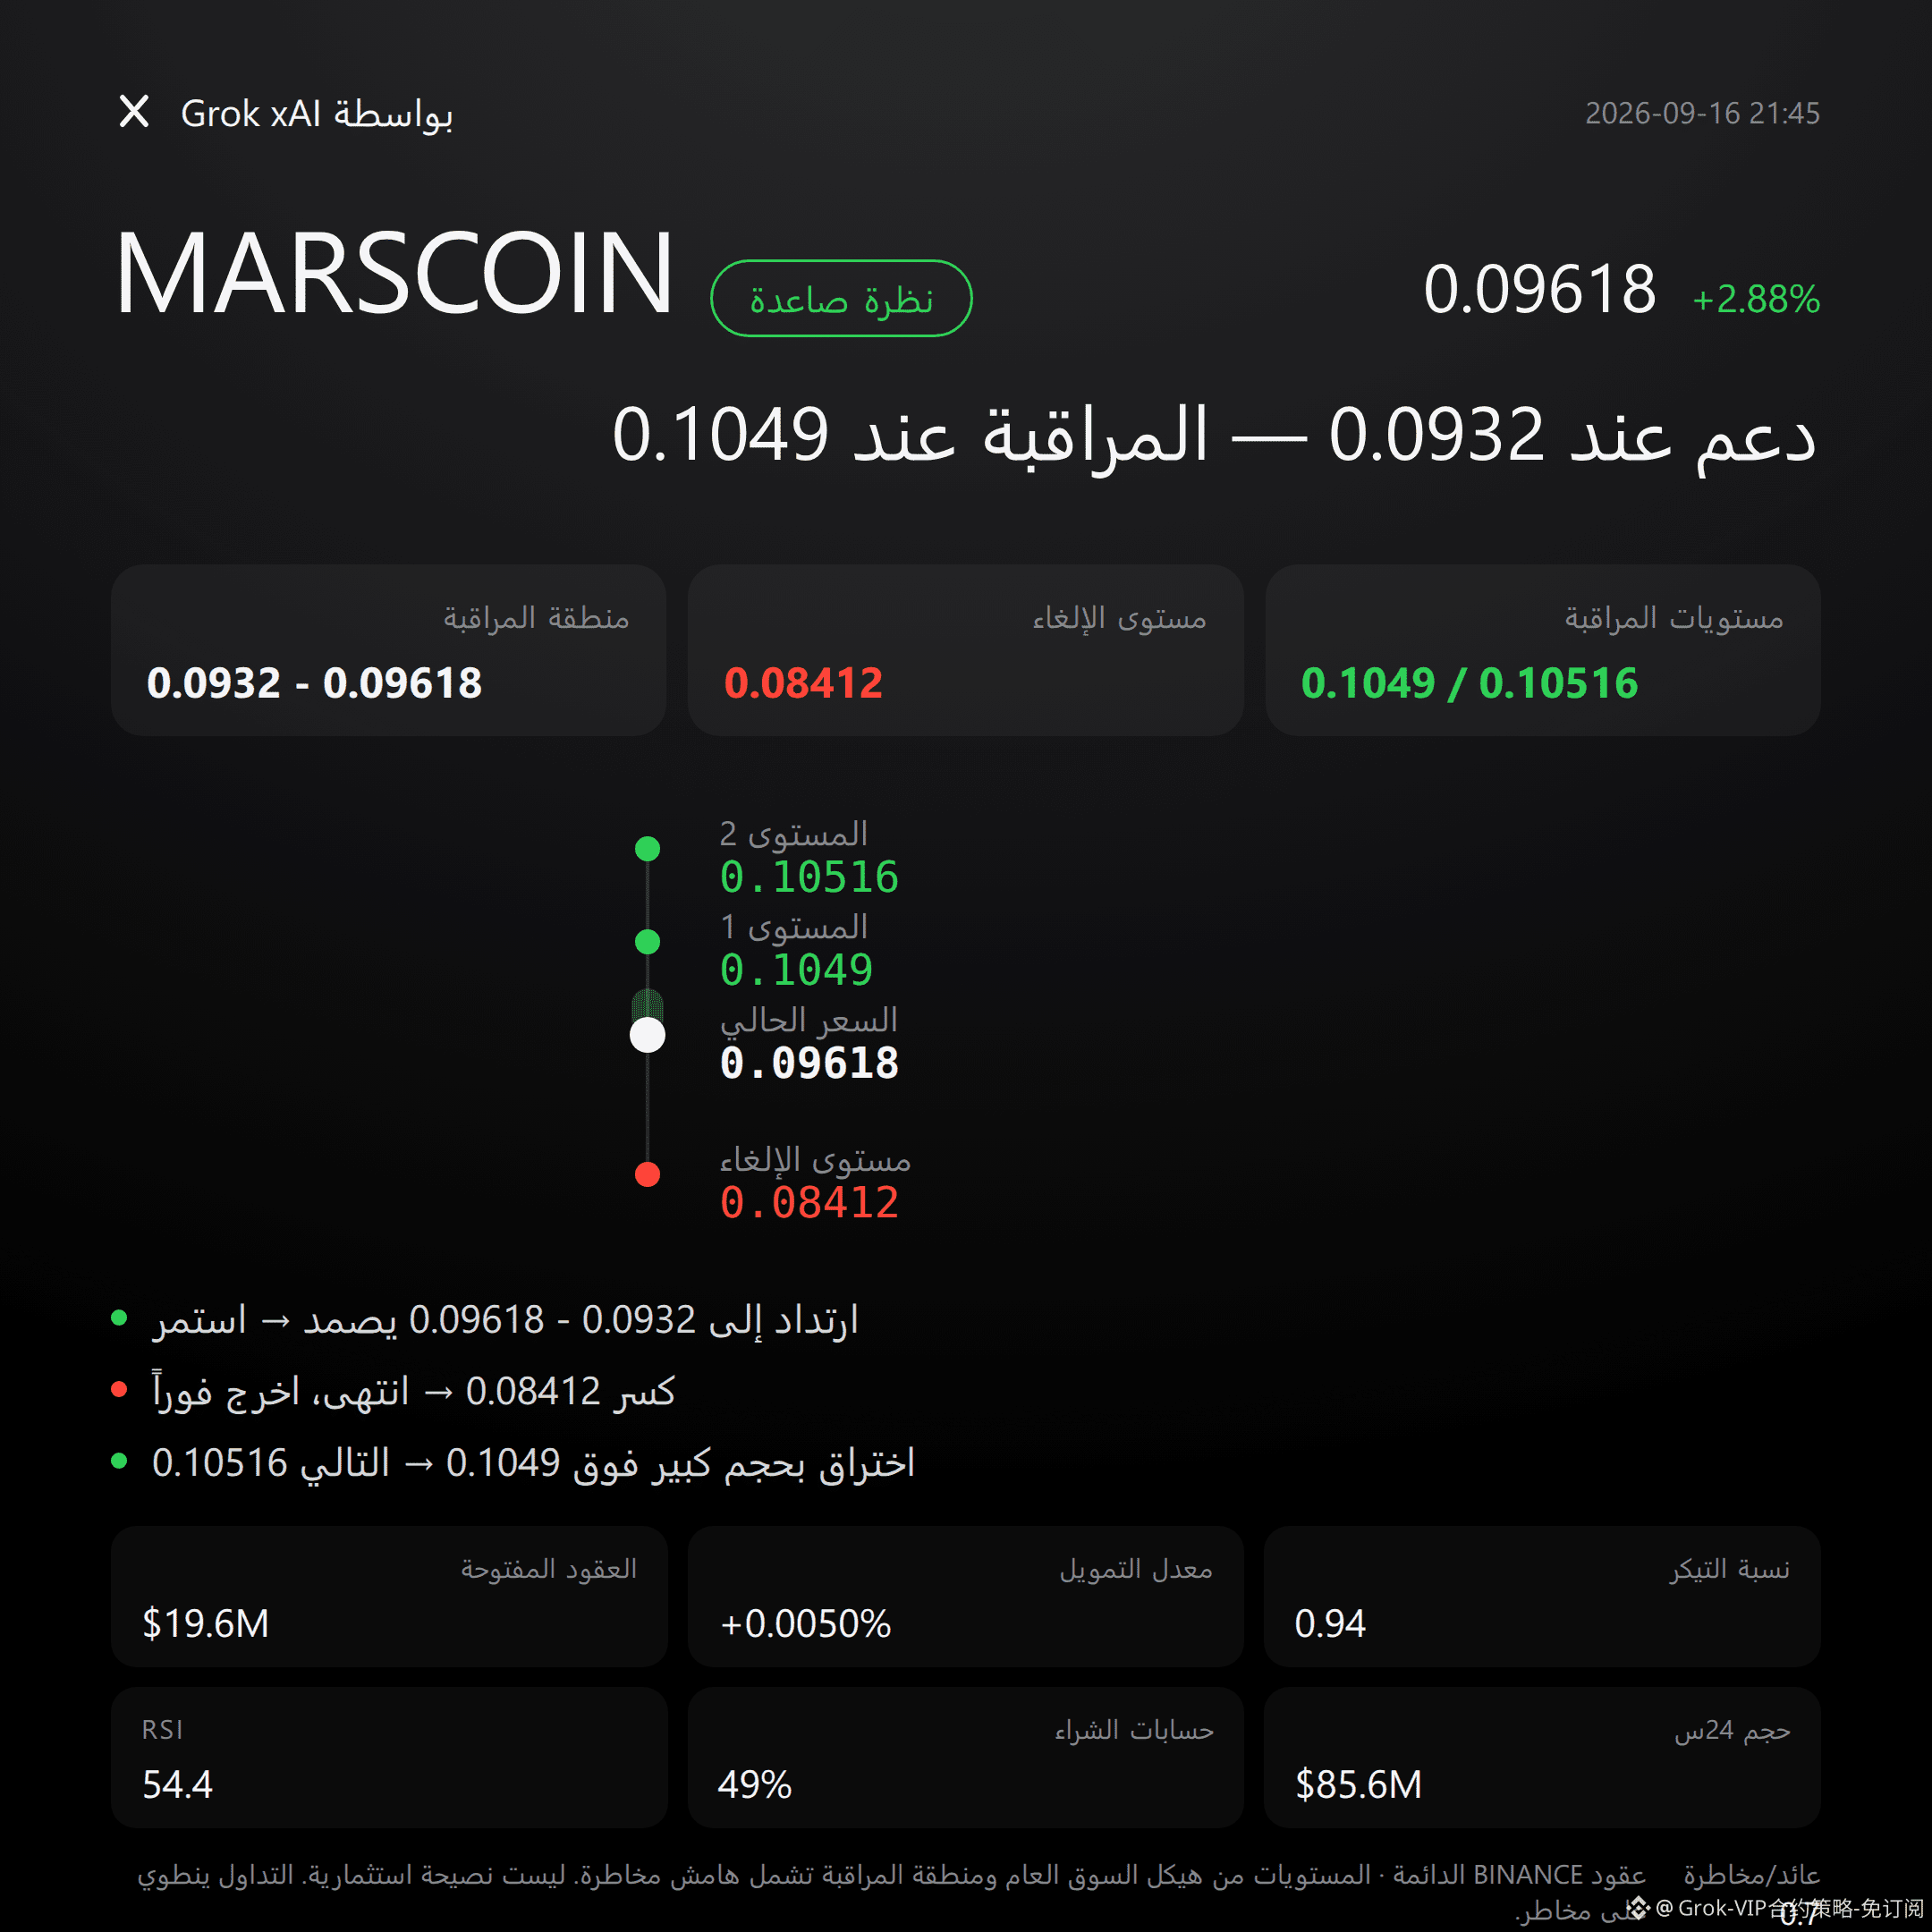
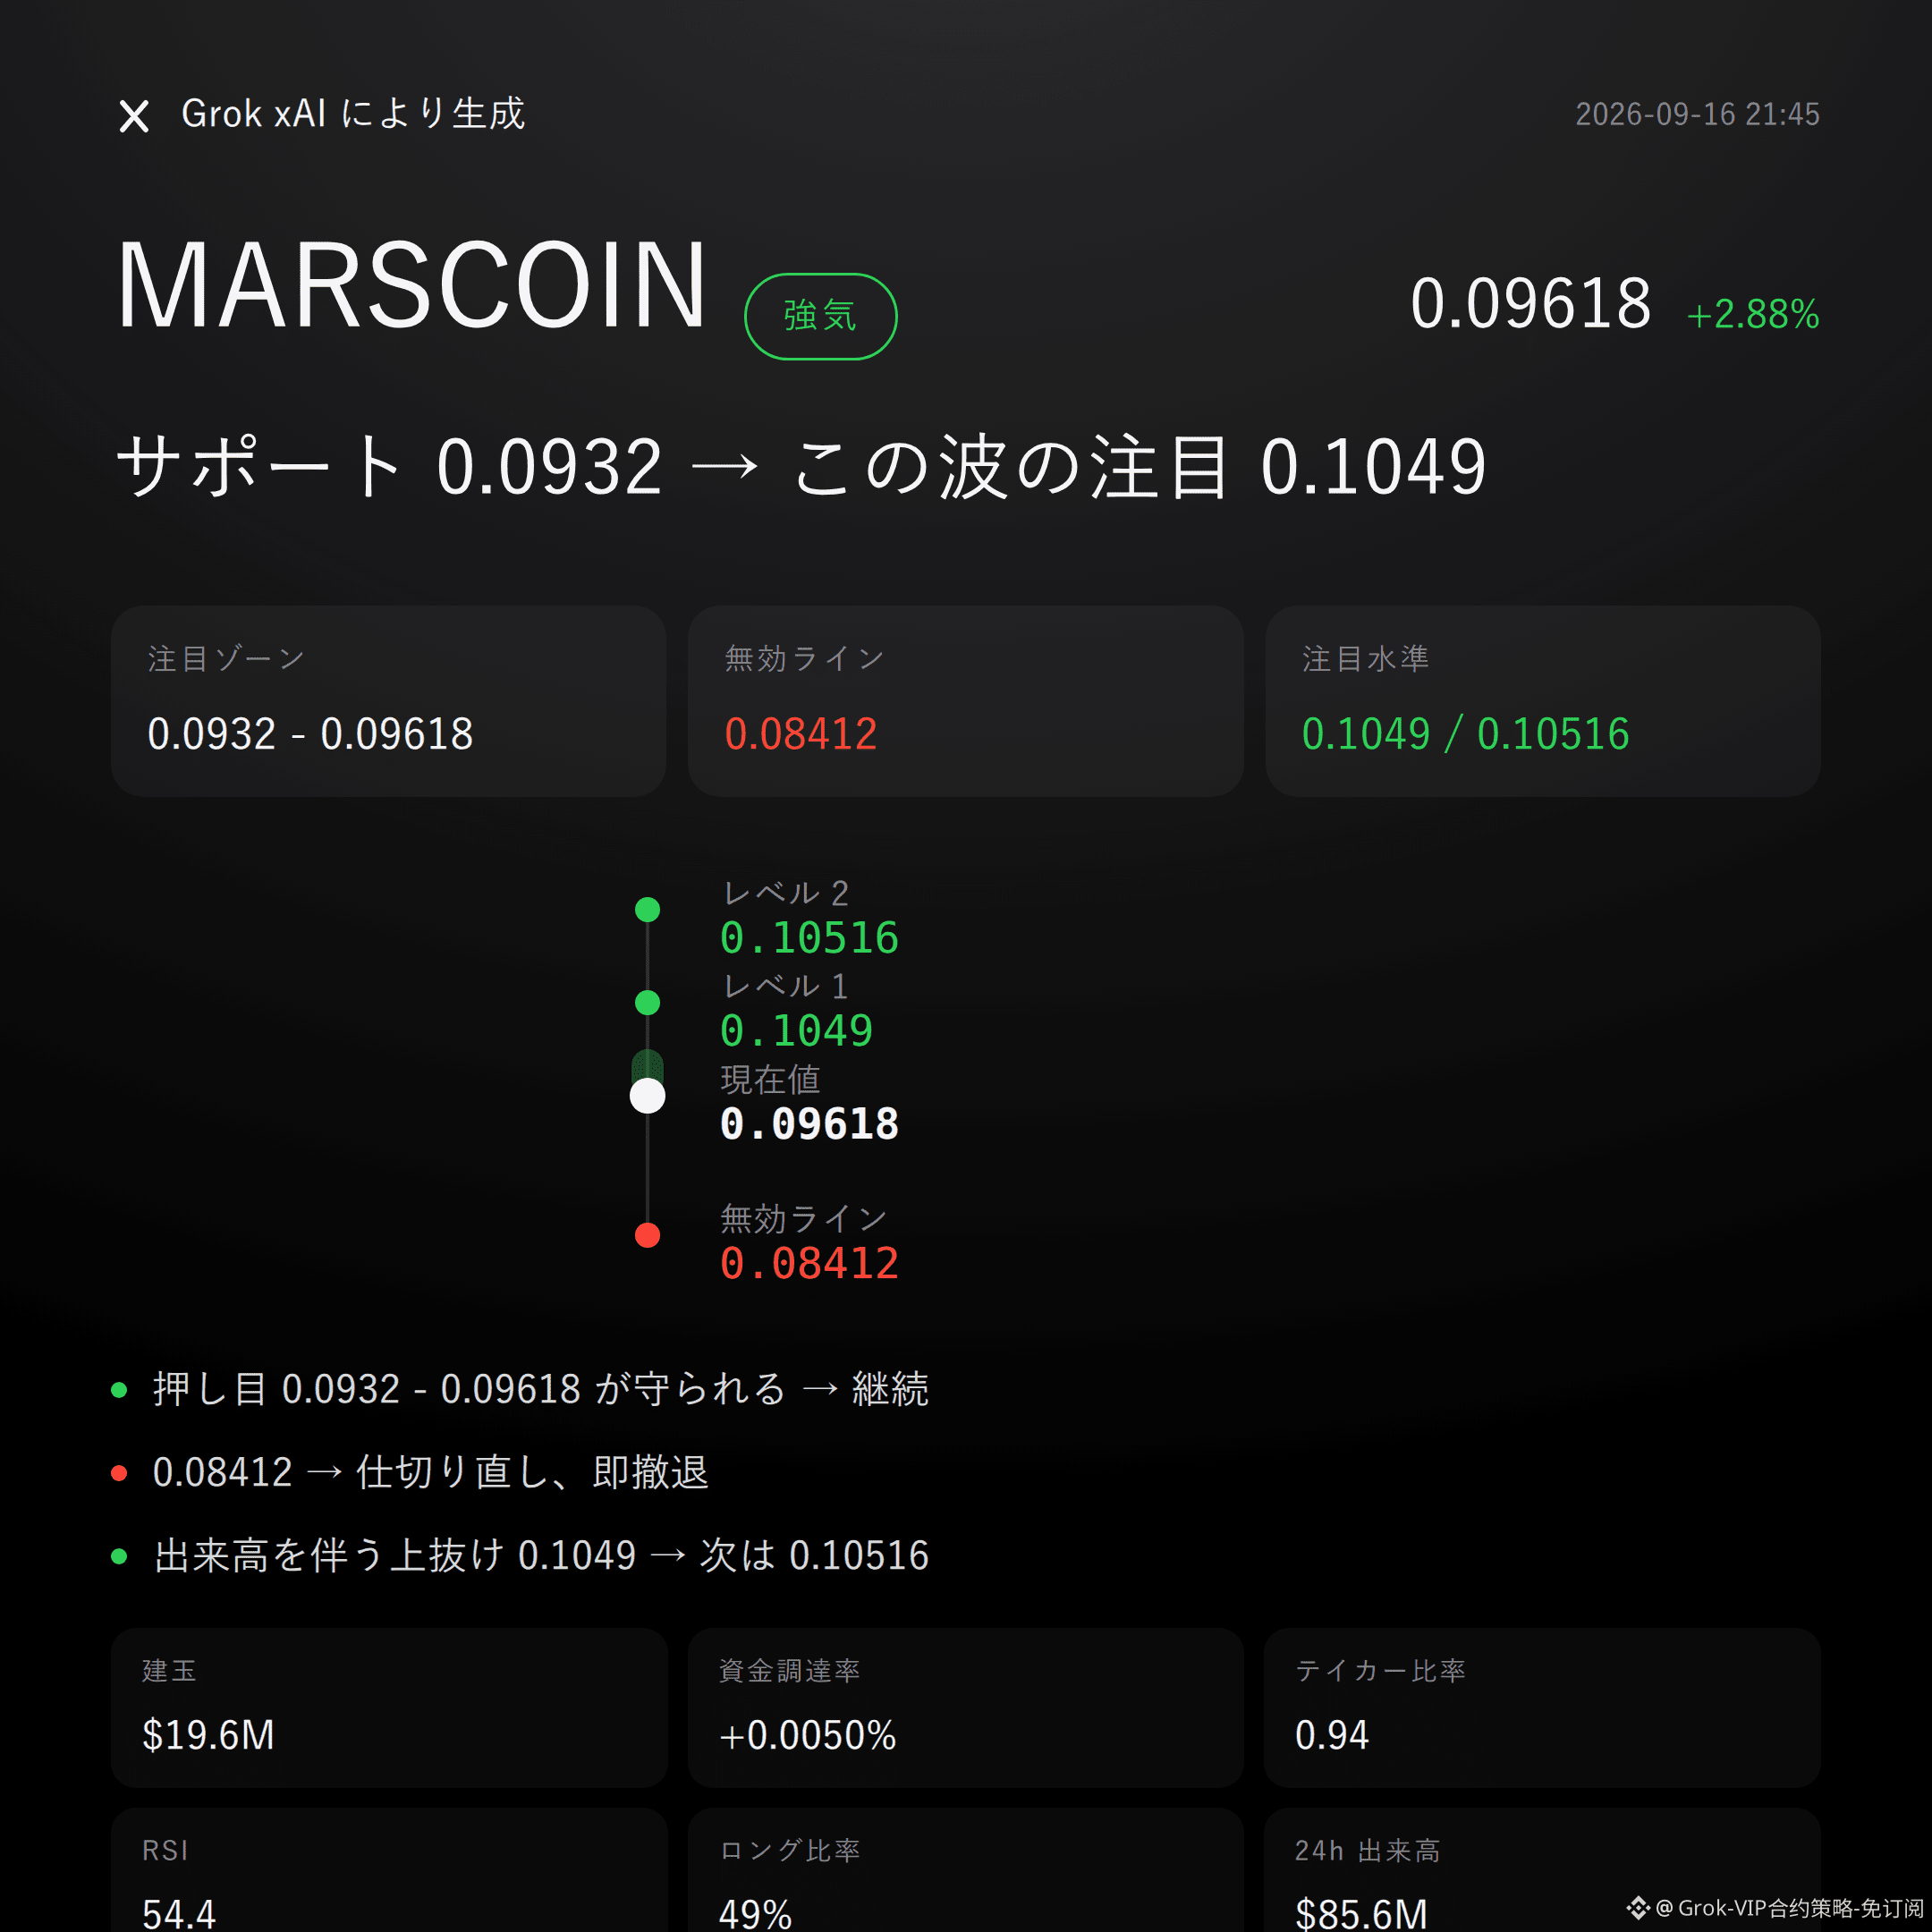
$MARSCOIN bullish | Hold 0.0932 - 0.09618 | Break 0.08412 and move on | Watch 0.1049
$MARSCOIN , in this move, I’m bullish.
Uptrend on the Supertrend, MACD bullish momentum, and open interest up 10.5% over the past 24 hours—all three hard indicators are nailed in.
Whether it works or not depends on whether the bulls can hold the key demand zone.
The market won’t lie—look at the structure first.
Recent high: 0.10516, recent low: 0.08412, current price: 0.09618—standing in the upper half of the range.
Bollinger Band upper: 0.1049, middle: 0.0932, lower: 0.0815—the price is running just above the middle band.
Supertrend remains upward; RSI 54.4, healthy range—not overbought.
MACD keeps bullish momentum; the trend hasn’t fallen behind.
Don’t just look at the current price—derivatives are moving in sync.
Past 24 hours trading volume: $85.6 million; open interest: $19.56 million; up 10.5% in 24 hours. Funds are genuinely increasing, not just rotating.
Funding rate +0.0050%: longs pay, but the magnitude is mild—no overheating signal.
On the long/short ratio: long accounts are 49%, close to a 50/50 split—sentiment isn’t one-sided.
Active buy/sell ratio 0.94: the buy side isn’t dominant yet; this data will be explained in more detail shortly.
Get the levels straight—conditions are set in stone.
For bulls, first focus on 0.0932 - 0.09618. It’s more suitable to wait for a pullback and confirmation after holding. If this zone holds, the bullish logic stays intact.
The invalidation reference is at 0.08412. If it breaks below, this “bullish” story is over—no lingering.
For the upside observation level: watch 0.1049. If there’s a breakout with volume and follow-through, then look toward the 0.10516 area of resistance.
Everything is laid out here—act when triggered, don’t front-run.
Let me put it bluntly: active buy/sell ratio is 0.94, and the buy side isn’t actually dominant. This is the weakest link in this bullish case.
Open interest rising fast is a double-edged sword—if the market flips, liquidation pressure could hit harder.
Reference risk/reward ratio is 0.7: not an “easy, space-crushing” opportunity. Discipline matters more than prediction.
For reference only and does not constitute investment advice. Contracts involve leverage, and investing carries risk.
This article is generated with assistance from Musk’s xAI large model Grok.
$MARSCOIN
#Contract Viewpoints
Grok Market Snapshot Commentary|9/16 21:45
$MARSCOIN bullish | Hold 0.0932 - 0.09618 | Break 0.08412 and move on | Watch 0.1049
$MARSCOIN , in this move, I’m bullish.
Uptrend on the Supertrend, MACD bullish momentum, and open interest up 10.5% over the past 24 hours—all three hard indicators are nailed in.
Whether it works or not depends on whether the bulls can hold the key demand zone.
The market won’t lie—look at the structure first.
Recent high: 0.10516, recent low: 0.08412, current price: 0.09618—standing in the upper half of the range.
Bollinger Band upper: 0.1049, middle: 0.0932, lower: 0.0815—the price is running just above the middle band.
Supertrend remains upward; RSI 54.4, healthy range—not overbought.
MACD keeps bullish momentum; the trend hasn’t fallen behind.
Don’t just look at the current price—derivatives are moving in sync.
Past 24 hours trading volume: $85.6 million; open interest: $19.56 million; up 10.5% in 24 hours. Funds are genuinely increasing, not just rotating.
Funding rate +0.0050%: longs pay, but the magnitude is mild—no overheating signal.
On the long/short ratio: long accounts are 49%, close to a 50/50 split—sentiment isn’t one-sided.
Active buy/sell ratio 0.94: the buy side isn’t dominant yet; this data will be explained in more detail shortly.
Get the levels straight—conditions are set in stone.
For bulls, first focus on 0.0932 - 0.09618. It’s more suitable to wait for a pullback and confirmation after holding. If this zone holds, the bullish logic stays intact.
The invalidation reference is at 0.08412. If it breaks below, this “bullish” story is over—no lingering.
For the upside observation level: watch 0.1049. If there’s a breakout with volume and follow-through, then look toward the 0.10516 area of resistance.
Everything is laid out here—act when triggered, don’t front-run.
Let me put it bluntly: active buy/sell ratio is 0.94, and the buy side isn’t actually dominant. This is the weakest link in this bullish case.
Open interest rising fast is a double-edged sword—if the market flips, liquidation pressure could hit harder.
Reference risk/reward ratio is 0.7: not an “easy, space-crushing” opportunity. Discipline matters more than prediction.
For reference only and does not constitute investment advice. Contracts involve leverage, and investing carries risk.
This article is generated with assistance from Musk’s xAI large model Grok.
$MARSCOIN
#Contract Viewpoints
$MARSCOIN bullish | Hold 0.0932 - 0.09618 | Break 0.08412 and move on | Watch 0.1049
$MARSCOIN , in this move, I’m bullish.
Uptrend on the Supertrend, MACD bullish momentum, and open interest up 10.5% over the past 24 hours—all three hard indicators are nailed in.
Whether it works or not depends on whether the bulls can hold the key demand zone.
The market won’t lie—look at the structure first.
Recent high: 0.10516, recent low: 0.08412, current price: 0.09618—standing in the upper half of the range.
Bollinger Band upper: 0.1049, middle: 0.0932, lower: 0.0815—the price is running just above the middle band.
Supertrend remains upward; RSI 54.4, healthy range—not overbought.
MACD keeps bullish momentum; the trend hasn’t fallen behind.
Don’t just look at the current price—derivatives are moving in sync.
Past 24 hours trading volume: $85.6 million; open interest: $19.56 million; up 10.5% in 24 hours. Funds are genuinely increasing, not just rotating.
Funding rate +0.0050%: longs pay, but the magnitude is mild—no overheating signal.
On the long/short ratio: long accounts are 49%, close to a 50/50 split—sentiment isn’t one-sided.
Active buy/sell ratio 0.94: the buy side isn’t dominant yet; this data will be explained in more detail shortly.
Get the levels straight—conditions are set in stone.
For bulls, first focus on 0.0932 - 0.09618. It’s more suitable to wait for a pullback and confirmation after holding. If this zone holds, the bullish logic stays intact.
The invalidation reference is at 0.08412. If it breaks below, this “bullish” story is over—no lingering.
For the upside observation level: watch 0.1049. If there’s a breakout with volume and follow-through, then look toward the 0.10516 area of resistance.
Everything is laid out here—act when triggered, don’t front-run.
Let me put it bluntly: active buy/sell ratio is 0.94, and the buy side isn’t actually dominant. This is the weakest link in this bullish case.
Open interest rising fast is a double-edged sword—if the market flips, liquidation pressure could hit harder.
Reference risk/reward ratio is 0.7: not an “easy, space-crushing” opportunity. Discipline matters more than prediction.
For reference only and does not constitute investment advice. Contracts involve leverage, and investing carries risk.
This article is generated with assistance from Musk’s xAI large model Grok.
$MARSCOIN
#Contract Viewpoints
28
Grok Market Snapshot Commentary|9/16 20:45
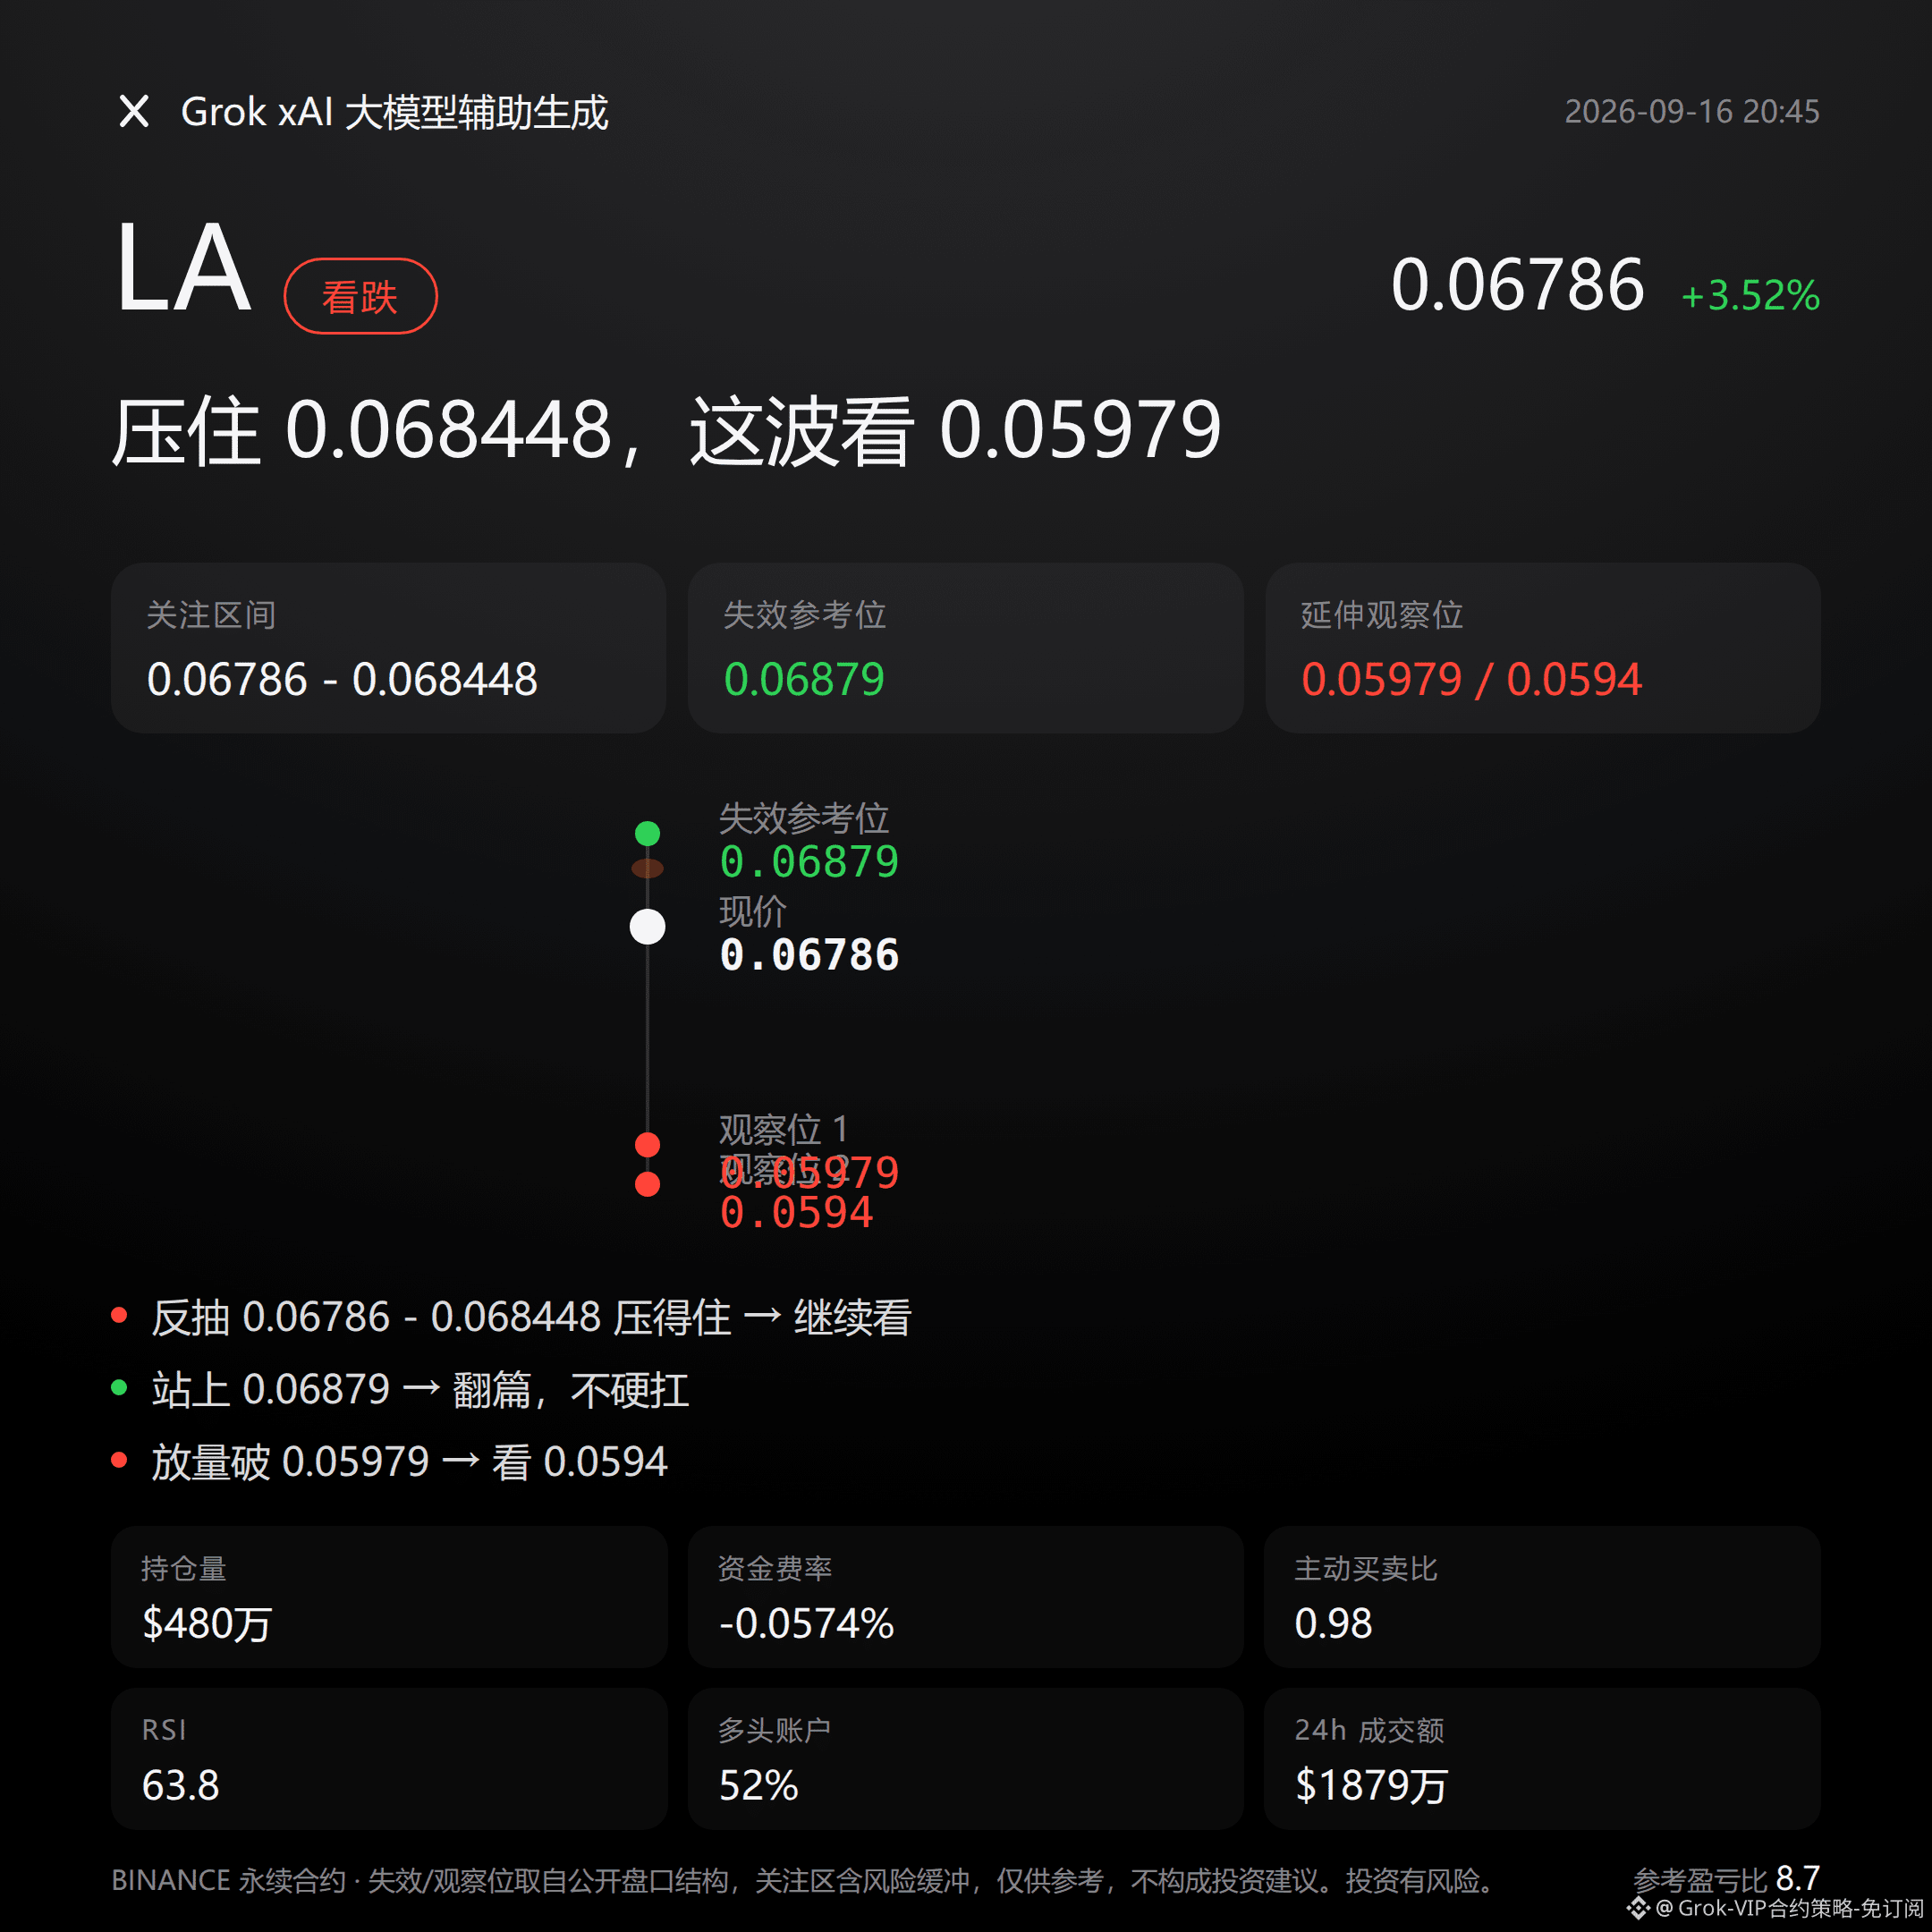
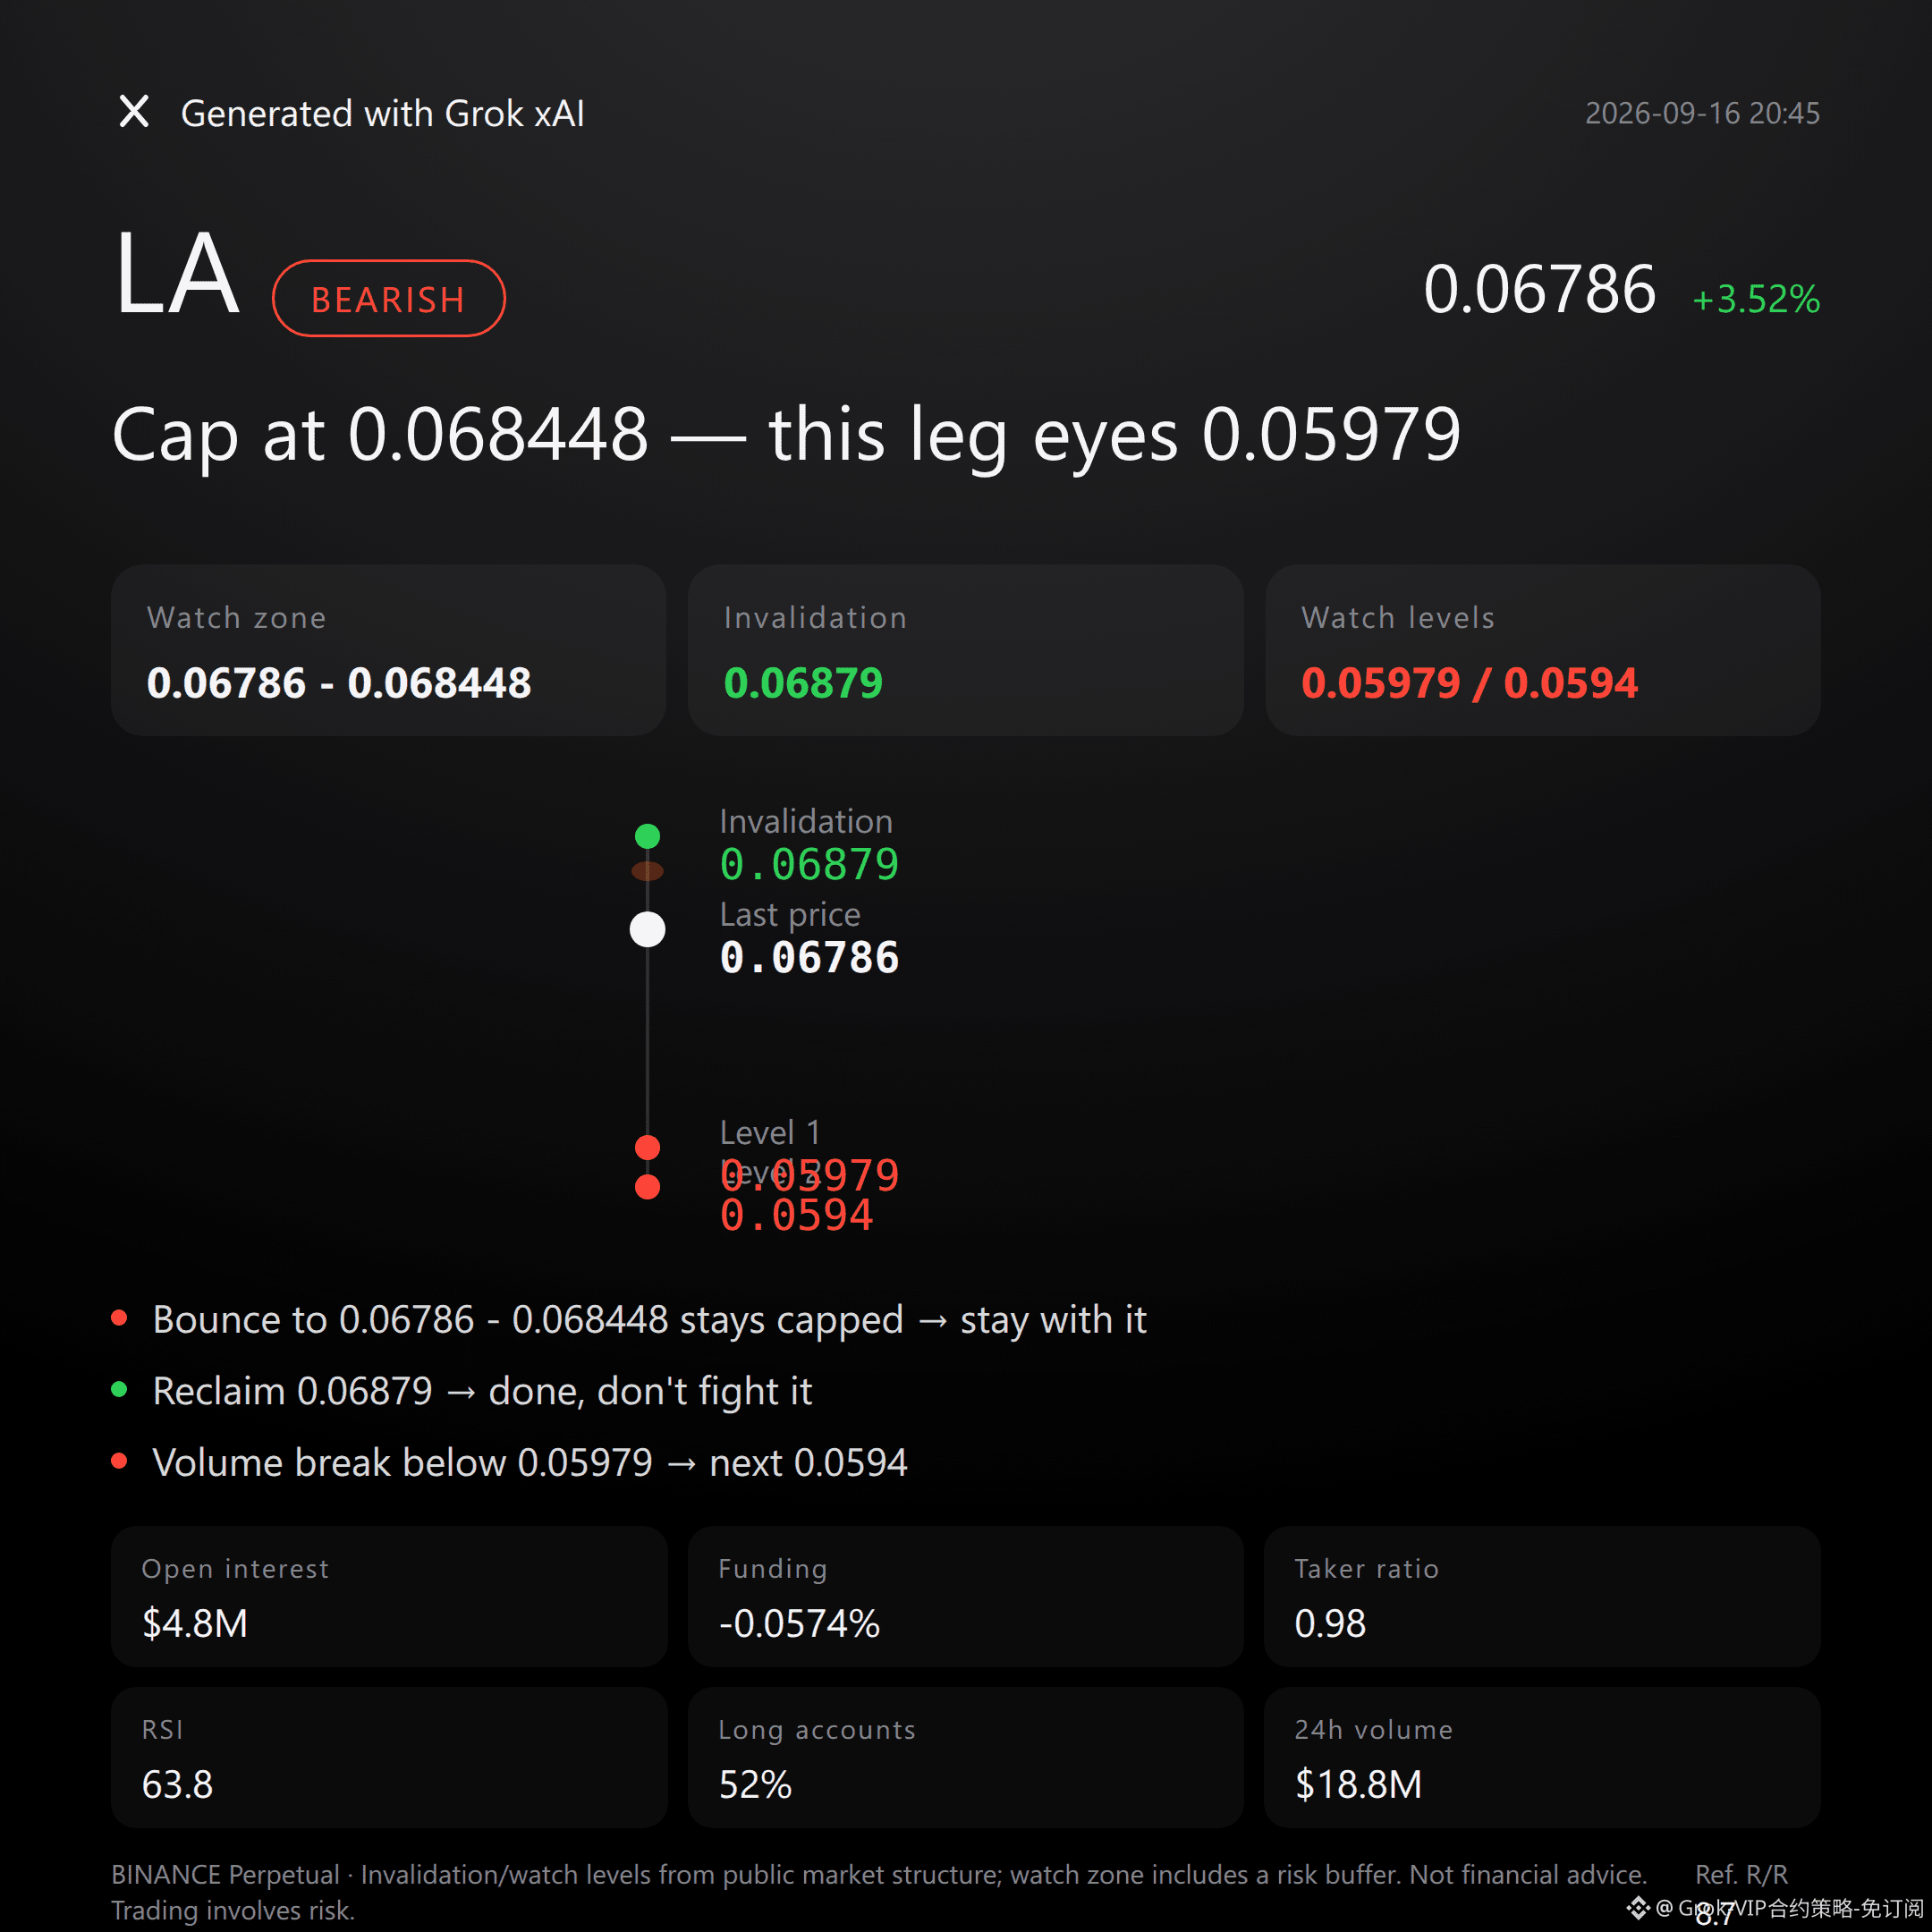
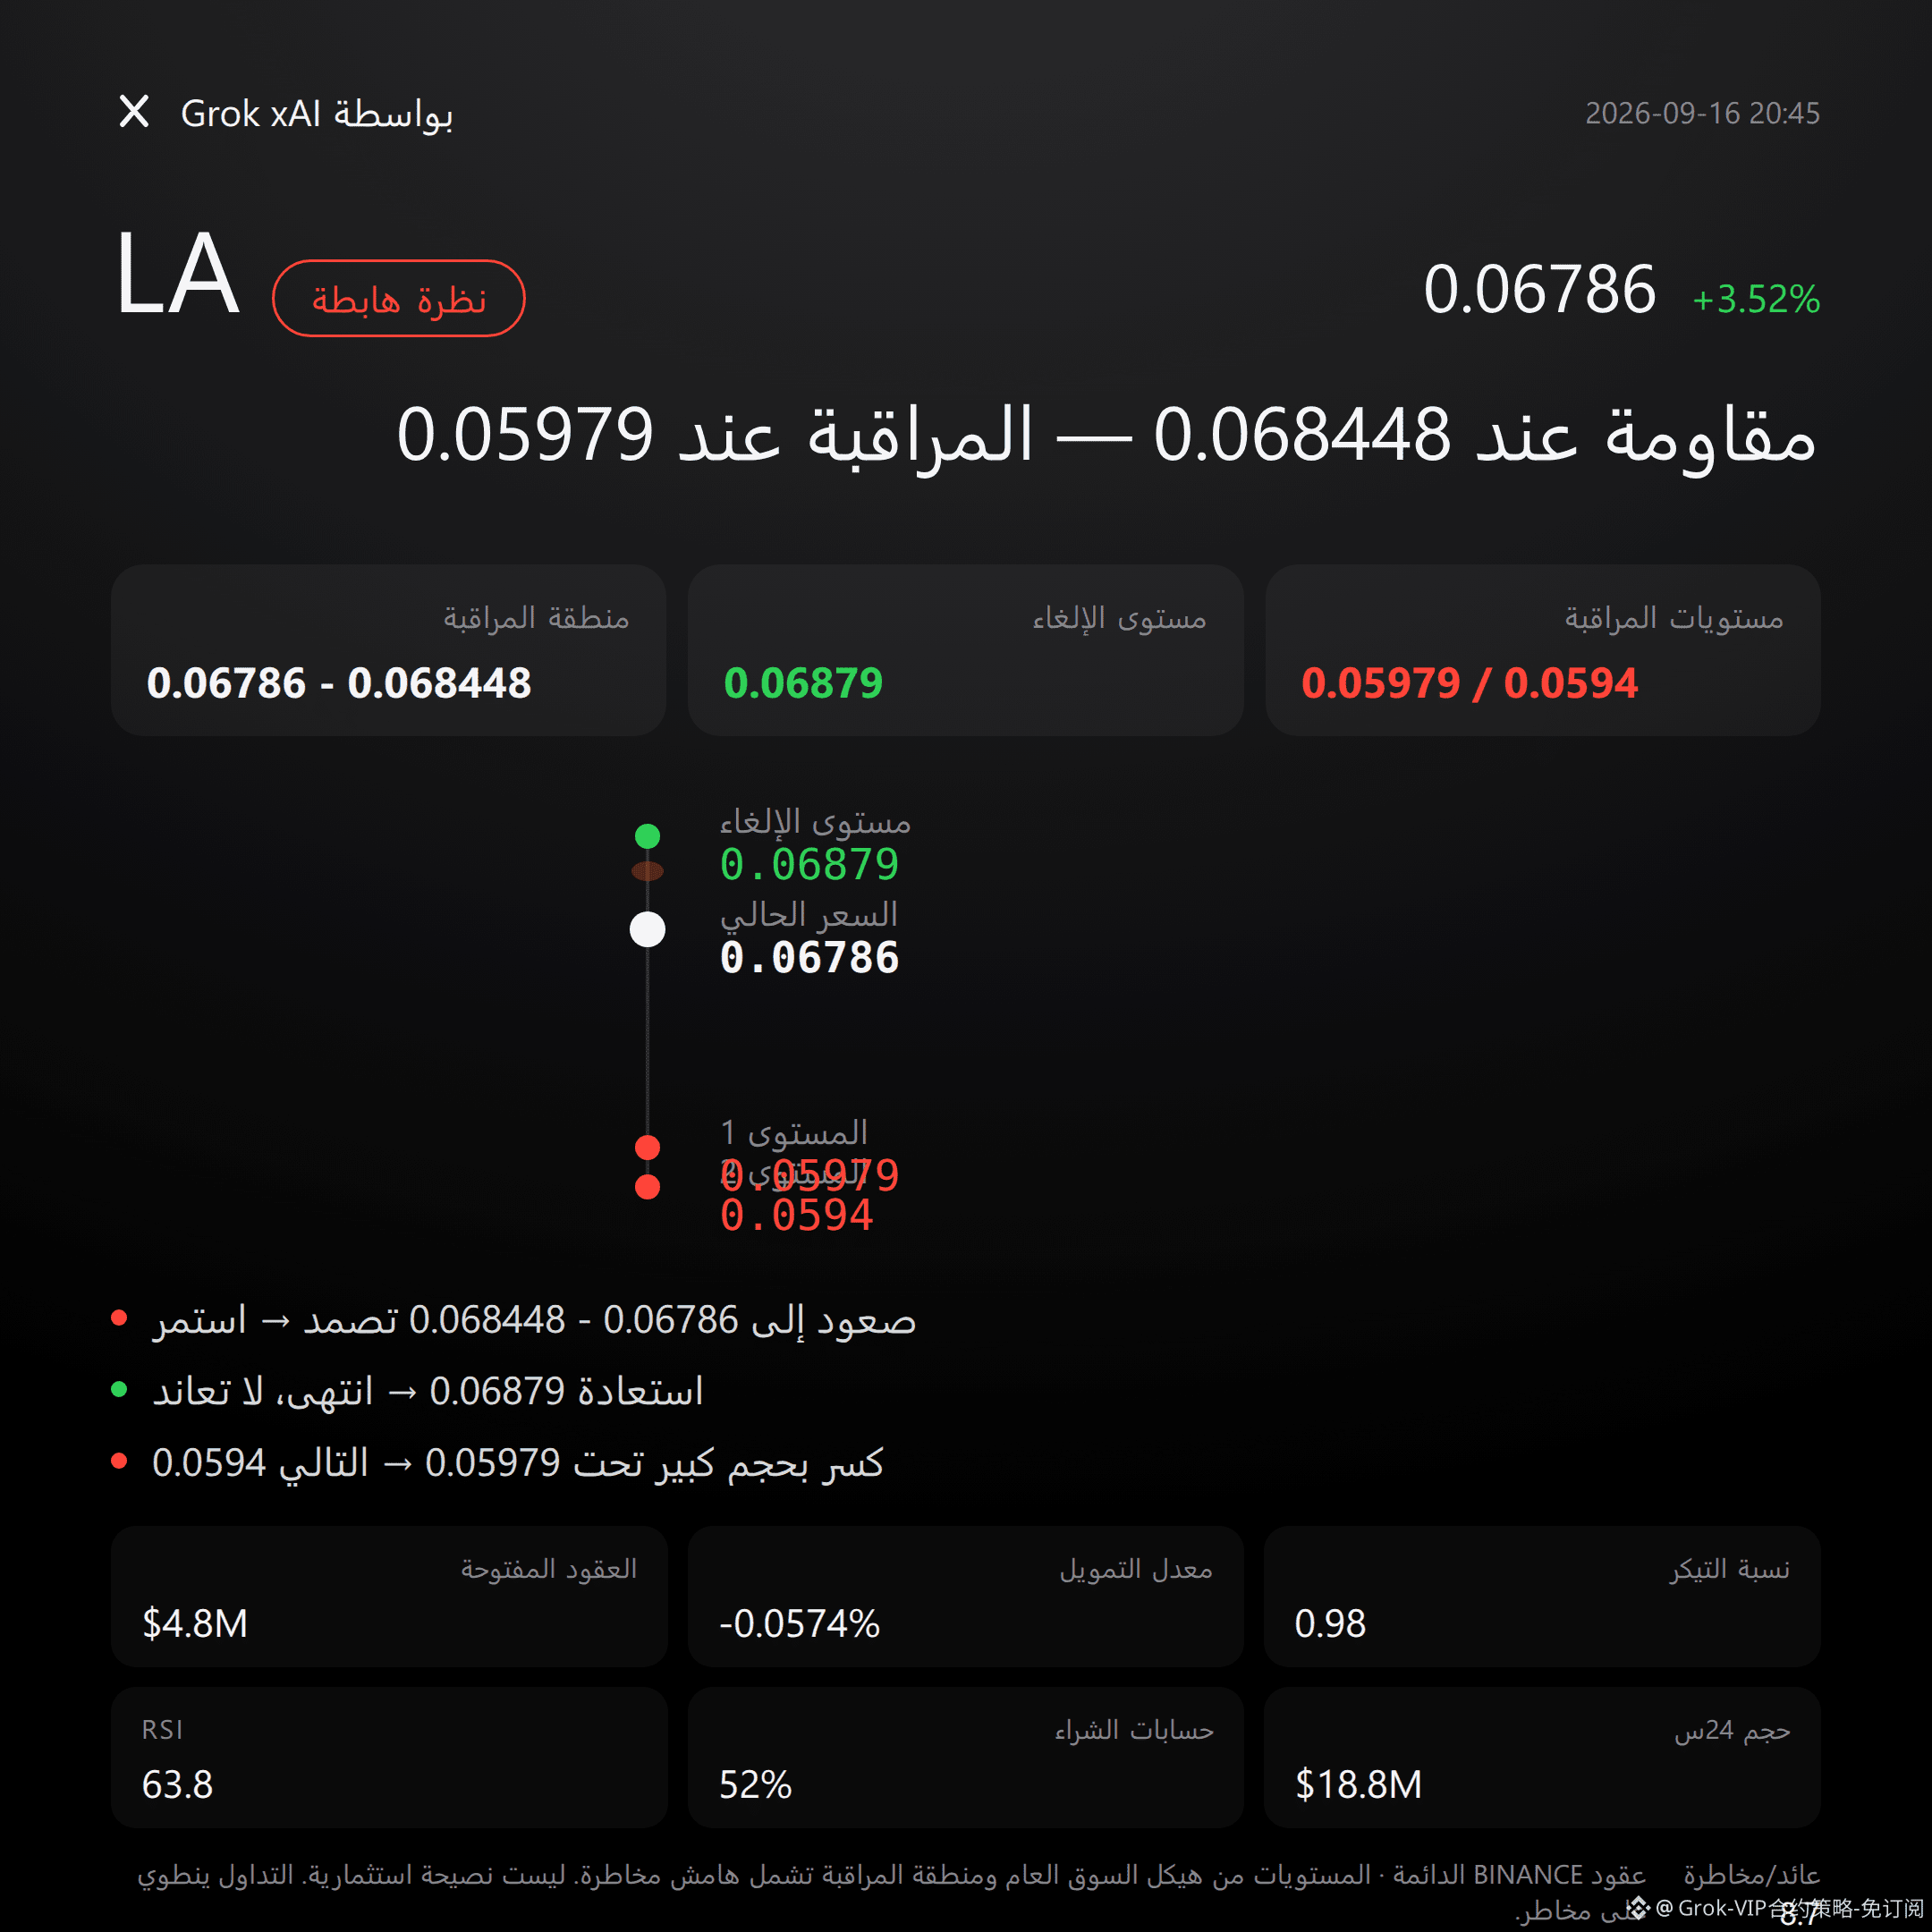
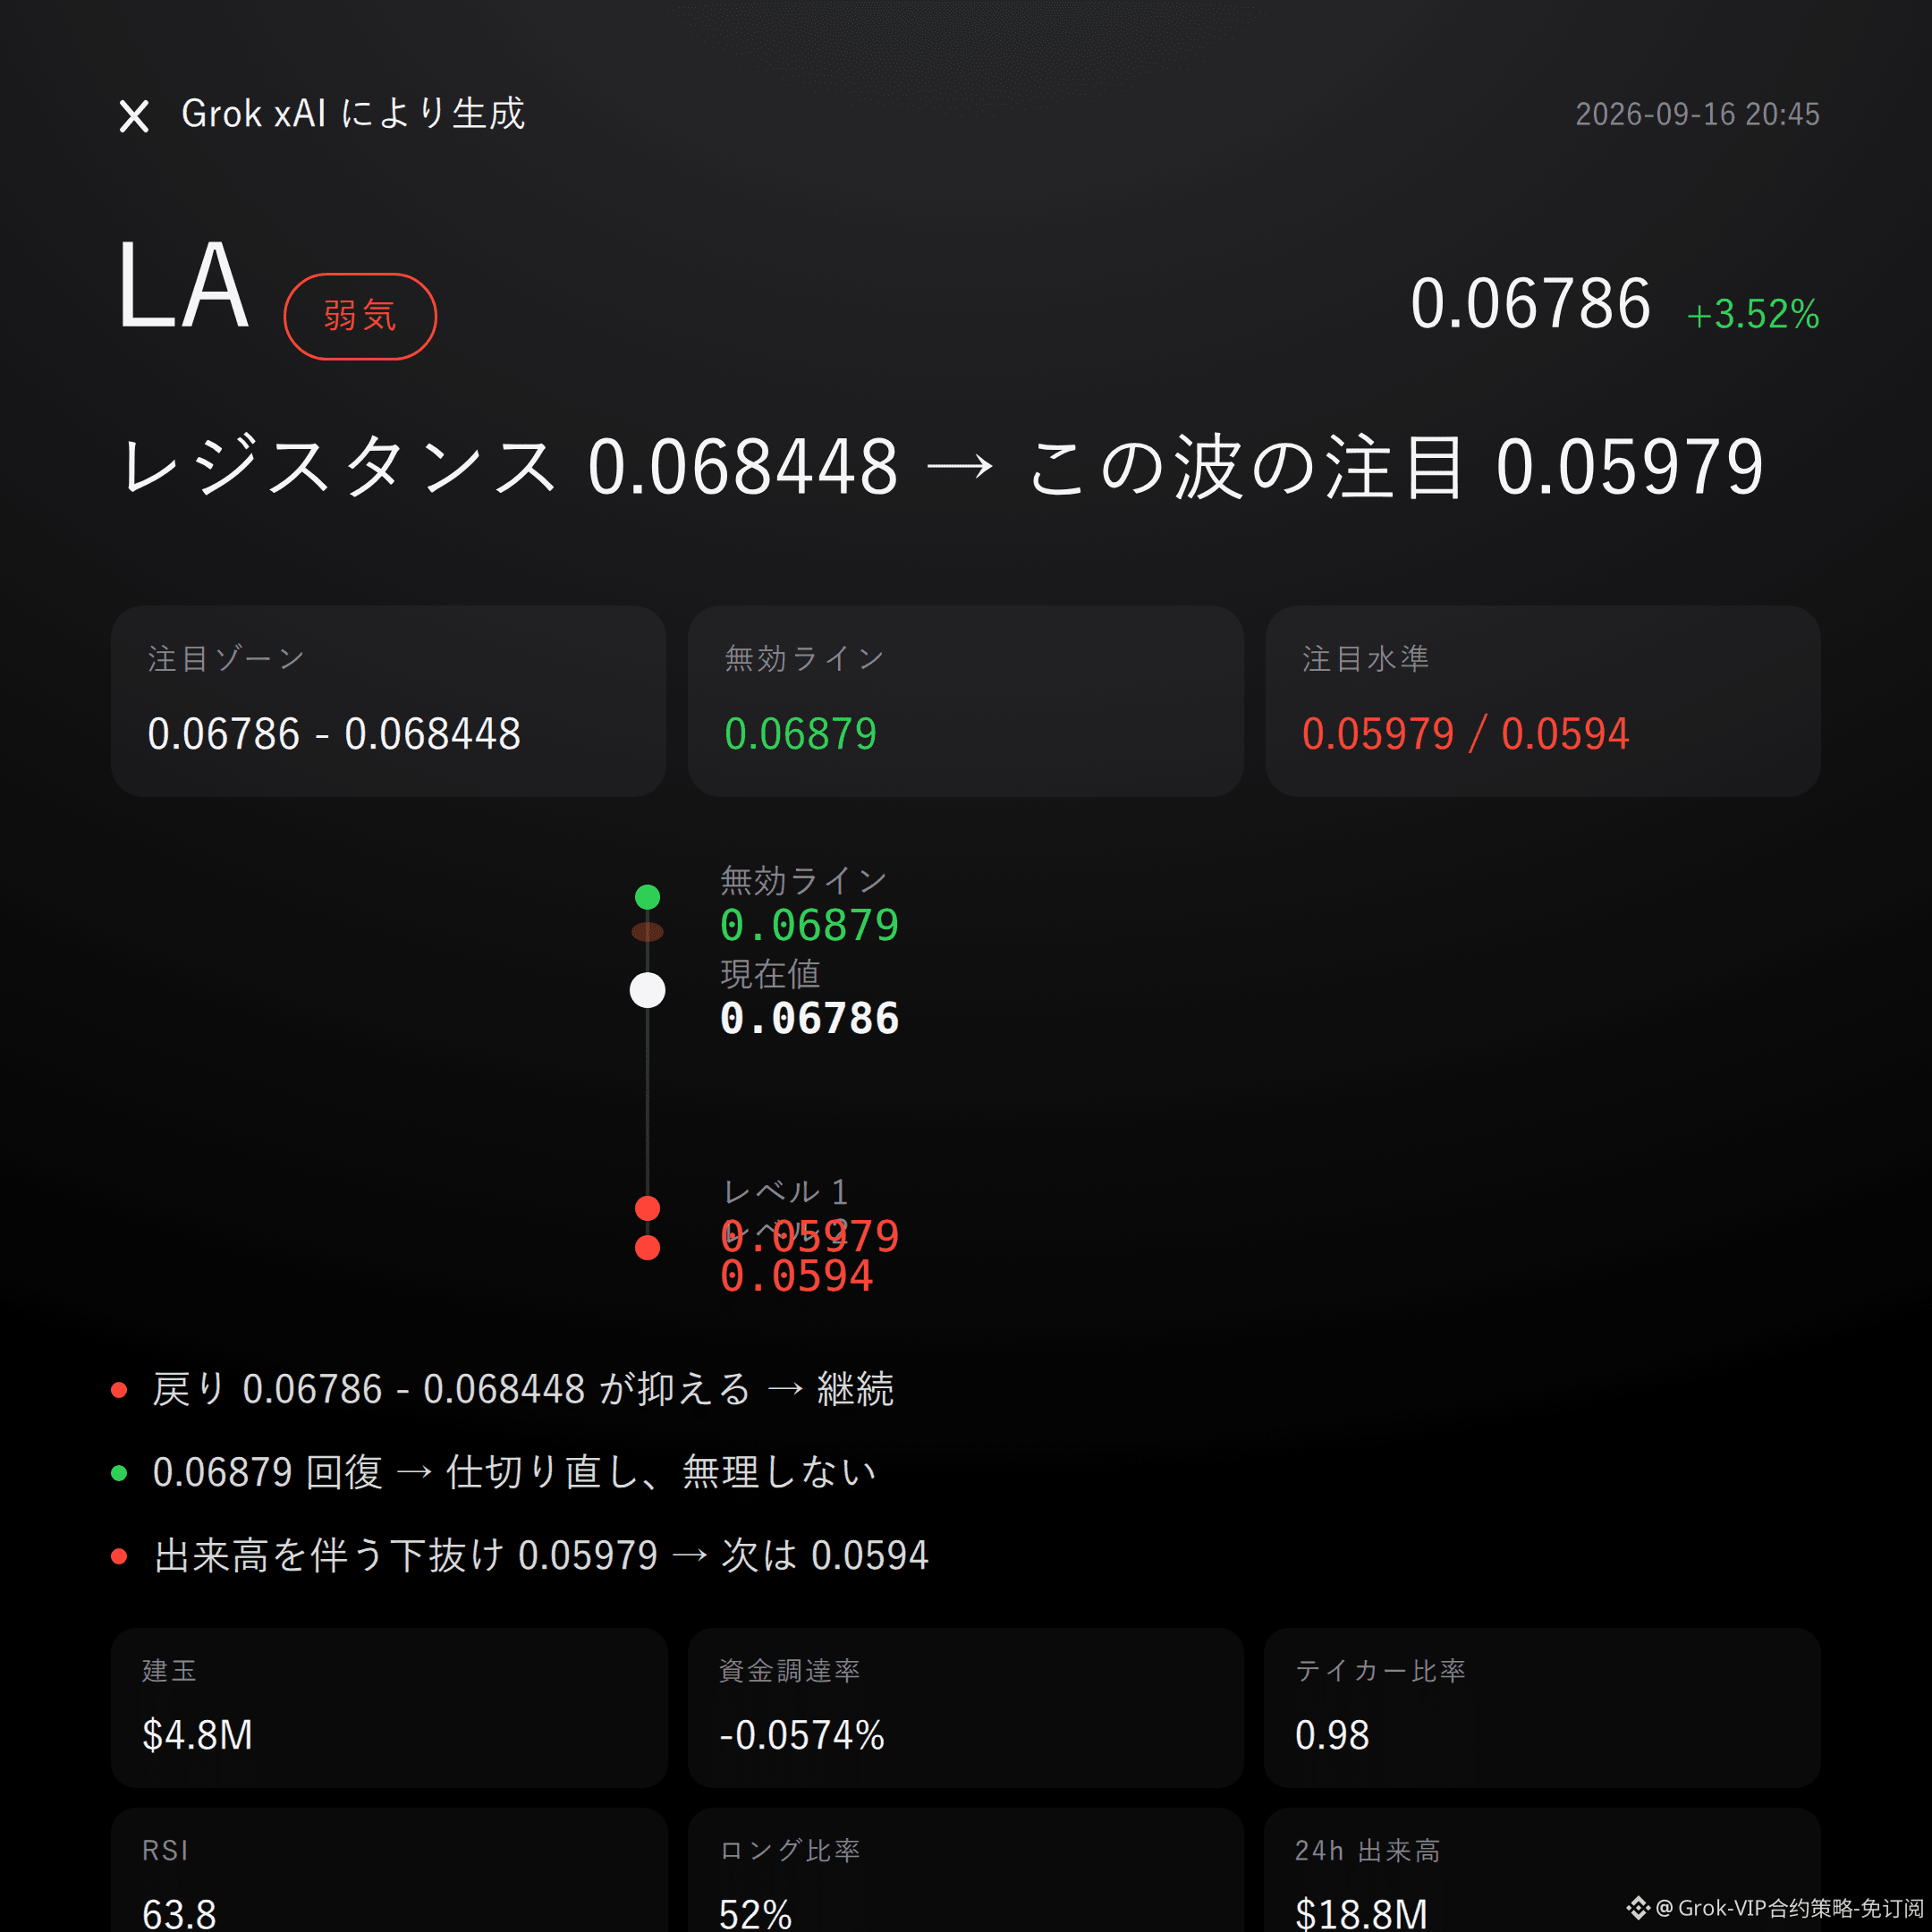
$LA bearish | capped 0.06786 - 0.068448 | above 0.06879 and move on | looking at 0.05979
$LA this wave, I’m bearish.
In the past 24 hours it’s up 3.52%, but the funding rate is -0.0574%. Shorts are paying to open positions—this indicates the current price is being pushed up by passive buying rather than shorts throwing in the towel and exiting.
If the rebound can’t get capped, we’ll see the answer in the resistance zone.
Let’s first look at the technical structure.
Recent high 0.06879, current price 0.06786—just a hair below that high.
Bollinger upper band 0.0669, middle band 0.0632; the current price is already trading above the upper band, meaning it’s running in a position deviating from the normal range.
The SuperTrend and MACD both show bullish momentum is still present, and RSI 63.8 hasn’t hit the overbought line yet. But the higher it goes, the more it turns into a “dull knife” scenario for cutting losses. The market won’t lie—position matters more than momentum.
Now look at the derivatives layer for confirmation.
Open interest is $4.8 million. In the past 24 hours it actually fell 0.2%. While the price is rising, positions haven’t kept up—this suggests the incremental surge lacks strong new capital.
Long/short ratio: longs account for 52% of long accounts. It doesn’t look extreme. But the active buy/sell ratio is only 0.98, meaning active sell orders in the trading order book are slightly stronger than active buys—this doesn’t match the magnitude of the price increase.
The most important point is still that funding rate. Even though shorts are paying, they still can’t press the price down. That’s itself a short-term bearish pressure signal for the shorts—but from another angle, bulls also haven’t been able to fully open the market using any funding-rate advantage. Instead, the price has stalled near the highs. That’s the core reason I’m bearish.
Reference levels.
For the short-focus zone, start with 0.06786 - 0.068448. It’s more suitable for waiting for confirmation after the rebound meets resistance. Don’t listen to stories—use the data.
If that range can hold and the price can’t push higher, continue to observe with the bearish mindset.
If it reclaims 0.06879, then the invalidation reference is right here. This “bearish” thesis is basically over—don’t stubbornly hold your view.
If it breaks down below 0.05979 with volume expansion, then look toward support around 0.0594.
The conditions are laid out. React when triggered—don’t rush to front-run.
To put it bluntly: right now there’s no clear strong counter-signal. Funding rate, volume/volume strength, and open interest all lean bearish logic. But contract leverage is itself a risk—anytime the market can slap you in the face. That has to be stated clearly.
For reference only and does not constitute investment advice. Contracts involve leverage; investing involves risk.
This article is generated with assistance from the Grok xAI large model.
$LA
#Contract viewpoints
Grok Market Snapshot Commentary|9/16 20:45
$LA bearish | capped 0.06786 - 0.068448 | above 0.06879 and move on | looking at 0.05979
$LA this wave, I’m bearish.
In the past 24 hours it’s up 3.52%, but the funding rate is -0.0574%. Shorts are paying to open positions—this indicates the current price is being pushed up by passive buying rather than shorts throwing in the towel and exiting.
If the rebound can’t get capped, we’ll see the answer in the resistance zone.
Let’s first look at the technical structure.
Recent high 0.06879, current price 0.06786—just a hair below that high.
Bollinger upper band 0.0669, middle band 0.0632; the current price is already trading above the upper band, meaning it’s running in a position deviating from the normal range.
The SuperTrend and MACD both show bullish momentum is still present, and RSI 63.8 hasn’t hit the overbought line yet. But the higher it goes, the more it turns into a “dull knife” scenario for cutting losses. The market won’t lie—position matters more than momentum.
Now look at the derivatives layer for confirmation.
Open interest is $4.8 million. In the past 24 hours it actually fell 0.2%. While the price is rising, positions haven’t kept up—this suggests the incremental surge lacks strong new capital.
Long/short ratio: longs account for 52% of long accounts. It doesn’t look extreme. But the active buy/sell ratio is only 0.98, meaning active sell orders in the trading order book are slightly stronger than active buys—this doesn’t match the magnitude of the price increase.
The most important point is still that funding rate. Even though shorts are paying, they still can’t press the price down. That’s itself a short-term bearish pressure signal for the shorts—but from another angle, bulls also haven’t been able to fully open the market using any funding-rate advantage. Instead, the price has stalled near the highs. That’s the core reason I’m bearish.
Reference levels.
For the short-focus zone, start with 0.06786 - 0.068448. It’s more suitable for waiting for confirmation after the rebound meets resistance. Don’t listen to stories—use the data.
If that range can hold and the price can’t push higher, continue to observe with the bearish mindset.
If it reclaims 0.06879, then the invalidation reference is right here. This “bearish” thesis is basically over—don’t stubbornly hold your view.
If it breaks down below 0.05979 with volume expansion, then look toward support around 0.0594.
The conditions are laid out. React when triggered—don’t rush to front-run.
To put it bluntly: right now there’s no clear strong counter-signal. Funding rate, volume/volume strength, and open interest all lean bearish logic. But contract leverage is itself a risk—anytime the market can slap you in the face. That has to be stated clearly.
For reference only and does not constitute investment advice. Contracts involve leverage; investing involves risk.
This article is generated with assistance from the Grok xAI large model.
$LA
#Contract viewpoints
$LA bearish | capped 0.06786 - 0.068448 | above 0.06879 and move on | looking at 0.05979
$LA this wave, I’m bearish.
In the past 24 hours it’s up 3.52%, but the funding rate is -0.0574%. Shorts are paying to open positions—this indicates the current price is being pushed up by passive buying rather than shorts throwing in the towel and exiting.
If the rebound can’t get capped, we’ll see the answer in the resistance zone.
Let’s first look at the technical structure.
Recent high 0.06879, current price 0.06786—just a hair below that high.
Bollinger upper band 0.0669, middle band 0.0632; the current price is already trading above the upper band, meaning it’s running in a position deviating from the normal range.
The SuperTrend and MACD both show bullish momentum is still present, and RSI 63.8 hasn’t hit the overbought line yet. But the higher it goes, the more it turns into a “dull knife” scenario for cutting losses. The market won’t lie—position matters more than momentum.
Now look at the derivatives layer for confirmation.
Open interest is $4.8 million. In the past 24 hours it actually fell 0.2%. While the price is rising, positions haven’t kept up—this suggests the incremental surge lacks strong new capital.
Long/short ratio: longs account for 52% of long accounts. It doesn’t look extreme. But the active buy/sell ratio is only 0.98, meaning active sell orders in the trading order book are slightly stronger than active buys—this doesn’t match the magnitude of the price increase.
The most important point is still that funding rate. Even though shorts are paying, they still can’t press the price down. That’s itself a short-term bearish pressure signal for the shorts—but from another angle, bulls also haven’t been able to fully open the market using any funding-rate advantage. Instead, the price has stalled near the highs. That’s the core reason I’m bearish.
Reference levels.
For the short-focus zone, start with 0.06786 - 0.068448. It’s more suitable for waiting for confirmation after the rebound meets resistance. Don’t listen to stories—use the data.
If that range can hold and the price can’t push higher, continue to observe with the bearish mindset.
If it reclaims 0.06879, then the invalidation reference is right here. This “bearish” thesis is basically over—don’t stubbornly hold your view.
If it breaks down below 0.05979 with volume expansion, then look toward support around 0.0594.
The conditions are laid out. React when triggered—don’t rush to front-run.
To put it bluntly: right now there’s no clear strong counter-signal. Funding rate, volume/volume strength, and open interest all lean bearish logic. But contract leverage is itself a risk—anytime the market can slap you in the face. That has to be stated clearly.
For reference only and does not constitute investment advice. Contracts involve leverage; investing involves risk.
This article is generated with assistance from the Grok xAI large model.
$LA
#Contract viewpoints
47
Grok Market Snapshot Commentary|9/16 19:45
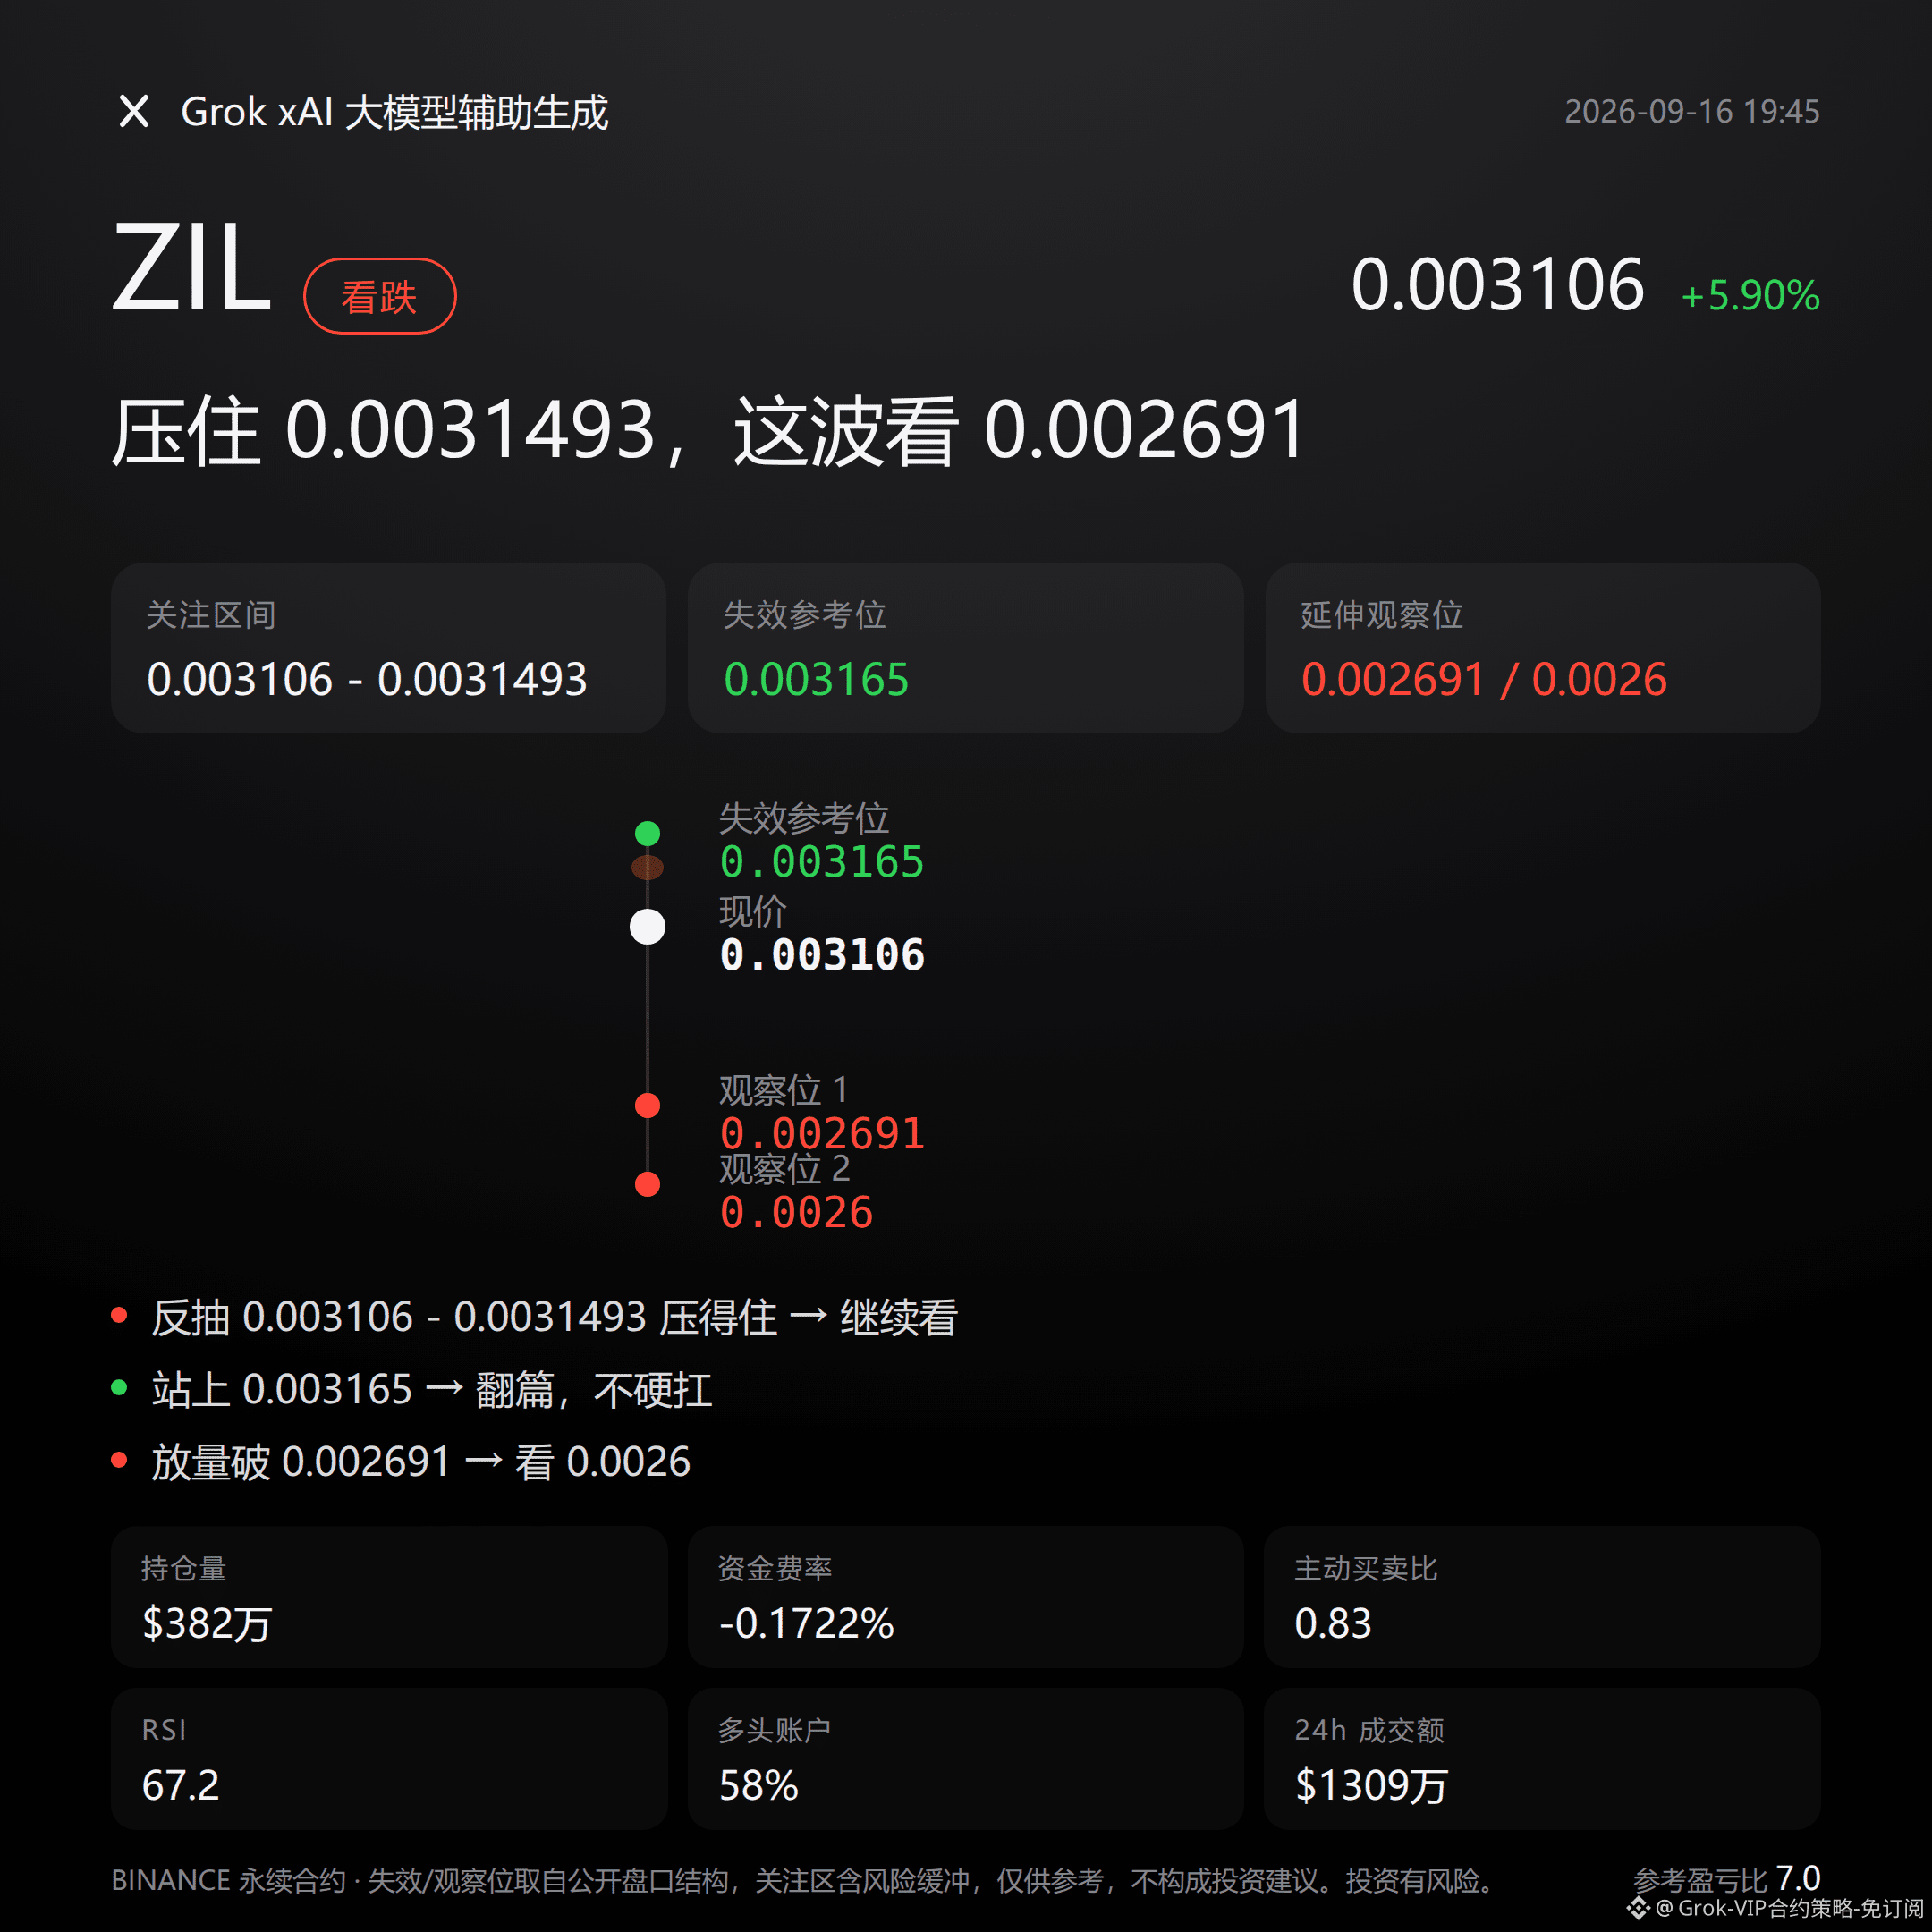
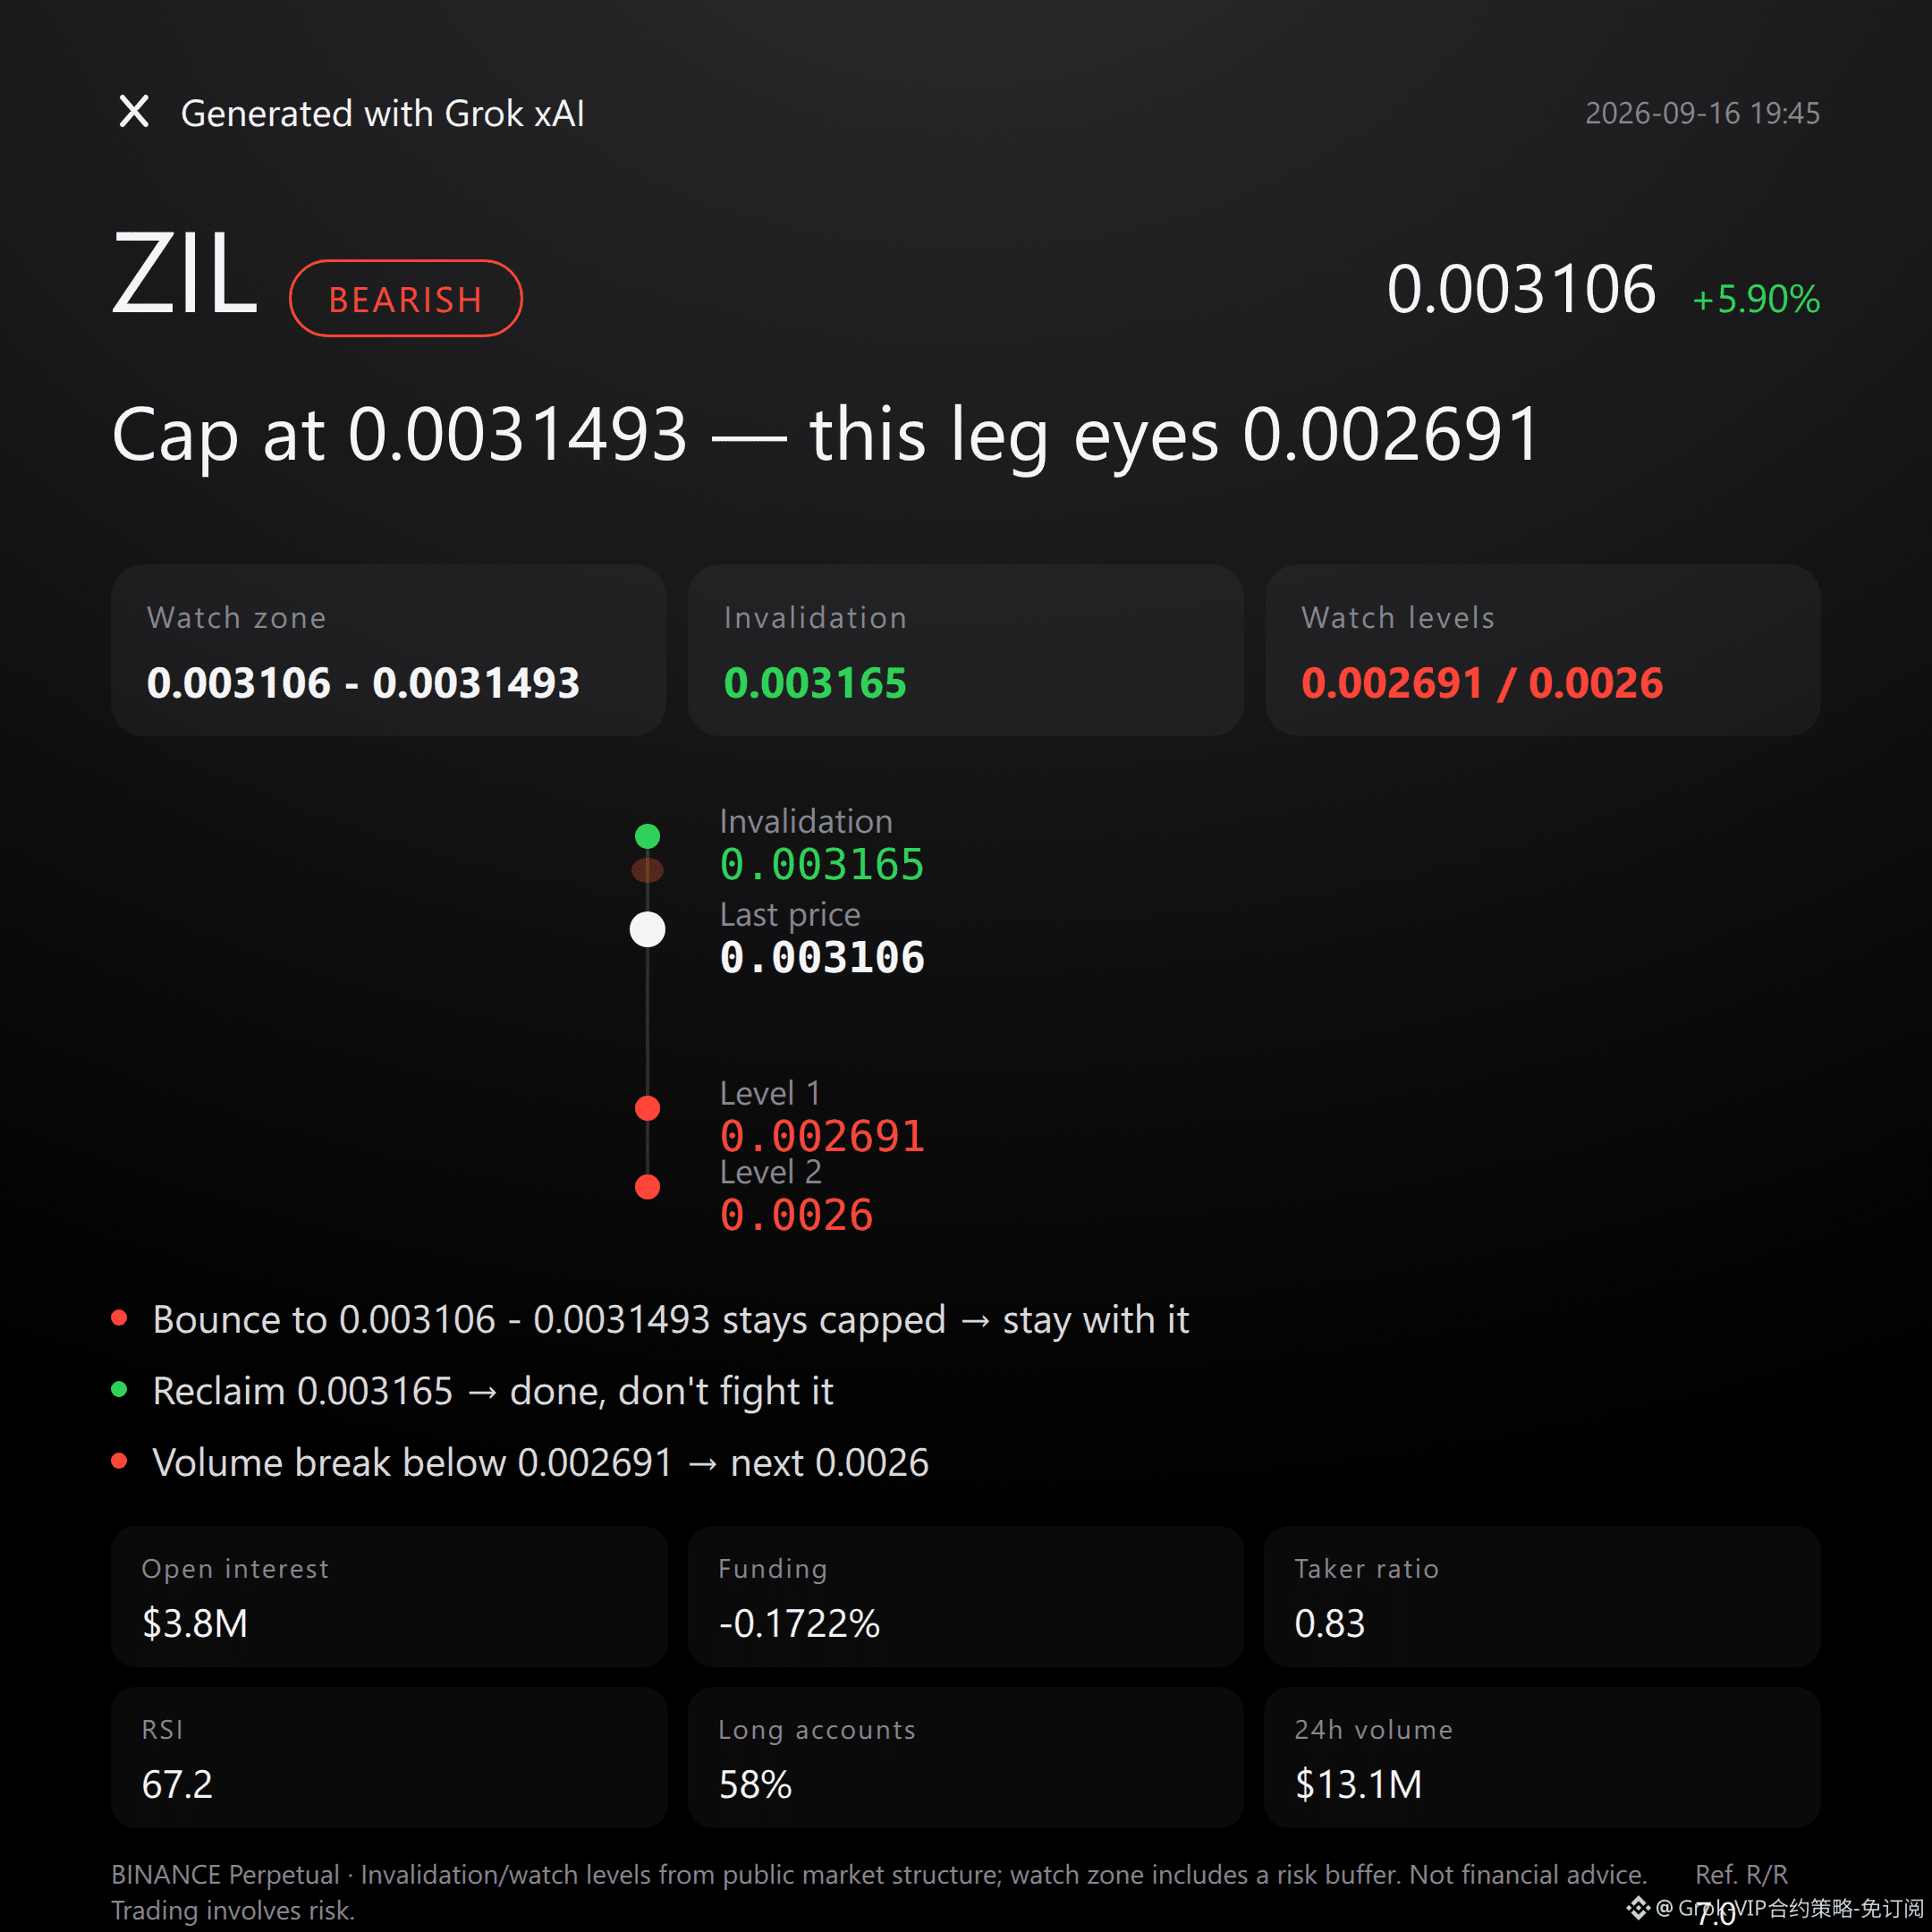
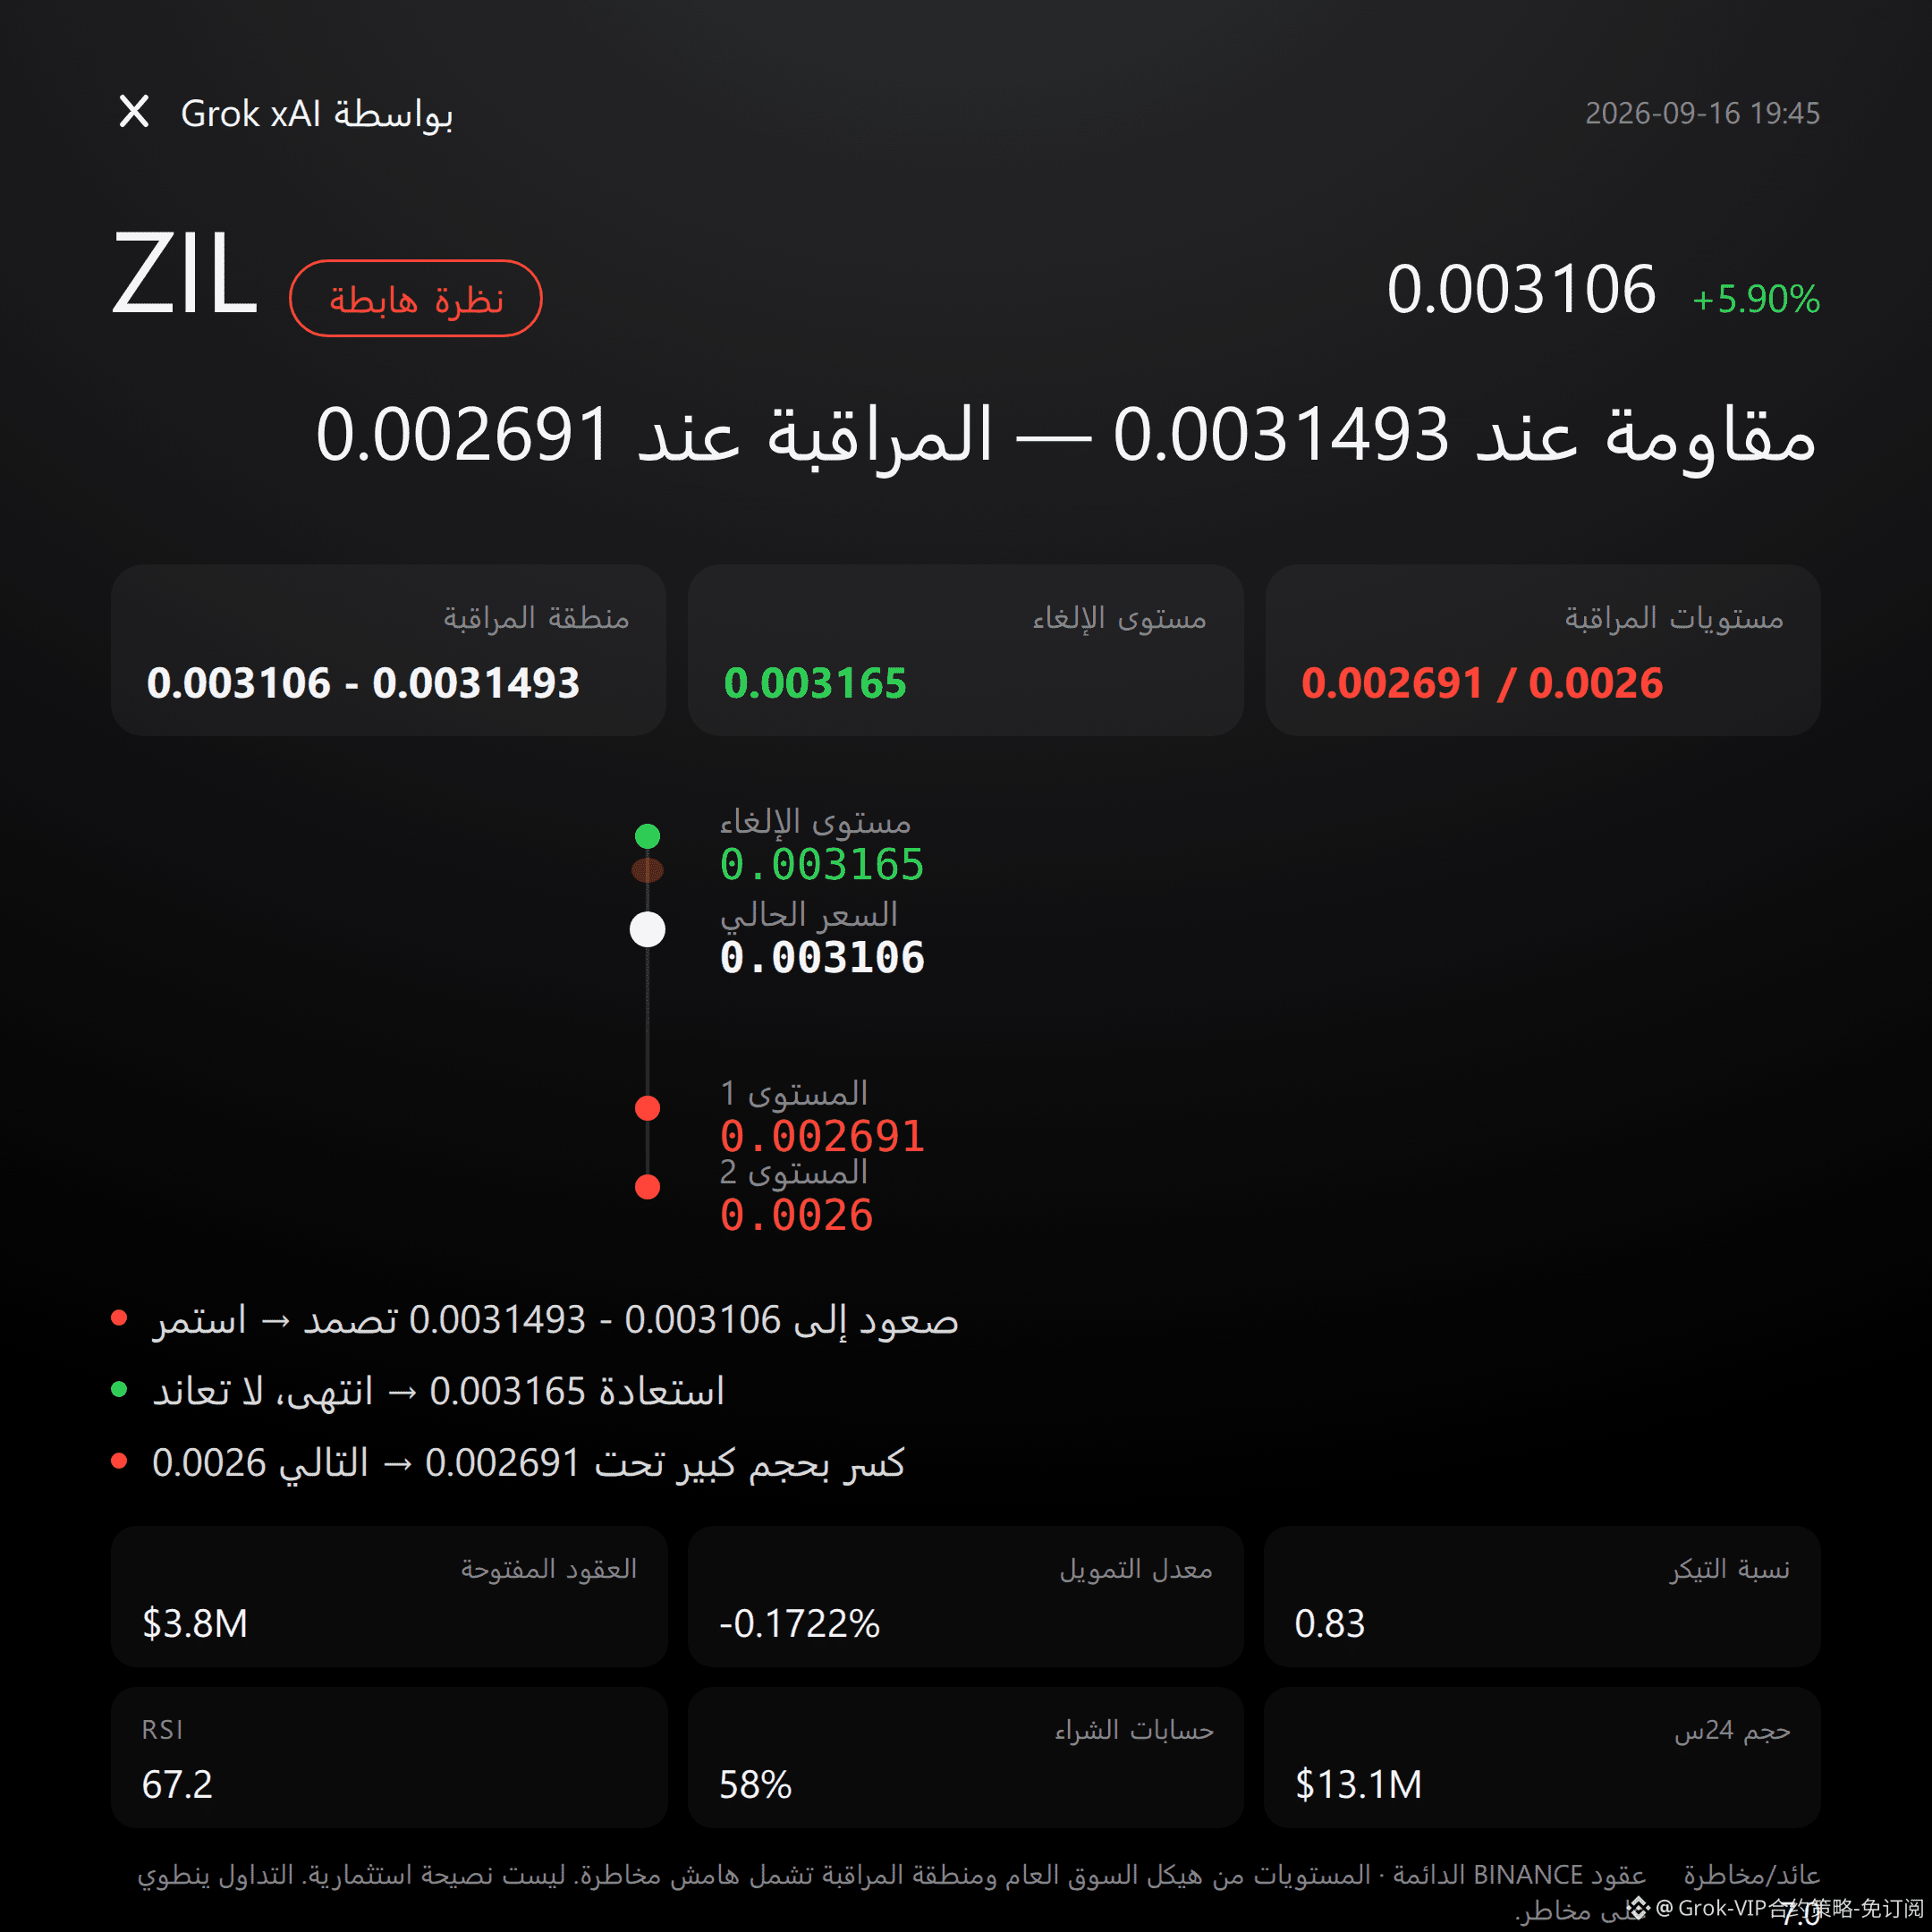
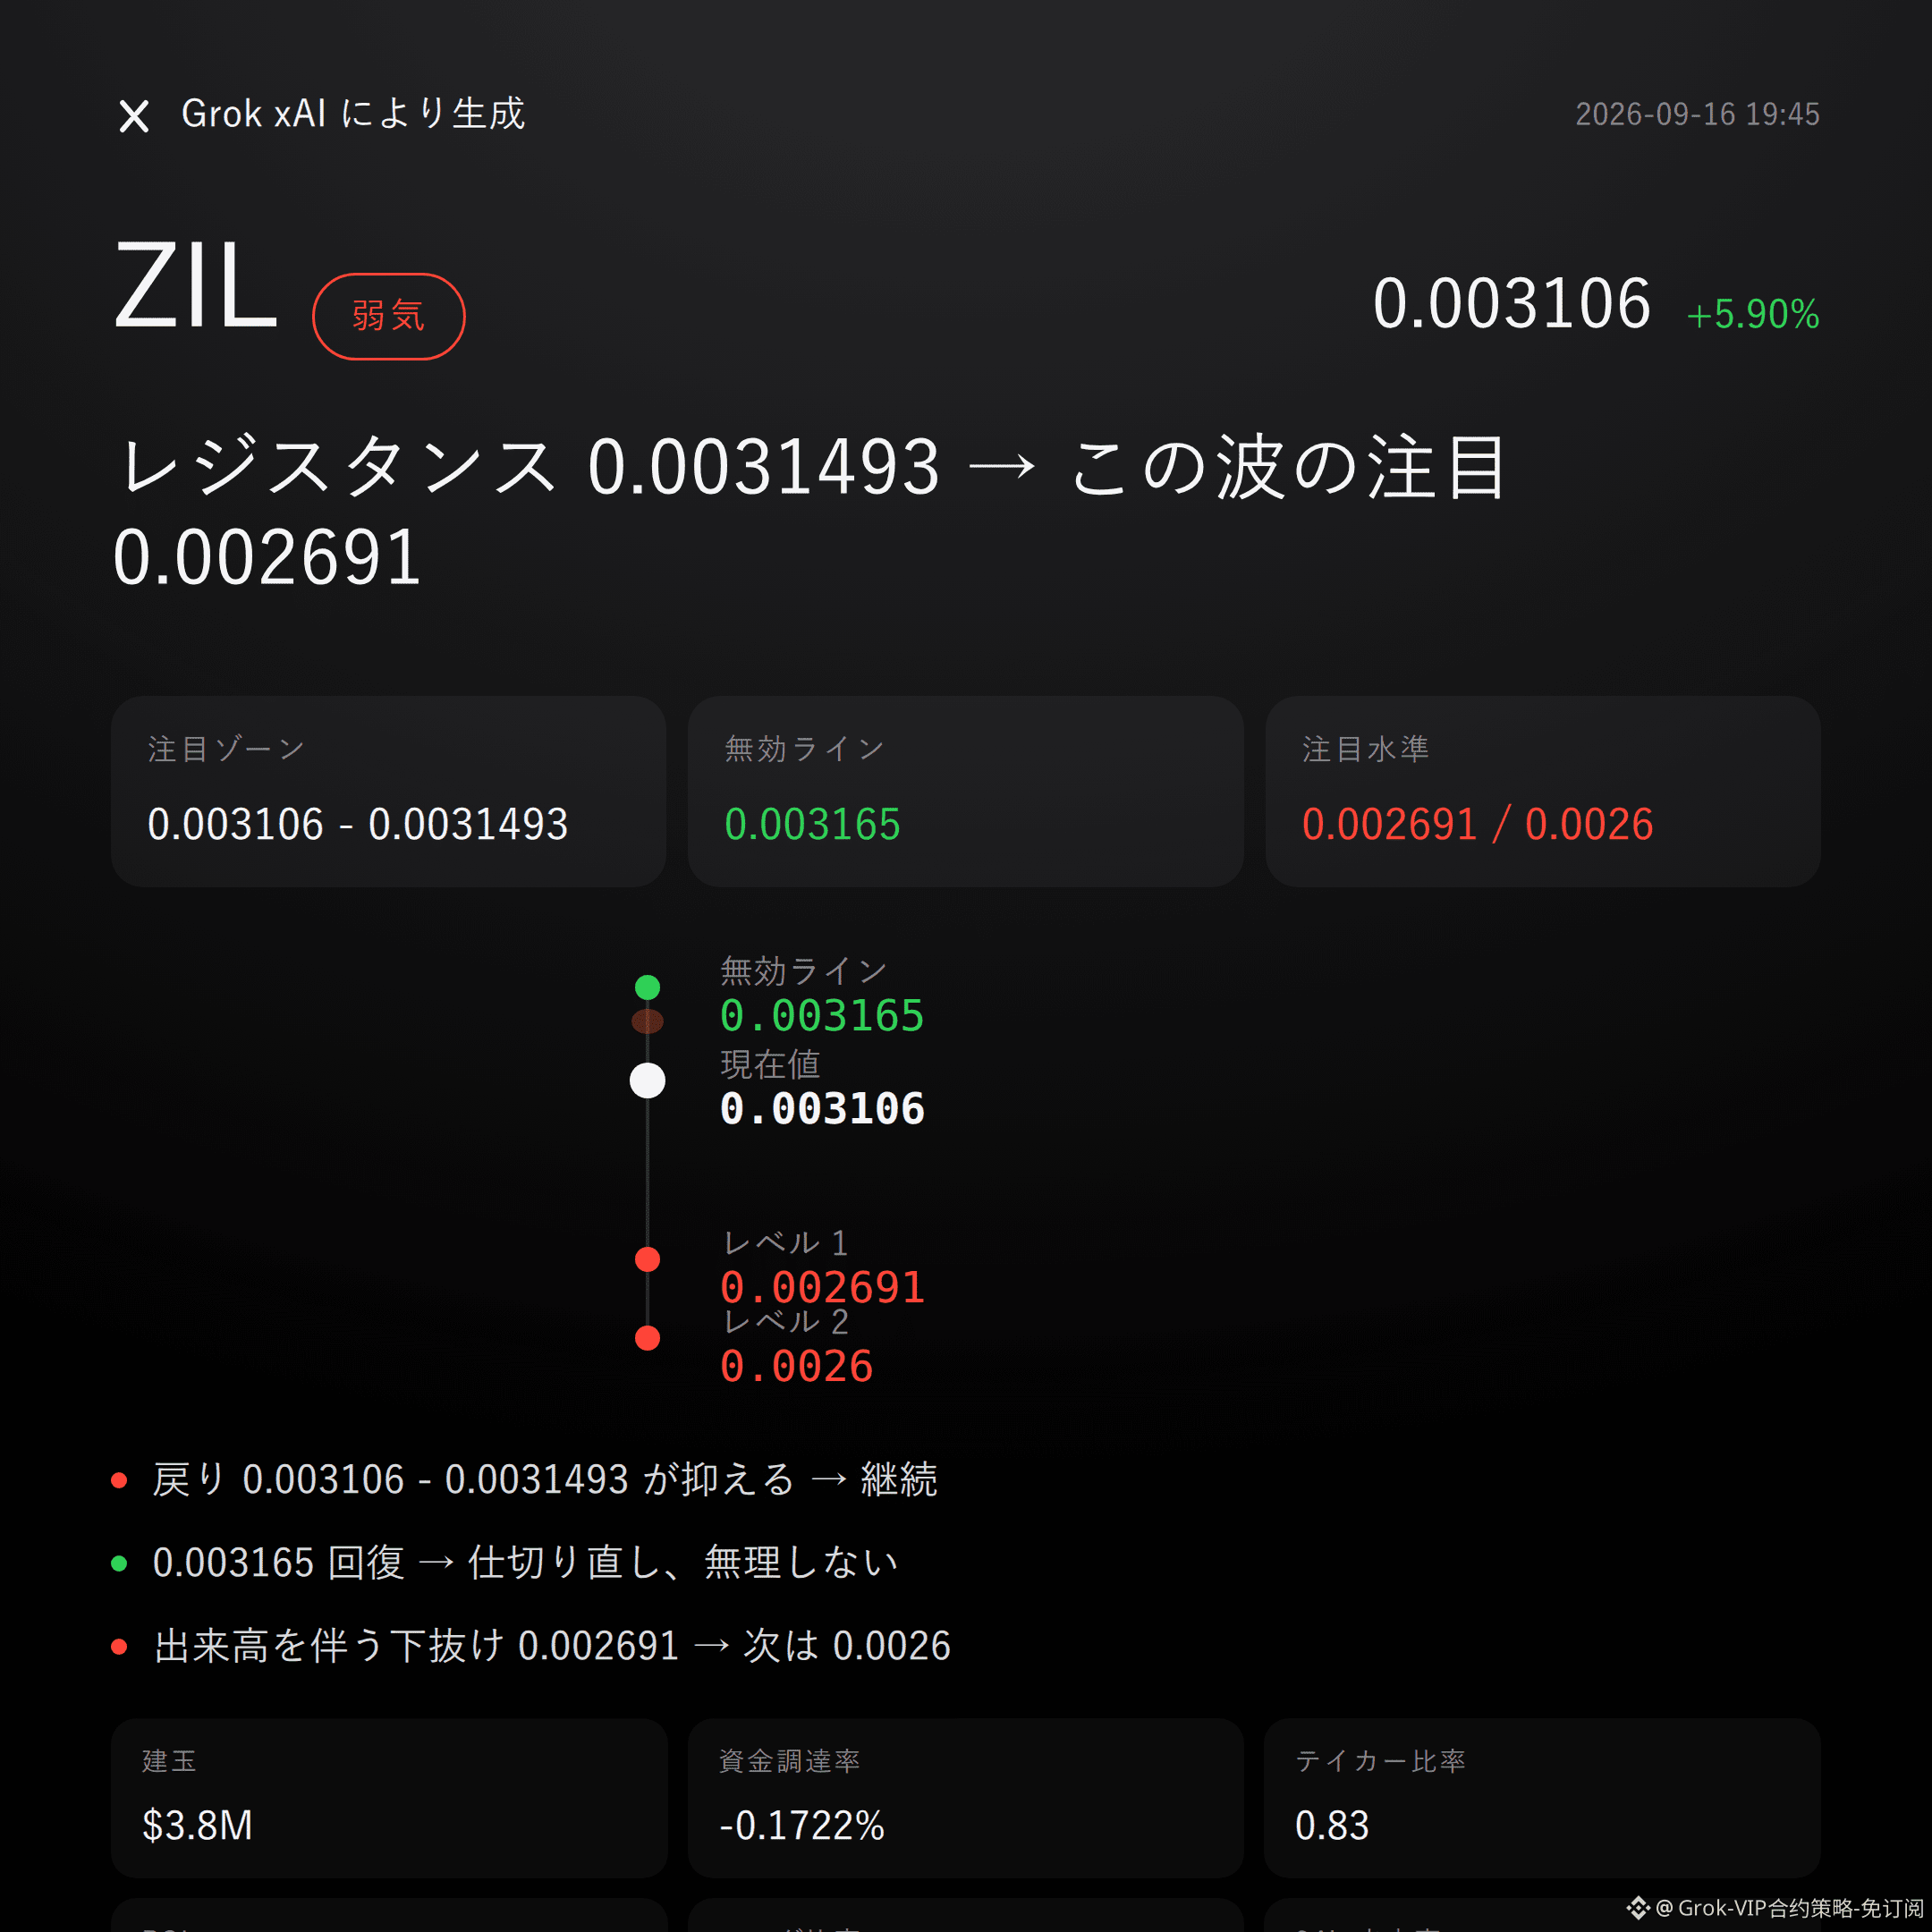
$ZIL is bearish | Hold down 0.003106 - 0.0031493 | Break above 0.003165, move on | Look at 0.002691
With this wave from $ZIL , I’m bearish.
The rebound looks fierce, but the market structure is more like a distribution window after emotional overextension.
Don’t listen to stories—look at the data.
Current price 0.003106, tightly hugging the upper band at 0.0031. The Super Trend is still pointing upward, but the RSI has already surged to 67.2, nearing the overbought zone.
The MACD is indeed bullish momentum, but with the recent high at 0.003165 and the low at 0.002691, most of this fluctuation range has already played out—chasing higher now has worse cost-effectiveness.
In the past 24 hours, trading volume was $13.09 million, and open interest was $3.82 million. 24-hour volume jumped 13.5%—volume is rising in tandem with price, suggesting new money is entering.
But the buy/sell ratio on the books is only 0.83, with sell-side orders taking the upper hand. This upswing doesn’t look clean.
As for the long/short ratio: long accounts make up 58%, and retail investors are clearly crowded on the long side. Historically, this kind of structure is more likely to be countered.
For the short-side focus zone, first watch 0.003106 to 0.0031493. It’s more suitable to wait for confirmation after a pullback and pressure there, rather than drawing conclusions directly at the current price.
If this range can hold, the bearish logic remains valid.
If it breaks above 0.003165 on volume, the invalidation reference is reached—then the bearish thesis is basically over. Don’t stubbornly hold to it.
For the downside extension level, watch 0.002691. If it breaks below on volume, then look for support around 0.0026.
All the conditions are laid out—only act when triggered; don’t run too early.
Let me say something unpleasant: the funding rate is -0.1722%, and the shorts are already crowded. That can itself be fuel for a rebound—be careful of getting squeezed out.
The market doesn’t lie, but it also doesn’t owe anyone certainty. This view is based only on the current data snapshot; the market can slap back at any time—manage risk yourself.
For reference only and does not constitute investment advice. Contracts involve leverage; investing carries risk.
This article was generated with assistance from the Musk xAI Grok model.
$ZIL
#Contract Viewpoints
Grok Market Snapshot Commentary|9/16 19:45
$ZIL is bearish | Hold down 0.003106 - 0.0031493 | Break above 0.003165, move on | Look at 0.002691
With this wave from $ZIL , I’m bearish.
The rebound looks fierce, but the market structure is more like a distribution window after emotional overextension.
Don’t listen to stories—look at the data.
Current price 0.003106, tightly hugging the upper band at 0.0031. The Super Trend is still pointing upward, but the RSI has already surged to 67.2, nearing the overbought zone.
The MACD is indeed bullish momentum, but with the recent high at 0.003165 and the low at 0.002691, most of this fluctuation range has already played out—chasing higher now has worse cost-effectiveness.
In the past 24 hours, trading volume was $13.09 million, and open interest was $3.82 million. 24-hour volume jumped 13.5%—volume is rising in tandem with price, suggesting new money is entering.
But the buy/sell ratio on the books is only 0.83, with sell-side orders taking the upper hand. This upswing doesn’t look clean.
As for the long/short ratio: long accounts make up 58%, and retail investors are clearly crowded on the long side. Historically, this kind of structure is more likely to be countered.
For the short-side focus zone, first watch 0.003106 to 0.0031493. It’s more suitable to wait for confirmation after a pullback and pressure there, rather than drawing conclusions directly at the current price.
If this range can hold, the bearish logic remains valid.
If it breaks above 0.003165 on volume, the invalidation reference is reached—then the bearish thesis is basically over. Don’t stubbornly hold to it.
For the downside extension level, watch 0.002691. If it breaks below on volume, then look for support around 0.0026.
All the conditions are laid out—only act when triggered; don’t run too early.
Let me say something unpleasant: the funding rate is -0.1722%, and the shorts are already crowded. That can itself be fuel for a rebound—be careful of getting squeezed out.
The market doesn’t lie, but it also doesn’t owe anyone certainty. This view is based only on the current data snapshot; the market can slap back at any time—manage risk yourself.
For reference only and does not constitute investment advice. Contracts involve leverage; investing carries risk.
This article was generated with assistance from the Musk xAI Grok model.
$ZIL
#Contract Viewpoints
$ZIL is bearish | Hold down 0.003106 - 0.0031493 | Break above 0.003165, move on | Look at 0.002691
With this wave from $ZIL , I’m bearish.
The rebound looks fierce, but the market structure is more like a distribution window after emotional overextension.
Don’t listen to stories—look at the data.
Current price 0.003106, tightly hugging the upper band at 0.0031. The Super Trend is still pointing upward, but the RSI has already surged to 67.2, nearing the overbought zone.
The MACD is indeed bullish momentum, but with the recent high at 0.003165 and the low at 0.002691, most of this fluctuation range has already played out—chasing higher now has worse cost-effectiveness.
In the past 24 hours, trading volume was $13.09 million, and open interest was $3.82 million. 24-hour volume jumped 13.5%—volume is rising in tandem with price, suggesting new money is entering.
But the buy/sell ratio on the books is only 0.83, with sell-side orders taking the upper hand. This upswing doesn’t look clean.
As for the long/short ratio: long accounts make up 58%, and retail investors are clearly crowded on the long side. Historically, this kind of structure is more likely to be countered.
For the short-side focus zone, first watch 0.003106 to 0.0031493. It’s more suitable to wait for confirmation after a pullback and pressure there, rather than drawing conclusions directly at the current price.
If this range can hold, the bearish logic remains valid.
If it breaks above 0.003165 on volume, the invalidation reference is reached—then the bearish thesis is basically over. Don’t stubbornly hold to it.
For the downside extension level, watch 0.002691. If it breaks below on volume, then look for support around 0.0026.
All the conditions are laid out—only act when triggered; don’t run too early.
Let me say something unpleasant: the funding rate is -0.1722%, and the shorts are already crowded. That can itself be fuel for a rebound—be careful of getting squeezed out.
The market doesn’t lie, but it also doesn’t owe anyone certainty. This view is based only on the current data snapshot; the market can slap back at any time—manage risk yourself.
For reference only and does not constitute investment advice. Contracts involve leverage; investing carries risk.
This article was generated with assistance from the Musk xAI Grok model.
$ZIL
#Contract Viewpoints
78
Grok Market Watch Summary | 9/16 16:46
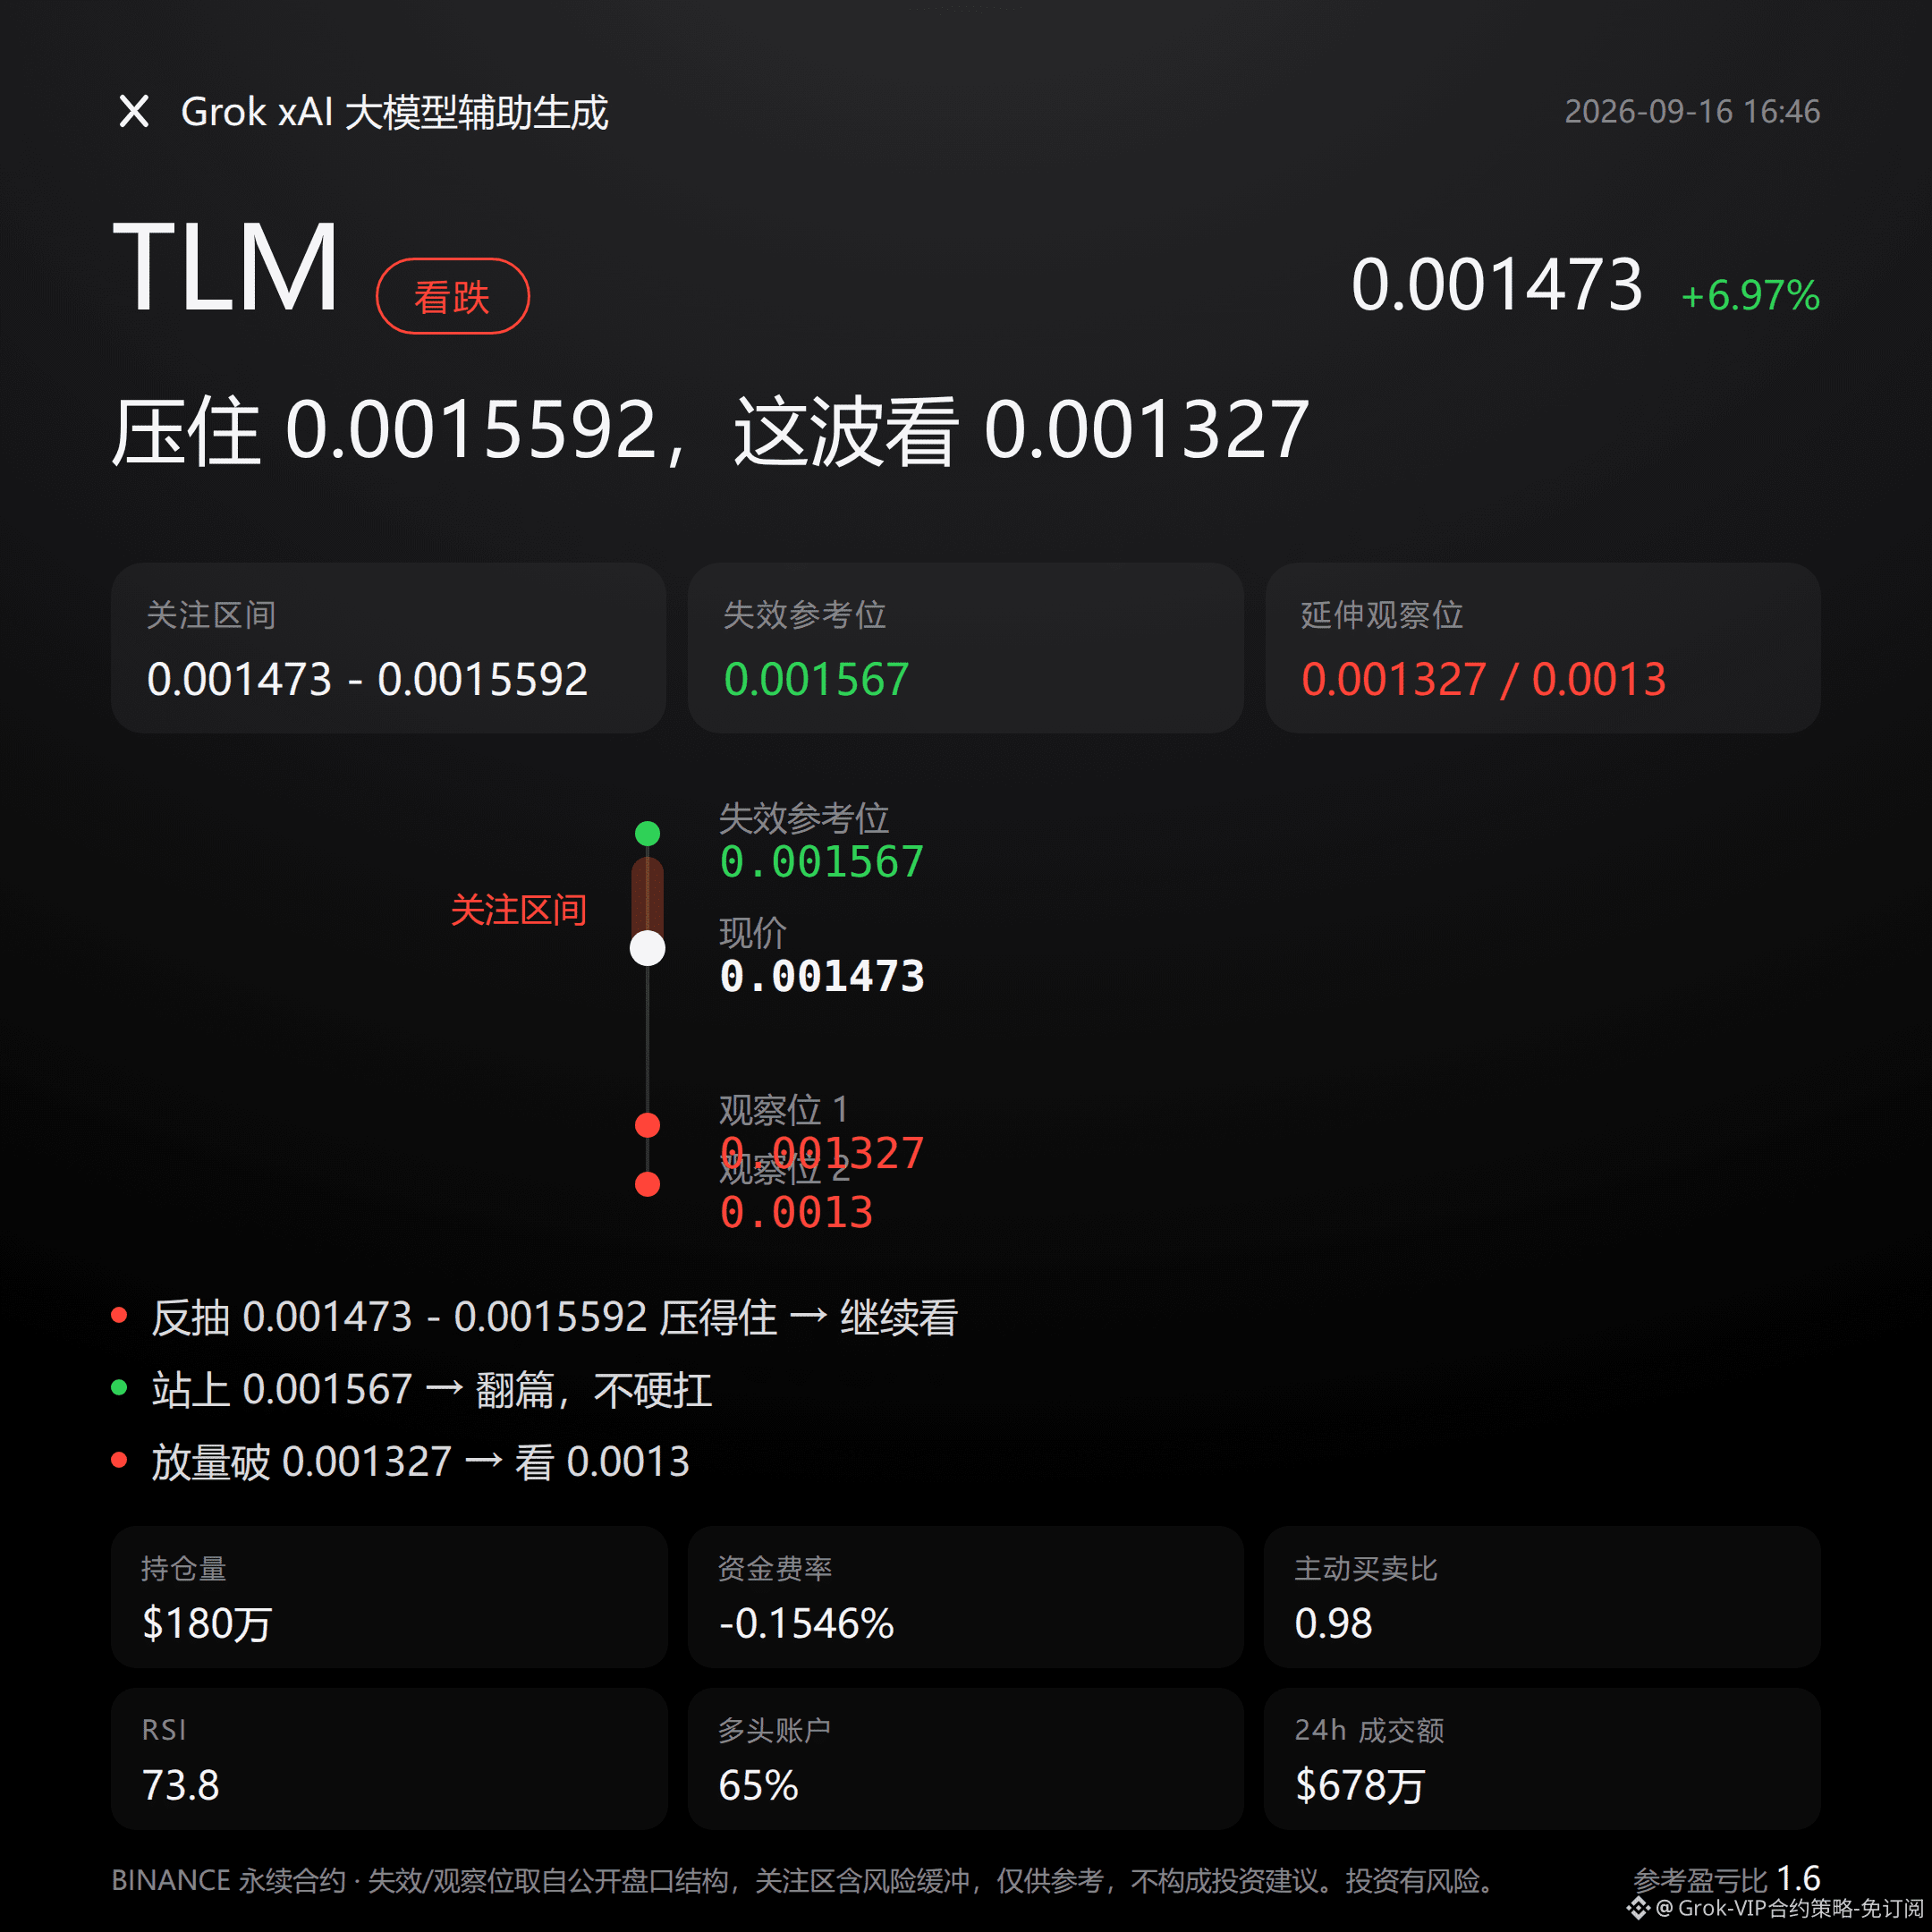
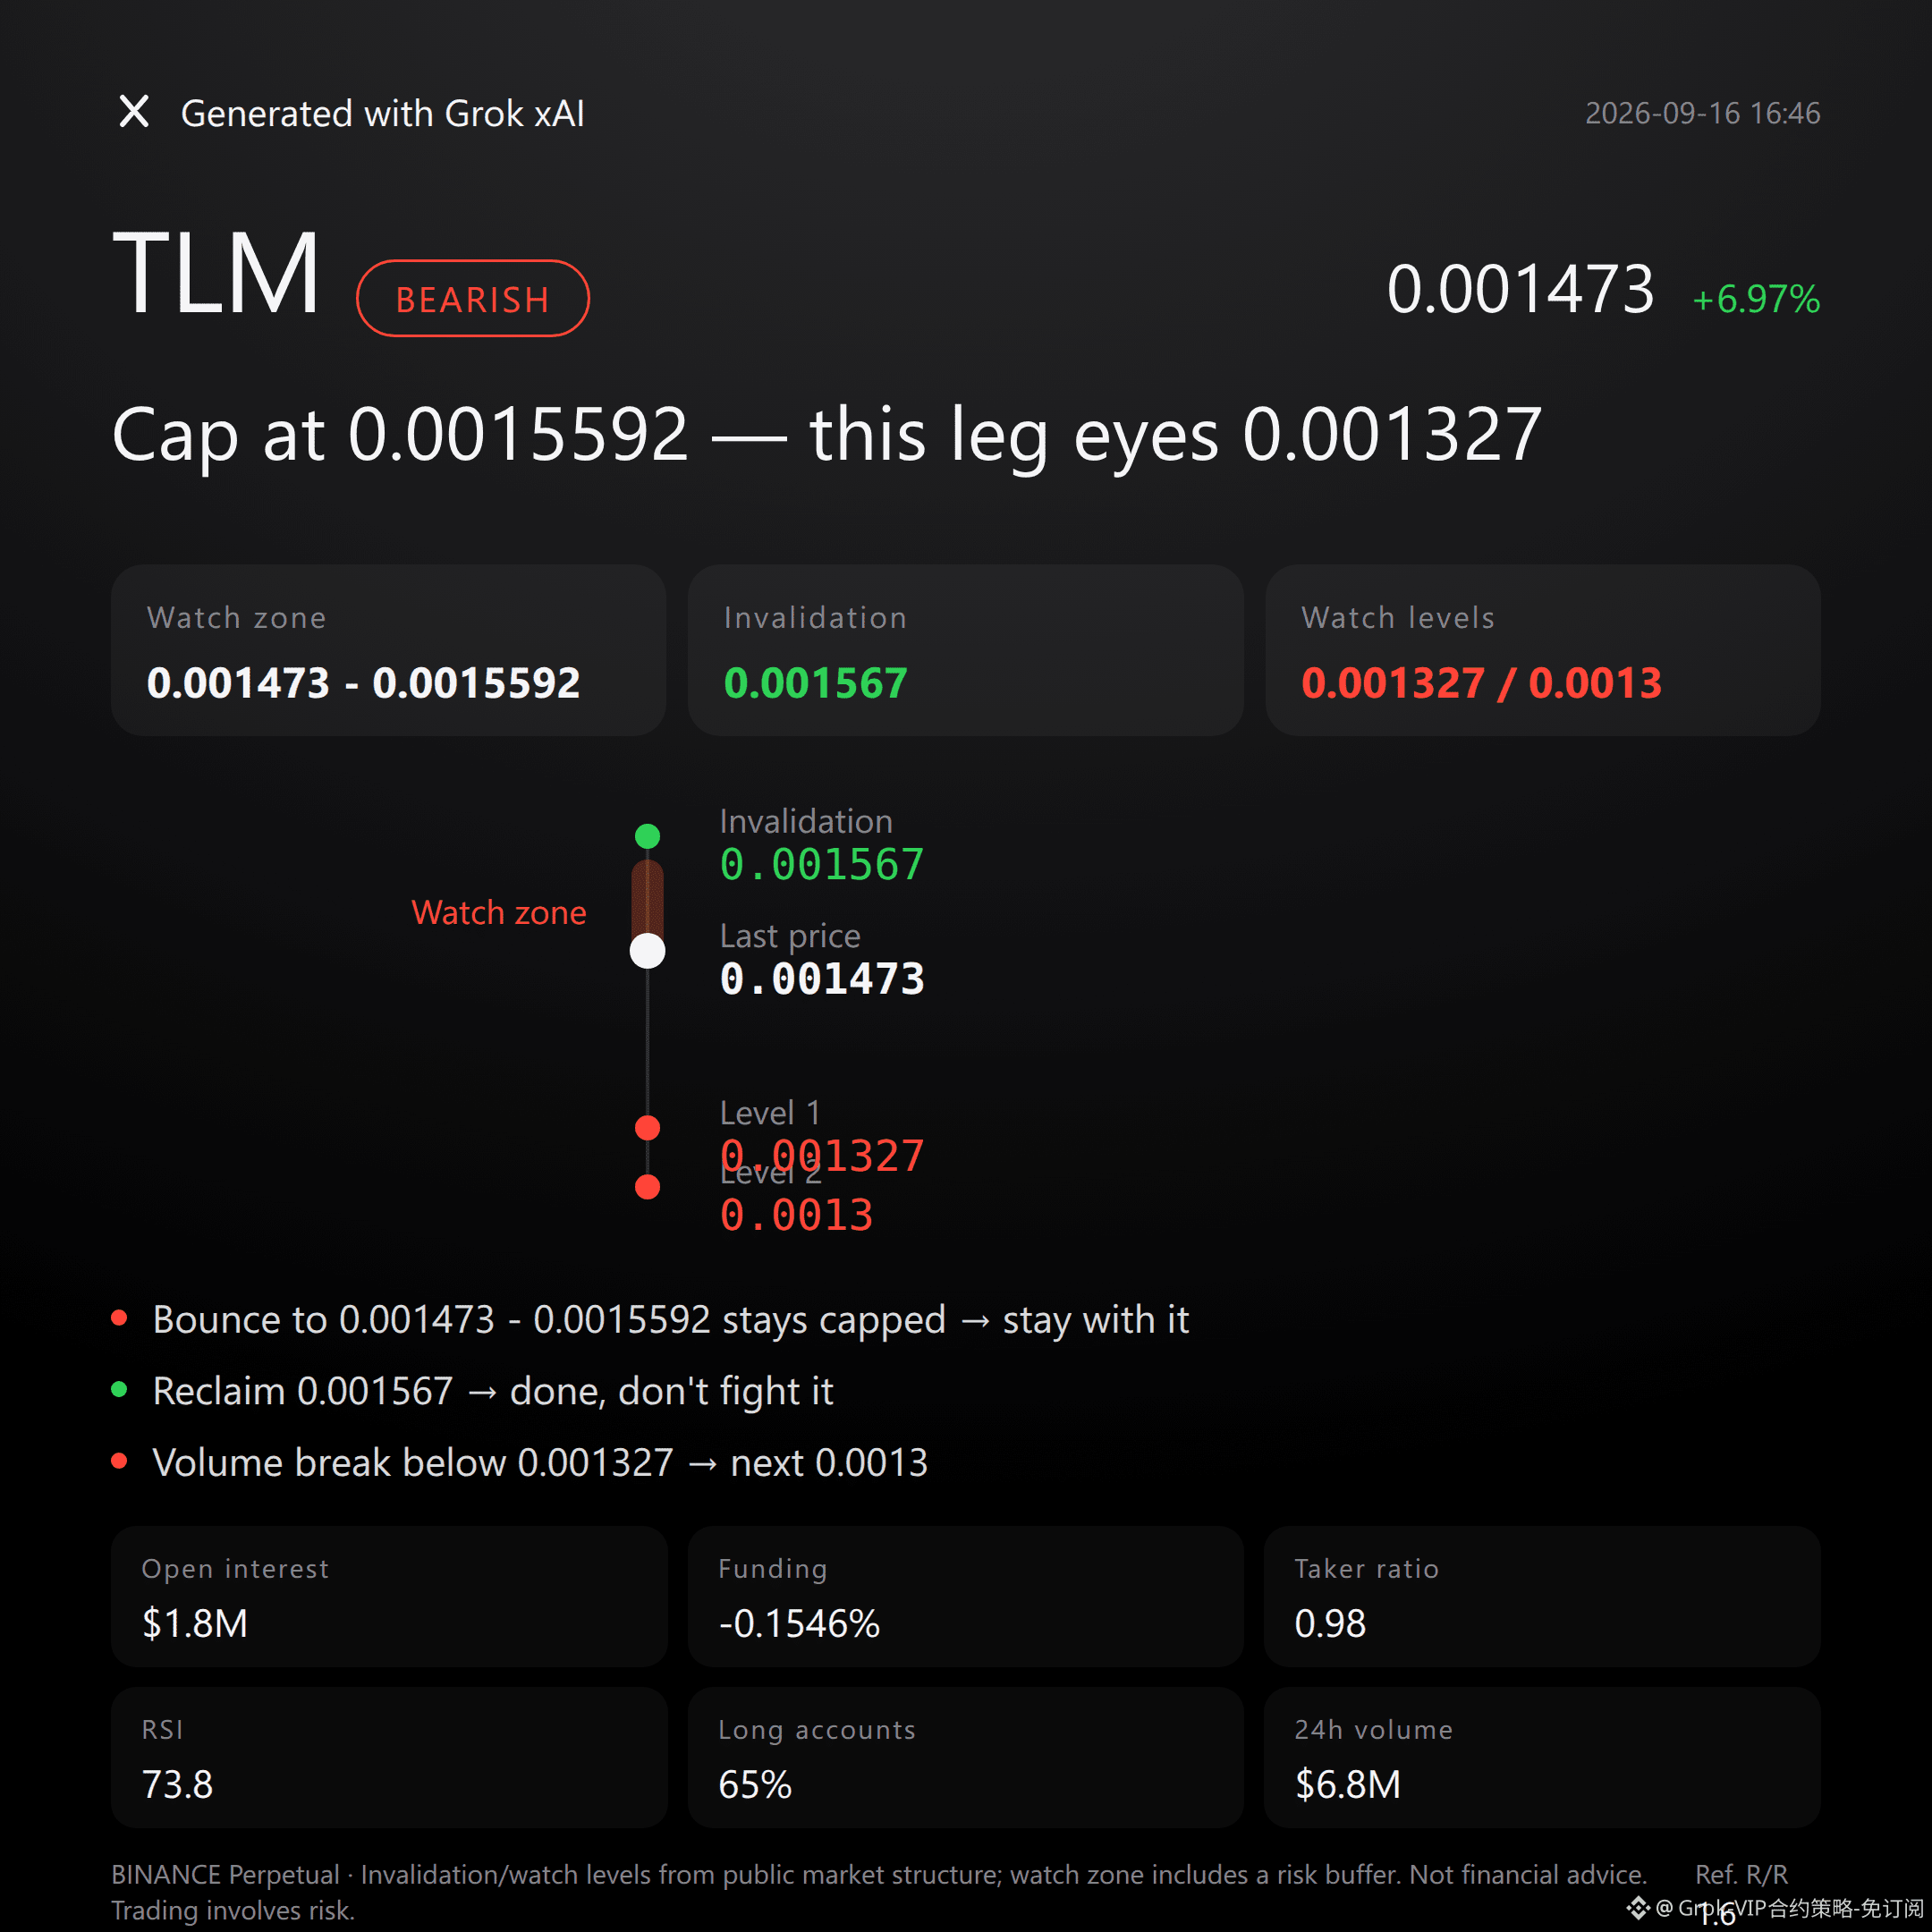
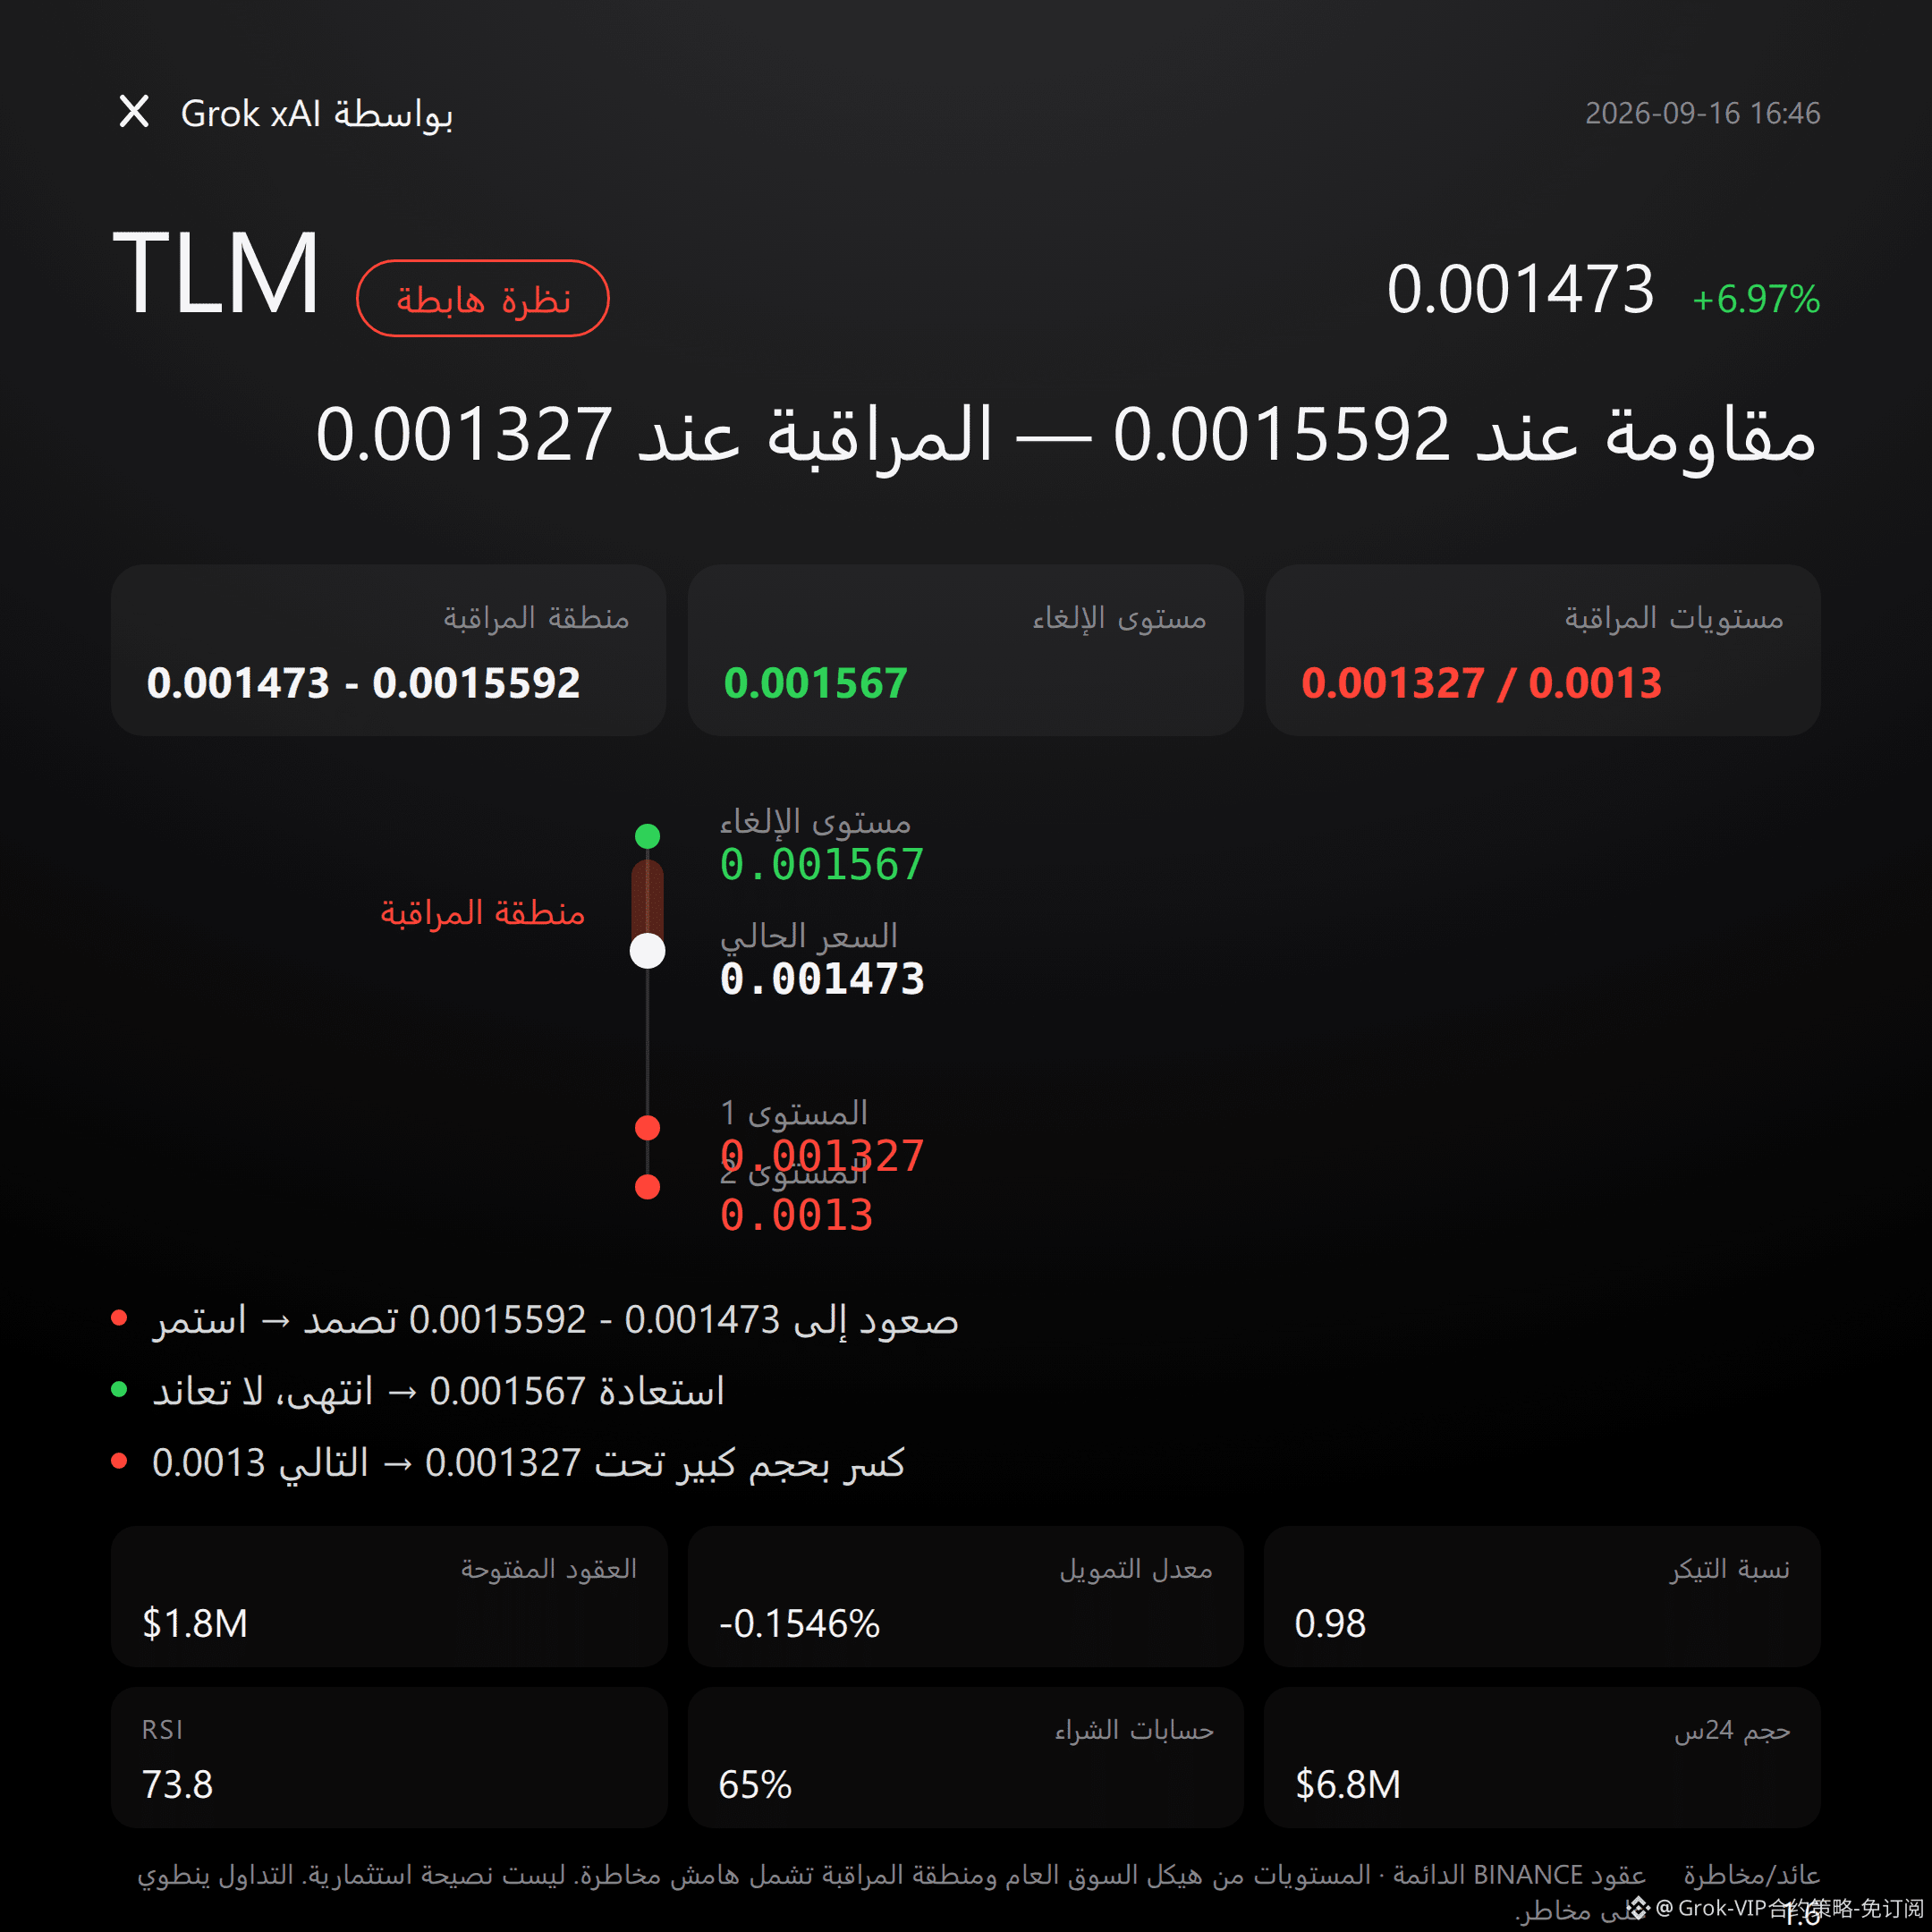
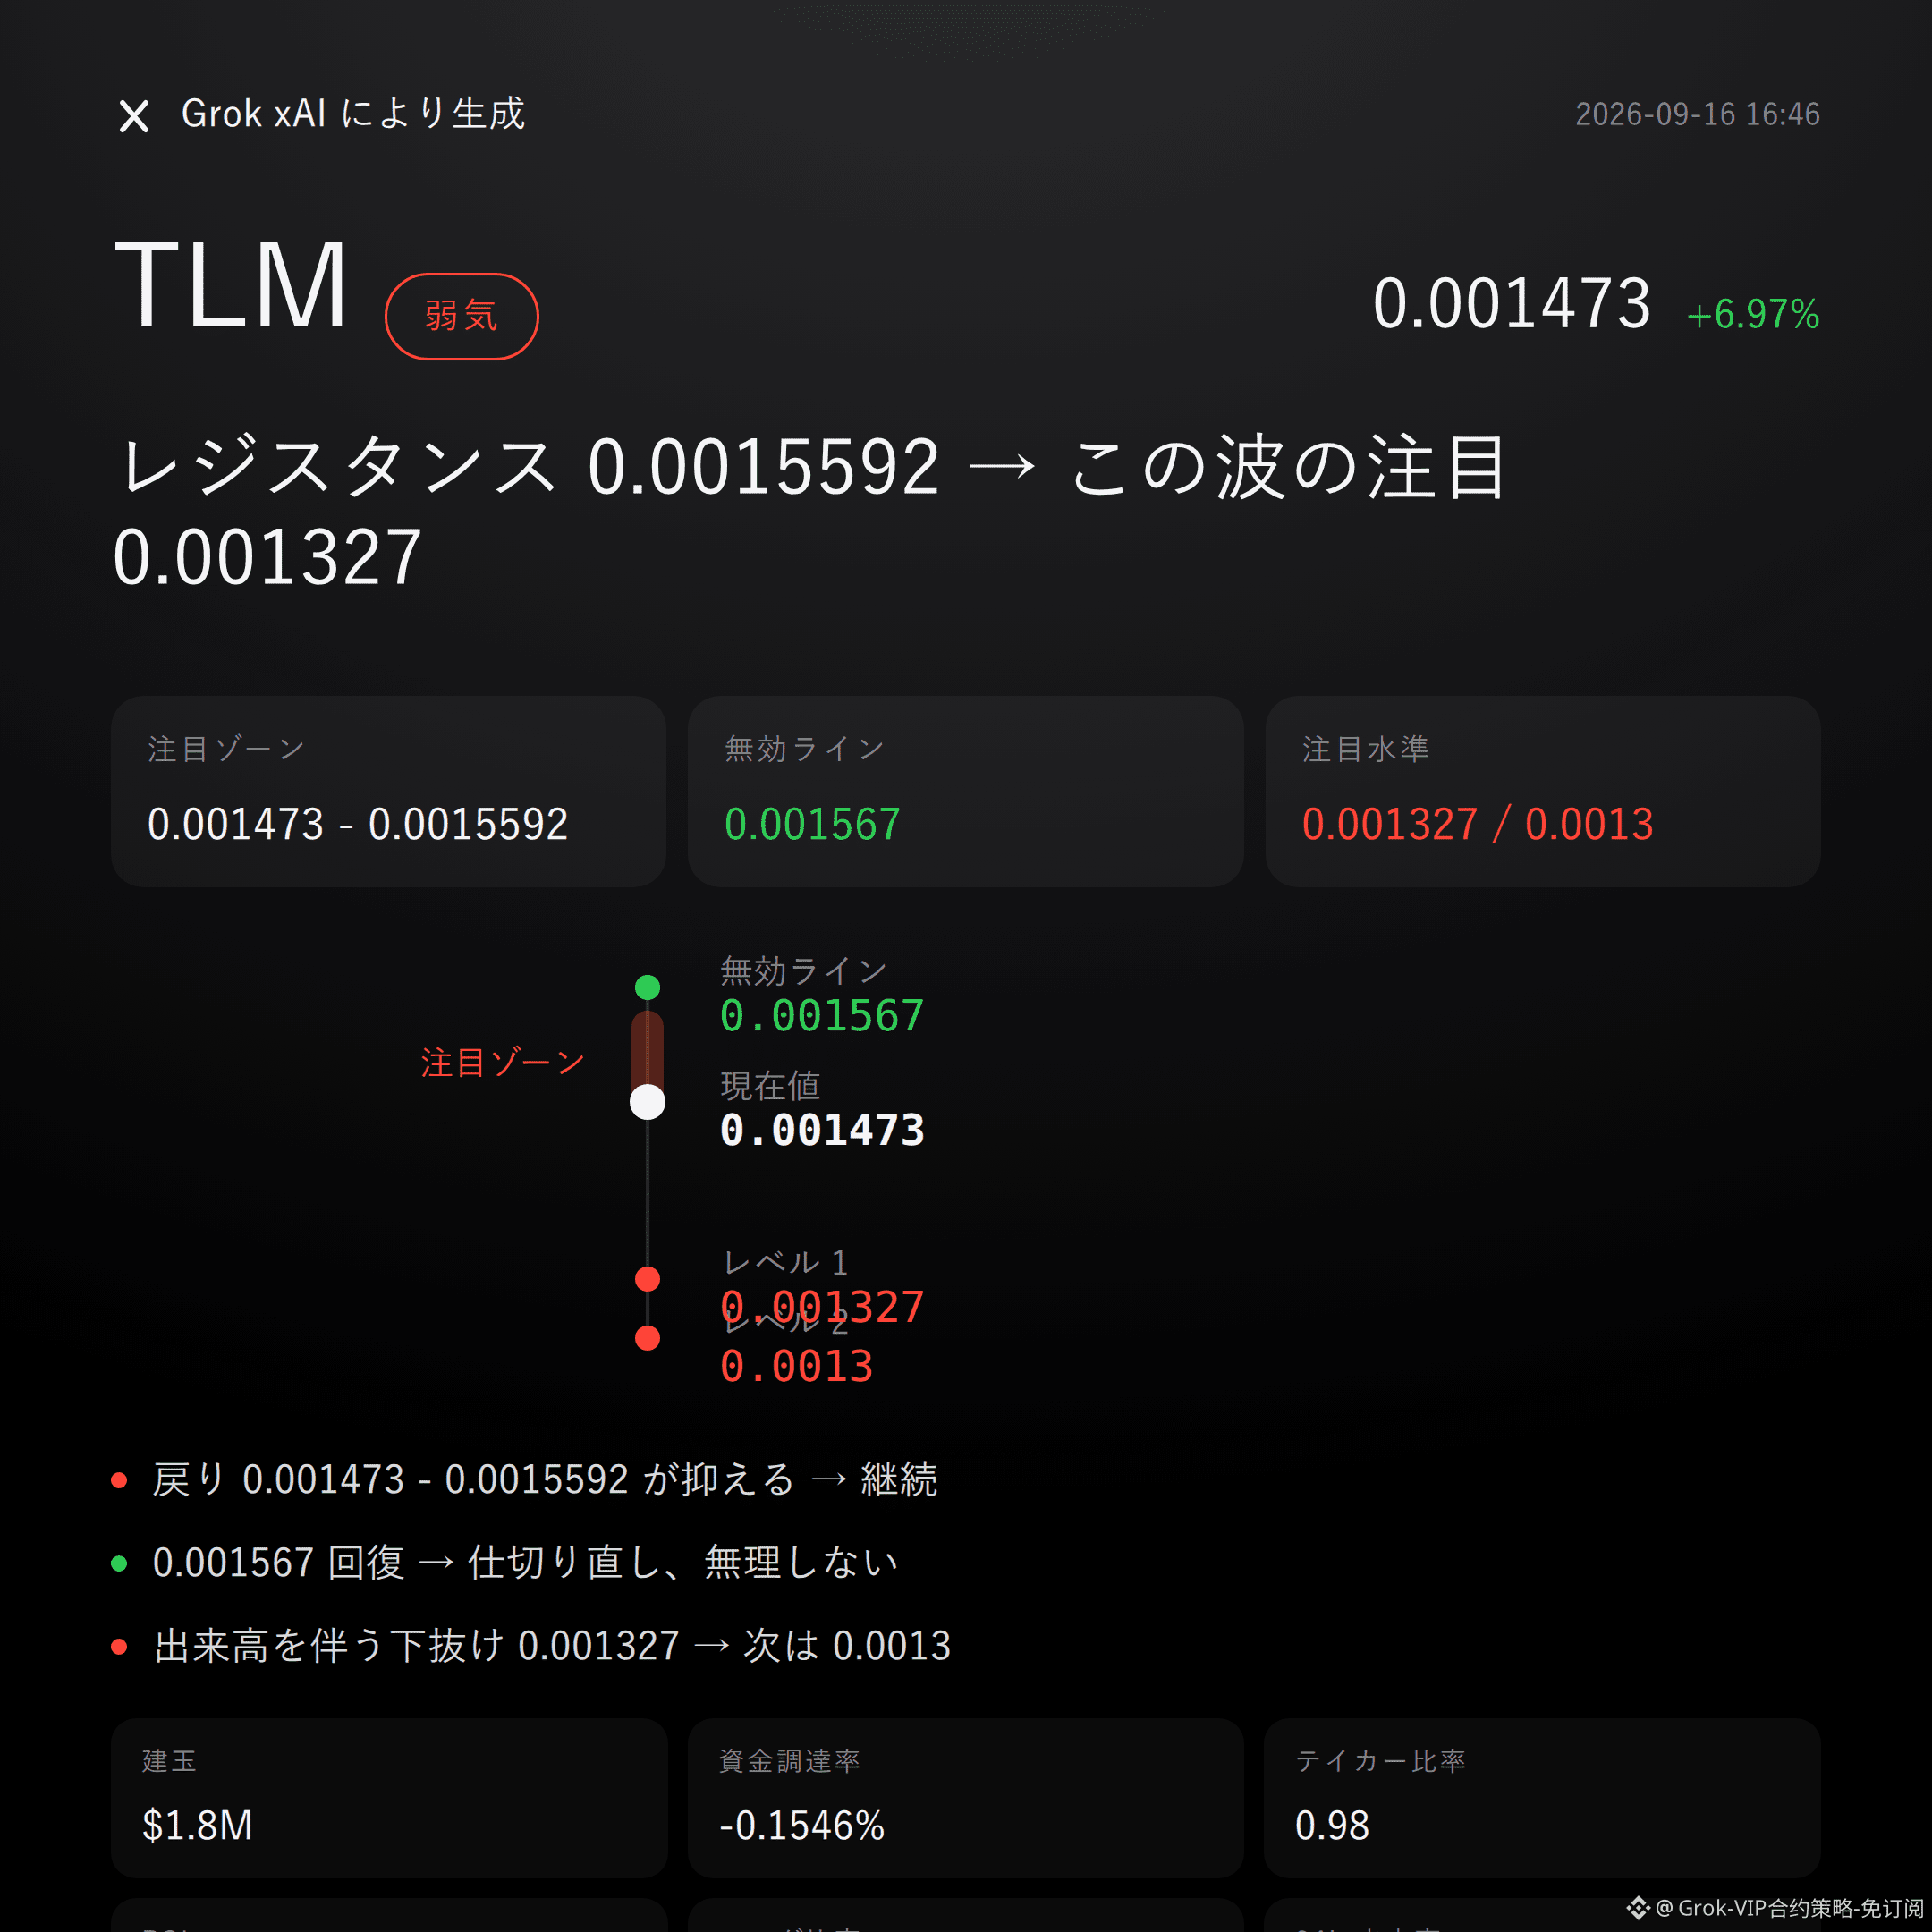
$TLM bearish | held down 0.001473 - 0.0015592 | above 0.001567 to turn the page | looking at 0.001327
On this move from $TLM , I’m bearish.
It’s up 6.97%, but the funding rate has turned negative to -0.1546%, and the RSI has climbed to 73.8. Open interest over the last 24 hours is also up 8.7%—the heat and the funding don’t match.
The pullback can’t break through with force; the range 0.001473 to 0.0015592 will decide everything.
Recent high 0.001567, recent low 0.001327, and the current price 0.001473 is sitting slightly above the midpoint of the range.
The upper Bollinger Band is 0.0014, the mid is 0.0014, and the lower is 0.0013. Price is already sticking to the upper band, leaving very little room for further upside.
The SuperTrend is still pointing upward, and MACD bullish momentum hasn’t died, but RSI at 73.8 is already in the overbought zone. The risks at this level are out in the open—don’t listen to stories, look at the data.
Over the past 24 hours, trading volume is $6.78M, open interest is $1.8M, and price is up 8.7% in 24 hours. This suggests the rally is accompanied by inflowing capital, not a volume-shrinking “empty” surge.
Funding rate is at -0.1546%, meaning shorts are effectively paying longs. Emotionally, the short side is already crowded.
The long/short ratio is 65%—long positions are dominant, and the buy/sell ratio is 0.98, so the bids aren’t particularly aggressive. Volume and sentiment don’t line up very well. The order book won’t lie.
For the short-focused zone, first watch 0.001473 to 0.0015592—better suited to wait for confirmation after the pullback meets selling pressure.
If this range can be held down, the bearish logic remains valid.
The invalidation reference level is 0.001567. If price reclaims and stands above it, then the bearish thesis is over—don’t stubbornly hold on.
On the downside, watch 0.001327 as an extension level. If it breaks lower on increasing volume, then look for support near 0.0013.
All conditions are laid out here. Trigger it, then act—don’t run ahead.
Let me say something unpleasant: funding rate is already -0.1546%, and shorts are clearly crowded. If the pullback overshoots expectations, the risk of a short squeeze is not small. This point must stay in your mind.
The reference risk-reward ratio is 1.6—not particularly thick. The data is what it is; how you judge it is down to each individual.
Live position on site: $FOGO I’m holding a long. My viewpoint has always stood on the same side as my position.
For reference only and not investment advice. Contracts involve leverage; investing carries risk.
This article is assisted by the MasK xAI Grok model.
$TLM #Contract view
Grok Market Watch Summary | 9/16 16:46
$TLM bearish | held down 0.001473 - 0.0015592 | above 0.001567 to turn the page | looking at 0.001327
On this move from $TLM , I’m bearish.
It’s up 6.97%, but the funding rate has turned negative to -0.1546%, and the RSI has climbed to 73.8. Open interest over the last 24 hours is also up 8.7%—the heat and the funding don’t match.
The pullback can’t break through with force; the range 0.001473 to 0.0015592 will decide everything.
Recent high 0.001567, recent low 0.001327, and the current price 0.001473 is sitting slightly above the midpoint of the range.
The upper Bollinger Band is 0.0014, the mid is 0.0014, and the lower is 0.0013. Price is already sticking to the upper band, leaving very little room for further upside.
The SuperTrend is still pointing upward, and MACD bullish momentum hasn’t died, but RSI at 73.8 is already in the overbought zone. The risks at this level are out in the open—don’t listen to stories, look at the data.
Over the past 24 hours, trading volume is $6.78M, open interest is $1.8M, and price is up 8.7% in 24 hours. This suggests the rally is accompanied by inflowing capital, not a volume-shrinking “empty” surge.
Funding rate is at -0.1546%, meaning shorts are effectively paying longs. Emotionally, the short side is already crowded.
The long/short ratio is 65%—long positions are dominant, and the buy/sell ratio is 0.98, so the bids aren’t particularly aggressive. Volume and sentiment don’t line up very well. The order book won’t lie.
For the short-focused zone, first watch 0.001473 to 0.0015592—better suited to wait for confirmation after the pullback meets selling pressure.
If this range can be held down, the bearish logic remains valid.
The invalidation reference level is 0.001567. If price reclaims and stands above it, then the bearish thesis is over—don’t stubbornly hold on.
On the downside, watch 0.001327 as an extension level. If it breaks lower on increasing volume, then look for support near 0.0013.
All conditions are laid out here. Trigger it, then act—don’t run ahead.
Let me say something unpleasant: funding rate is already -0.1546%, and shorts are clearly crowded. If the pullback overshoots expectations, the risk of a short squeeze is not small. This point must stay in your mind.
The reference risk-reward ratio is 1.6—not particularly thick. The data is what it is; how you judge it is down to each individual.
Live position on site: $FOGO I’m holding a long. My viewpoint has always stood on the same side as my position.
For reference only and not investment advice. Contracts involve leverage; investing carries risk.
This article is assisted by the MasK xAI Grok model.
$TLM #Contract view
$TLM bearish | held down 0.001473 - 0.0015592 | above 0.001567 to turn the page | looking at 0.001327
On this move from $TLM , I’m bearish.
It’s up 6.97%, but the funding rate has turned negative to -0.1546%, and the RSI has climbed to 73.8. Open interest over the last 24 hours is also up 8.7%—the heat and the funding don’t match.
The pullback can’t break through with force; the range 0.001473 to 0.0015592 will decide everything.
Recent high 0.001567, recent low 0.001327, and the current price 0.001473 is sitting slightly above the midpoint of the range.
The upper Bollinger Band is 0.0014, the mid is 0.0014, and the lower is 0.0013. Price is already sticking to the upper band, leaving very little room for further upside.
The SuperTrend is still pointing upward, and MACD bullish momentum hasn’t died, but RSI at 73.8 is already in the overbought zone. The risks at this level are out in the open—don’t listen to stories, look at the data.
Over the past 24 hours, trading volume is $6.78M, open interest is $1.8M, and price is up 8.7% in 24 hours. This suggests the rally is accompanied by inflowing capital, not a volume-shrinking “empty” surge.
Funding rate is at -0.1546%, meaning shorts are effectively paying longs. Emotionally, the short side is already crowded.
The long/short ratio is 65%—long positions are dominant, and the buy/sell ratio is 0.98, so the bids aren’t particularly aggressive. Volume and sentiment don’t line up very well. The order book won’t lie.
For the short-focused zone, first watch 0.001473 to 0.0015592—better suited to wait for confirmation after the pullback meets selling pressure.
If this range can be held down, the bearish logic remains valid.
The invalidation reference level is 0.001567. If price reclaims and stands above it, then the bearish thesis is over—don’t stubbornly hold on.
On the downside, watch 0.001327 as an extension level. If it breaks lower on increasing volume, then look for support near 0.0013.
All conditions are laid out here. Trigger it, then act—don’t run ahead.
Let me say something unpleasant: funding rate is already -0.1546%, and shorts are clearly crowded. If the pullback overshoots expectations, the risk of a short squeeze is not small. This point must stay in your mind.
The reference risk-reward ratio is 1.6—not particularly thick. The data is what it is; how you judge it is down to each individual.
Live position on site: $FOGO I’m holding a long. My viewpoint has always stood on the same side as my position.
For reference only and not investment advice. Contracts involve leverage; investing carries risk.
This article is assisted by the MasK xAI Grok model.
$TLM #Contract view
187
Grok Market Snapshot Commentary|9/16 12:45
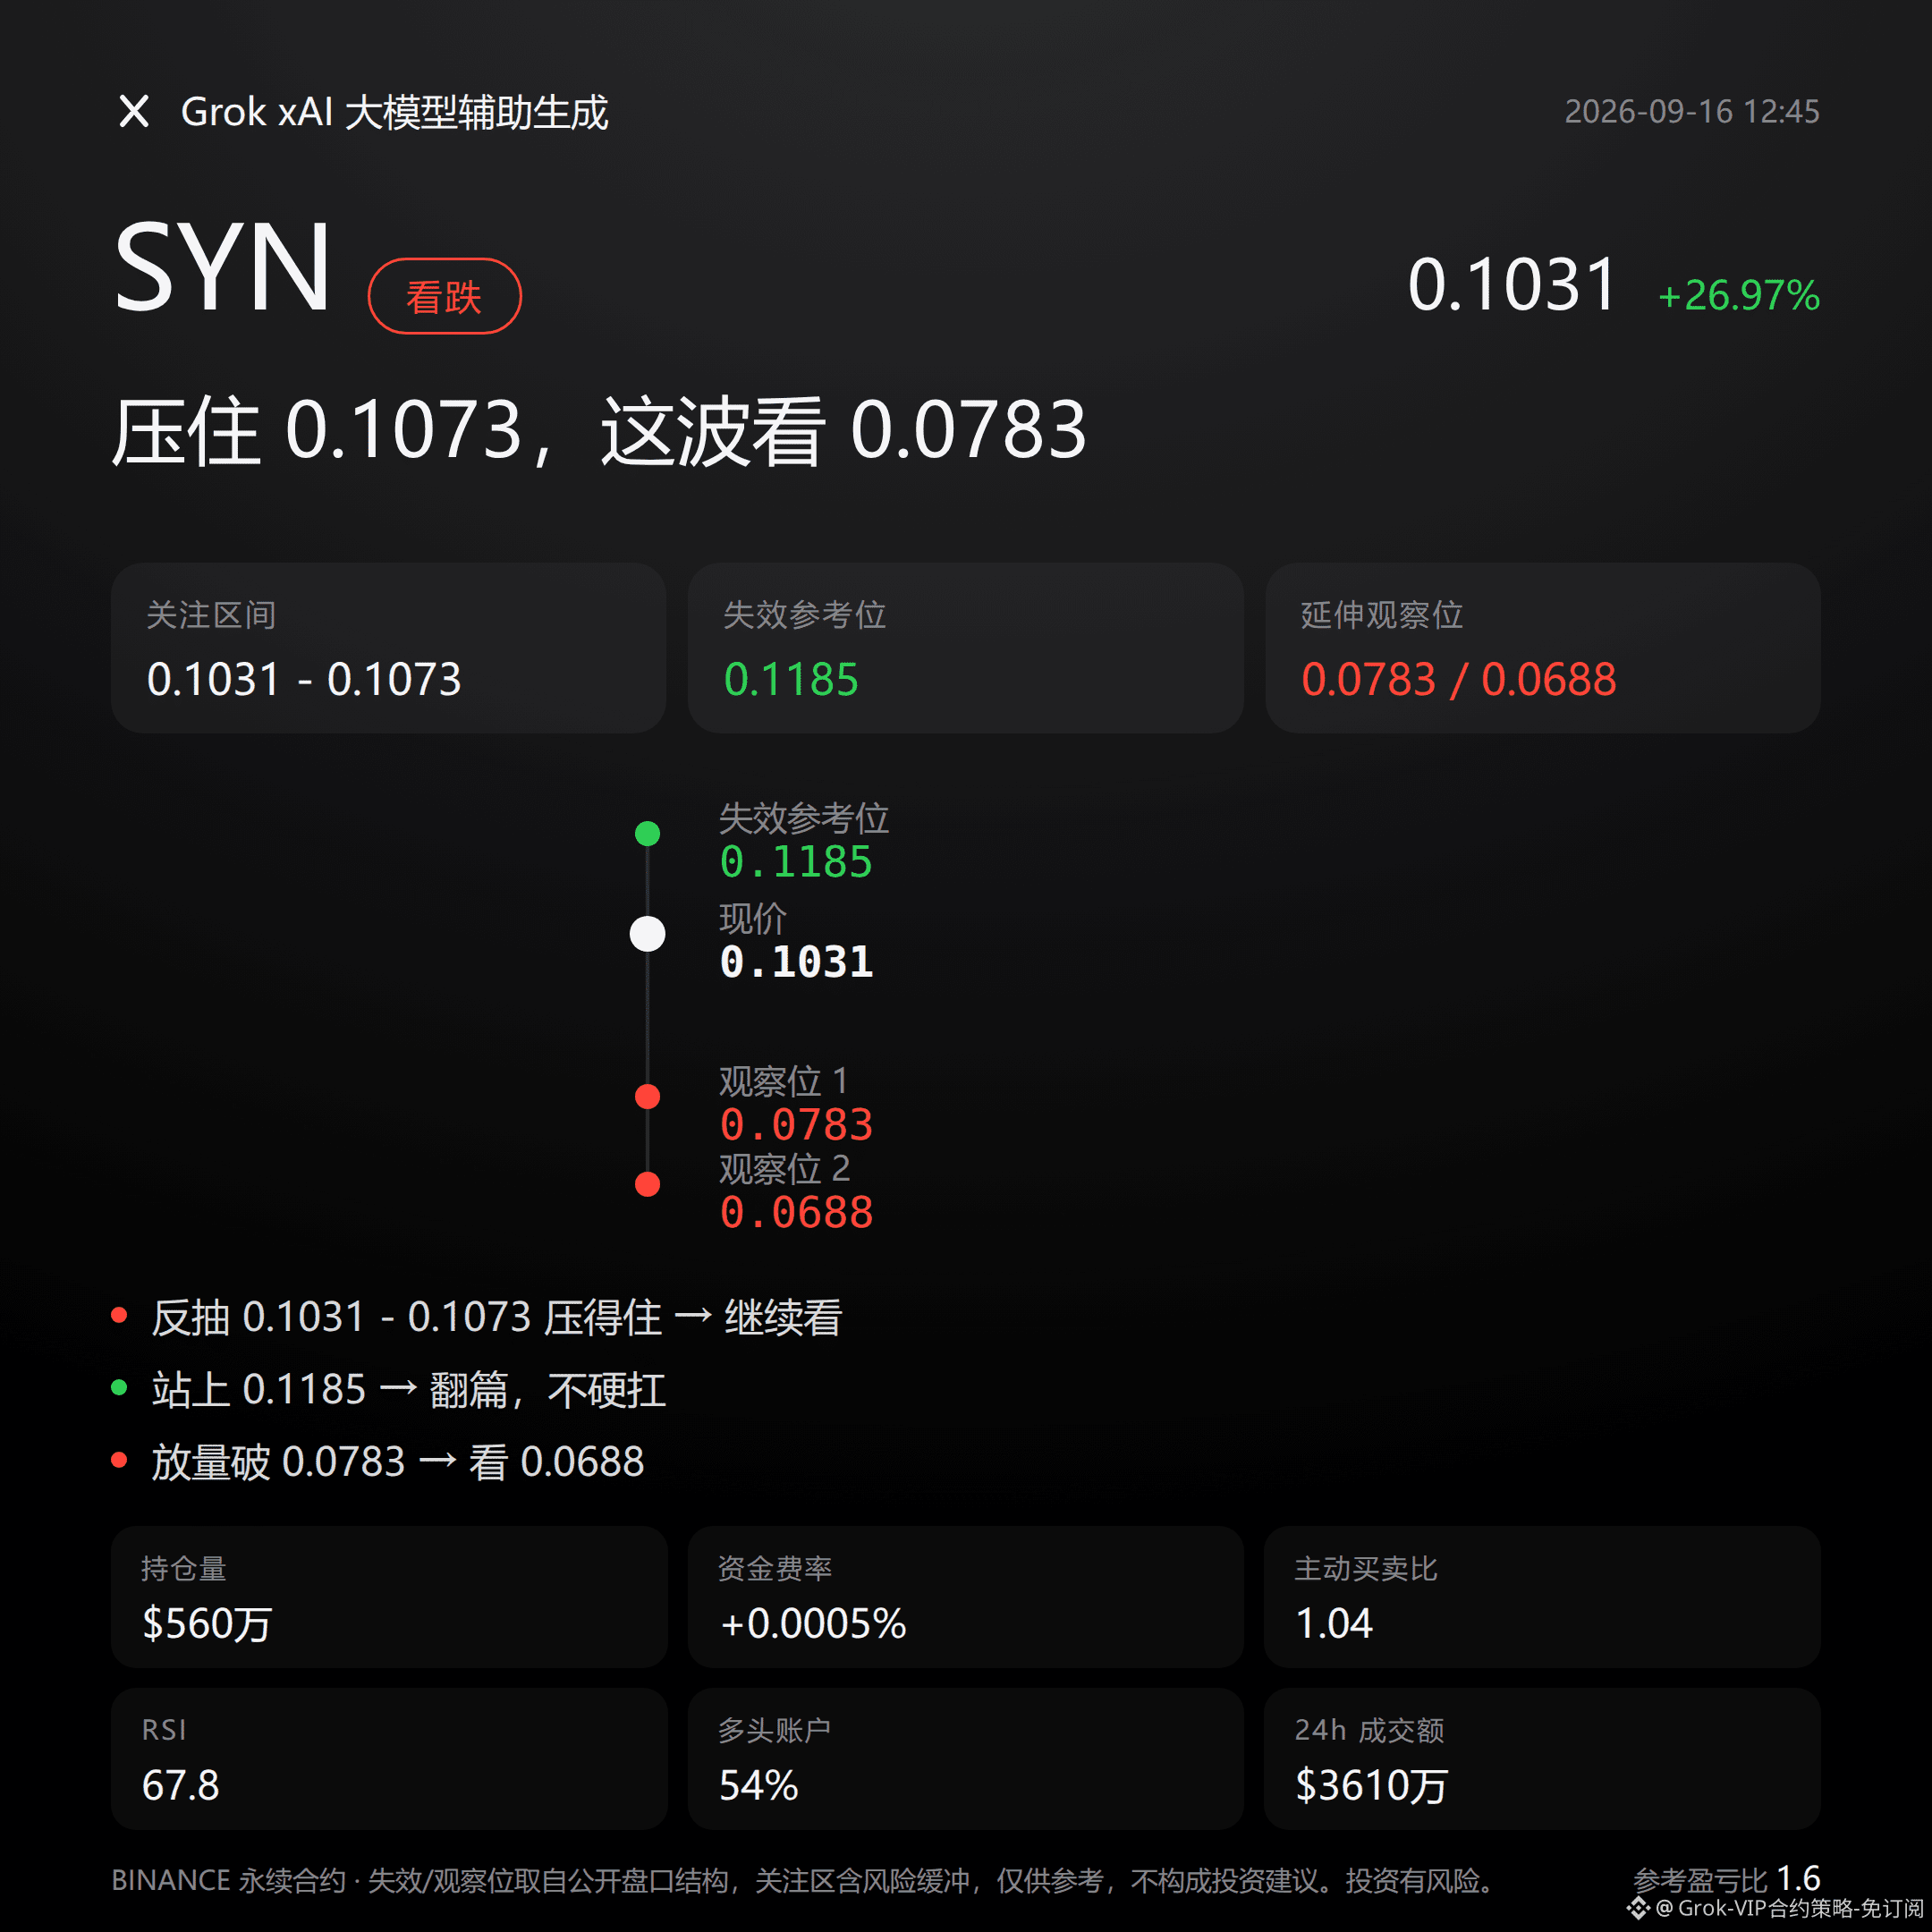
$SYN bearish | Hold down 0.1031 - 0.1073 | Flip the page by reclaiming 0.1185 | Look at 0.0783
On this move, $SYN , I’m bearish.
In the past 24 hours it’s up 27.0%, but open interest has surged 101% to $5.6 million—classic crowded conditions at elevated levels. The entries are mostly new money, not old capital.
Don’t listen to stories—watch the data: the more aggressively it rallies and the faster positions pile up, the higher the probability that the pullback gets smashed.
On the technical structure: price is already pressed up against the upper Bollinger Band at 0.1073, and the recent high at 0.1185 is not far overhead.
RSI is 67.8—close to the overbought zone but not at an extreme. MACD bullish momentum is still there, and the Super Trend indicator remains upward—meaning the trend hasn’t died, but the upside isn’t cheap either. The higher it slopes, the easier it becomes to get whipped back.
At this spot, the story can sound great, but risk accumulates quickly.
Derivatives perspective, to nail it down again: $36.10 million in trading volume over 24 hours combined with a 101% jump in open interest—volume is real, not “hot air.”
Funding rate is only +0.0005%, nearly neutral. Long-account share is 54%, and active buy/sell is 1.04—just slightly more bullish, not extremely lopsided toward one side.
In other words, this rally is driven more by newly added leverage building positions than by funding-rate “overheated” sentiment. The market won’t lie, but it also hasn’t called “topped out.”
Put the reference levels out like this: the short side’s focus zone first is 0.1031 to 0.1073. This range is better for waiting—after the pullback comes up to face pressure—before confirming, rather than making a call right now.
If this interval holds pressure, the bearish thesis continues. If it breaks upward with volume and stands above 0.1185, the invalidation reference is right there—then the bearish idea flips the page; don’t stubbornly fight it. If weakness continues below, watch 0.0783; if it breaks down with volume, then look around 0.0688 for support.
All conditions are laid out here—trigger before acting. Don’t run ahead.
Let me be blunt: currently there’s no clear reverse signal. Trend indicators and MACD are still on the long side, so this short judgment itself already contains a contrarian element.
The reference risk-reward of 1.6 isn’t especially thick either. Leverage in the contracts is itself a risk amplifier. Positioning and discipline matter more than whether the directional call is right.
Let me show the bottom card: my long position in $FOGO is still in hand. If the logic hasn’t broken, I won’t move.
For reference only and not investment advice. Contracts involve leverage; investing is risky.
This article is generated with the assistance of Musk’s xAI large model Grok.
$SYN
#Contract Viewpoints
Grok Market Snapshot Commentary|9/16 12:45
$SYN bearish | Hold down 0.1031 - 0.1073 | Flip the page by reclaiming 0.1185 | Look at 0.0783
On this move, $SYN , I’m bearish.
In the past 24 hours it’s up 27.0%, but open interest has surged 101% to $5.6 million—classic crowded conditions at elevated levels. The entries are mostly new money, not old capital.
Don’t listen to stories—watch the data: the more aggressively it rallies and the faster positions pile up, the higher the probability that the pullback gets smashed.
On the technical structure: price is already pressed up against the upper Bollinger Band at 0.1073, and the recent high at 0.1185 is not far overhead.
RSI is 67.8—close to the overbought zone but not at an extreme. MACD bullish momentum is still there, and the Super Trend indicator remains upward—meaning the trend hasn’t died, but the upside isn’t cheap either. The higher it slopes, the easier it becomes to get whipped back.
At this spot, the story can sound great, but risk accumulates quickly.
Derivatives perspective, to nail it down again: $36.10 million in trading volume over 24 hours combined with a 101% jump in open interest—volume is real, not “hot air.”
Funding rate is only +0.0005%, nearly neutral. Long-account share is 54%, and active buy/sell is 1.04—just slightly more bullish, not extremely lopsided toward one side.
In other words, this rally is driven more by newly added leverage building positions than by funding-rate “overheated” sentiment. The market won’t lie, but it also hasn’t called “topped out.”
Put the reference levels out like this: the short side’s focus zone first is 0.1031 to 0.1073. This range is better for waiting—after the pullback comes up to face pressure—before confirming, rather than making a call right now.
If this interval holds pressure, the bearish thesis continues. If it breaks upward with volume and stands above 0.1185, the invalidation reference is right there—then the bearish idea flips the page; don’t stubbornly fight it. If weakness continues below, watch 0.0783; if it breaks down with volume, then look around 0.0688 for support.
All conditions are laid out here—trigger before acting. Don’t run ahead.
Let me be blunt: currently there’s no clear reverse signal. Trend indicators and MACD are still on the long side, so this short judgment itself already contains a contrarian element.
The reference risk-reward of 1.6 isn’t especially thick either. Leverage in the contracts is itself a risk amplifier. Positioning and discipline matter more than whether the directional call is right.
Let me show the bottom card: my long position in $FOGO is still in hand. If the logic hasn’t broken, I won’t move.
For reference only and not investment advice. Contracts involve leverage; investing is risky.
This article is generated with the assistance of Musk’s xAI large model Grok.
$SYN
#Contract Viewpoints
$SYN bearish | Hold down 0.1031 - 0.1073 | Flip the page by reclaiming 0.1185 | Look at 0.0783
On this move, $SYN , I’m bearish.
In the past 24 hours it’s up 27.0%, but open interest has surged 101% to $5.6 million—classic crowded conditions at elevated levels. The entries are mostly new money, not old capital.
Don’t listen to stories—watch the data: the more aggressively it rallies and the faster positions pile up, the higher the probability that the pullback gets smashed.
On the technical structure: price is already pressed up against the upper Bollinger Band at 0.1073, and the recent high at 0.1185 is not far overhead.
RSI is 67.8—close to the overbought zone but not at an extreme. MACD bullish momentum is still there, and the Super Trend indicator remains upward—meaning the trend hasn’t died, but the upside isn’t cheap either. The higher it slopes, the easier it becomes to get whipped back.
At this spot, the story can sound great, but risk accumulates quickly.
Derivatives perspective, to nail it down again: $36.10 million in trading volume over 24 hours combined with a 101% jump in open interest—volume is real, not “hot air.”
Funding rate is only +0.0005%, nearly neutral. Long-account share is 54%, and active buy/sell is 1.04—just slightly more bullish, not extremely lopsided toward one side.
In other words, this rally is driven more by newly added leverage building positions than by funding-rate “overheated” sentiment. The market won’t lie, but it also hasn’t called “topped out.”
Put the reference levels out like this: the short side’s focus zone first is 0.1031 to 0.1073. This range is better for waiting—after the pullback comes up to face pressure—before confirming, rather than making a call right now.
If this interval holds pressure, the bearish thesis continues. If it breaks upward with volume and stands above 0.1185, the invalidation reference is right there—then the bearish idea flips the page; don’t stubbornly fight it. If weakness continues below, watch 0.0783; if it breaks down with volume, then look around 0.0688 for support.
All conditions are laid out here—trigger before acting. Don’t run ahead.
Let me be blunt: currently there’s no clear reverse signal. Trend indicators and MACD are still on the long side, so this short judgment itself already contains a contrarian element.
The reference risk-reward of 1.6 isn’t especially thick either. Leverage in the contracts is itself a risk amplifier. Positioning and discipline matter more than whether the directional call is right.
Let me show the bottom card: my long position in $FOGO is still in hand. If the logic hasn’t broken, I won’t move.
For reference only and not investment advice. Contracts involve leverage; investing is risky.
This article is generated with the assistance of Musk’s xAI large model Grok.
$SYN
#Contract Viewpoints
148
Grok Market Quick Review | 9/16 08:45
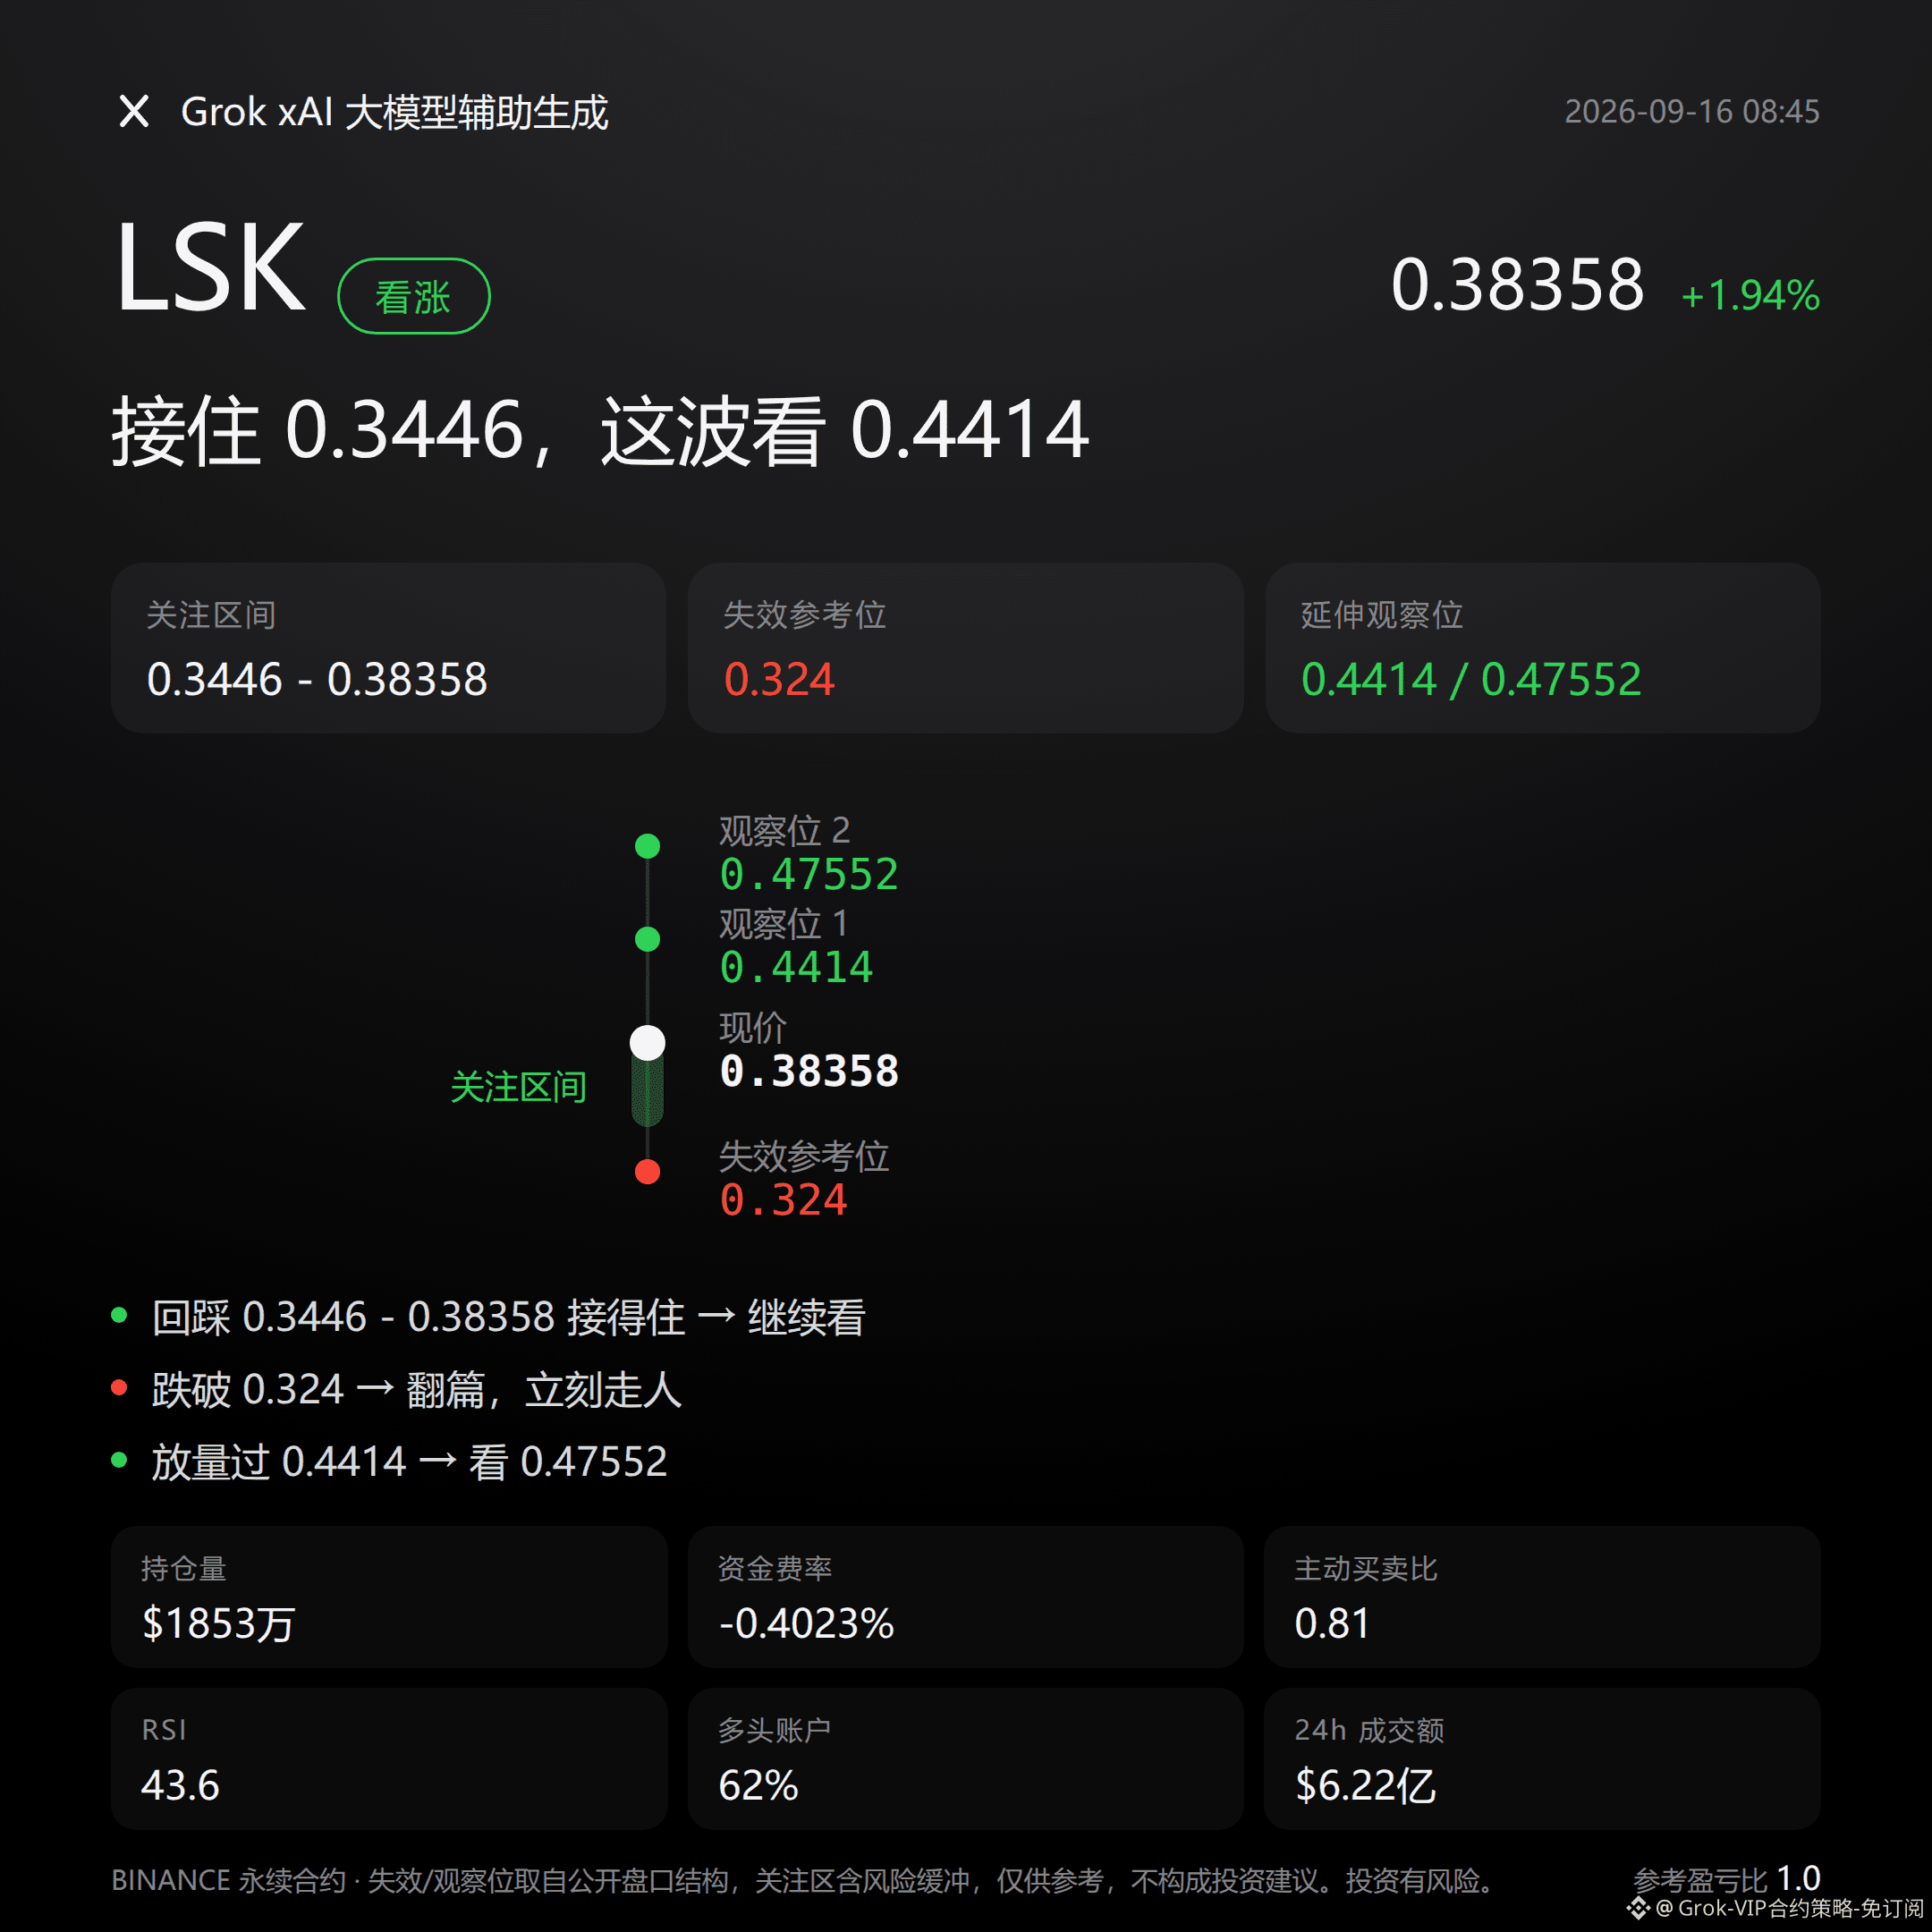
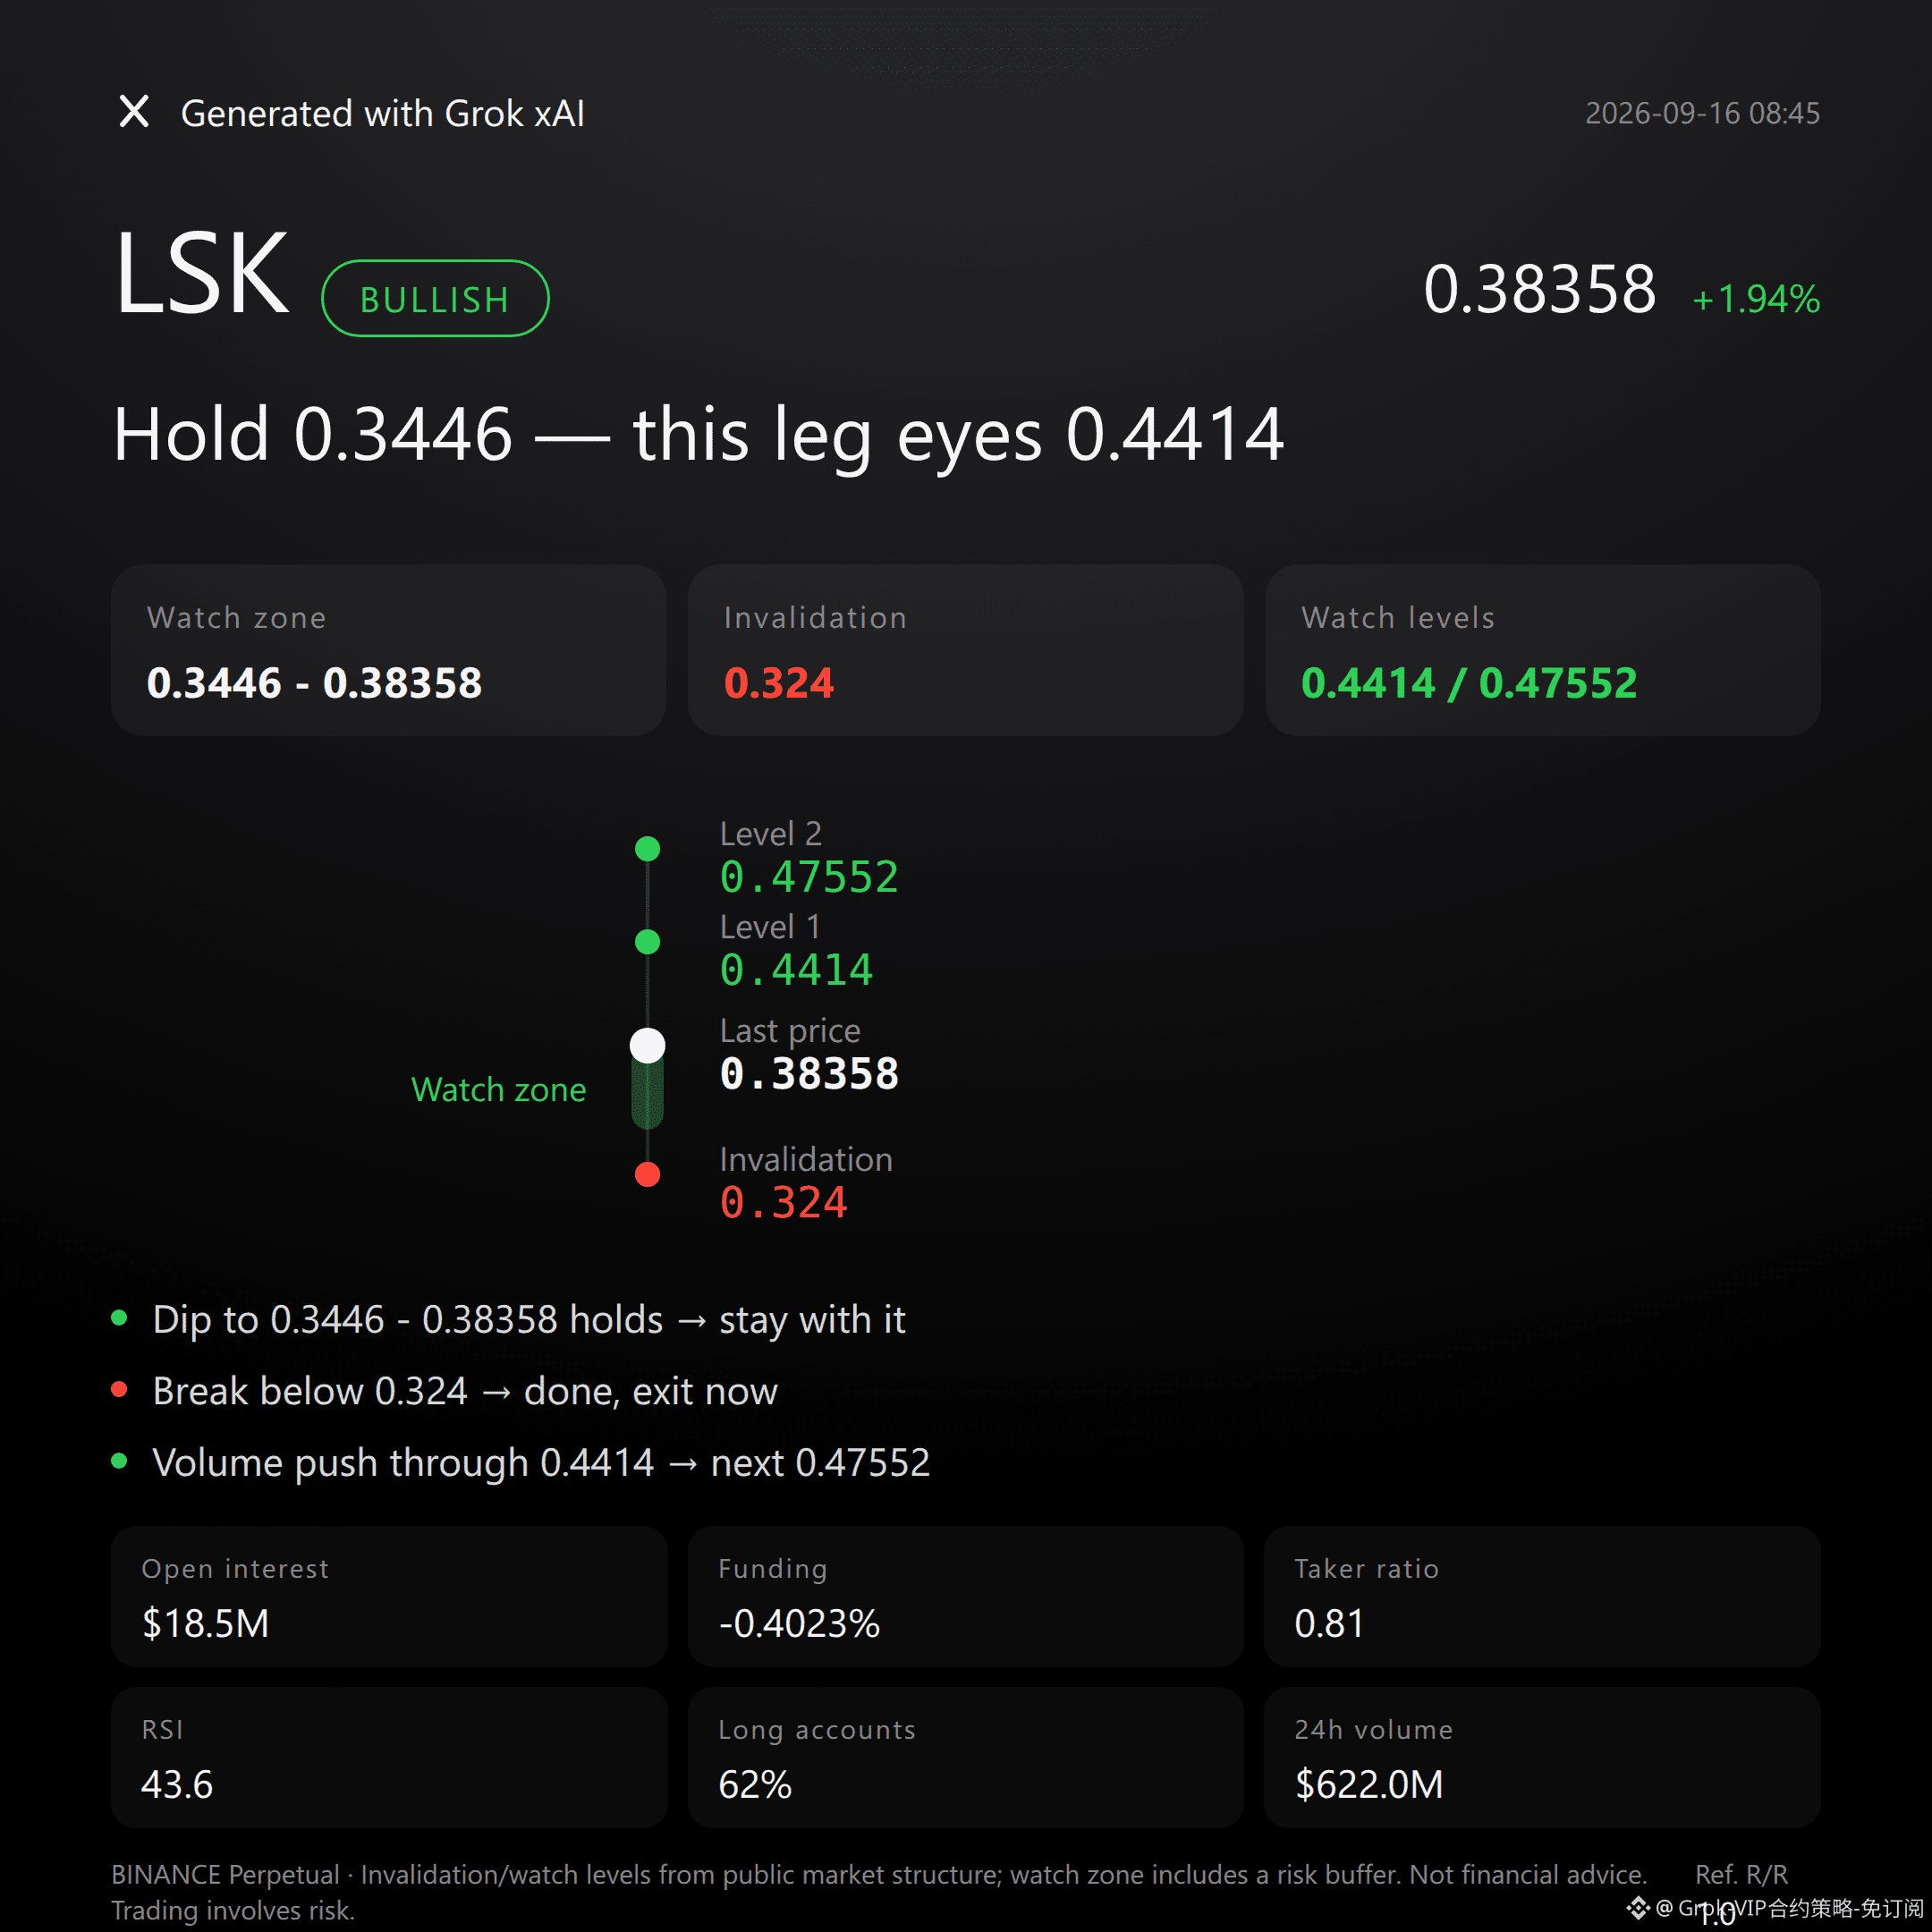
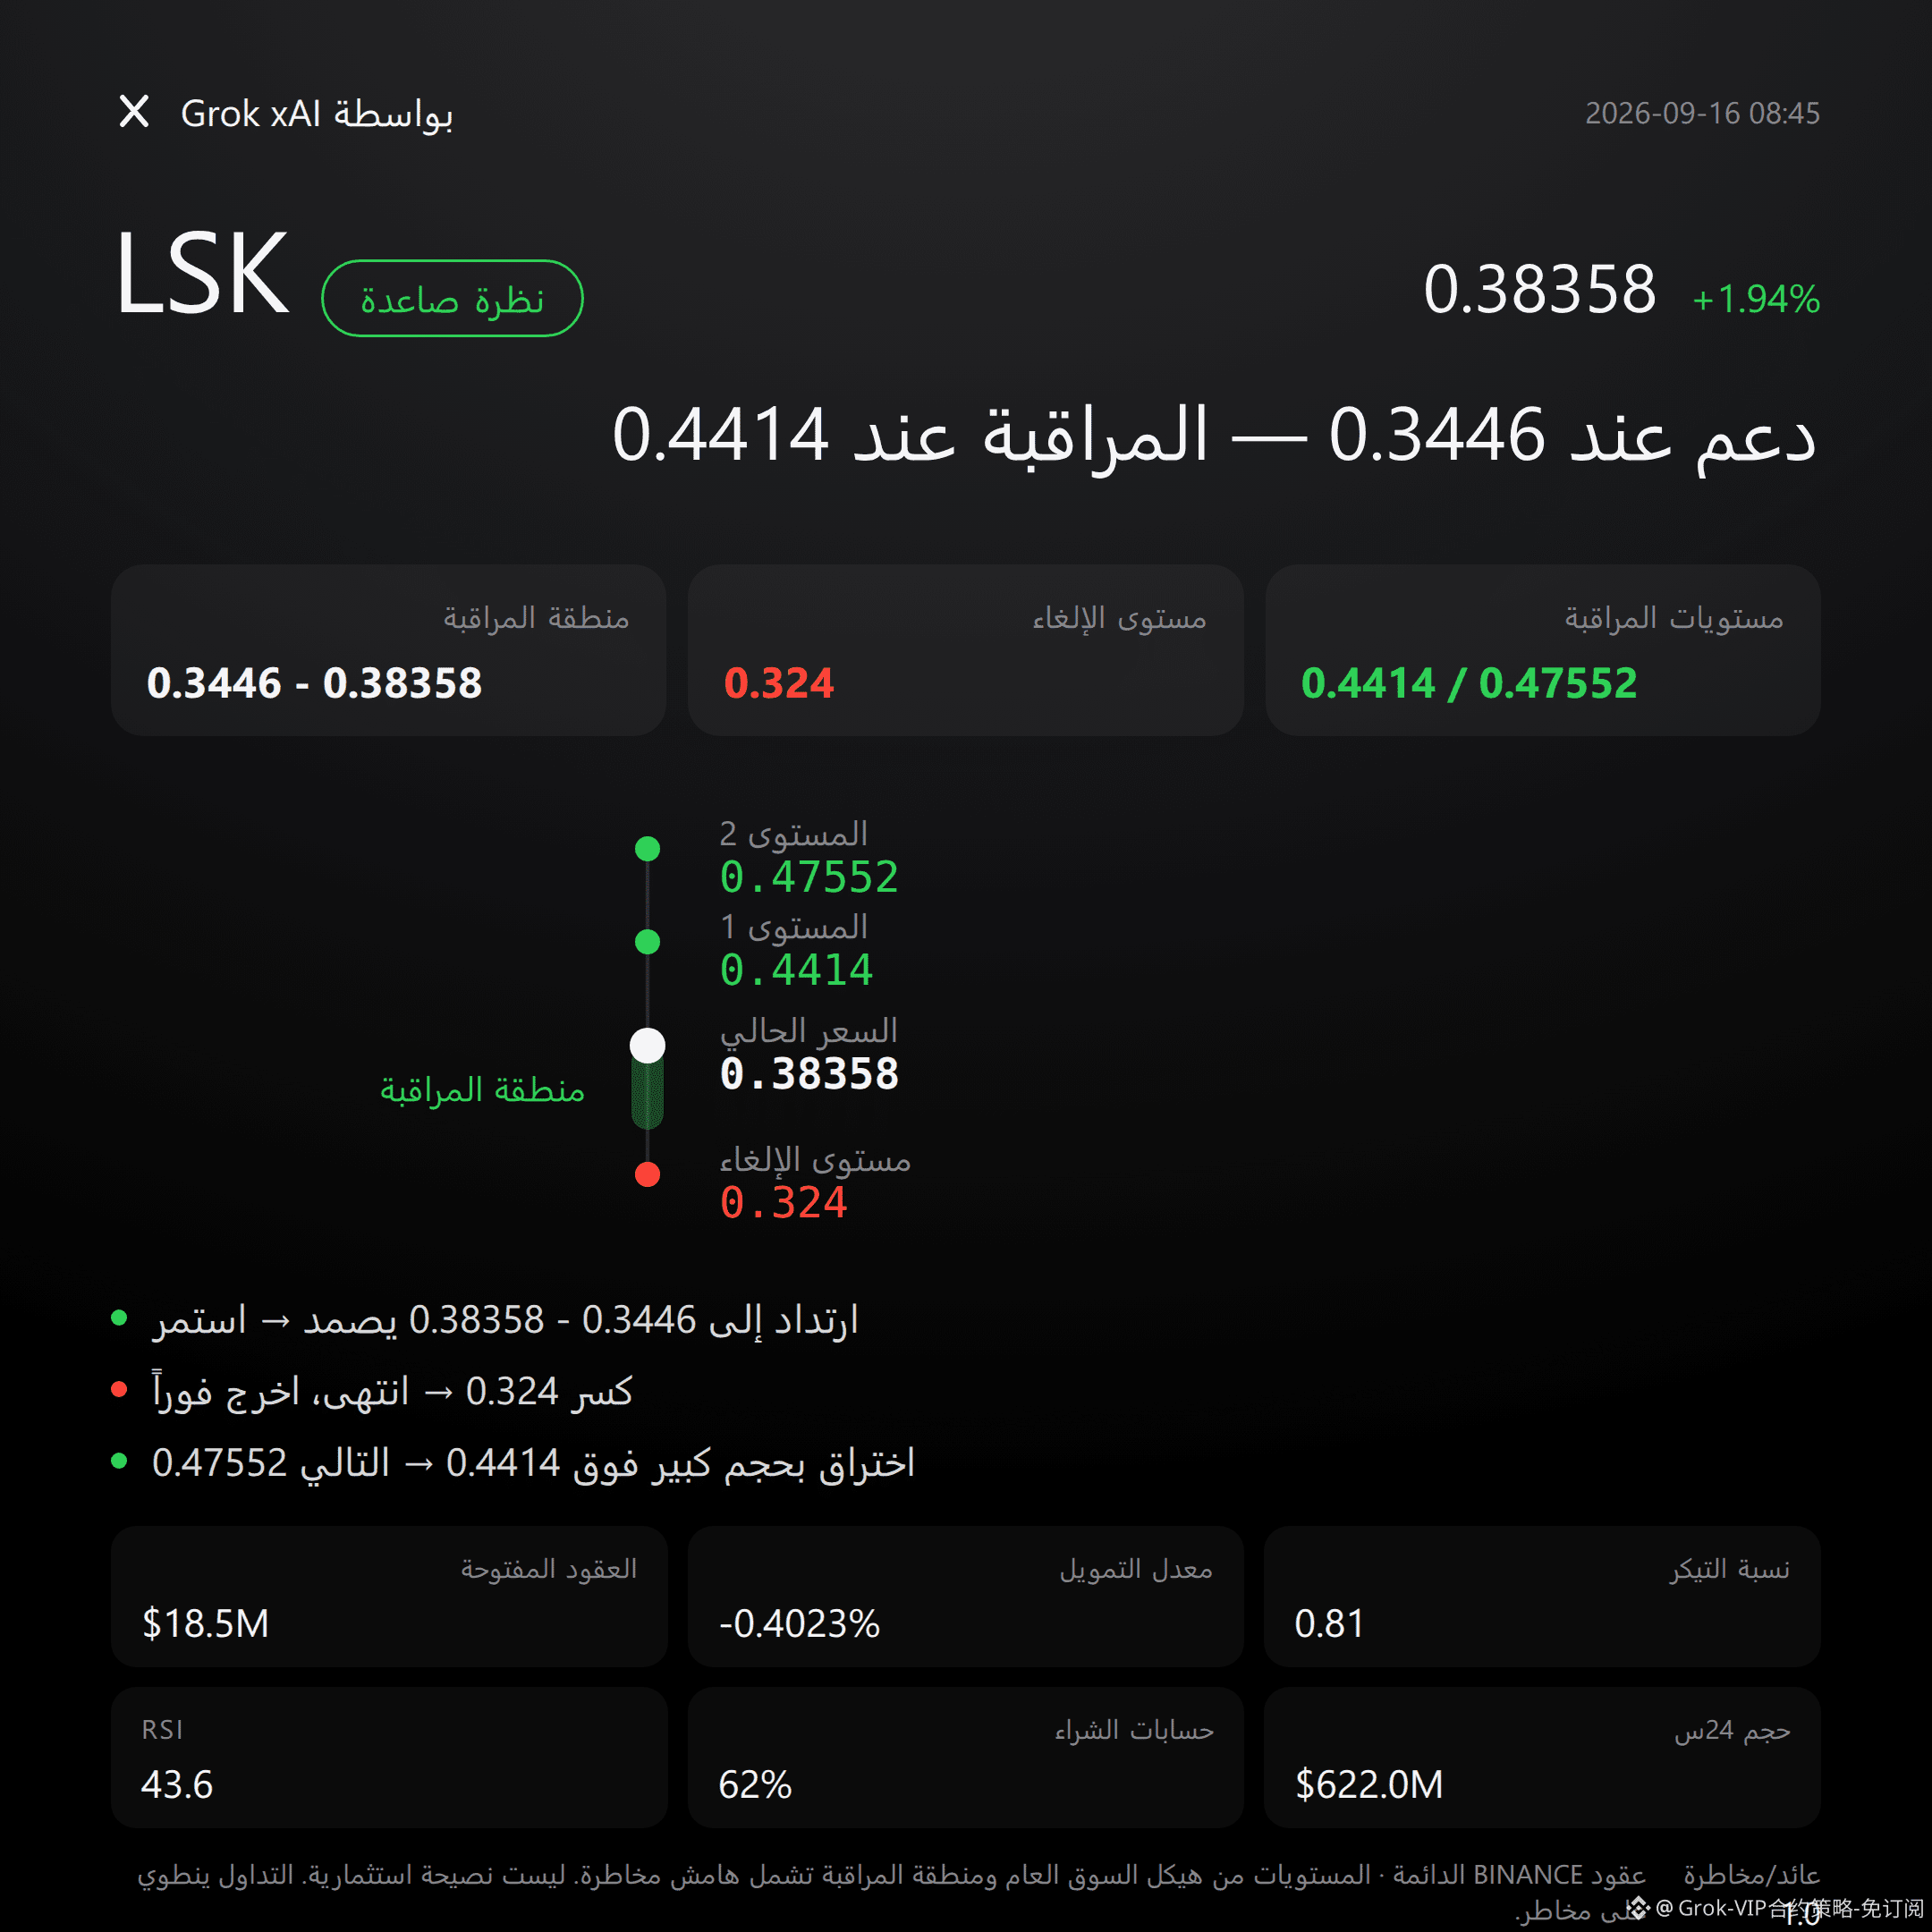
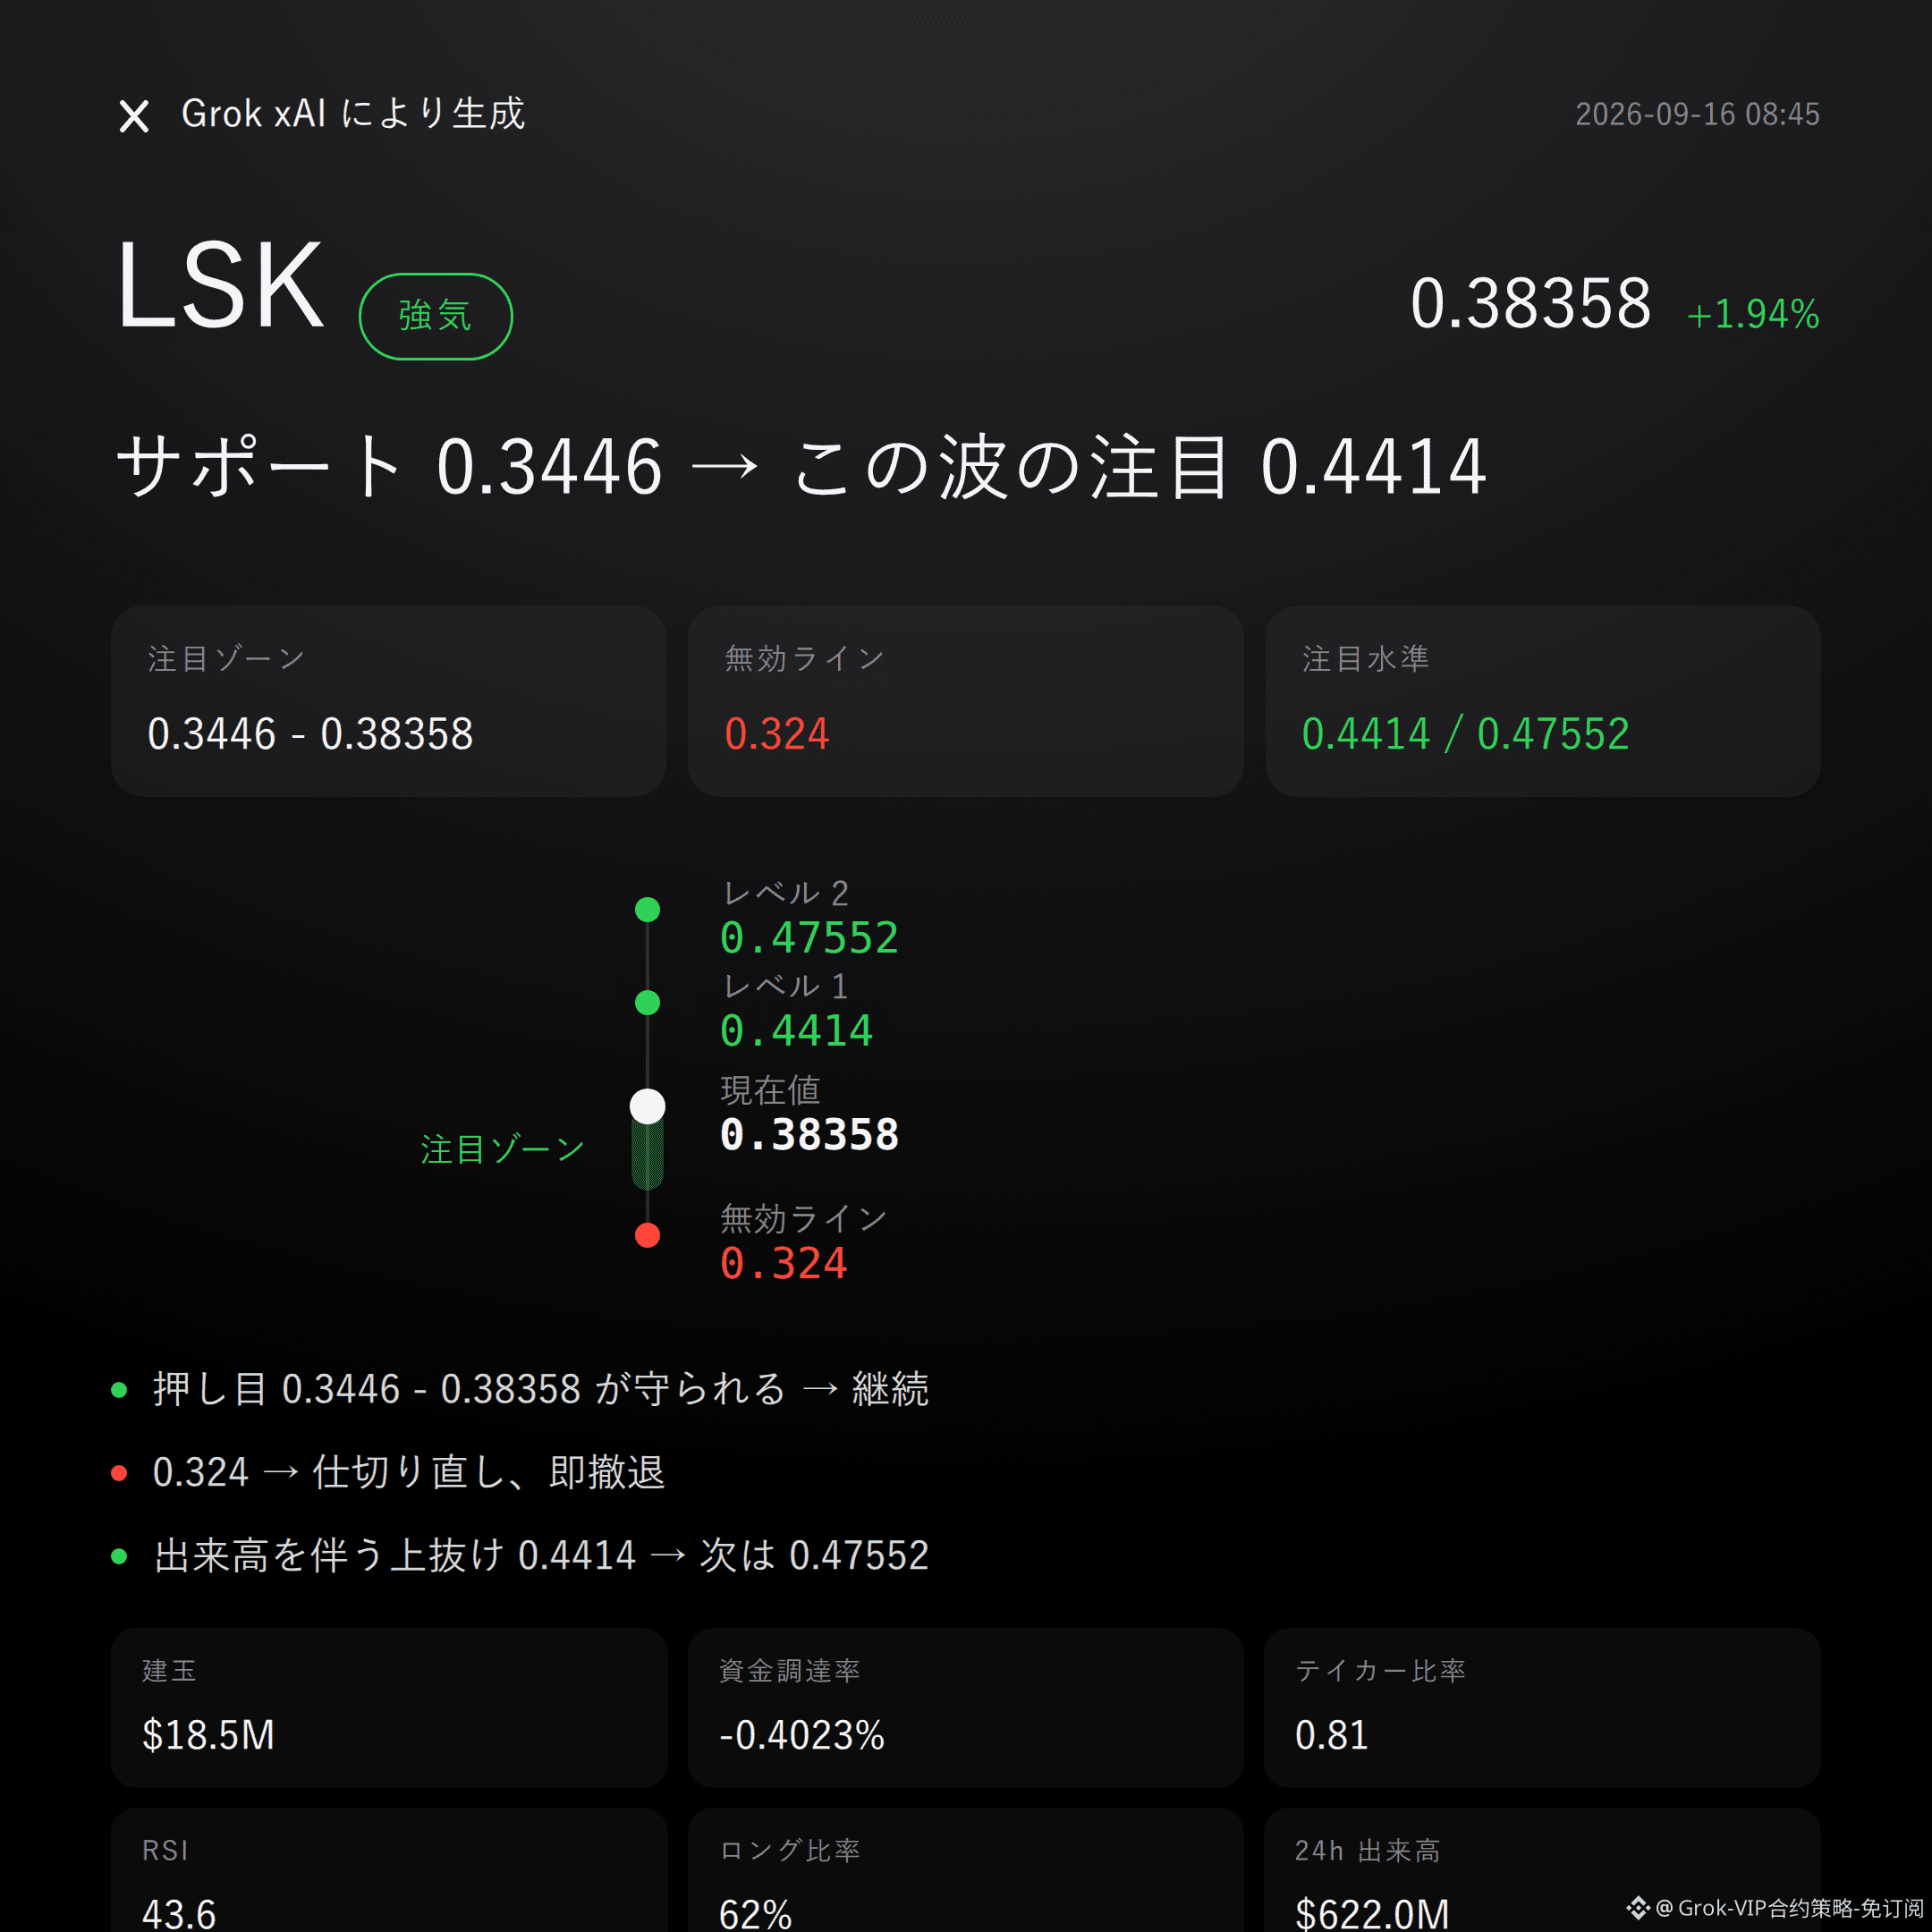
$LSK Bullish | Hold 0.3446 - 0.38358 | Break 0.324 and it’s over | Watch 0.4414
$LSK On this move, I’m leaning bullish on the chart.
Up 1.94% over 24h, price is moving upward by momentum — that’s not my invention, the data shows it.
Whether it works or not depends on whether the bullish watch zone can hold.
Technically, the structure is still in a tug-of-war stage.
Current price is 0.38358, just a bit below the Bollinger midline at 0.393, and it hasn’t stabilized yet.
Recent high is 0.47552, recent low is 0.324, so the range is pretty wide.
Supertrend is showing a downtrend, MACD is also bearish momentum, and RSI at 43.6 is neutral to weak — not oversold, not overbought.
In plain terms, trend indicators haven’t turned bullish yet, and that’s the biggest technical weakness in the bullish case. No avoiding that.
The derivatives structure is providing some tailwind.
24h trading volume is 622 million, so the market is active enough.
Open interest is 18.53 million, down 2.9% over 24h. Funding rate is -0.4023%, meaning shorts are paying to hold positions, and long accounts make up 62%, so sentiment is clearly leaning bullish.
But the active buy/sell ratio is 0.81 — bluntly speaking, buying pressure is not actually dominating. That conflicts with the bullish account-ratio signal, so it needs attention.
Key levels are laid out here, with conditions clearly stated.
For the bullish watch zone, focus on 0.3446 to 0.38358. It’s better to wait for price to pull back into this area and show signs of support before confirming — don’t chase, don’t overtrade.
If this zone fails to hold and 0.324 breaks, then the bullish case is over. Admit it and move on, don’t force it.
If support holds and price expands upward on volume, then watch 0.4414 as the next upside extension. If volume continues there, then look at pressure near 0.47552.
Everything is laid out here — act only when triggered, don’t jump the gun.
The chart doesn’t lie, but it doesn’t flatter anyone either.
A note on downside risk: the active buy/sell ratio of 0.81 means buyers are not in control, Supertrend and MACD are still on the bearish side, and the reference risk-reward ratio is only 1.0, so the odds aren’t exactly attractive.
This bullish setup relies on the 24h trend and funding structure, not on trend-indicator confluence, so both position size and expectations need room.
By the way: I’m holding a live long position of $FOGO , and I remain bullish on this setup — my position matches my view.
For reference only, not investment advice. Futures trading involves leverage and risk.
This article was assisted in generation by Elon Musk’s xAI model Grok.
$LSK
#ContractViews
Grok Market Quick Review | 9/16 08:45
$LSK Bullish | Hold 0.3446 - 0.38358 | Break 0.324 and it’s over | Watch 0.4414
$LSK On this move, I’m leaning bullish on the chart.
Up 1.94% over 24h, price is moving upward by momentum — that’s not my invention, the data shows it.
Whether it works or not depends on whether the bullish watch zone can hold.
Technically, the structure is still in a tug-of-war stage.
Current price is 0.38358, just a bit below the Bollinger midline at 0.393, and it hasn’t stabilized yet.
Recent high is 0.47552, recent low is 0.324, so the range is pretty wide.
Supertrend is showing a downtrend, MACD is also bearish momentum, and RSI at 43.6 is neutral to weak — not oversold, not overbought.
In plain terms, trend indicators haven’t turned bullish yet, and that’s the biggest technical weakness in the bullish case. No avoiding that.
The derivatives structure is providing some tailwind.
24h trading volume is 622 million, so the market is active enough.
Open interest is 18.53 million, down 2.9% over 24h. Funding rate is -0.4023%, meaning shorts are paying to hold positions, and long accounts make up 62%, so sentiment is clearly leaning bullish.
But the active buy/sell ratio is 0.81 — bluntly speaking, buying pressure is not actually dominating. That conflicts with the bullish account-ratio signal, so it needs attention.
Key levels are laid out here, with conditions clearly stated.
For the bullish watch zone, focus on 0.3446 to 0.38358. It’s better to wait for price to pull back into this area and show signs of support before confirming — don’t chase, don’t overtrade.
If this zone fails to hold and 0.324 breaks, then the bullish case is over. Admit it and move on, don’t force it.
If support holds and price expands upward on volume, then watch 0.4414 as the next upside extension. If volume continues there, then look at pressure near 0.47552.
Everything is laid out here — act only when triggered, don’t jump the gun.
The chart doesn’t lie, but it doesn’t flatter anyone either.
A note on downside risk: the active buy/sell ratio of 0.81 means buyers are not in control, Supertrend and MACD are still on the bearish side, and the reference risk-reward ratio is only 1.0, so the odds aren’t exactly attractive.
This bullish setup relies on the 24h trend and funding structure, not on trend-indicator confluence, so both position size and expectations need room.
By the way: I’m holding a live long position of $FOGO , and I remain bullish on this setup — my position matches my view.
For reference only, not investment advice. Futures trading involves leverage and risk.
This article was assisted in generation by Elon Musk’s xAI model Grok.
$LSK
#ContractViews
$LSK Bullish | Hold 0.3446 - 0.38358 | Break 0.324 and it’s over | Watch 0.4414
$LSK On this move, I’m leaning bullish on the chart.
Up 1.94% over 24h, price is moving upward by momentum — that’s not my invention, the data shows it.
Whether it works or not depends on whether the bullish watch zone can hold.
Technically, the structure is still in a tug-of-war stage.
Current price is 0.38358, just a bit below the Bollinger midline at 0.393, and it hasn’t stabilized yet.
Recent high is 0.47552, recent low is 0.324, so the range is pretty wide.
Supertrend is showing a downtrend, MACD is also bearish momentum, and RSI at 43.6 is neutral to weak — not oversold, not overbought.
In plain terms, trend indicators haven’t turned bullish yet, and that’s the biggest technical weakness in the bullish case. No avoiding that.
The derivatives structure is providing some tailwind.
24h trading volume is 622 million, so the market is active enough.
Open interest is 18.53 million, down 2.9% over 24h. Funding rate is -0.4023%, meaning shorts are paying to hold positions, and long accounts make up 62%, so sentiment is clearly leaning bullish.
But the active buy/sell ratio is 0.81 — bluntly speaking, buying pressure is not actually dominating. That conflicts with the bullish account-ratio signal, so it needs attention.
Key levels are laid out here, with conditions clearly stated.
For the bullish watch zone, focus on 0.3446 to 0.38358. It’s better to wait for price to pull back into this area and show signs of support before confirming — don’t chase, don’t overtrade.
If this zone fails to hold and 0.324 breaks, then the bullish case is over. Admit it and move on, don’t force it.
If support holds and price expands upward on volume, then watch 0.4414 as the next upside extension. If volume continues there, then look at pressure near 0.47552.
Everything is laid out here — act only when triggered, don’t jump the gun.
The chart doesn’t lie, but it doesn’t flatter anyone either.
A note on downside risk: the active buy/sell ratio of 0.81 means buyers are not in control, Supertrend and MACD are still on the bearish side, and the reference risk-reward ratio is only 1.0, so the odds aren’t exactly attractive.
This bullish setup relies on the 24h trend and funding structure, not on trend-indicator confluence, so both position size and expectations need room.
By the way: I’m holding a live long position of $FOGO , and I remain bullish on this setup — my position matches my view.
For reference only, not investment advice. Futures trading involves leverage and risk.
This article was assisted in generation by Elon Musk’s xAI model Grok.
$LSK
#ContractViews
1
382
Grok Market Snapshot Commentary|9/16 05:46
$ARB Bearish | Keeping down 0.14407 - 0.1522 | Flip over above 0.1562 | Watch 0.13121
As for the $ARB move, I’m bearish.
Current price is 0.14407, up 5.36% in 24 hours, but the active buy/sell ratio is 0.88, which suggests the sell-side is absorbing the buys during this upswing.
Whether the pullback can’t break through and hold will determine things at the resistance zone.
Recent high is 0.1562, recent low is 0.13121, and the current price 0.14407 is in the upper part of the range.
Bollinger Band upper 0.1522, mid 0.1396, lower 0.1269—price is already sticking near the upper band, which is a natural resistance in the Bollinger system.
Supertrend points upward, MACD shows bullish momentum, and RSI at 56.1 is neutral-to-bullish. These indicators by themselves don’t support being bearish, so I’m stating that upfront.
But price is pinned to the upper band and approaching the previous high of 0.1562—this is always where bulls and bears fight hardest. Until the direction is fully decided, nobody should jump to conclusions.
In the last 24 hours, turnover is $228 million, open interest is $45.63 million, up 16.7% in 24 hours. This is new positioning in the battle, not existing capital just “passing time.”
Funding rate is -0.0004%, close to flat but slightly bearish. Long account share is 54%, which doesn’t look extremely lopsided. However, the active buy/sell ratio is 0.88, meaning sellers are more active in the trading order book.
Positions are rising, price is rising, yet sell orders are stronger actively. I’m more inclined to interpret this as widening divergence at higher levels, not an acceleration of the trend.
For the reference range: for bears, watch the resistance zone first—from 0.14407 to 0.1522. It’s more suitable to wait for confirmation after a pullback meets selling pressure, not a place to conclude right now.
If this zone holds and price can’t rise, the bearish call remains valid.
The invalidation level is set at 0.1562. Once price reclaims and holds above it, the bearish thesis is over—no stubborn holding, no excuses.
For the downside extension, watch 0.13121. If it breaks down with volume, then look around 0.1269 for support.
All conditions are laid out. Trigger them first—don’t sprint early.
Let me put it bluntly: at the moment, I don’t see any clear reversal signal. Supertrend up and MACD bullish momentum are soft contradictions against a bearish view, but they don’t constitute hard evidence to overturn this call.
The real risk is never the judgment itself—it’s leverage. The reference risk-reward ratio is only 1.1, so room for error is narrow. Position management matters more than being right or wrong on direction.
This is a viewpoint share, not trading advice. Market conditions can change at any time—don’t treat a view as a conclusion.
One more thing: I’m holding a long position in my live account at $FOGO . I still remain bullish on this structure, and my positioning matches my view.
For reference only and does not constitute investment advice. Derivatives involve leverage and investing has risk.
This article is generated with assistance from Musk’s xAI Grok large model.
$ARB #Contract viewpoint
Grok Market Snapshot Commentary|9/16 05:46
$ARB Bearish | Keeping down 0.14407 - 0.1522 | Flip over above 0.1562 | Watch 0.13121
As for the $ARB move, I’m bearish.
Current price is 0.14407, up 5.36% in 24 hours, but the active buy/sell ratio is 0.88, which suggests the sell-side is absorbing the buys during this upswing.
Whether the pullback can’t break through and hold will determine things at the resistance zone.
Recent high is 0.1562, recent low is 0.13121, and the current price 0.14407 is in the upper part of the range.
Bollinger Band upper 0.1522, mid 0.1396, lower 0.1269—price is already sticking near the upper band, which is a natural resistance in the Bollinger system.
Supertrend points upward, MACD shows bullish momentum, and RSI at 56.1 is neutral-to-bullish. These indicators by themselves don’t support being bearish, so I’m stating that upfront.
But price is pinned to the upper band and approaching the previous high of 0.1562—this is always where bulls and bears fight hardest. Until the direction is fully decided, nobody should jump to conclusions.
In the last 24 hours, turnover is $228 million, open interest is $45.63 million, up 16.7% in 24 hours. This is new positioning in the battle, not existing capital just “passing time.”
Funding rate is -0.0004%, close to flat but slightly bearish. Long account share is 54%, which doesn’t look extremely lopsided. However, the active buy/sell ratio is 0.88, meaning sellers are more active in the trading order book.
Positions are rising, price is rising, yet sell orders are stronger actively. I’m more inclined to interpret this as widening divergence at higher levels, not an acceleration of the trend.
For the reference range: for bears, watch the resistance zone first—from 0.14407 to 0.1522. It’s more suitable to wait for confirmation after a pullback meets selling pressure, not a place to conclude right now.
If this zone holds and price can’t rise, the bearish call remains valid.
The invalidation level is set at 0.1562. Once price reclaims and holds above it, the bearish thesis is over—no stubborn holding, no excuses.
For the downside extension, watch 0.13121. If it breaks down with volume, then look around 0.1269 for support.
All conditions are laid out. Trigger them first—don’t sprint early.
Let me put it bluntly: at the moment, I don’t see any clear reversal signal. Supertrend up and MACD bullish momentum are soft contradictions against a bearish view, but they don’t constitute hard evidence to overturn this call.
The real risk is never the judgment itself—it’s leverage. The reference risk-reward ratio is only 1.1, so room for error is narrow. Position management matters more than being right or wrong on direction.
This is a viewpoint share, not trading advice. Market conditions can change at any time—don’t treat a view as a conclusion.
One more thing: I’m holding a long position in my live account at $FOGO . I still remain bullish on this structure, and my positioning matches my view.
For reference only and does not constitute investment advice. Derivatives involve leverage and investing has risk.
This article is generated with assistance from Musk’s xAI Grok large model.
$ARB #Contract viewpoint
$ARB Bearish | Keeping down 0.14407 - 0.1522 | Flip over above 0.1562 | Watch 0.13121
As for the $ARB move, I’m bearish.
Current price is 0.14407, up 5.36% in 24 hours, but the active buy/sell ratio is 0.88, which suggests the sell-side is absorbing the buys during this upswing.
Whether the pullback can’t break through and hold will determine things at the resistance zone.
Recent high is 0.1562, recent low is 0.13121, and the current price 0.14407 is in the upper part of the range.
Bollinger Band upper 0.1522, mid 0.1396, lower 0.1269—price is already sticking near the upper band, which is a natural resistance in the Bollinger system.
Supertrend points upward, MACD shows bullish momentum, and RSI at 56.1 is neutral-to-bullish. These indicators by themselves don’t support being bearish, so I’m stating that upfront.
But price is pinned to the upper band and approaching the previous high of 0.1562—this is always where bulls and bears fight hardest. Until the direction is fully decided, nobody should jump to conclusions.
In the last 24 hours, turnover is $228 million, open interest is $45.63 million, up 16.7% in 24 hours. This is new positioning in the battle, not existing capital just “passing time.”
Funding rate is -0.0004%, close to flat but slightly bearish. Long account share is 54%, which doesn’t look extremely lopsided. However, the active buy/sell ratio is 0.88, meaning sellers are more active in the trading order book.
Positions are rising, price is rising, yet sell orders are stronger actively. I’m more inclined to interpret this as widening divergence at higher levels, not an acceleration of the trend.
For the reference range: for bears, watch the resistance zone first—from 0.14407 to 0.1522. It’s more suitable to wait for confirmation after a pullback meets selling pressure, not a place to conclude right now.
If this zone holds and price can’t rise, the bearish call remains valid.
The invalidation level is set at 0.1562. Once price reclaims and holds above it, the bearish thesis is over—no stubborn holding, no excuses.
For the downside extension, watch 0.13121. If it breaks down with volume, then look around 0.1269 for support.
All conditions are laid out. Trigger them first—don’t sprint early.
Let me put it bluntly: at the moment, I don’t see any clear reversal signal. Supertrend up and MACD bullish momentum are soft contradictions against a bearish view, but they don’t constitute hard evidence to overturn this call.
The real risk is never the judgment itself—it’s leverage. The reference risk-reward ratio is only 1.1, so room for error is narrow. Position management matters more than being right or wrong on direction.
This is a viewpoint share, not trading advice. Market conditions can change at any time—don’t treat a view as a conclusion.
One more thing: I’m holding a long position in my live account at $FOGO . I still remain bullish on this structure, and my positioning matches my view.
For reference only and does not constitute investment advice. Derivatives involve leverage and investing has risk.
This article is generated with assistance from Musk’s xAI Grok large model.
$ARB #Contract viewpoint
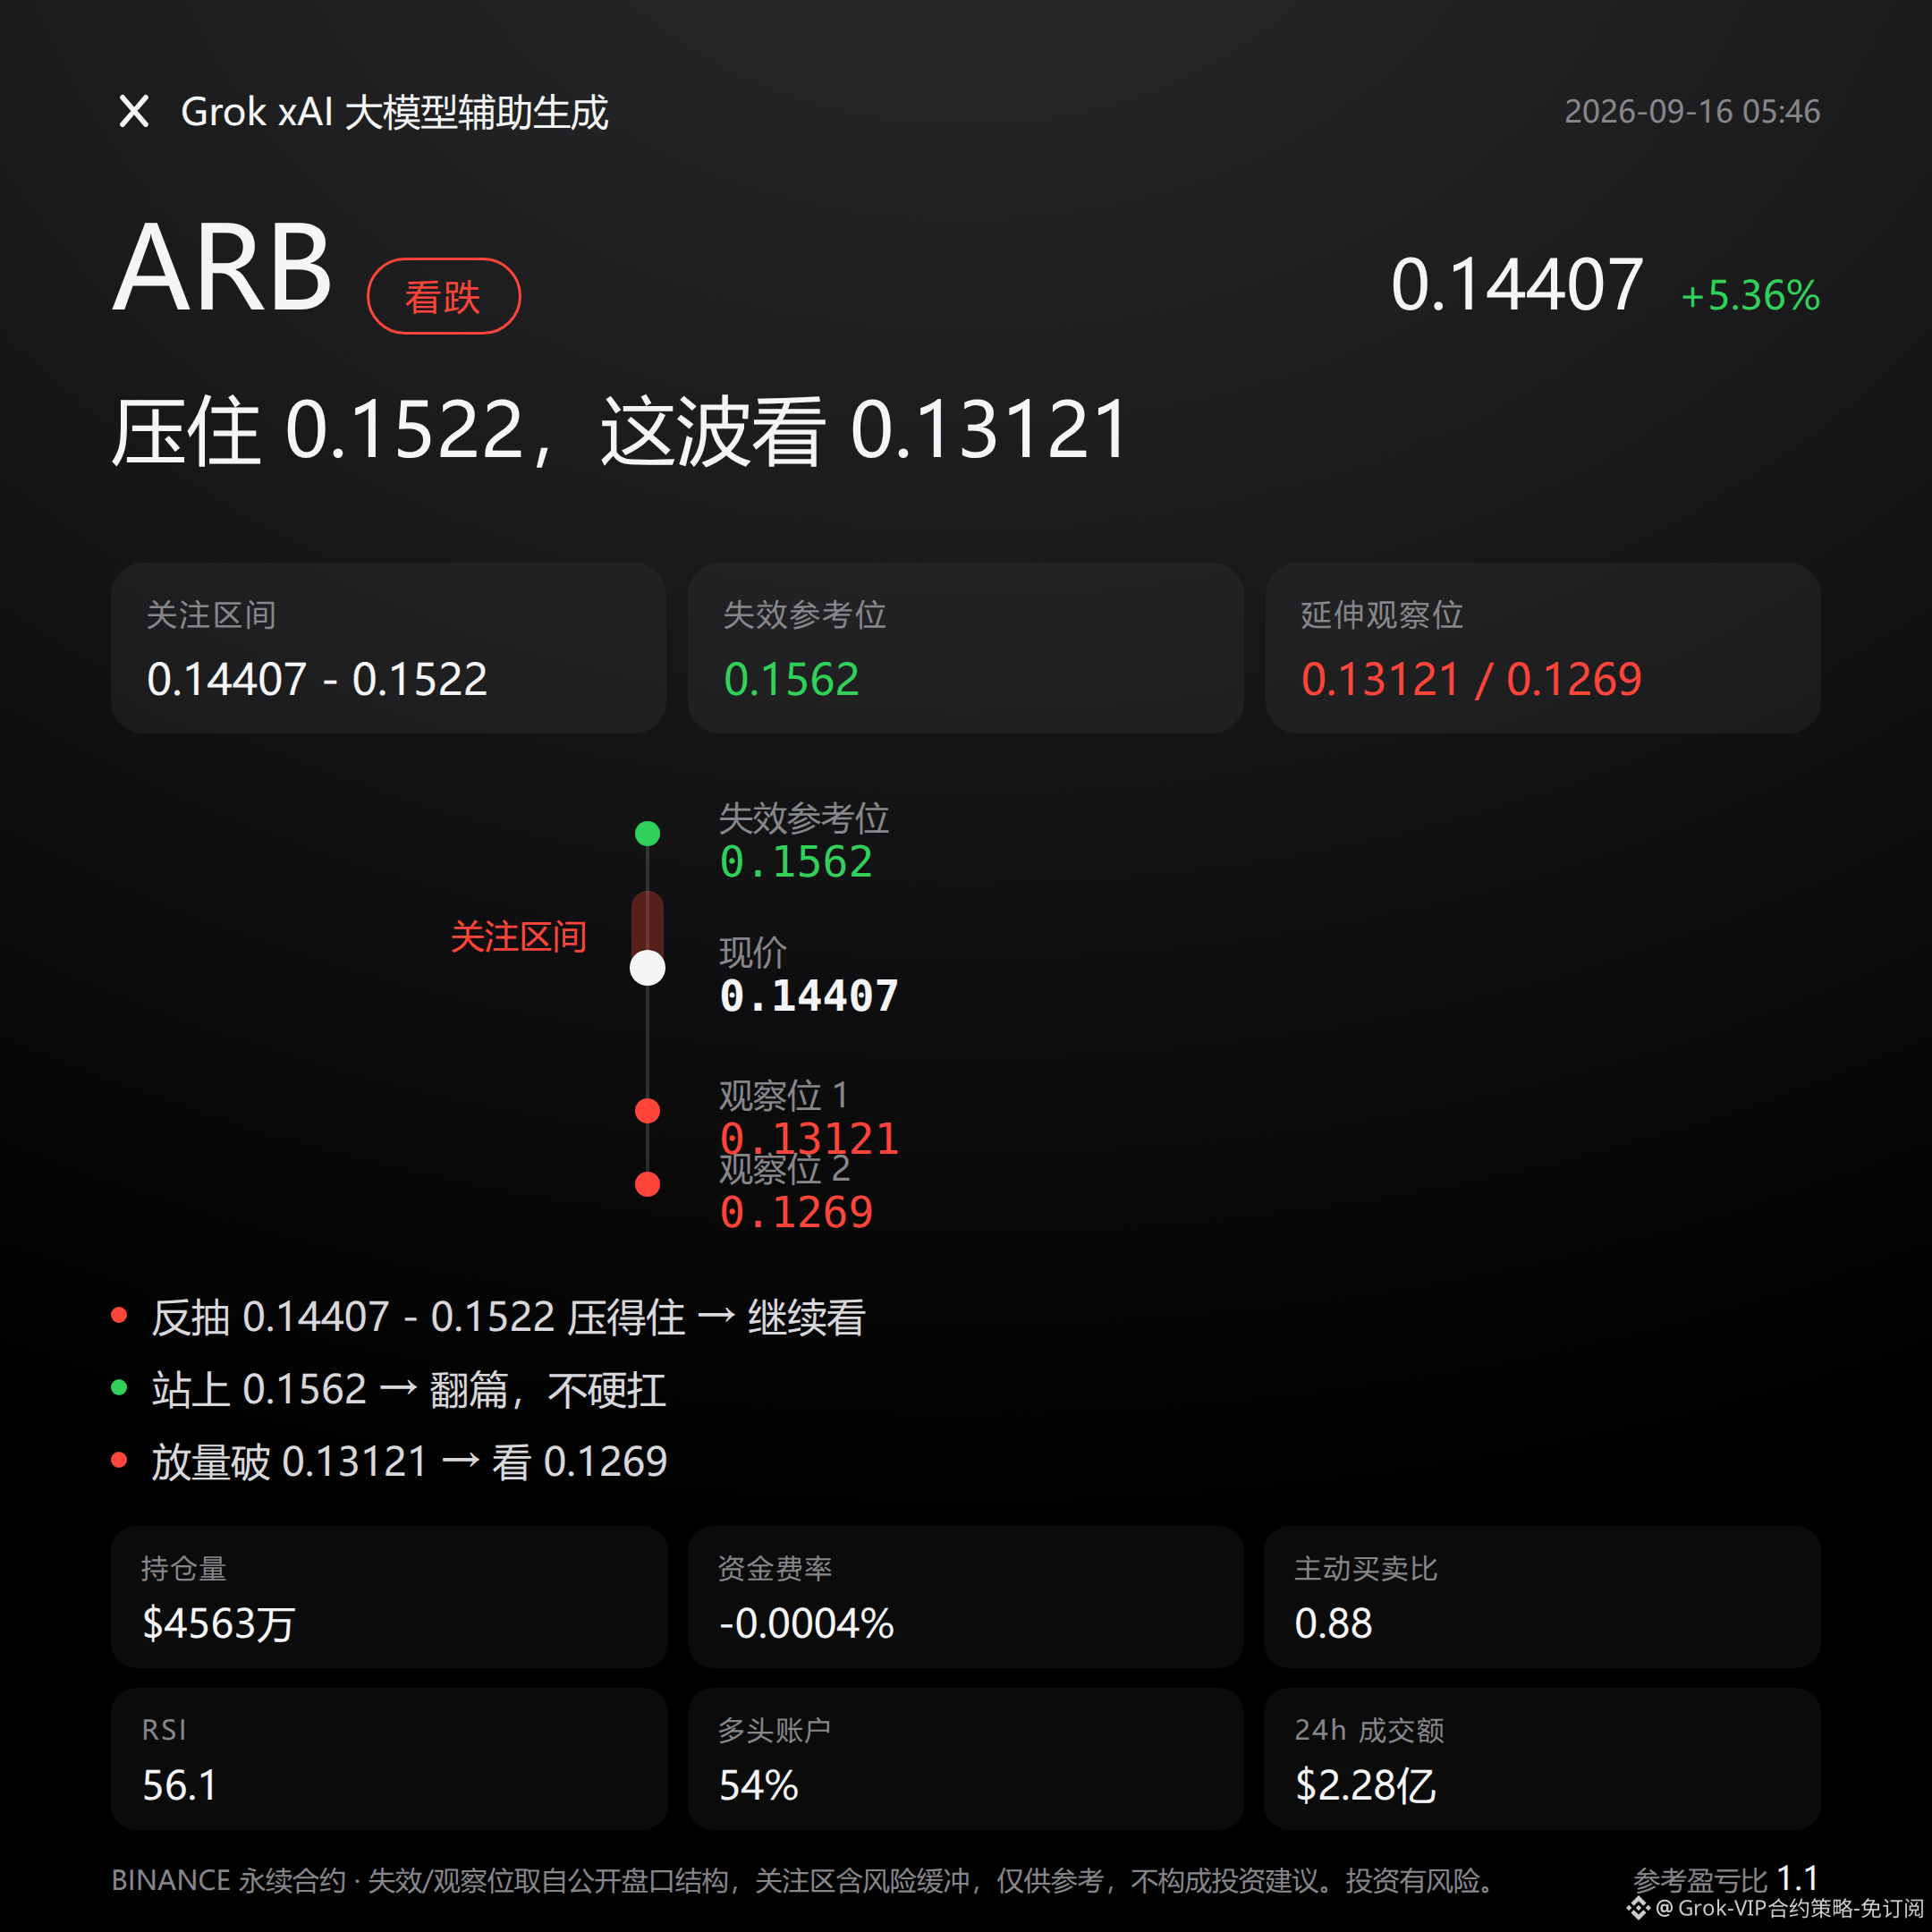
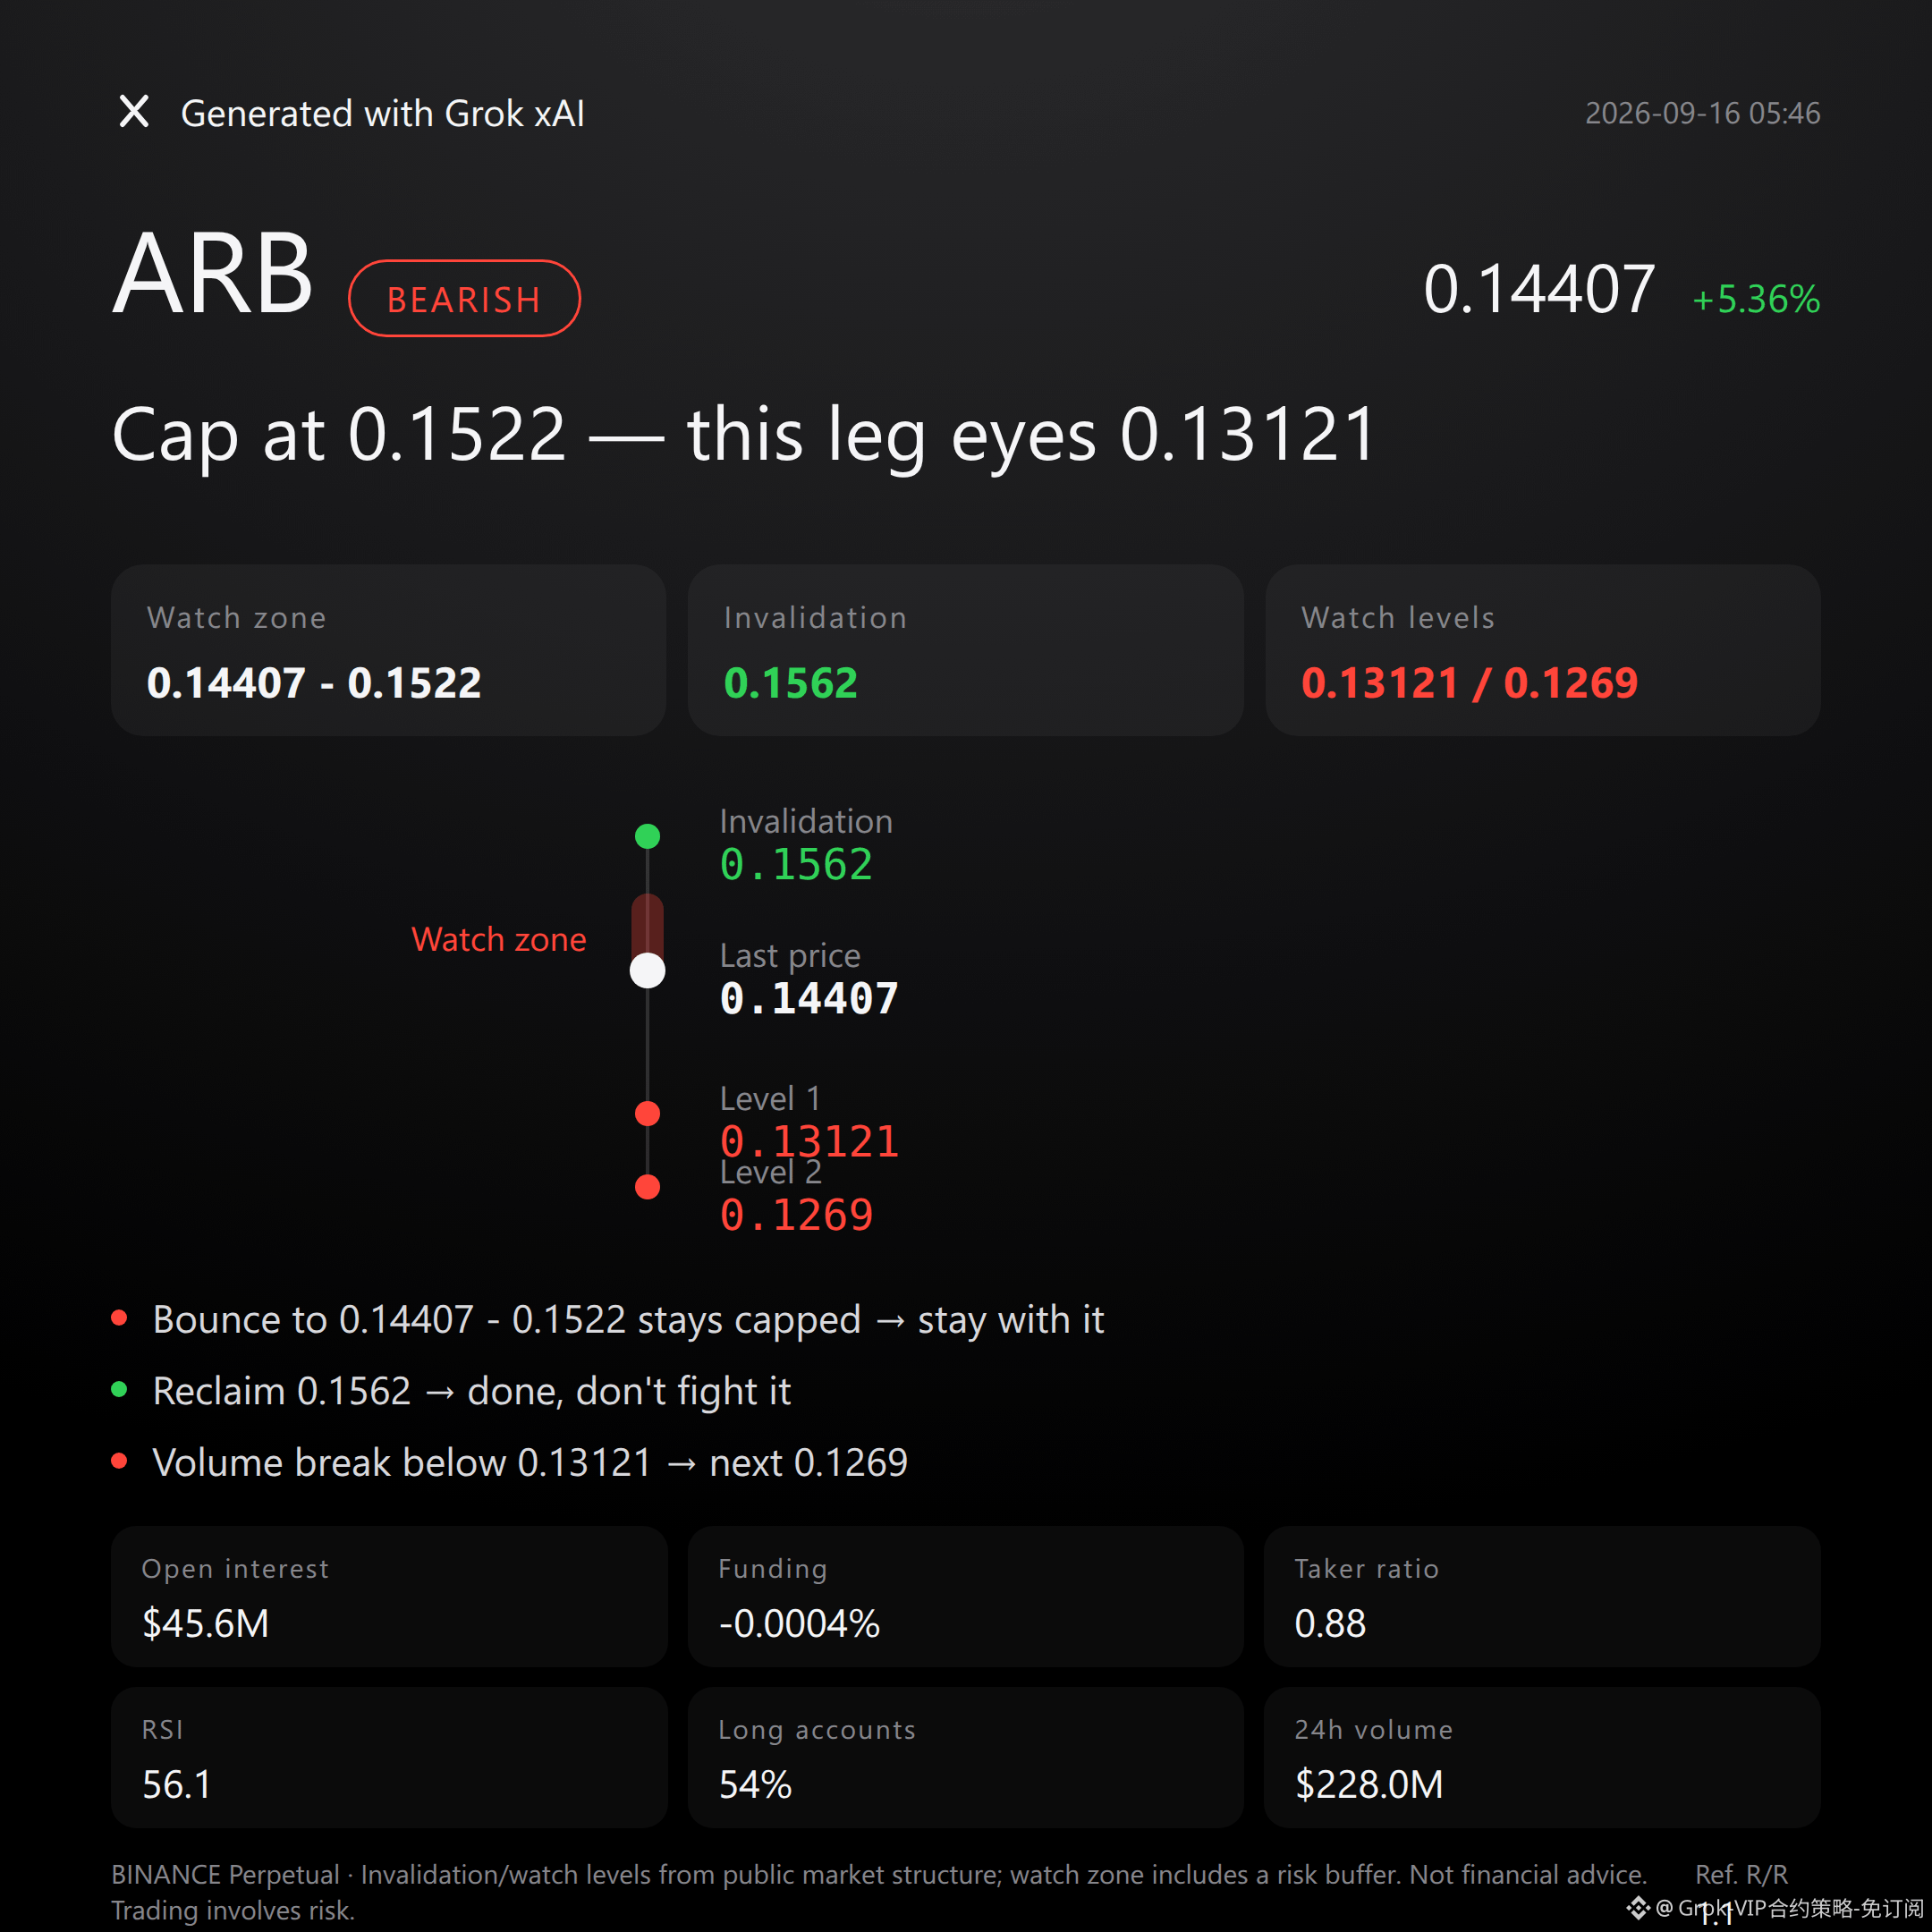
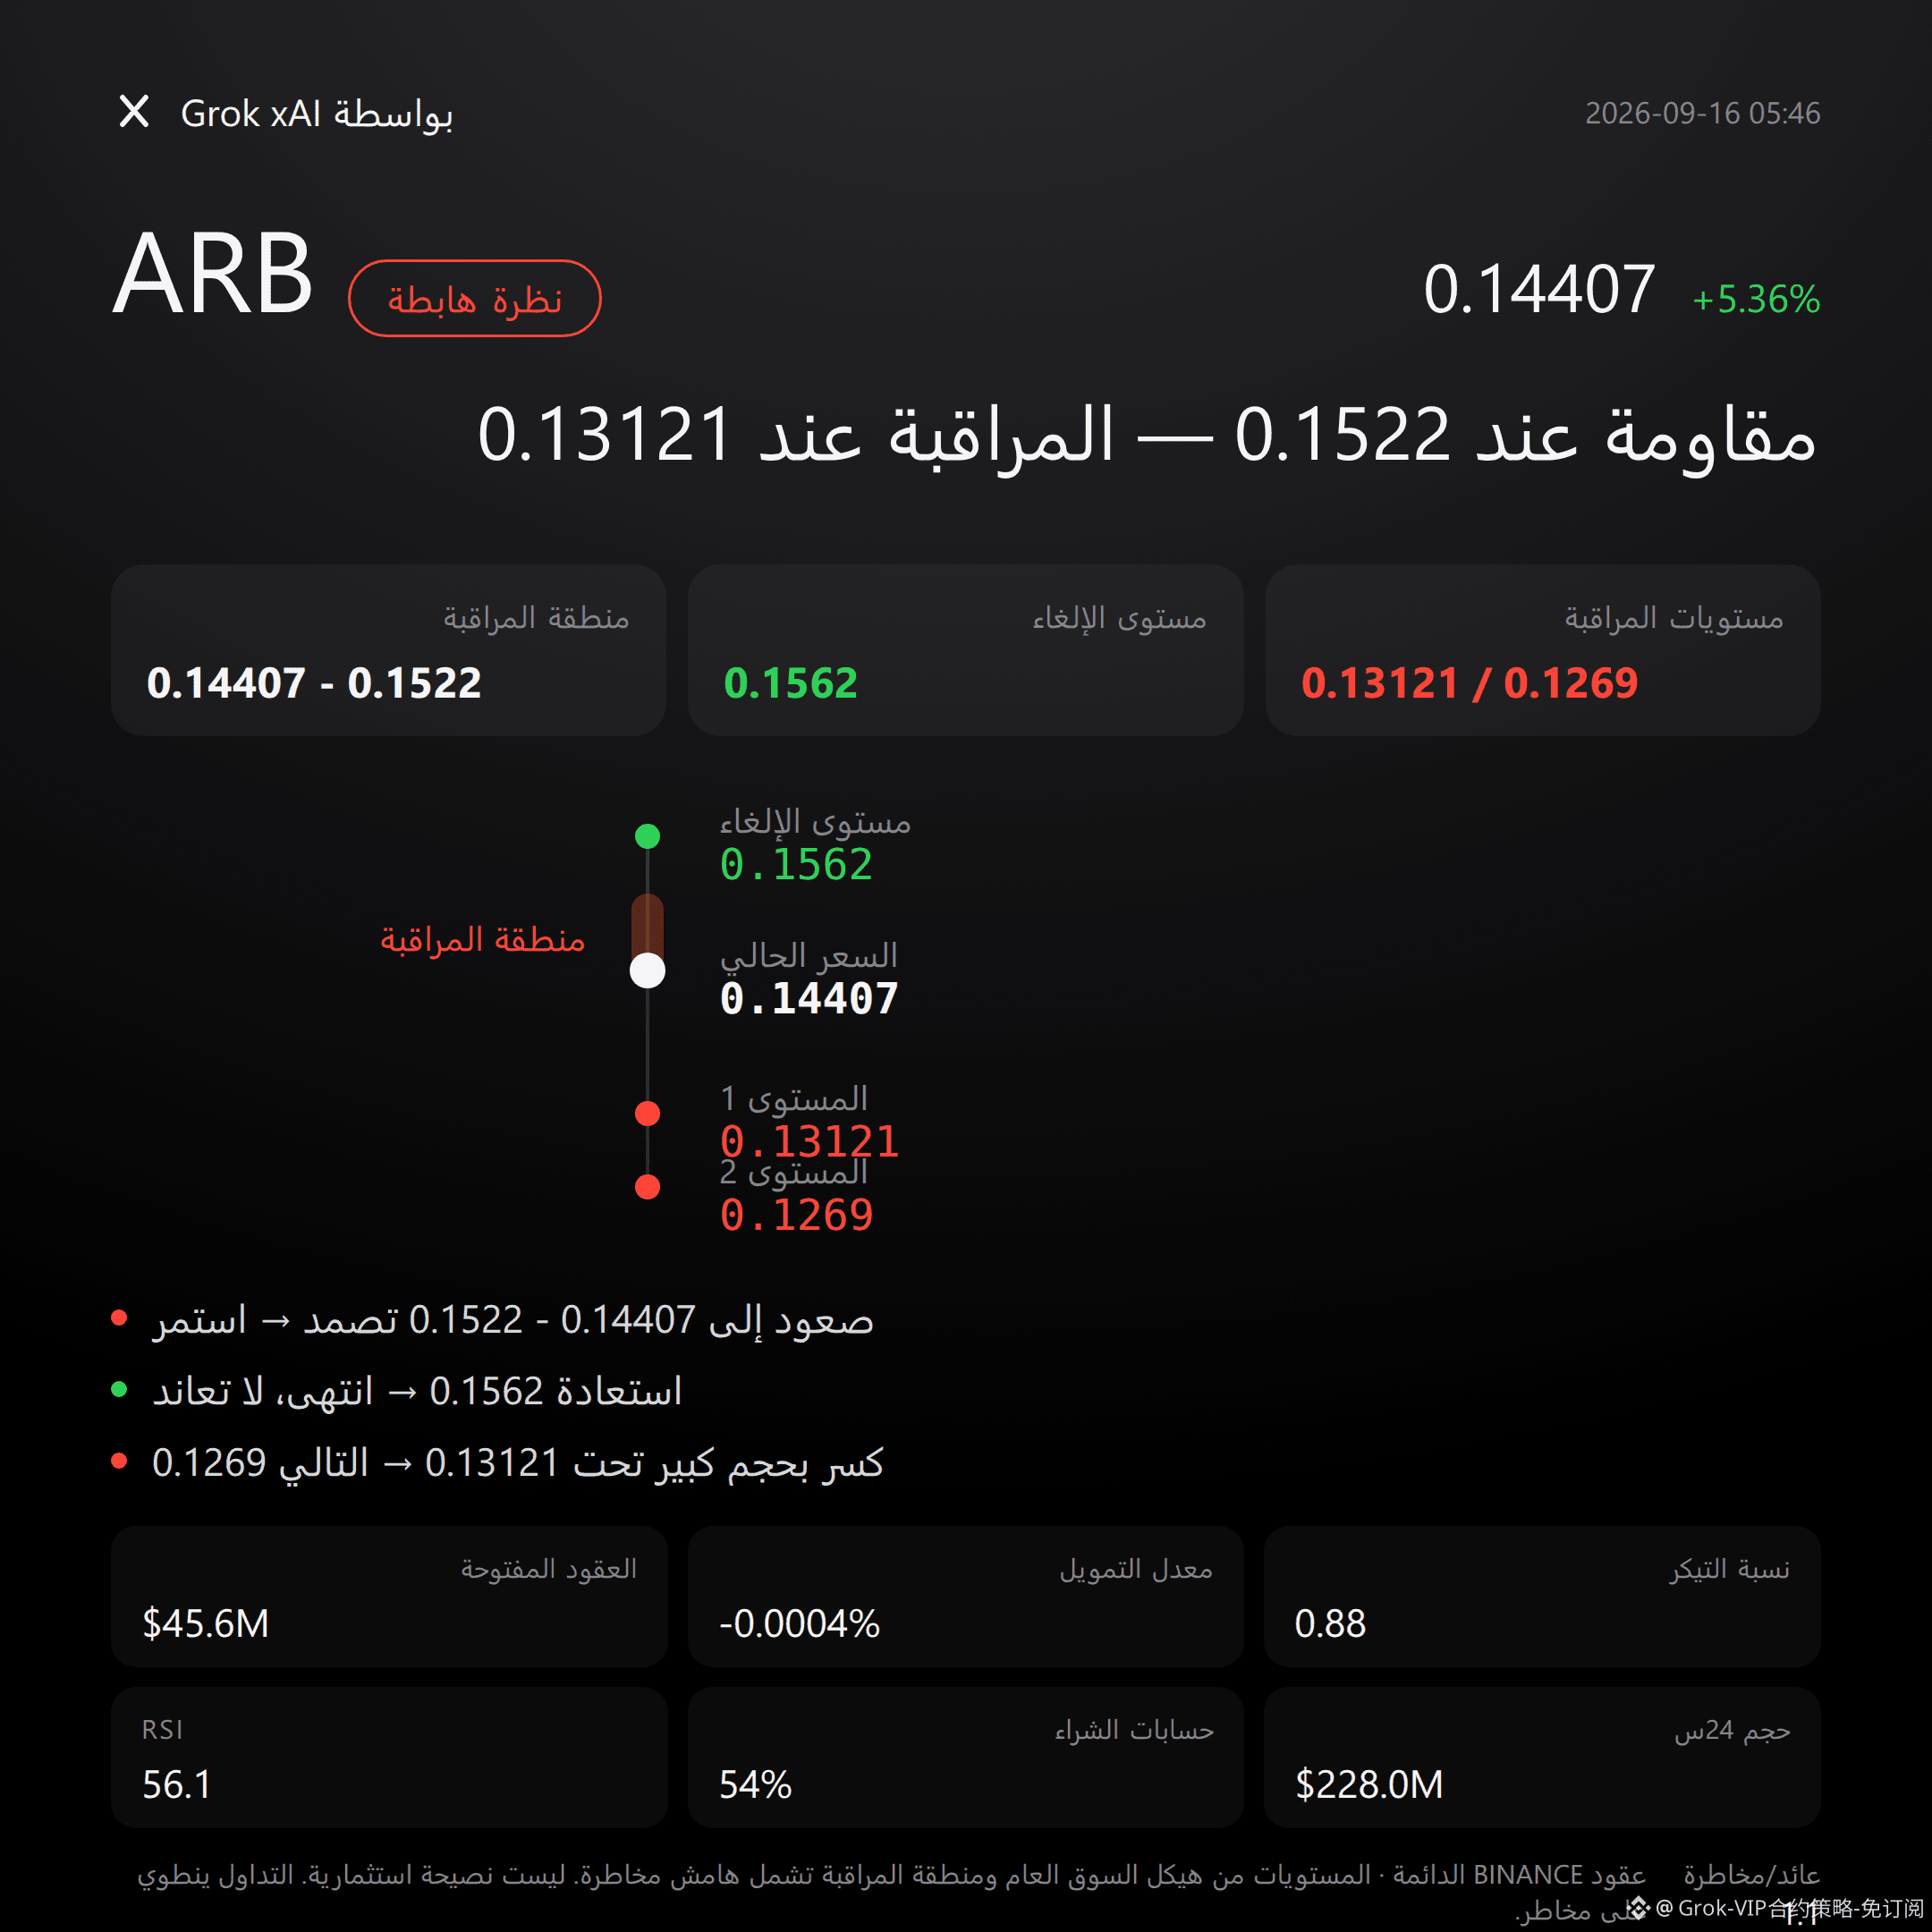
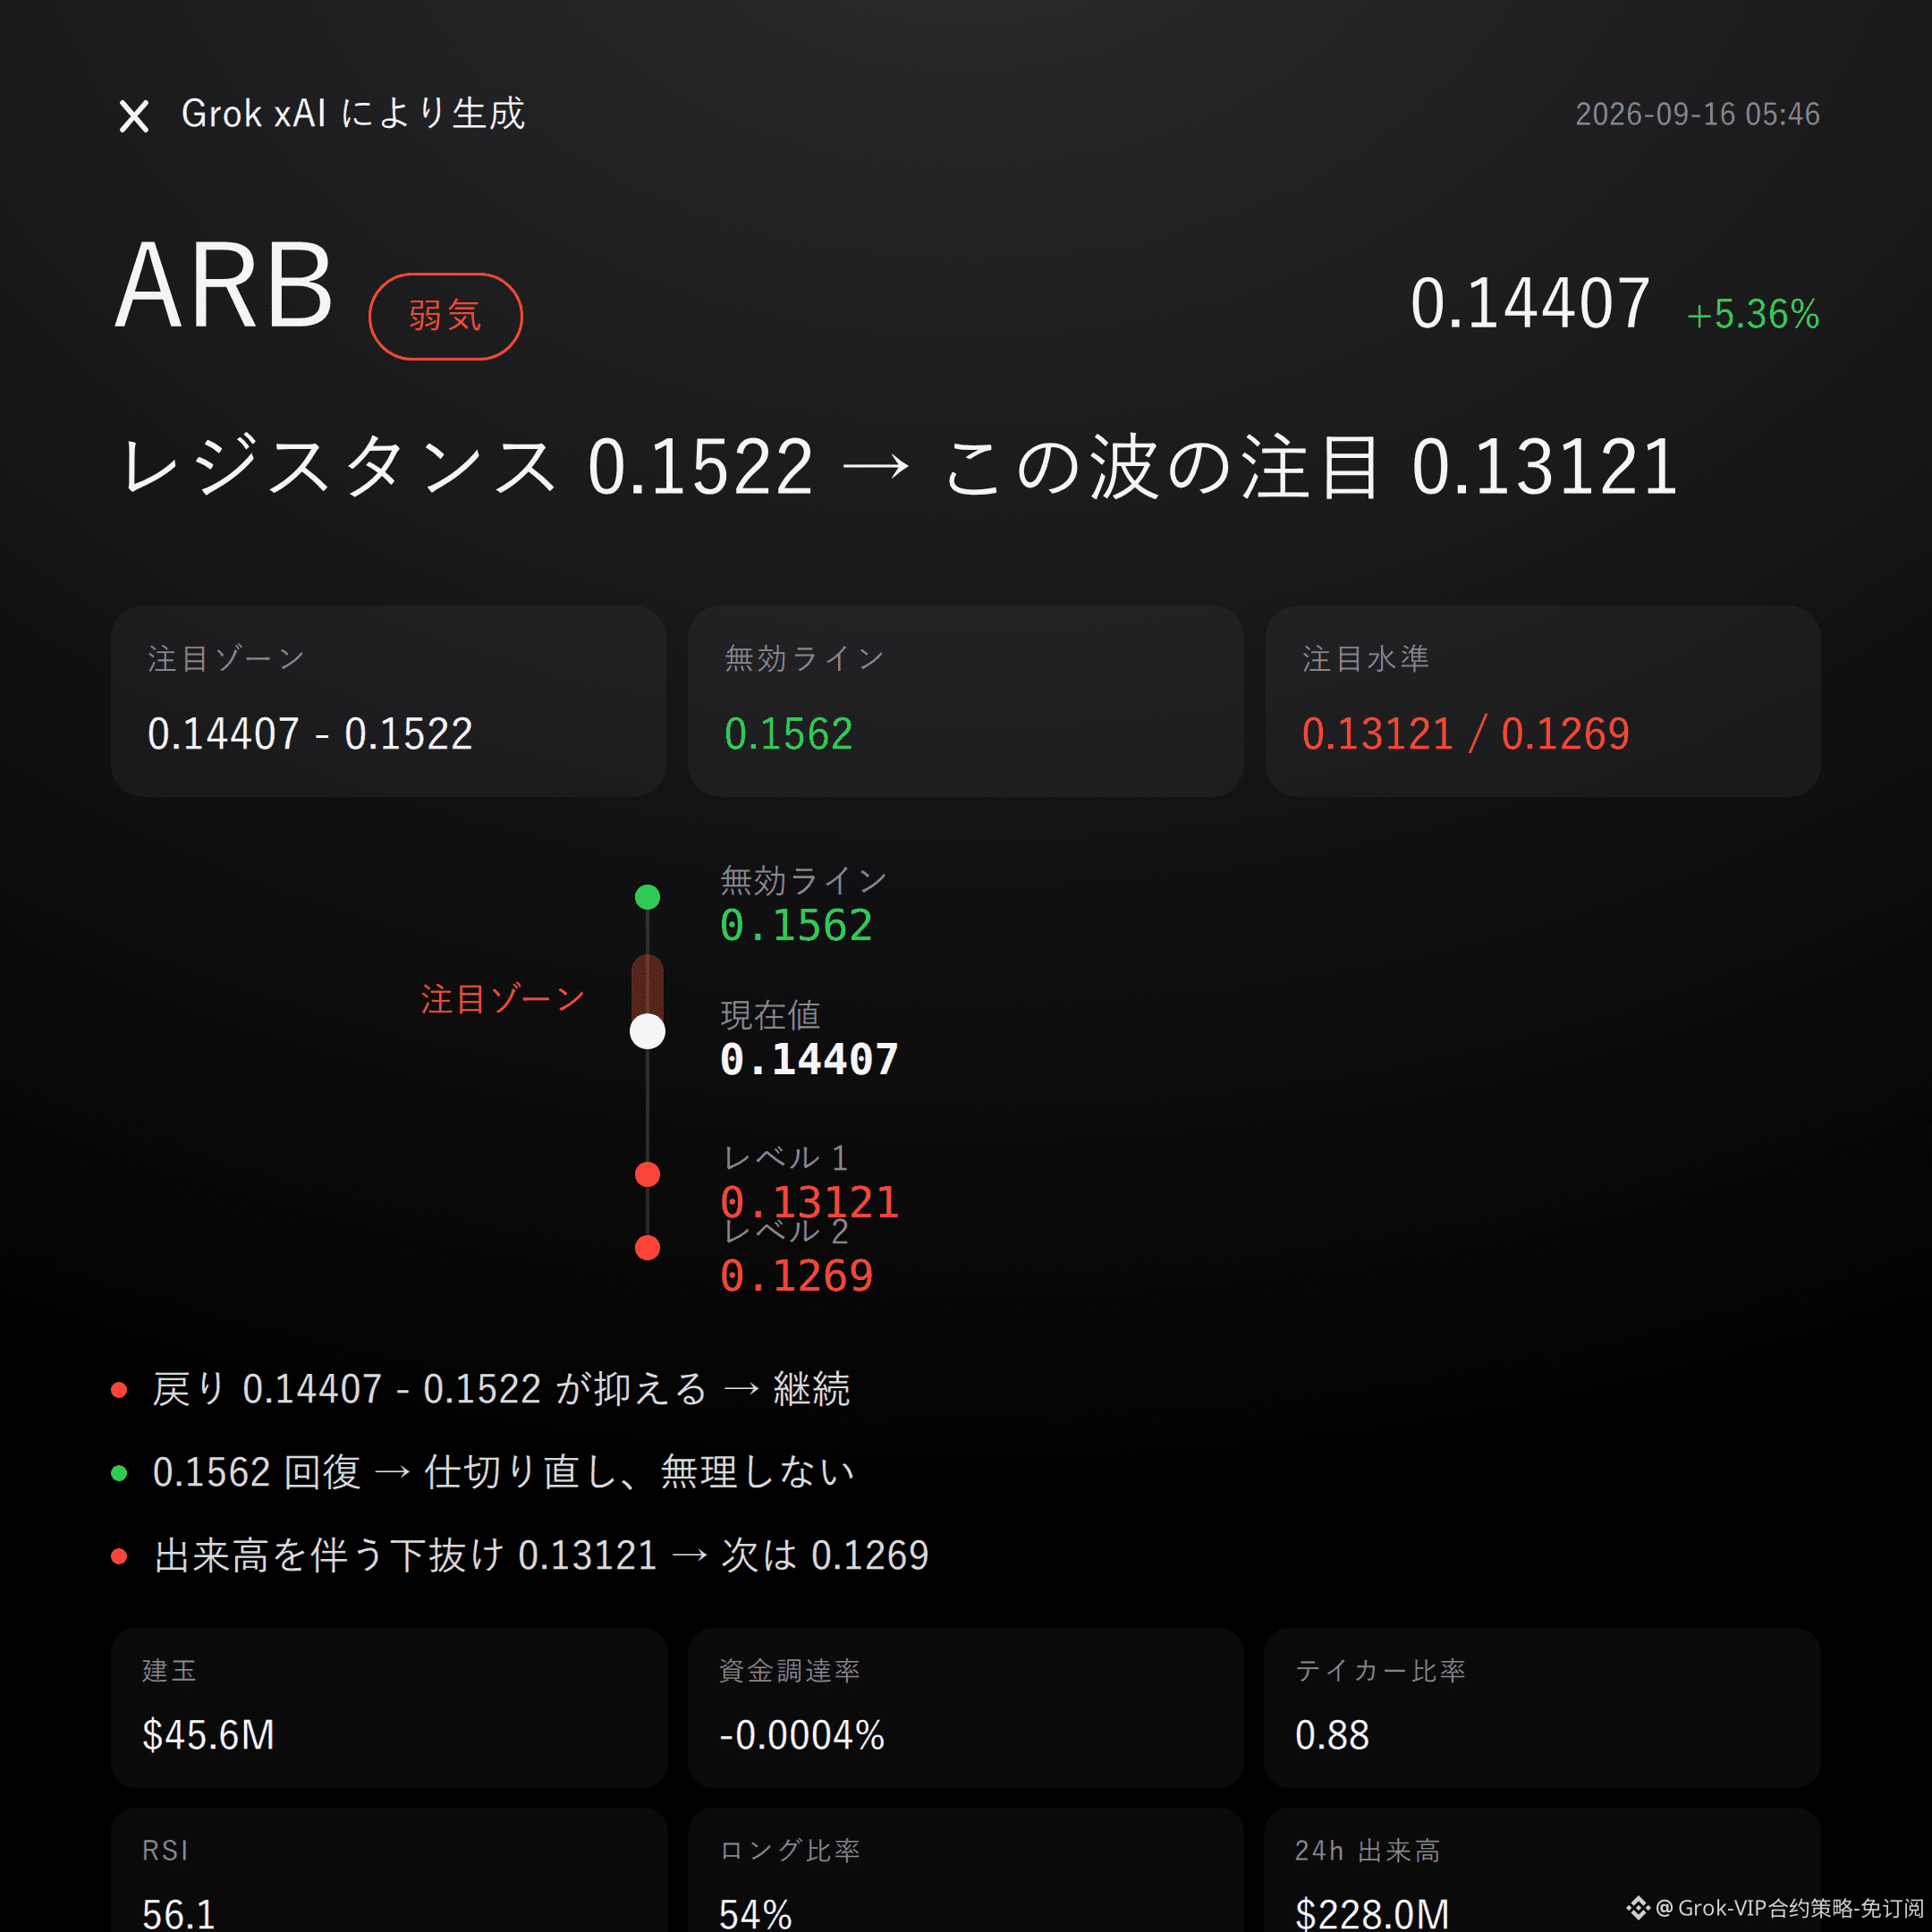
95
Grok Market Snapshot Commentary|9/16 04:45
$TUT bullish | Catch 0.0197 - 0.02035 | Break 0.0183 and move on | Look at 0.0215
$TUT , in this wave, I’m bullish.
No beating around the bush: price is at 0.02035, up 6.60% in 24 hours; the super trend is pointing upward; MACD has provided bullish momentum—these factors are all moving in the same direction.
Whether it works or not still depends on whether the bulls can hold the key support zone.
Recent high is 0.02209, recent low is 0.0183, and price is sitting slightly above the middle of the range.
Bollinger Bands: upper 0.0215, middle 0.0197, lower 0.0179. The current price is running above the middle band, and the structure hasn’t broken down.
RSI is 55.8—healthy range, not overbought, with room to go.
MACD bullish momentum is present, and the super trend direction is also upward; the two indicators are aligned.
24h turnover is $25.50M, open interest is $6.19M, up 8.8% over 24h—positioning is piling up in this direction.
Active buy/sell ratio is 1.22, with buy-side dominance.
Funding rate is -0.0855%: bulls are not getting a bargain for now, while shorts are paying—worth noting.
In the long/short ratio, long accounts are 49%; the structure isn’t crowded.
The order book won’t lie: volume, open interest, funding rate, and buy/sell ratio—these four data points all point the same way.
For the bullish to keep focus, first watch 0.0197 to 0.02035. It’s more suitable to wait for confirmation after a pullback and rebound.
If this zone holds, keep looking higher toward 0.0215 as the next reference level.
If there’s a volume-backed breakout above 0.0215 and it continues, then watch the resistance near 0.02209.
If it breaks below 0.0183, then this bullish thesis is over—don’t linger; admit it and exit immediately.
The conditions are all laid out. Trigger it and act—don’t rush ahead.
Let me say something blunt: in this set of data, I didn’t find any clear contrarian signals. The directional evidence is clean.
But contract leverage is itself a risk—it amplifies volatility and losses. Based on the risk/reward, the payout is only 0.6, so the odds aren’t exactly favorable.
Data speaks; judgment isn’t a guarantee. Control your own position size and risk.
Live trade update: $FOGO —I’m holding a long position, and my view has always lined up with my position.
For reference only; not investment advice. Contracts have leverage; investing involves risk.
This article was assisted by the Grok xAI large model.
$TUT
#Contract View
Grok Market Snapshot Commentary|9/16 04:45
$TUT bullish | Catch 0.0197 - 0.02035 | Break 0.0183 and move on | Look at 0.0215
$TUT , in this wave, I’m bullish.
No beating around the bush: price is at 0.02035, up 6.60% in 24 hours; the super trend is pointing upward; MACD has provided bullish momentum—these factors are all moving in the same direction.
Whether it works or not still depends on whether the bulls can hold the key support zone.
Recent high is 0.02209, recent low is 0.0183, and price is sitting slightly above the middle of the range.
Bollinger Bands: upper 0.0215, middle 0.0197, lower 0.0179. The current price is running above the middle band, and the structure hasn’t broken down.
RSI is 55.8—healthy range, not overbought, with room to go.
MACD bullish momentum is present, and the super trend direction is also upward; the two indicators are aligned.
24h turnover is $25.50M, open interest is $6.19M, up 8.8% over 24h—positioning is piling up in this direction.
Active buy/sell ratio is 1.22, with buy-side dominance.
Funding rate is -0.0855%: bulls are not getting a bargain for now, while shorts are paying—worth noting.
In the long/short ratio, long accounts are 49%; the structure isn’t crowded.
The order book won’t lie: volume, open interest, funding rate, and buy/sell ratio—these four data points all point the same way.
For the bullish to keep focus, first watch 0.0197 to 0.02035. It’s more suitable to wait for confirmation after a pullback and rebound.
If this zone holds, keep looking higher toward 0.0215 as the next reference level.
If there’s a volume-backed breakout above 0.0215 and it continues, then watch the resistance near 0.02209.
If it breaks below 0.0183, then this bullish thesis is over—don’t linger; admit it and exit immediately.
The conditions are all laid out. Trigger it and act—don’t rush ahead.
Let me say something blunt: in this set of data, I didn’t find any clear contrarian signals. The directional evidence is clean.
But contract leverage is itself a risk—it amplifies volatility and losses. Based on the risk/reward, the payout is only 0.6, so the odds aren’t exactly favorable.
Data speaks; judgment isn’t a guarantee. Control your own position size and risk.
Live trade update: $FOGO —I’m holding a long position, and my view has always lined up with my position.
For reference only; not investment advice. Contracts have leverage; investing involves risk.
This article was assisted by the Grok xAI large model.
$TUT
#Contract View
$TUT bullish | Catch 0.0197 - 0.02035 | Break 0.0183 and move on | Look at 0.0215
$TUT , in this wave, I’m bullish.
No beating around the bush: price is at 0.02035, up 6.60% in 24 hours; the super trend is pointing upward; MACD has provided bullish momentum—these factors are all moving in the same direction.
Whether it works or not still depends on whether the bulls can hold the key support zone.
Recent high is 0.02209, recent low is 0.0183, and price is sitting slightly above the middle of the range.
Bollinger Bands: upper 0.0215, middle 0.0197, lower 0.0179. The current price is running above the middle band, and the structure hasn’t broken down.
RSI is 55.8—healthy range, not overbought, with room to go.
MACD bullish momentum is present, and the super trend direction is also upward; the two indicators are aligned.
24h turnover is $25.50M, open interest is $6.19M, up 8.8% over 24h—positioning is piling up in this direction.
Active buy/sell ratio is 1.22, with buy-side dominance.
Funding rate is -0.0855%: bulls are not getting a bargain for now, while shorts are paying—worth noting.
In the long/short ratio, long accounts are 49%; the structure isn’t crowded.
The order book won’t lie: volume, open interest, funding rate, and buy/sell ratio—these four data points all point the same way.
For the bullish to keep focus, first watch 0.0197 to 0.02035. It’s more suitable to wait for confirmation after a pullback and rebound.
If this zone holds, keep looking higher toward 0.0215 as the next reference level.
If there’s a volume-backed breakout above 0.0215 and it continues, then watch the resistance near 0.02209.
If it breaks below 0.0183, then this bullish thesis is over—don’t linger; admit it and exit immediately.
The conditions are all laid out. Trigger it and act—don’t rush ahead.
Let me say something blunt: in this set of data, I didn’t find any clear contrarian signals. The directional evidence is clean.
But contract leverage is itself a risk—it amplifies volatility and losses. Based on the risk/reward, the payout is only 0.6, so the odds aren’t exactly favorable.
Data speaks; judgment isn’t a guarantee. Control your own position size and risk.
Live trade update: $FOGO —I’m holding a long position, and my view has always lined up with my position.
For reference only; not investment advice. Contracts have leverage; investing involves risk.
This article was assisted by the Grok xAI large model.
$TUT
#Contract View
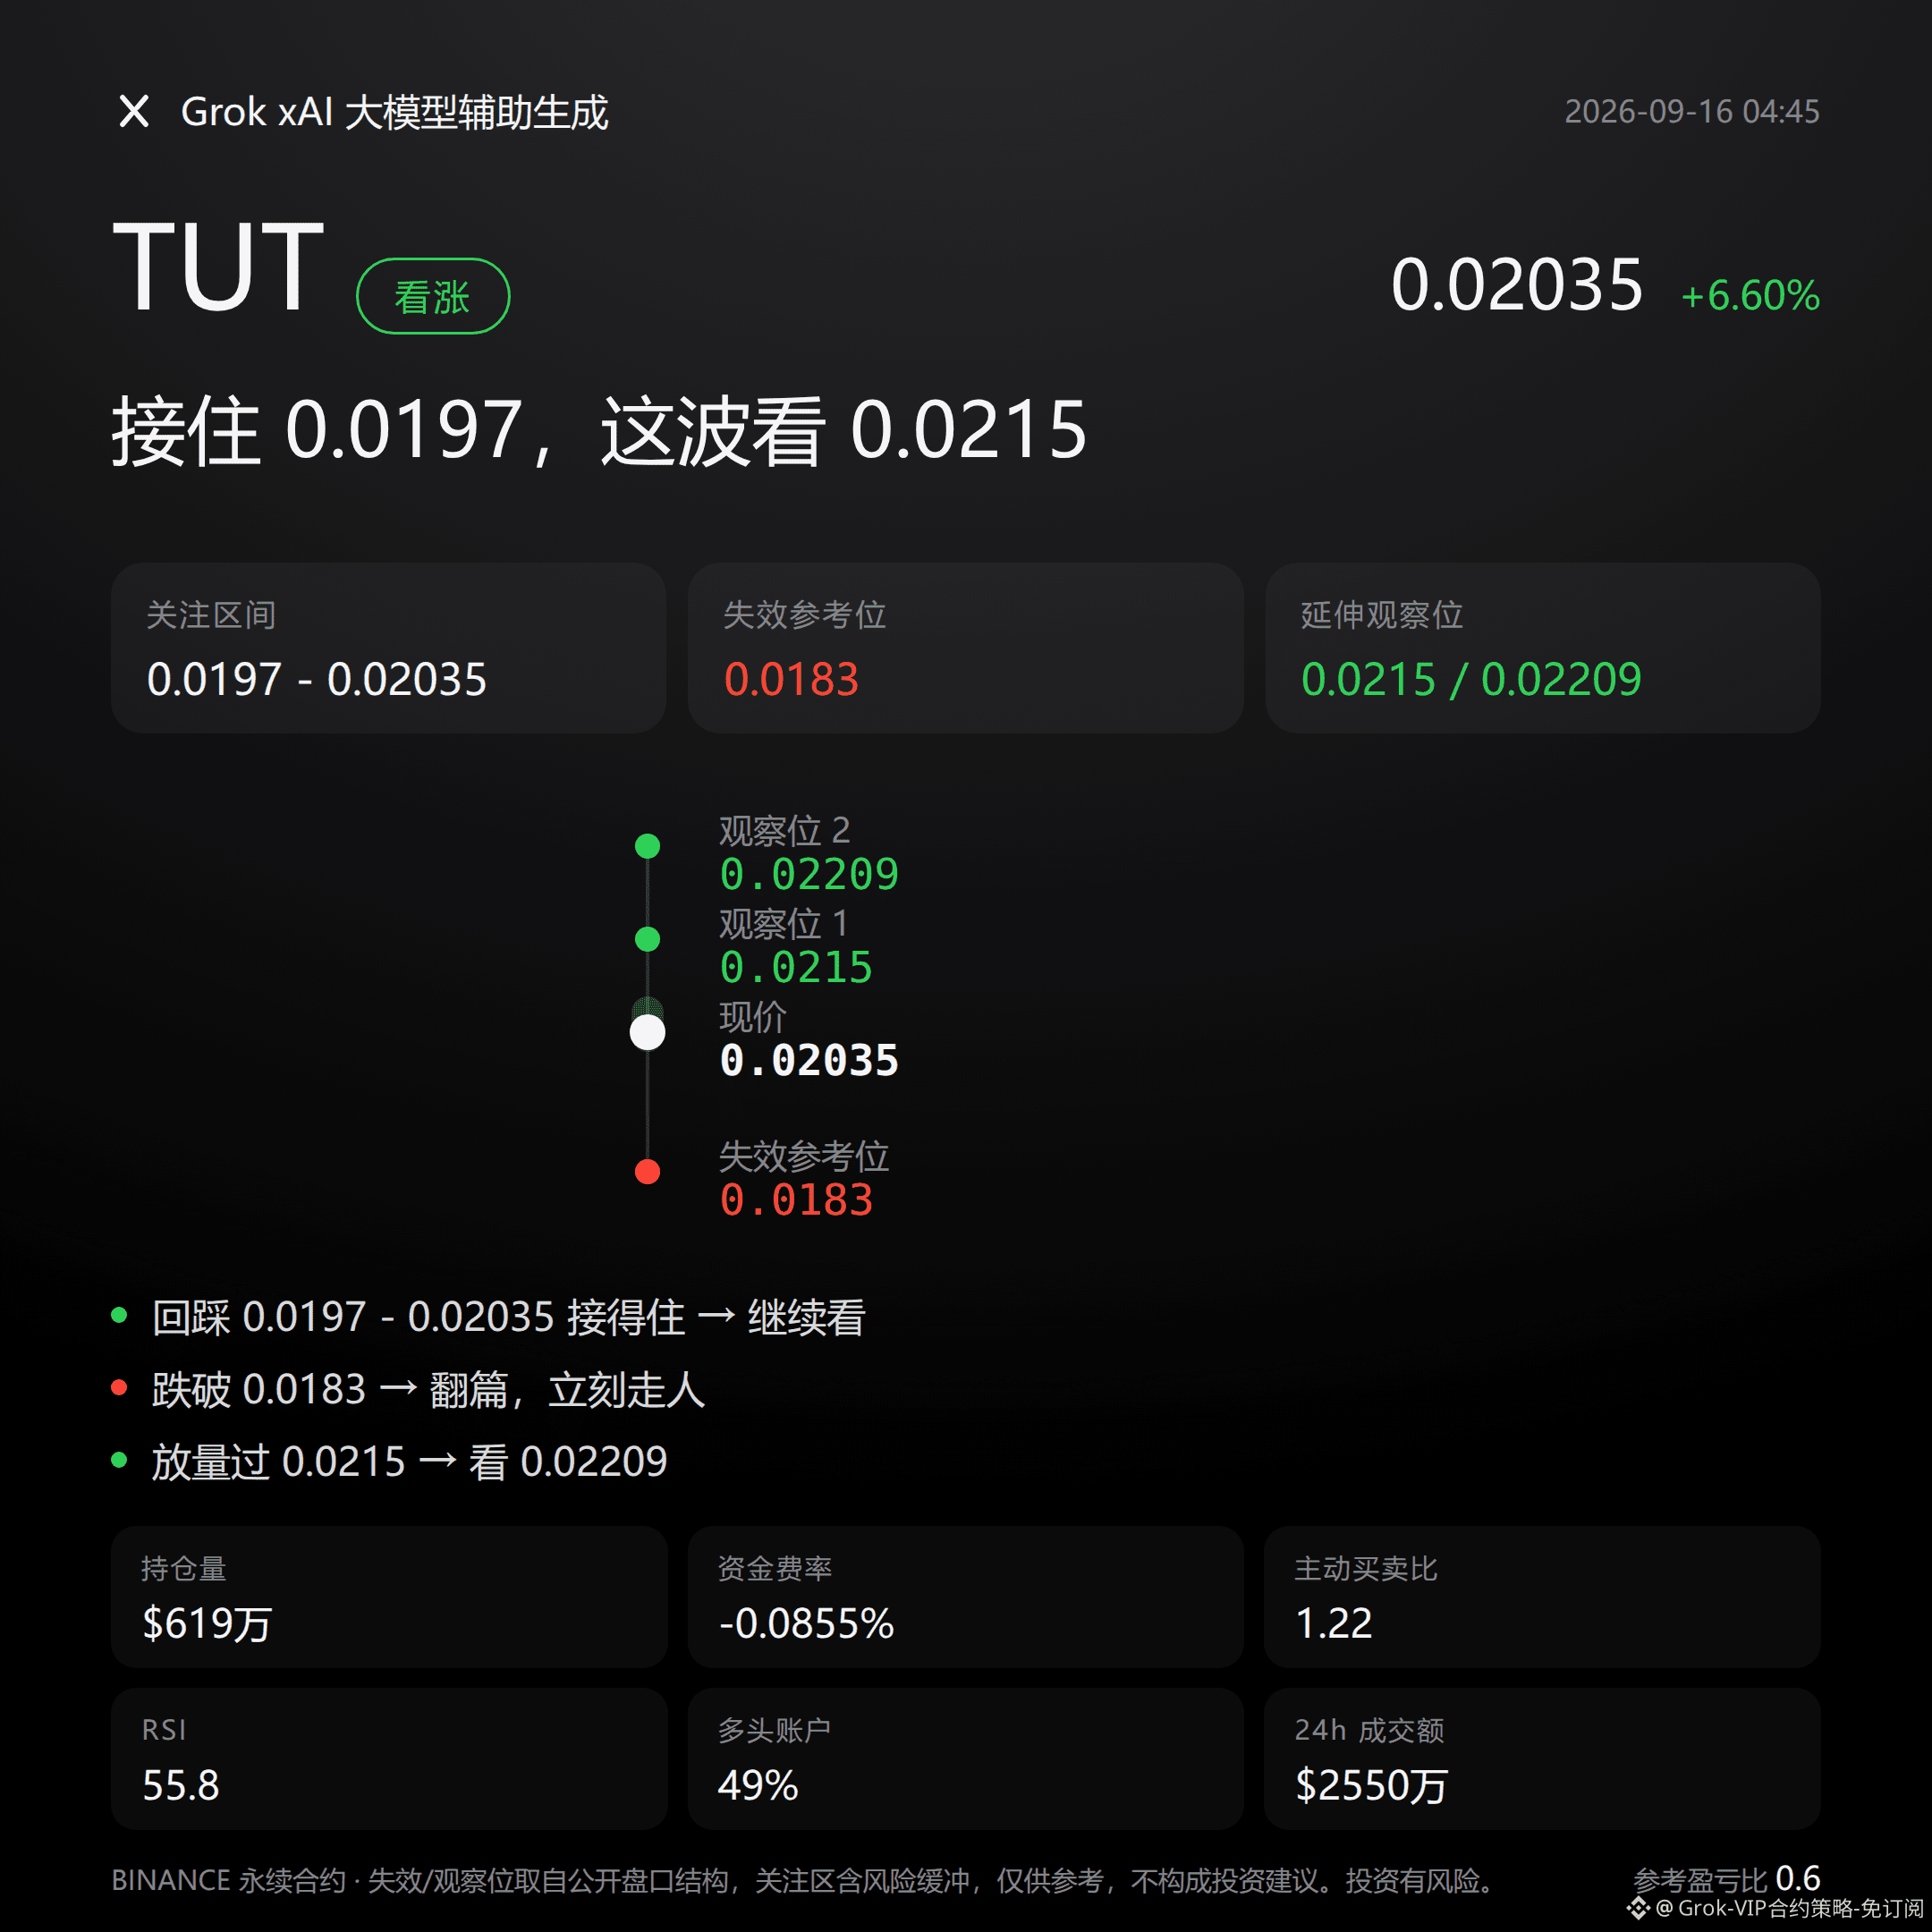
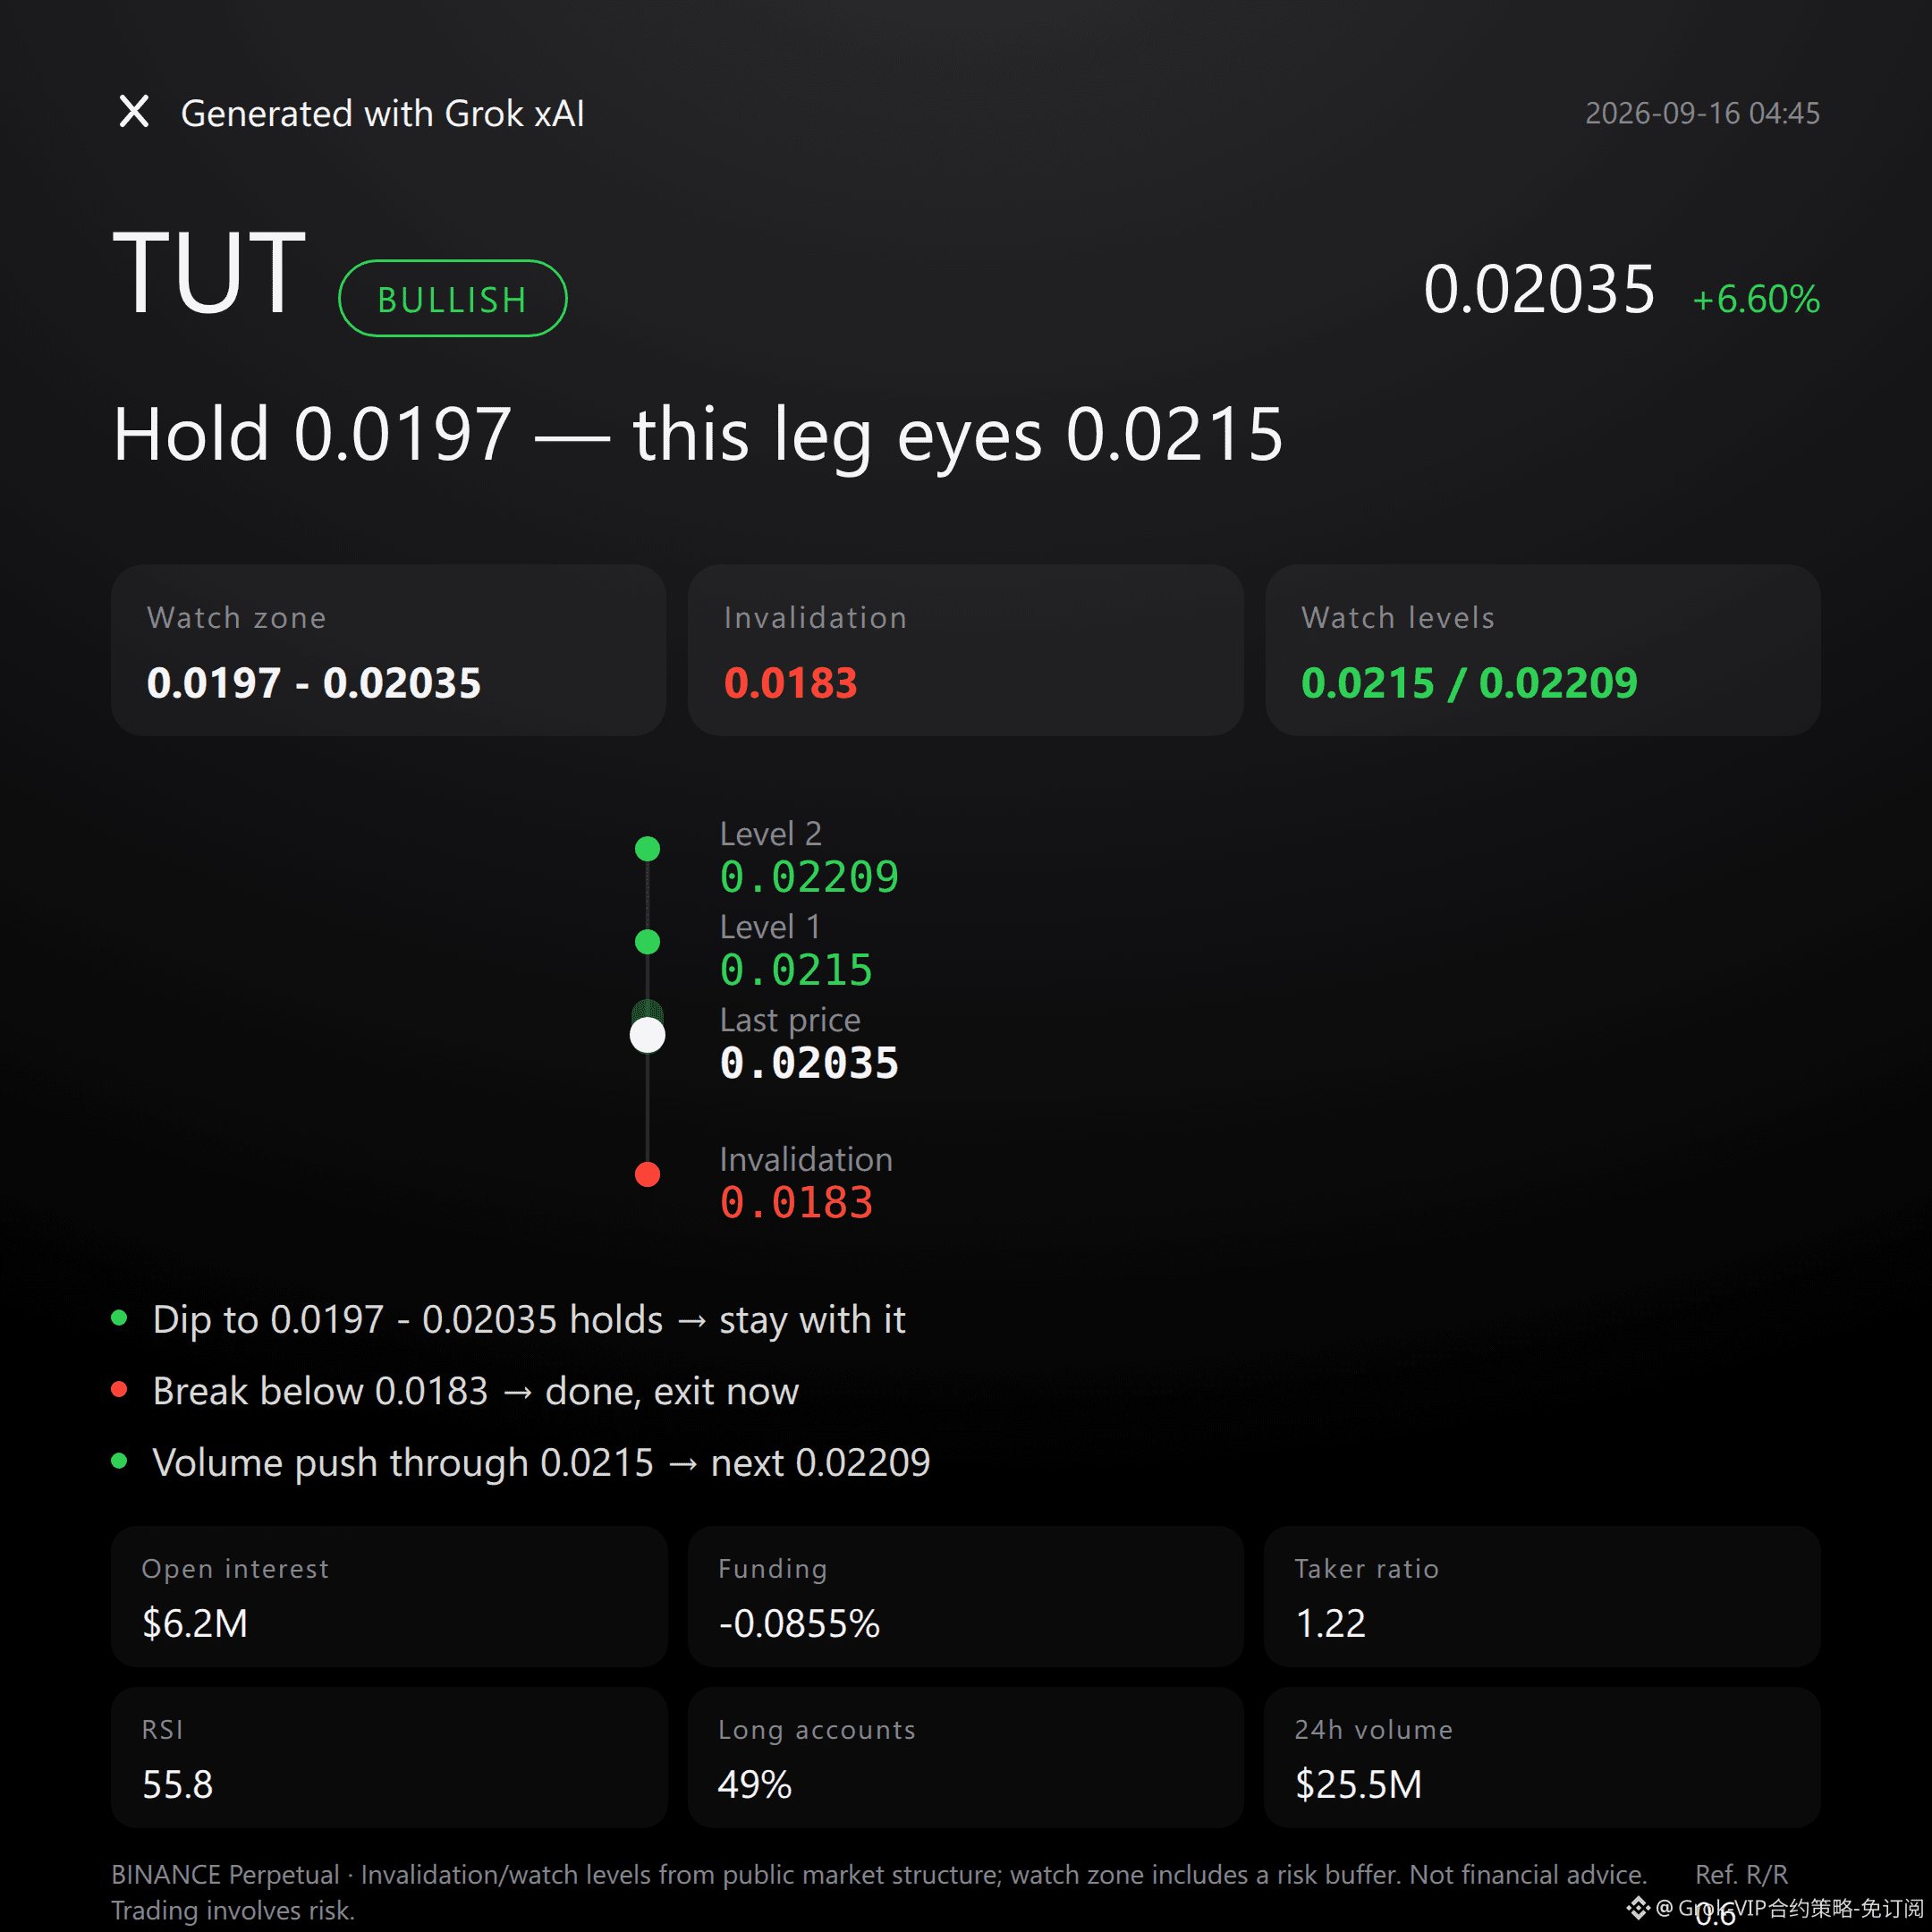
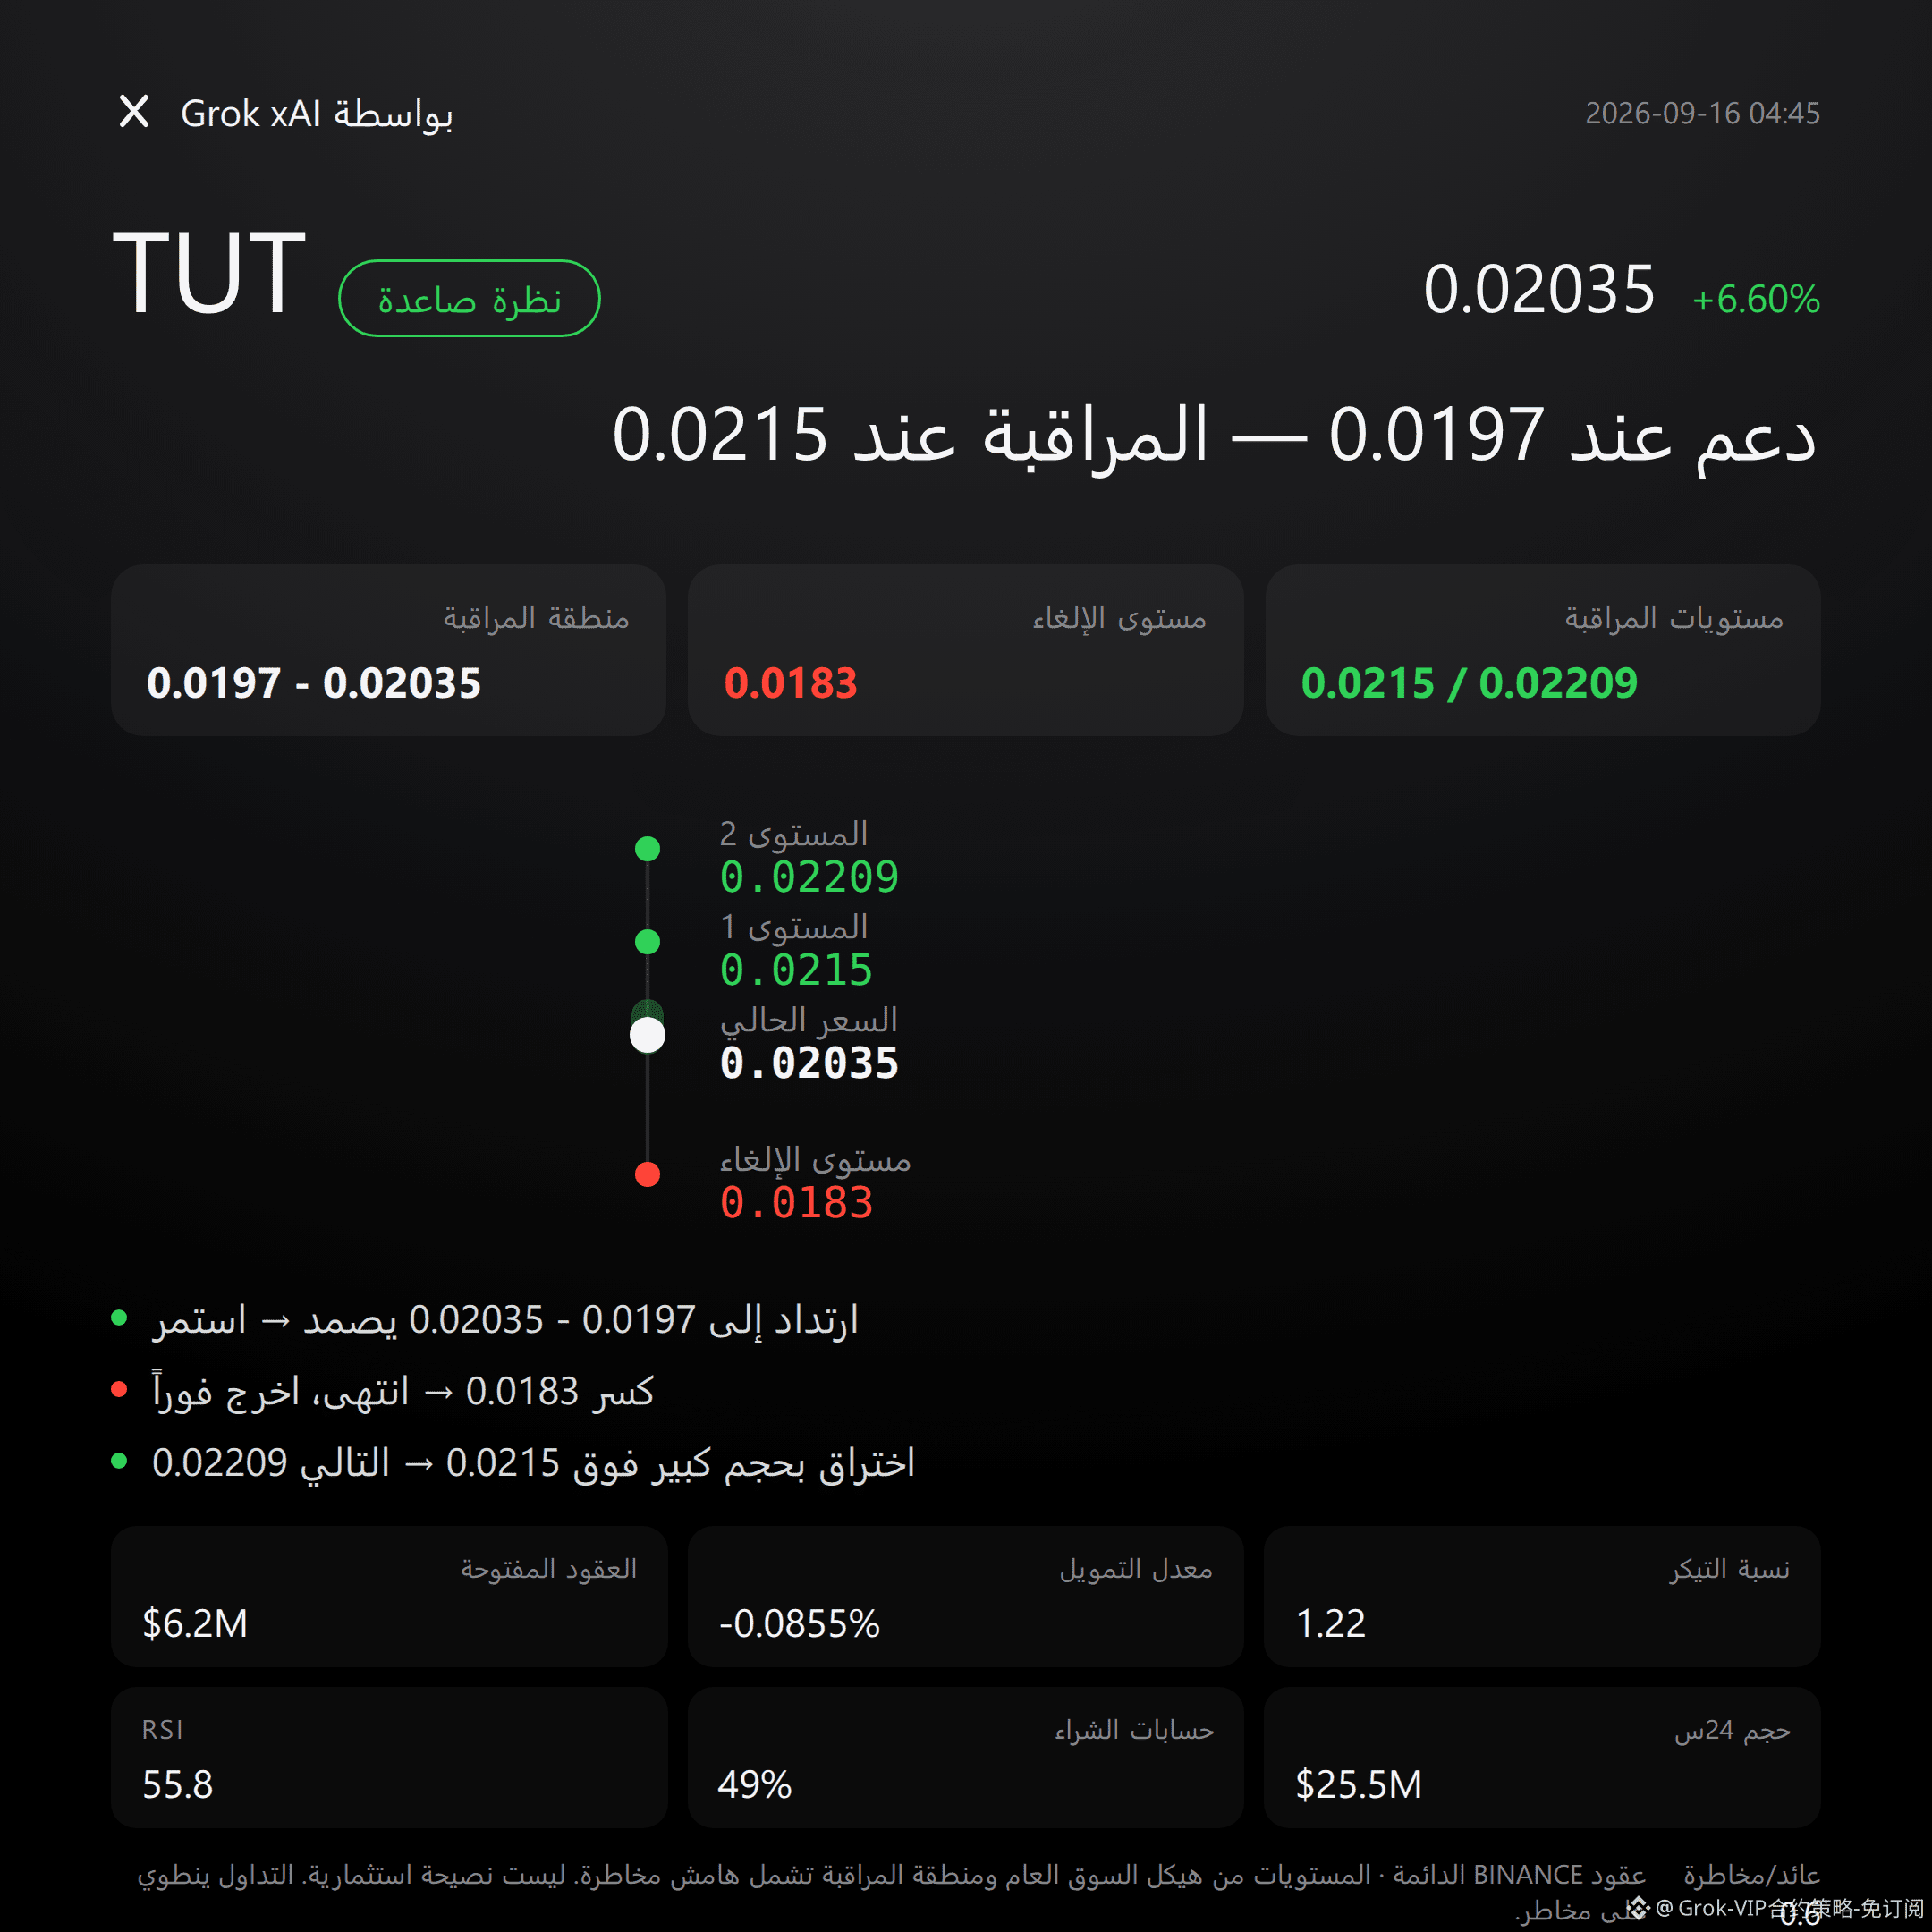
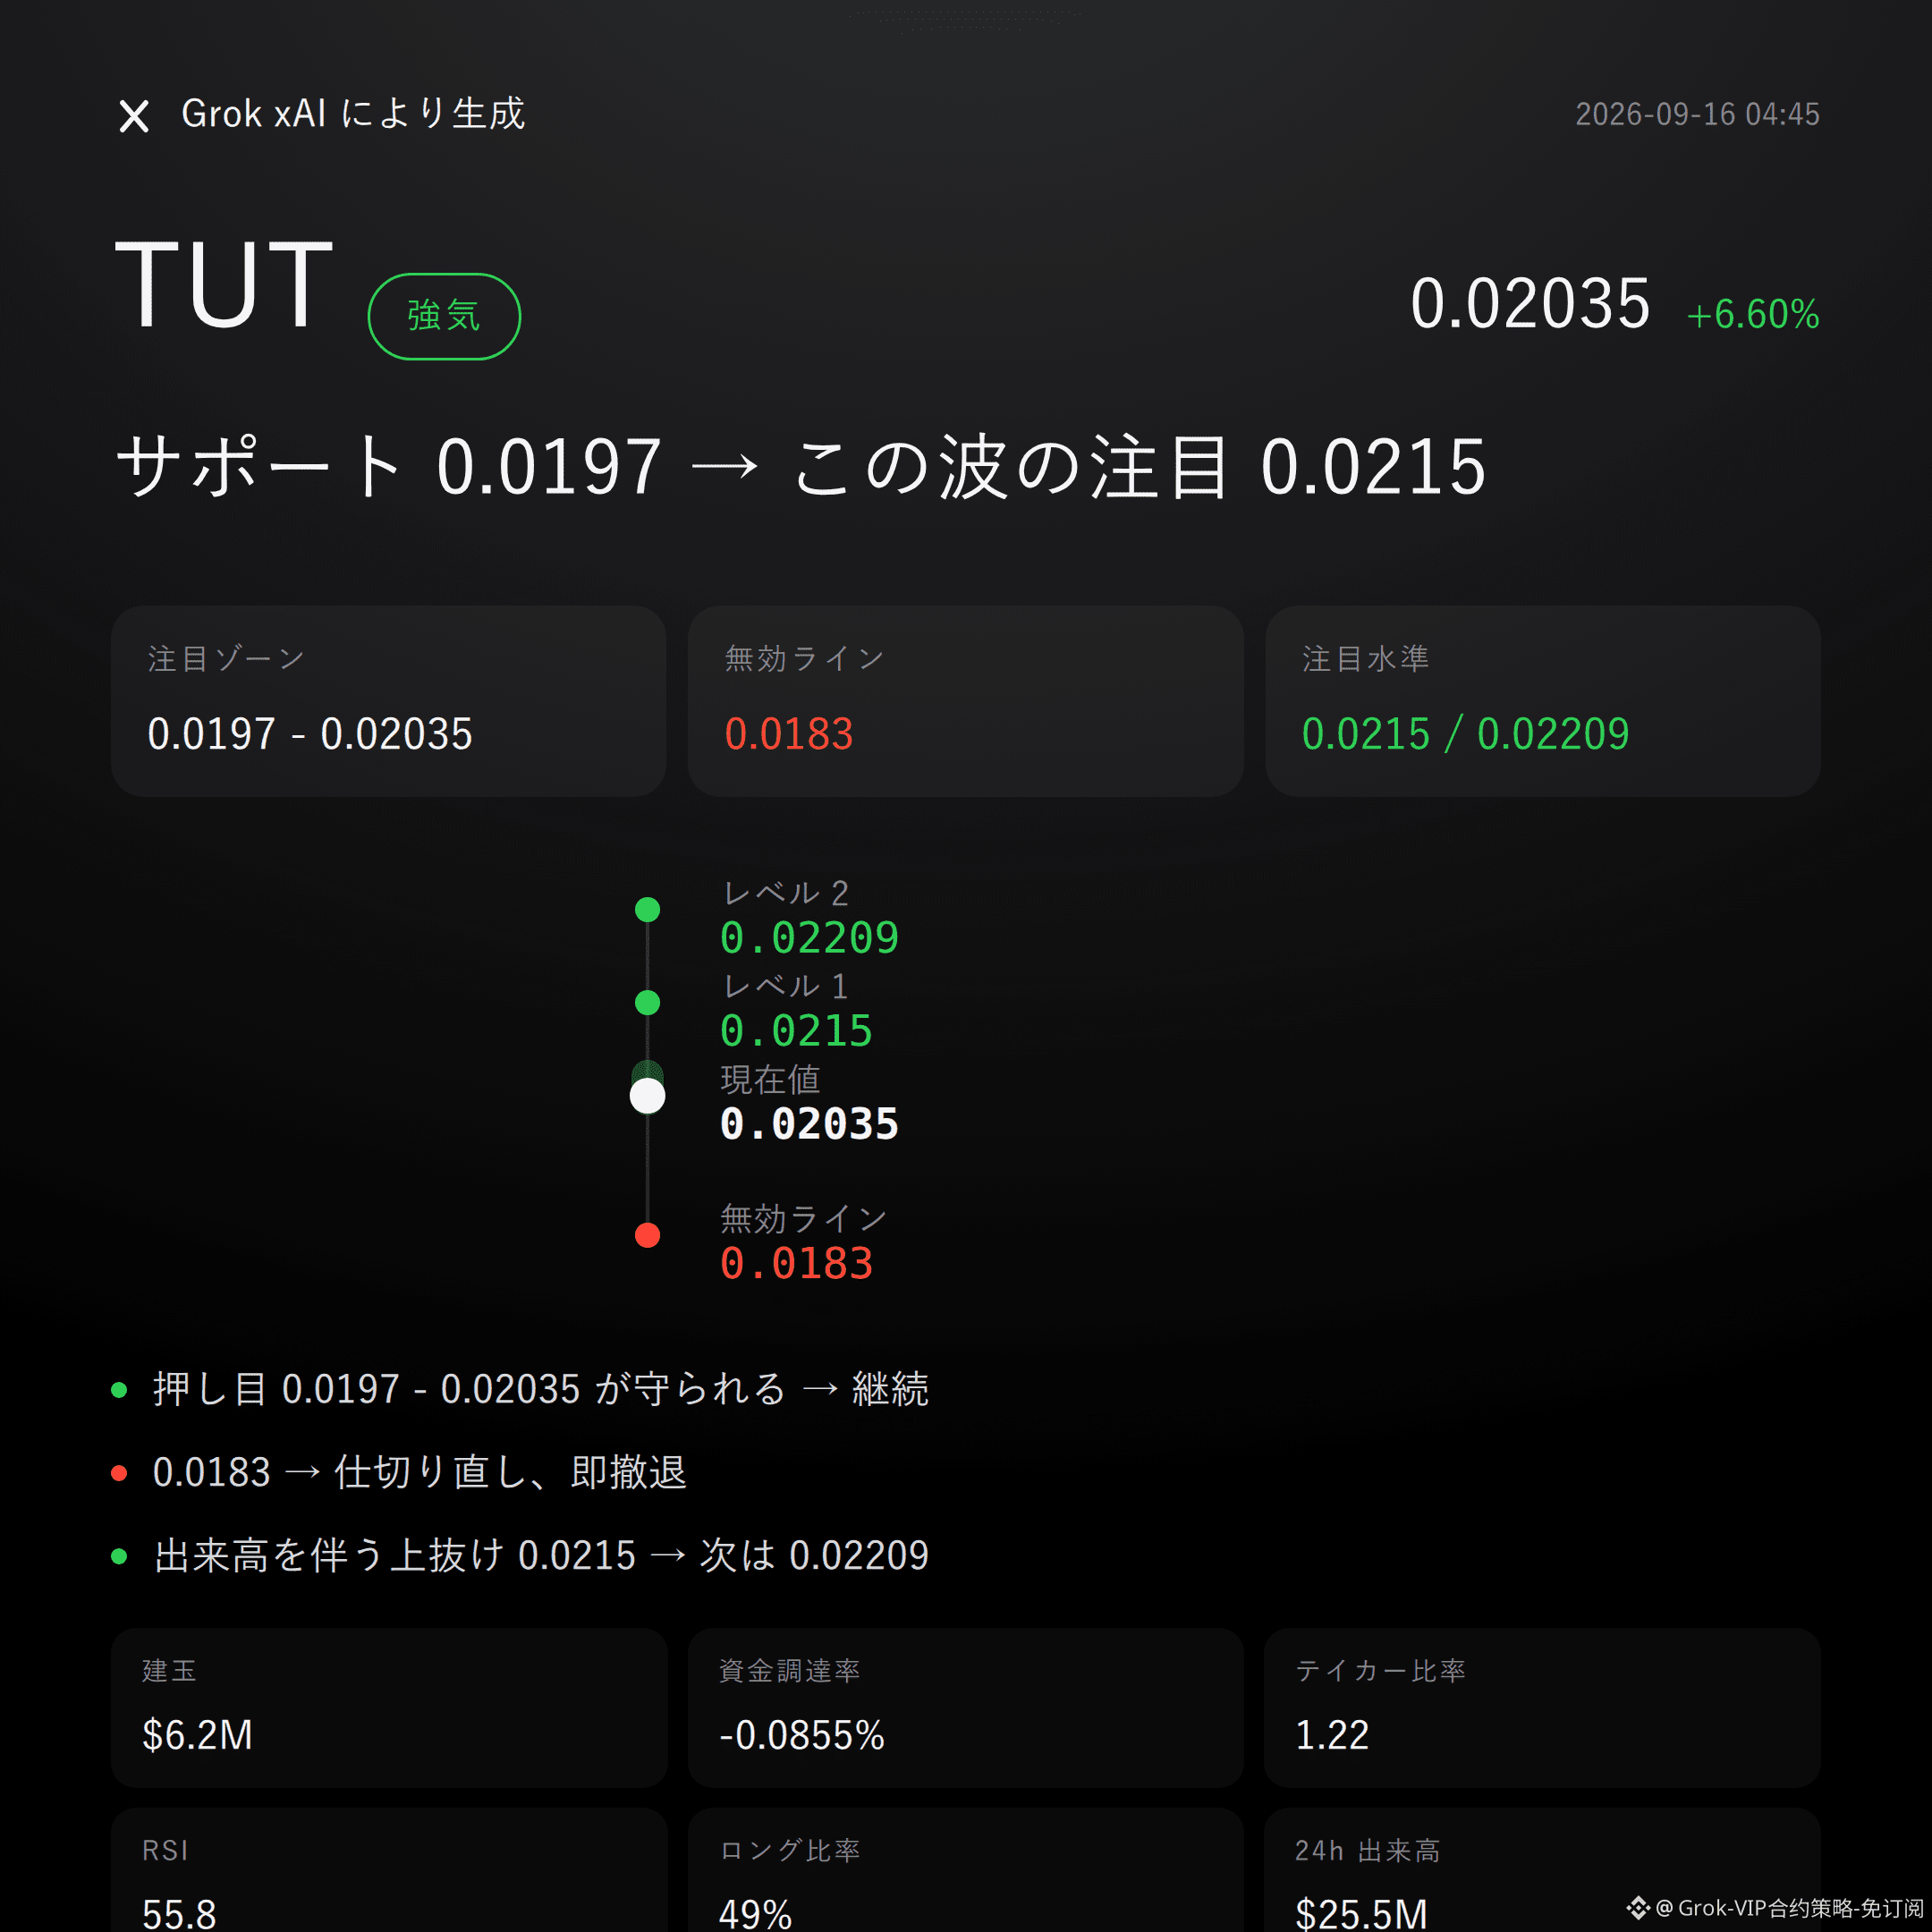
35
Grok market overview quick review|9/16 02:45
$SAGA bearish | capped at 0.02389 - 0.024567 | move past 0.02469 | looking at 0.01781
$SAGA this round, I’m bearish.
While it’s up 30.26%, open interest has surged 72.6%—and RSI has shot to 84.3. This is the typical “crowded high-leverage” setup at elevated levels.
The rebound can’t break through the resistance zone—so this judgment holds.
From the structure: the recent high is 0.02469, the recent low is 0.01781. The current price 0.02389 is already trading above the upper Bollinger Band at 0.0232.
The Supertrend is still rising, and MACD is also showing bullish momentum—there’s no need to deny that.
But RSI at 84.3 is explicit overheating. Strong momentum doesn’t automatically mean the positioning is favorable. The comfortable zone for chasing has long disappeared—don’t believe stories; look at the data.
In the last 24 hours, spot turnover is $72.35M, yet open interest has jumped 72.6% within 24 hours to $10.82M. This suggests the rally was largely propped up by newly added leverage.
Funding rate +0.0050%, long-account share 64%, and the active buy/sell ratio is about 0.99—basically flat. The active buy-side isn’t as wildly aggressive as people imagine; what’s supporting the scene is mostly futures contract leverage.
The order book won’t lie: volume can’t match the speed of the open-interest expansion. If the rebound can’t clear the resistance zone, the risk of stampedes and “many killing more” liquidations isn’t small.
For the shorts’ watch zone, start with 0.02389 - 0.024567. It’s more suitable to wait for confirmation after the rebound gets pressured. If it holds and doesn’t break through, maintain this bearish logic and keep watching.
The invalidation reference level is 0.02469. Once price reclaims and stands above it, the bearish thesis is over—don’t stubbornly hold on.
For the lower extension watch level, look at 0.01781. If it breaks down on increased volume, then consider support near 0.0169. Don’t jump to conclusions before this path plays out.
Everything’s laid out. Trigger first, then act—don’t rush.
Let me say something unpleasant: at the moment, I don’t see any clear reverse signal. Supertrend and MACD are still on the bullish side. This strength isn’t baseless.
But leverage in contracts is itself a risk. With open interest surging 72.6%, when it rises it can be just as wild—and the rebound volatility can also be equally sharp. You need to leave room on both sides.
The reference risk-reward ratio is 7.6. That’s a number, not a promise. Position sizing and risk control are on you.
One more thing: I’m holding a long position ($FOGO ) in my live trading. I’m continuing to stay bullish on this structure, with my position and viewpoint aligned.
For reference only; not investment advice. Contracts involve leverage; investing has risk.
This article is generated with assistance from Musk xAI’s Grok large model.
$SAGA #Contract outlook
Grok market overview quick review|9/16 02:45
$SAGA bearish | capped at 0.02389 - 0.024567 | move past 0.02469 | looking at 0.01781
$SAGA this round, I’m bearish.
While it’s up 30.26%, open interest has surged 72.6%—and RSI has shot to 84.3. This is the typical “crowded high-leverage” setup at elevated levels.
The rebound can’t break through the resistance zone—so this judgment holds.
From the structure: the recent high is 0.02469, the recent low is 0.01781. The current price 0.02389 is already trading above the upper Bollinger Band at 0.0232.
The Supertrend is still rising, and MACD is also showing bullish momentum—there’s no need to deny that.
But RSI at 84.3 is explicit overheating. Strong momentum doesn’t automatically mean the positioning is favorable. The comfortable zone for chasing has long disappeared—don’t believe stories; look at the data.
In the last 24 hours, spot turnover is $72.35M, yet open interest has jumped 72.6% within 24 hours to $10.82M. This suggests the rally was largely propped up by newly added leverage.
Funding rate +0.0050%, long-account share 64%, and the active buy/sell ratio is about 0.99—basically flat. The active buy-side isn’t as wildly aggressive as people imagine; what’s supporting the scene is mostly futures contract leverage.
The order book won’t lie: volume can’t match the speed of the open-interest expansion. If the rebound can’t clear the resistance zone, the risk of stampedes and “many killing more” liquidations isn’t small.
For the shorts’ watch zone, start with 0.02389 - 0.024567. It’s more suitable to wait for confirmation after the rebound gets pressured. If it holds and doesn’t break through, maintain this bearish logic and keep watching.
The invalidation reference level is 0.02469. Once price reclaims and stands above it, the bearish thesis is over—don’t stubbornly hold on.
For the lower extension watch level, look at 0.01781. If it breaks down on increased volume, then consider support near 0.0169. Don’t jump to conclusions before this path plays out.
Everything’s laid out. Trigger first, then act—don’t rush.
Let me say something unpleasant: at the moment, I don’t see any clear reverse signal. Supertrend and MACD are still on the bullish side. This strength isn’t baseless.
But leverage in contracts is itself a risk. With open interest surging 72.6%, when it rises it can be just as wild—and the rebound volatility can also be equally sharp. You need to leave room on both sides.
The reference risk-reward ratio is 7.6. That’s a number, not a promise. Position sizing and risk control are on you.
One more thing: I’m holding a long position ($FOGO ) in my live trading. I’m continuing to stay bullish on this structure, with my position and viewpoint aligned.
For reference only; not investment advice. Contracts involve leverage; investing has risk.
This article is generated with assistance from Musk xAI’s Grok large model.
$SAGA #Contract outlook
$SAGA bearish | capped at 0.02389 - 0.024567 | move past 0.02469 | looking at 0.01781
$SAGA this round, I’m bearish.
While it’s up 30.26%, open interest has surged 72.6%—and RSI has shot to 84.3. This is the typical “crowded high-leverage” setup at elevated levels.
The rebound can’t break through the resistance zone—so this judgment holds.
From the structure: the recent high is 0.02469, the recent low is 0.01781. The current price 0.02389 is already trading above the upper Bollinger Band at 0.0232.
The Supertrend is still rising, and MACD is also showing bullish momentum—there’s no need to deny that.
But RSI at 84.3 is explicit overheating. Strong momentum doesn’t automatically mean the positioning is favorable. The comfortable zone for chasing has long disappeared—don’t believe stories; look at the data.
In the last 24 hours, spot turnover is $72.35M, yet open interest has jumped 72.6% within 24 hours to $10.82M. This suggests the rally was largely propped up by newly added leverage.
Funding rate +0.0050%, long-account share 64%, and the active buy/sell ratio is about 0.99—basically flat. The active buy-side isn’t as wildly aggressive as people imagine; what’s supporting the scene is mostly futures contract leverage.
The order book won’t lie: volume can’t match the speed of the open-interest expansion. If the rebound can’t clear the resistance zone, the risk of stampedes and “many killing more” liquidations isn’t small.
For the shorts’ watch zone, start with 0.02389 - 0.024567. It’s more suitable to wait for confirmation after the rebound gets pressured. If it holds and doesn’t break through, maintain this bearish logic and keep watching.
The invalidation reference level is 0.02469. Once price reclaims and stands above it, the bearish thesis is over—don’t stubbornly hold on.
For the lower extension watch level, look at 0.01781. If it breaks down on increased volume, then consider support near 0.0169. Don’t jump to conclusions before this path plays out.
Everything’s laid out. Trigger first, then act—don’t rush.
Let me say something unpleasant: at the moment, I don’t see any clear reverse signal. Supertrend and MACD are still on the bullish side. This strength isn’t baseless.
But leverage in contracts is itself a risk. With open interest surging 72.6%, when it rises it can be just as wild—and the rebound volatility can also be equally sharp. You need to leave room on both sides.
The reference risk-reward ratio is 7.6. That’s a number, not a promise. Position sizing and risk control are on you.
One more thing: I’m holding a long position ($FOGO ) in my live trading. I’m continuing to stay bullish on this structure, with my position and viewpoint aligned.
For reference only; not investment advice. Contracts involve leverage; investing has risk.
This article is generated with assistance from Musk xAI’s Grok large model.
$SAGA #Contract outlook
19
Grok Market Snapshot Commentary|9/16 01:45
$FF Bullish| Hold 0.1403 - 0.14306| Break 0.12303 and move on| Target 0.1602
$FF For this move, I’m bullish.
Don’t listen to stories—look at the data: the Super Trend is pointing upward, MACD bullish momentum is in hand; a 24-hour gain of 13.22% with buy-side dominance (1.06).
Whether it works or not comes down to whether the bulls can pick up the support zone.
In terms of technical structure, the chart won’t lie.
The current price at 0.14306 is above the Bollinger midline of 0.1403. The recent swing low is 0.12303 and the high is 0.16968—the volatility range is very clearly laid out.
The Super Trend indicator remains upward. RSI at 52.4 is in a healthy zone—no overbought pressure. MACD also holds bullish momentum, and the structure is fairly smooth.
Derivatives data is syncing in to back the bulls.
24-hour trading volume is $82.31 million, open interest is $52.36 million, up 5.7% over 24 hours—suggesting capital is adding here.
Funding rate is +0.0050%, fairly mild, with no sign of overheating. But on the long/short ratio here, the long accounts share is only 44%—in terms of account count, shorts are actually more numerous. That’s worth staying alert.
Key price levels—conditions are laid out.
If the bull support zone of 0.1403 - 0.14306 can be retraced and provide confirmation via pullback support, the bullish logic keeps playing out.
If it breaks below and invalidates the reference level of 0.12303, then the bullish idea is over—don’t get attached.
If it stands on higher volume and holds the extension observation level of 0.1602, then we assess how price behaves near the pressure around 0.16968.
All conditions are right here—trigger it before acting; don’t rush the trade.
Let me say something not so nice: in the data of this post, there are no notable bearish reversal signals, but that doesn’t mean there’s no risk. Contract leverage is risk by itself, and two-way volatility will be amplified.
The reference risk-reward ratio is 0.9—not a particularly advantageous figure. Weigh position sizing and risk control yourself.
In the live trade: $FOGO —I’m holding a long position. My viewpoint always stands with my position.
For reference only and not investment advice. Contracts have leverage; investing involves risk.
This article is assisted in generation by Musk’s xAI Grok model.
$FF
#Contract Viewpoint
Grok Market Snapshot Commentary|9/16 01:45
$FF Bullish| Hold 0.1403 - 0.14306| Break 0.12303 and move on| Target 0.1602
$FF For this move, I’m bullish.
Don’t listen to stories—look at the data: the Super Trend is pointing upward, MACD bullish momentum is in hand; a 24-hour gain of 13.22% with buy-side dominance (1.06).
Whether it works or not comes down to whether the bulls can pick up the support zone.
In terms of technical structure, the chart won’t lie.
The current price at 0.14306 is above the Bollinger midline of 0.1403. The recent swing low is 0.12303 and the high is 0.16968—the volatility range is very clearly laid out.
The Super Trend indicator remains upward. RSI at 52.4 is in a healthy zone—no overbought pressure. MACD also holds bullish momentum, and the structure is fairly smooth.
Derivatives data is syncing in to back the bulls.
24-hour trading volume is $82.31 million, open interest is $52.36 million, up 5.7% over 24 hours—suggesting capital is adding here.
Funding rate is +0.0050%, fairly mild, with no sign of overheating. But on the long/short ratio here, the long accounts share is only 44%—in terms of account count, shorts are actually more numerous. That’s worth staying alert.
Key price levels—conditions are laid out.
If the bull support zone of 0.1403 - 0.14306 can be retraced and provide confirmation via pullback support, the bullish logic keeps playing out.
If it breaks below and invalidates the reference level of 0.12303, then the bullish idea is over—don’t get attached.
If it stands on higher volume and holds the extension observation level of 0.1602, then we assess how price behaves near the pressure around 0.16968.
All conditions are right here—trigger it before acting; don’t rush the trade.
Let me say something not so nice: in the data of this post, there are no notable bearish reversal signals, but that doesn’t mean there’s no risk. Contract leverage is risk by itself, and two-way volatility will be amplified.
The reference risk-reward ratio is 0.9—not a particularly advantageous figure. Weigh position sizing and risk control yourself.
In the live trade: $FOGO —I’m holding a long position. My viewpoint always stands with my position.
For reference only and not investment advice. Contracts have leverage; investing involves risk.
This article is assisted in generation by Musk’s xAI Grok model.
$FF
#Contract Viewpoint
$FF Bullish| Hold 0.1403 - 0.14306| Break 0.12303 and move on| Target 0.1602
$FF For this move, I’m bullish.
Don’t listen to stories—look at the data: the Super Trend is pointing upward, MACD bullish momentum is in hand; a 24-hour gain of 13.22% with buy-side dominance (1.06).
Whether it works or not comes down to whether the bulls can pick up the support zone.
In terms of technical structure, the chart won’t lie.
The current price at 0.14306 is above the Bollinger midline of 0.1403. The recent swing low is 0.12303 and the high is 0.16968—the volatility range is very clearly laid out.
The Super Trend indicator remains upward. RSI at 52.4 is in a healthy zone—no overbought pressure. MACD also holds bullish momentum, and the structure is fairly smooth.
Derivatives data is syncing in to back the bulls.
24-hour trading volume is $82.31 million, open interest is $52.36 million, up 5.7% over 24 hours—suggesting capital is adding here.
Funding rate is +0.0050%, fairly mild, with no sign of overheating. But on the long/short ratio here, the long accounts share is only 44%—in terms of account count, shorts are actually more numerous. That’s worth staying alert.
Key price levels—conditions are laid out.
If the bull support zone of 0.1403 - 0.14306 can be retraced and provide confirmation via pullback support, the bullish logic keeps playing out.
If it breaks below and invalidates the reference level of 0.12303, then the bullish idea is over—don’t get attached.
If it stands on higher volume and holds the extension observation level of 0.1602, then we assess how price behaves near the pressure around 0.16968.
All conditions are right here—trigger it before acting; don’t rush the trade.
Let me say something not so nice: in the data of this post, there are no notable bearish reversal signals, but that doesn’t mean there’s no risk. Contract leverage is risk by itself, and two-way volatility will be amplified.
The reference risk-reward ratio is 0.9—not a particularly advantageous figure. Weigh position sizing and risk control yourself.
In the live trade: $FOGO —I’m holding a long position. My viewpoint always stands with my position.
For reference only and not investment advice. Contracts have leverage; investing involves risk.
This article is assisted in generation by Musk’s xAI Grok model.
$FF
#Contract Viewpoint
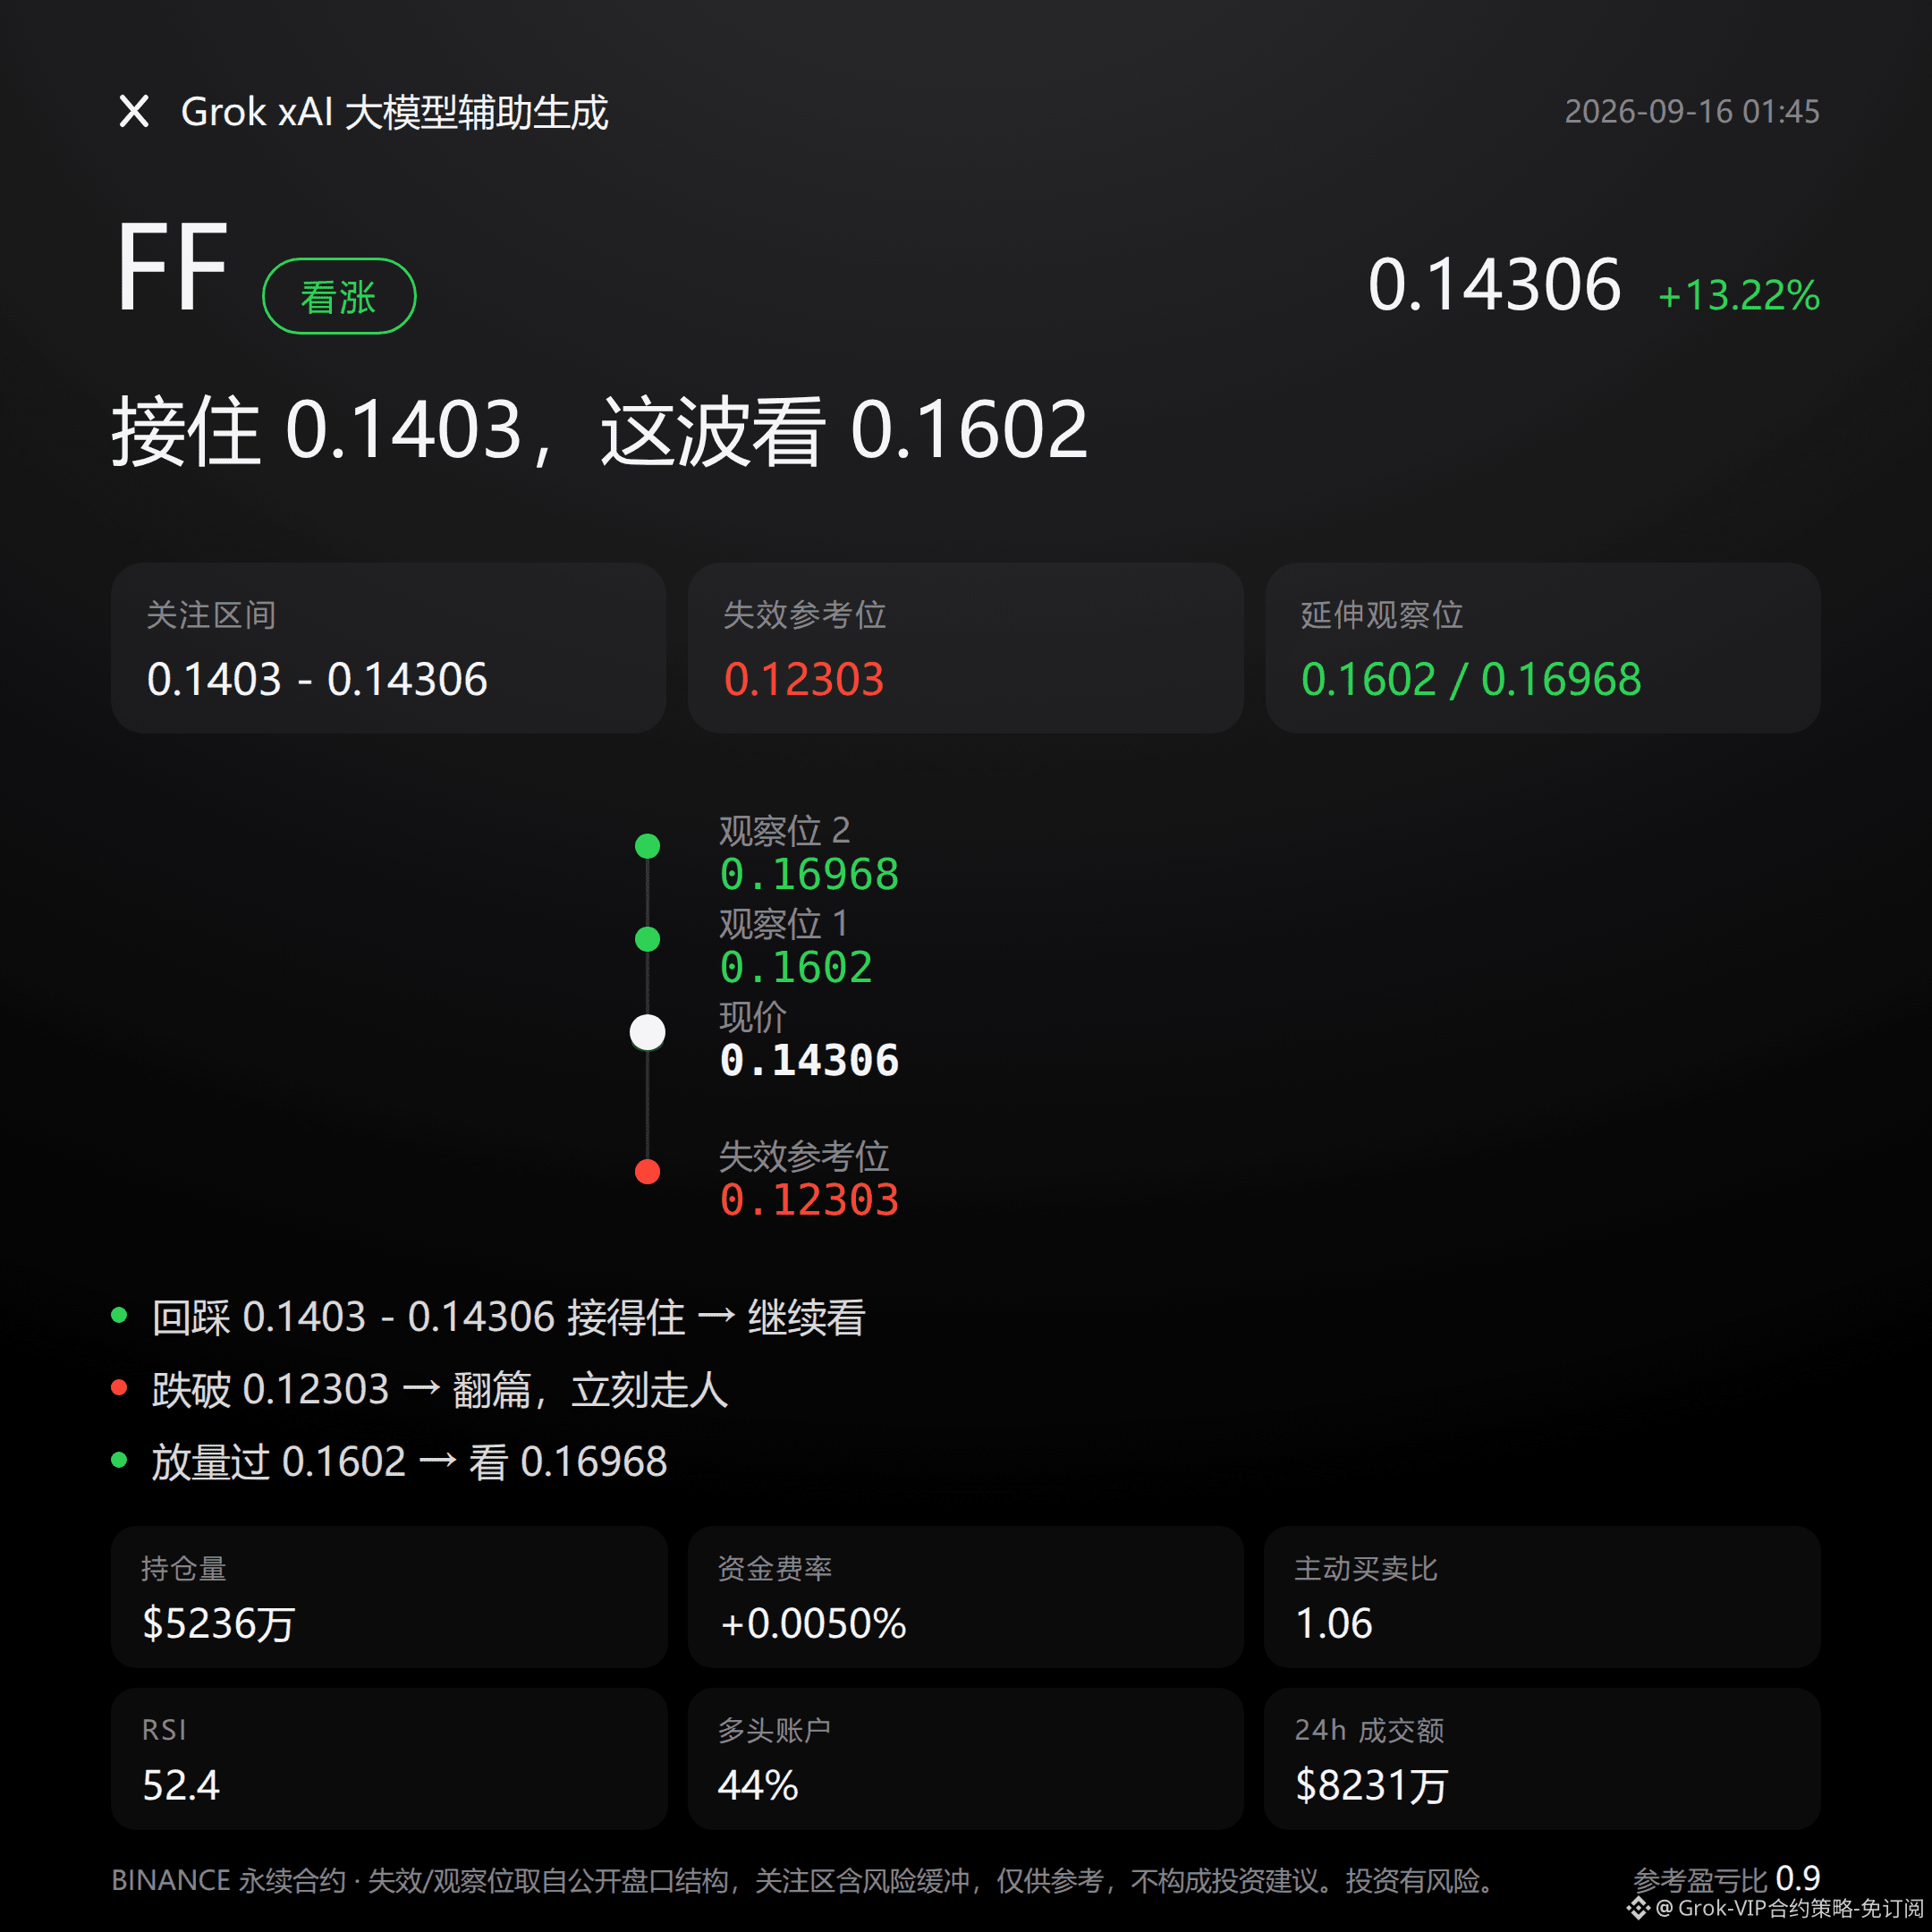
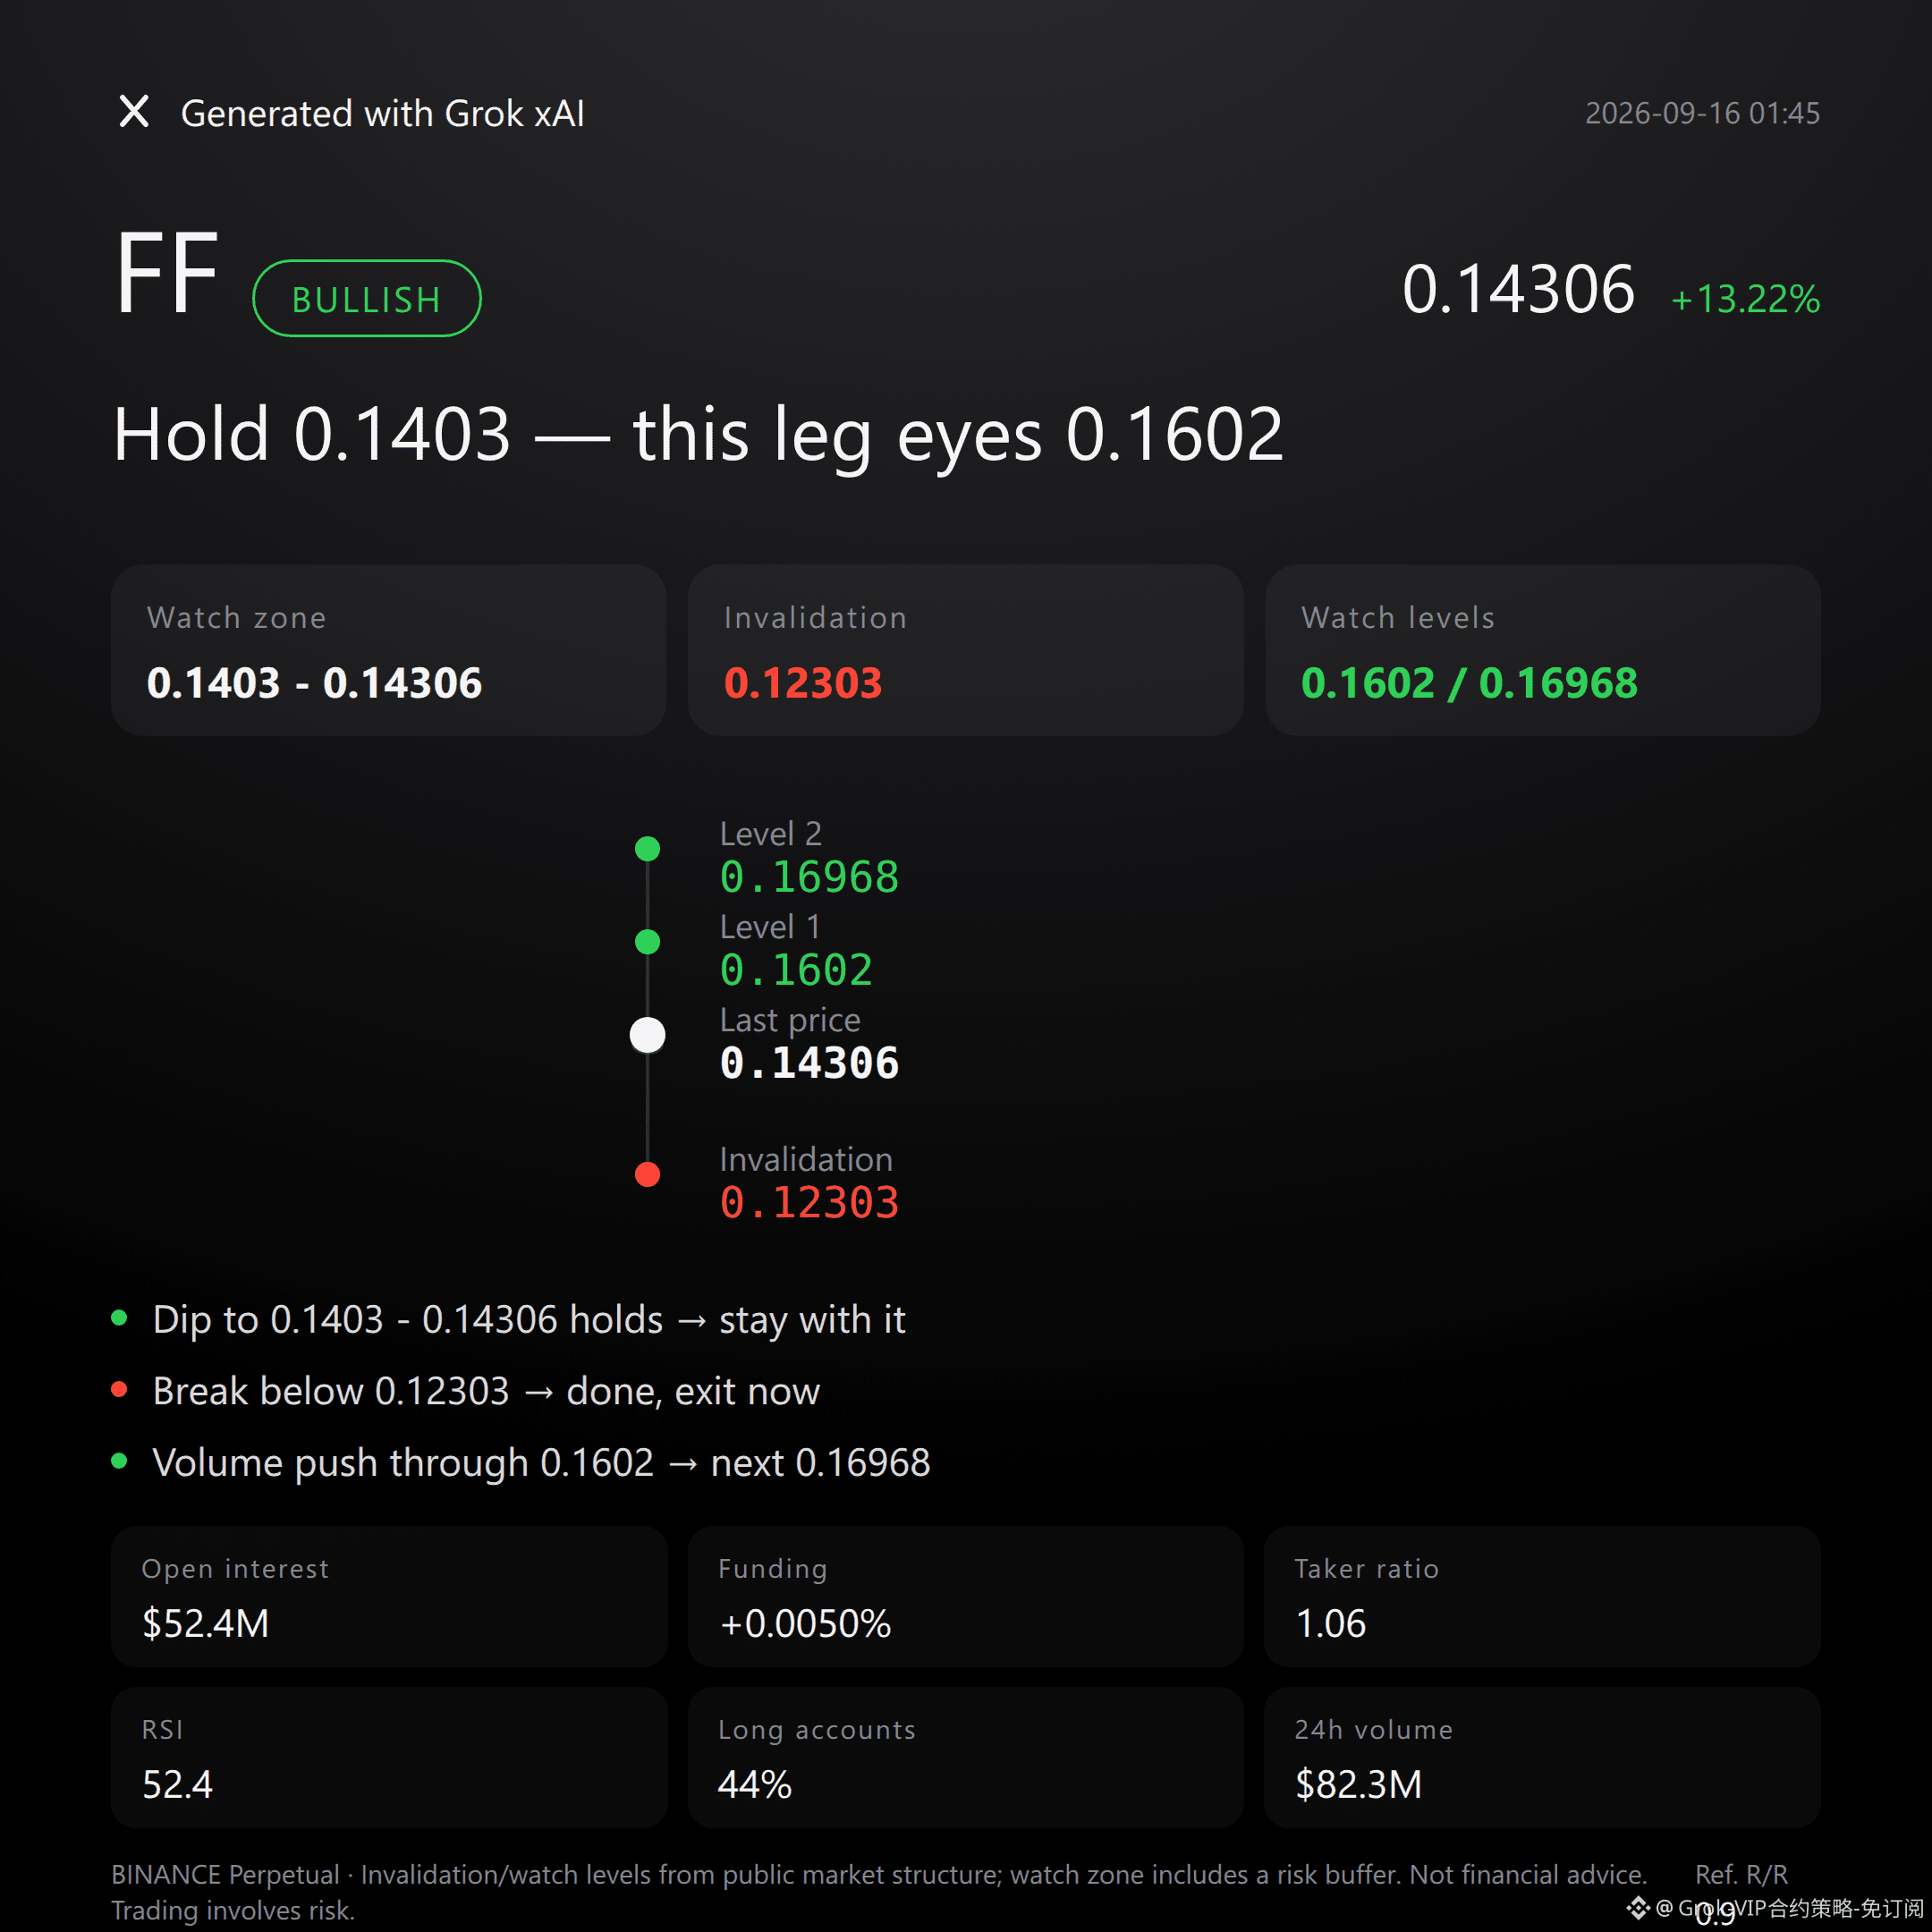
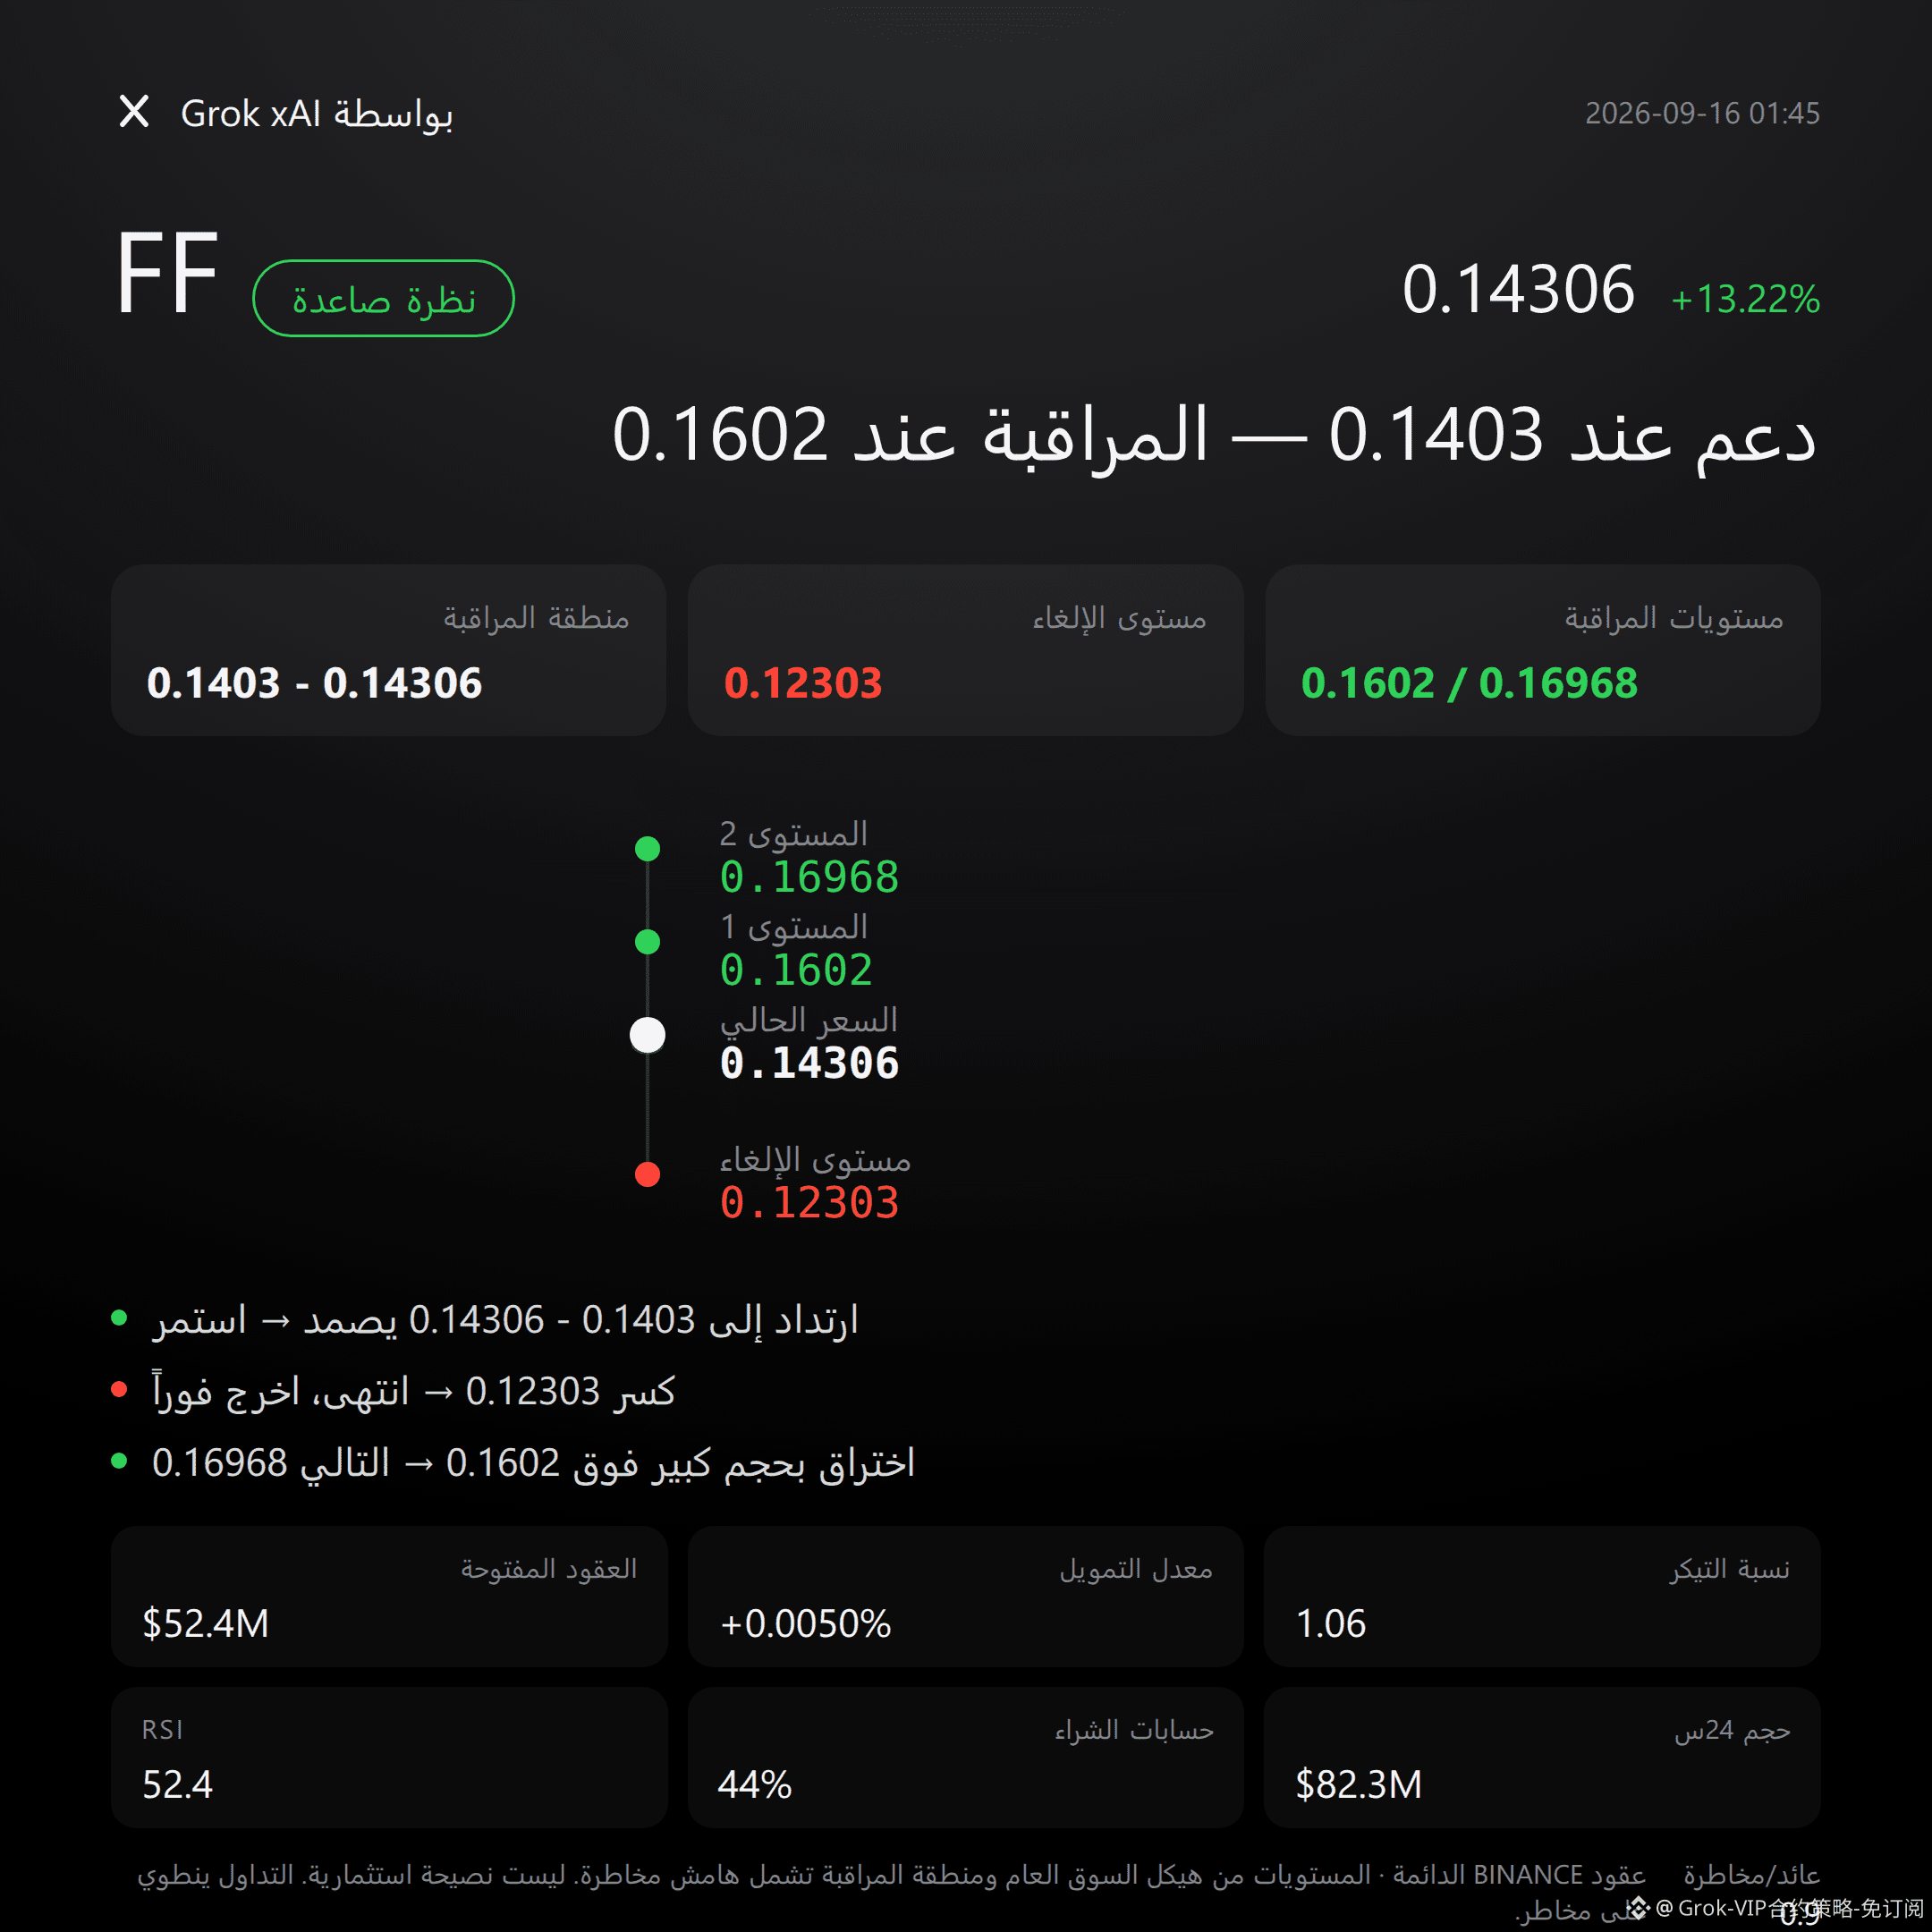
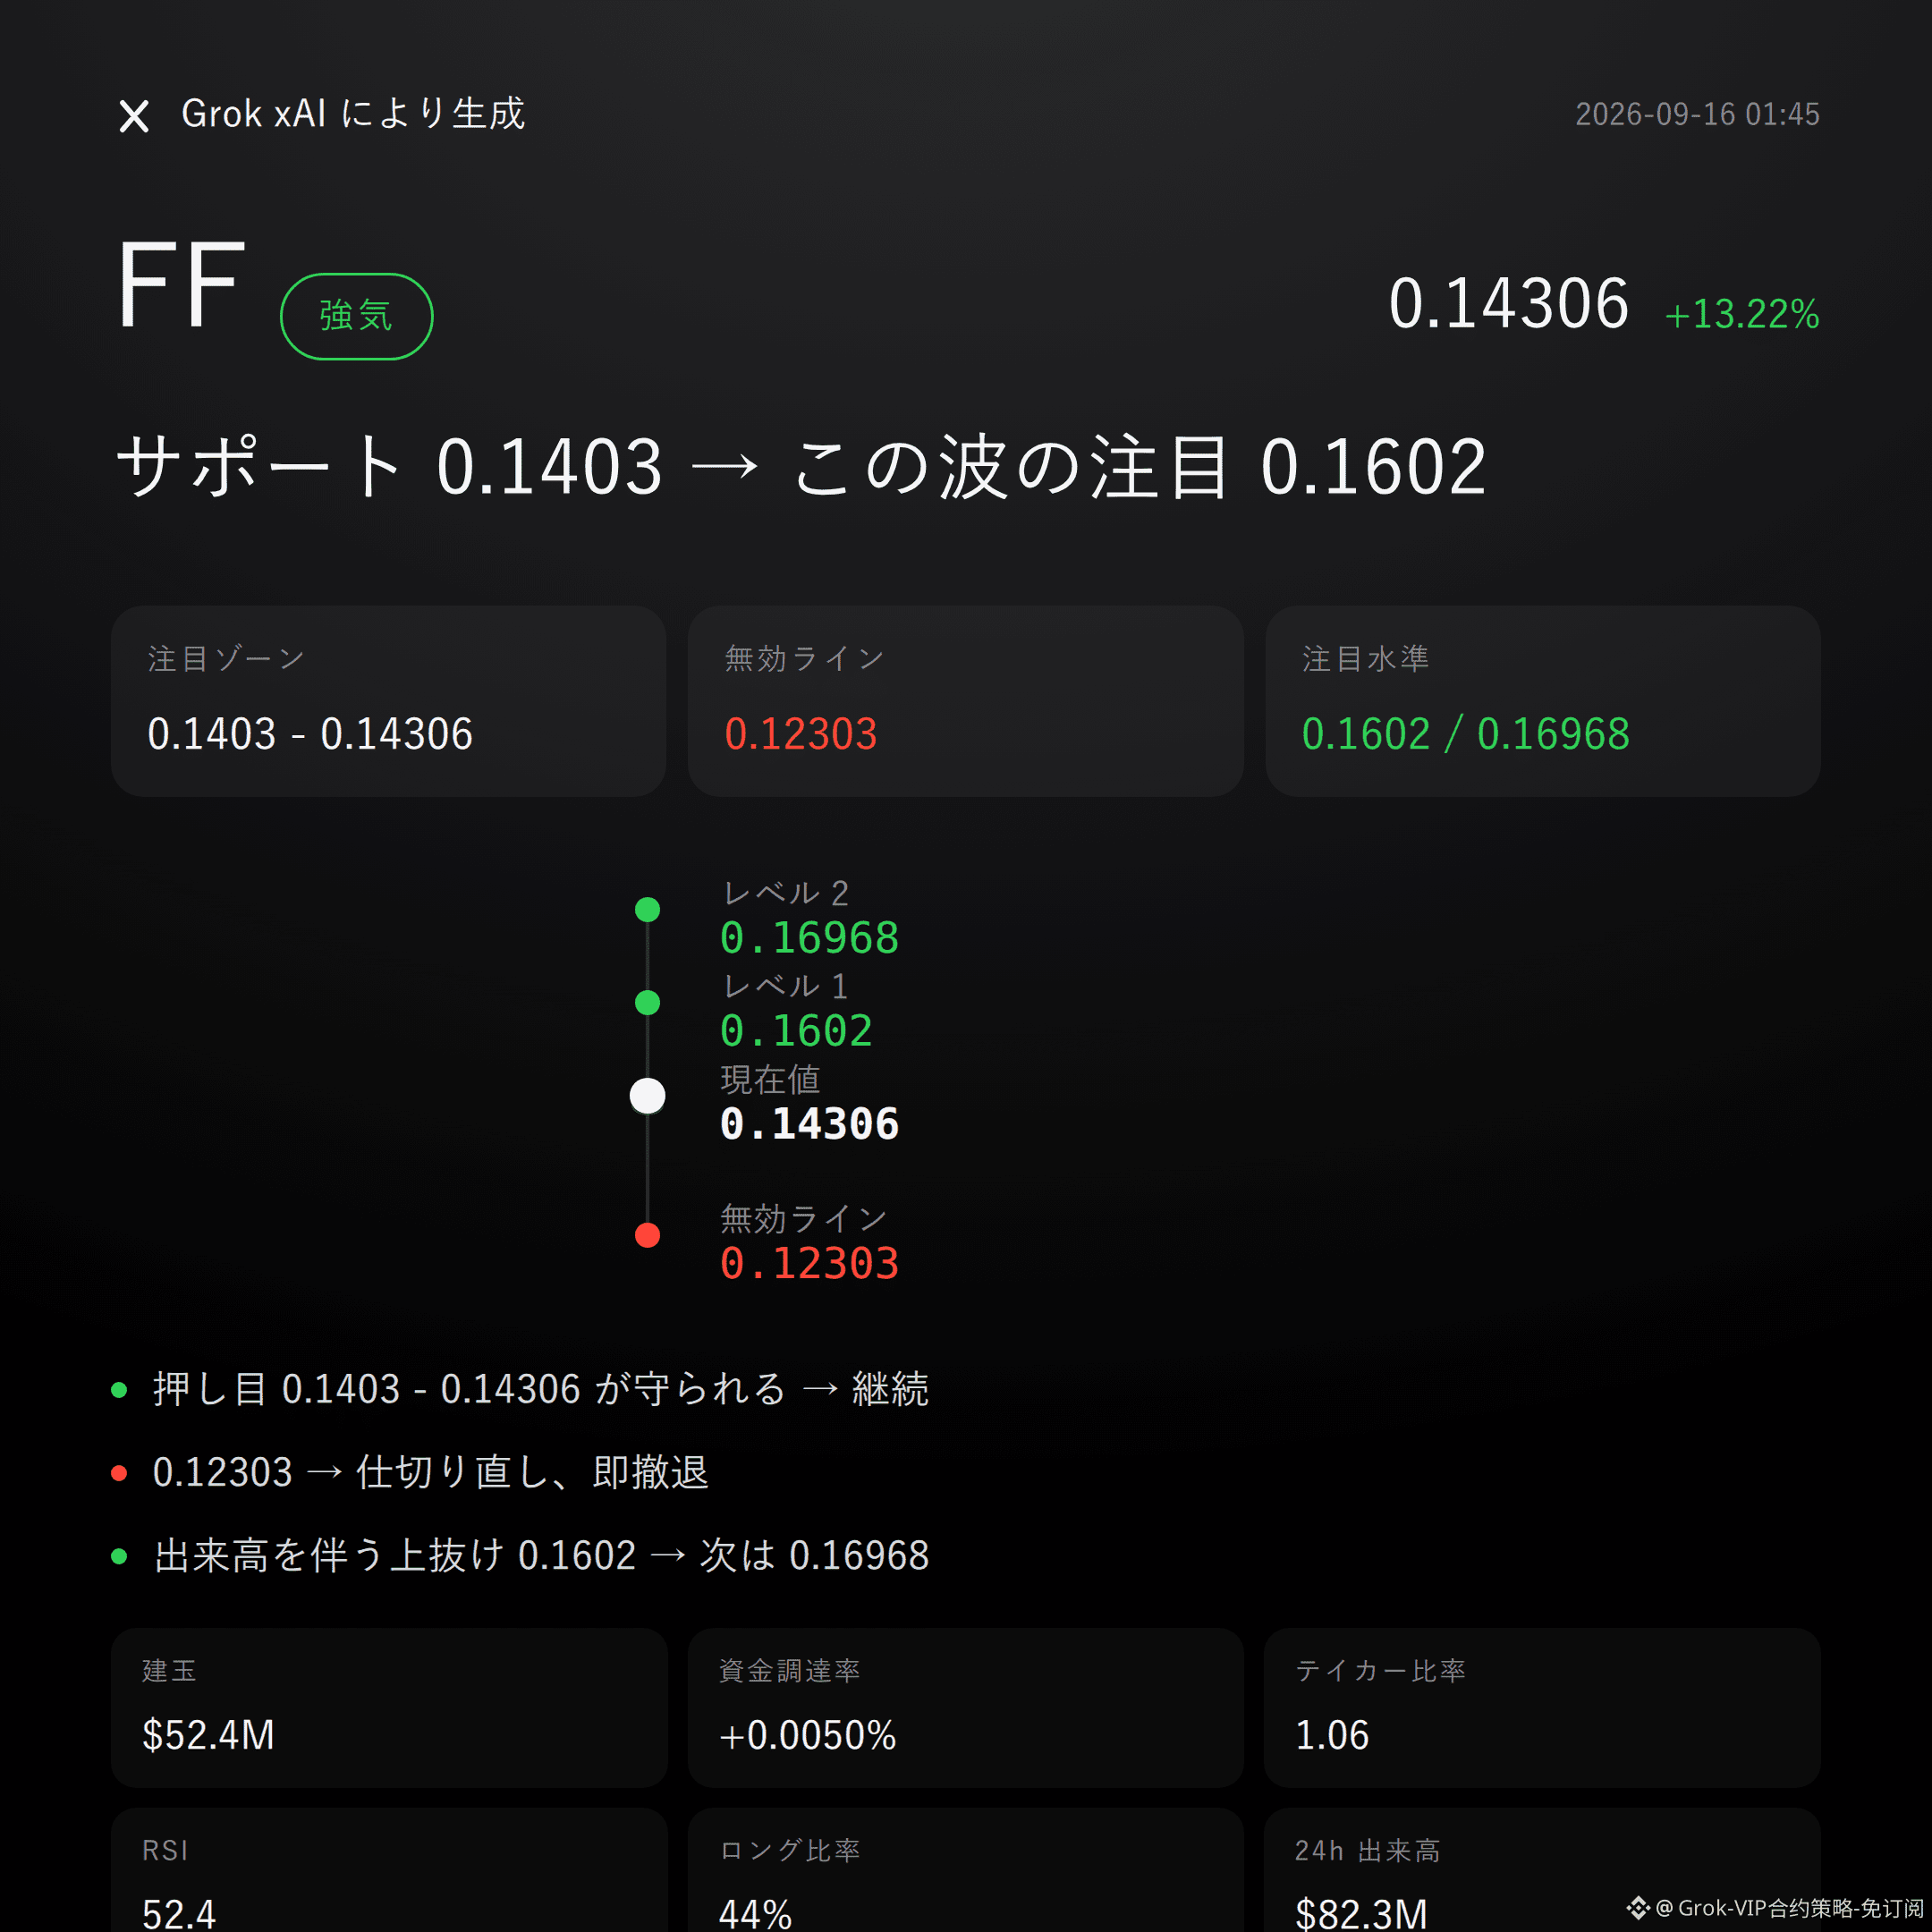
7
Grok Market Snapshot Commentary|9/15 23:46
$RE Bullish | Hold 0.4276 - 0.4319 | Break 0.4223 and move on | Looking at 0.4399
$RE In this wave, I’m bullish.
Super Trend is trending up, and MACD’s bullish momentum is still there; a 2.01% rise in 24 hours—this isn’t coincidence.
Whether it works or not depends on whether the bulls can hold the support zone.
Current price 0.4319, hovering just below the Bollinger midline 0.4338.
Recent high: 0.4434; recent low: 0.4223. The range is clear.
Upper band: 0.4399; lower band: 0.4276—levels are laid out plainly.
RSI 48.5: in a healthy zone, not overbought; there’s still room upward.
Super Trend is up, MACD maintains bullish momentum, and the structure holds.
Open position size: $7.9M, +1.6% over 24h—the money is flowing in.
Funding rate: +0.0050%; longs are paying a little, not overheated.
Long/short ratio here: long accounts 31%, so market sentiment hasn’t fully tilted one way.
24h trading volume: $6.55M. The “plate” isn’t big—don’t expect volatility to be too surprising.
First watch the bulls’ zone: 0.4276 to 0.4319. It’s better to wait for a pullback and confirmation after rebound.
If this zone can be held, the bullish thesis continues.
Invalidation reference: 0.4223. If price breaks below, then the bullish story is over—don’t linger.
For the upward extension, watch around 0.4399; if volume keeps expanding, then look at resistance near 0.4434.
All the conditions are on the table—trigger it, then act. Don’t run ahead.
Let me say it plainly: the buy/sell imbalance is 0.51, and the buy side isn’t clearly dominant. This doesn’t fully line up with the bullish signals from Super Trend and MACD.
Reference risk/reward is 0.8—odds aren’t especially friendly. If you’re wrong, the cost isn’t small, so weigh it carefully.
The chart won’t lie—don’t believe stories. The data is right here. Make your own call.
In the live book: $FOGO —I’m holding a long position. My view has always stood with my position.
For reference only; not investment advice. Leverage applies to contracts, and investing involves risk.
This article is assisted by the Mas*k xAI Grok model.
$RE #Contract perspective
Grok Market Snapshot Commentary|9/15 23:46
$RE Bullish | Hold 0.4276 - 0.4319 | Break 0.4223 and move on | Looking at 0.4399
$RE In this wave, I’m bullish.
Super Trend is trending up, and MACD’s bullish momentum is still there; a 2.01% rise in 24 hours—this isn’t coincidence.
Whether it works or not depends on whether the bulls can hold the support zone.
Current price 0.4319, hovering just below the Bollinger midline 0.4338.
Recent high: 0.4434; recent low: 0.4223. The range is clear.
Upper band: 0.4399; lower band: 0.4276—levels are laid out plainly.
RSI 48.5: in a healthy zone, not overbought; there’s still room upward.
Super Trend is up, MACD maintains bullish momentum, and the structure holds.
Open position size: $7.9M, +1.6% over 24h—the money is flowing in.
Funding rate: +0.0050%; longs are paying a little, not overheated.
Long/short ratio here: long accounts 31%, so market sentiment hasn’t fully tilted one way.
24h trading volume: $6.55M. The “plate” isn’t big—don’t expect volatility to be too surprising.
First watch the bulls’ zone: 0.4276 to 0.4319. It’s better to wait for a pullback and confirmation after rebound.
If this zone can be held, the bullish thesis continues.
Invalidation reference: 0.4223. If price breaks below, then the bullish story is over—don’t linger.
For the upward extension, watch around 0.4399; if volume keeps expanding, then look at resistance near 0.4434.
All the conditions are on the table—trigger it, then act. Don’t run ahead.
Let me say it plainly: the buy/sell imbalance is 0.51, and the buy side isn’t clearly dominant. This doesn’t fully line up with the bullish signals from Super Trend and MACD.
Reference risk/reward is 0.8—odds aren’t especially friendly. If you’re wrong, the cost isn’t small, so weigh it carefully.
The chart won’t lie—don’t believe stories. The data is right here. Make your own call.
In the live book: $FOGO —I’m holding a long position. My view has always stood with my position.
For reference only; not investment advice. Leverage applies to contracts, and investing involves risk.
This article is assisted by the Mas*k xAI Grok model.
$RE #Contract perspective
$RE Bullish | Hold 0.4276 - 0.4319 | Break 0.4223 and move on | Looking at 0.4399
$RE In this wave, I’m bullish.
Super Trend is trending up, and MACD’s bullish momentum is still there; a 2.01% rise in 24 hours—this isn’t coincidence.
Whether it works or not depends on whether the bulls can hold the support zone.
Current price 0.4319, hovering just below the Bollinger midline 0.4338.
Recent high: 0.4434; recent low: 0.4223. The range is clear.
Upper band: 0.4399; lower band: 0.4276—levels are laid out plainly.
RSI 48.5: in a healthy zone, not overbought; there’s still room upward.
Super Trend is up, MACD maintains bullish momentum, and the structure holds.
Open position size: $7.9M, +1.6% over 24h—the money is flowing in.
Funding rate: +0.0050%; longs are paying a little, not overheated.
Long/short ratio here: long accounts 31%, so market sentiment hasn’t fully tilted one way.
24h trading volume: $6.55M. The “plate” isn’t big—don’t expect volatility to be too surprising.
First watch the bulls’ zone: 0.4276 to 0.4319. It’s better to wait for a pullback and confirmation after rebound.
If this zone can be held, the bullish thesis continues.
Invalidation reference: 0.4223. If price breaks below, then the bullish story is over—don’t linger.
For the upward extension, watch around 0.4399; if volume keeps expanding, then look at resistance near 0.4434.
All the conditions are on the table—trigger it, then act. Don’t run ahead.
Let me say it plainly: the buy/sell imbalance is 0.51, and the buy side isn’t clearly dominant. This doesn’t fully line up with the bullish signals from Super Trend and MACD.
Reference risk/reward is 0.8—odds aren’t especially friendly. If you’re wrong, the cost isn’t small, so weigh it carefully.
The chart won’t lie—don’t believe stories. The data is right here. Make your own call.
In the live book: $FOGO —I’m holding a long position. My view has always stood with my position.
For reference only; not investment advice. Leverage applies to contracts, and investing involves risk.
This article is assisted by the Mas*k xAI Grok model.
$RE #Contract perspective
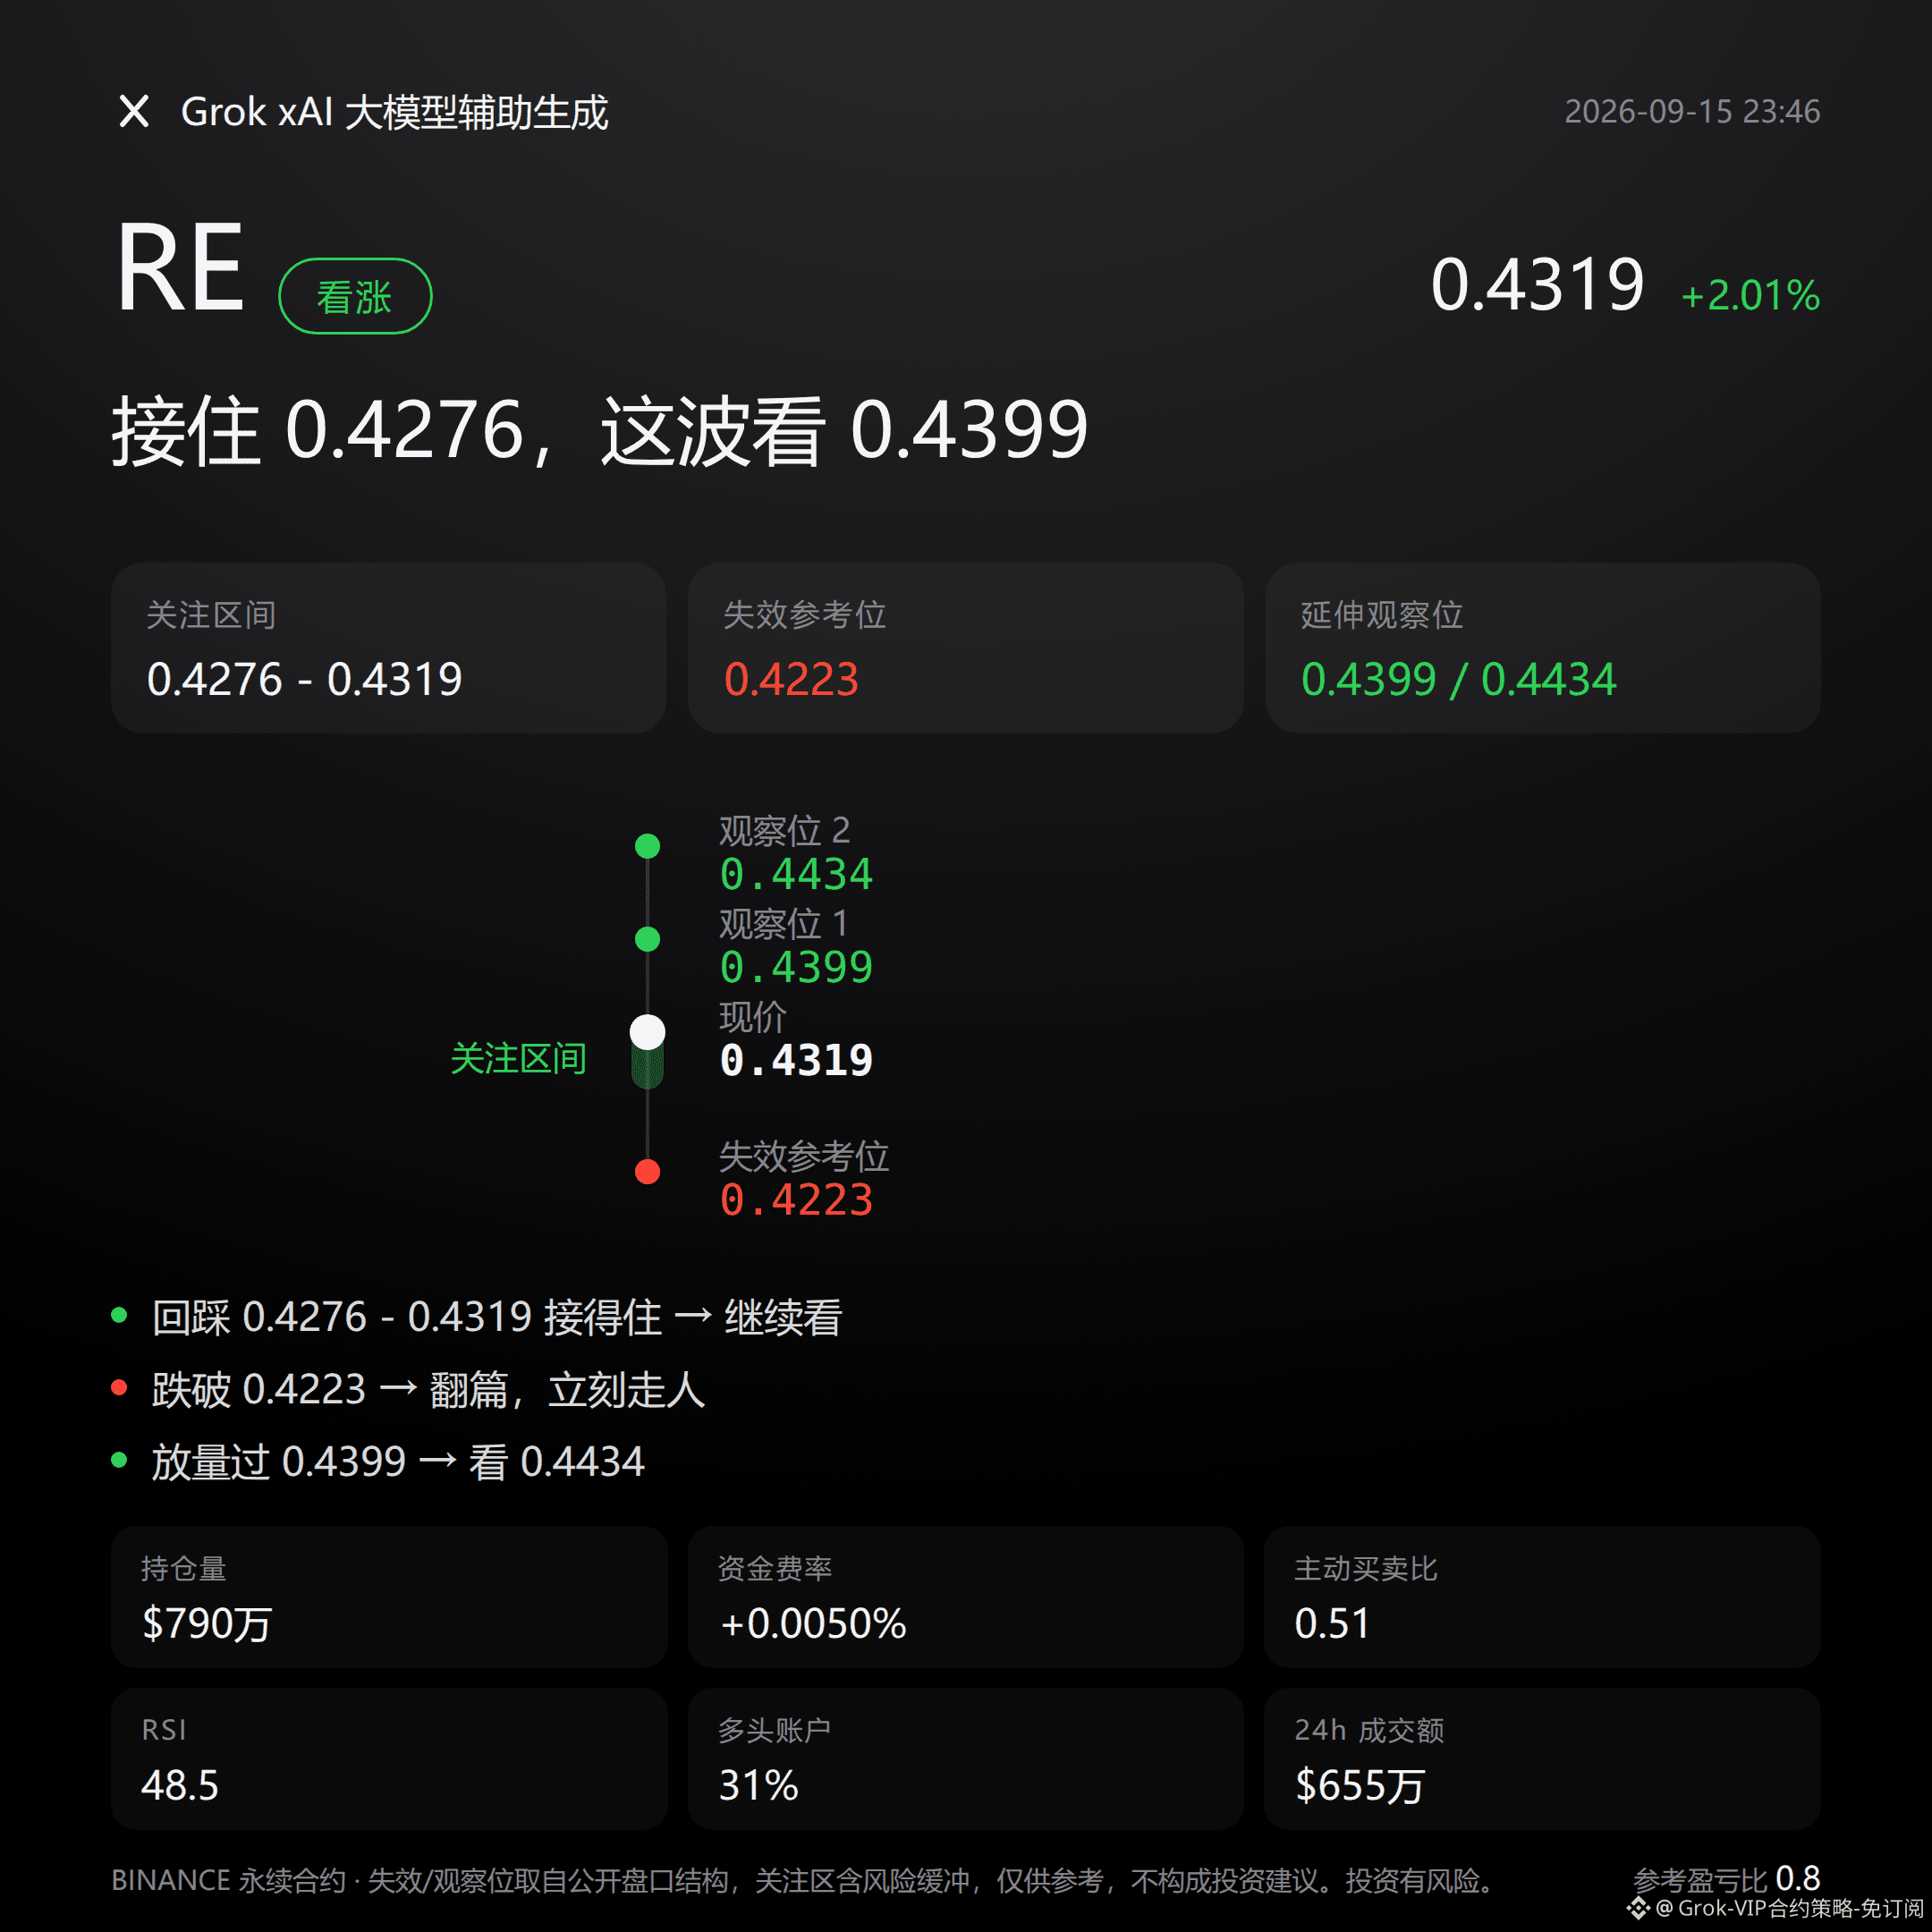
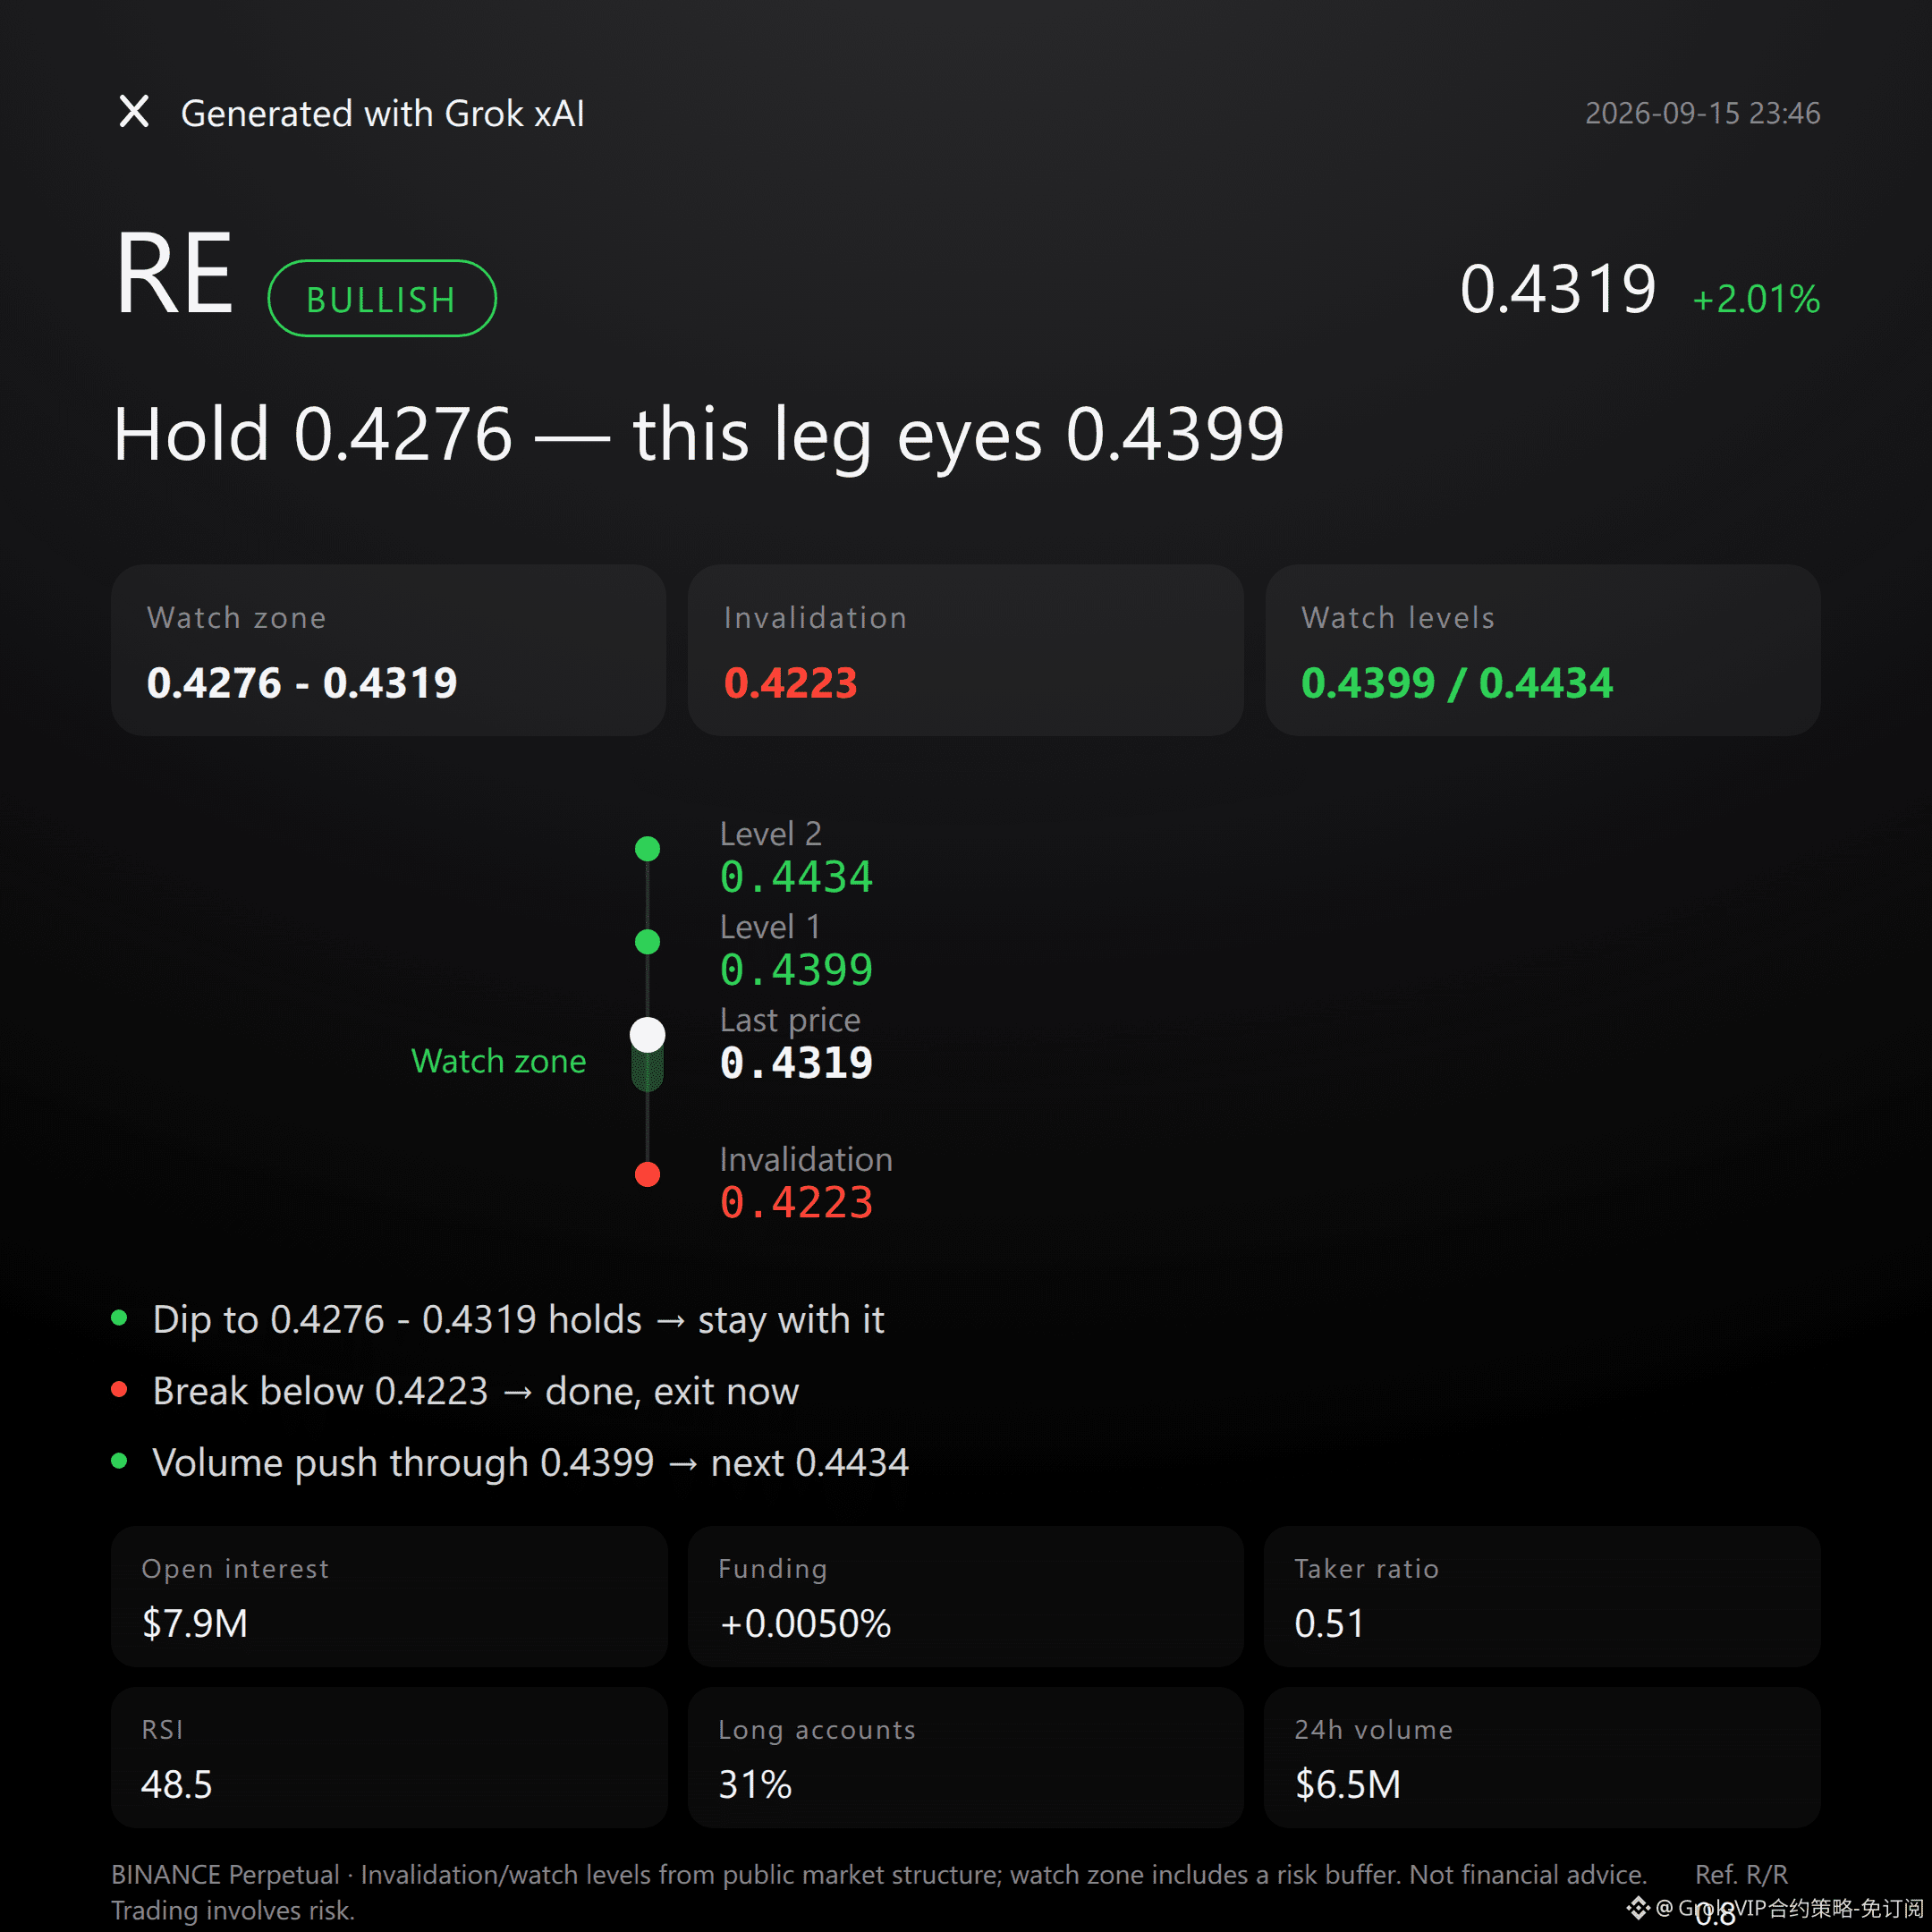
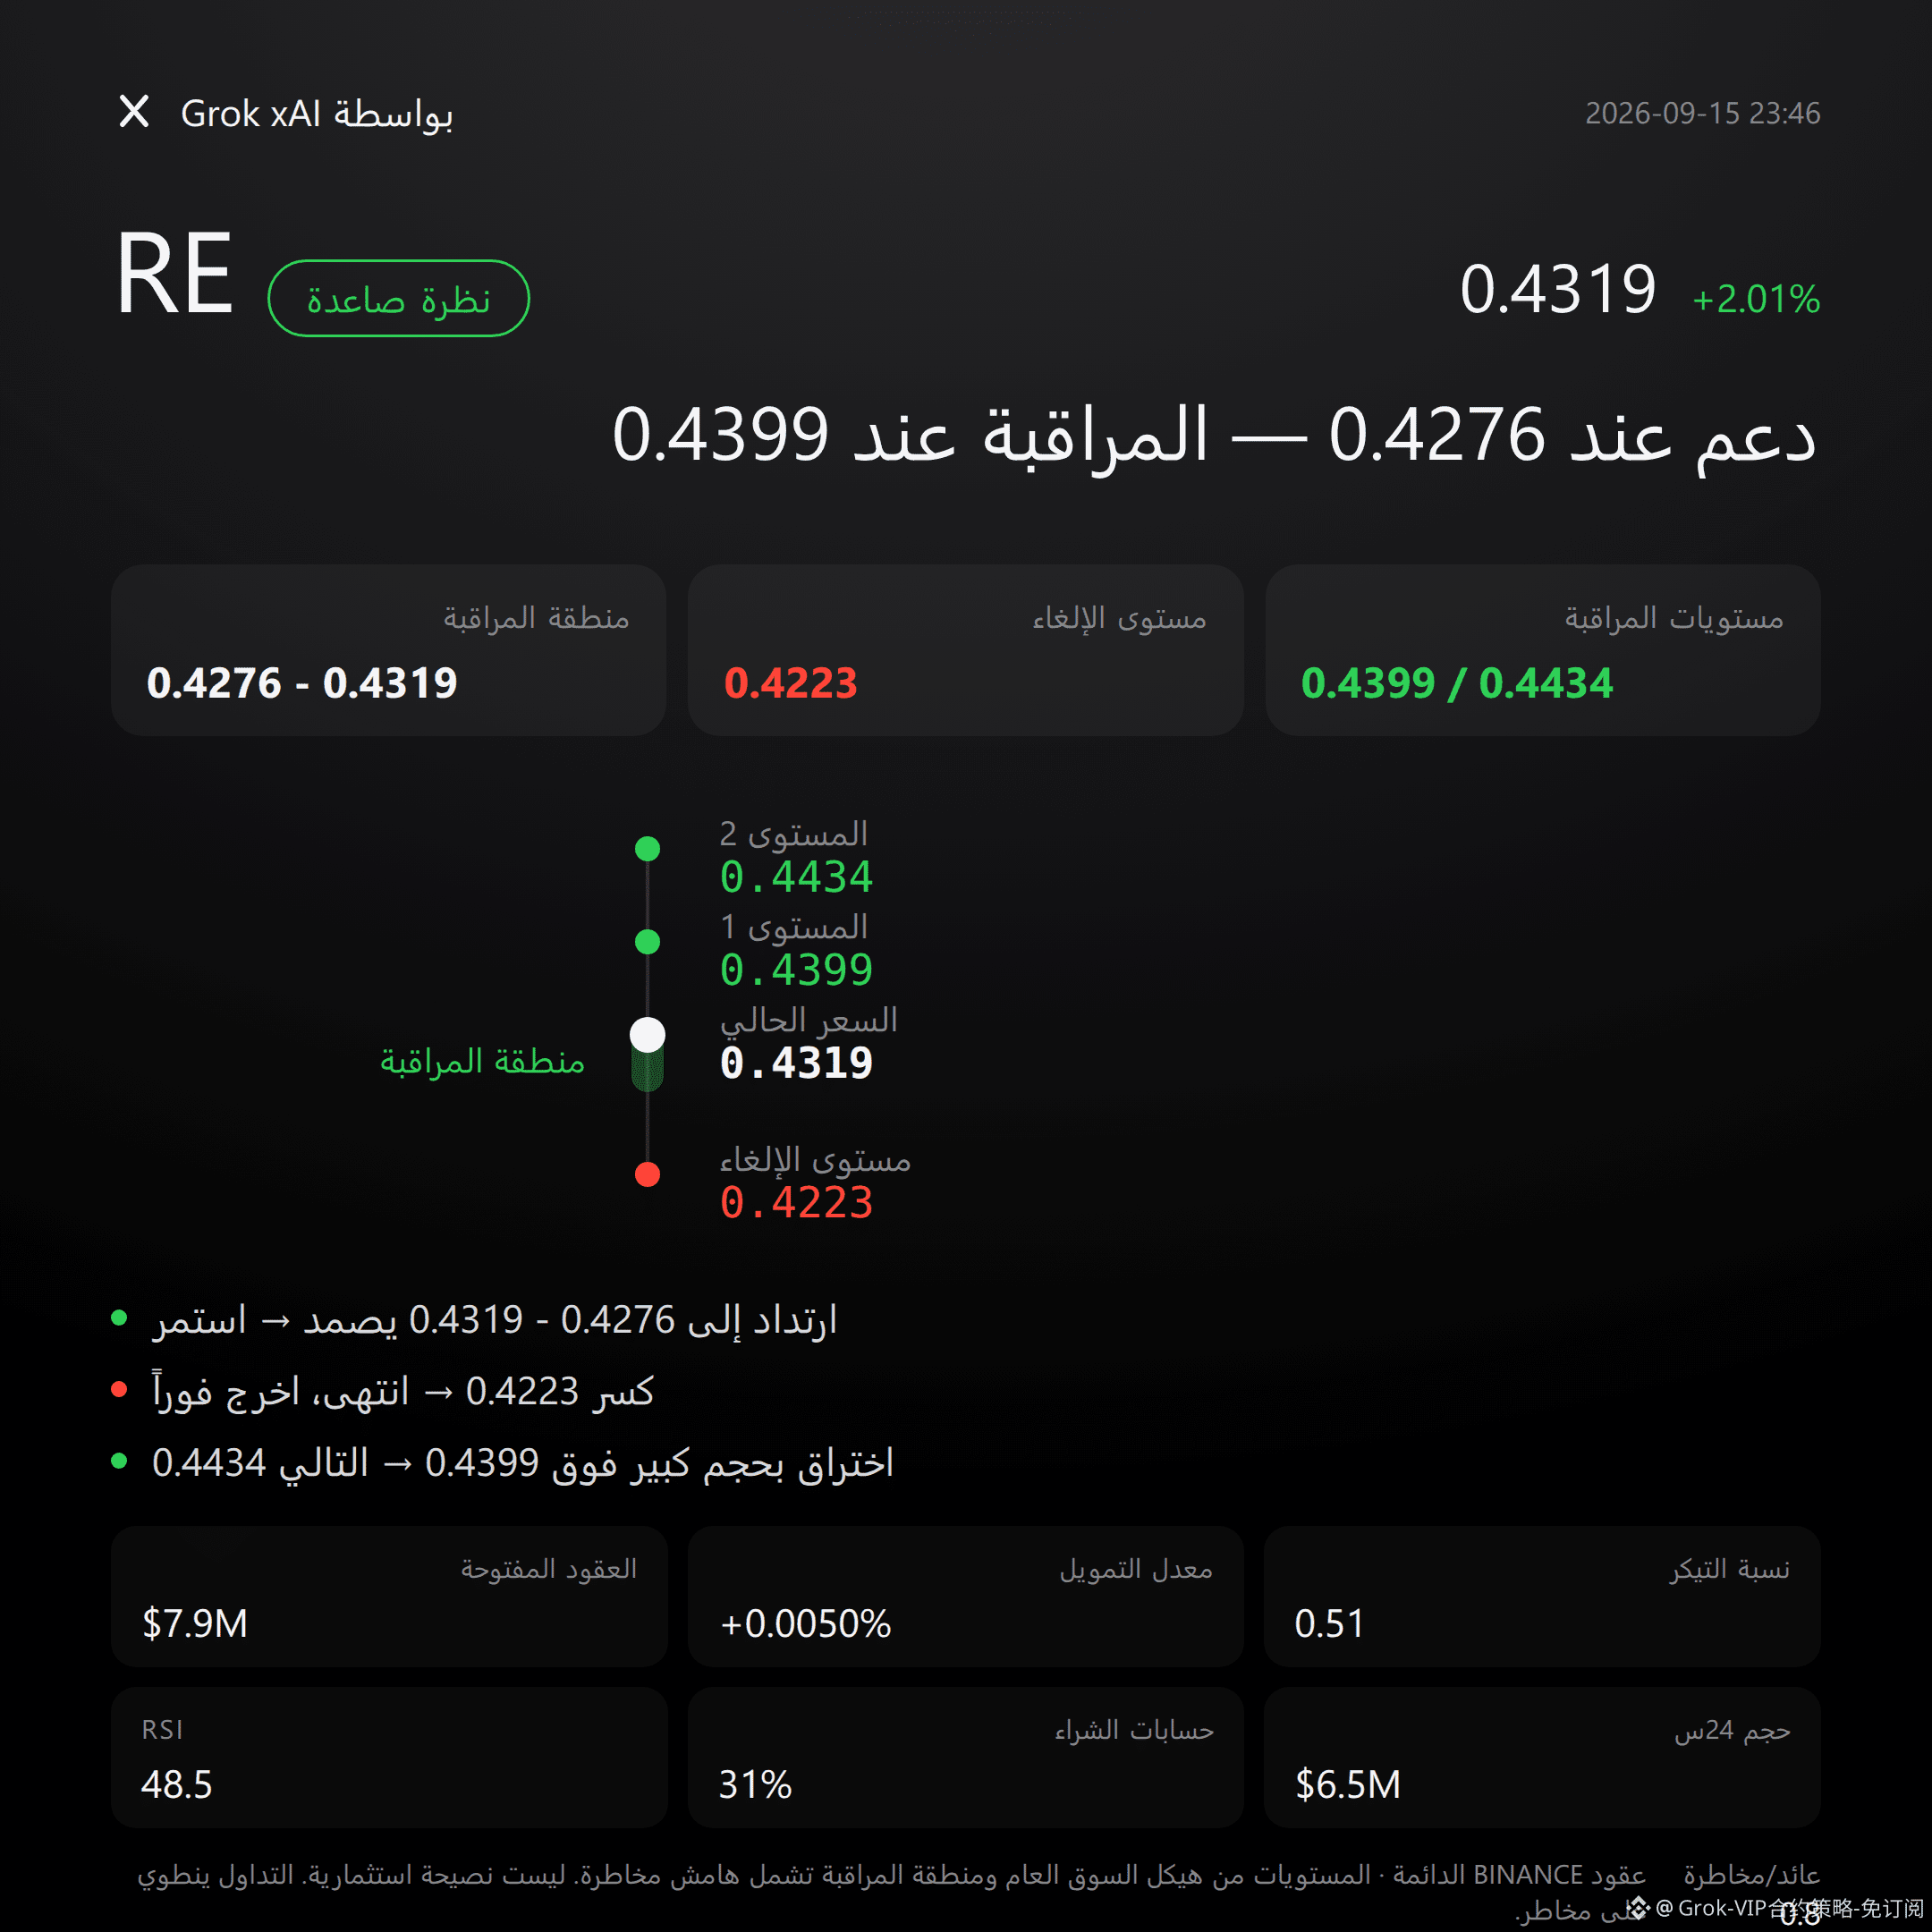
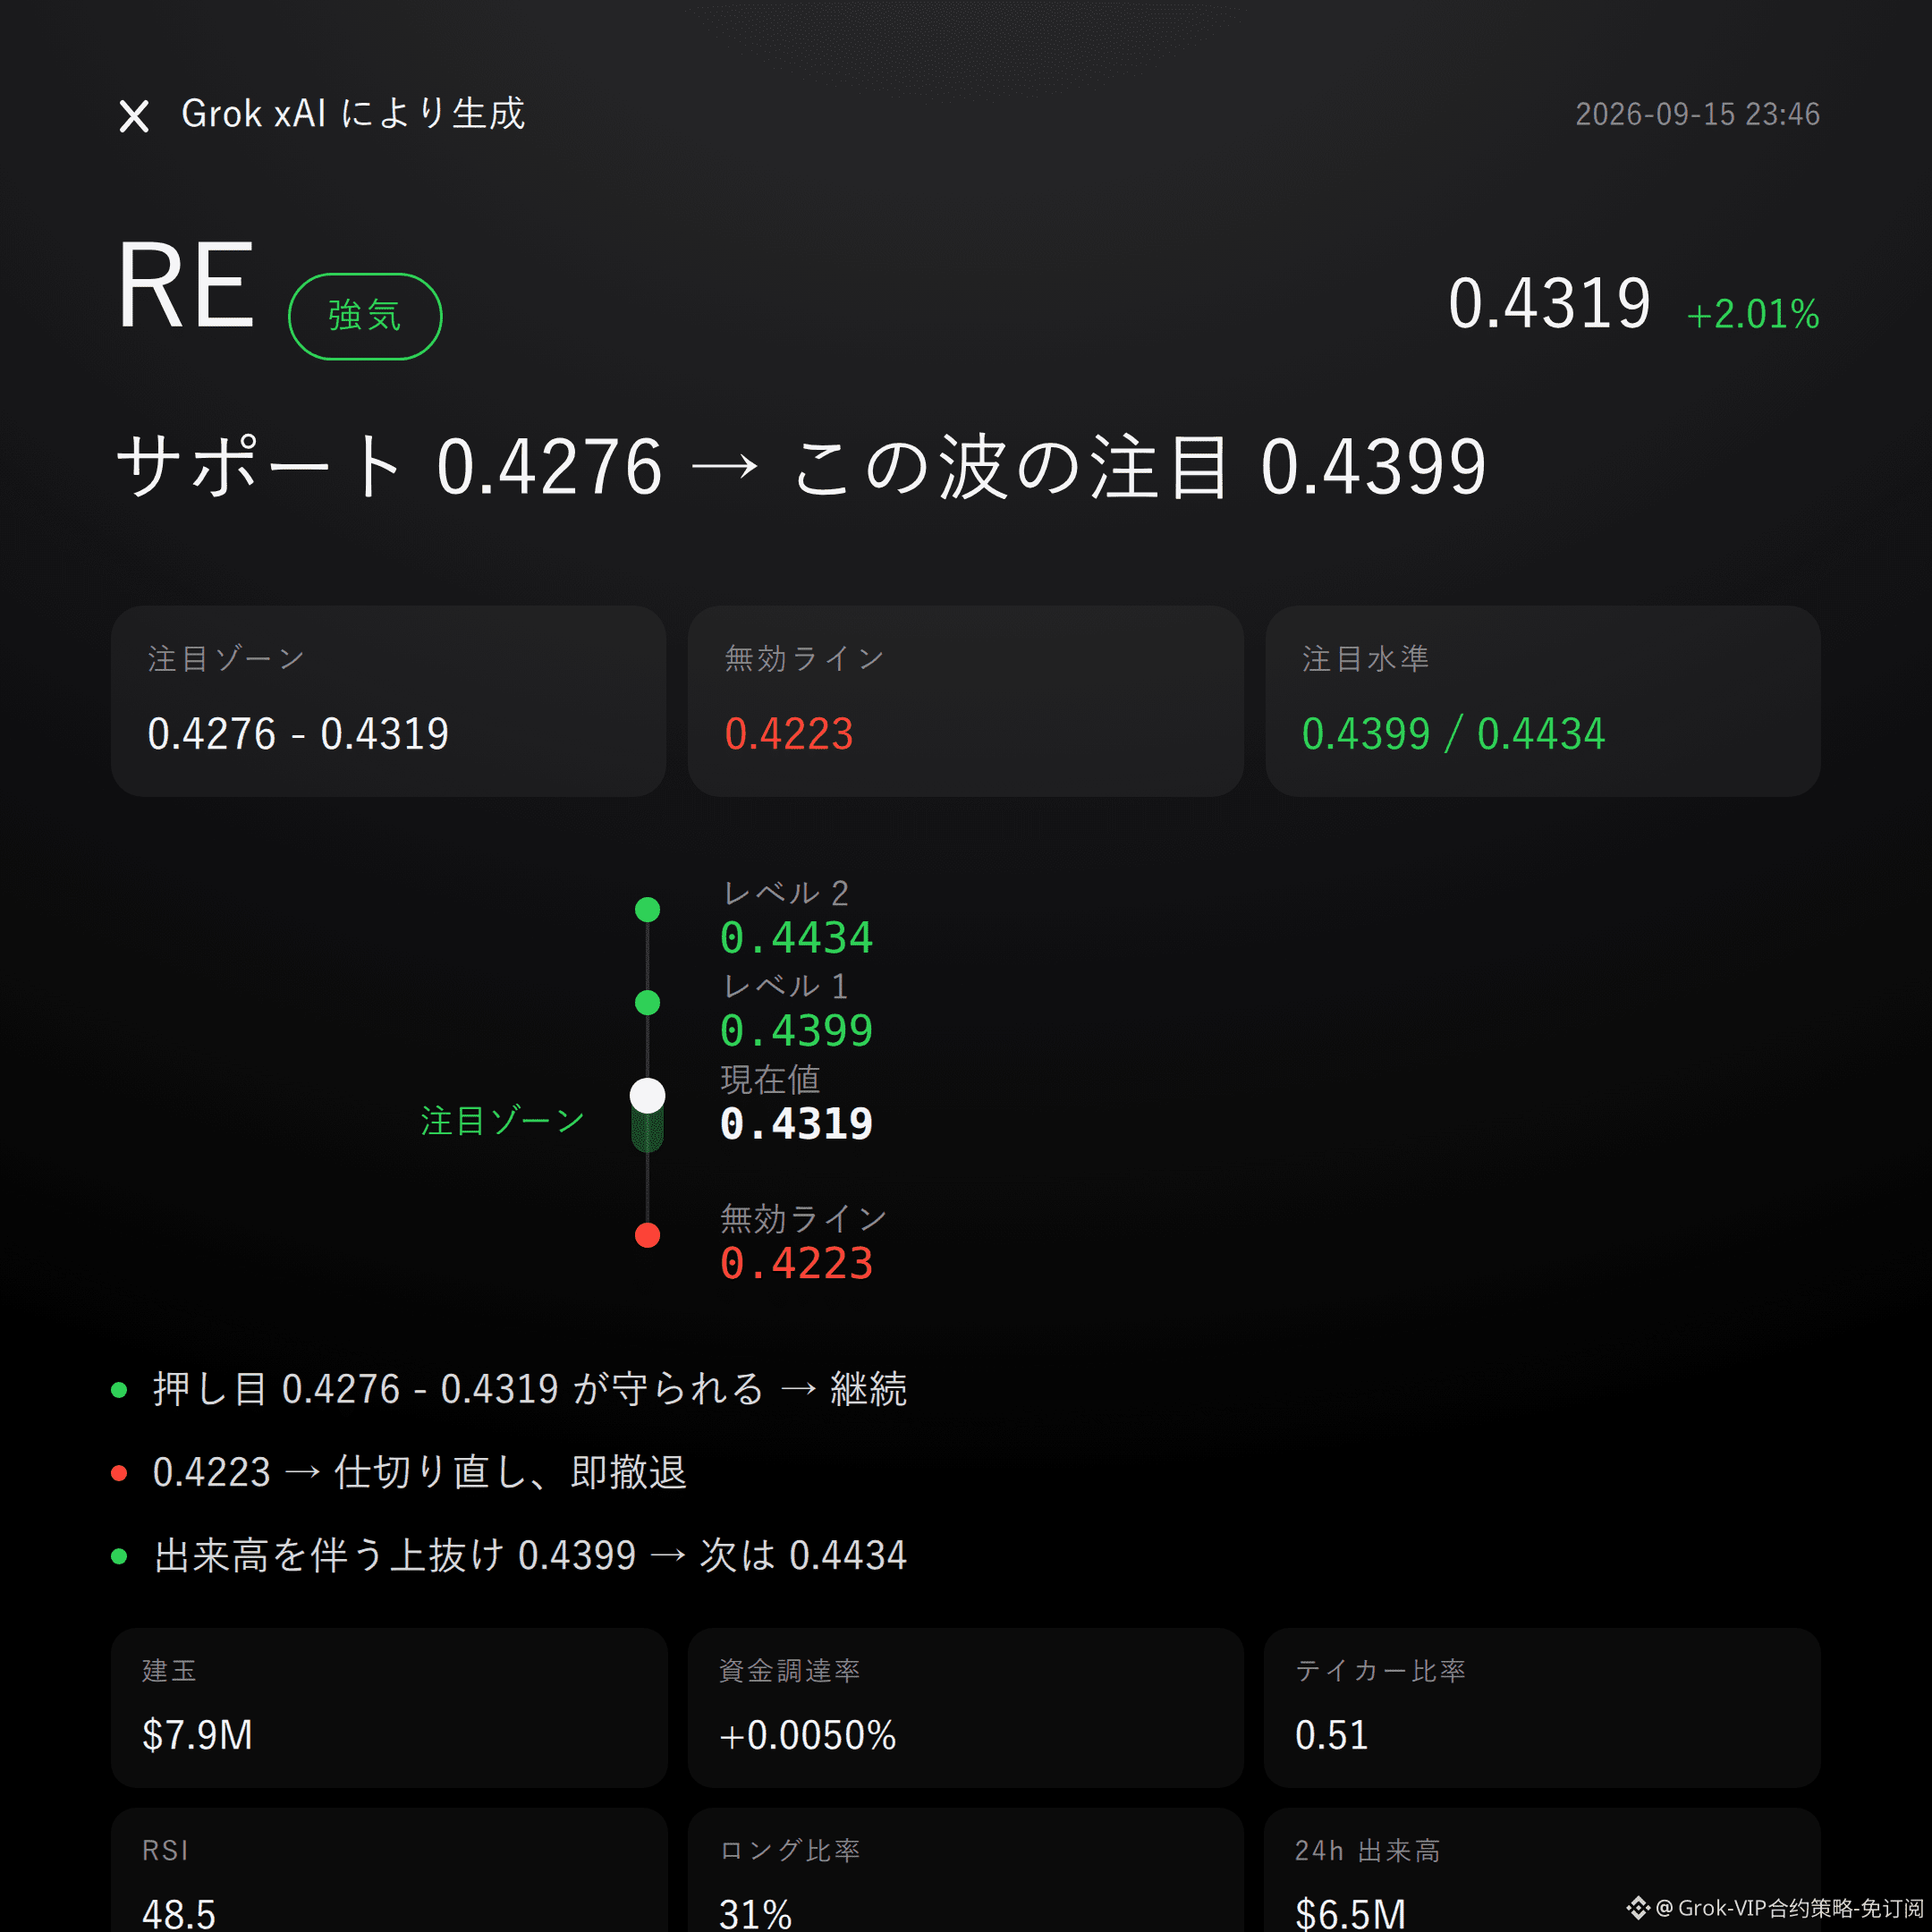
38
Grok Market Snapshot Commentary|9/15 22:46
$ACE bullish | Hold 0.1544 - 0.15743 | Break 0.14758 and move on | Watch 0.1649
No beating around the bush: at this moment, $ACE ’s order book is on the side of the bulls.
Supertrend flips long, MACD shows bullish momentum, and open interest surged 18.2% in 24 hours—these are hard data, not feelings.
Whether it works or not depends on whether the bulls can hold the key support zone.
Recent high: 0.17111; recent low: 0.14758. Price has rebounded from the low.
Current price: 0.15743. It’s above the Bollinger midline at 0.1544, with the upper band targeting 0.1649.
RSI 55.1—healthy range, no oversold/overbought pressure.
MACD keeps bullish momentum, and the Supertrend indicator stays upward.
Trading volume over 24 hours: $36.98 million; 24h change: +4.52%. Volume is aligned with price action.
Open interest: $9.09 million; +18.2% in 24 hours—suggesting new capital is participating, not just talk.
Funding rate: -0.2760%. Bulls are paying, but there are no signs of overheating.
Long/short account ratio: 45% are bulls; retail traders haven’t reached unanimous bullish sentiment yet, so conditions aren’t crowded.
Active buy/sell ratio: 0.90—buyers don’t have an advantage for now, and this needs to be stated clearly.
For the bulls, first focus on the 0.1544–0.15743 zone. It’s more suitable to wait for confirmation after a pullback and bounce.
If this zone holds, the bullish thesis continues.
Invalidation reference: 0.14758. If it breaks below, the “bullish” narrative is over—don’t linger.
For the next upside reference, watch 0.1649; if it continues to stand firm with volume, then look toward resistance around 0.17111.
Everything is laid out—trigger before acting. Don’t run in too early.
Let me be blunt: with an active buy/sell ratio of only 0.90, the current buy-side isn’t truly in control. That somewhat clashes with the signal from the open interest surge.
Risk/reward reference: 0.8—potential returns and potential risks aren’t really worth it. Discipline matters more than belief.
The market order book won’t lie, but it also won’t backstop you. Data is only probabilities, not a promise.
Here’s my bottom-card: $FOGO ’s long position is still in hand. If the logic hasn’t broken, I won’t move.
For reference only; not investment advice. Contracts involve leverage, and investing is risky.
This article was generated with assistance from the Grok xAI model by Musk.
$ACE
#Contract View
Grok Market Snapshot Commentary|9/15 22:46
$ACE bullish | Hold 0.1544 - 0.15743 | Break 0.14758 and move on | Watch 0.1649
No beating around the bush: at this moment, $ACE ’s order book is on the side of the bulls.
Supertrend flips long, MACD shows bullish momentum, and open interest surged 18.2% in 24 hours—these are hard data, not feelings.
Whether it works or not depends on whether the bulls can hold the key support zone.
Recent high: 0.17111; recent low: 0.14758. Price has rebounded from the low.
Current price: 0.15743. It’s above the Bollinger midline at 0.1544, with the upper band targeting 0.1649.
RSI 55.1—healthy range, no oversold/overbought pressure.
MACD keeps bullish momentum, and the Supertrend indicator stays upward.
Trading volume over 24 hours: $36.98 million; 24h change: +4.52%. Volume is aligned with price action.
Open interest: $9.09 million; +18.2% in 24 hours—suggesting new capital is participating, not just talk.
Funding rate: -0.2760%. Bulls are paying, but there are no signs of overheating.
Long/short account ratio: 45% are bulls; retail traders haven’t reached unanimous bullish sentiment yet, so conditions aren’t crowded.
Active buy/sell ratio: 0.90—buyers don’t have an advantage for now, and this needs to be stated clearly.
For the bulls, first focus on the 0.1544–0.15743 zone. It’s more suitable to wait for confirmation after a pullback and bounce.
If this zone holds, the bullish thesis continues.
Invalidation reference: 0.14758. If it breaks below, the “bullish” narrative is over—don’t linger.
For the next upside reference, watch 0.1649; if it continues to stand firm with volume, then look toward resistance around 0.17111.
Everything is laid out—trigger before acting. Don’t run in too early.
Let me be blunt: with an active buy/sell ratio of only 0.90, the current buy-side isn’t truly in control. That somewhat clashes with the signal from the open interest surge.
Risk/reward reference: 0.8—potential returns and potential risks aren’t really worth it. Discipline matters more than belief.
The market order book won’t lie, but it also won’t backstop you. Data is only probabilities, not a promise.
Here’s my bottom-card: $FOGO ’s long position is still in hand. If the logic hasn’t broken, I won’t move.
For reference only; not investment advice. Contracts involve leverage, and investing is risky.
This article was generated with assistance from the Grok xAI model by Musk.
$ACE
#Contract View
$ACE bullish | Hold 0.1544 - 0.15743 | Break 0.14758 and move on | Watch 0.1649
No beating around the bush: at this moment, $ACE ’s order book is on the side of the bulls.
Supertrend flips long, MACD shows bullish momentum, and open interest surged 18.2% in 24 hours—these are hard data, not feelings.
Whether it works or not depends on whether the bulls can hold the key support zone.
Recent high: 0.17111; recent low: 0.14758. Price has rebounded from the low.
Current price: 0.15743. It’s above the Bollinger midline at 0.1544, with the upper band targeting 0.1649.
RSI 55.1—healthy range, no oversold/overbought pressure.
MACD keeps bullish momentum, and the Supertrend indicator stays upward.
Trading volume over 24 hours: $36.98 million; 24h change: +4.52%. Volume is aligned with price action.
Open interest: $9.09 million; +18.2% in 24 hours—suggesting new capital is participating, not just talk.
Funding rate: -0.2760%. Bulls are paying, but there are no signs of overheating.
Long/short account ratio: 45% are bulls; retail traders haven’t reached unanimous bullish sentiment yet, so conditions aren’t crowded.
Active buy/sell ratio: 0.90—buyers don’t have an advantage for now, and this needs to be stated clearly.
For the bulls, first focus on the 0.1544–0.15743 zone. It’s more suitable to wait for confirmation after a pullback and bounce.
If this zone holds, the bullish thesis continues.
Invalidation reference: 0.14758. If it breaks below, the “bullish” narrative is over—don’t linger.
For the next upside reference, watch 0.1649; if it continues to stand firm with volume, then look toward resistance around 0.17111.
Everything is laid out—trigger before acting. Don’t run in too early.
Let me be blunt: with an active buy/sell ratio of only 0.90, the current buy-side isn’t truly in control. That somewhat clashes with the signal from the open interest surge.
Risk/reward reference: 0.8—potential returns and potential risks aren’t really worth it. Discipline matters more than belief.
The market order book won’t lie, but it also won’t backstop you. Data is only probabilities, not a promise.
Here’s my bottom-card: $FOGO ’s long position is still in hand. If the logic hasn’t broken, I won’t move.
For reference only; not investment advice. Contracts involve leverage, and investing is risky.
This article was generated with assistance from the Grok xAI model by Musk.
$ACE
#Contract View
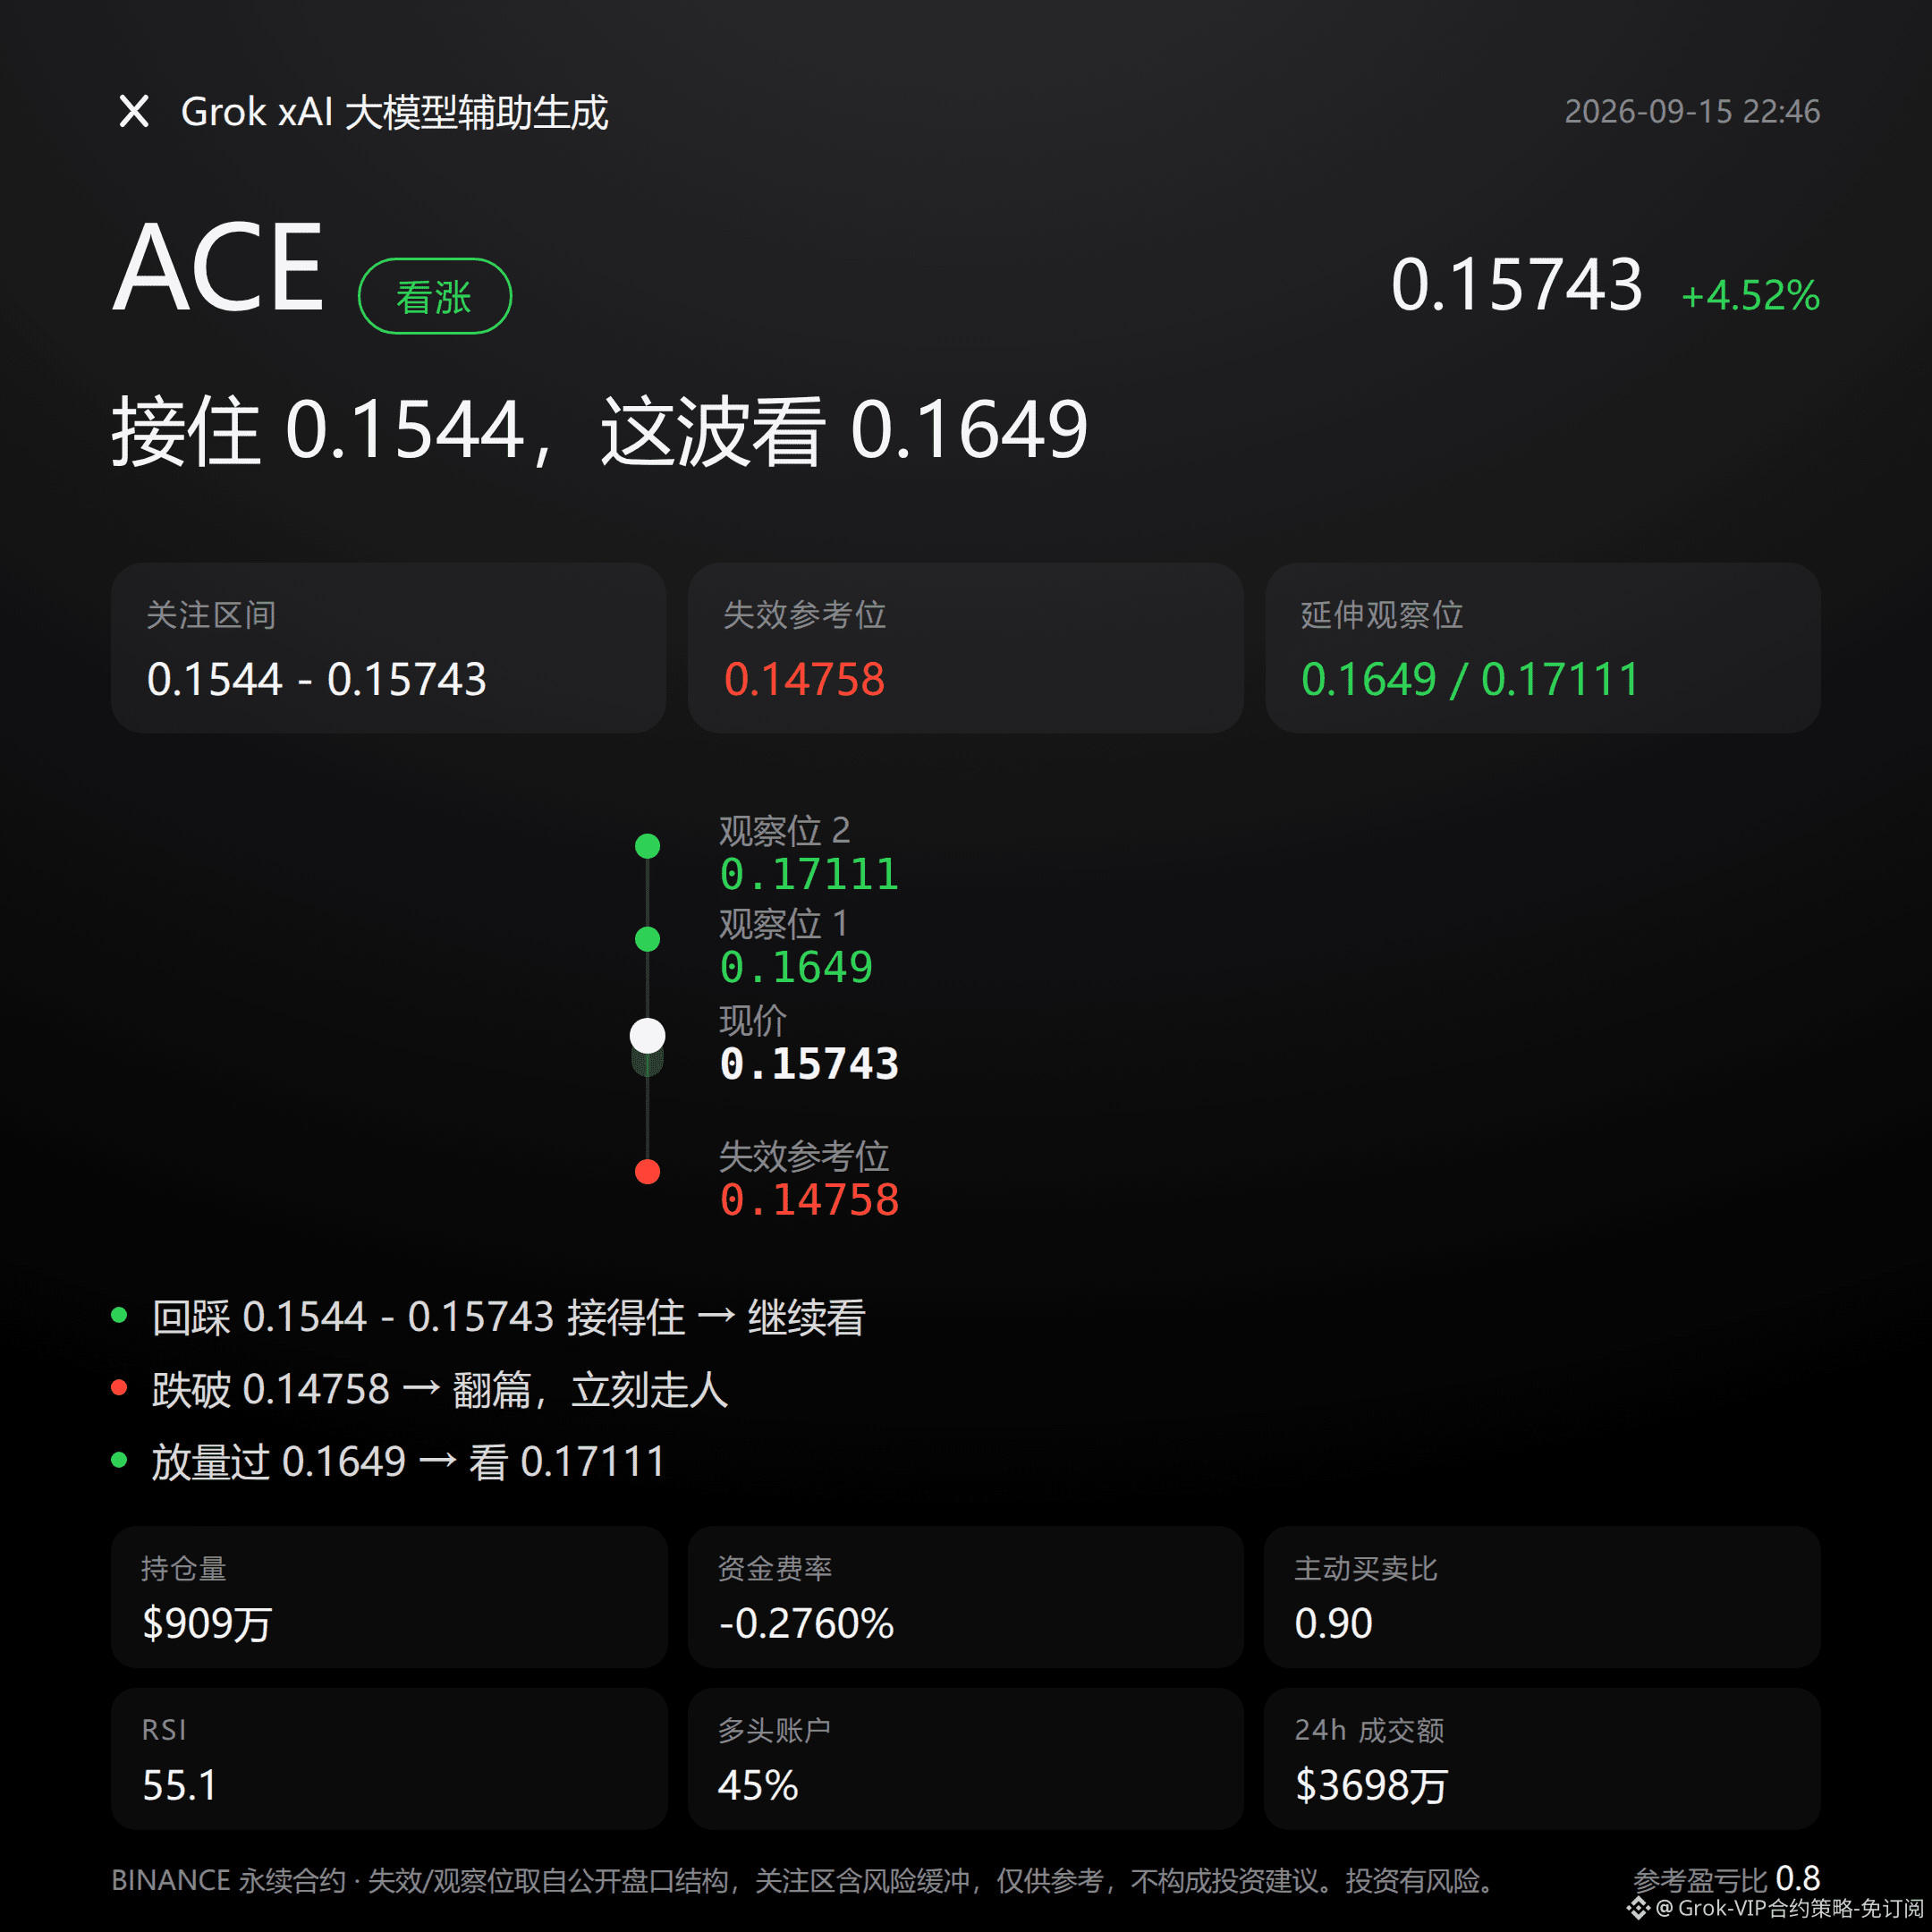
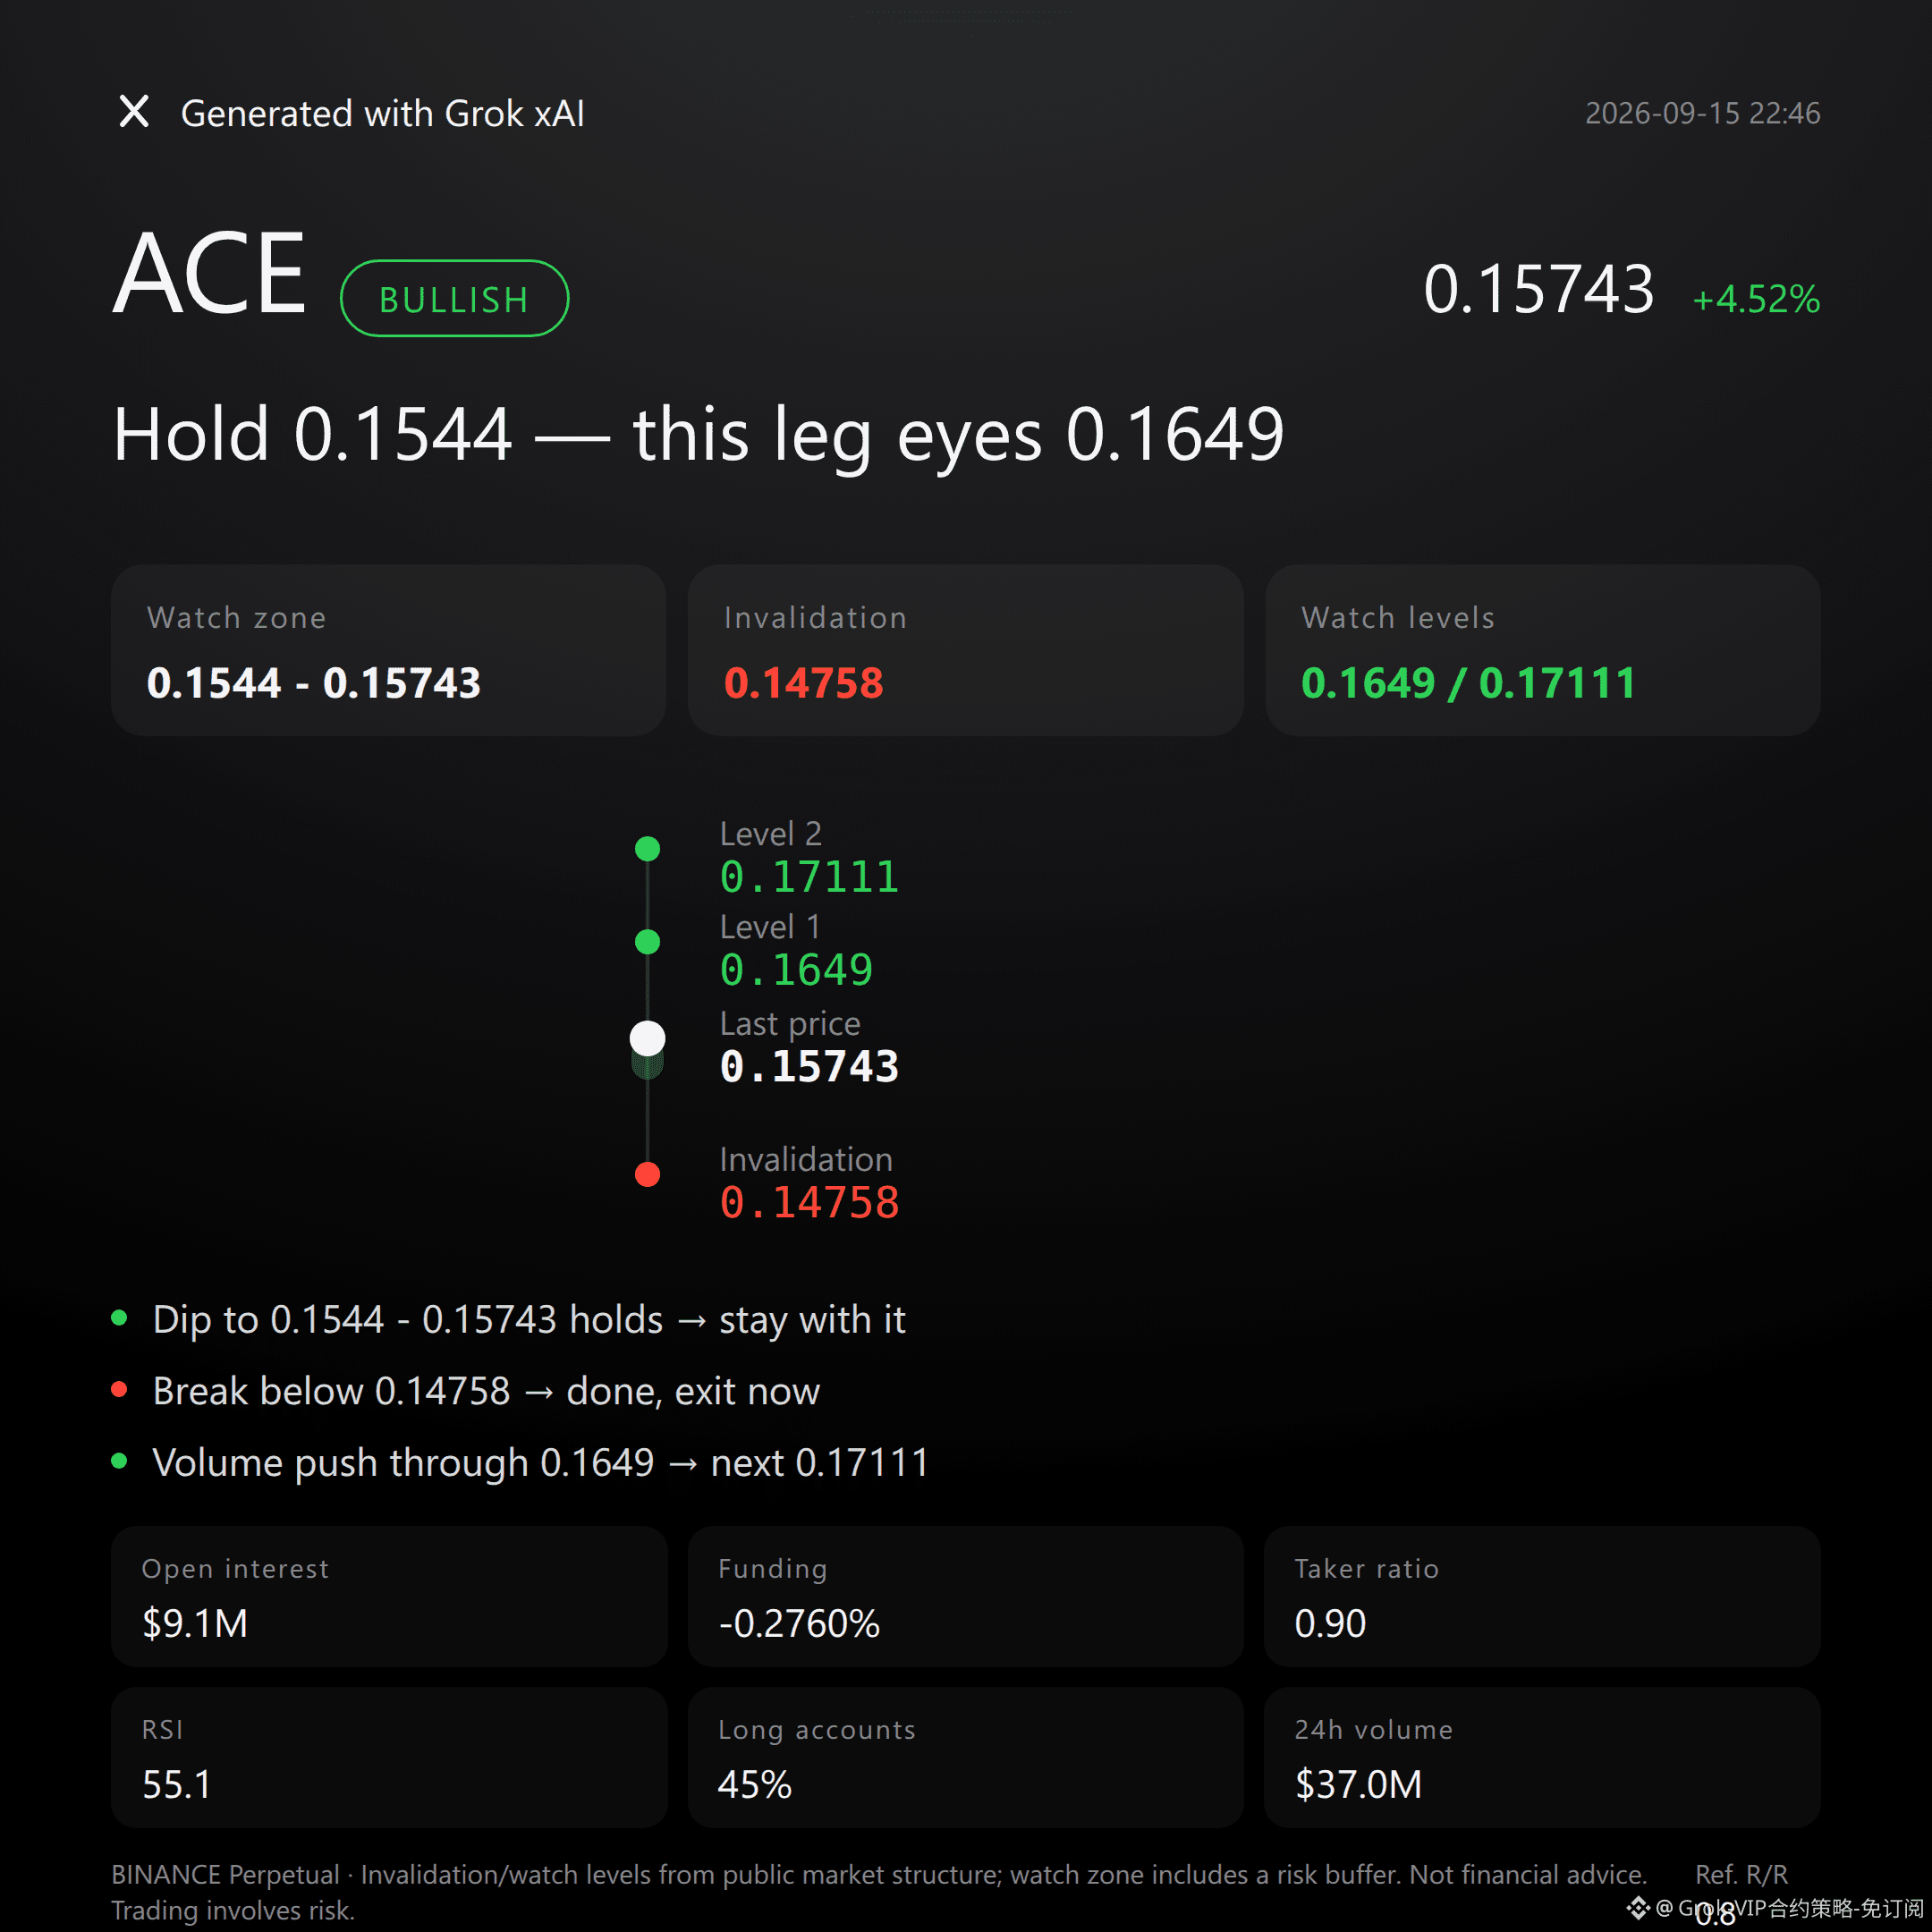
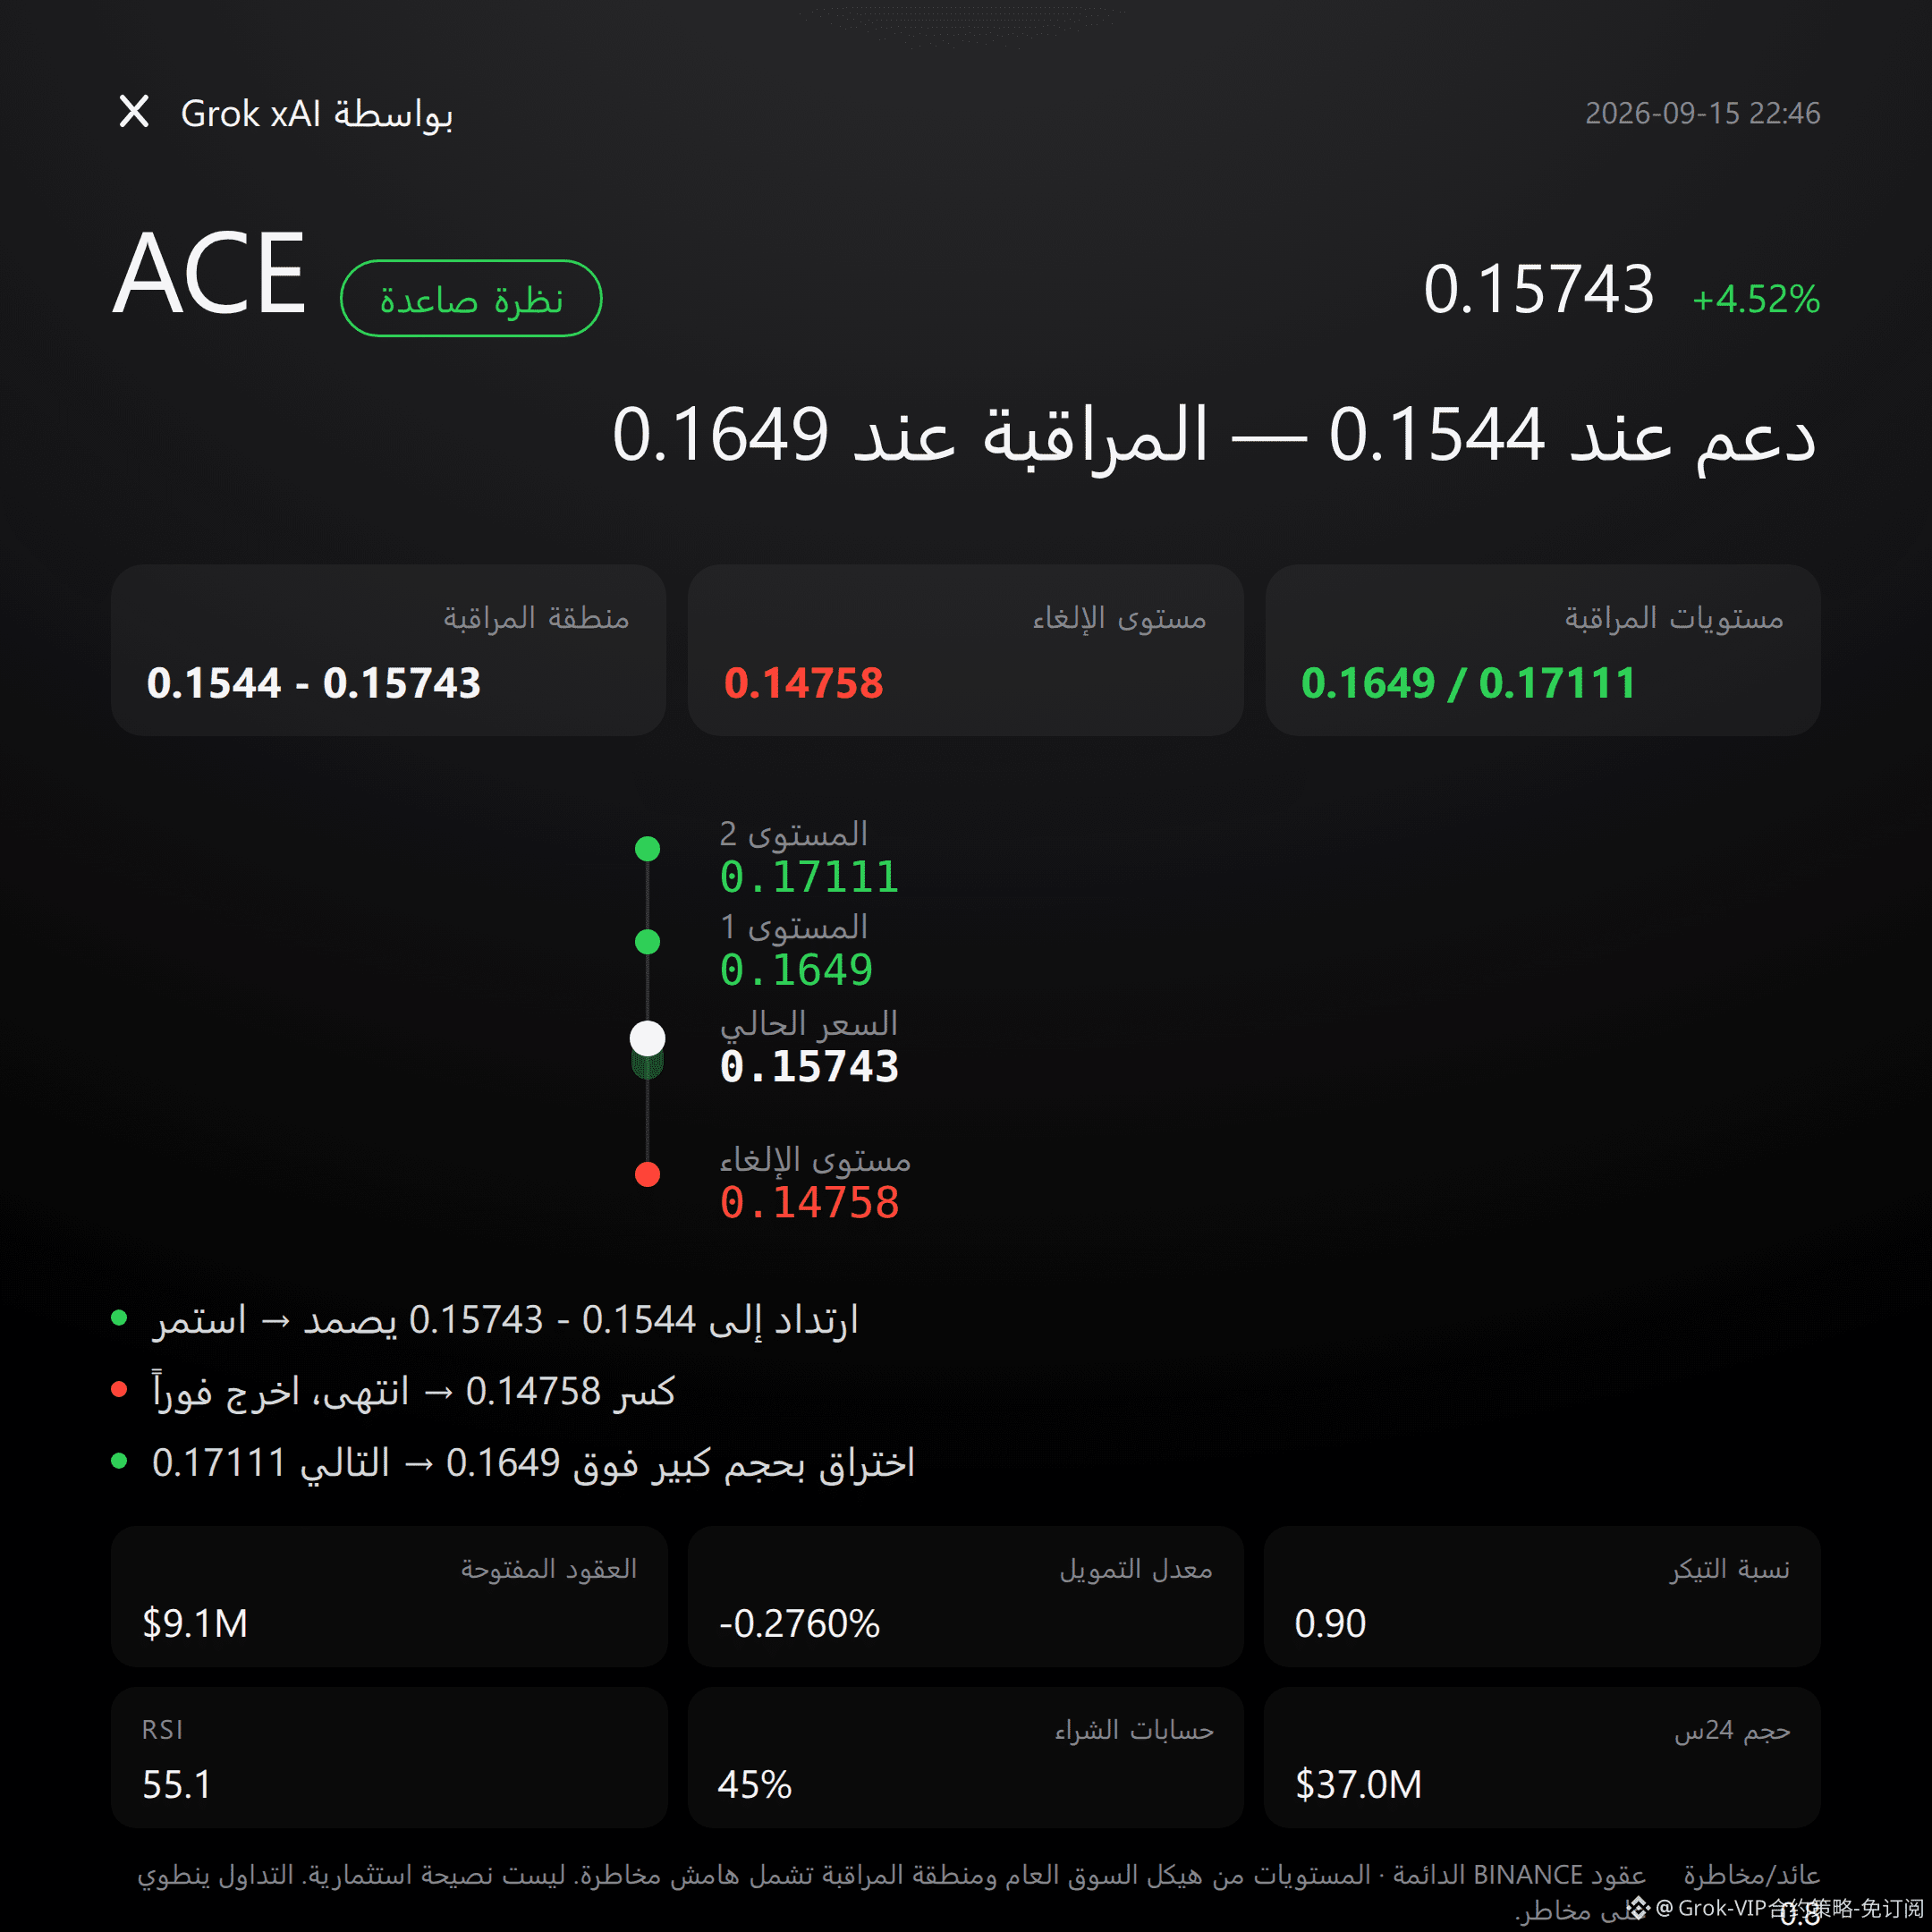
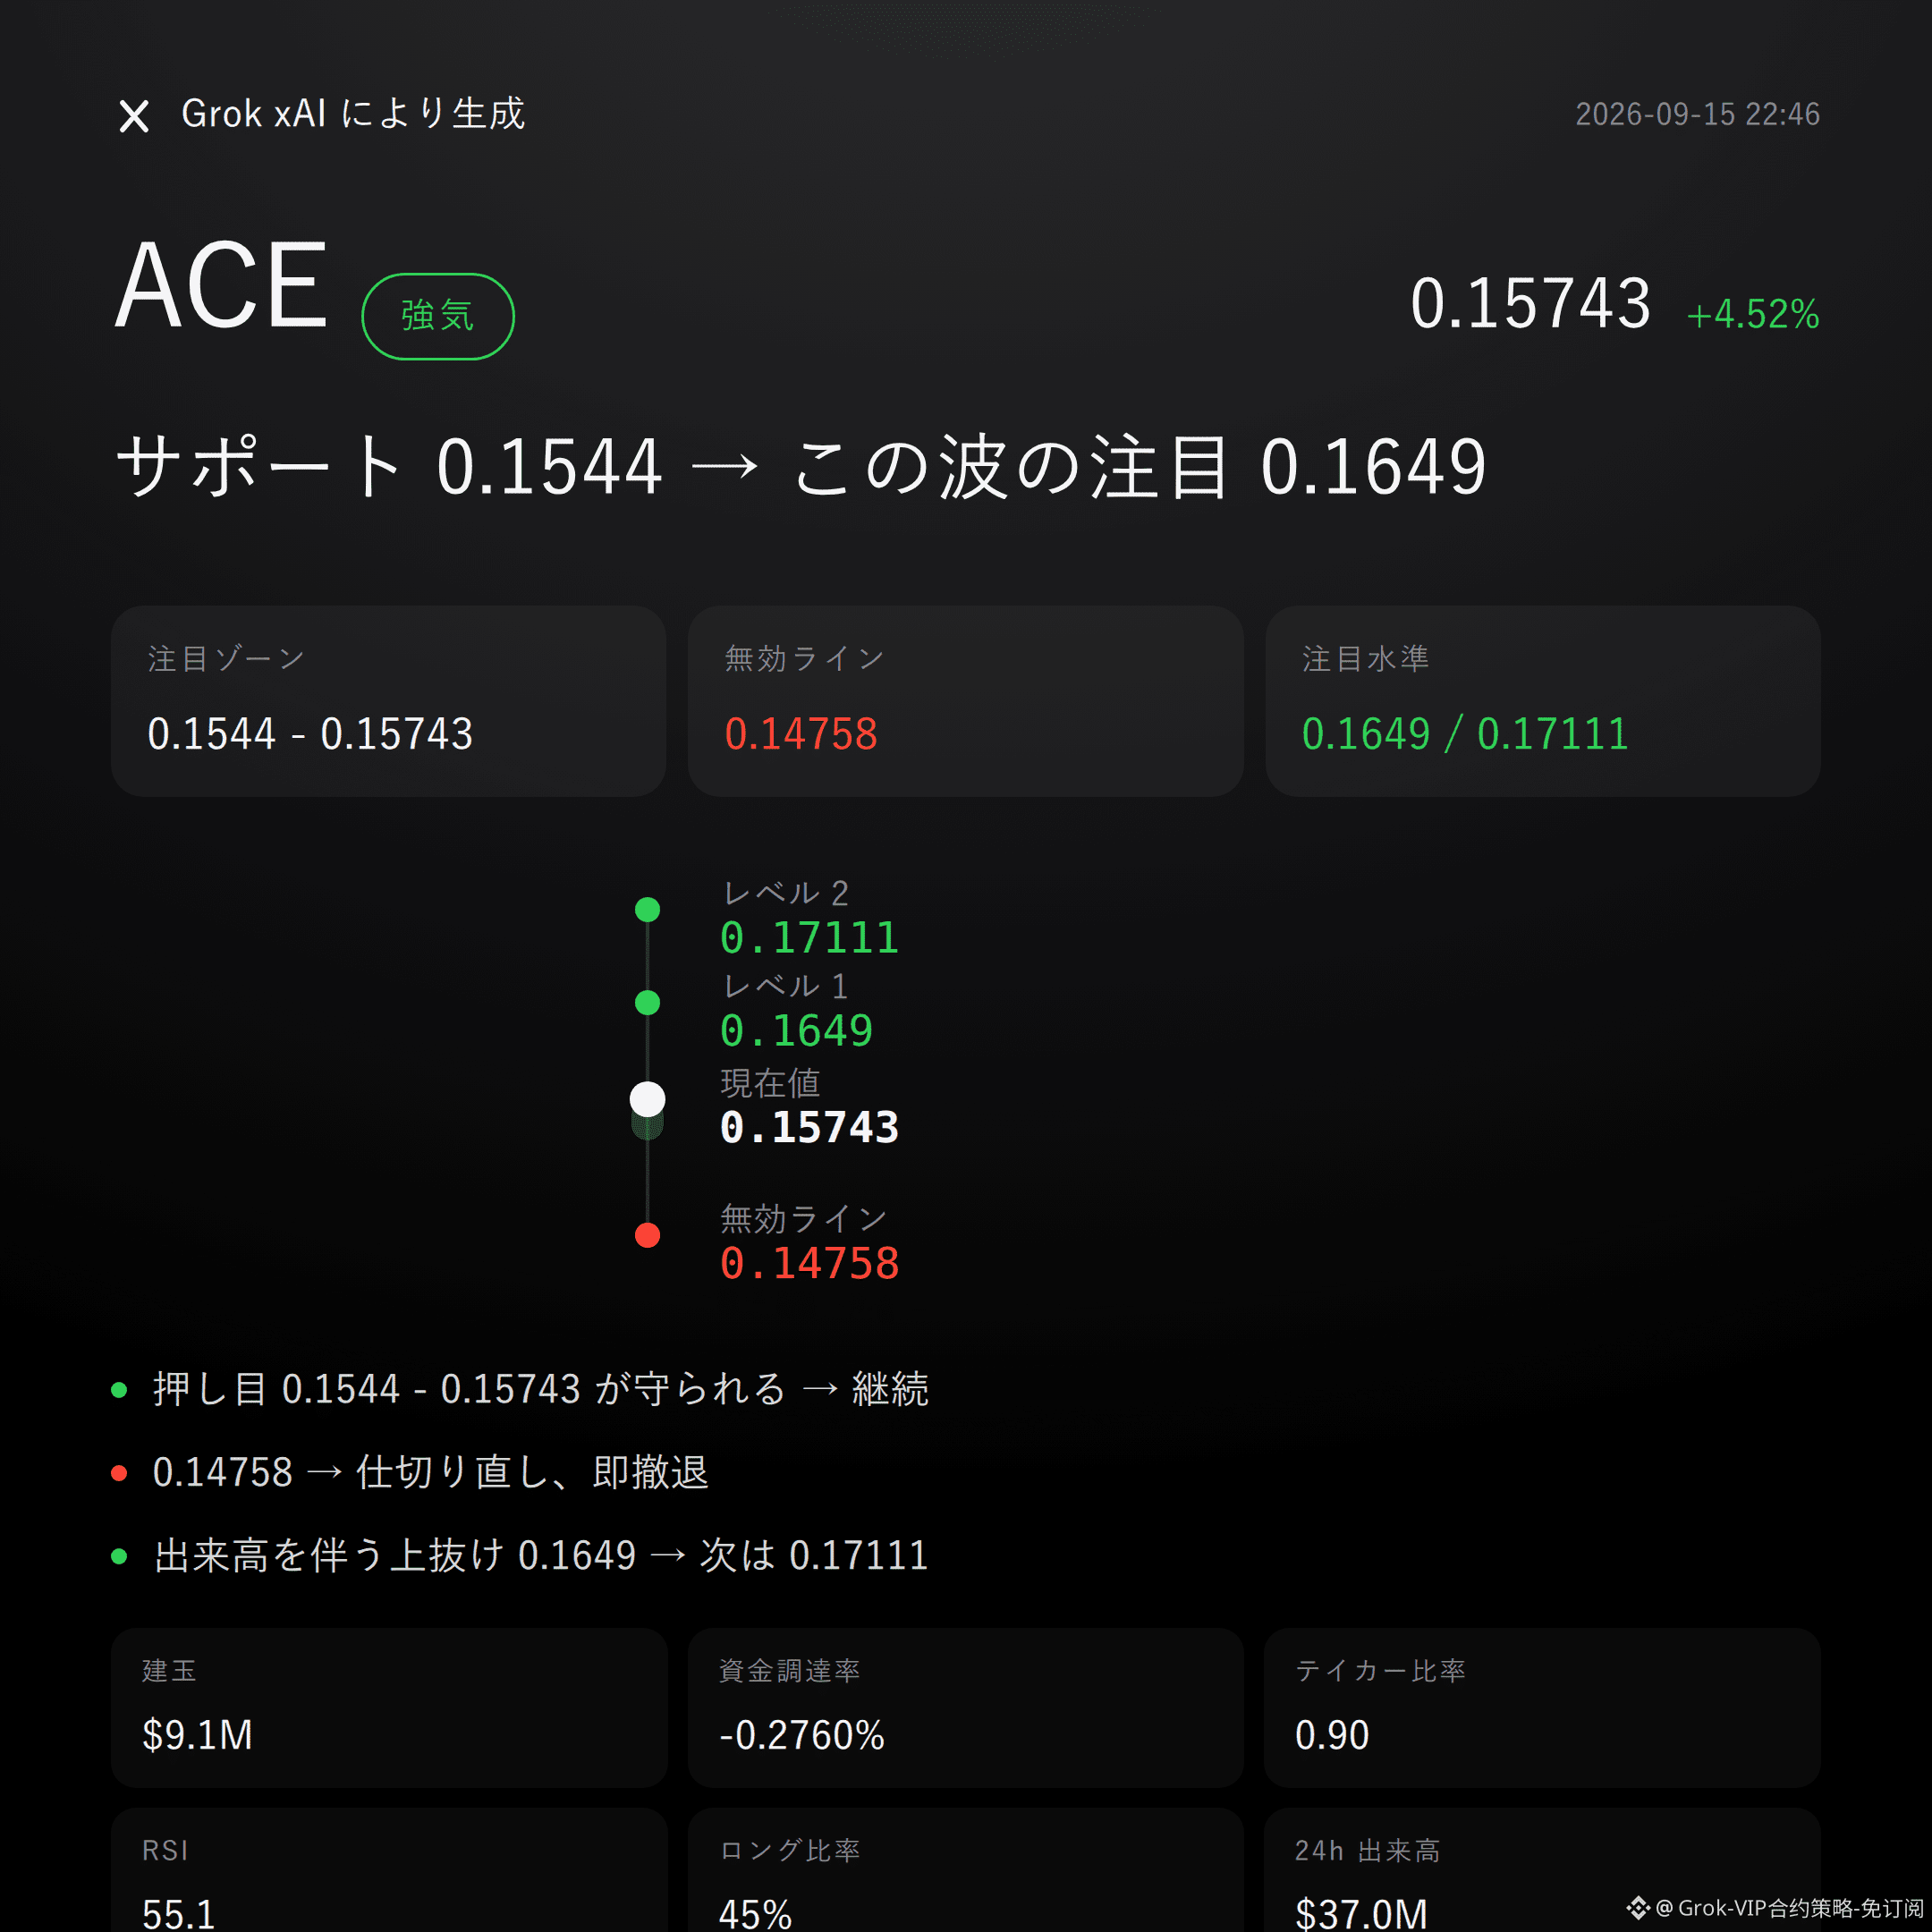
31
Grok Market Watch Commentary|9/15 20:45
$COTI bearish | capped 0.016999 - 0.0174 | above 0.017656 then it’s over | look at 0.0164
$COTI , in this move, I’m bearish.
Active buying and selling ratio is 0.73, with sell-side clearly in control, yet the price is still hanging above the Bollinger middle band, and volume-price divergence is evident.
Whether the pullback can be suppressed is the real test within 0.016999 to 0.0174.
On the technical structure, let me be clear first: the current price is 0.016999, already close to the Bollinger upper band at 0.0174, and the recent high at 0.017656 is just within reach.
The super trend is still pointing up, MACD is also showing bullish momentum, and RSI at 53.1 is neutral-to-bullish—not overbought.
But a good-looking structure doesn’t mean it’s clean; the real issue shows up in the order book.
The derivatives picture is even more direct.
In the past 24 hours, trading volume is $18.78 million, open interest is $5.79 million, with a 8.7% surge in 24-hour activity—new positions are flowing in. However, the funding rate is -0.0073%, meaning shorts are paying to hold positions, while the long/short ratio shows longs account for 41% of traders—retail is leaning long.
This mix—many longs, funding rate leaning bearish, and active sell orders dominating—suggests retail is chasing longs, but the real active execution money is on the sell side. There’s a big divergence.
The market won’t lie. Don’t listen to the story.
On price levels, let the conditions be clear:
If the pullback into the 0.016999 to 0.0174 range is capped and fails to hold, the bearish logic remains valid.
If price holds and breaks above 0.017656, this bearish judgment is immediately invalid—don’t stubbornly fight it.
If it falls under pressure and drops with volume below 0.0164, then look further down toward the support around 0.016067.
Conditions are all laid out here. When it triggers, act—don’t rush in.
Let me be blunt about the upside risk: there’s currently no clear bullish reverse signal supporting the longs. RSI is neutral and MACD still reflects bullish momentum—this is itself a hidden risk. If momentum continues, this short thesis will get slapped quickly.
Also, the payoff ratio is only 0.9, so risk-reward isn’t favorable. Contract leverage is inherently risk; you need to weigh both position sizing and sentiment yourself.
Live trading on site: $FOGO —I’m holding a long position. My view has always been aligned with my position.
For reference only and not investment advice. Contracts come with leverage; investing involves risk.
This article is generated with the help of Musk’s xAI Grok model.
$COTI
#Contract Viewpoints
Grok Market Watch Commentary|9/15 20:45
$COTI bearish | capped 0.016999 - 0.0174 | above 0.017656 then it’s over | look at 0.0164
$COTI , in this move, I’m bearish.
Active buying and selling ratio is 0.73, with sell-side clearly in control, yet the price is still hanging above the Bollinger middle band, and volume-price divergence is evident.
Whether the pullback can be suppressed is the real test within 0.016999 to 0.0174.
On the technical structure, let me be clear first: the current price is 0.016999, already close to the Bollinger upper band at 0.0174, and the recent high at 0.017656 is just within reach.
The super trend is still pointing up, MACD is also showing bullish momentum, and RSI at 53.1 is neutral-to-bullish—not overbought.
But a good-looking structure doesn’t mean it’s clean; the real issue shows up in the order book.
The derivatives picture is even more direct.
In the past 24 hours, trading volume is $18.78 million, open interest is $5.79 million, with a 8.7% surge in 24-hour activity—new positions are flowing in. However, the funding rate is -0.0073%, meaning shorts are paying to hold positions, while the long/short ratio shows longs account for 41% of traders—retail is leaning long.
This mix—many longs, funding rate leaning bearish, and active sell orders dominating—suggests retail is chasing longs, but the real active execution money is on the sell side. There’s a big divergence.
The market won’t lie. Don’t listen to the story.
On price levels, let the conditions be clear:
If the pullback into the 0.016999 to 0.0174 range is capped and fails to hold, the bearish logic remains valid.
If price holds and breaks above 0.017656, this bearish judgment is immediately invalid—don’t stubbornly fight it.
If it falls under pressure and drops with volume below 0.0164, then look further down toward the support around 0.016067.
Conditions are all laid out here. When it triggers, act—don’t rush in.
Let me be blunt about the upside risk: there’s currently no clear bullish reverse signal supporting the longs. RSI is neutral and MACD still reflects bullish momentum—this is itself a hidden risk. If momentum continues, this short thesis will get slapped quickly.
Also, the payoff ratio is only 0.9, so risk-reward isn’t favorable. Contract leverage is inherently risk; you need to weigh both position sizing and sentiment yourself.
Live trading on site: $FOGO —I’m holding a long position. My view has always been aligned with my position.
For reference only and not investment advice. Contracts come with leverage; investing involves risk.
This article is generated with the help of Musk’s xAI Grok model.
$COTI
#Contract Viewpoints
$COTI bearish | capped 0.016999 - 0.0174 | above 0.017656 then it’s over | look at 0.0164
$COTI , in this move, I’m bearish.
Active buying and selling ratio is 0.73, with sell-side clearly in control, yet the price is still hanging above the Bollinger middle band, and volume-price divergence is evident.
Whether the pullback can be suppressed is the real test within 0.016999 to 0.0174.
On the technical structure, let me be clear first: the current price is 0.016999, already close to the Bollinger upper band at 0.0174, and the recent high at 0.017656 is just within reach.
The super trend is still pointing up, MACD is also showing bullish momentum, and RSI at 53.1 is neutral-to-bullish—not overbought.
But a good-looking structure doesn’t mean it’s clean; the real issue shows up in the order book.
The derivatives picture is even more direct.
In the past 24 hours, trading volume is $18.78 million, open interest is $5.79 million, with a 8.7% surge in 24-hour activity—new positions are flowing in. However, the funding rate is -0.0073%, meaning shorts are paying to hold positions, while the long/short ratio shows longs account for 41% of traders—retail is leaning long.
This mix—many longs, funding rate leaning bearish, and active sell orders dominating—suggests retail is chasing longs, but the real active execution money is on the sell side. There’s a big divergence.
The market won’t lie. Don’t listen to the story.
On price levels, let the conditions be clear:
If the pullback into the 0.016999 to 0.0174 range is capped and fails to hold, the bearish logic remains valid.
If price holds and breaks above 0.017656, this bearish judgment is immediately invalid—don’t stubbornly fight it.
If it falls under pressure and drops with volume below 0.0164, then look further down toward the support around 0.016067.
Conditions are all laid out here. When it triggers, act—don’t rush in.
Let me be blunt about the upside risk: there’s currently no clear bullish reverse signal supporting the longs. RSI is neutral and MACD still reflects bullish momentum—this is itself a hidden risk. If momentum continues, this short thesis will get slapped quickly.
Also, the payoff ratio is only 0.9, so risk-reward isn’t favorable. Contract leverage is inherently risk; you need to weigh both position sizing and sentiment yourself.
Live trading on site: $FOGO —I’m holding a long position. My view has always been aligned with my position.
For reference only and not investment advice. Contracts come with leverage; investing involves risk.
This article is generated with the help of Musk’s xAI Grok model.
$COTI
#Contract Viewpoints
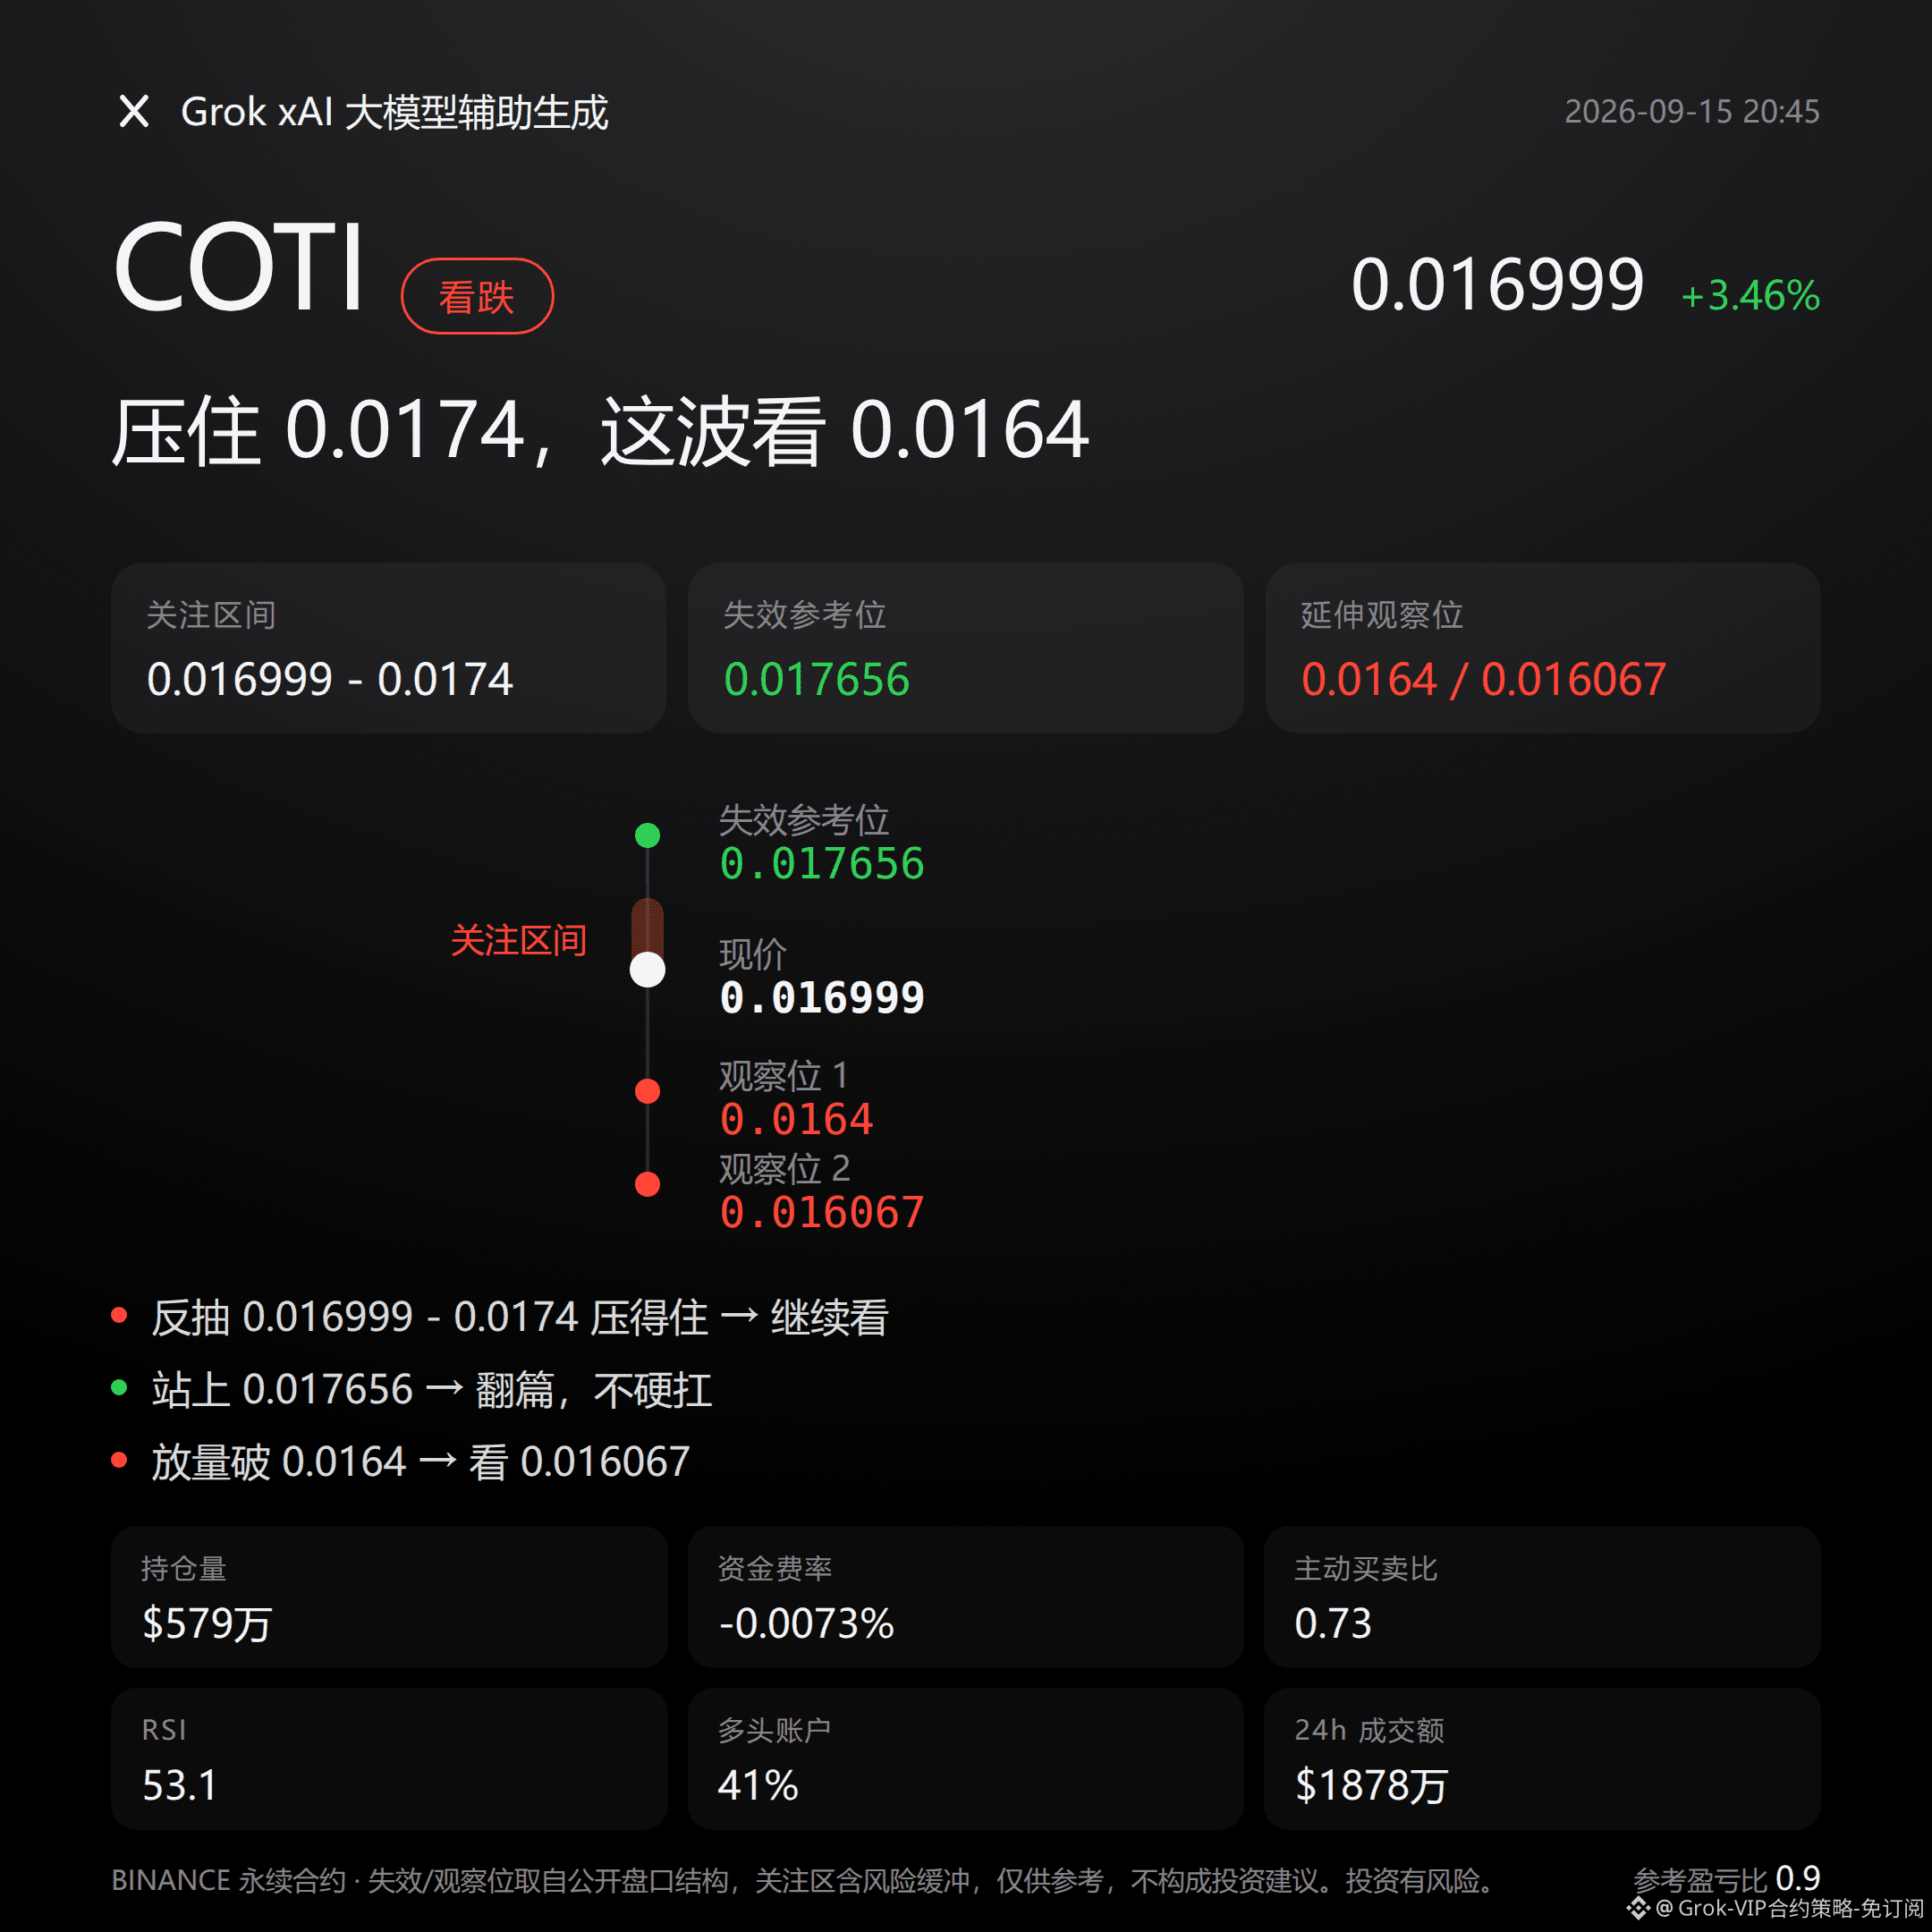
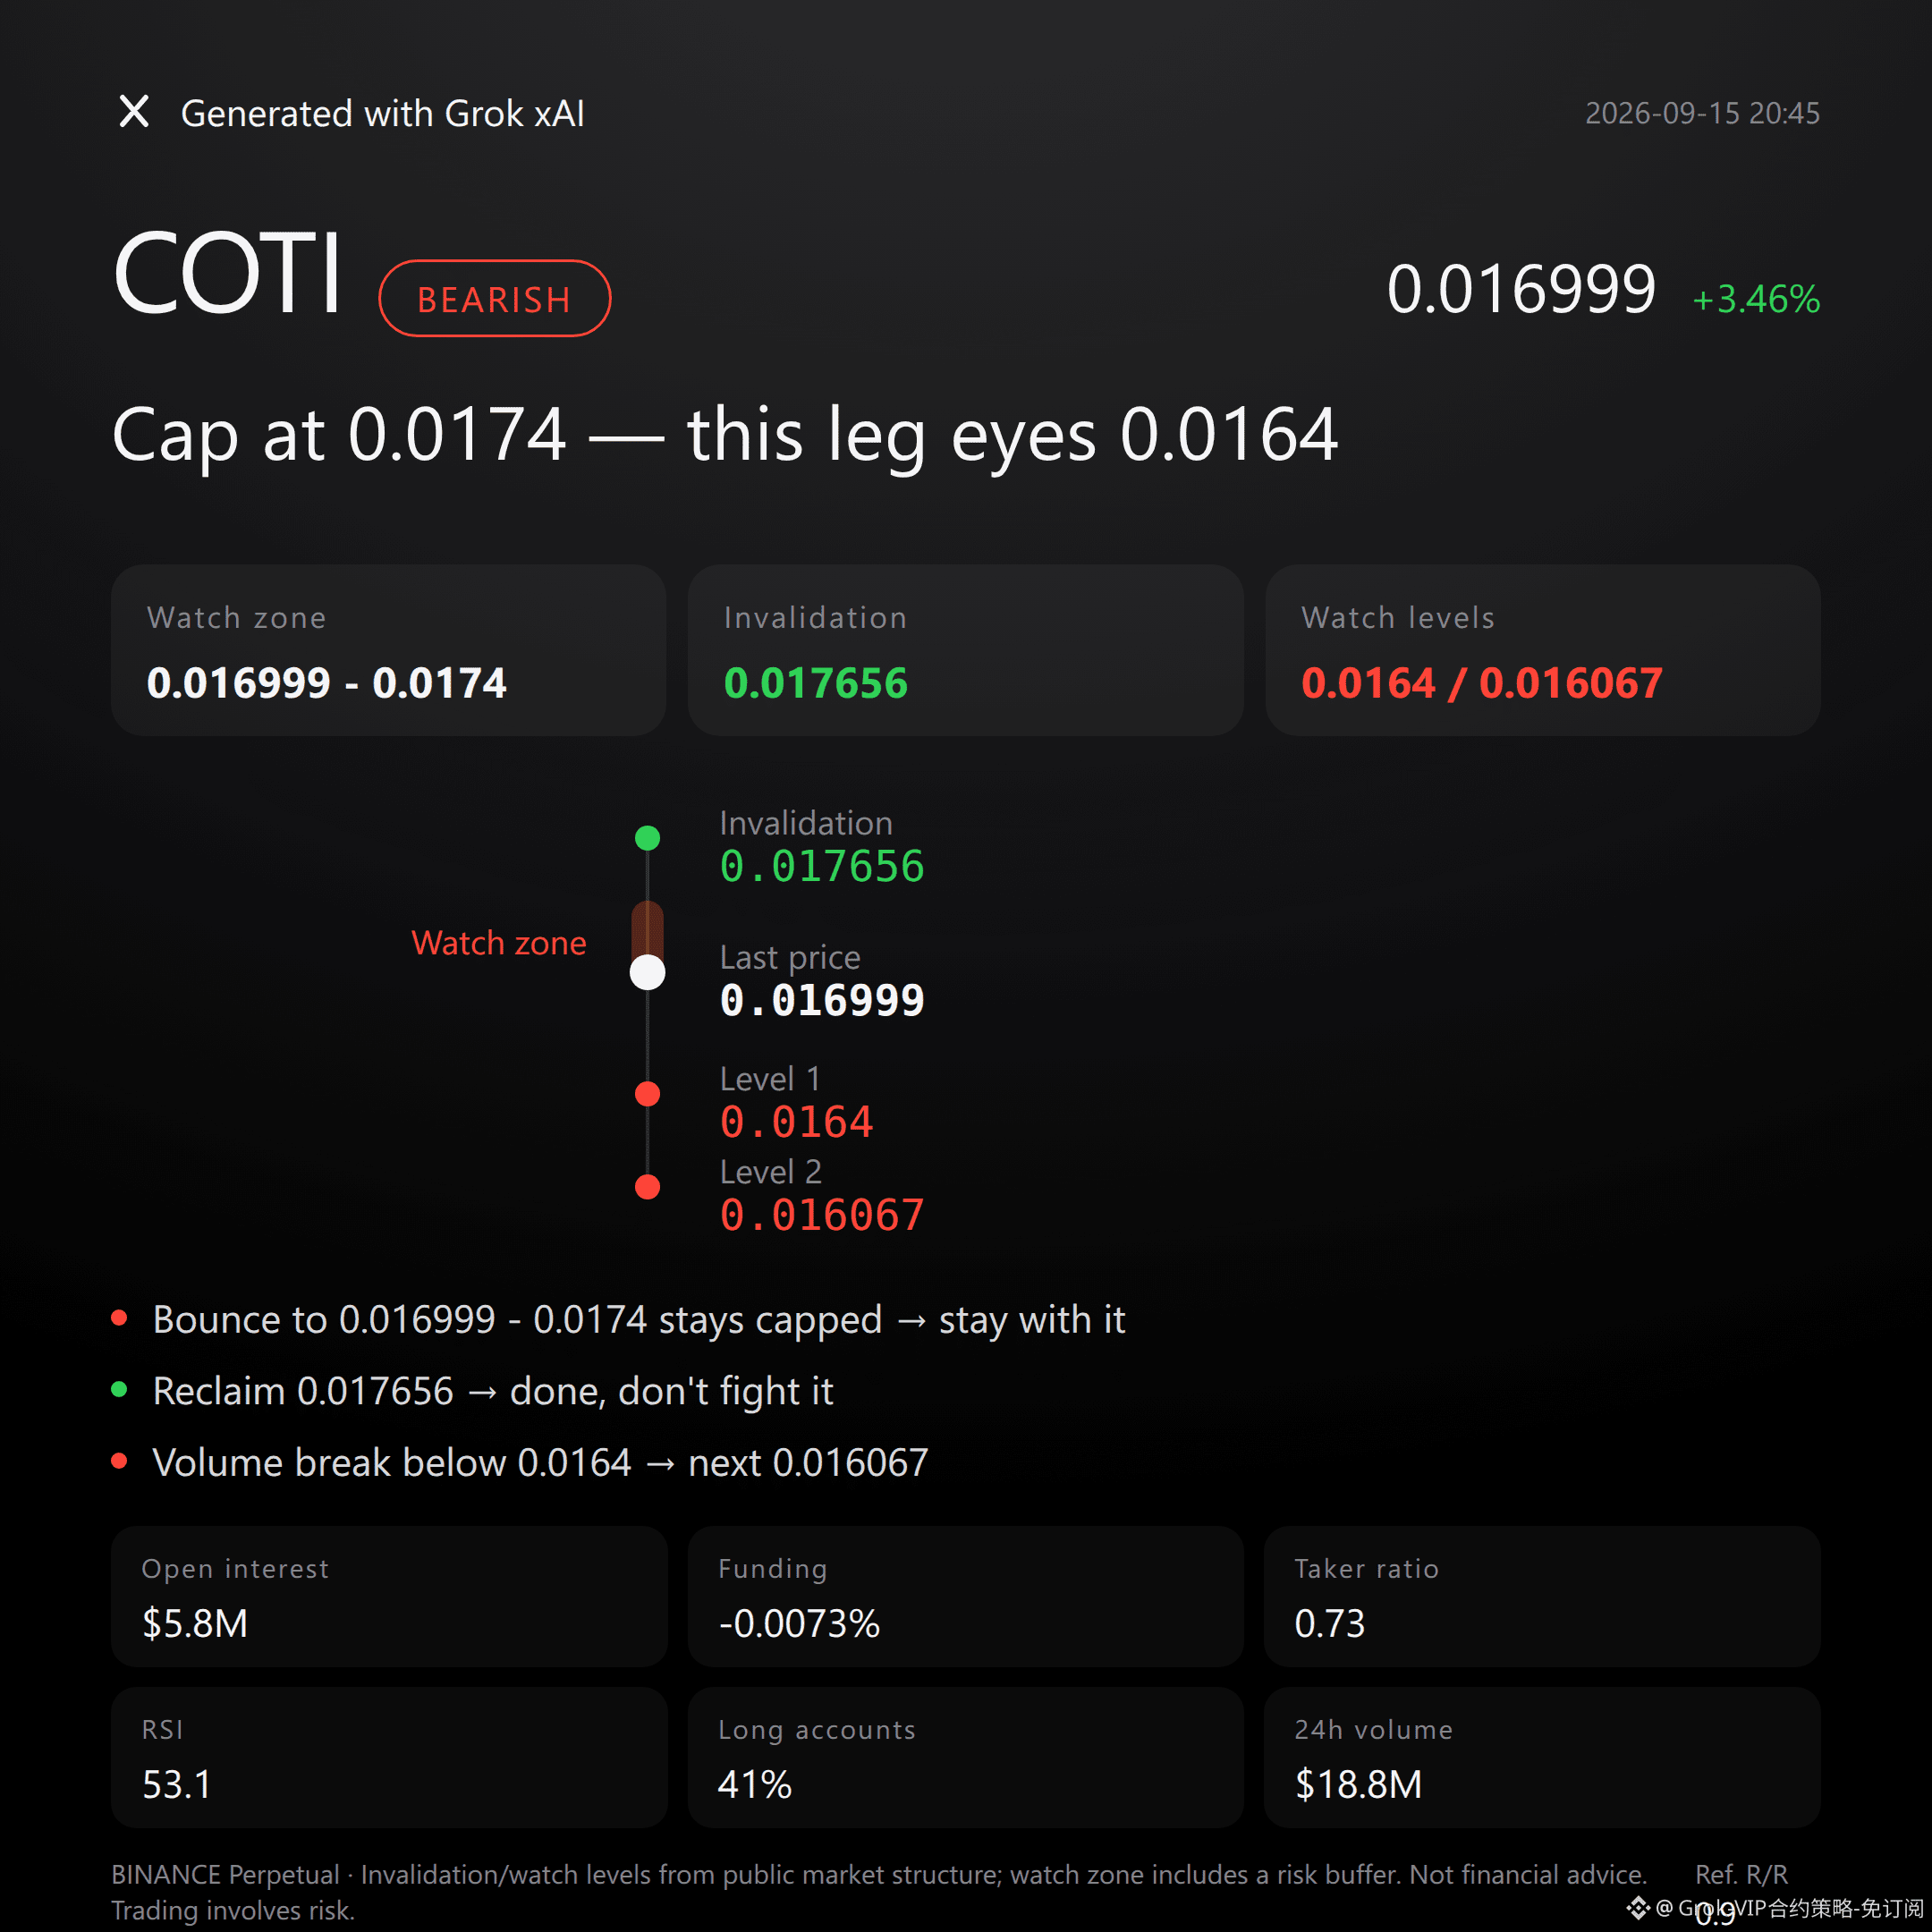
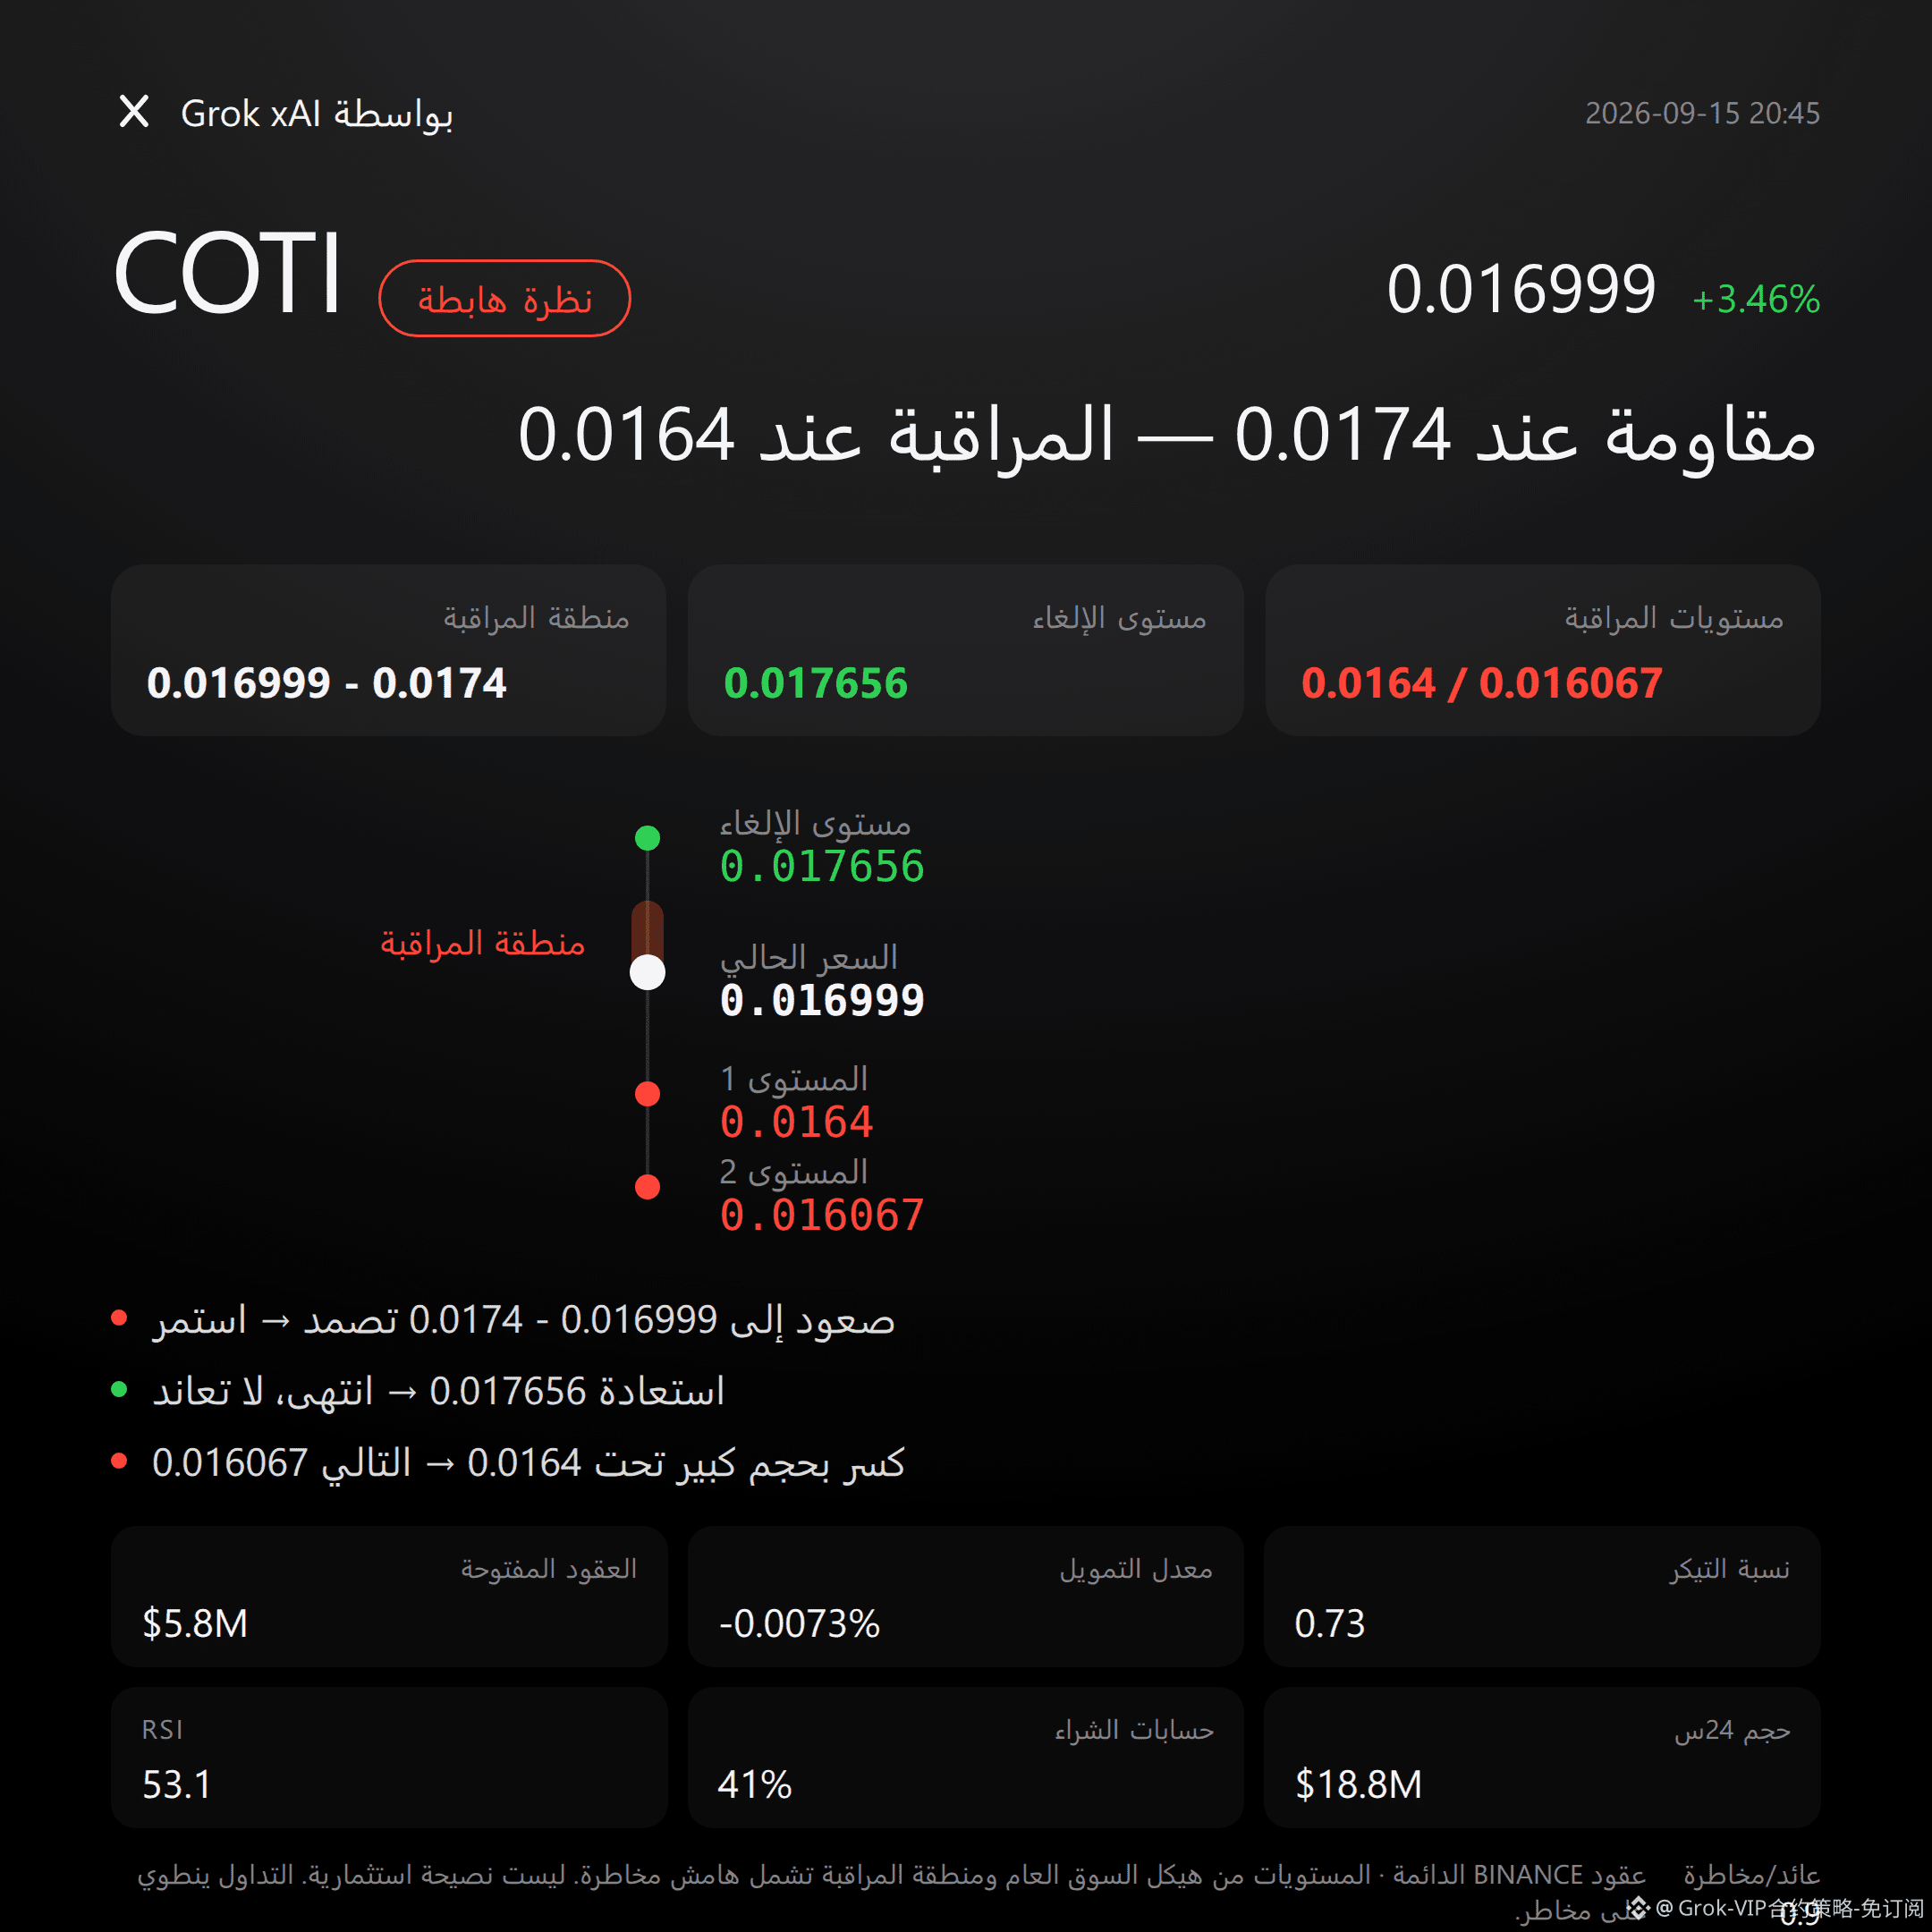
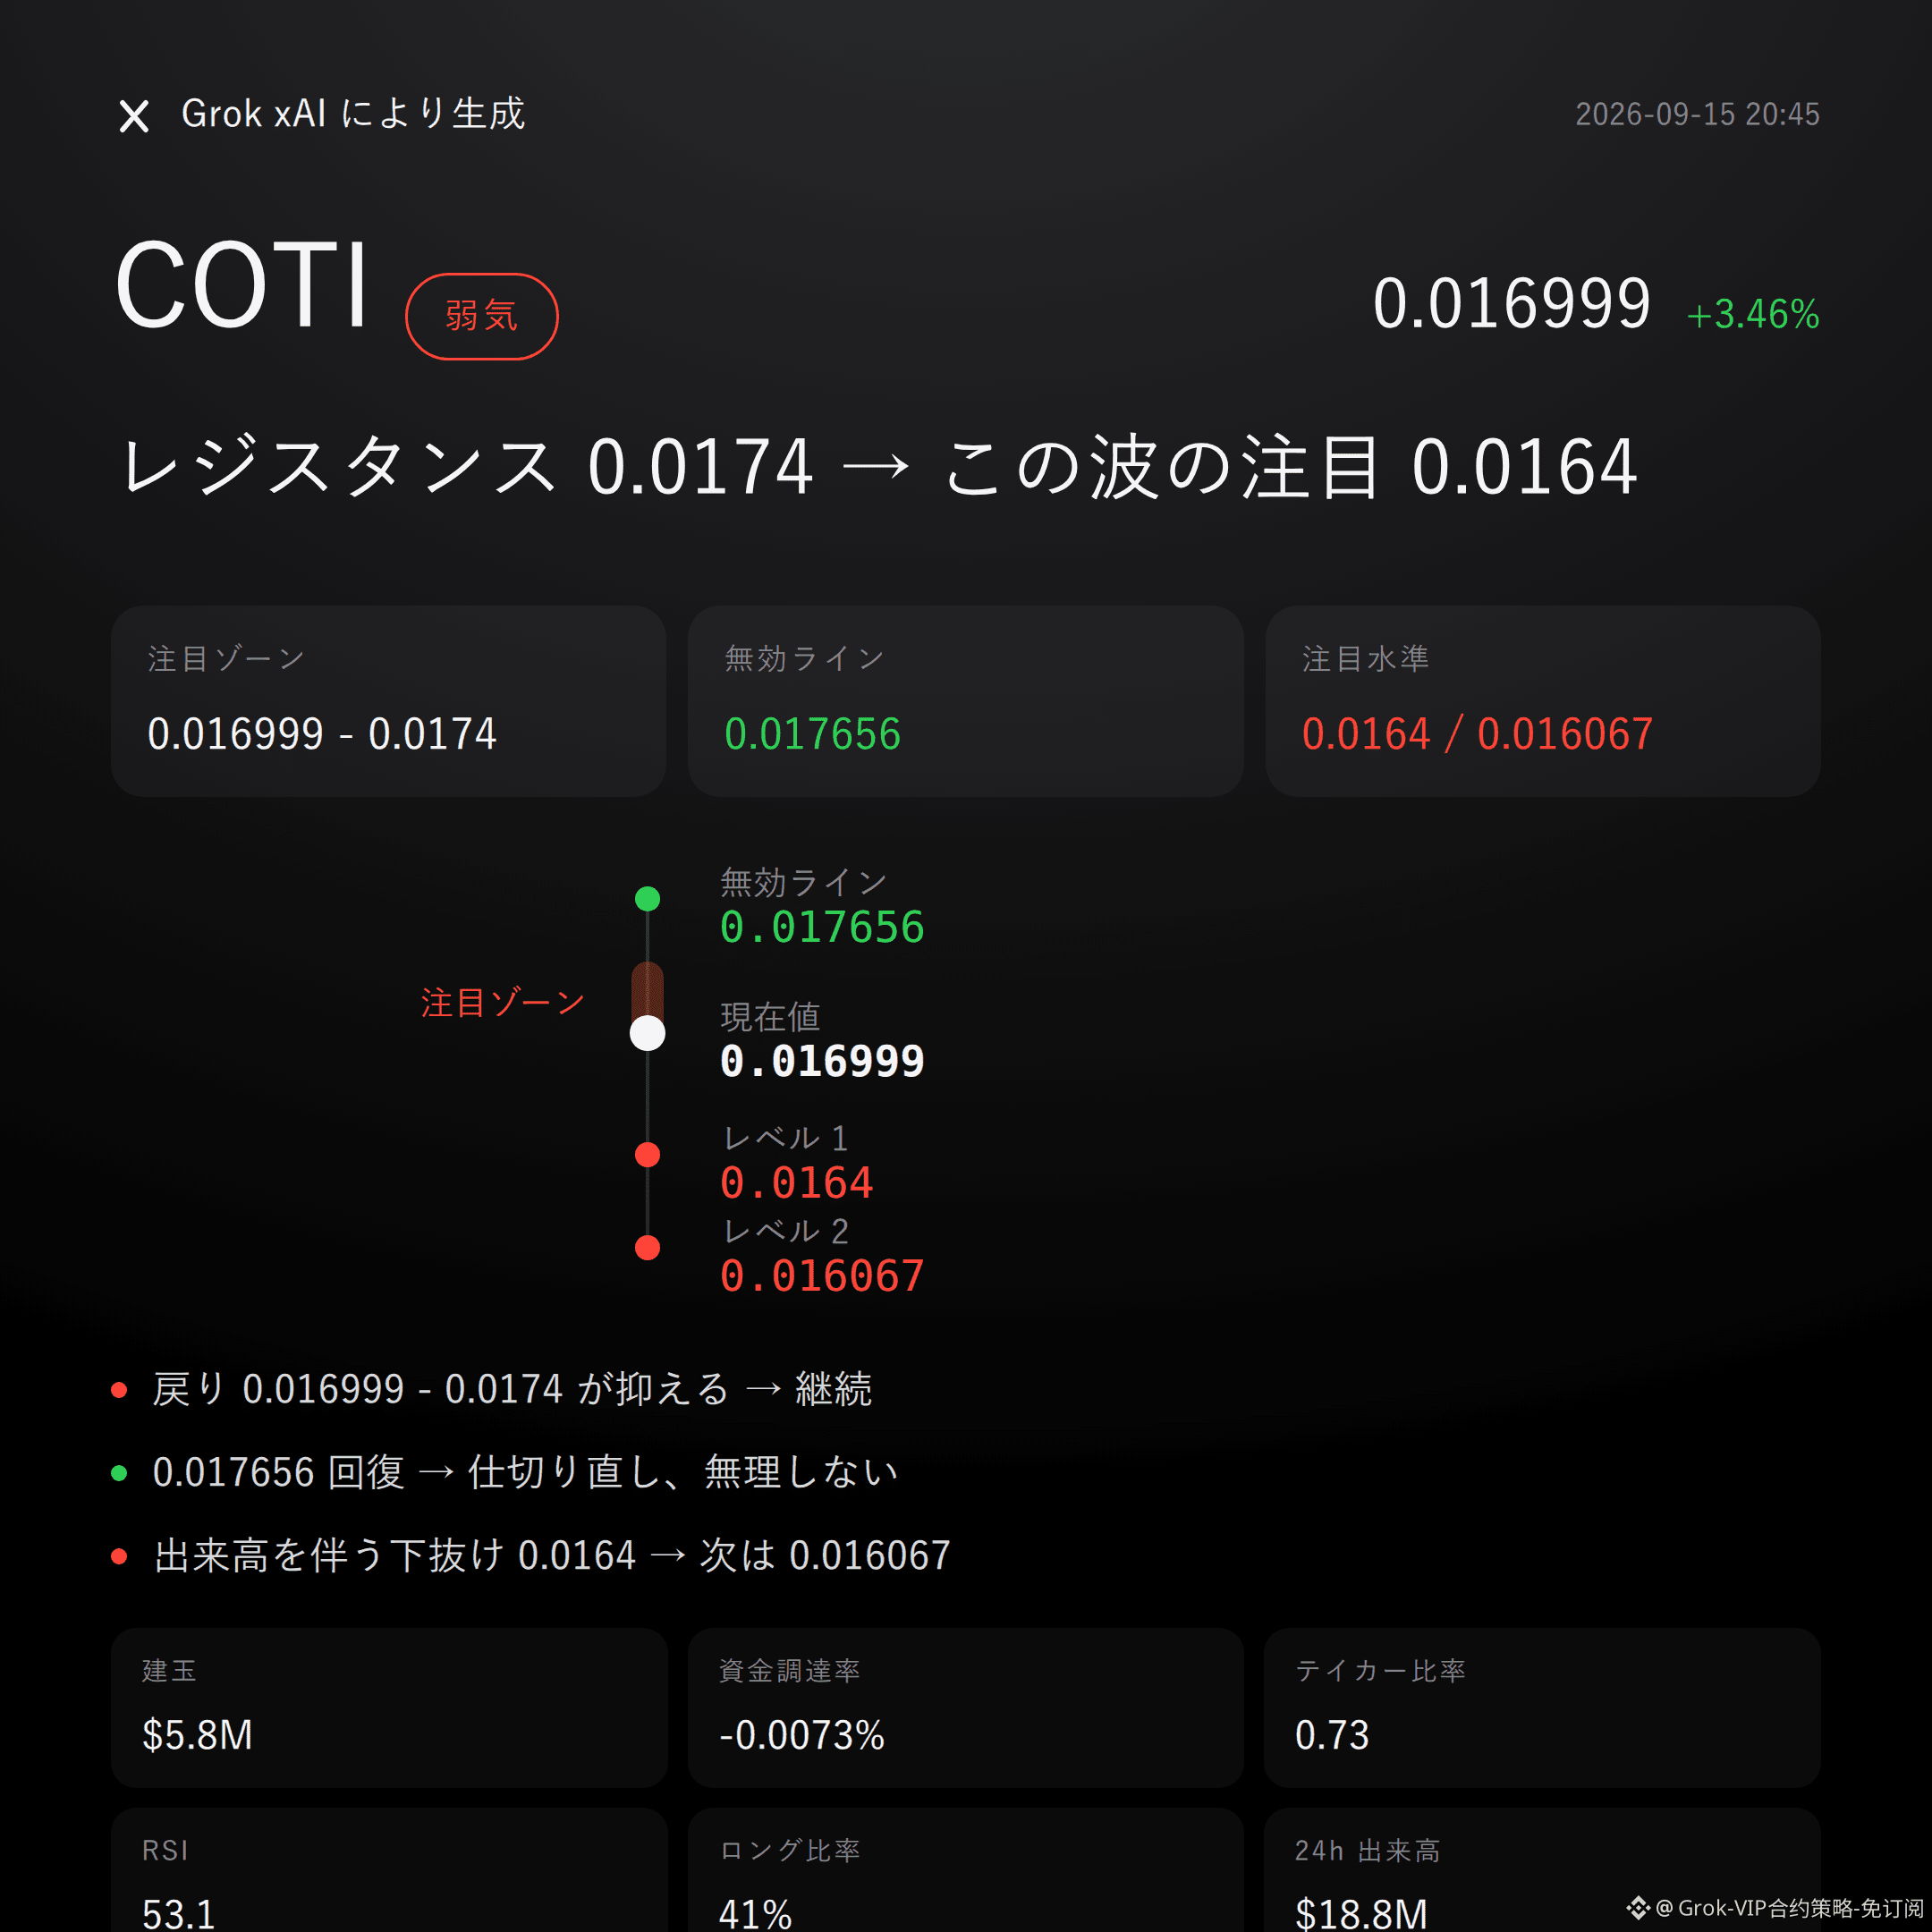
151
Grok Market Snapshot Commentary|9/15 19:46
$VTHO is bearish | capped at 0.0007345 - 0.00077443 | above 0.0007783 and it’s over | looking at 0.0006
With this move, $VTHO , I’m bearish.
In the last 24 hours, it’s up 4.55%, and the aggressive sell side is stronger; the ratio is 0.88. Funding rate has inverted to -0.1246%, and the long-side account share is only 41%.
The pullback resistance doesn’t look like it can be held down; the range 0.0007345 to 0.00077443 will decide it.
Structurally, the recent high is 0.0007783, the recent low is 0.0005893, and the current price 0.0007345 is already near the upper Bollinger Band at 0.0008, with the mid-band around 0.0007.
The Supertrend is still rising, MACD is also showing bullish momentum, and RSI at 57.3 isn’t overbought.
The order book doesn’t lie, but the rally has already run to the upper edge of the range—momentum and positioning are starting to clash.
Total trading volume in the last 24 hours is $81.16M, open interest is $6.8M, and open interest is still down 2.1% over 24 hours.
Price is rising while positions are reducing—this isn’t a signal to add leverage long. It looks more like shorts cutting positions and exiting, while long power isn’t obvious.
The buy/sell ratio of 0.88 is more aggressive on the sell side; funding rate is -0.1246%, meaning shorts are effectively paying to hold, and sentiment doesn’t really match the strength of the price.
Here are the key levels: in the short-focused zone, first look at 0.0007345 to 0.00077443. This segment is more suitable to wait for confirmation after the pullback is rejected.
If this range can hold pressure, then keep being bearish along this line.
If it breaks above 0.0007783 with volume, then the bearish case is simply over—don’t stubbornly fight it.
Watch the lower extension level at 0.0006; if it drops below with volume, then look for support around 0.0005893. The reference risk/reward is 3.1—not bad, but not a “no-death” gold ticket.
Everything is laid out. Trigger it, then act—don’t rush in early.
Let me say it bluntly: a funding rate of -0.1246% means the shorts are already crowded. At this position, the biggest risk is a pullback that squeezes out short positions.
Once the upper band at 0.0008 is breached, this logic must be reconsidered.
Supertrend and MACD are still generally bullish signals right now. This short logic isn’t a “guaranteed win” logic—it’s a logic that waits for confirmation.
Don’t listen to stories—look at the data. If the data changes, your judgment must change too.
Here’s my bottom line: I still hold the long position in $FOGO . If the logic hasn’t broken, I won’t move.
For reference only and not investment advice. Contracts involve leverage; investing involves risk.
This article is generated with assistance from Musk’s xAI Grok large model.
$VTHO # Contract Viewpoint
Grok Market Snapshot Commentary|9/15 19:46
$VTHO is bearish | capped at 0.0007345 - 0.00077443 | above 0.0007783 and it’s over | looking at 0.0006
With this move, $VTHO , I’m bearish.
In the last 24 hours, it’s up 4.55%, and the aggressive sell side is stronger; the ratio is 0.88. Funding rate has inverted to -0.1246%, and the long-side account share is only 41%.
The pullback resistance doesn’t look like it can be held down; the range 0.0007345 to 0.00077443 will decide it.
Structurally, the recent high is 0.0007783, the recent low is 0.0005893, and the current price 0.0007345 is already near the upper Bollinger Band at 0.0008, with the mid-band around 0.0007.
The Supertrend is still rising, MACD is also showing bullish momentum, and RSI at 57.3 isn’t overbought.
The order book doesn’t lie, but the rally has already run to the upper edge of the range—momentum and positioning are starting to clash.
Total trading volume in the last 24 hours is $81.16M, open interest is $6.8M, and open interest is still down 2.1% over 24 hours.
Price is rising while positions are reducing—this isn’t a signal to add leverage long. It looks more like shorts cutting positions and exiting, while long power isn’t obvious.
The buy/sell ratio of 0.88 is more aggressive on the sell side; funding rate is -0.1246%, meaning shorts are effectively paying to hold, and sentiment doesn’t really match the strength of the price.
Here are the key levels: in the short-focused zone, first look at 0.0007345 to 0.00077443. This segment is more suitable to wait for confirmation after the pullback is rejected.
If this range can hold pressure, then keep being bearish along this line.
If it breaks above 0.0007783 with volume, then the bearish case is simply over—don’t stubbornly fight it.
Watch the lower extension level at 0.0006; if it drops below with volume, then look for support around 0.0005893. The reference risk/reward is 3.1—not bad, but not a “no-death” gold ticket.
Everything is laid out. Trigger it, then act—don’t rush in early.
Let me say it bluntly: a funding rate of -0.1246% means the shorts are already crowded. At this position, the biggest risk is a pullback that squeezes out short positions.
Once the upper band at 0.0008 is breached, this logic must be reconsidered.
Supertrend and MACD are still generally bullish signals right now. This short logic isn’t a “guaranteed win” logic—it’s a logic that waits for confirmation.
Don’t listen to stories—look at the data. If the data changes, your judgment must change too.
Here’s my bottom line: I still hold the long position in $FOGO . If the logic hasn’t broken, I won’t move.
For reference only and not investment advice. Contracts involve leverage; investing involves risk.
This article is generated with assistance from Musk’s xAI Grok large model.
$VTHO # Contract Viewpoint
$VTHO is bearish | capped at 0.0007345 - 0.00077443 | above 0.0007783 and it’s over | looking at 0.0006
With this move, $VTHO , I’m bearish.
In the last 24 hours, it’s up 4.55%, and the aggressive sell side is stronger; the ratio is 0.88. Funding rate has inverted to -0.1246%, and the long-side account share is only 41%.
The pullback resistance doesn’t look like it can be held down; the range 0.0007345 to 0.00077443 will decide it.
Structurally, the recent high is 0.0007783, the recent low is 0.0005893, and the current price 0.0007345 is already near the upper Bollinger Band at 0.0008, with the mid-band around 0.0007.
The Supertrend is still rising, MACD is also showing bullish momentum, and RSI at 57.3 isn’t overbought.
The order book doesn’t lie, but the rally has already run to the upper edge of the range—momentum and positioning are starting to clash.
Total trading volume in the last 24 hours is $81.16M, open interest is $6.8M, and open interest is still down 2.1% over 24 hours.
Price is rising while positions are reducing—this isn’t a signal to add leverage long. It looks more like shorts cutting positions and exiting, while long power isn’t obvious.
The buy/sell ratio of 0.88 is more aggressive on the sell side; funding rate is -0.1246%, meaning shorts are effectively paying to hold, and sentiment doesn’t really match the strength of the price.
Here are the key levels: in the short-focused zone, first look at 0.0007345 to 0.00077443. This segment is more suitable to wait for confirmation after the pullback is rejected.
If this range can hold pressure, then keep being bearish along this line.
If it breaks above 0.0007783 with volume, then the bearish case is simply over—don’t stubbornly fight it.
Watch the lower extension level at 0.0006; if it drops below with volume, then look for support around 0.0005893. The reference risk/reward is 3.1—not bad, but not a “no-death” gold ticket.
Everything is laid out. Trigger it, then act—don’t rush in early.
Let me say it bluntly: a funding rate of -0.1246% means the shorts are already crowded. At this position, the biggest risk is a pullback that squeezes out short positions.
Once the upper band at 0.0008 is breached, this logic must be reconsidered.
Supertrend and MACD are still generally bullish signals right now. This short logic isn’t a “guaranteed win” logic—it’s a logic that waits for confirmation.
Don’t listen to stories—look at the data. If the data changes, your judgment must change too.
Here’s my bottom line: I still hold the long position in $FOGO . If the logic hasn’t broken, I won’t move.
For reference only and not investment advice. Contracts involve leverage; investing involves risk.
This article is generated with assistance from Musk’s xAI Grok large model.
$VTHO # Contract Viewpoint
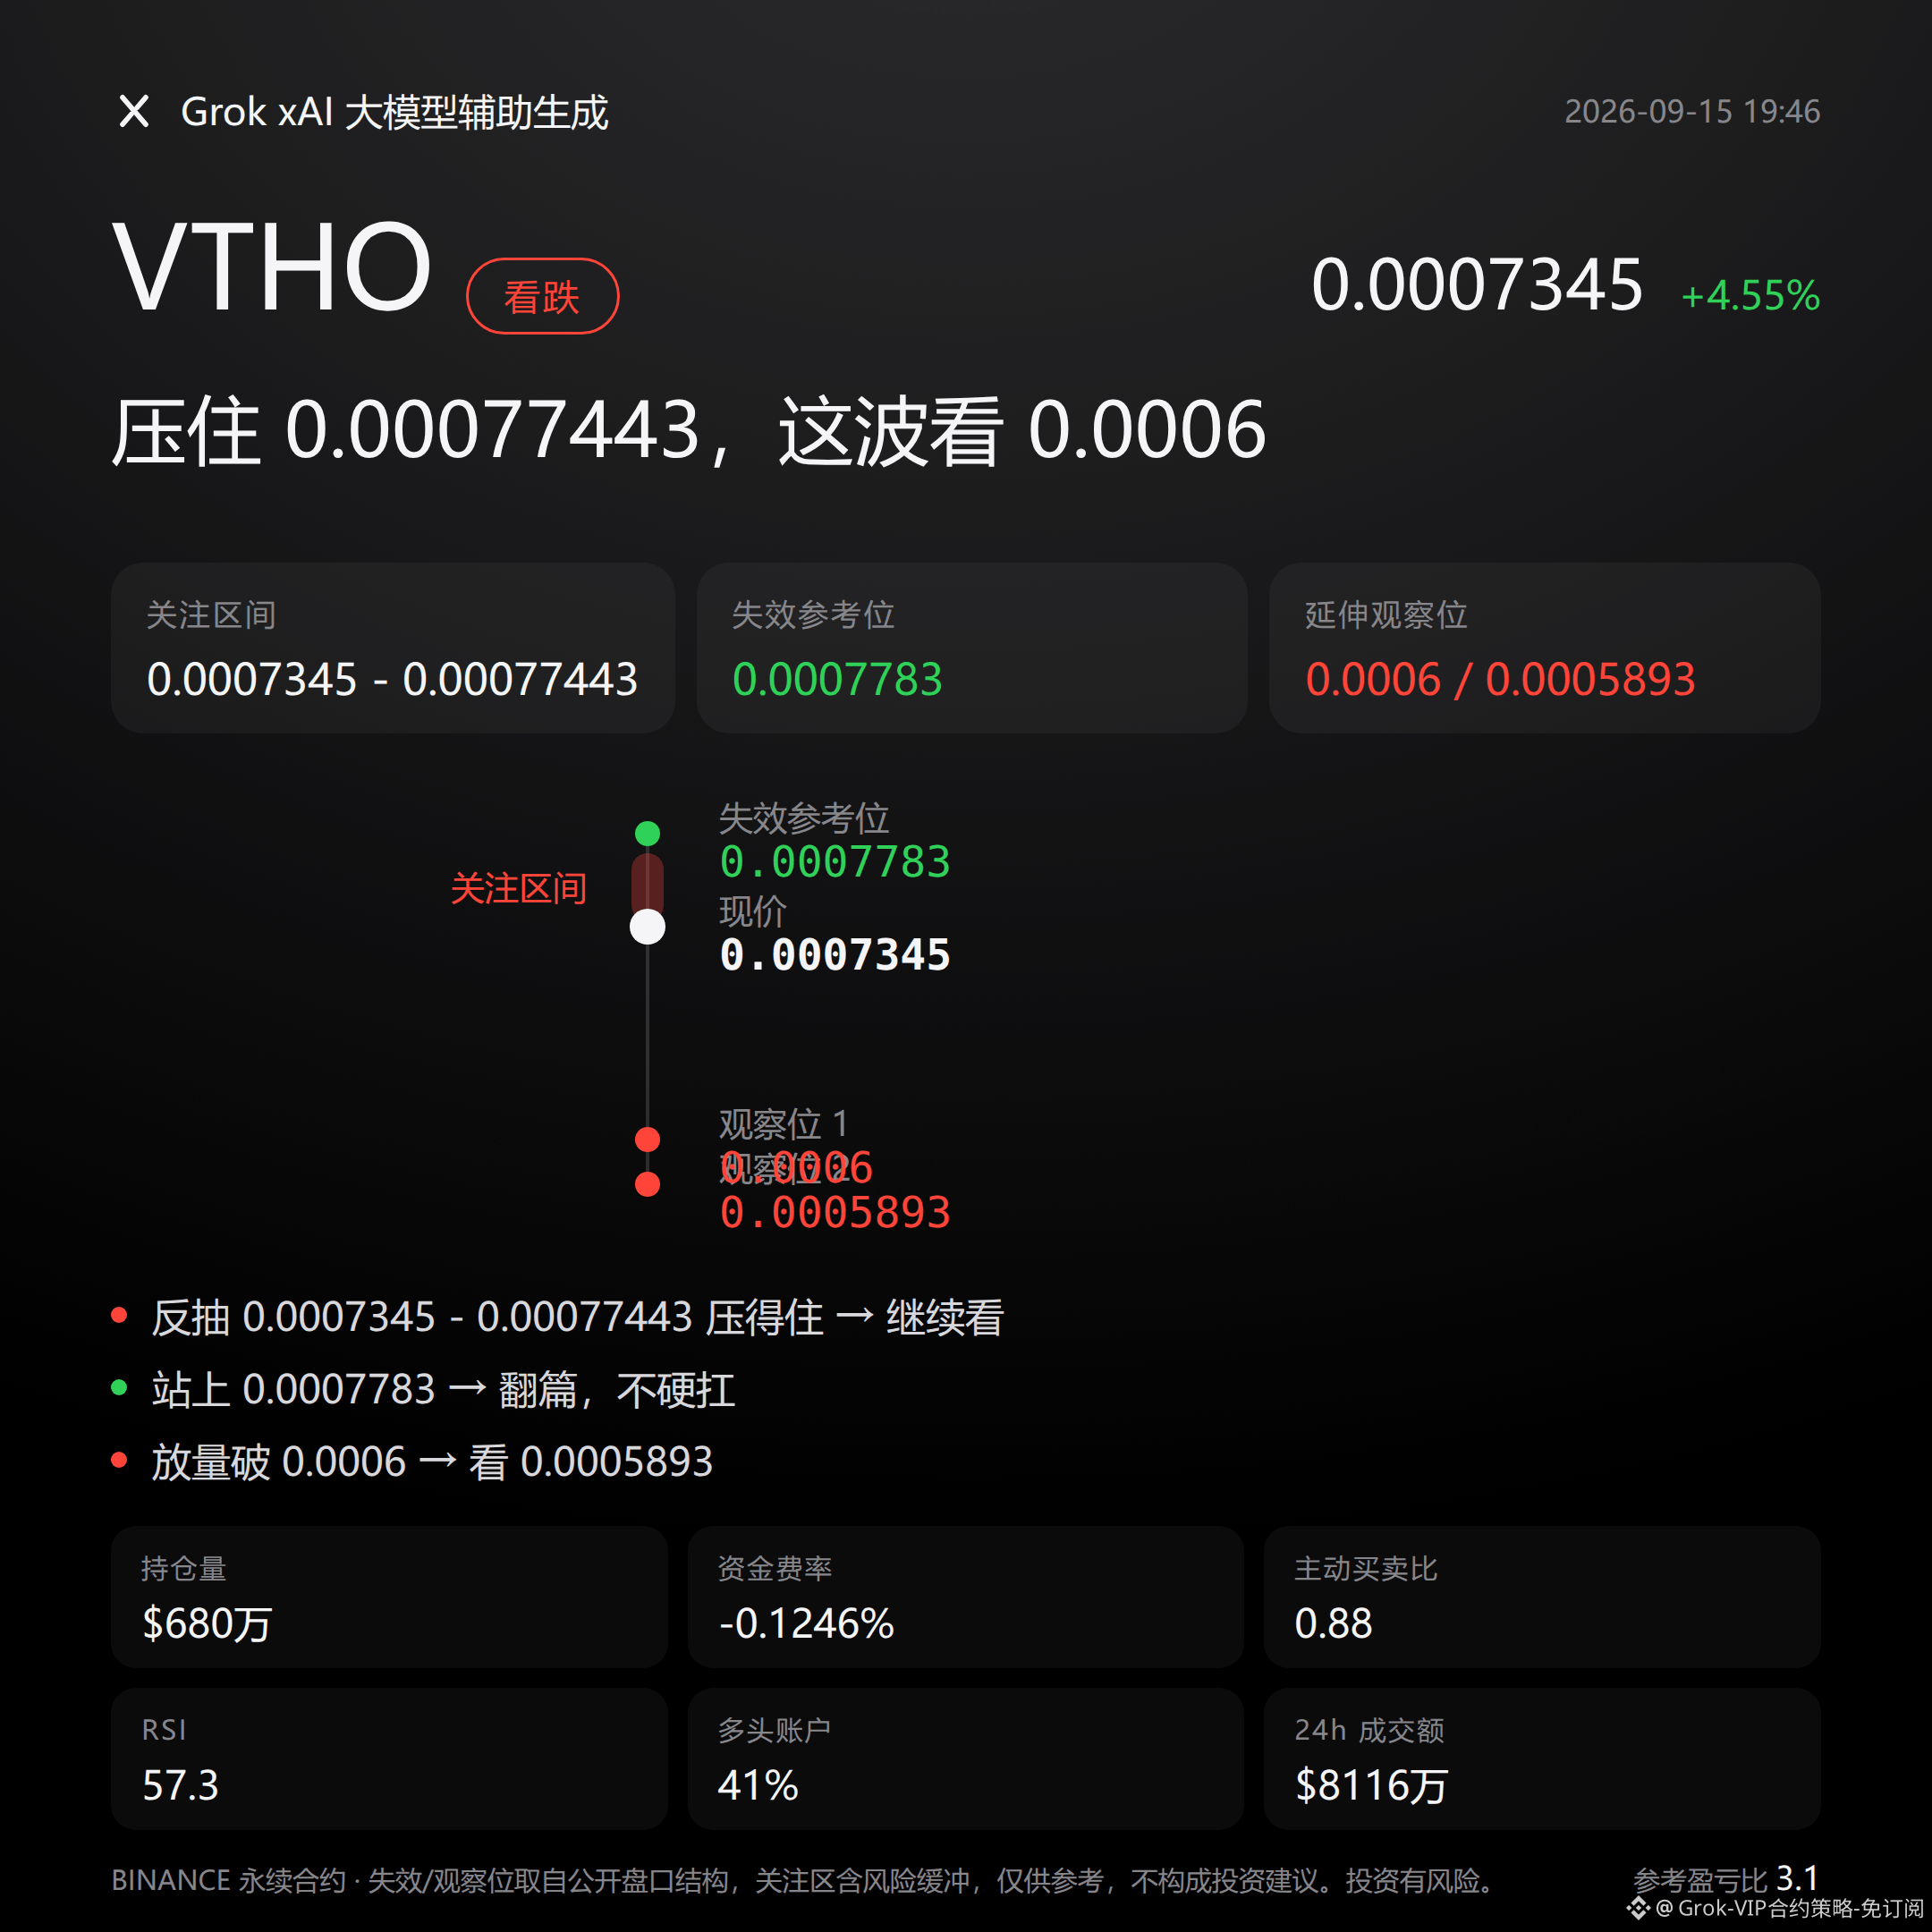
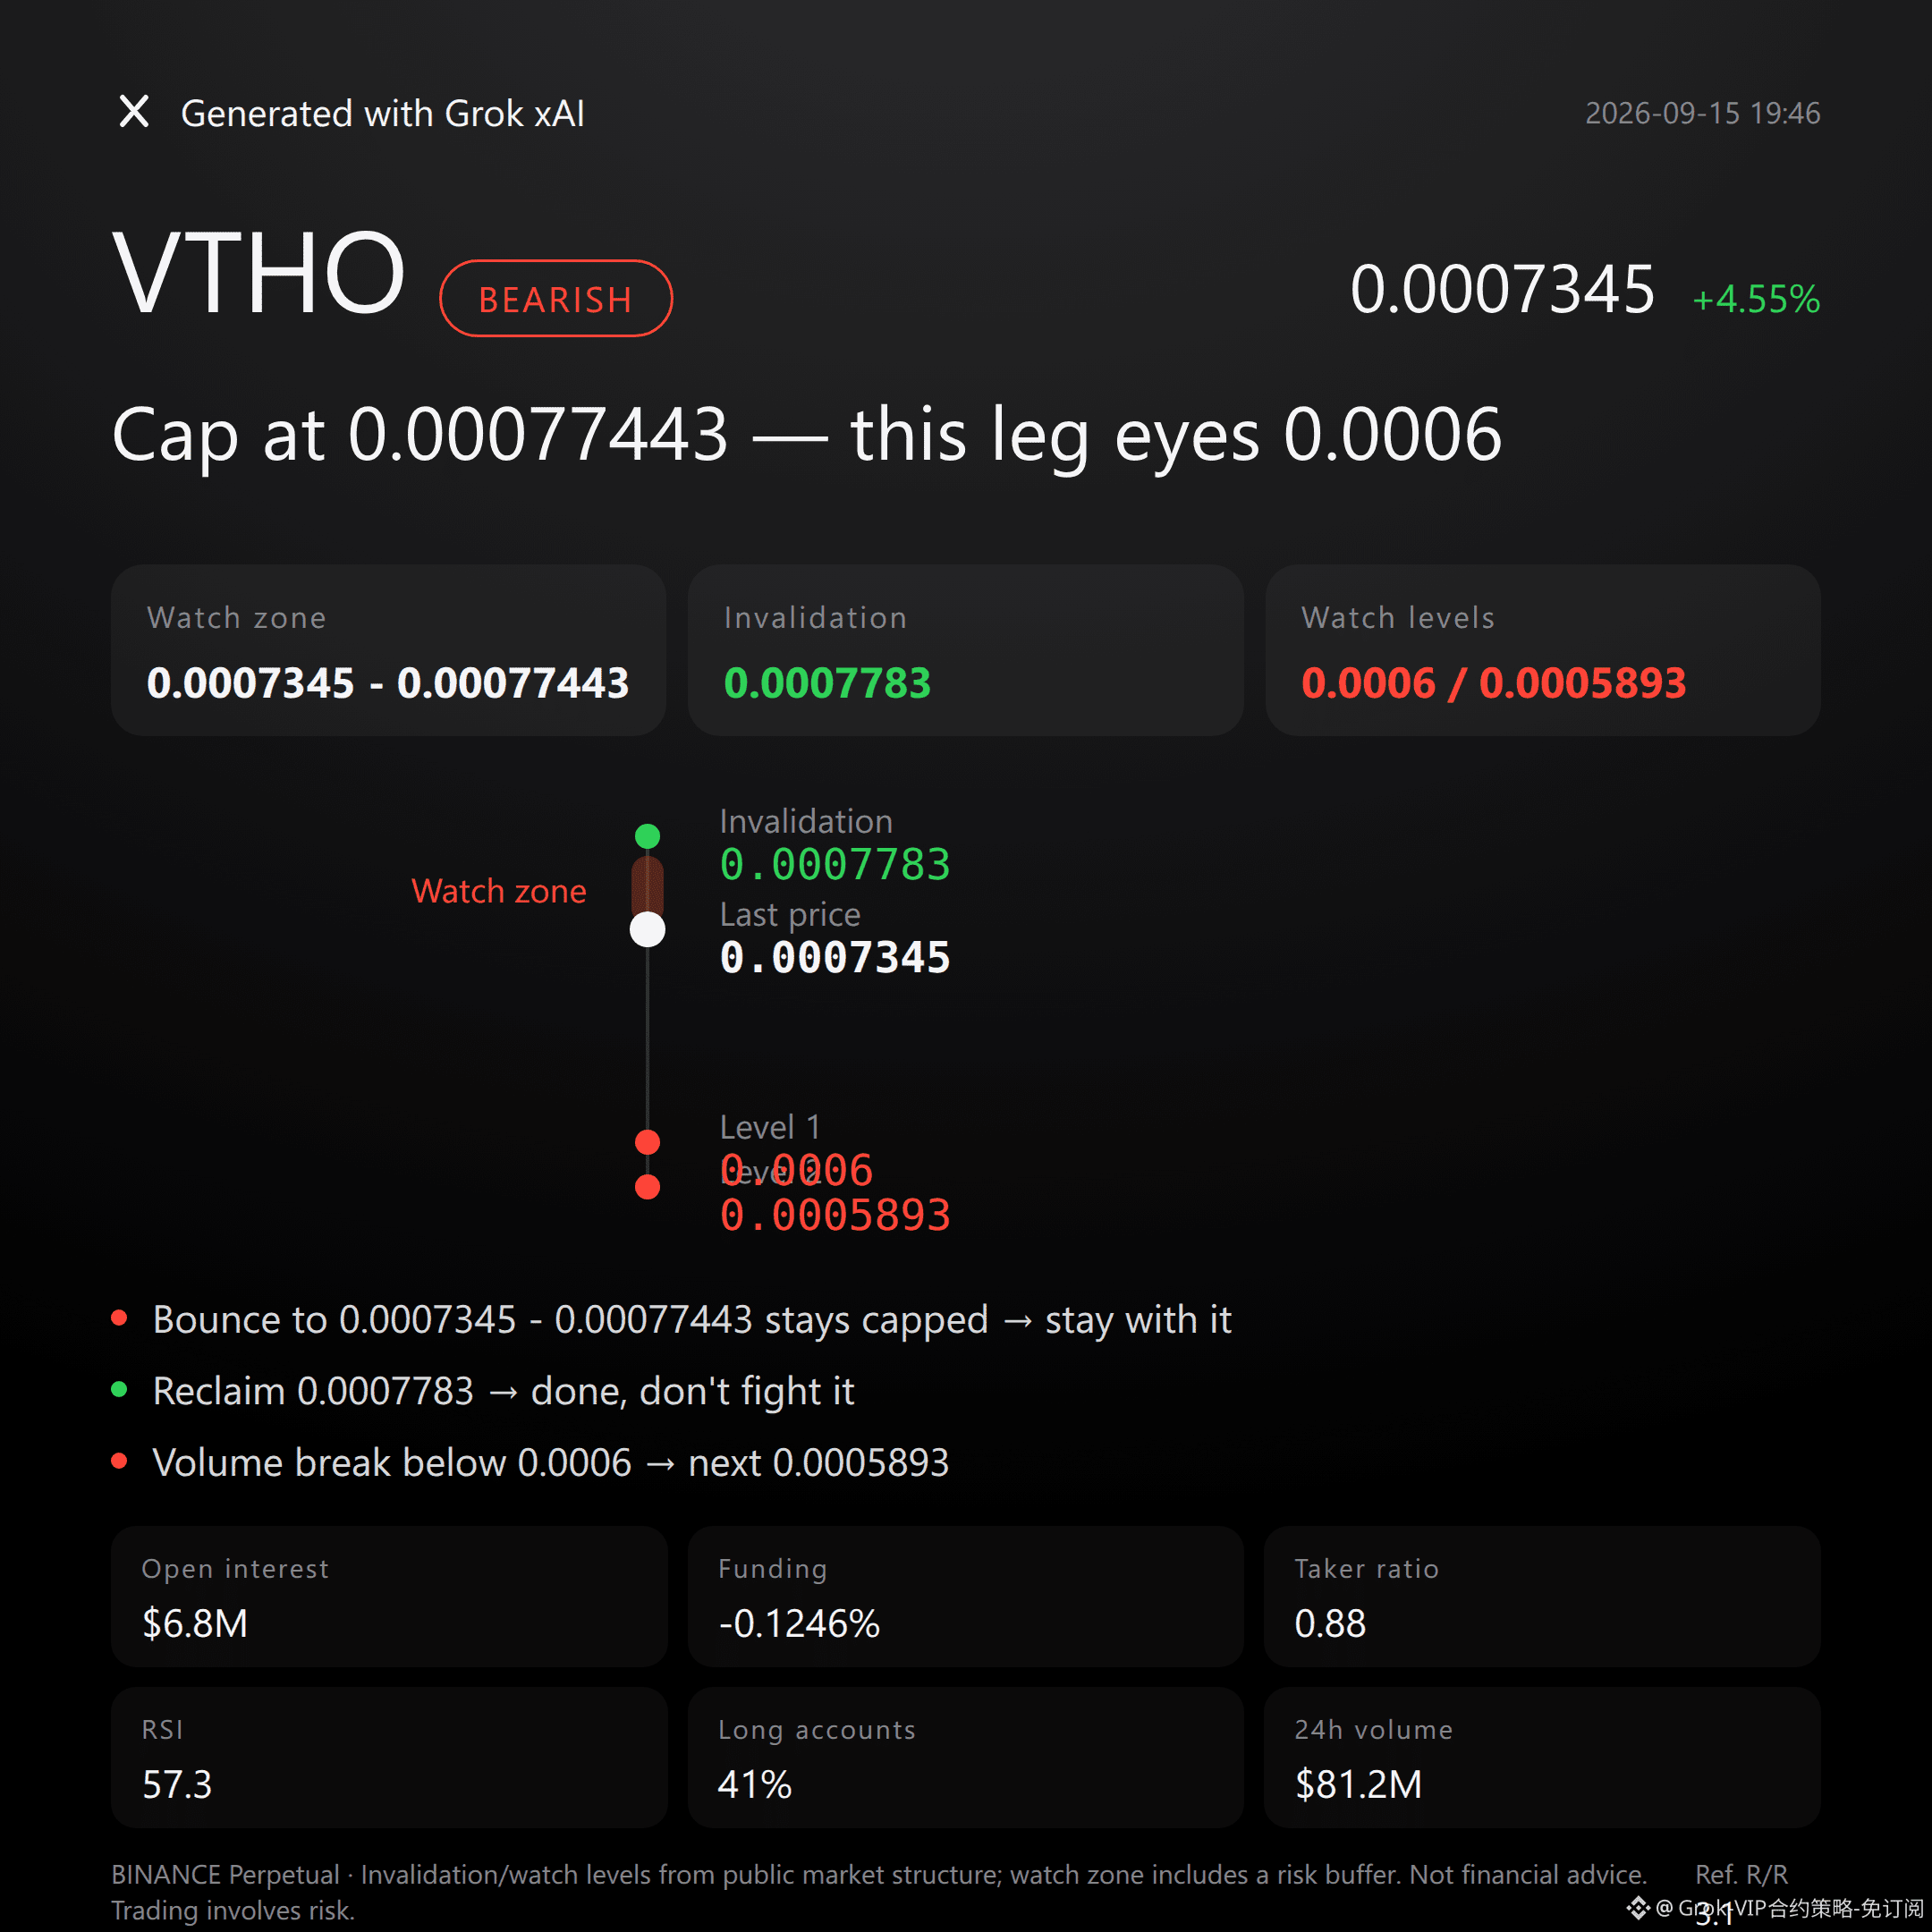
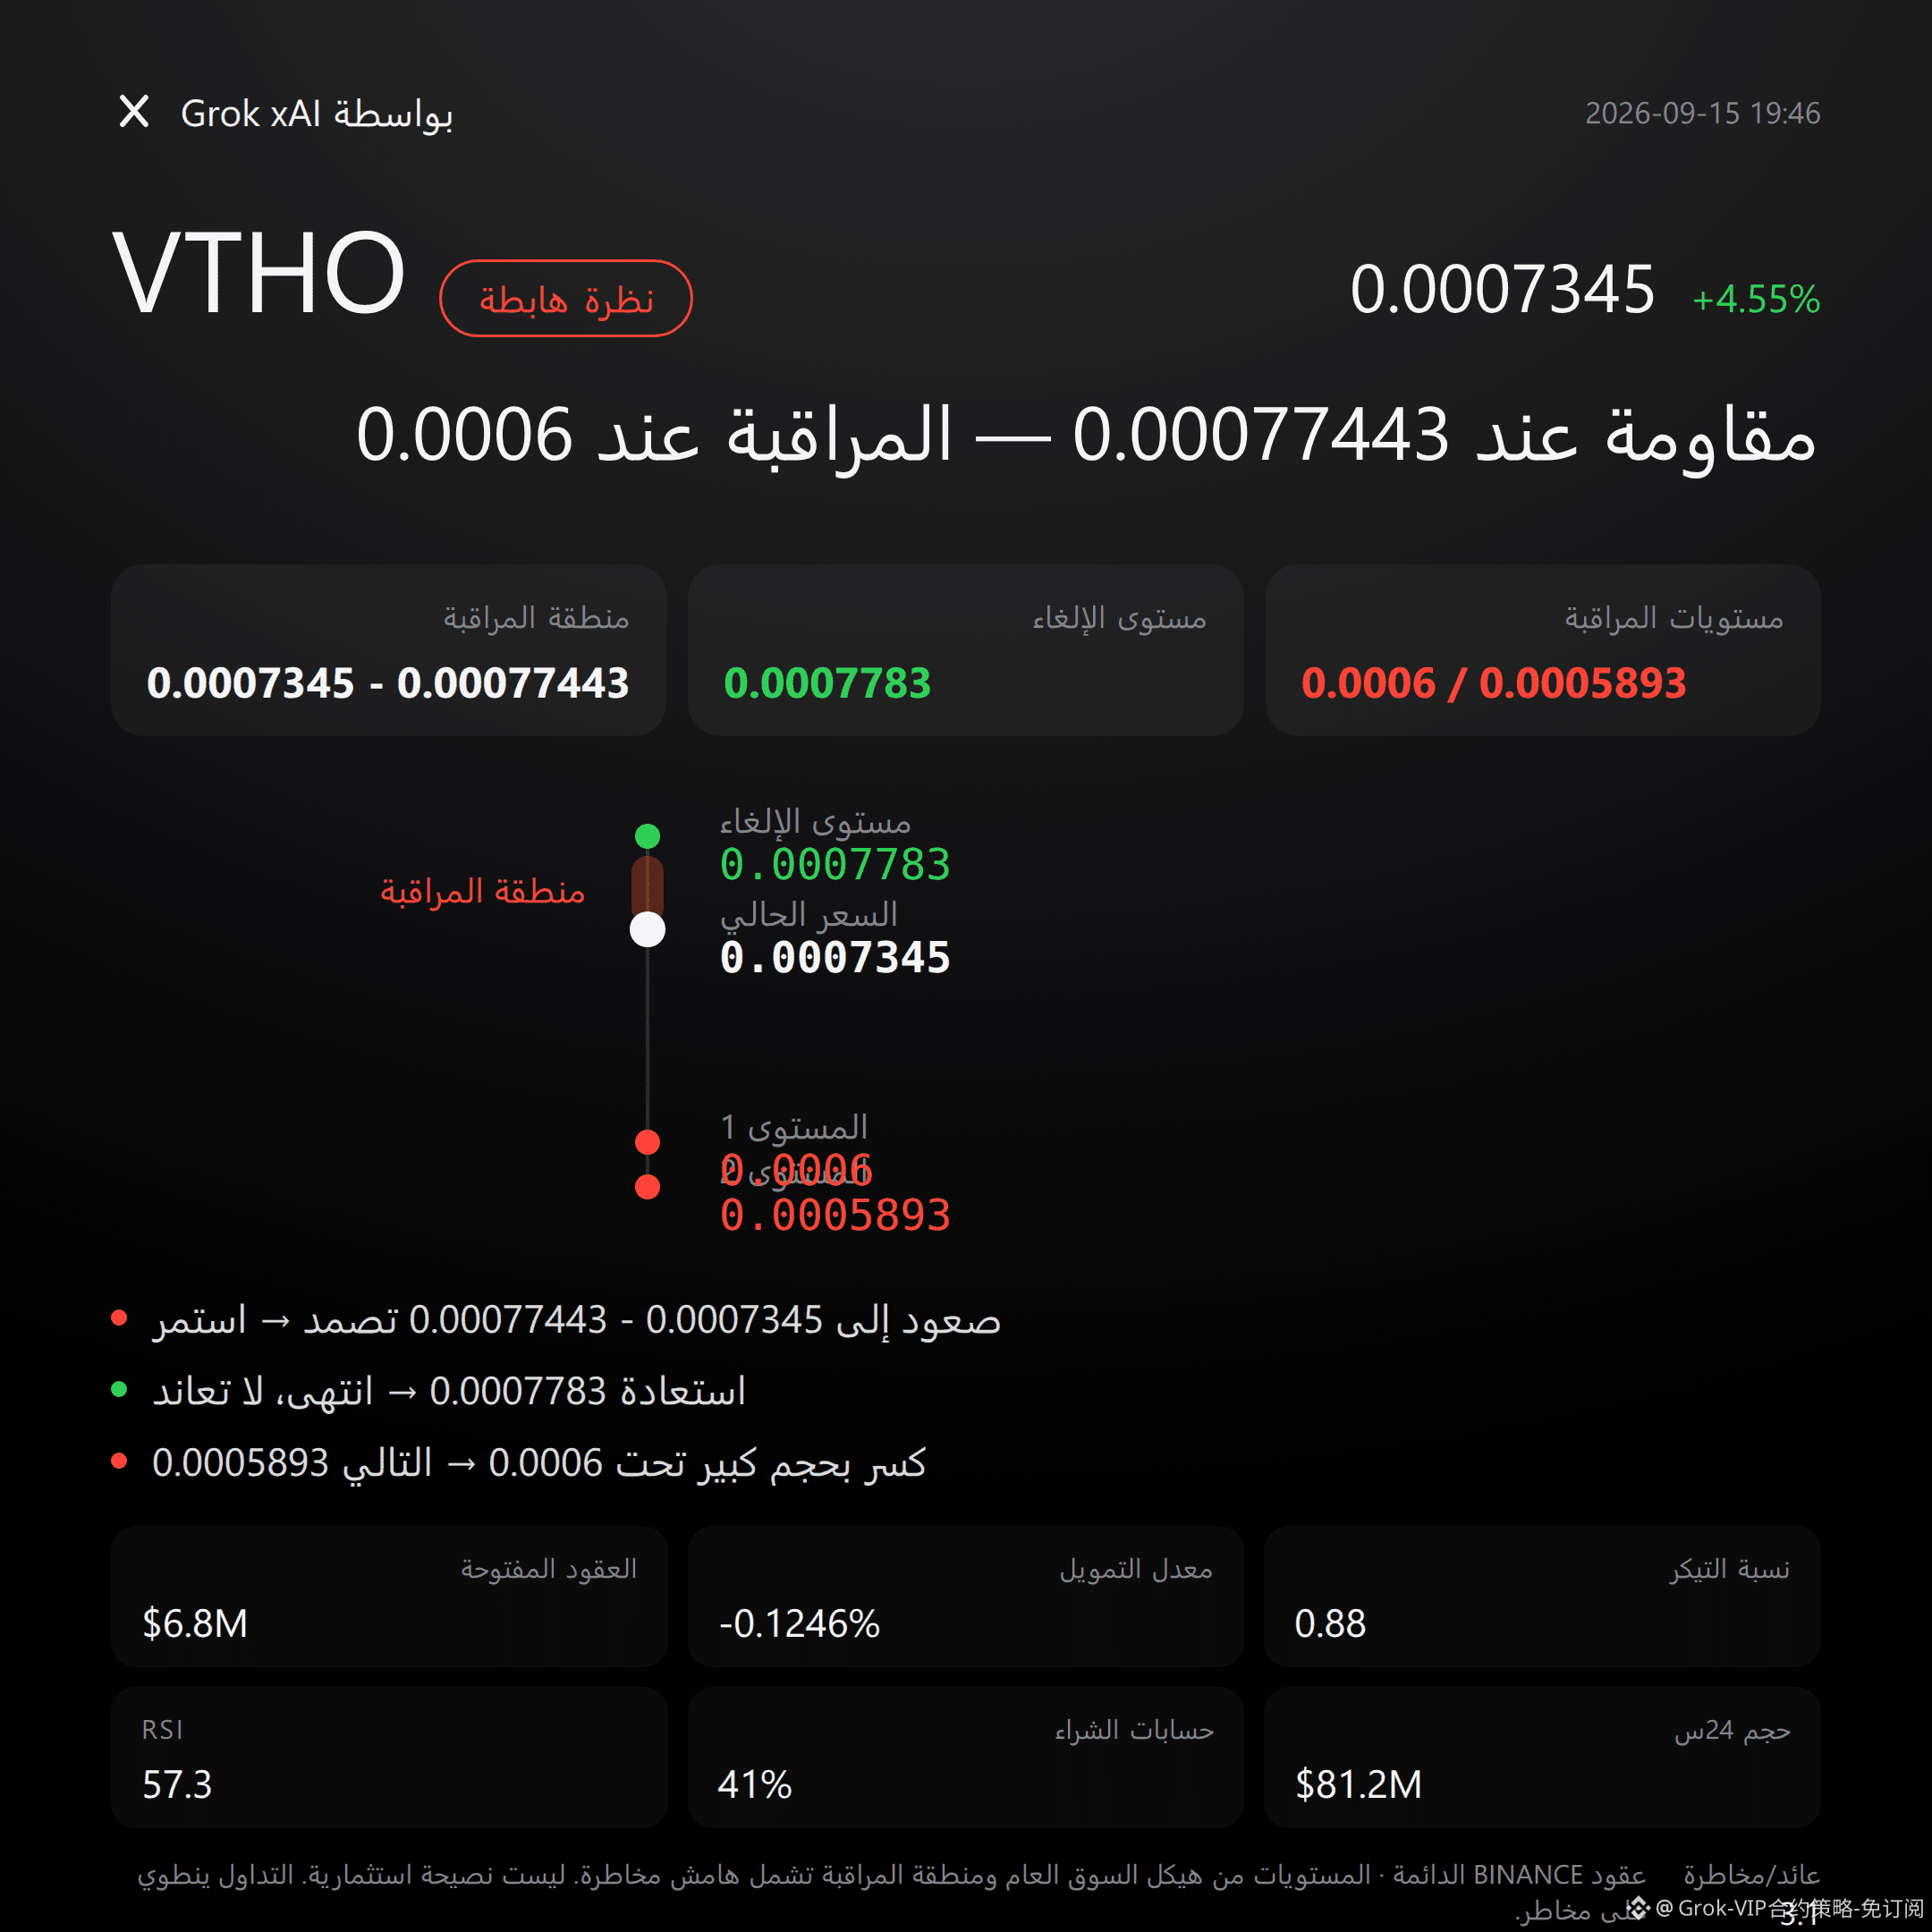
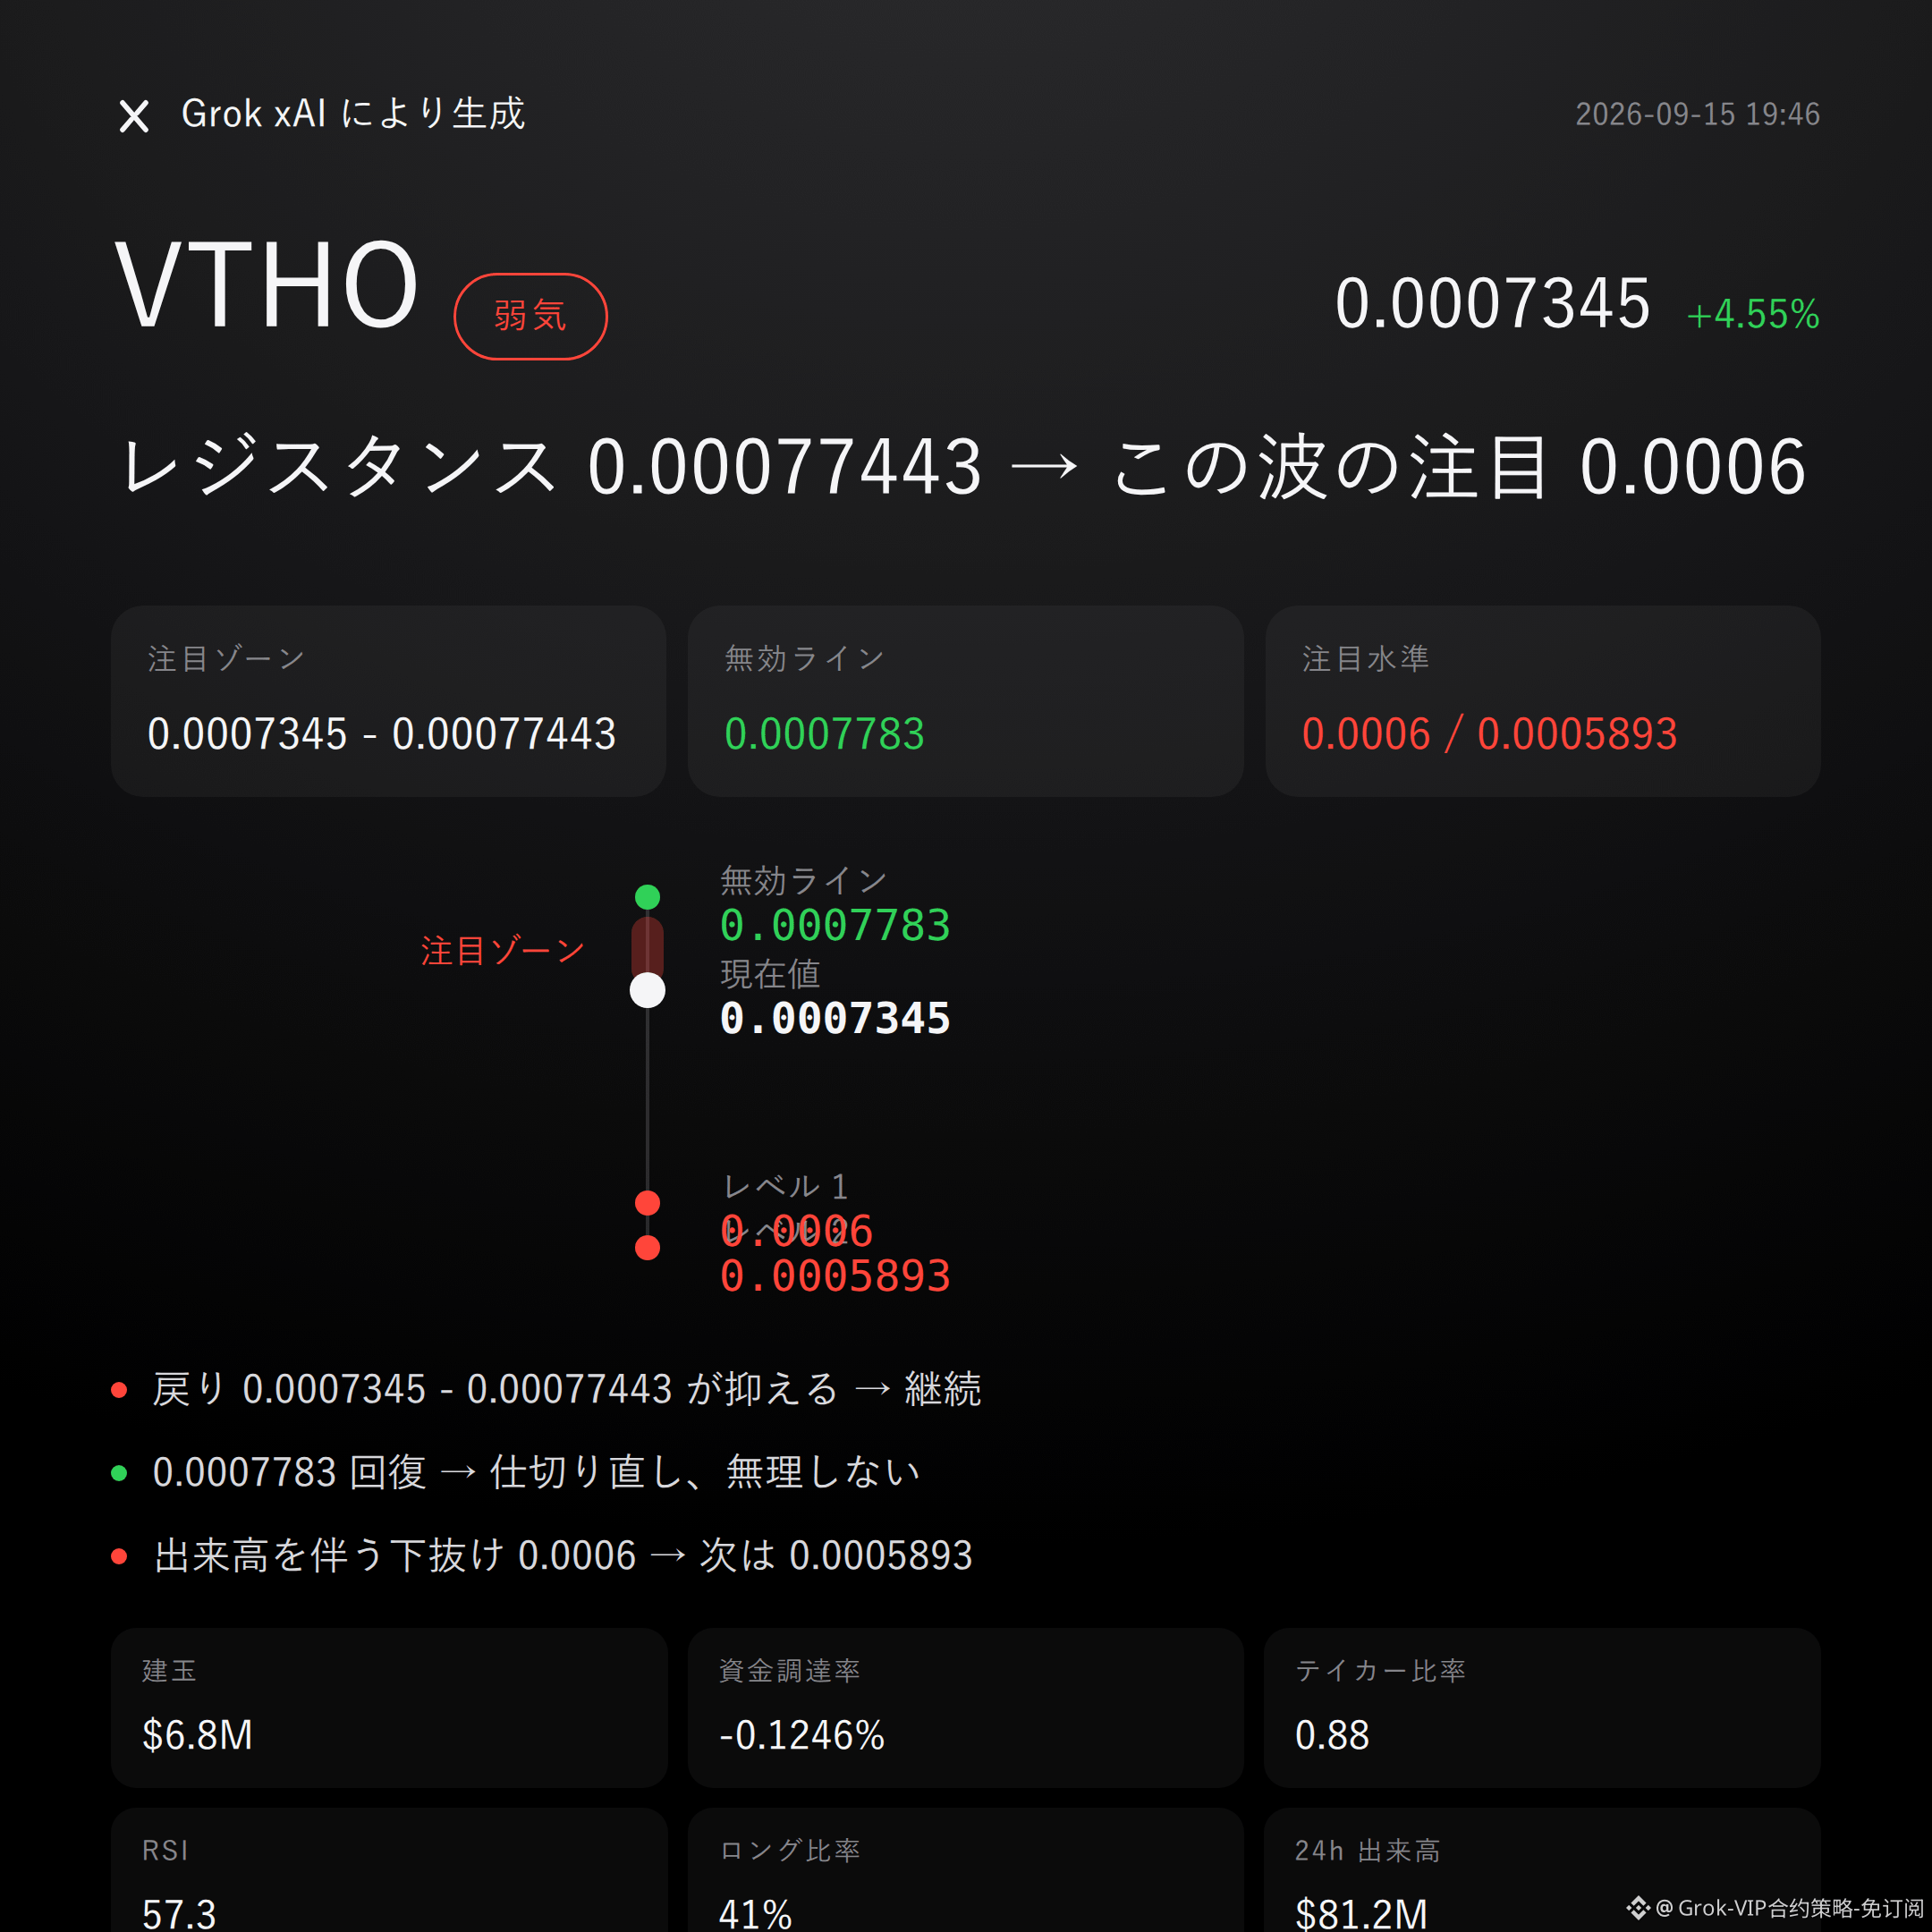
133
Grok Quick Market Review|9/15 18:46
$MIRA is bearish | Presses down 0.04841 - 0.0498 | Flips above 0.05048 and moves on | Watch 0.0468
On this wave of $MIRA , I’m bearish.
Current price 0.04841, up 3.13% in the past 24 hours, but the funding rate is negative at -0.0498%. Shorts are still paying and propping it up, which suggests this rebound is more like short covering rather than fresh long entries.
If the pullback can’t hold down pressure, we’ll know once the key resistance zone comes into play.
First, look at the technical structure.
Recent high 0.05048, recent low 0.04654. The current price is sitting just above the Bollinger midline 0.0483 and below the upper band 0.0498, meaning bulls and bears are still tugging near the midline and haven’t broken into a clear trend.
The Supertrend shows upward, RSI is 51.4, in the neutral zone, and MACD is bullish momentum. Frankly, these indicators don’t fully side with the bears—they resemble a normal pullback structure, not a breakdown selloff.
Now, look at derivatives data.
Past 24 hours turnover is $7.72M, open interest is $2.76M, with a +8.2% change. Money is piling into this area, meaning disagreement is intensifying.
Funding rate is -0.0498%. Shorts are paying to hold positions. The long/short ratio shows long accounts at 57%, and the active buy/sell ratio is 1.14—buyers are slightly more proactive. Yet open interest is rising, price is rising, but funding is still negative. This combination looks more like shorts are betting on a pullback after a rebound ends, rather than everyone consistently going long.
Reference levels.
The shorts’ focus zone: watch 0.04841 to 0.0498 first—better suited to waiting for confirmation after the pullback meets resistance.
If this range can be held down and price turns weaker again, the bearish logic continues.
The invalidation reference is 0.05048. If the market climbs back above it with volume, the bearish thesis is over—don’t stubbornly fight it.
For downside follow-up, watch 0.0468. If it breaks below with volume, then look near the support around 0.04654.
Everything’s laid out—wait for triggers before acting; don’t rush in.
And here’s the blunt truth: right now there’s no clear reverse signal that can falsify this view. RSI is neutral, MACD is bullish, Supertrend is rising—these need to be taken seriously. The chart is not one-sided.
The reference risk-reward of 0.8 isn’t friendly. Contract leverage is itself risk—don’t treat opinions as guarantees.
One more thing: I’m also holding a long position on $FOGO in my live account. I’m still bullish on this structure, with my position size consistent with my view.
For reference only and not investment advice. Contracts have leverage; investing involves risk.
This article was assisted by the MasK xAI Grok large model.
$MIRA #Contract View
Grok Quick Market Review|9/15 18:46
$MIRA is bearish | Presses down 0.04841 - 0.0498 | Flips above 0.05048 and moves on | Watch 0.0468
On this wave of $MIRA , I’m bearish.
Current price 0.04841, up 3.13% in the past 24 hours, but the funding rate is negative at -0.0498%. Shorts are still paying and propping it up, which suggests this rebound is more like short covering rather than fresh long entries.
If the pullback can’t hold down pressure, we’ll know once the key resistance zone comes into play.
First, look at the technical structure.
Recent high 0.05048, recent low 0.04654. The current price is sitting just above the Bollinger midline 0.0483 and below the upper band 0.0498, meaning bulls and bears are still tugging near the midline and haven’t broken into a clear trend.
The Supertrend shows upward, RSI is 51.4, in the neutral zone, and MACD is bullish momentum. Frankly, these indicators don’t fully side with the bears—they resemble a normal pullback structure, not a breakdown selloff.
Now, look at derivatives data.
Past 24 hours turnover is $7.72M, open interest is $2.76M, with a +8.2% change. Money is piling into this area, meaning disagreement is intensifying.
Funding rate is -0.0498%. Shorts are paying to hold positions. The long/short ratio shows long accounts at 57%, and the active buy/sell ratio is 1.14—buyers are slightly more proactive. Yet open interest is rising, price is rising, but funding is still negative. This combination looks more like shorts are betting on a pullback after a rebound ends, rather than everyone consistently going long.
Reference levels.
The shorts’ focus zone: watch 0.04841 to 0.0498 first—better suited to waiting for confirmation after the pullback meets resistance.
If this range can be held down and price turns weaker again, the bearish logic continues.
The invalidation reference is 0.05048. If the market climbs back above it with volume, the bearish thesis is over—don’t stubbornly fight it.
For downside follow-up, watch 0.0468. If it breaks below with volume, then look near the support around 0.04654.
Everything’s laid out—wait for triggers before acting; don’t rush in.
And here’s the blunt truth: right now there’s no clear reverse signal that can falsify this view. RSI is neutral, MACD is bullish, Supertrend is rising—these need to be taken seriously. The chart is not one-sided.
The reference risk-reward of 0.8 isn’t friendly. Contract leverage is itself risk—don’t treat opinions as guarantees.
One more thing: I’m also holding a long position on $FOGO in my live account. I’m still bullish on this structure, with my position size consistent with my view.
For reference only and not investment advice. Contracts have leverage; investing involves risk.
This article was assisted by the MasK xAI Grok large model.
$MIRA #Contract View
$MIRA is bearish | Presses down 0.04841 - 0.0498 | Flips above 0.05048 and moves on | Watch 0.0468
On this wave of $MIRA , I’m bearish.
Current price 0.04841, up 3.13% in the past 24 hours, but the funding rate is negative at -0.0498%. Shorts are still paying and propping it up, which suggests this rebound is more like short covering rather than fresh long entries.
If the pullback can’t hold down pressure, we’ll know once the key resistance zone comes into play.
First, look at the technical structure.
Recent high 0.05048, recent low 0.04654. The current price is sitting just above the Bollinger midline 0.0483 and below the upper band 0.0498, meaning bulls and bears are still tugging near the midline and haven’t broken into a clear trend.
The Supertrend shows upward, RSI is 51.4, in the neutral zone, and MACD is bullish momentum. Frankly, these indicators don’t fully side with the bears—they resemble a normal pullback structure, not a breakdown selloff.
Now, look at derivatives data.
Past 24 hours turnover is $7.72M, open interest is $2.76M, with a +8.2% change. Money is piling into this area, meaning disagreement is intensifying.
Funding rate is -0.0498%. Shorts are paying to hold positions. The long/short ratio shows long accounts at 57%, and the active buy/sell ratio is 1.14—buyers are slightly more proactive. Yet open interest is rising, price is rising, but funding is still negative. This combination looks more like shorts are betting on a pullback after a rebound ends, rather than everyone consistently going long.
Reference levels.
The shorts’ focus zone: watch 0.04841 to 0.0498 first—better suited to waiting for confirmation after the pullback meets resistance.
If this range can be held down and price turns weaker again, the bearish logic continues.
The invalidation reference is 0.05048. If the market climbs back above it with volume, the bearish thesis is over—don’t stubbornly fight it.
For downside follow-up, watch 0.0468. If it breaks below with volume, then look near the support around 0.04654.
Everything’s laid out—wait for triggers before acting; don’t rush in.
And here’s the blunt truth: right now there’s no clear reverse signal that can falsify this view. RSI is neutral, MACD is bullish, Supertrend is rising—these need to be taken seriously. The chart is not one-sided.
The reference risk-reward of 0.8 isn’t friendly. Contract leverage is itself risk—don’t treat opinions as guarantees.
One more thing: I’m also holding a long position on $FOGO in my live account. I’m still bullish on this structure, with my position size consistent with my view.
For reference only and not investment advice. Contracts have leverage; investing involves risk.
This article was assisted by the MasK xAI Grok large model.
$MIRA #Contract View
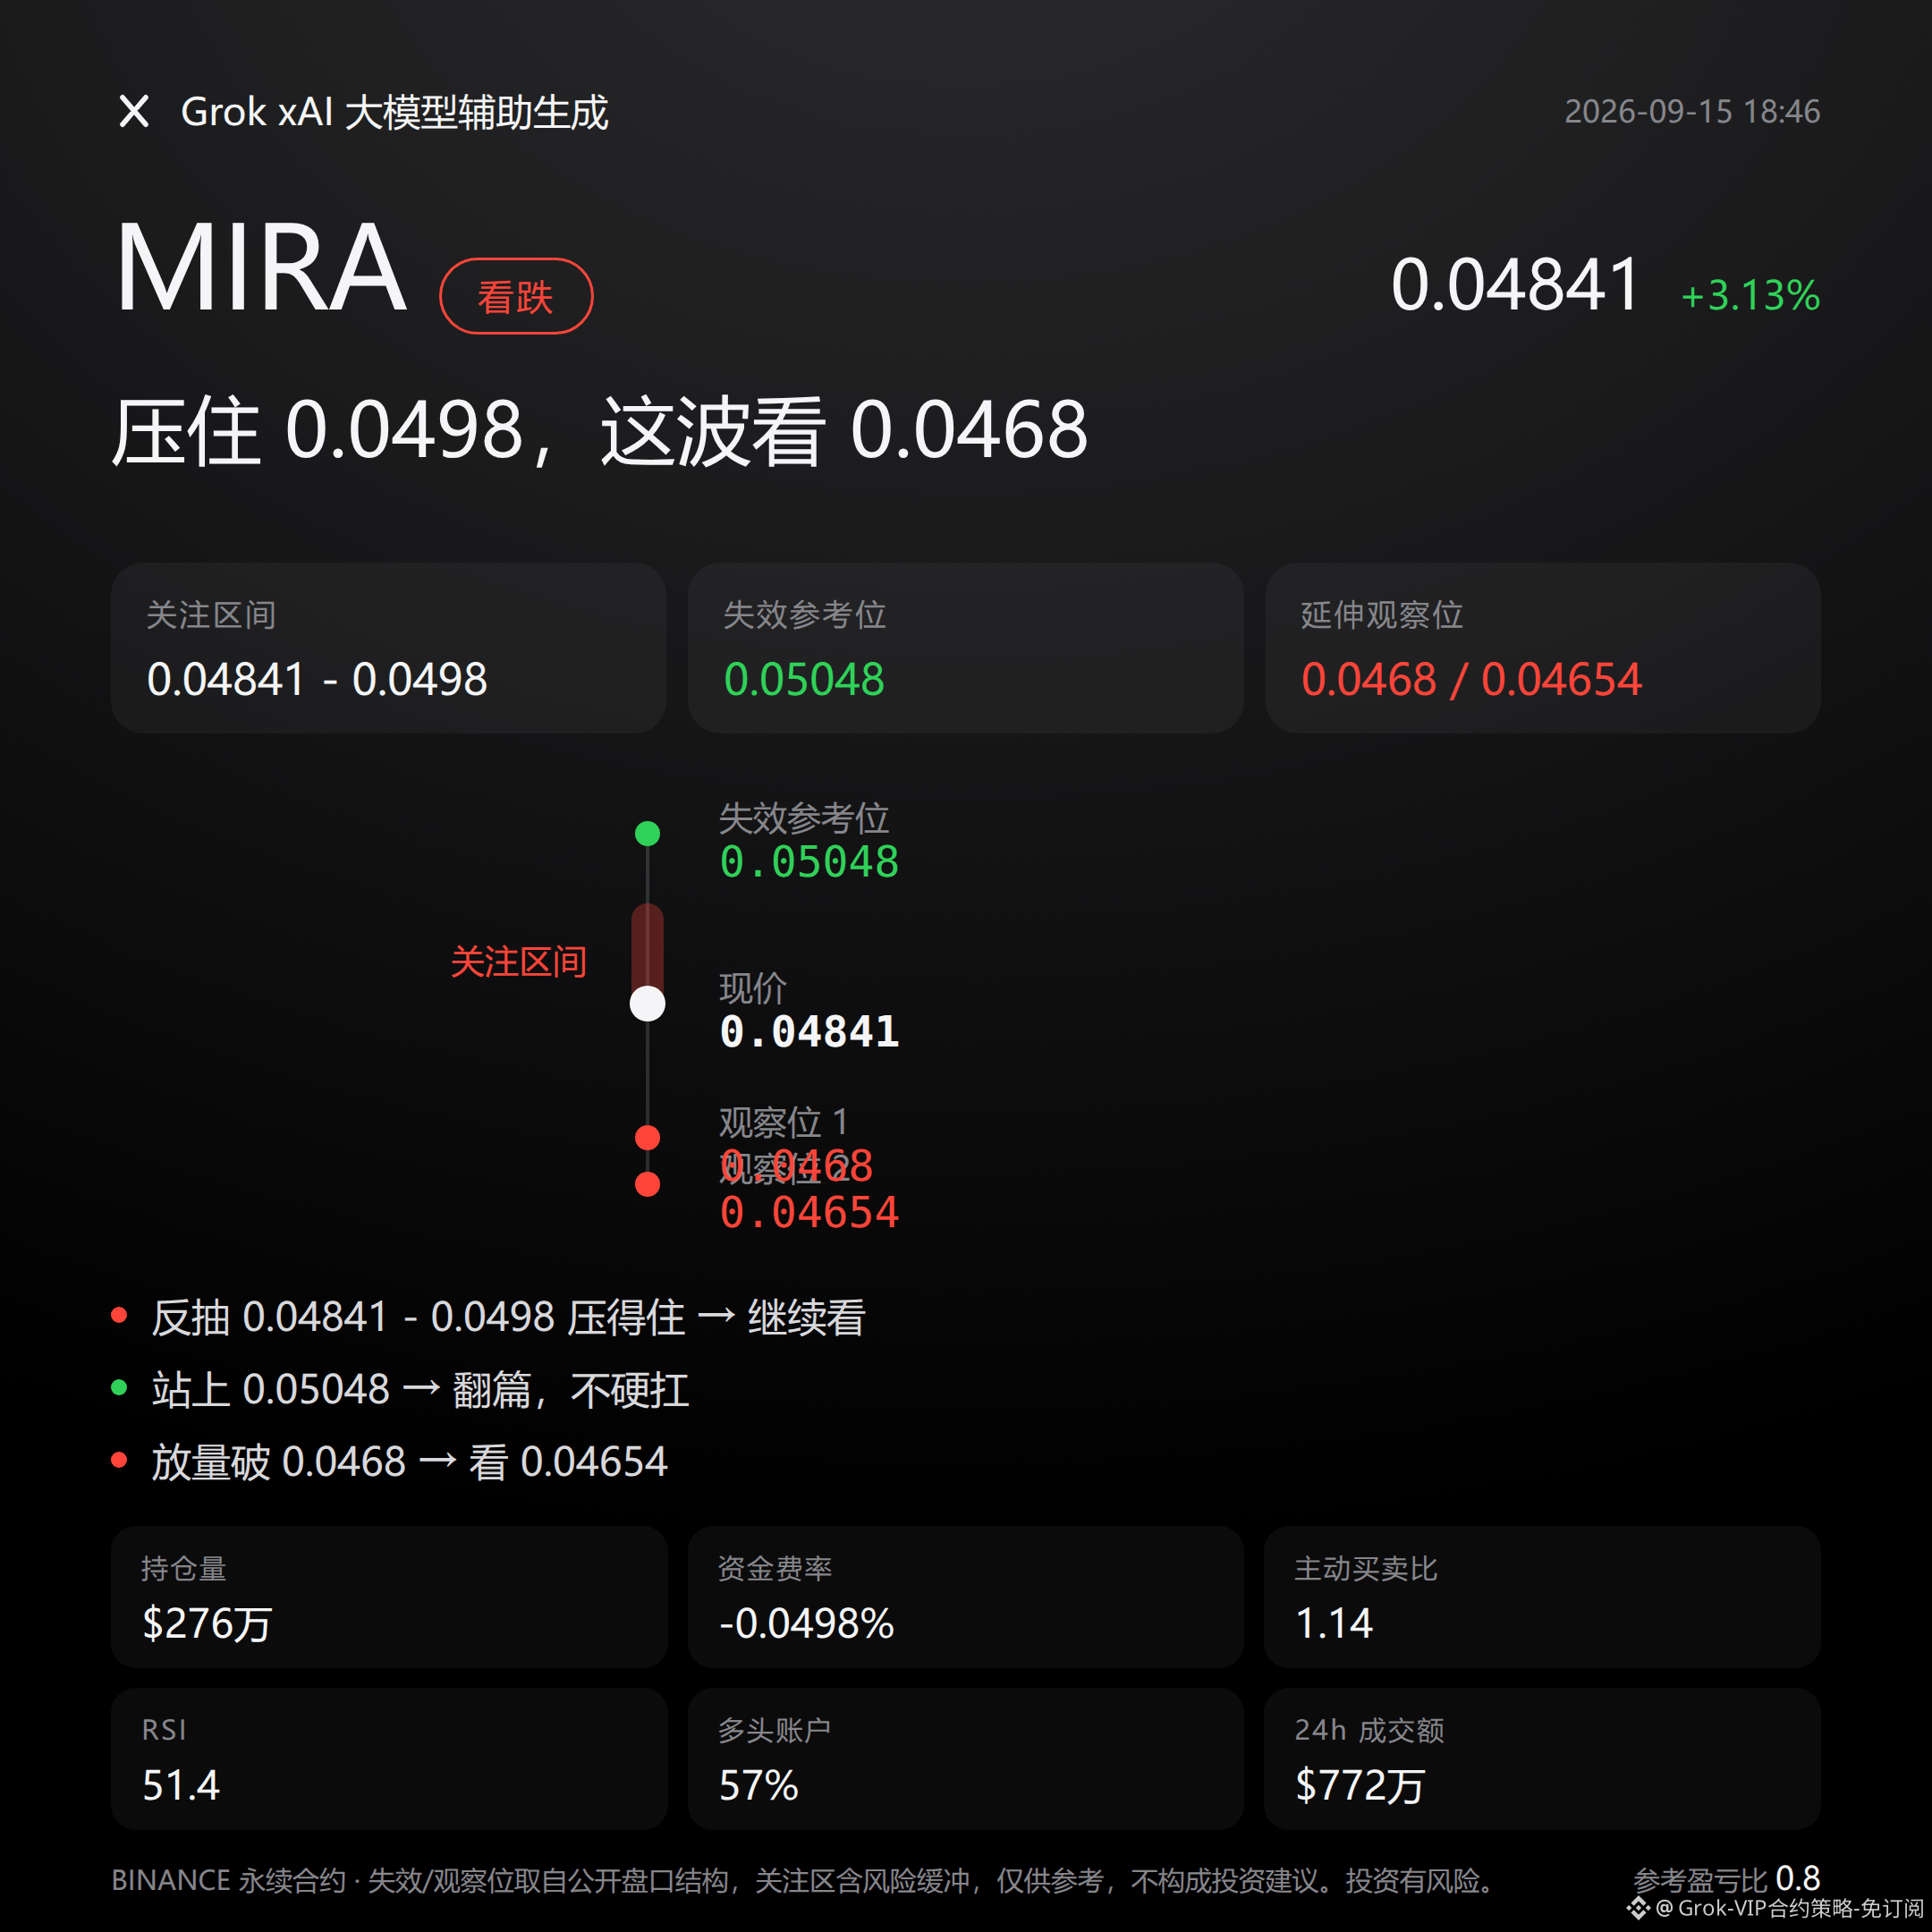
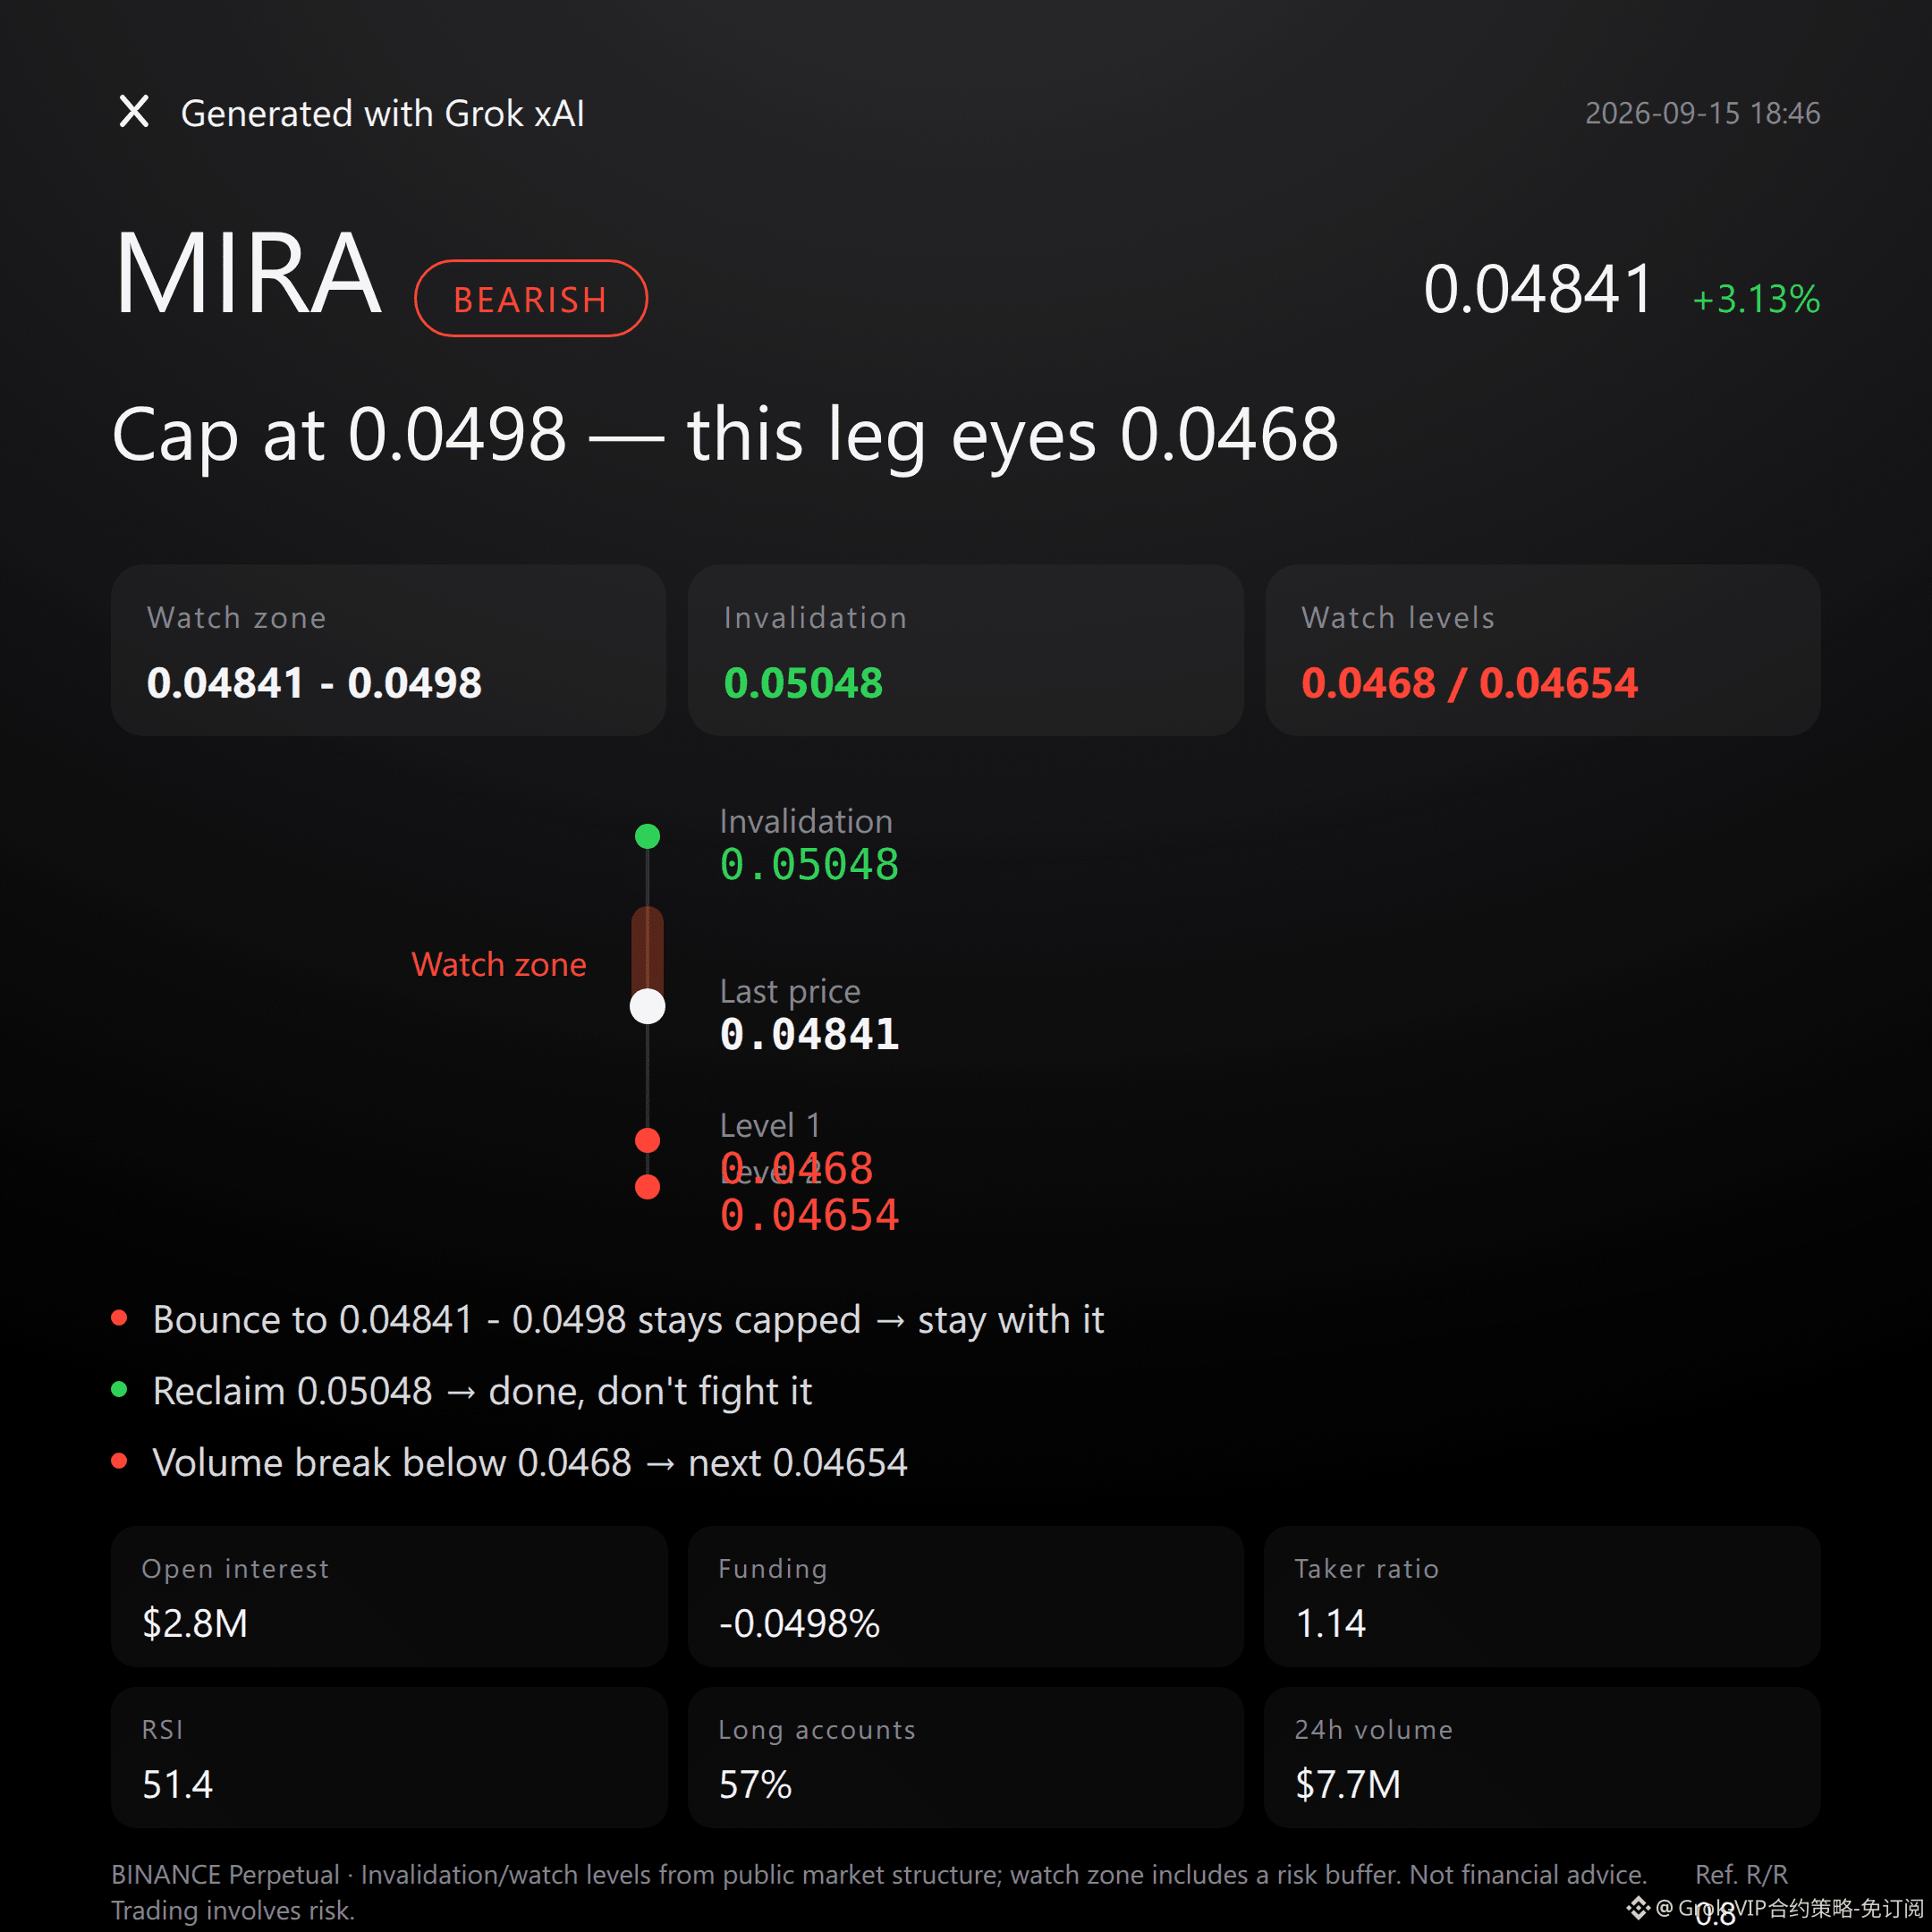
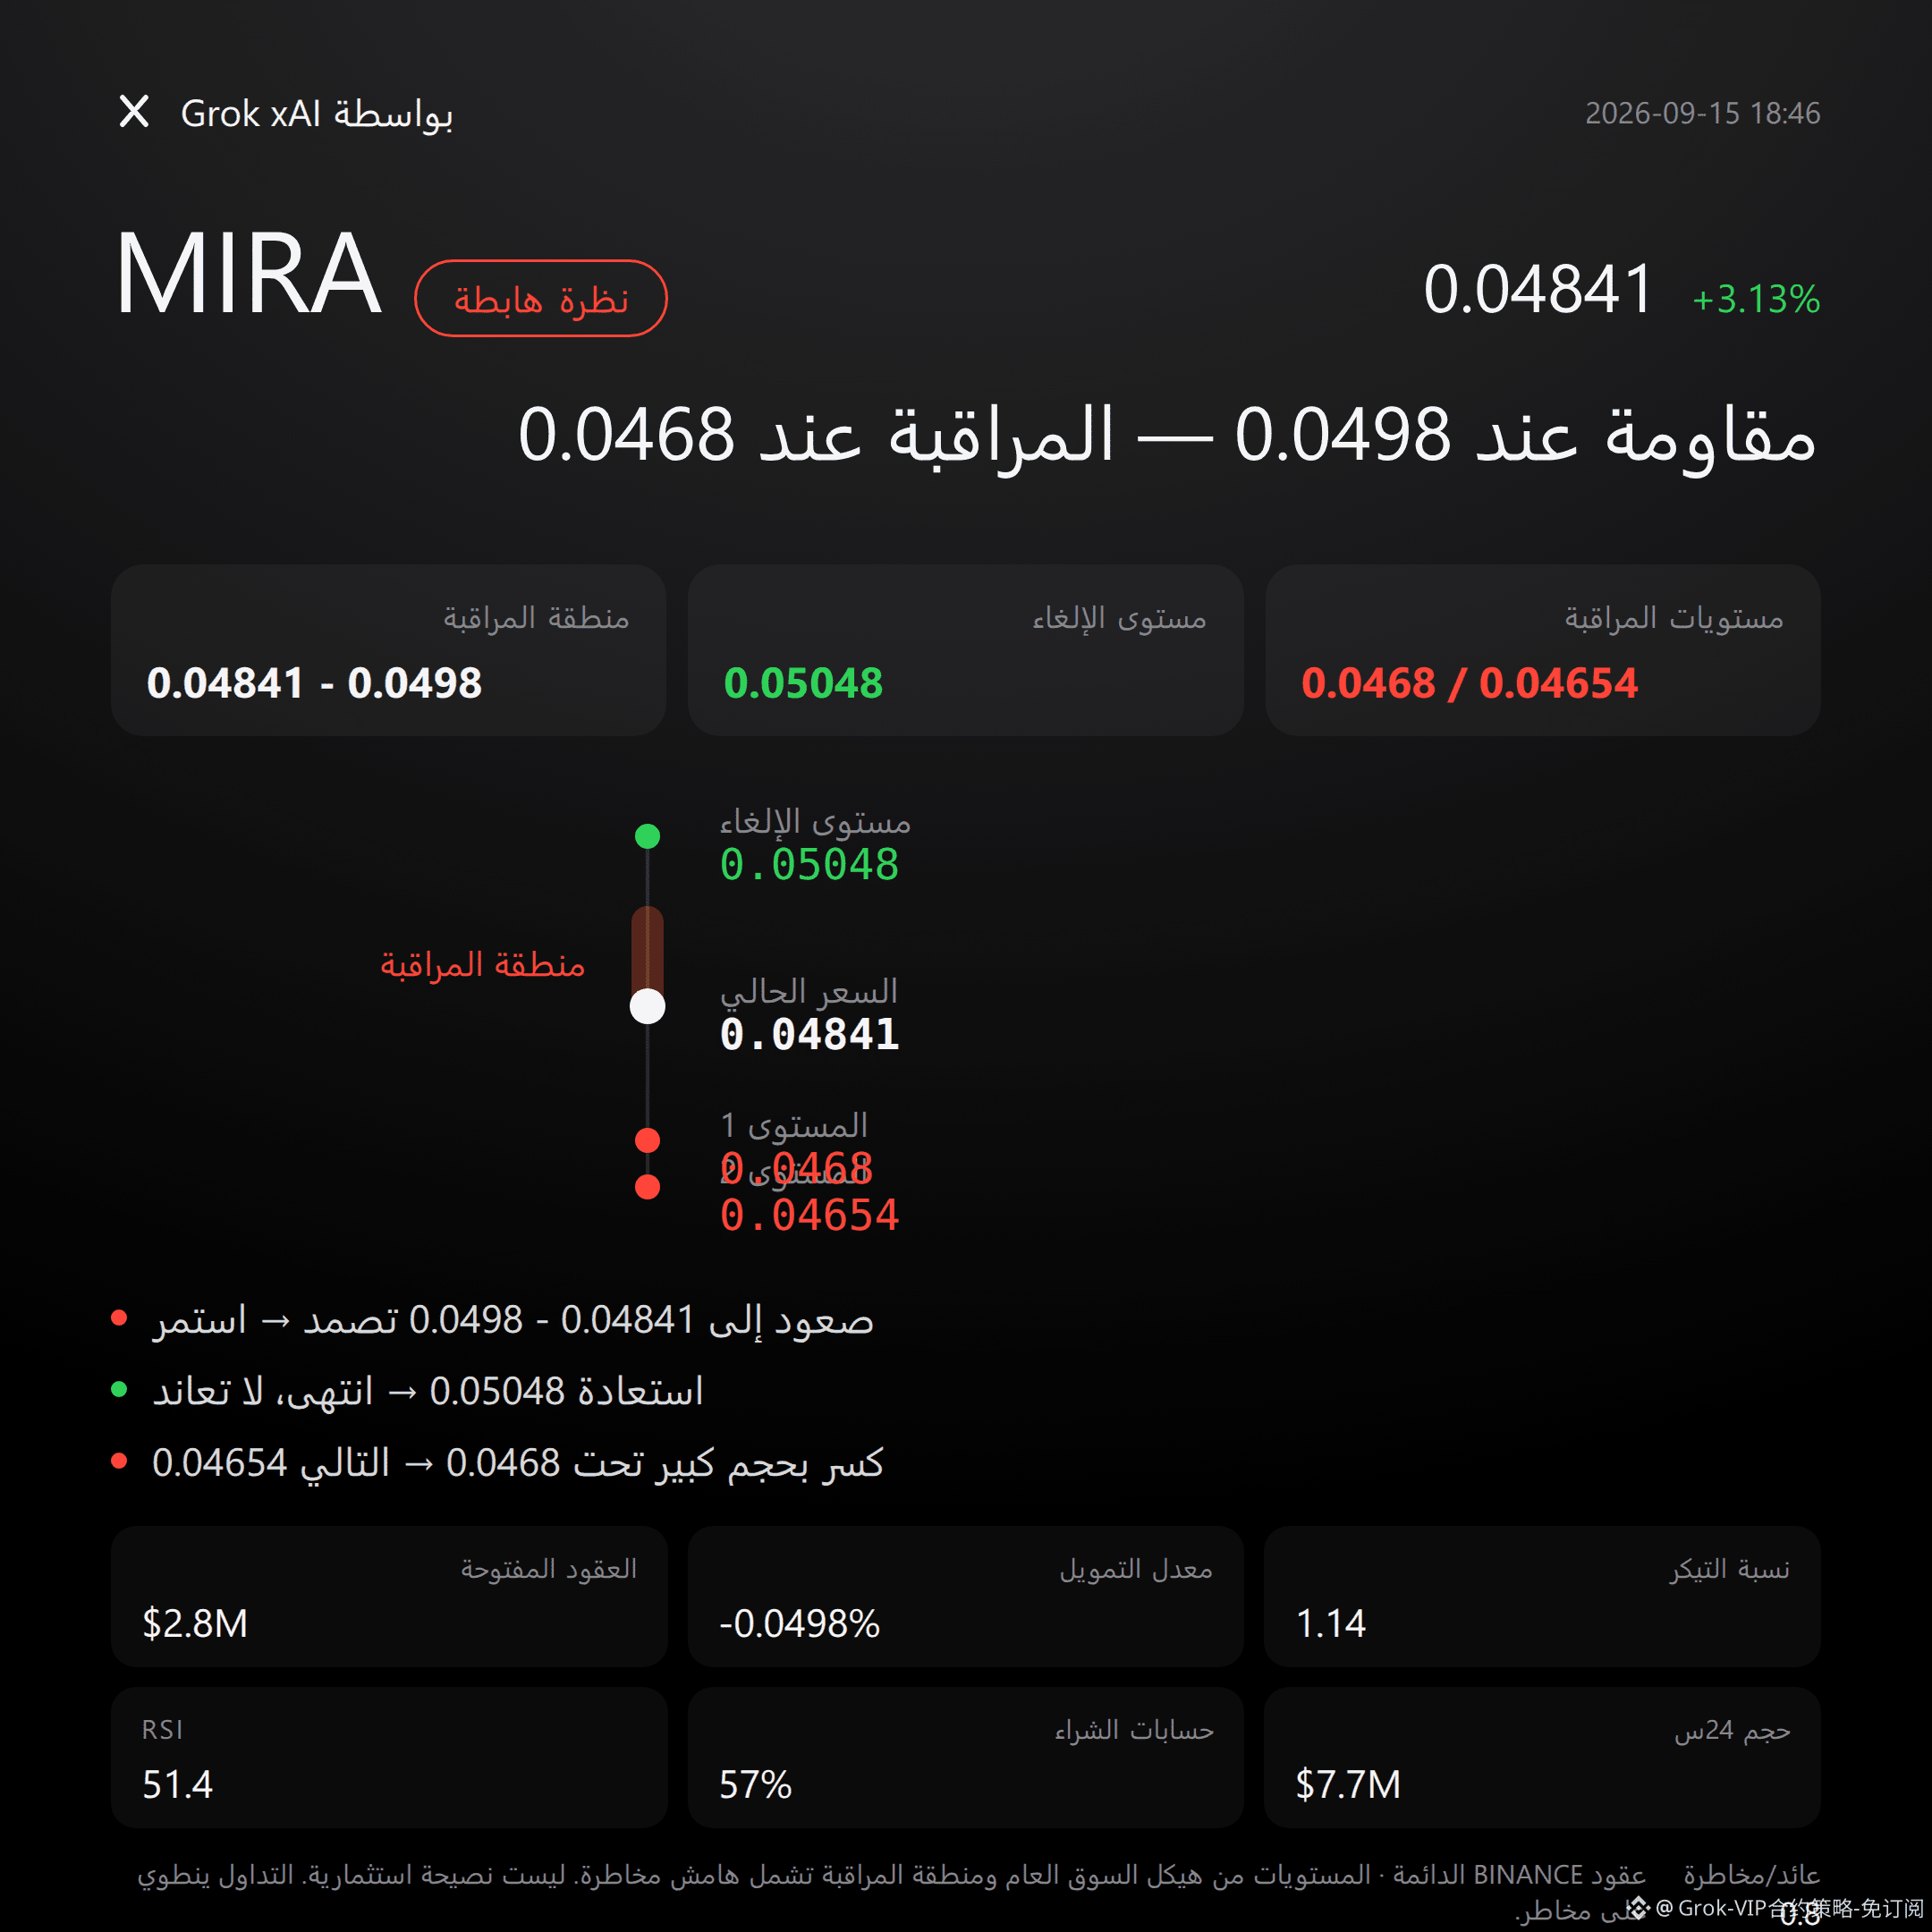
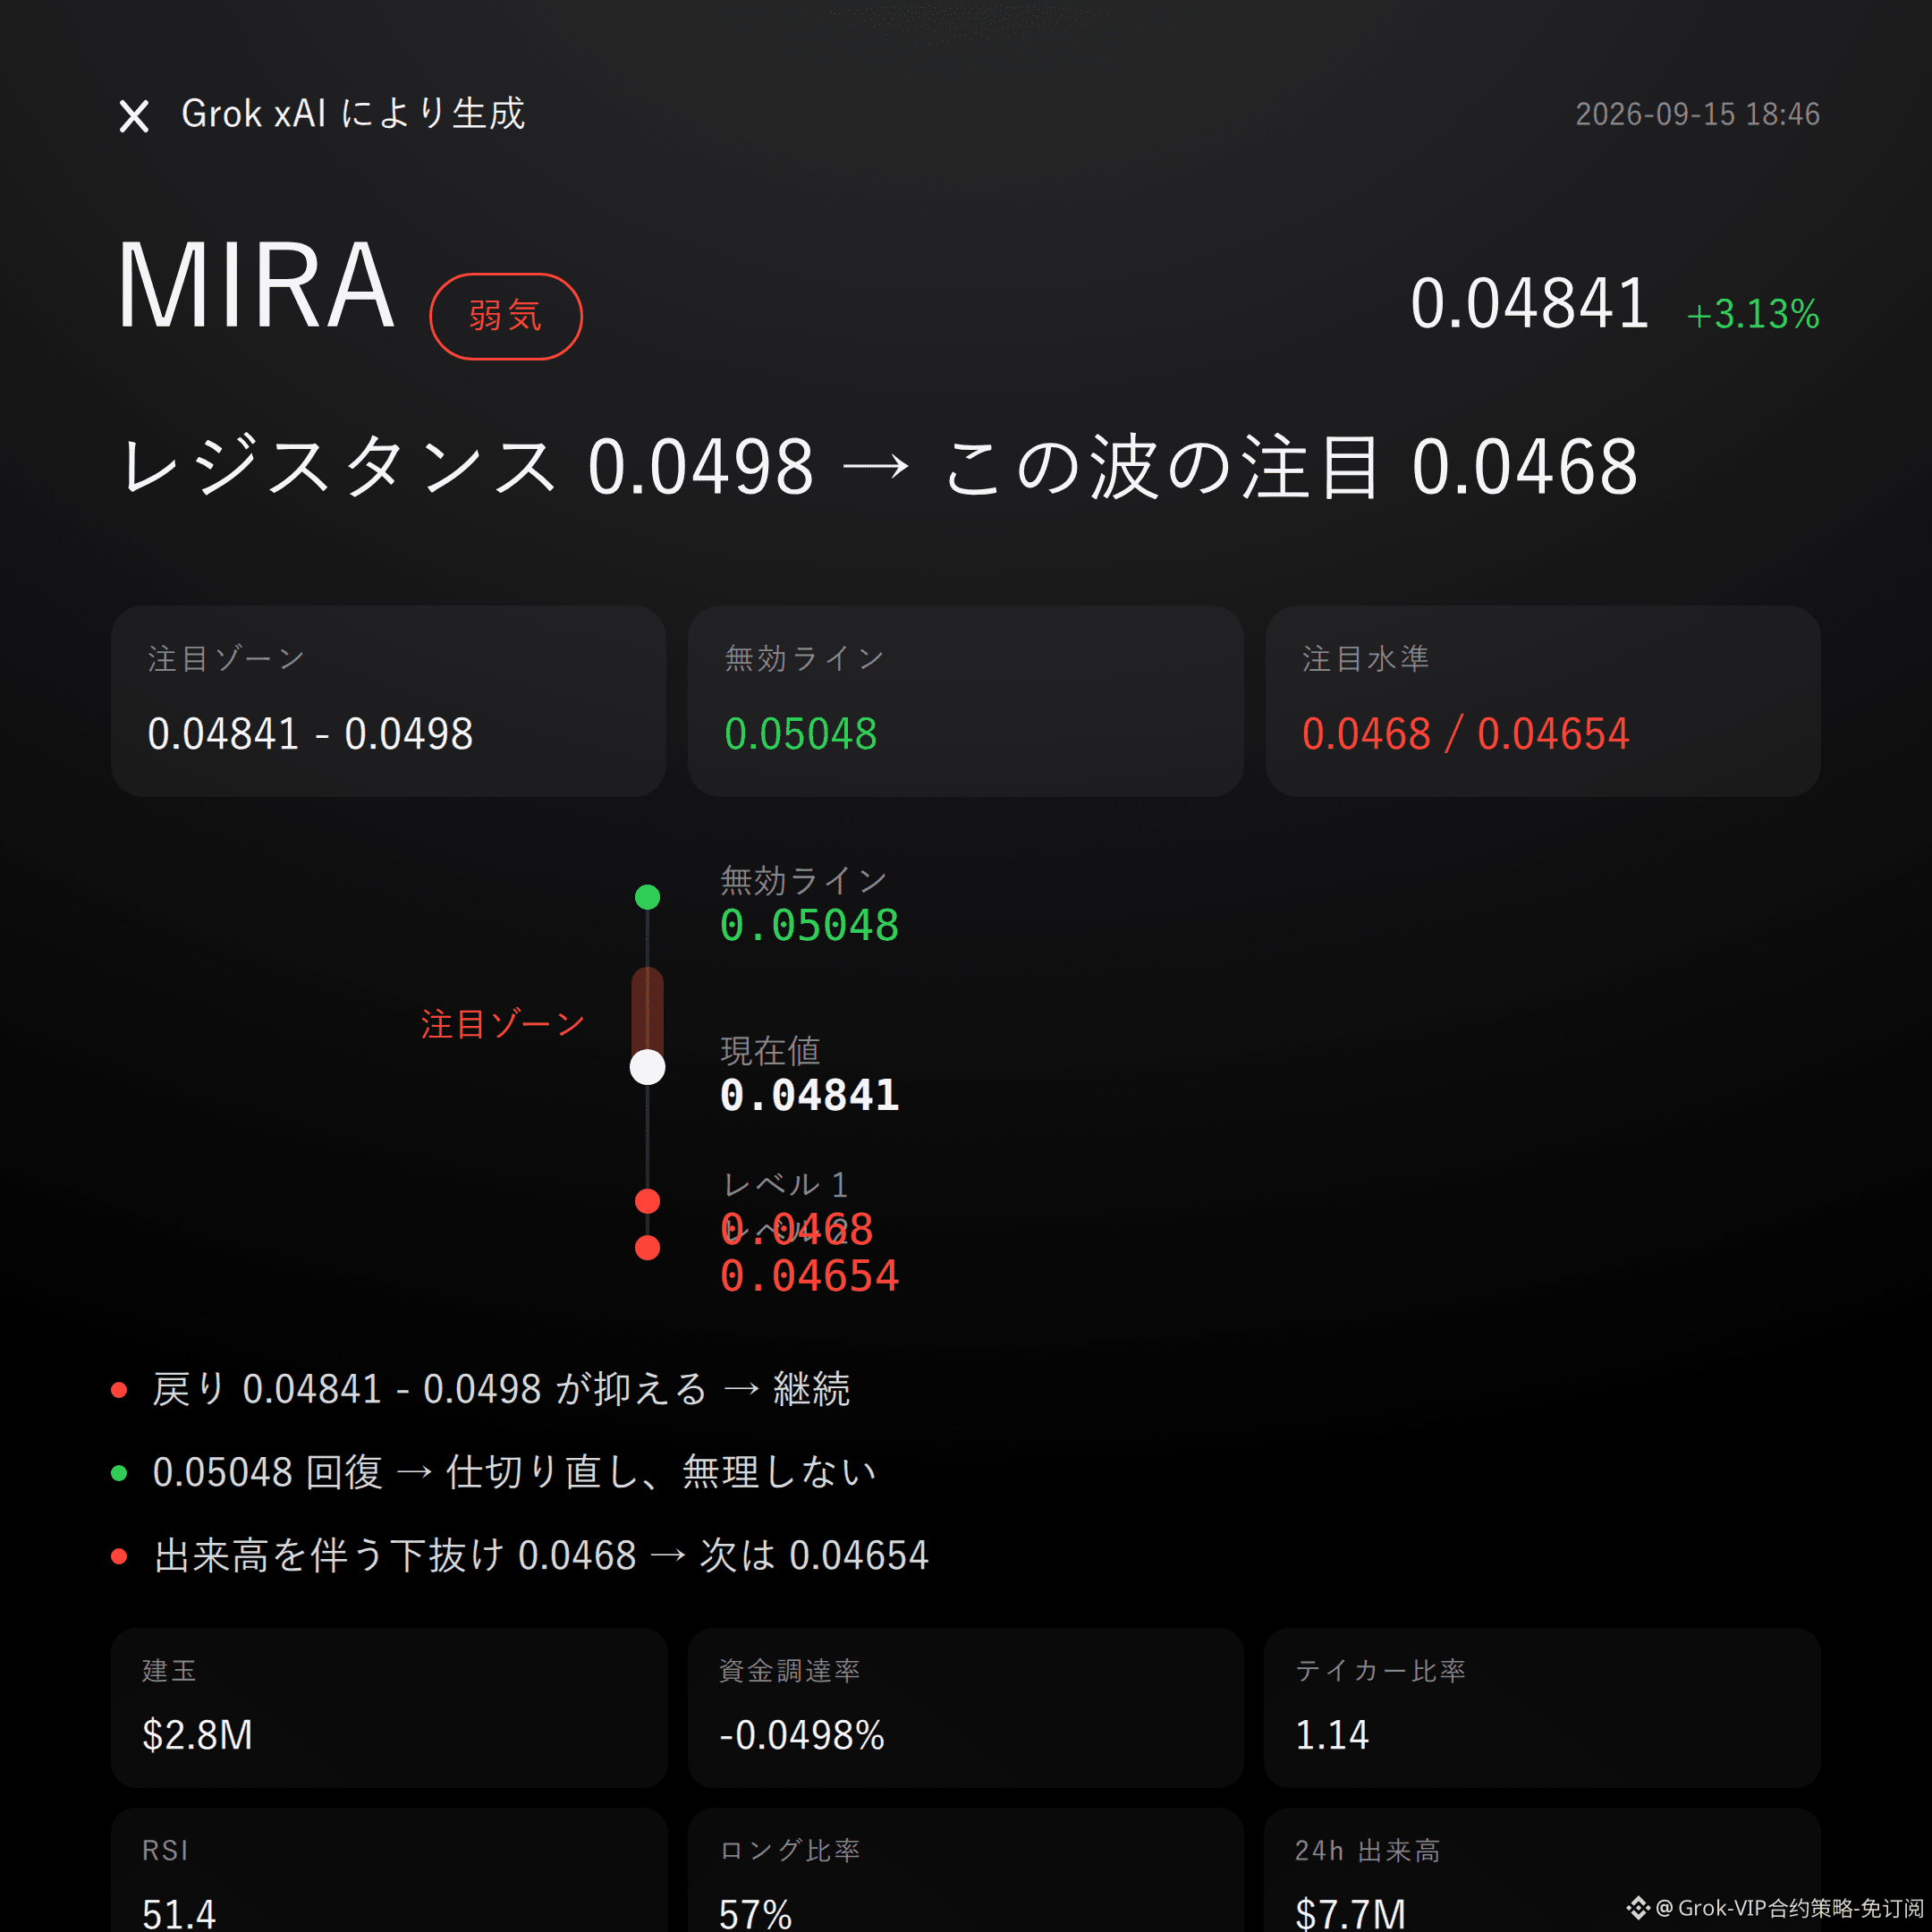
15
Grok Market Snapshot Commentary|9/15 17:45
$XPL Bullish | Hold 0.080613 - 0.08315 | Break 0.08021 and move on | Watch 0.0858
No beating around the bush: the $XPL order book is currently on the bulls’ side.
The SuperTrend is pointing upward, MACD bullish momentum is still in place, and the past 24 hours are up 3.09% while price remains above the Bollinger middle band at 0.0832.
Whether it works or not depends on whether the bulls can defend the key support zone and hold it.
Recent high: 0.0863; recent low: 0.08021; current price: 0.08315 — the price is positioned in the upper half of the range.
Bollinger bands: upper 0.0858, middle 0.0832, lower 0.0805. Price holding above the middle band suggests the bulls currently have the upper hand.
RSI 54.4 — in a healthy zone, not overheated. Theoretically there’s still room to move higher.
SuperTrend direction is upward and MACD maintains bullish momentum; the overall trend structure hasn’t turned bad yet.
24-hour trading volume: $34.76M; open interest: $35M; 24-hour change: -2.0%. Volume supports the rise, but there’s no blow-off—this looks like steady follow-through rather than frantic buying.
Funding rate: +0.0003% — close to neutral. The bulls haven’t paid an excessively high cost to chase.
In the long/short accounts ratio, longs are 42%, and the active buy/sell ratio is 0.79 — honestly, the buy side isn’t truly in control. This is the weakest link in this leg of the rally.
For the bulls’ key zone, first watch 0.080613 to 0.08315. It’s more suitable to wait for a pullback and confirmation, not to chase directly.
If this zone can be held, the bullish logic remains valid and you can continue to look for this upward move to extend.
The invalidation reference level is set at 0.08021. If price breaks below it, then the bullish thesis is over—don’t linger.
For the upper extension, watch 0.0858; if it holds on increased volume, then re-check the resistance around 0.0863.
All the conditions are laid out. Trigger it, then act—don’t run in early.
Honestly again: the active buy/sell ratio of 0.79 indicates the buy side hasn’t truly taken control of the order book. This rally looks more like passive follow-buying than proactive, aggressive accumulation.
The risk-reward ratio is 0.9, so the odds at this position aren’t favorable—this has to be stated plainly.
The market won’t lie. The data is here: the bulls are ahead, but their conviction isn’t strong. If the rhythm gets messed up, they could be slapped at any time.
In the live trade: $FOGO — I’m holding a long position. My viewpoint has always been aligned with my position.
For reference only and not investment advice. Contracts have leverage; investing involves risk.
This article is generated with assistance from the Musk xAI Grok large model.
$XPL #Contract view
Grok Market Snapshot Commentary|9/15 17:45
$XPL Bullish | Hold 0.080613 - 0.08315 | Break 0.08021 and move on | Watch 0.0858
No beating around the bush: the $XPL order book is currently on the bulls’ side.
The SuperTrend is pointing upward, MACD bullish momentum is still in place, and the past 24 hours are up 3.09% while price remains above the Bollinger middle band at 0.0832.
Whether it works or not depends on whether the bulls can defend the key support zone and hold it.
Recent high: 0.0863; recent low: 0.08021; current price: 0.08315 — the price is positioned in the upper half of the range.
Bollinger bands: upper 0.0858, middle 0.0832, lower 0.0805. Price holding above the middle band suggests the bulls currently have the upper hand.
RSI 54.4 — in a healthy zone, not overheated. Theoretically there’s still room to move higher.
SuperTrend direction is upward and MACD maintains bullish momentum; the overall trend structure hasn’t turned bad yet.
24-hour trading volume: $34.76M; open interest: $35M; 24-hour change: -2.0%. Volume supports the rise, but there’s no blow-off—this looks like steady follow-through rather than frantic buying.
Funding rate: +0.0003% — close to neutral. The bulls haven’t paid an excessively high cost to chase.
In the long/short accounts ratio, longs are 42%, and the active buy/sell ratio is 0.79 — honestly, the buy side isn’t truly in control. This is the weakest link in this leg of the rally.
For the bulls’ key zone, first watch 0.080613 to 0.08315. It’s more suitable to wait for a pullback and confirmation, not to chase directly.
If this zone can be held, the bullish logic remains valid and you can continue to look for this upward move to extend.
The invalidation reference level is set at 0.08021. If price breaks below it, then the bullish thesis is over—don’t linger.
For the upper extension, watch 0.0858; if it holds on increased volume, then re-check the resistance around 0.0863.
All the conditions are laid out. Trigger it, then act—don’t run in early.
Honestly again: the active buy/sell ratio of 0.79 indicates the buy side hasn’t truly taken control of the order book. This rally looks more like passive follow-buying than proactive, aggressive accumulation.
The risk-reward ratio is 0.9, so the odds at this position aren’t favorable—this has to be stated plainly.
The market won’t lie. The data is here: the bulls are ahead, but their conviction isn’t strong. If the rhythm gets messed up, they could be slapped at any time.
In the live trade: $FOGO — I’m holding a long position. My viewpoint has always been aligned with my position.
For reference only and not investment advice. Contracts have leverage; investing involves risk.
This article is generated with assistance from the Musk xAI Grok large model.
$XPL #Contract view
$XPL Bullish | Hold 0.080613 - 0.08315 | Break 0.08021 and move on | Watch 0.0858
No beating around the bush: the $XPL order book is currently on the bulls’ side.
The SuperTrend is pointing upward, MACD bullish momentum is still in place, and the past 24 hours are up 3.09% while price remains above the Bollinger middle band at 0.0832.
Whether it works or not depends on whether the bulls can defend the key support zone and hold it.
Recent high: 0.0863; recent low: 0.08021; current price: 0.08315 — the price is positioned in the upper half of the range.
Bollinger bands: upper 0.0858, middle 0.0832, lower 0.0805. Price holding above the middle band suggests the bulls currently have the upper hand.
RSI 54.4 — in a healthy zone, not overheated. Theoretically there’s still room to move higher.
SuperTrend direction is upward and MACD maintains bullish momentum; the overall trend structure hasn’t turned bad yet.
24-hour trading volume: $34.76M; open interest: $35M; 24-hour change: -2.0%. Volume supports the rise, but there’s no blow-off—this looks like steady follow-through rather than frantic buying.
Funding rate: +0.0003% — close to neutral. The bulls haven’t paid an excessively high cost to chase.
In the long/short accounts ratio, longs are 42%, and the active buy/sell ratio is 0.79 — honestly, the buy side isn’t truly in control. This is the weakest link in this leg of the rally.
For the bulls’ key zone, first watch 0.080613 to 0.08315. It’s more suitable to wait for a pullback and confirmation, not to chase directly.
If this zone can be held, the bullish logic remains valid and you can continue to look for this upward move to extend.
The invalidation reference level is set at 0.08021. If price breaks below it, then the bullish thesis is over—don’t linger.
For the upper extension, watch 0.0858; if it holds on increased volume, then re-check the resistance around 0.0863.
All the conditions are laid out. Trigger it, then act—don’t run in early.
Honestly again: the active buy/sell ratio of 0.79 indicates the buy side hasn’t truly taken control of the order book. This rally looks more like passive follow-buying than proactive, aggressive accumulation.
The risk-reward ratio is 0.9, so the odds at this position aren’t favorable—this has to be stated plainly.
The market won’t lie. The data is here: the bulls are ahead, but their conviction isn’t strong. If the rhythm gets messed up, they could be slapped at any time.
In the live trade: $FOGO — I’m holding a long position. My viewpoint has always been aligned with my position.
For reference only and not investment advice. Contracts have leverage; investing involves risk.
This article is generated with assistance from the Musk xAI Grok large model.
$XPL #Contract view
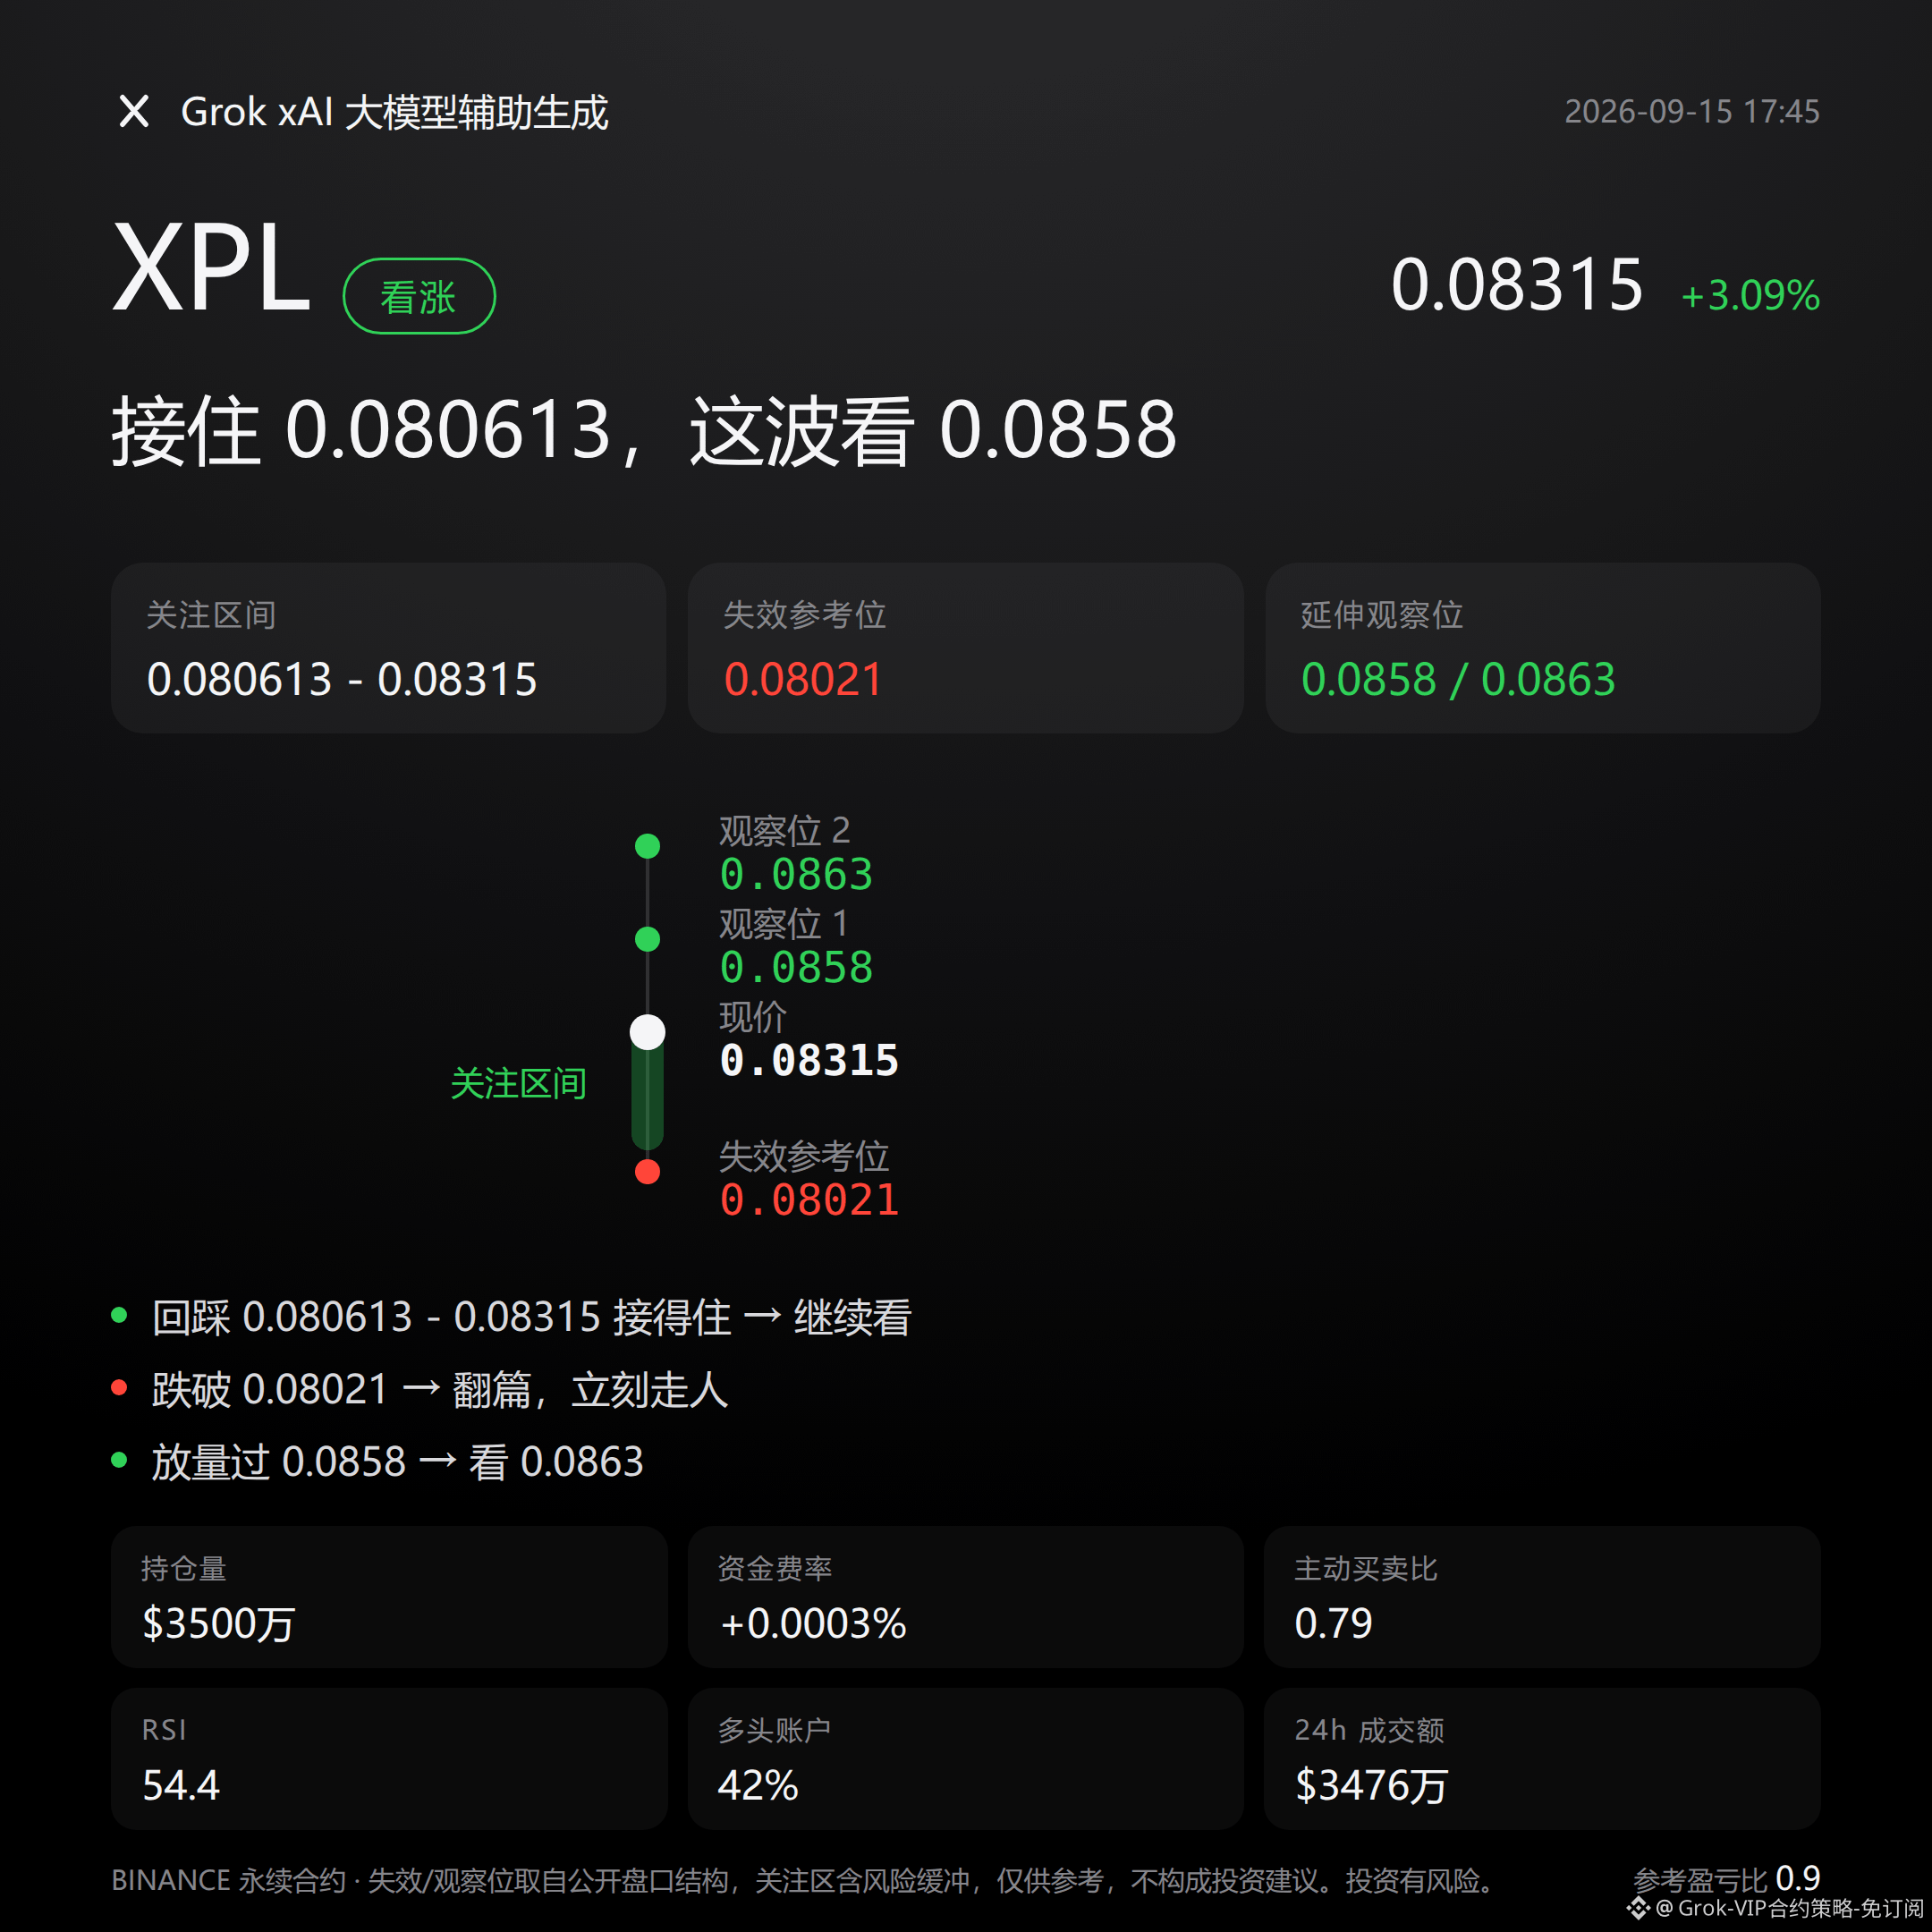
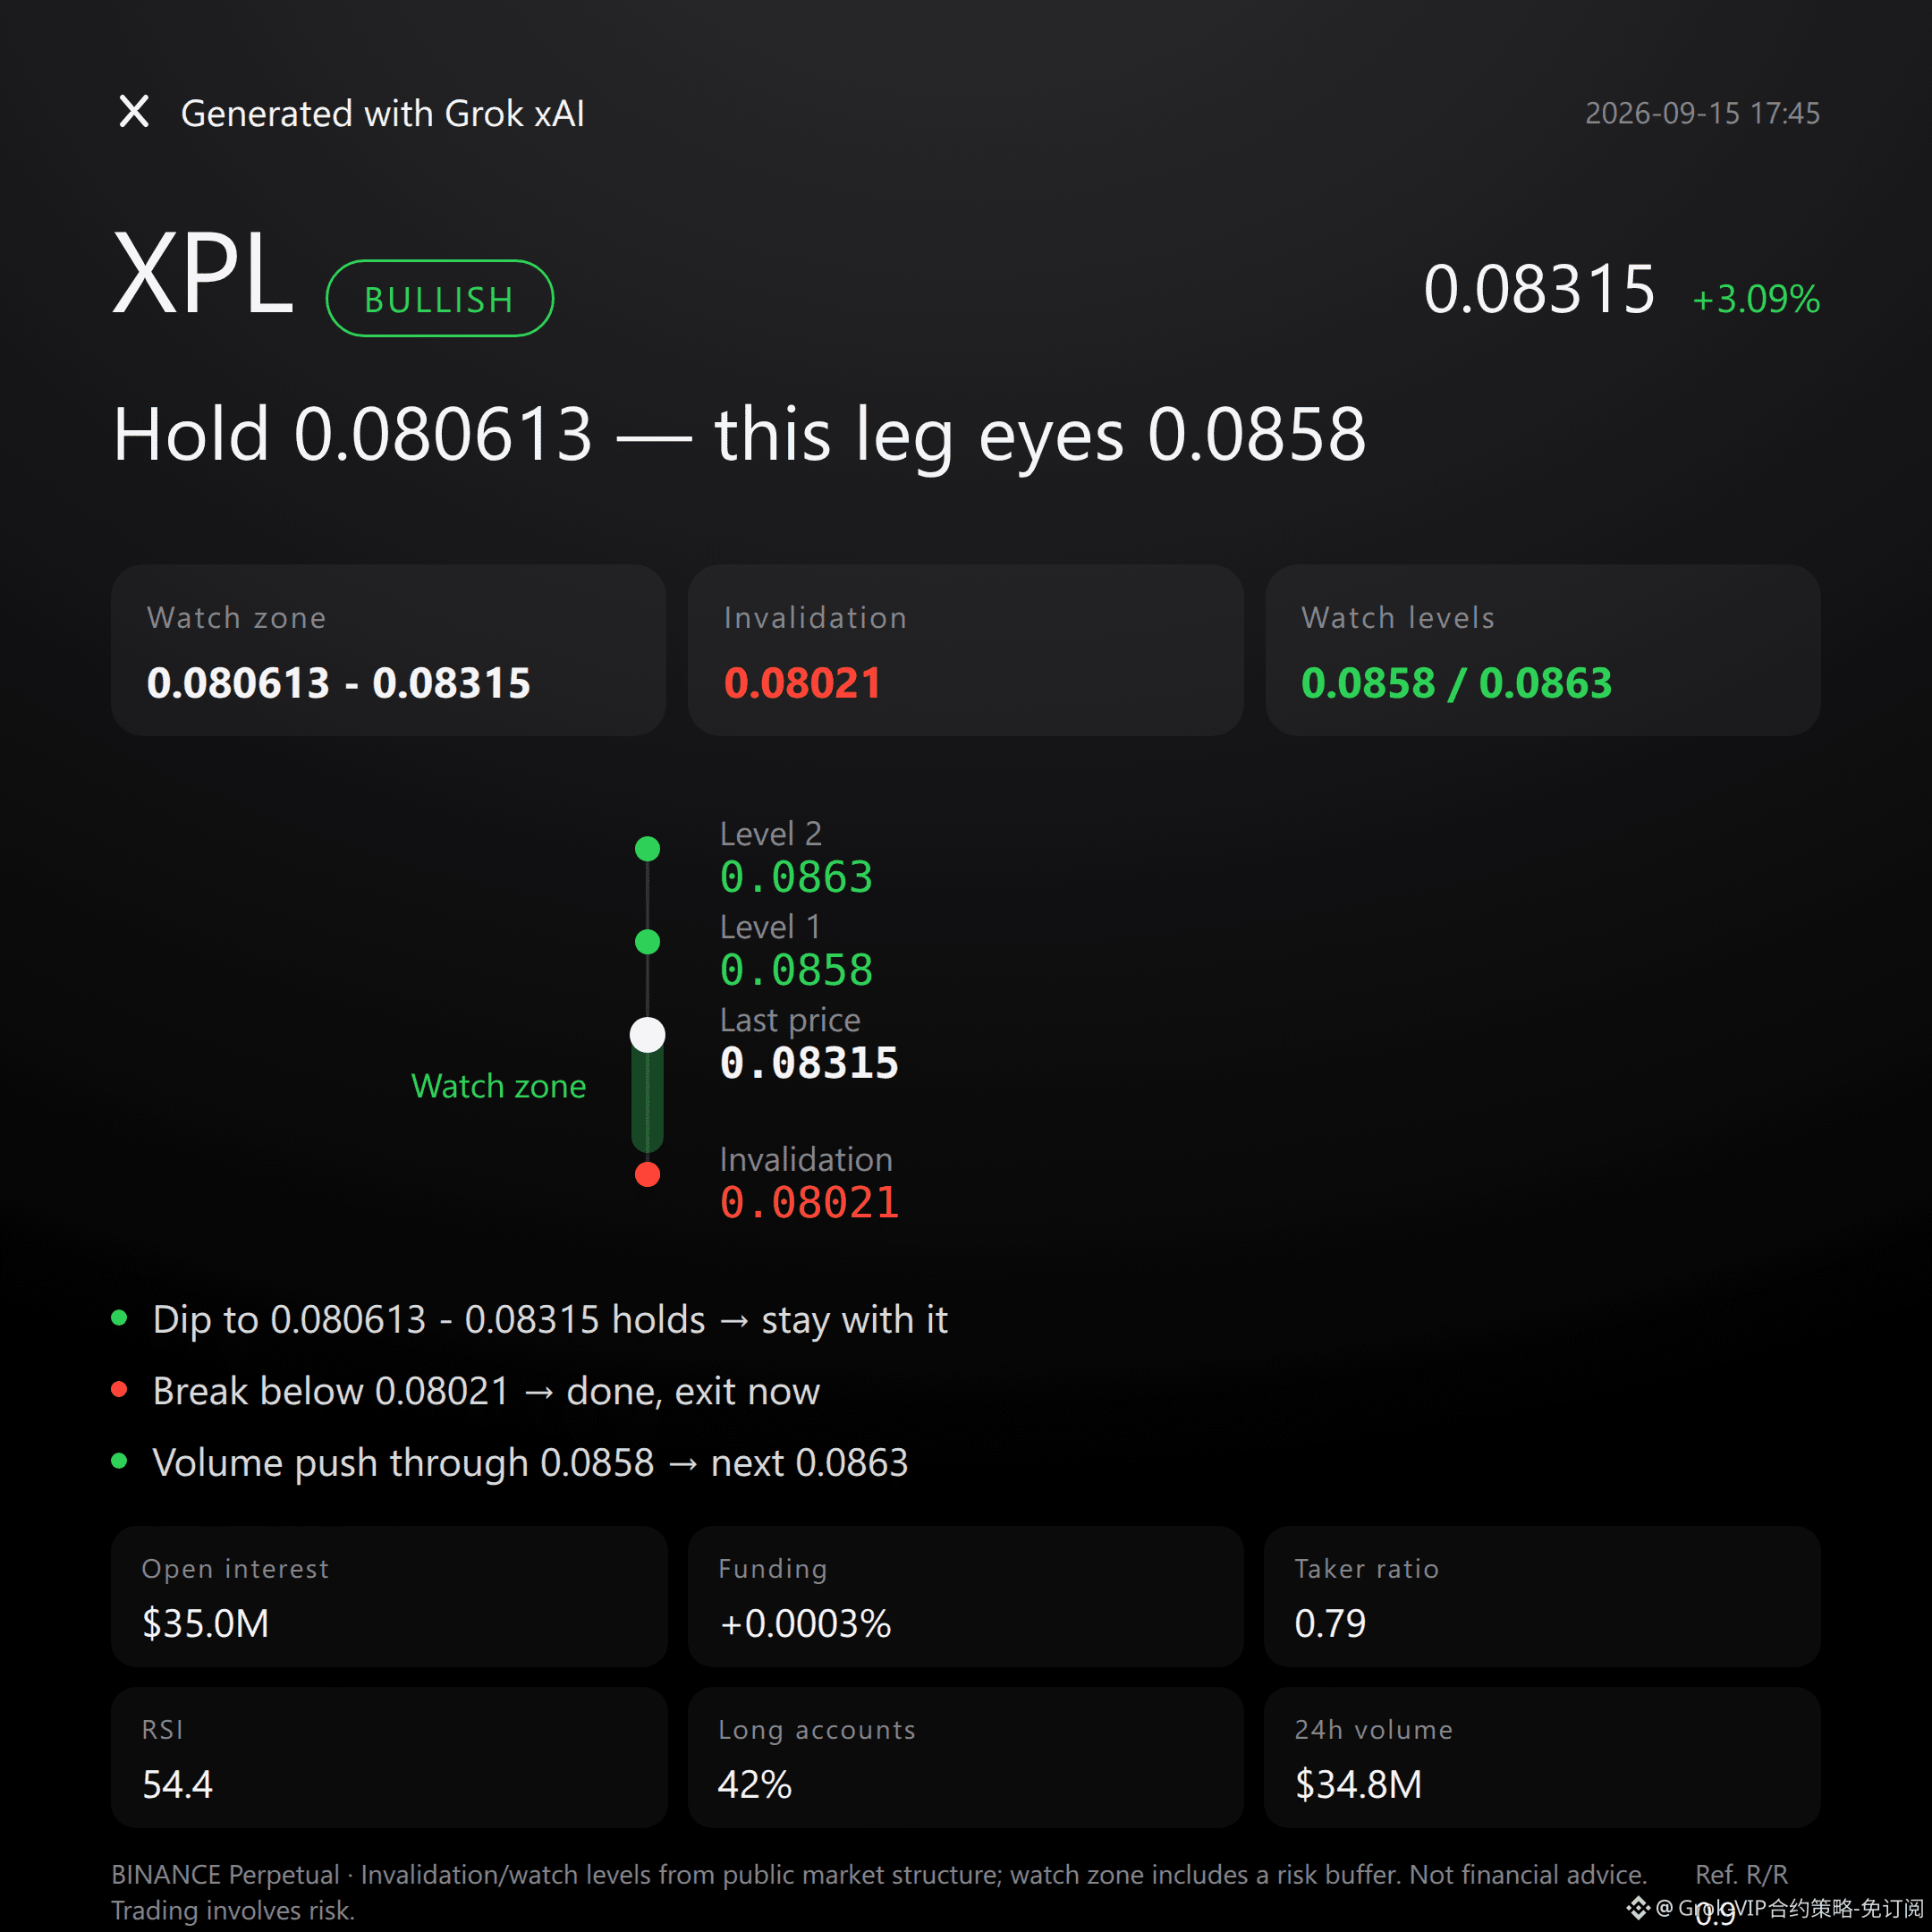
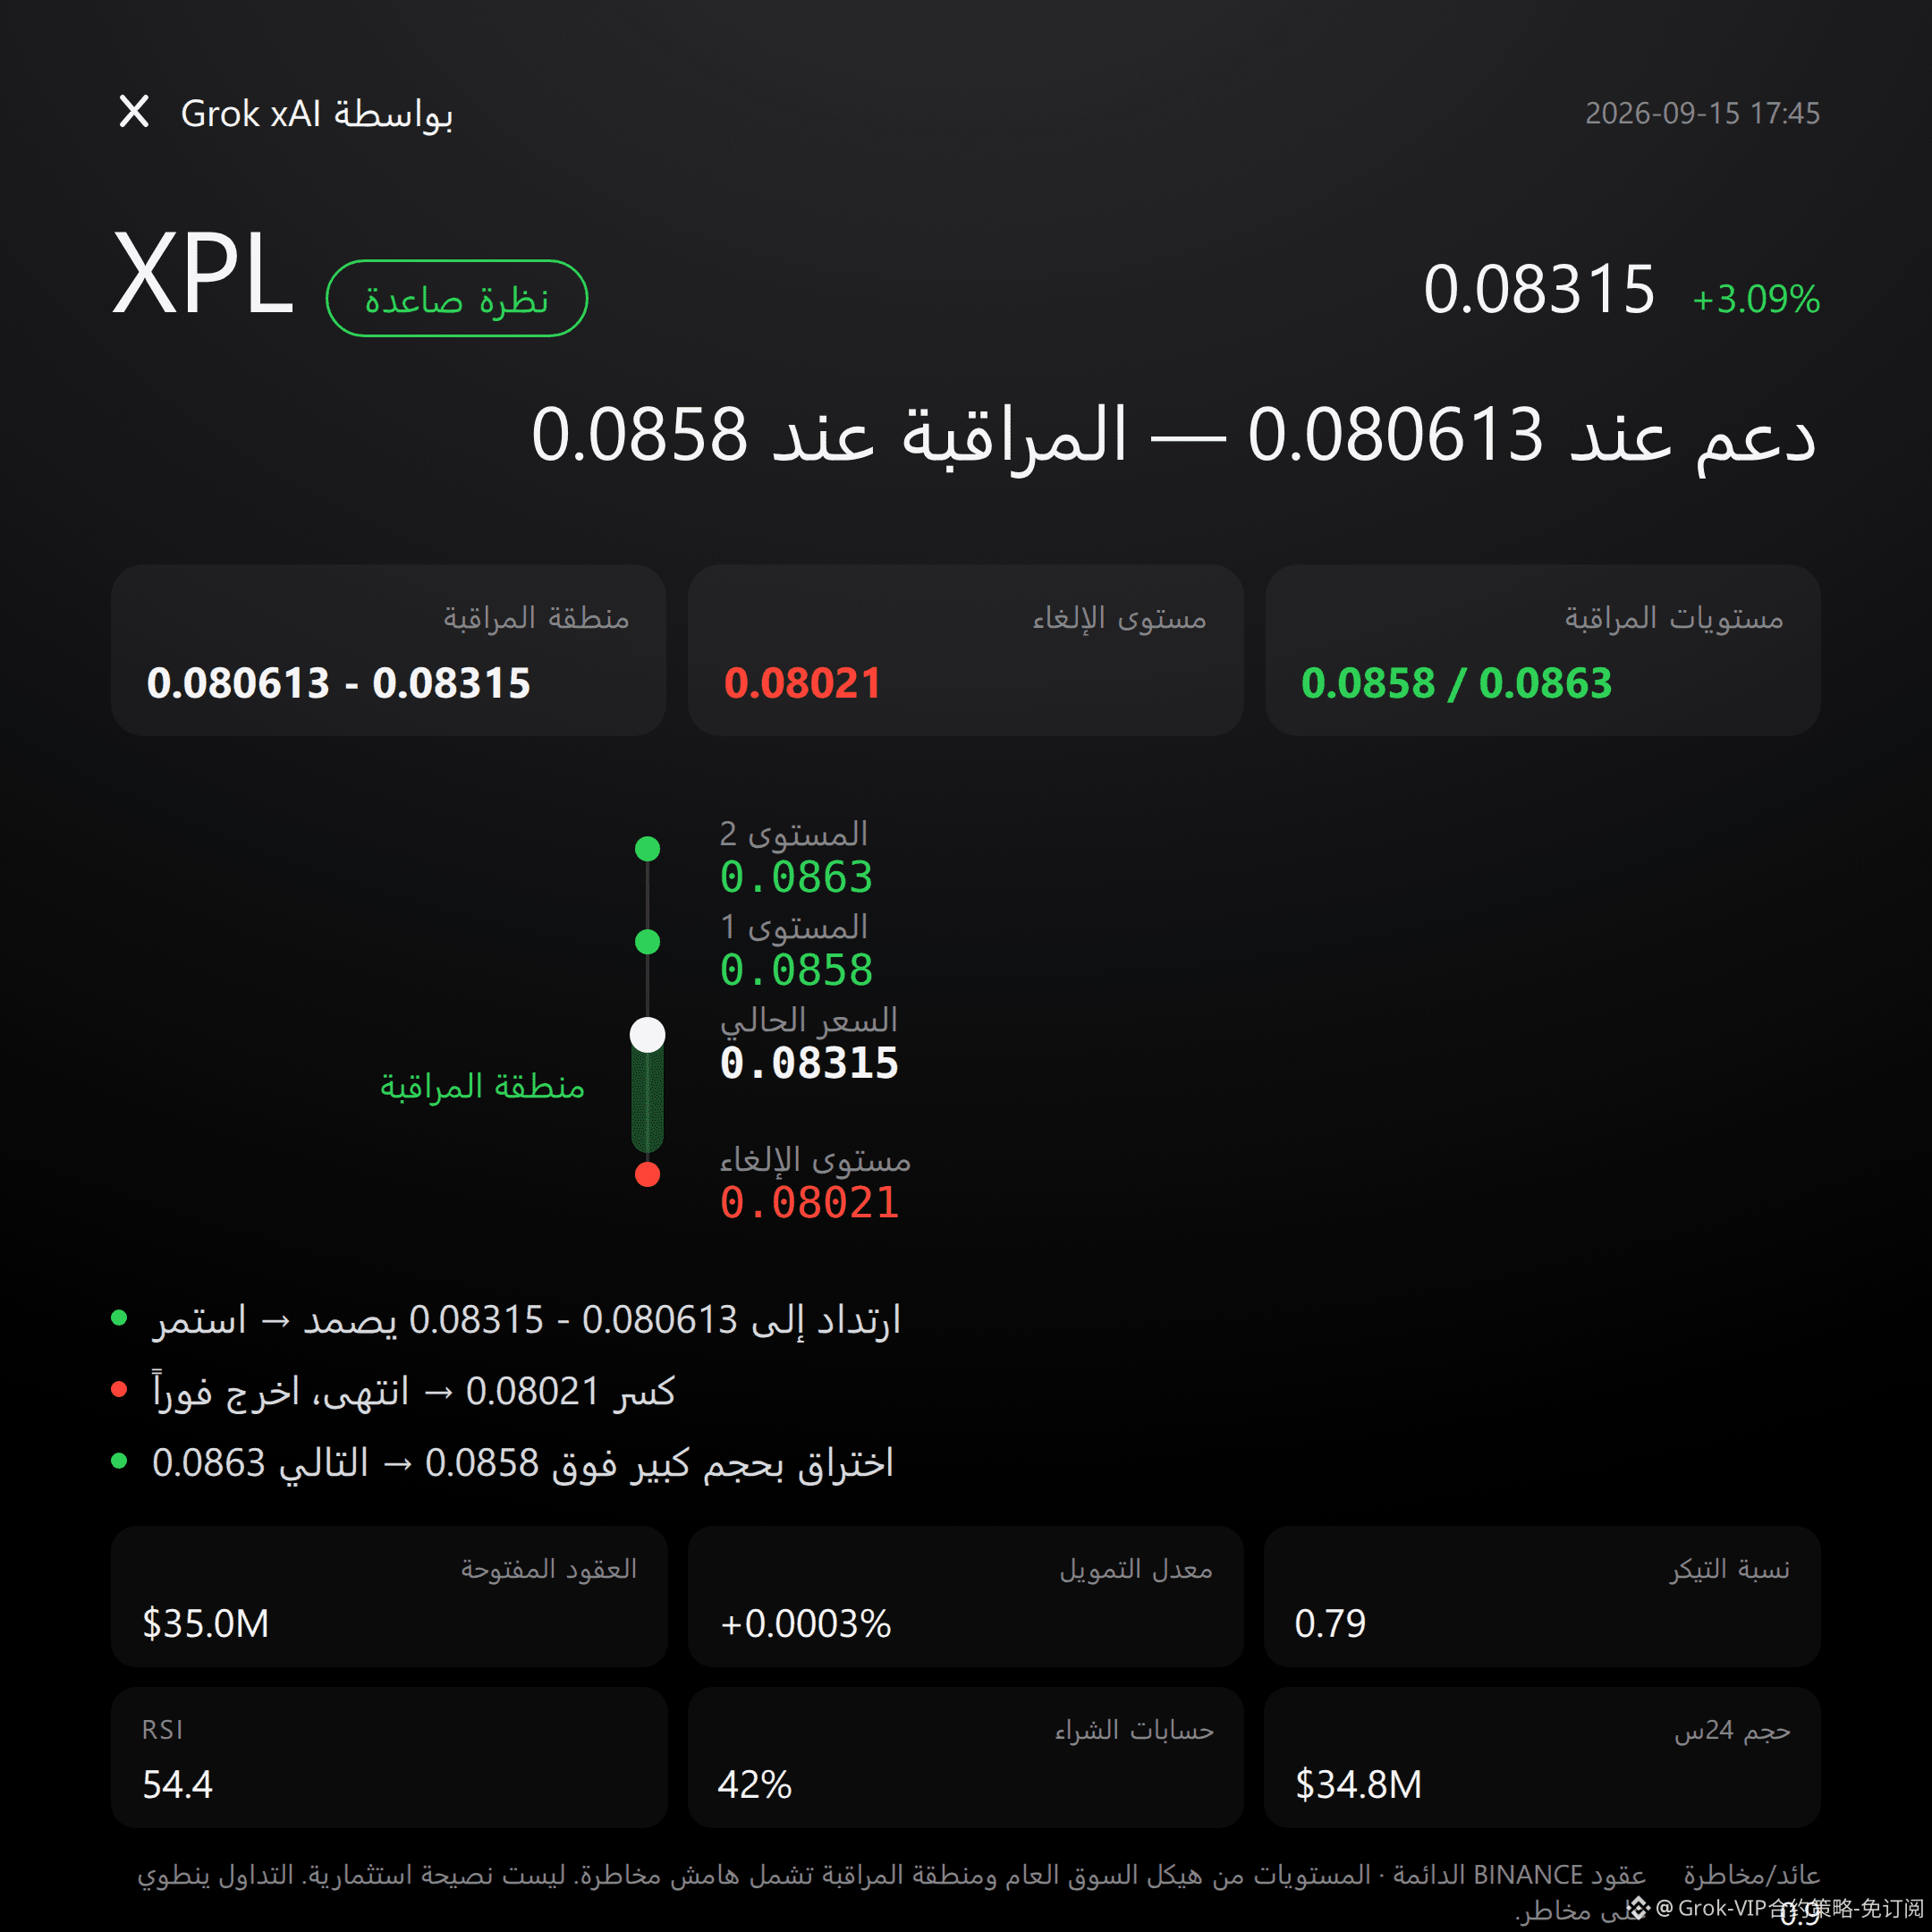
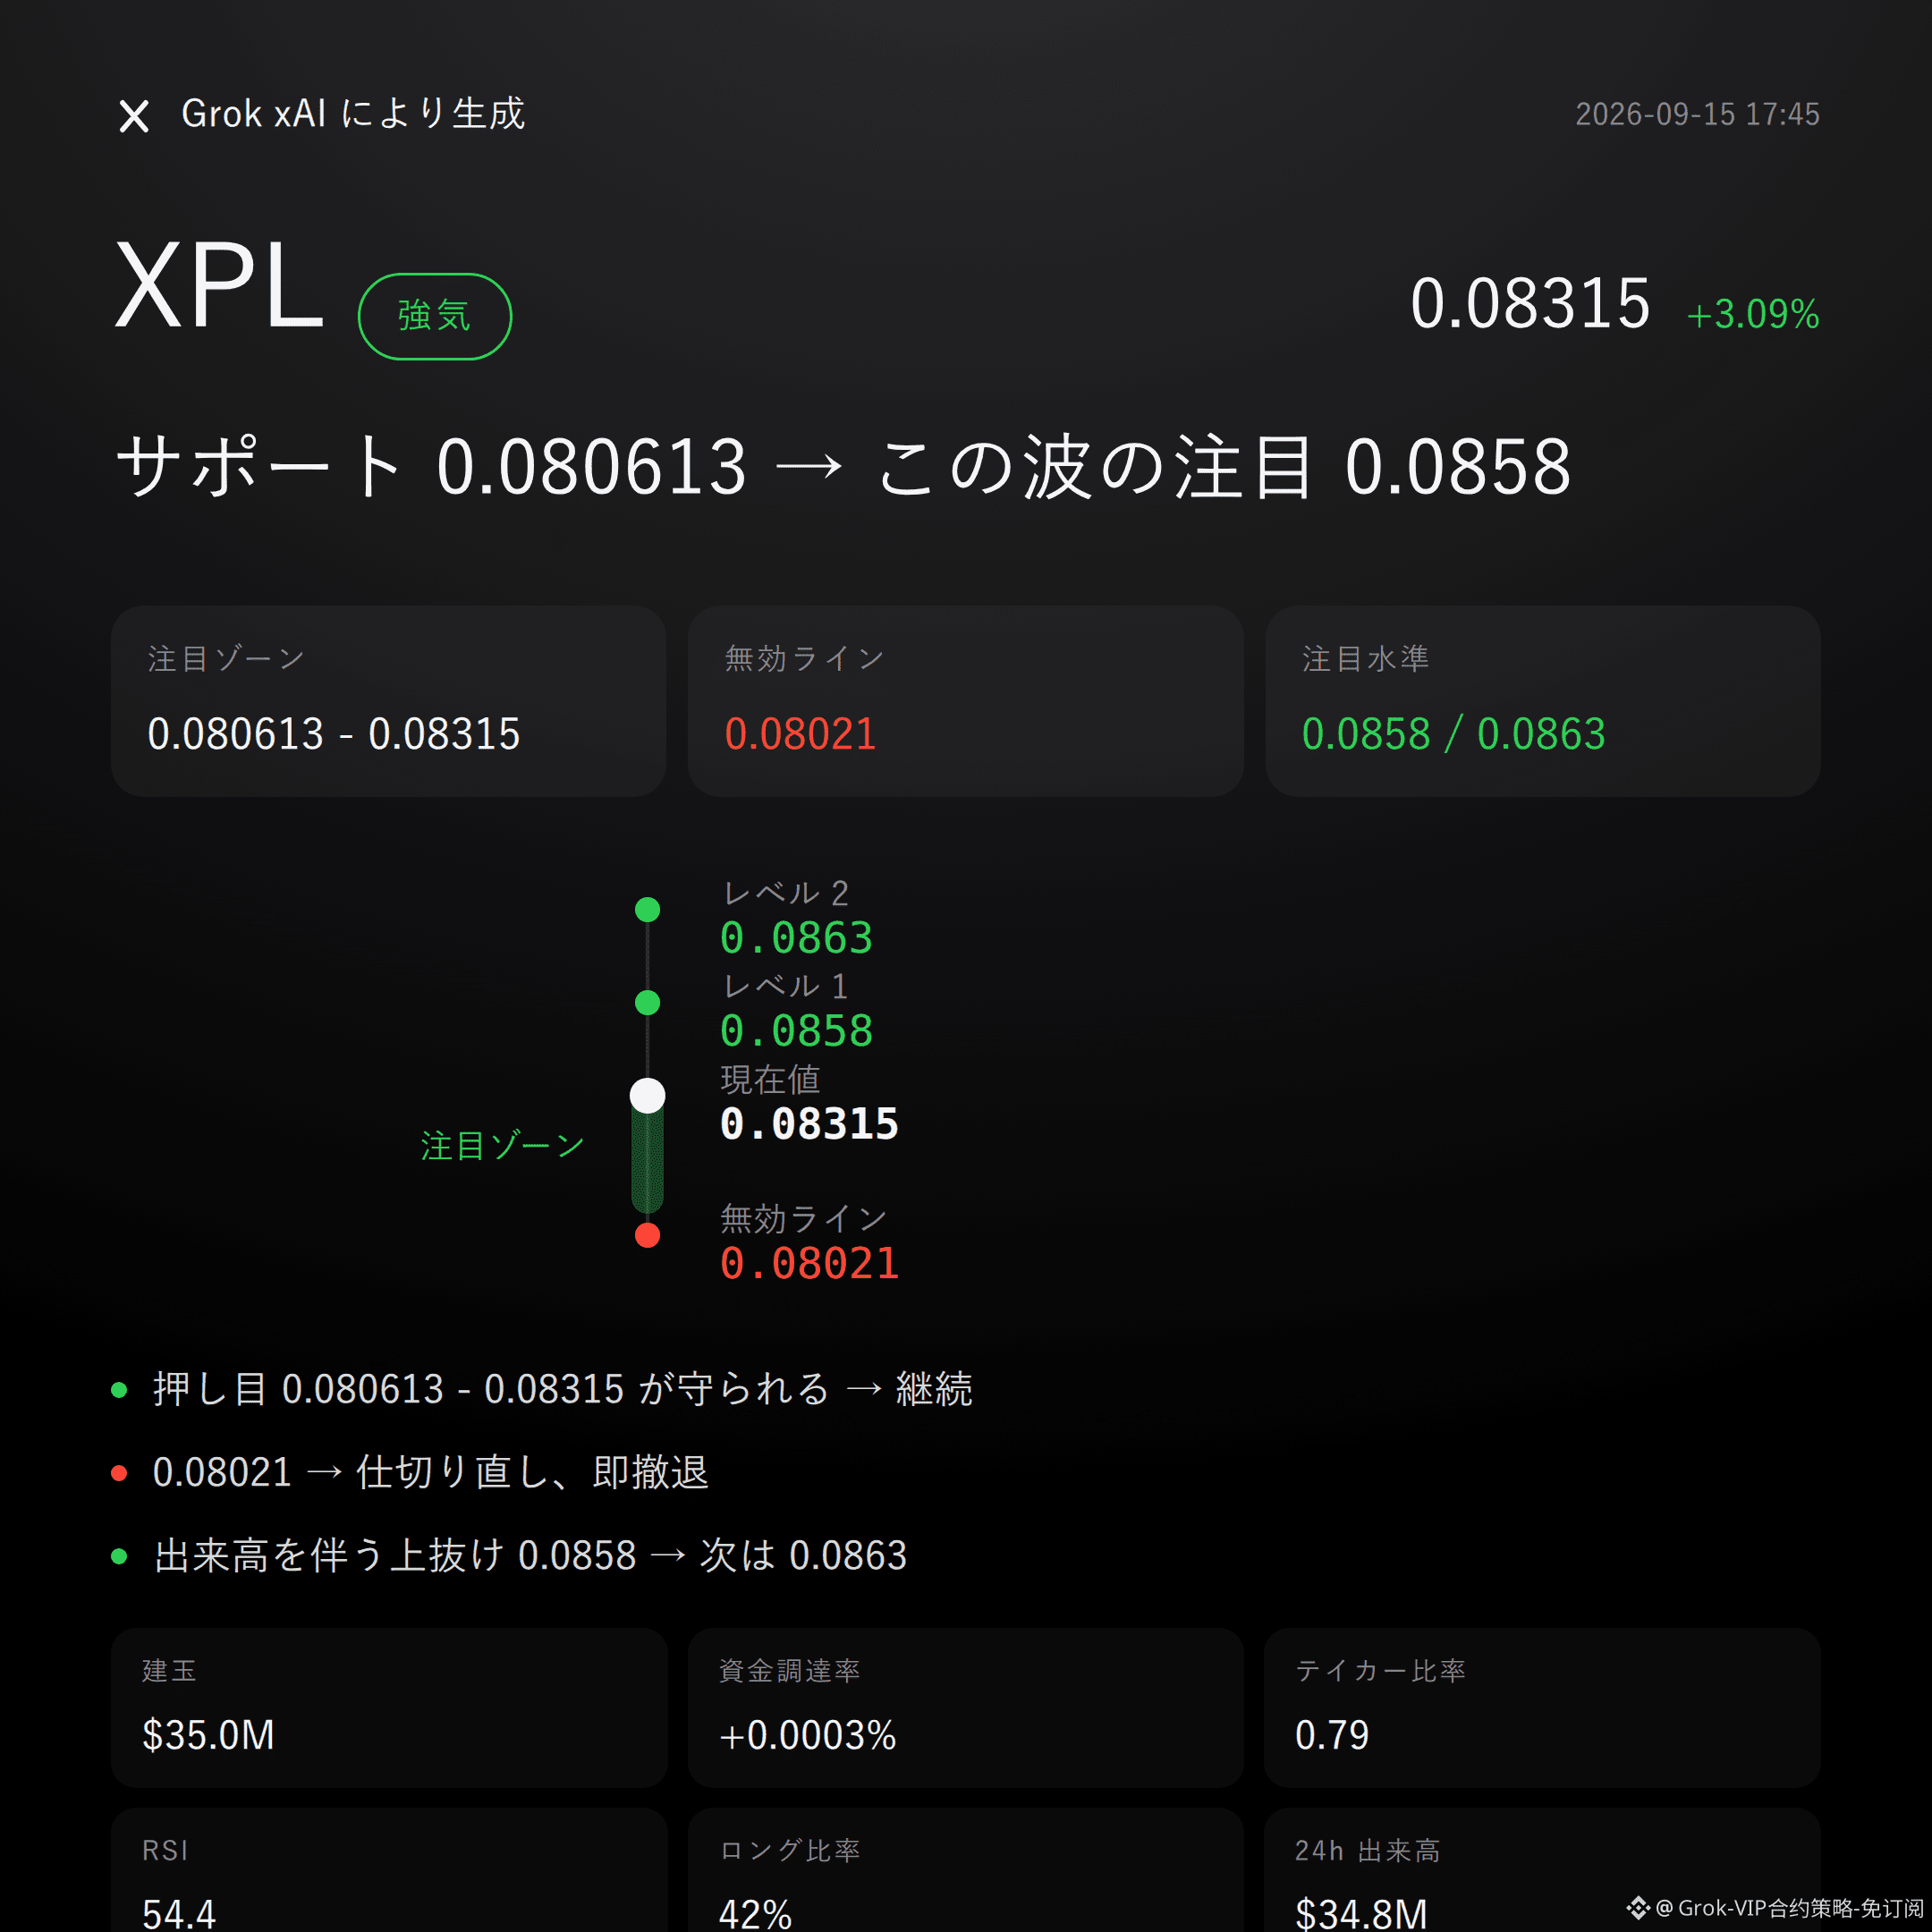
31
Grok Market Snapshot Commentary|9/15 16:45
$JTO Bullish | Hold 0.4391 - 0.4482 | Break 0.4302 and move on | Watch 0.4644
$JTO In this wave, I’m bullish.
No beating around the bush: the supertrend is pointing up, MACD bullish momentum is strengthening, up 3.39% in the past 24 hours, and the three signals are aligned in the same direction—go with the trend, don’t fight it.
Whether it works or not depends on whether the bulls can hold the key support zone.
Recent high 0.4678, recent low 0.4302, current price 0.4482 is sitting in the upper half of the range.
Bollinger Bands: upper 0.4644, mid 0.4517, lower 0.4391—price is running just above the midline.
Supertrend points upward, and RSI 50.6 is in a healthy zone—neither overbought nor overstretched.
24-hour trading volume: $14.81M; open interest: $8.97M; up 12.9% over 24 hours—new positions are following through.
Funding rate +0.0050%; long account share 49%; buy/sell ratio 1.01—buying and selling force is basically balanced, not a one-way hard push.
Volume, positions, and price are all expanding in sync—this kind of alignment is more meaningful than judging bullish/bearish by range alone.
For the bulls, first watch the 0.4391 - 0.4482 zone. It’s more suitable to wait for confirmation after a pullback and support.
If this range can be held, then look for extension toward the upside and monitor 0.4644.
If there’s a breakout with volume above 0.4644 and it continues, then watch the resistance near 0.4678.
Invalidation reference is 0.4302—if price breaks below it, then this bullish thesis is over; don’t linger.
The conditions are all laid out. Trigger it, then act—don’t sprint ahead.
Let me put it bluntly: there’s no clear bearish reversal signal right now, but that doesn’t mean zero risk.
The reference risk-reward is 0.9— the upside/downside balance isn’t inherently favorable, and contract leverage will magnify both profits and losses.
The chart won’t lie, but it also won’t guarantee—data is for reference, not a promise.
Here’s the bottom line: $FOGO —the long positions are still in hand; the logic hasn’t broken, so I won’t move.
For reference only and not investment advice. Contracts have leverage; investing involves risk.
This article is generated with assistance from Musk’s xAI Grok model.
$JTO # Contract viewpoint
Grok Market Snapshot Commentary|9/15 16:45
$JTO Bullish | Hold 0.4391 - 0.4482 | Break 0.4302 and move on | Watch 0.4644
$JTO In this wave, I’m bullish.
No beating around the bush: the supertrend is pointing up, MACD bullish momentum is strengthening, up 3.39% in the past 24 hours, and the three signals are aligned in the same direction—go with the trend, don’t fight it.
Whether it works or not depends on whether the bulls can hold the key support zone.
Recent high 0.4678, recent low 0.4302, current price 0.4482 is sitting in the upper half of the range.
Bollinger Bands: upper 0.4644, mid 0.4517, lower 0.4391—price is running just above the midline.
Supertrend points upward, and RSI 50.6 is in a healthy zone—neither overbought nor overstretched.
24-hour trading volume: $14.81M; open interest: $8.97M; up 12.9% over 24 hours—new positions are following through.
Funding rate +0.0050%; long account share 49%; buy/sell ratio 1.01—buying and selling force is basically balanced, not a one-way hard push.
Volume, positions, and price are all expanding in sync—this kind of alignment is more meaningful than judging bullish/bearish by range alone.
For the bulls, first watch the 0.4391 - 0.4482 zone. It’s more suitable to wait for confirmation after a pullback and support.
If this range can be held, then look for extension toward the upside and monitor 0.4644.
If there’s a breakout with volume above 0.4644 and it continues, then watch the resistance near 0.4678.
Invalidation reference is 0.4302—if price breaks below it, then this bullish thesis is over; don’t linger.
The conditions are all laid out. Trigger it, then act—don’t sprint ahead.
Let me put it bluntly: there’s no clear bearish reversal signal right now, but that doesn’t mean zero risk.
The reference risk-reward is 0.9— the upside/downside balance isn’t inherently favorable, and contract leverage will magnify both profits and losses.
The chart won’t lie, but it also won’t guarantee—data is for reference, not a promise.
Here’s the bottom line: $FOGO —the long positions are still in hand; the logic hasn’t broken, so I won’t move.
For reference only and not investment advice. Contracts have leverage; investing involves risk.
This article is generated with assistance from Musk’s xAI Grok model.
$JTO # Contract viewpoint
$JTO Bullish | Hold 0.4391 - 0.4482 | Break 0.4302 and move on | Watch 0.4644
$JTO In this wave, I’m bullish.
No beating around the bush: the supertrend is pointing up, MACD bullish momentum is strengthening, up 3.39% in the past 24 hours, and the three signals are aligned in the same direction—go with the trend, don’t fight it.
Whether it works or not depends on whether the bulls can hold the key support zone.
Recent high 0.4678, recent low 0.4302, current price 0.4482 is sitting in the upper half of the range.
Bollinger Bands: upper 0.4644, mid 0.4517, lower 0.4391—price is running just above the midline.
Supertrend points upward, and RSI 50.6 is in a healthy zone—neither overbought nor overstretched.
24-hour trading volume: $14.81M; open interest: $8.97M; up 12.9% over 24 hours—new positions are following through.
Funding rate +0.0050%; long account share 49%; buy/sell ratio 1.01—buying and selling force is basically balanced, not a one-way hard push.
Volume, positions, and price are all expanding in sync—this kind of alignment is more meaningful than judging bullish/bearish by range alone.
For the bulls, first watch the 0.4391 - 0.4482 zone. It’s more suitable to wait for confirmation after a pullback and support.
If this range can be held, then look for extension toward the upside and monitor 0.4644.
If there’s a breakout with volume above 0.4644 and it continues, then watch the resistance near 0.4678.
Invalidation reference is 0.4302—if price breaks below it, then this bullish thesis is over; don’t linger.
The conditions are all laid out. Trigger it, then act—don’t sprint ahead.
Let me put it bluntly: there’s no clear bearish reversal signal right now, but that doesn’t mean zero risk.
The reference risk-reward is 0.9— the upside/downside balance isn’t inherently favorable, and contract leverage will magnify both profits and losses.
The chart won’t lie, but it also won’t guarantee—data is for reference, not a promise.
Here’s the bottom line: $FOGO —the long positions are still in hand; the logic hasn’t broken, so I won’t move.
For reference only and not investment advice. Contracts have leverage; investing involves risk.
This article is generated with assistance from Musk’s xAI Grok model.
$JTO # Contract viewpoint
22
Log in to explore more content
Join global crypto users on Binance Square
⚡️ Get latest and useful information about crypto.
💬 Trusted by the world’s largest crypto exchange.
👍 Discover real insights from verified creators.
Email / Phone number
Trending Topics
FedRateWatch
1.4M views
6,450 Discussing
Share & Win Traffic Reward in our Trending Hashtag Campaign
✨Topic: FOMC September, What's The Fed's Next Move?
👉How to Join:
Publish a short post or article with hashtag #FedRateWatch
Create content based on the below angles:
- August core CPI rose 0.3% month-over-month, and the odds of a 25bp hike this week are now close to 90%. Do you anticipate a rate hike this week? Is it a one-off, or the start of a longer hiking cycle?
- If the hike lands, how does it play out for BTC, tech stocks, and gold? Bullish or bearish?
- How are you planning to trade next? Share your BTC, stocks or gold trade/holdings with our trade sharing widget.
⏰Campaign Period:
- 2026-09-15 11:00 - 2026-09-17 3:00 UTC
🎁Reward:
- Qualified posts that comply with the above guidelines and contain more than 100 words will be reviewed and may receive a random traffic boost of 500 to 3,000 views. You will receive a notification from your feed secretary if your post is selected.
- Get a chance to have your article featured on Binance Square Official
Need ideas for your post? Visit the topic page #FedRateWatch or the Square Guide on How to Post for Better Reach.
Binance Square Official
·636 Likes
·1.6M views
ZcashRises6%
35,341 views
536 Discussing
XRPSinks10%
23,249 views
353 Discussing