
beeple-1
149 Posts

beeple-1
Report
Block User
0 Following
3 Followers
2 Liked
Posts
·
--
See translation
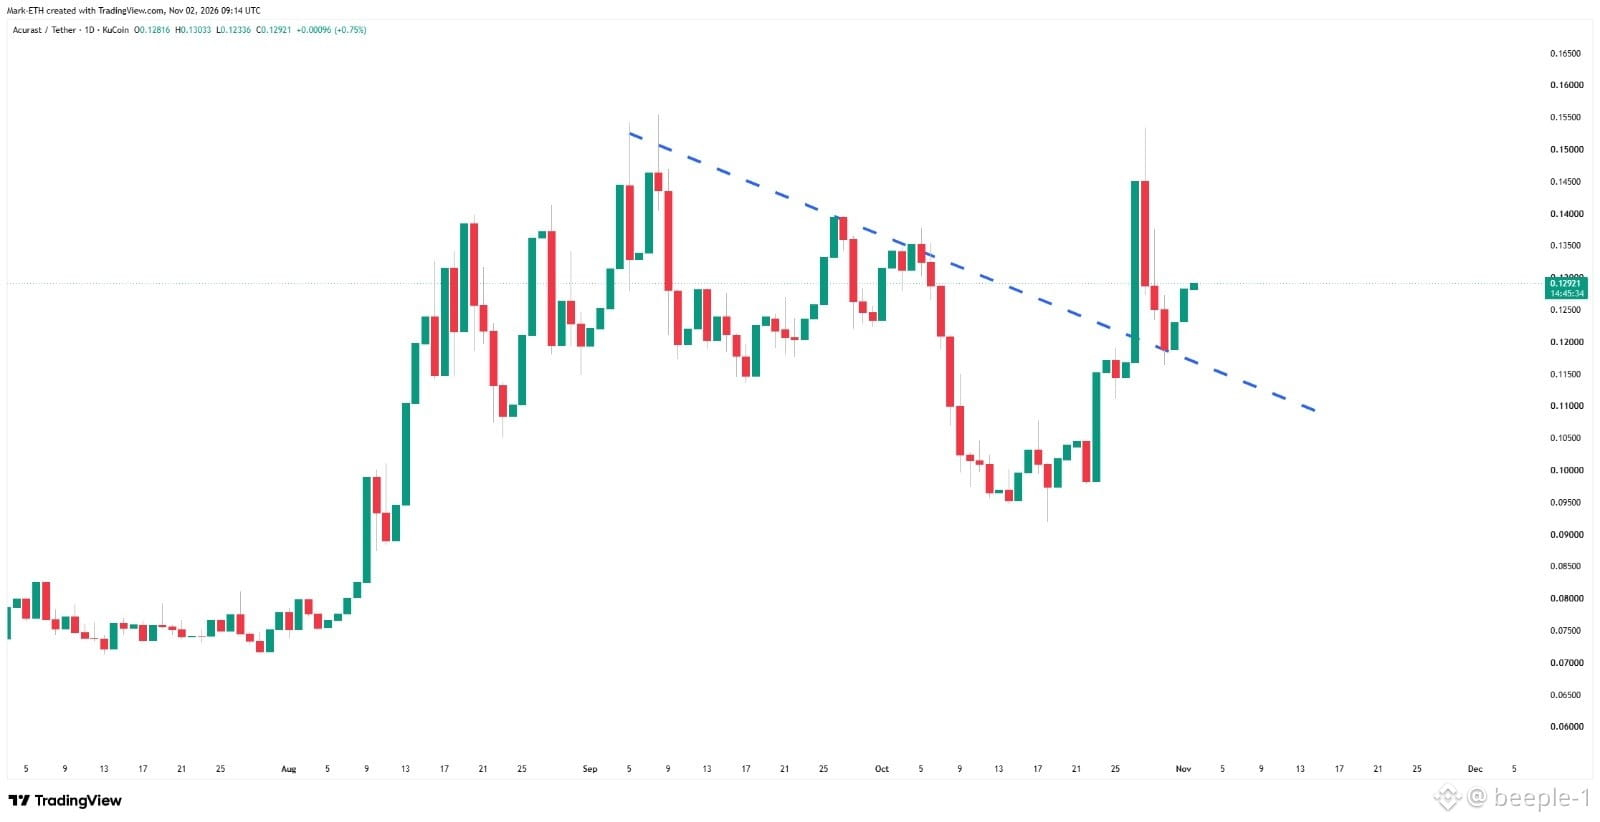
$ACU is showing signs of a trend reversal on the 1D chart.
Price has broken above a multi-month descending trendline and is now retesting it as potential support.
The key is holding $0.125–$0.128.
A successful hold could open the path toward $0.140, followed by $0.150–$0.155.
Lose this zone, and the breakout risks turning into a bull trap.
Watching the daily close for confirmation.
Join with my code: ns2dj
#BTC Price Analysis# #Macro Insights# #Altcoin Season# #Meme Alpha# #BNBChain#
$ACU is showing signs of a trend reversal on the 1D chart.
Price has broken above a multi-month descending trendline and is now retesting it as potential support.
The key is holding $0.125–$0.128.
A successful hold could open the path toward $0.140, followed by $0.150–$0.155.
Lose this zone, and the breakout risks turning into a bull trap.
Watching the daily close for confirmation.
Join with my code: ns2dj
#BTC Price Analysis# #Macro Insights# #Altcoin Season# #Meme Alpha# #BNBChain#
Price has broken above a multi-month descending trendline and is now retesting it as potential support.
The key is holding $0.125–$0.128.
A successful hold could open the path toward $0.140, followed by $0.150–$0.155.
Lose this zone, and the breakout risks turning into a bull trap.
Watching the daily close for confirmation.
Join with my code: ns2dj
#BTC Price Analysis# #Macro Insights# #Altcoin Season# #Meme Alpha# #BNBChain#
67
·
--
See translation
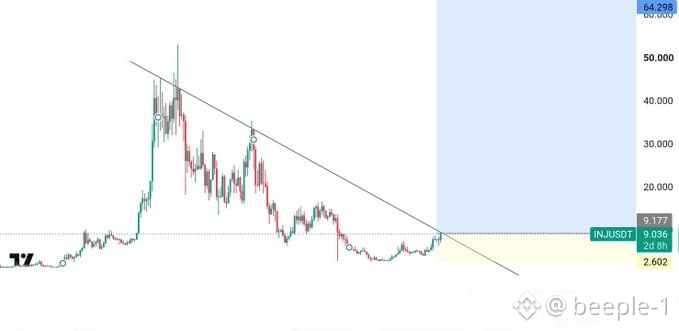
$INJ is squeezing into a major resistance zone 👀
One decisive move could change the whole chart.
#BTC Price Analysis# #Macro Insights# #Altcoin Season# #Meme Alpha# #BNBChain#
$INJ is squeezing into a major resistance zone 👀
One decisive move could change the whole chart.
#BTC Price Analysis# #Macro Insights# #Altcoin Season# #Meme Alpha# #BNBChain#
One decisive move could change the whole chart.
#BTC Price Analysis# #Macro Insights# #Altcoin Season# #Meme Alpha# #BNBChain#
66
·
--
See translation
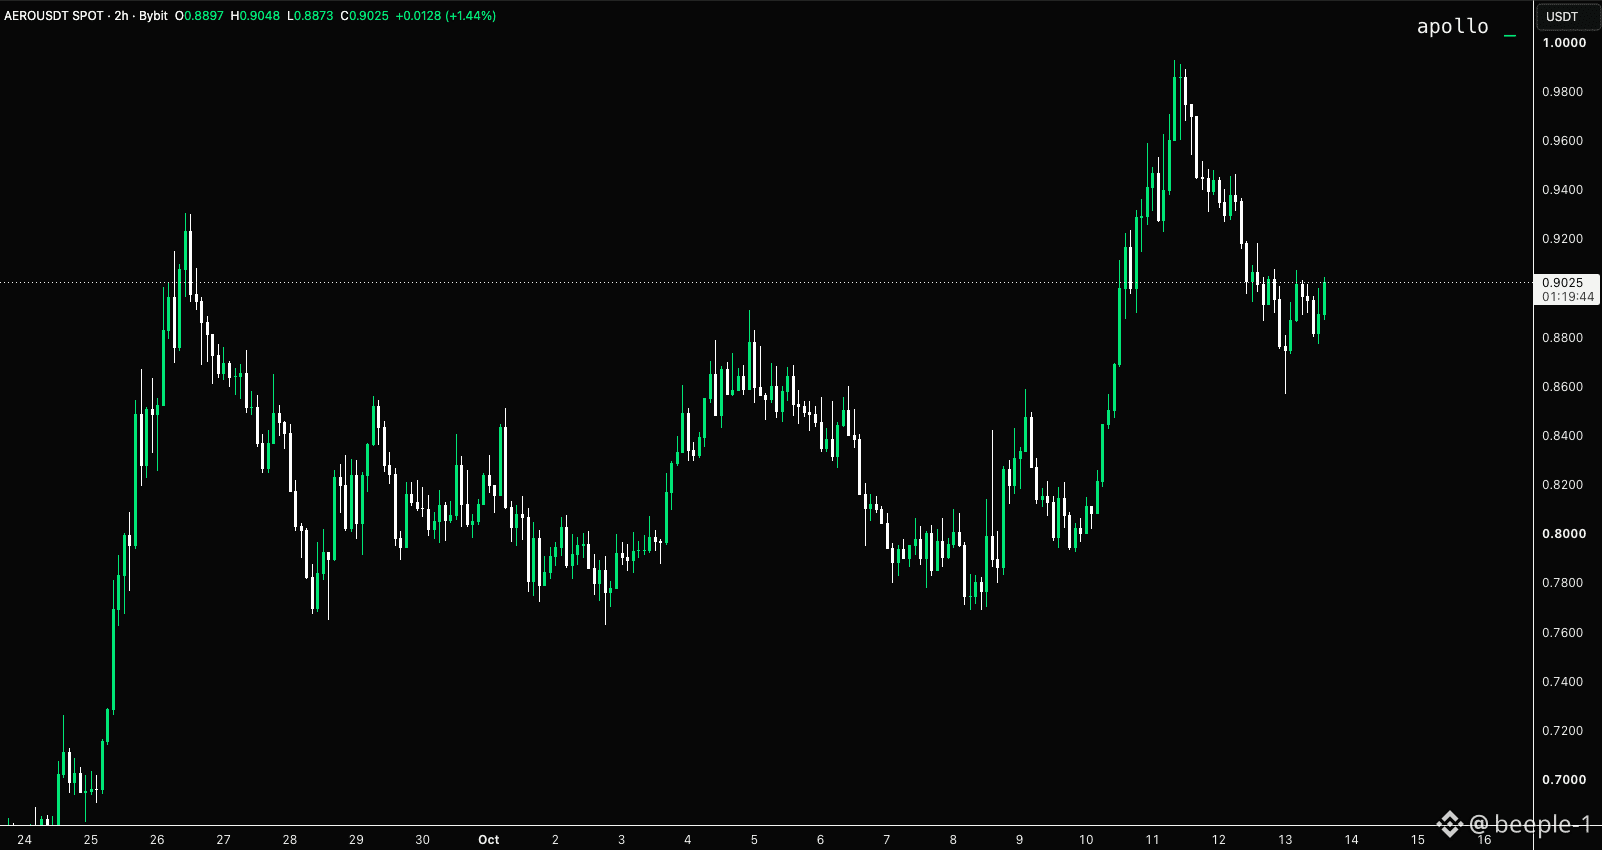
$AERO is cooling off after a strong rally, but buyers haven’t fully disappeared. 👀
Price is holding around $0.88–$0.90 after rejecting near $0.99.
Reclaim $0.94 and the next push toward $0.98–$1.00 gets interesting. Lose $0.88, and a deeper pullback could follow.
Watching the next move, not chasing the last one.
#BTC Price Analysis# #Macro Insights# #Altcoin Season# #Meme Alpha# #BNBChain#
$AERO is cooling off after a strong rally, but buyers haven’t fully disappeared. 👀
Price is holding around $0.88–$0.90 after rejecting near $0.99.
Reclaim $0.94 and the next push toward $0.98–$1.00 gets interesting. Lose $0.88, and a deeper pullback could follow.
Watching the next move, not chasing the last one.
#BTC Price Analysis# #Macro Insights# #Altcoin Season# #Meme Alpha# #BNBChain#
Price is holding around $0.88–$0.90 after rejecting near $0.99.
Reclaim $0.94 and the next push toward $0.98–$1.00 gets interesting. Lose $0.88, and a deeper pullback could follow.
Watching the next move, not chasing the last one.
#BTC Price Analysis# #Macro Insights# #Altcoin Season# #Meme Alpha# #BNBChain#
68
·
--
See translation
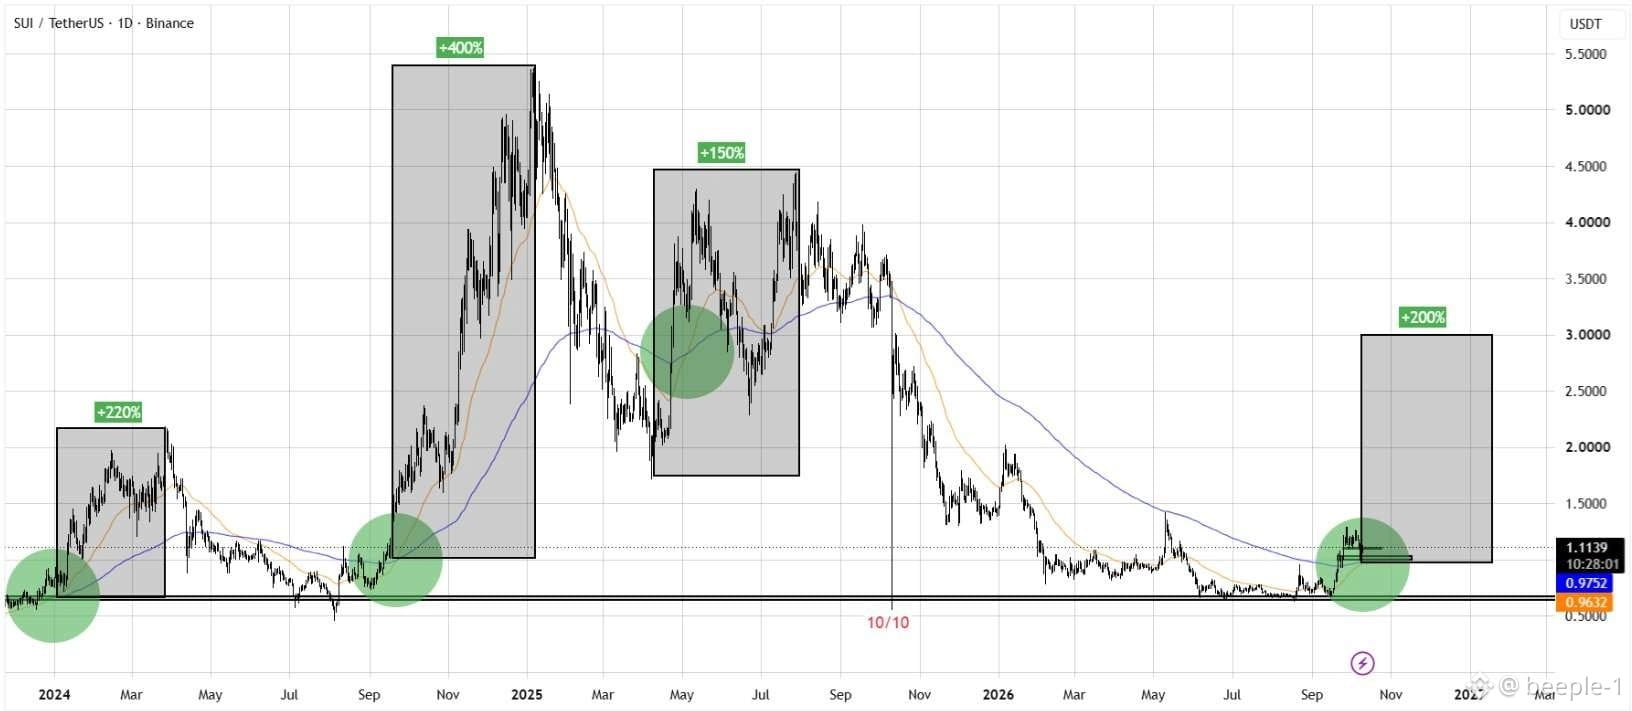
$SUI might be setting up for another big move.
Every major rally started near a similar base. Now price is back at that zone, trying to build momentum again.
History doesn’t guarantee a repeat, but this is a level worth watching.
If the pattern plays out, $SUI could surprise a lot of people.
#BTC Price Analysis# #Macro Insights# #Altcoin Season# #Meme Alpha# #BNBChain#
$SUI might be setting up for another big move.
Every major rally started near a similar base. Now price is back at that zone, trying to build momentum again.
History doesn’t guarantee a repeat, but this is a level worth watching.
If the pattern plays out, $SUI could surprise a lot of people.
#BTC Price Analysis# #Macro Insights# #Altcoin Season# #Meme Alpha# #BNBChain#
Every major rally started near a similar base. Now price is back at that zone, trying to build momentum again.
History doesn’t guarantee a repeat, but this is a level worth watching.
If the pattern plays out, $SUI could surprise a lot of people.
#BTC Price Analysis# #Macro Insights# #Altcoin Season# #Meme Alpha# #BNBChain#
85
·
--
See translation
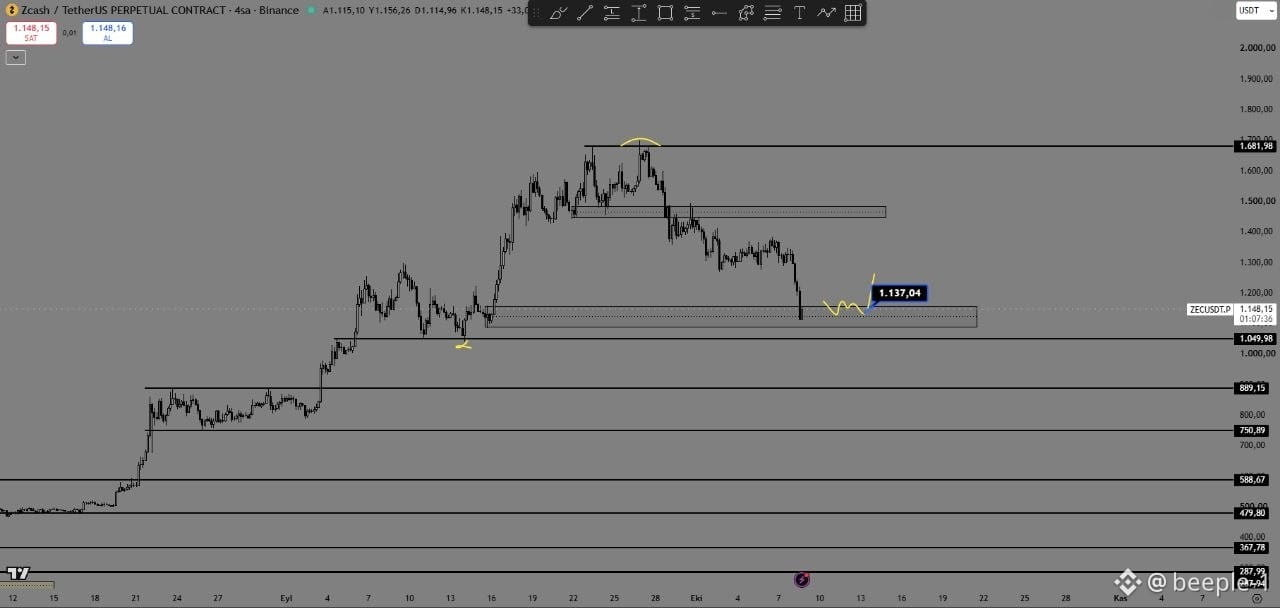
$ZEC
This pullback is actually sitting where I want it to.
$1,050–$1,100 is the key demand zone. If buyers defend it and reclaim $1,137, I’d be watching $1,450 first and eventually that $1,680 ATH zone.
Simple setup. Let price confirm it.
#BTC Price Analysis# #Macro Insights# #Altcoin Season# #Meme Alpha# #BNBChain#
$ZEC
This pullback is actually sitting where I want it to.
$1,050–$1,100 is the key demand zone. If buyers defend it and reclaim $1,137, I’d be watching $1,450 first and eventually that $1,680 ATH zone.
Simple setup. Let price confirm it.
#BTC Price Analysis# #Macro Insights# #Altcoin Season# #Meme Alpha# #BNBChain#
This pullback is actually sitting where I want it to.
$1,050–$1,100 is the key demand zone. If buyers defend it and reclaim $1,137, I’d be watching $1,450 first and eventually that $1,680 ATH zone.
Simple setup. Let price confirm it.
#BTC Price Analysis# #Macro Insights# #Altcoin Season# #Meme Alpha# #BNBChain#
67
·
--
See translation
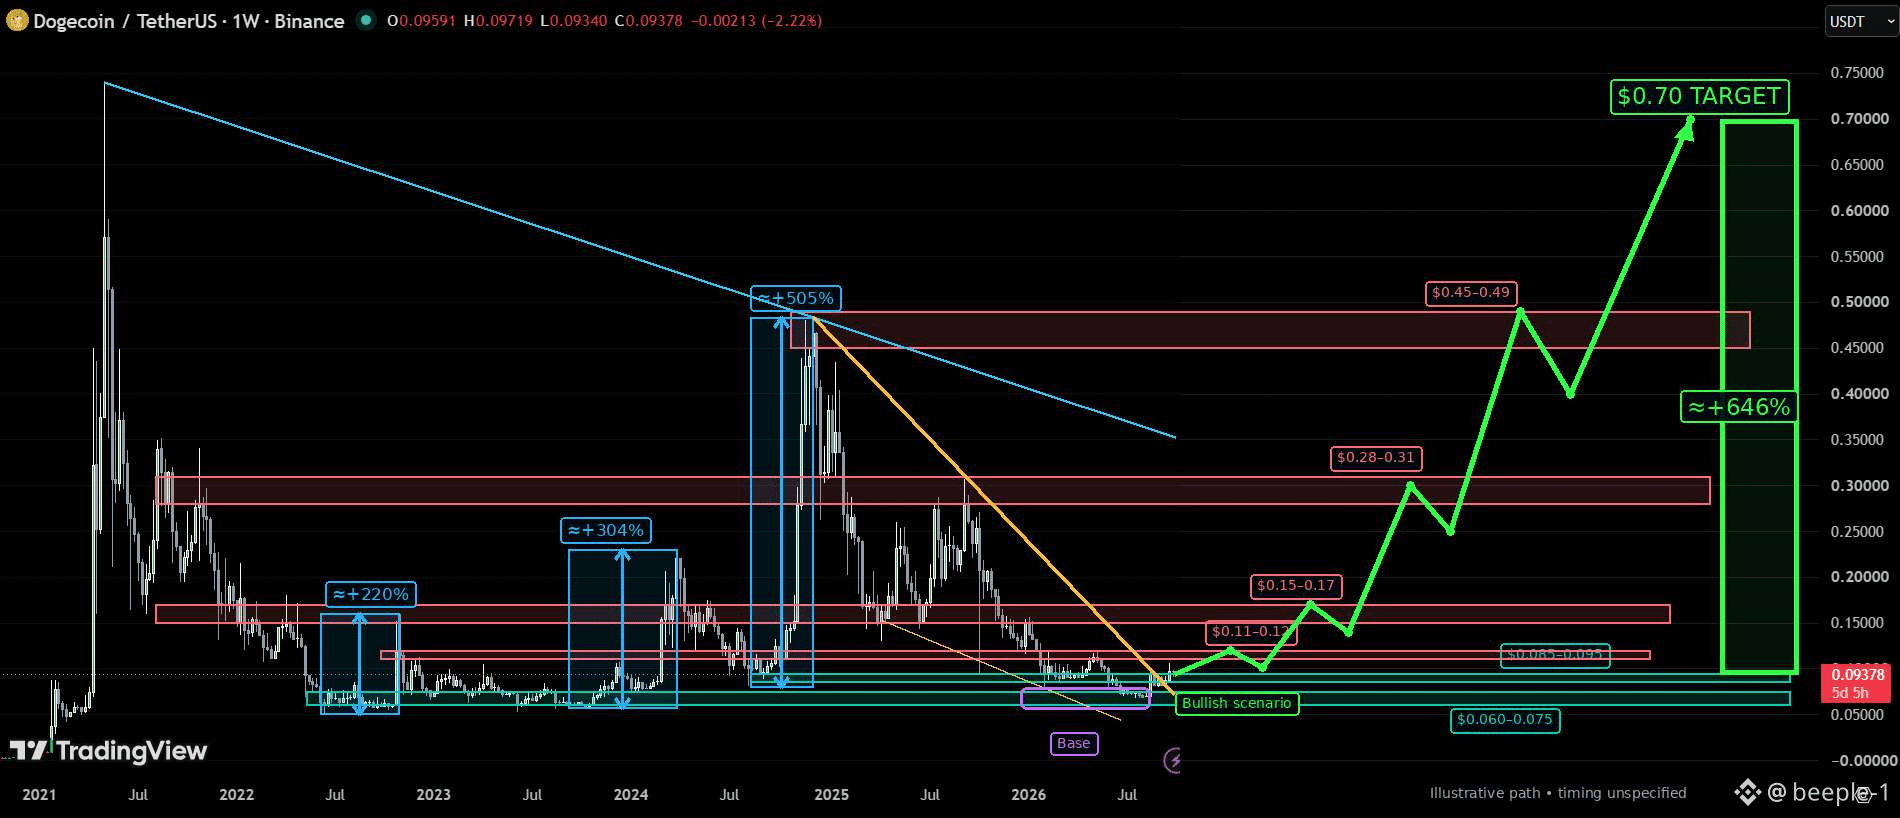
$DOGE is starting to look interesting from a higher-timeframe perspective.
The weekly chart is basically showing me one thing: DOGE is sitting near a major base, while the old downtrend is being tested.
I’m watching these levels:
• $0.06–0.075 → major demand/base
• $0.11–0.13 → first resistance
• $0.15–0.17 → next breakout zone
• $0.28–0.31 → major resistance
• $0.45–0.49 → the big one
If DOGE can reclaim these zones one by one, the structure gets very interesting.
And yes, the chart has a $0.70 long-term target but I’m not assuming a straight-line move there.
For me, the real confirmation is simple:
base holds → resistance flips to support → higher highs.
Until that happens, it’s a setup I’m watching, not chasing.
#BTC Price Analysis# #Macro Insights# #Altcoin Season# #Meme Alpha# #BNBChain#
$DOGE is starting to look interesting from a higher-timeframe perspective.
The weekly chart is basically showing me one thing: DOGE is sitting near a major base, while the old downtrend is being tested.
I’m watching these levels:
• $0.06–0.075 → major demand/base
• $0.11–0.13 → first resistance
• $0.15–0.17 → next breakout zone
• $0.28–0.31 → major resistance
• $0.45–0.49 → the big one
If DOGE can reclaim these zones one by one, the structure gets very interesting.
And yes, the chart has a $0.70 long-term target but I’m not assuming a straight-line move there.
For me, the real confirmation is simple:
base holds → resistance flips to support → higher highs.
Until that happens, it’s a setup I’m watching, not chasing.
#BTC Price Analysis# #Macro Insights# #Altcoin Season# #Meme Alpha# #BNBChain#
The weekly chart is basically showing me one thing: DOGE is sitting near a major base, while the old downtrend is being tested.
I’m watching these levels:
• $0.06–0.075 → major demand/base
• $0.11–0.13 → first resistance
• $0.15–0.17 → next breakout zone
• $0.28–0.31 → major resistance
• $0.45–0.49 → the big one
If DOGE can reclaim these zones one by one, the structure gets very interesting.
And yes, the chart has a $0.70 long-term target but I’m not assuming a straight-line move there.
For me, the real confirmation is simple:
base holds → resistance flips to support → higher highs.
Until that happens, it’s a setup I’m watching, not chasing.
#BTC Price Analysis# #Macro Insights# #Altcoin Season# #Meme Alpha# #BNBChain#
70
·
--
See translation
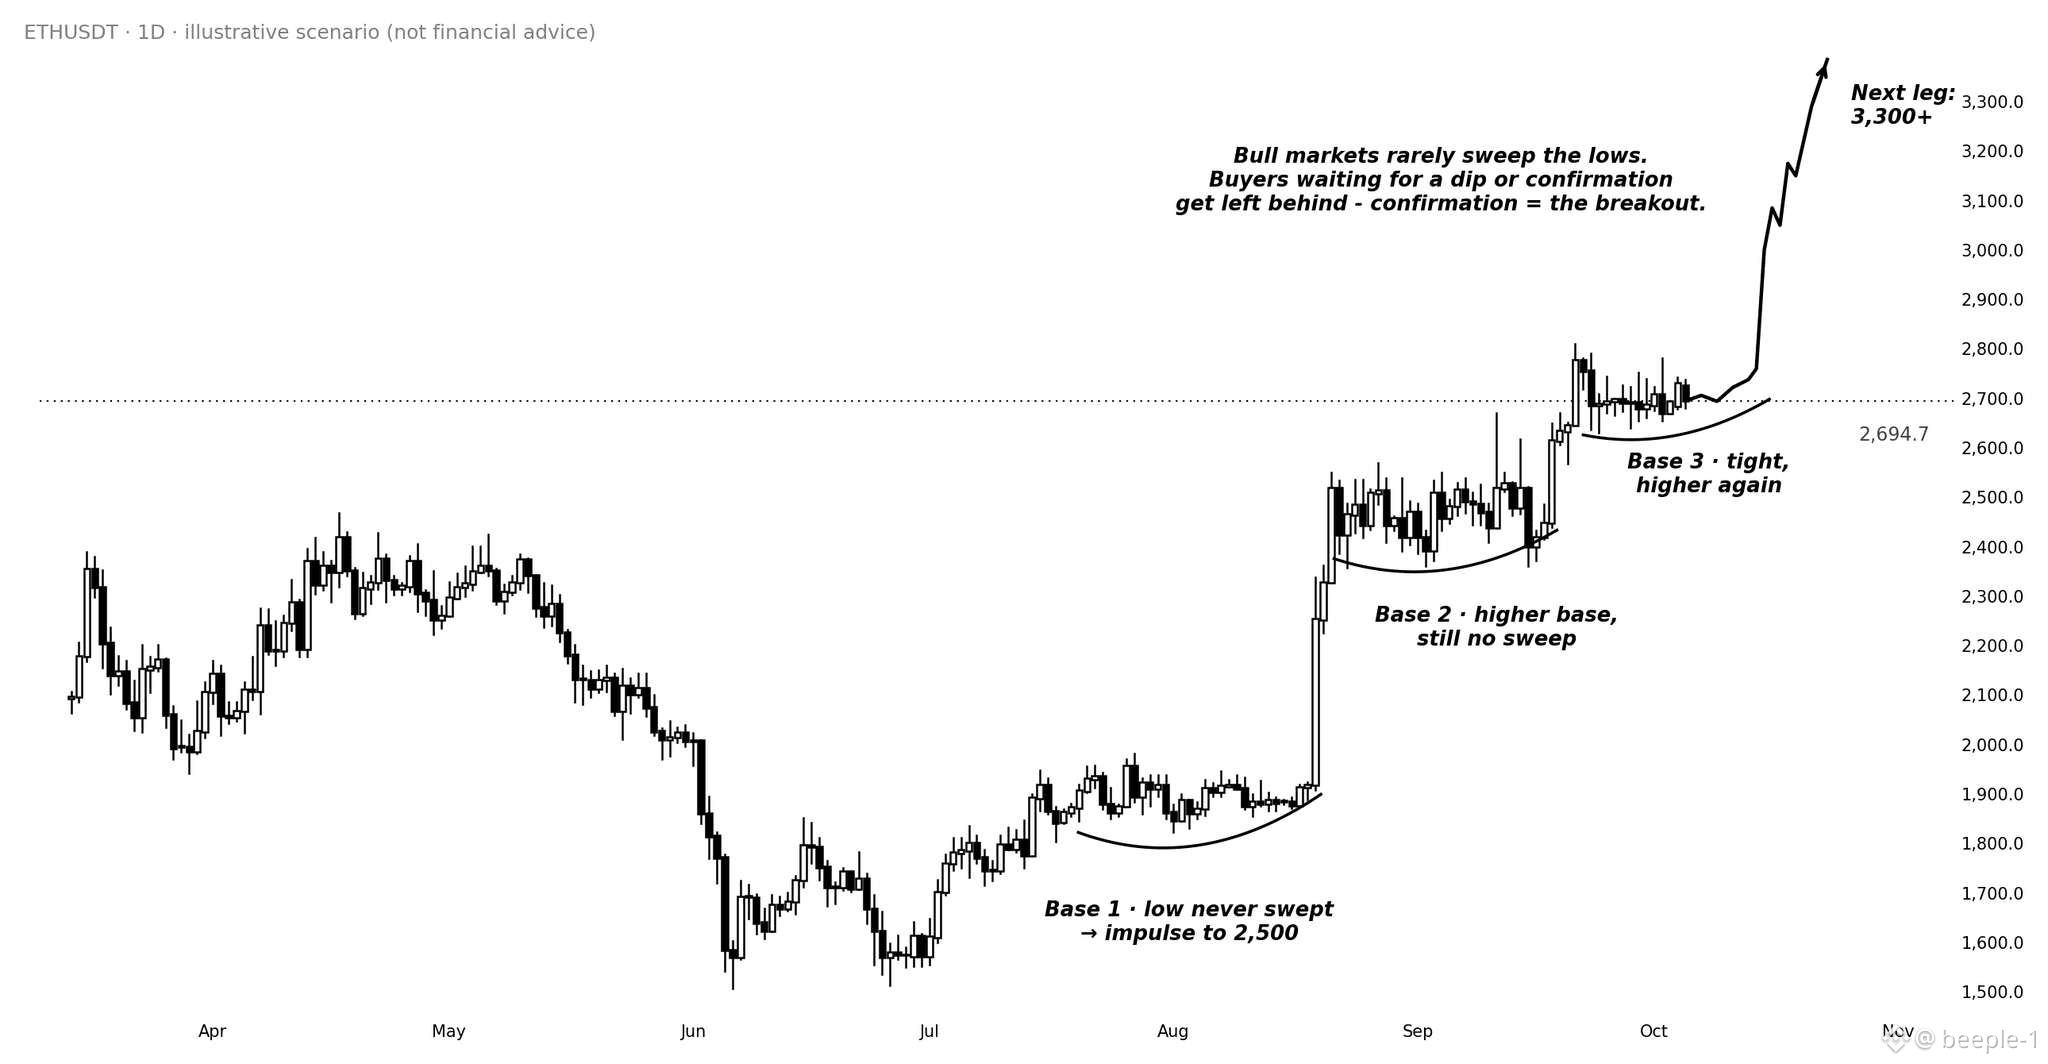
$ETH is quietly building one of the cleaner structures on the chart.
Three bases.
Three higher lows.
No real sweep of the previous lows.
That tells me sellers are struggling to push ETH deeper.
If $2.7K holds and momentum expands, $3K is the first area I’m watching then $3.3K.
The setup is simple: higher base → higher breakout.
#BTC Price Analysis# #Macro Insights# #Altcoin Season# #Meme Alpha# #BNBChain#
$ETH is quietly building one of the cleaner structures on the chart.
Three bases.
Three higher lows.
No real sweep of the previous lows.
That tells me sellers are struggling to push ETH deeper.
If $2.7K holds and momentum expands, $3K is the first area I’m watching then $3.3K.
The setup is simple: higher base → higher breakout.
#BTC Price Analysis# #Macro Insights# #Altcoin Season# #Meme Alpha# #BNBChain#
Three bases.
Three higher lows.
No real sweep of the previous lows.
That tells me sellers are struggling to push ETH deeper.
If $2.7K holds and momentum expands, $3K is the first area I’m watching then $3.3K.
The setup is simple: higher base → higher breakout.
#BTC Price Analysis# #Macro Insights# #Altcoin Season# #Meme Alpha# #BNBChain#
71
·
--
See translation
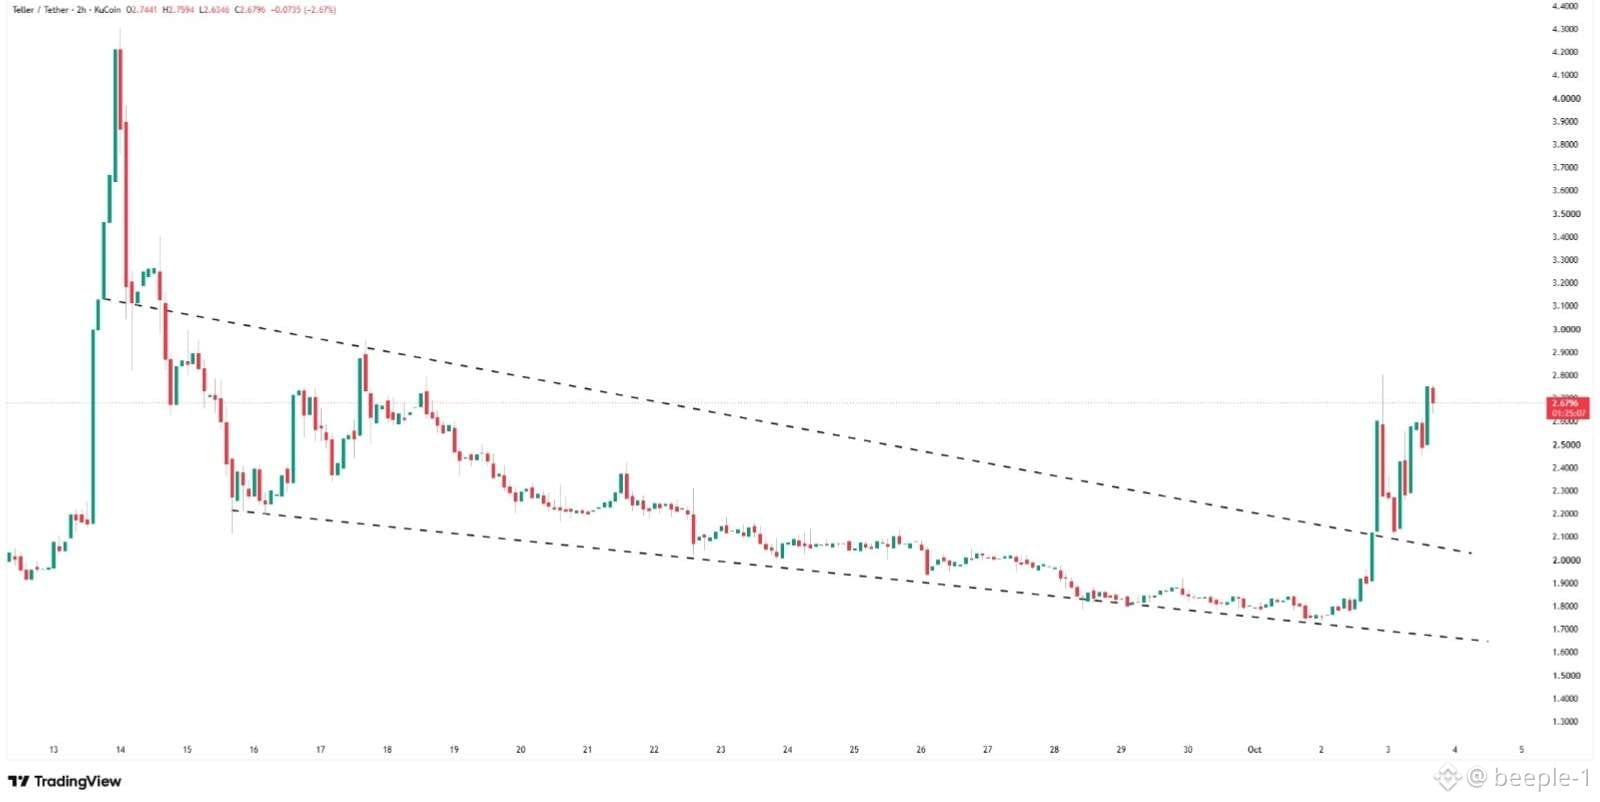
$DEBIT finally looks like it’s waking up.
After weeks of grinding inside that descending channel, price has broken above the trendline and is now testing the $2.75–$2.80 area.
If the breakout holds, I’d watch $3.00 → $3.20 next.
The interesting part isn’t just the chart Debit is building an AI-powered on-chain interface for swaps, bridging, borrowing and portfolio actions.
Breakout is there. Now I want to see the retest hold.
#BTC Price Analysis# #Macro Insights# #Meme Alpha# #BNBChain#
$DEBIT finally looks like it’s waking up.
After weeks of grinding inside that descending channel, price has broken above the trendline and is now testing the $2.75–$2.80 area.
If the breakout holds, I’d watch $3.00 → $3.20 next.
The interesting part isn’t just the chart Debit is building an AI-powered on-chain interface for swaps, bridging, borrowing and portfolio actions.
Breakout is there. Now I want to see the retest hold.
#BTC Price Analysis# #Macro Insights# #Meme Alpha# #BNBChain#
After weeks of grinding inside that descending channel, price has broken above the trendline and is now testing the $2.75–$2.80 area.
If the breakout holds, I’d watch $3.00 → $3.20 next.
The interesting part isn’t just the chart Debit is building an AI-powered on-chain interface for swaps, bridging, borrowing and portfolio actions.
Breakout is there. Now I want to see the retest hold.
#BTC Price Analysis# #Macro Insights# #Meme Alpha# #BNBChain#
82
·
--
See translation
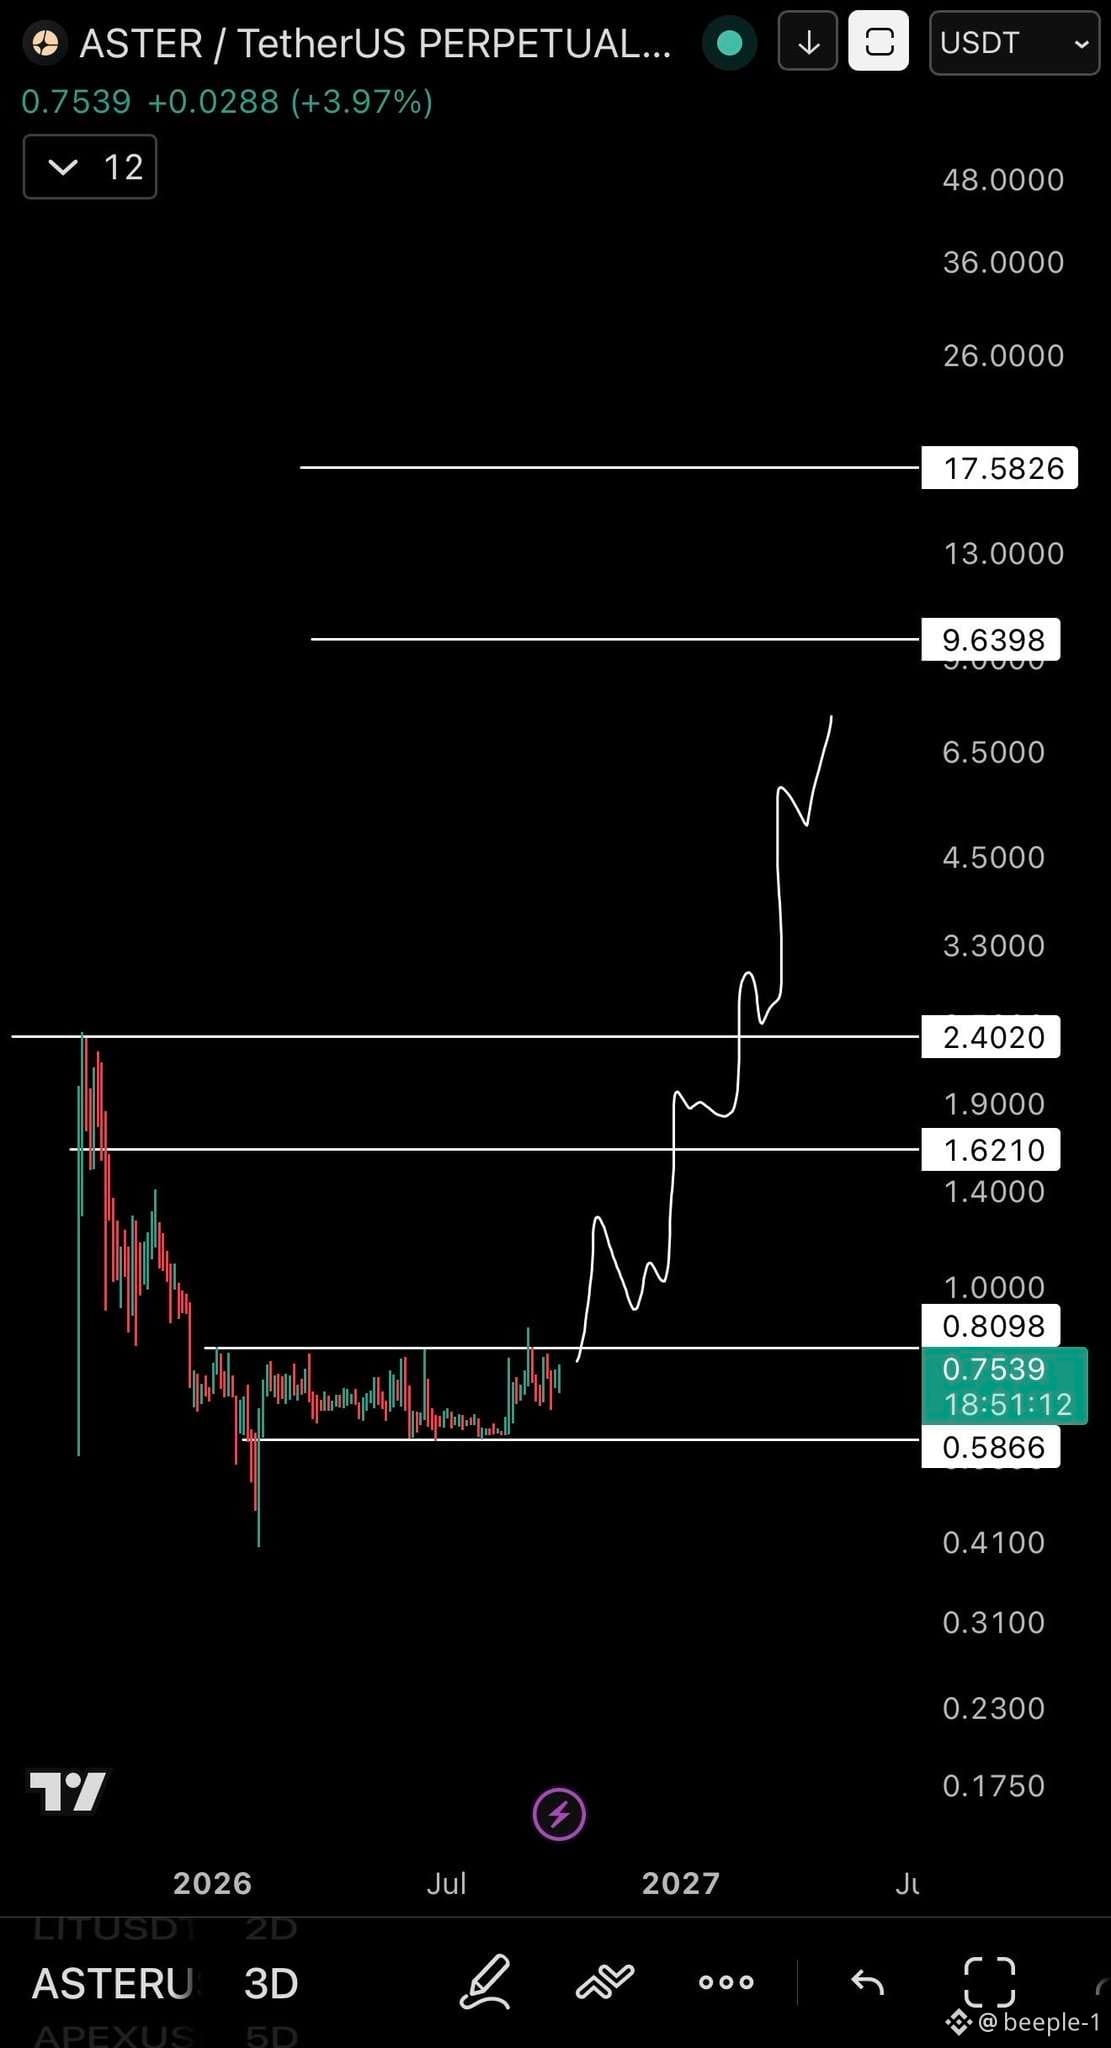
$ASTER is finally showing some life after months of consolidation.
Price is testing the $0.81 breakout zone right now.
If buyers can flip $0.81 into support, the next levels I’m watching are:
→ $1.62
→ $2.40
→ $9.64
The structure is getting interesting, but the key is simple: hold the breakout, then let price prove itself.
Not financial advice.
#BTC Price Analysis# #Macro Insights# #Altcoin Season# #Meme Alpha# #BNBChain#
$ASTER is finally showing some life after months of consolidation.
Price is testing the $0.81 breakout zone right now.
If buyers can flip $0.81 into support, the next levels I’m watching are:
→ $1.62
→ $2.40
→ $9.64
The structure is getting interesting, but the key is simple: hold the breakout, then let price prove itself.
Not financial advice.
#BTC Price Analysis# #Macro Insights# #Altcoin Season# #Meme Alpha# #BNBChain#
Price is testing the $0.81 breakout zone right now.
If buyers can flip $0.81 into support, the next levels I’m watching are:
→ $1.62
→ $2.40
→ $9.64
The structure is getting interesting, but the key is simple: hold the breakout, then let price prove itself.
Not financial advice.
#BTC Price Analysis# #Macro Insights# #Altcoin Season# #Meme Alpha# #BNBChain#
70
·
--
See translation
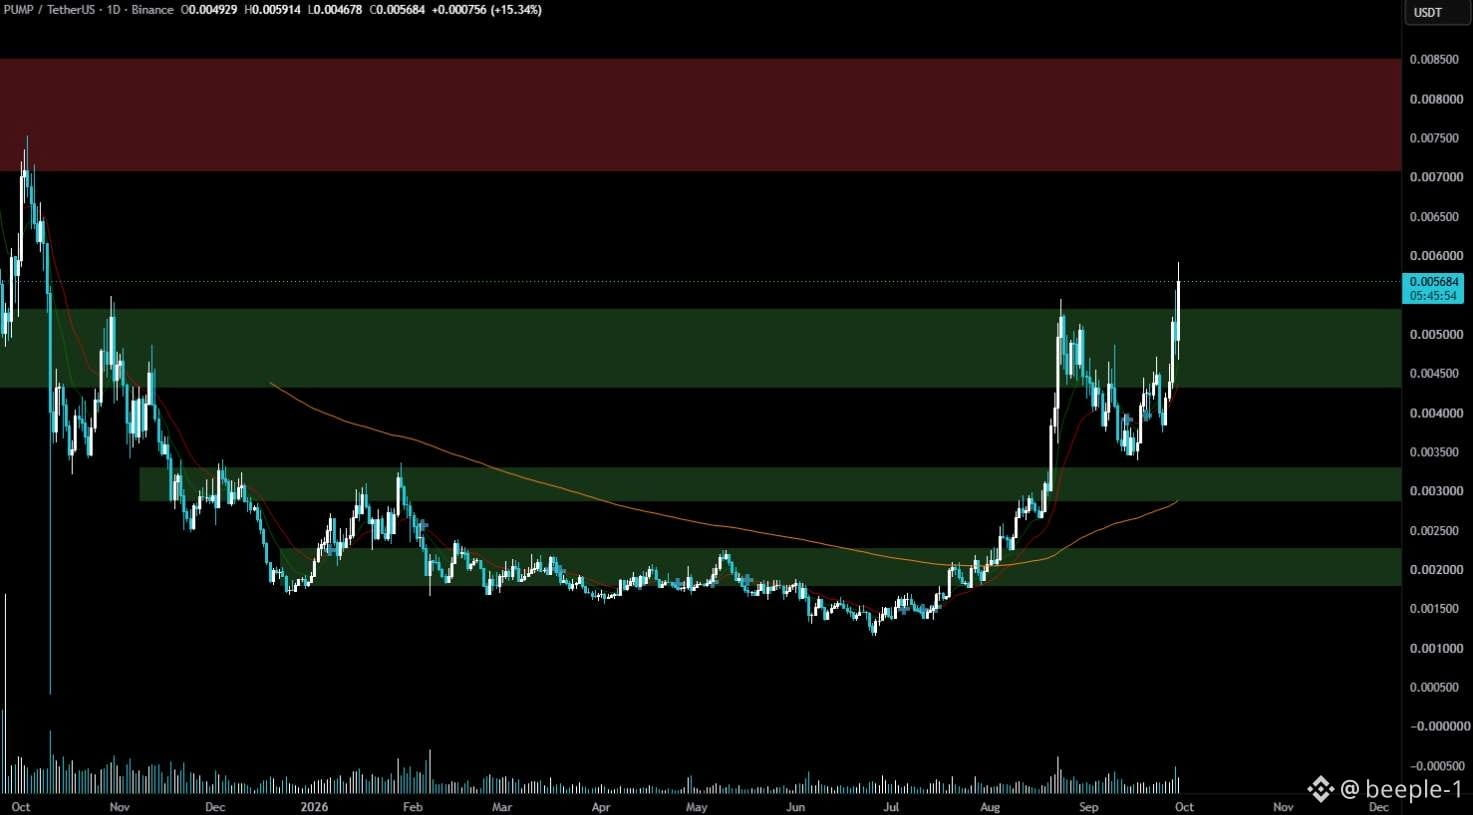
$PUMP is finally showing some real strength.
Price just pushed through the $0.0053 area after reclaiming the previous demand zone, with momentum clearly picking up.
Now I’m watching $0.0057–$0.0060 closely. A clean breakout there could put the $0.0070–$0.0085 supply zone back in play.
For now, structure looks strong but I’d rather see a retest than chase the candle.
#BTC Price Analysis# #Macro Insights# #Altcoin Season# #Meme Alpha# #BNBChain#
$PUMP is finally showing some real strength.
Price just pushed through the $0.0053 area after reclaiming the previous demand zone, with momentum clearly picking up.
Now I’m watching $0.0057–$0.0060 closely. A clean breakout there could put the $0.0070–$0.0085 supply zone back in play.
For now, structure looks strong but I’d rather see a retest than chase the candle.
#BTC Price Analysis# #Macro Insights# #Altcoin Season# #Meme Alpha# #BNBChain#
Price just pushed through the $0.0053 area after reclaiming the previous demand zone, with momentum clearly picking up.
Now I’m watching $0.0057–$0.0060 closely. A clean breakout there could put the $0.0070–$0.0085 supply zone back in play.
For now, structure looks strong but I’d rather see a retest than chase the candle.
#BTC Price Analysis# #Macro Insights# #Altcoin Season# #Meme Alpha# #BNBChain#
67
·
--
See translation
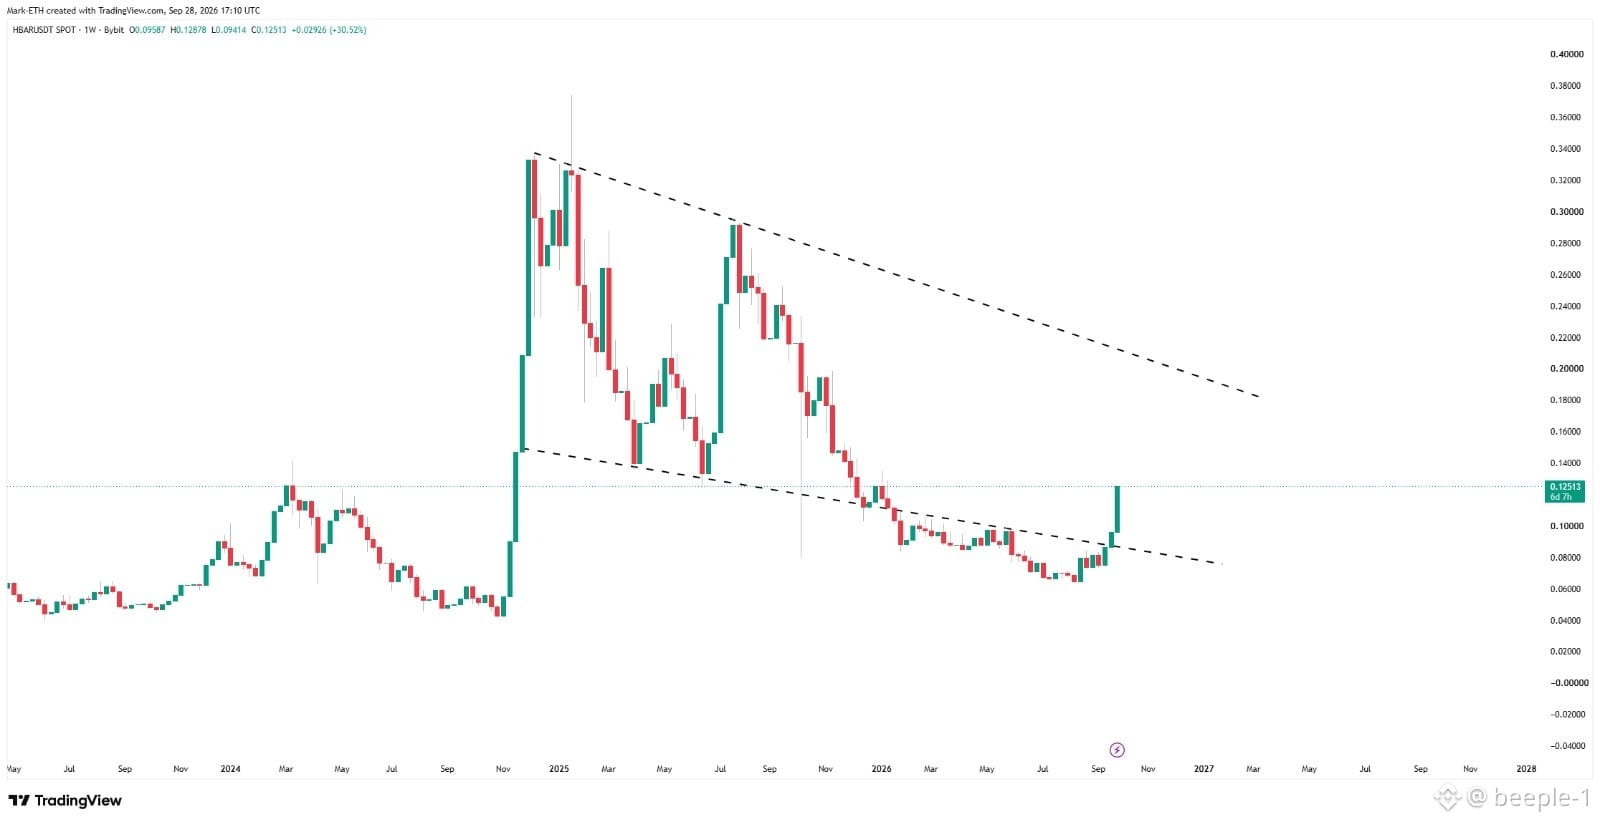
$HBAR finally looks interesting.
The weekly chart just broke above a long-term descending trendline with a strong +30% move.
Now I’m watching $0.12–$0.125 as the key retest zone.
Hold it → $0.15 → $0.20 comes into focus.
No need to chase the pump. Let the breakout prove itself.
#BTC Price Analysis# #Macro Insights# #BNBChain# #Meme Alpha#
$HBAR finally looks interesting.
The weekly chart just broke above a long-term descending trendline with a strong +30% move.
Now I’m watching $0.12–$0.125 as the key retest zone.
Hold it → $0.15 → $0.20 comes into focus.
No need to chase the pump. Let the breakout prove itself.
#BTC Price Analysis# #Macro Insights# #BNBChain# #Meme Alpha#
The weekly chart just broke above a long-term descending trendline with a strong +30% move.
Now I’m watching $0.12–$0.125 as the key retest zone.
Hold it → $0.15 → $0.20 comes into focus.
No need to chase the pump. Let the breakout prove itself.
#BTC Price Analysis# #Macro Insights# #BNBChain# #Meme Alpha#
90
·
--
See translation
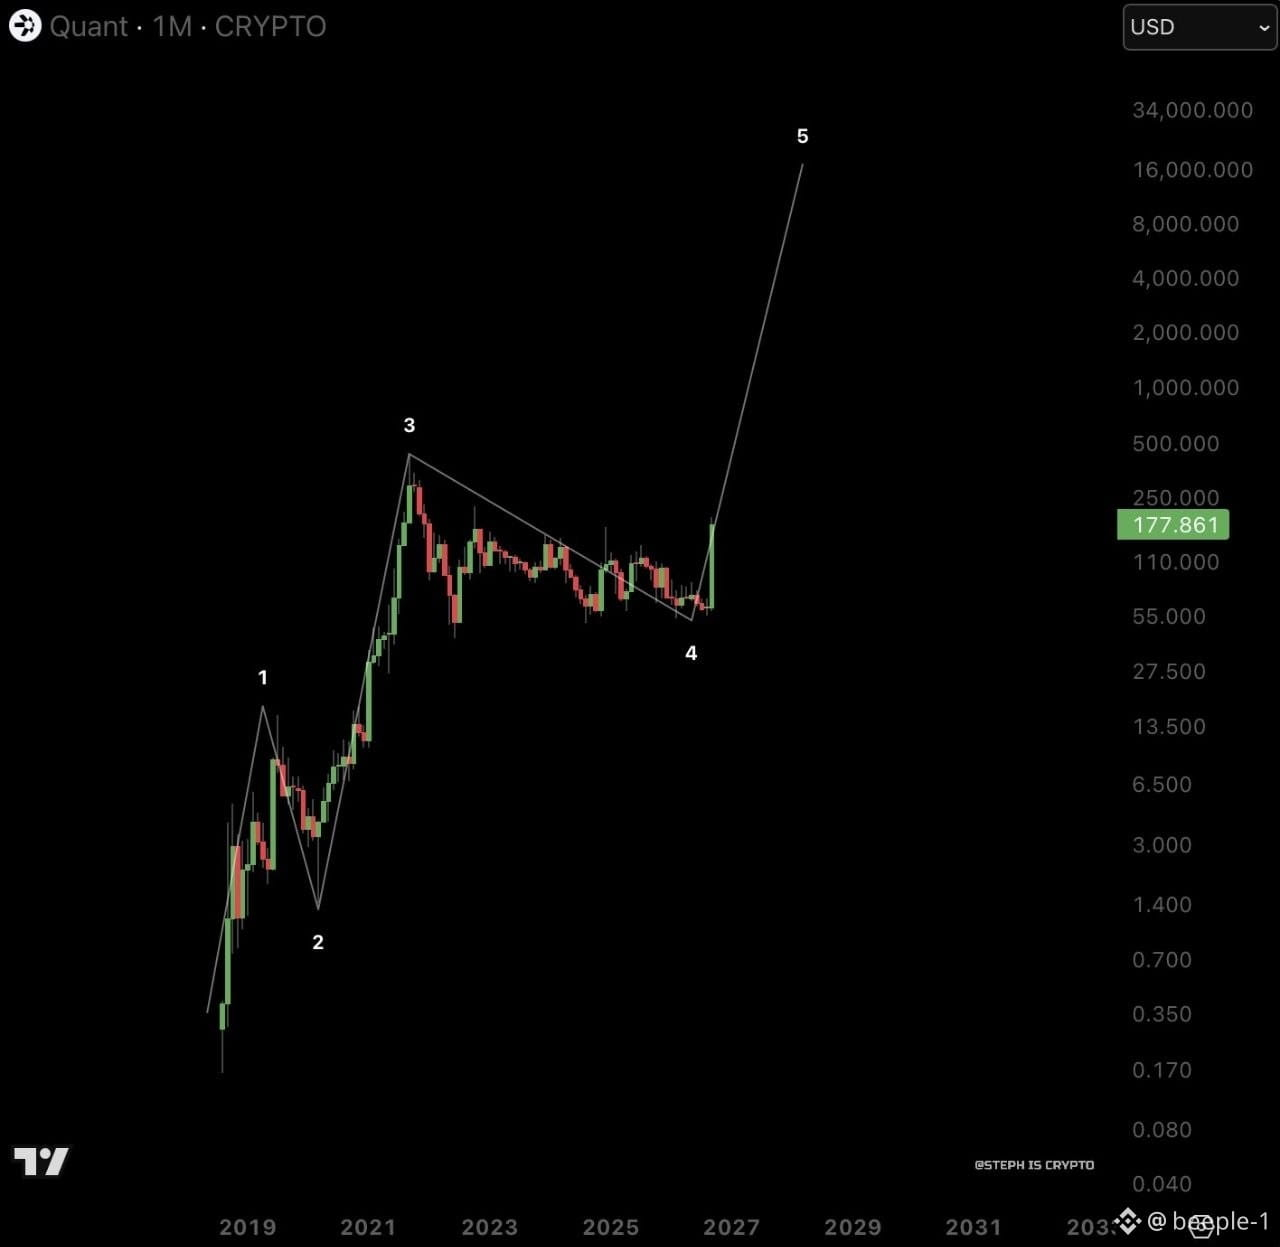
$QNT looking insanely bullish
$200 loading ⏳
#BTC Price Analysis# #Macro Insights# #Altcoin Season# #Meme Alpha# #BNBChain#
$QNT looking insanely bullish
$200 loading ⏳
#BTC Price Analysis# #Macro Insights# #Altcoin Season# #Meme Alpha# #BNBChain#
$200 loading ⏳
#BTC Price Analysis# #Macro Insights# #Altcoin Season# #Meme Alpha# #BNBChain#
71
·
--
See translation
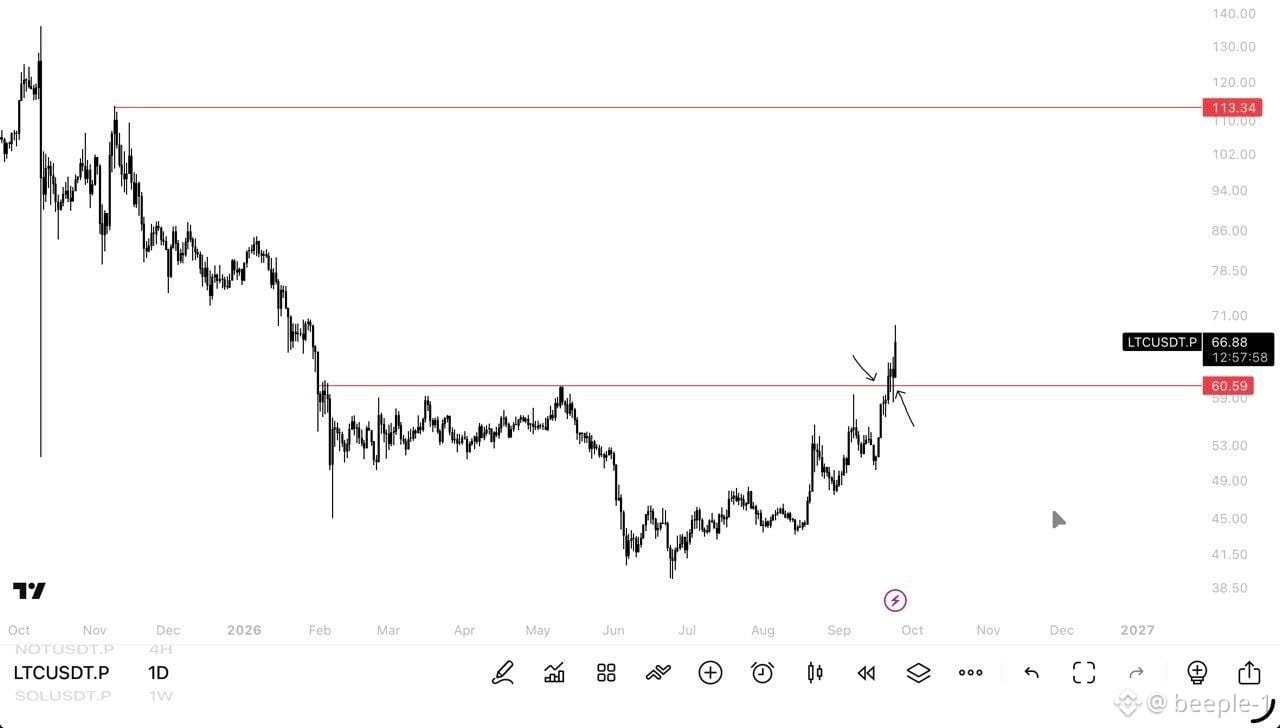
$LTC is finally showing some strength. 👀
After months below the $60.59 level, LTC has pushed through it and is now holding above the breakout area.
The key now is simple:
$60.59 → support
$66–67 → immediate zone
$113.34 → bigger resistance
If $60.59 flips into solid support, this breakout gets a lot more interesting.
#BTC Price Analysis# #Macro Insights# #Altcoin Season# #BNBChain# #Meme Alpha#
$LTC is finally showing some strength. 👀
After months below the $60.59 level, LTC has pushed through it and is now holding above the breakout area.
The key now is simple:
$60.59 → support
$66–67 → immediate zone
$113.34 → bigger resistance
If $60.59 flips into solid support, this breakout gets a lot more interesting.
#BTC Price Analysis# #Macro Insights# #Altcoin Season# #BNBChain# #Meme Alpha#
After months below the $60.59 level, LTC has pushed through it and is now holding above the breakout area.
The key now is simple:
$60.59 → support
$66–67 → immediate zone
$113.34 → bigger resistance
If $60.59 flips into solid support, this breakout gets a lot more interesting.
#BTC Price Analysis# #Macro Insights# #Altcoin Season# #BNBChain# #Meme Alpha#
60
·
--
See translation
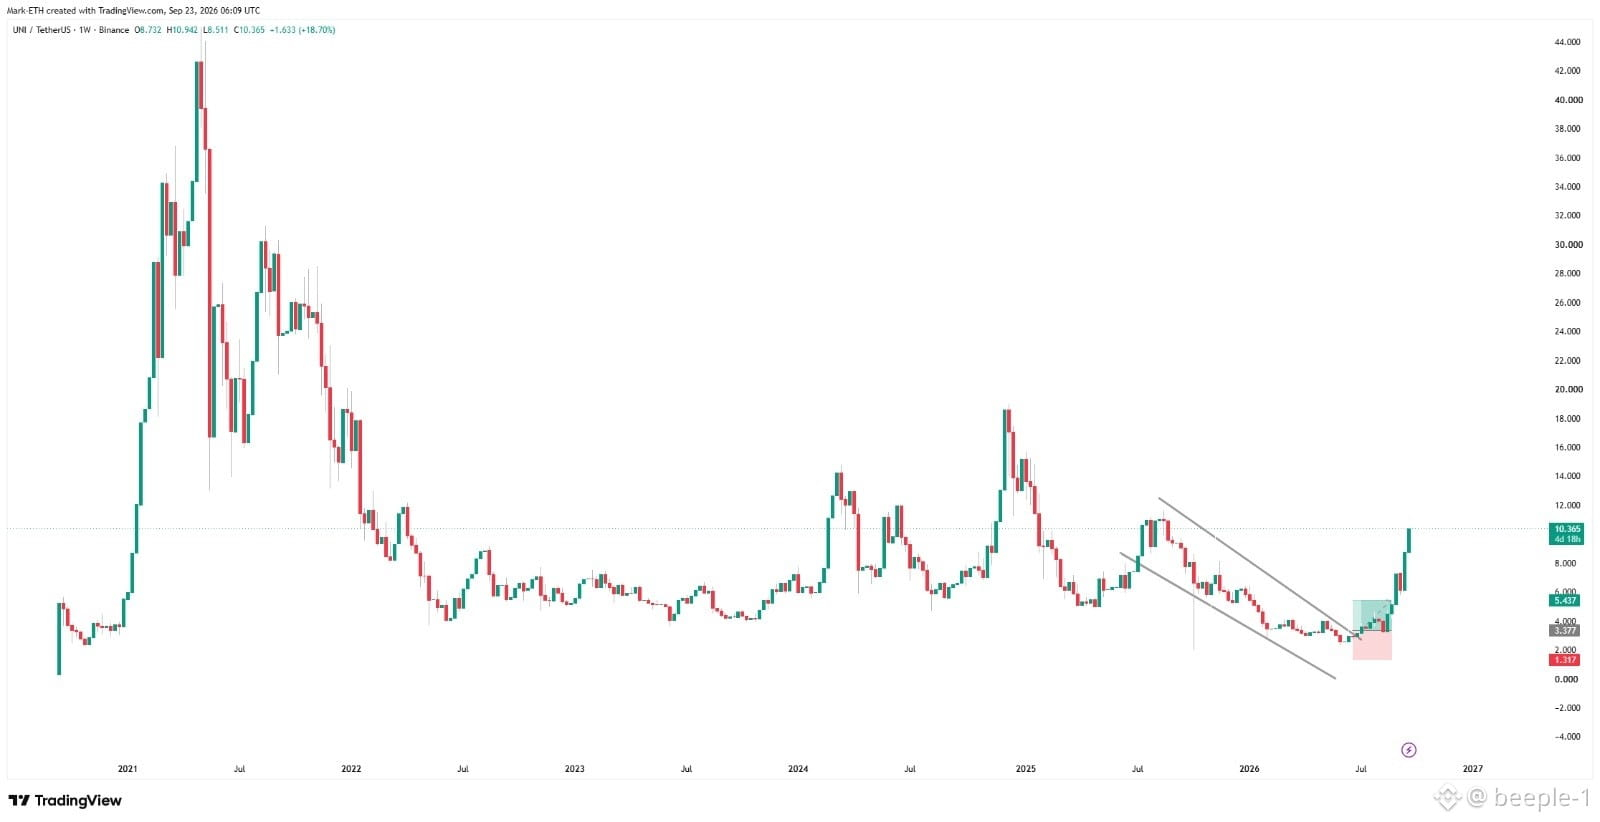
$UNI just broke out of a multi-month falling channel.
The structure is finally changing breakout + strong momentum.
If $UNI can hold this breakout, the $12–$14 zone becomes the next area I’m watching.
This move is getting interesting.
#BTC Price Analysis# #Macro Insights# #Meme Alpha# #BNBChain#
$UNI just broke out of a multi-month falling channel.
The structure is finally changing breakout + strong momentum.
If $UNI can hold this breakout, the $12–$14 zone becomes the next area I’m watching.
This move is getting interesting.
#BTC Price Analysis# #Macro Insights# #Meme Alpha# #BNBChain#
The structure is finally changing breakout + strong momentum.
If $UNI can hold this breakout, the $12–$14 zone becomes the next area I’m watching.
This move is getting interesting.
#BTC Price Analysis# #Macro Insights# #Meme Alpha# #BNBChain#
55
·
--
See translation
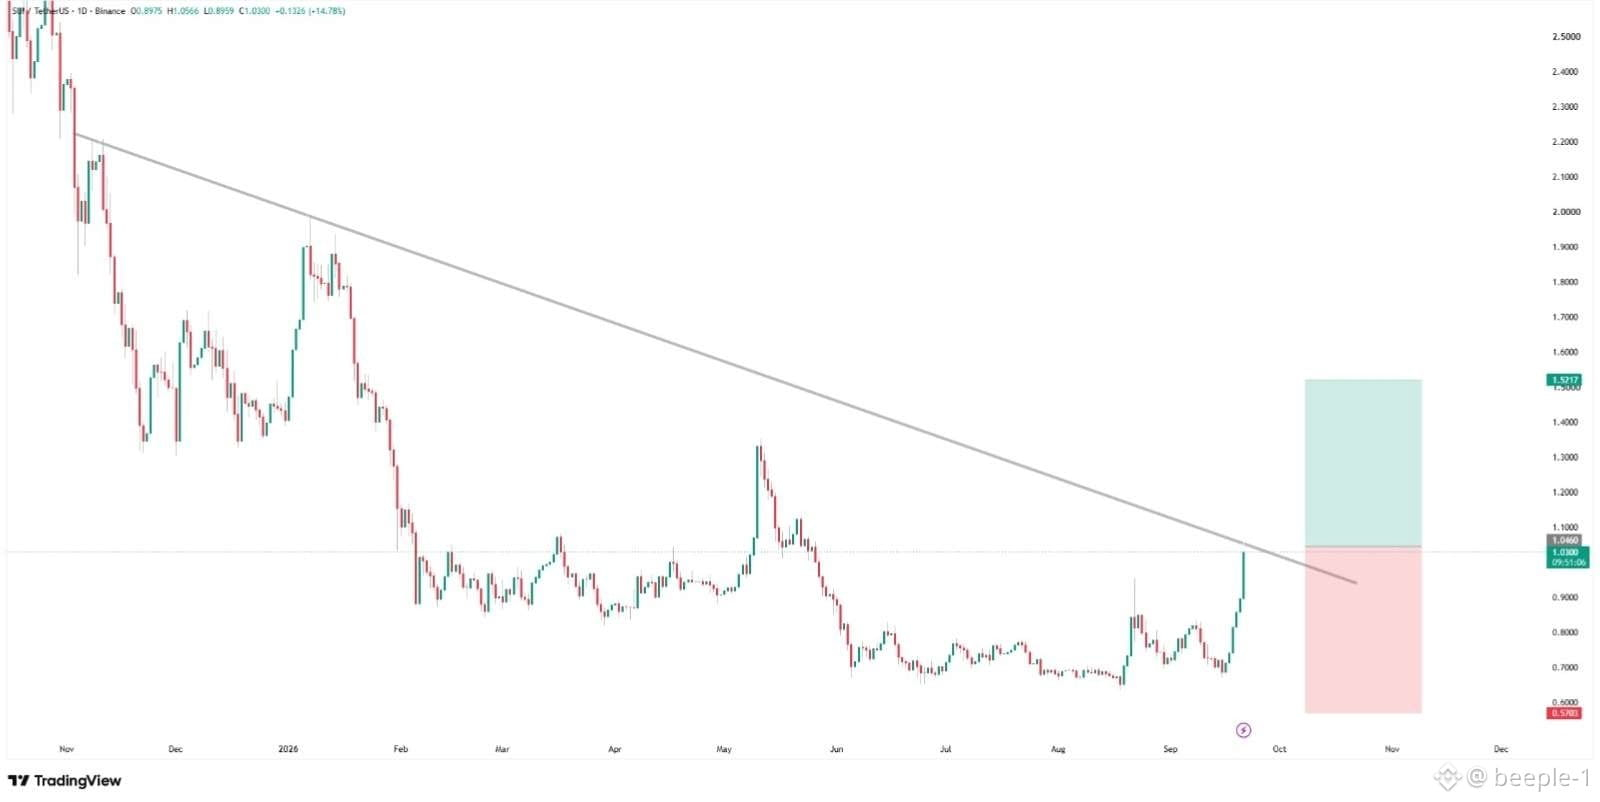
$SUI trying to break out the long descending channel.
If this get successful I'm eyeing $2 next.
#BTC Price Analysis# #Macro Insights# #Altcoin Season# #Meme Alpha#
$SUI trying to break out the long descending channel.
If this get successful I'm eyeing $2 next.
#BTC Price Analysis# #Macro Insights# #Altcoin Season# #Meme Alpha#
If this get successful I'm eyeing $2 next.
#BTC Price Analysis# #Macro Insights# #Altcoin Season# #Meme Alpha#
71
·
--
See translation
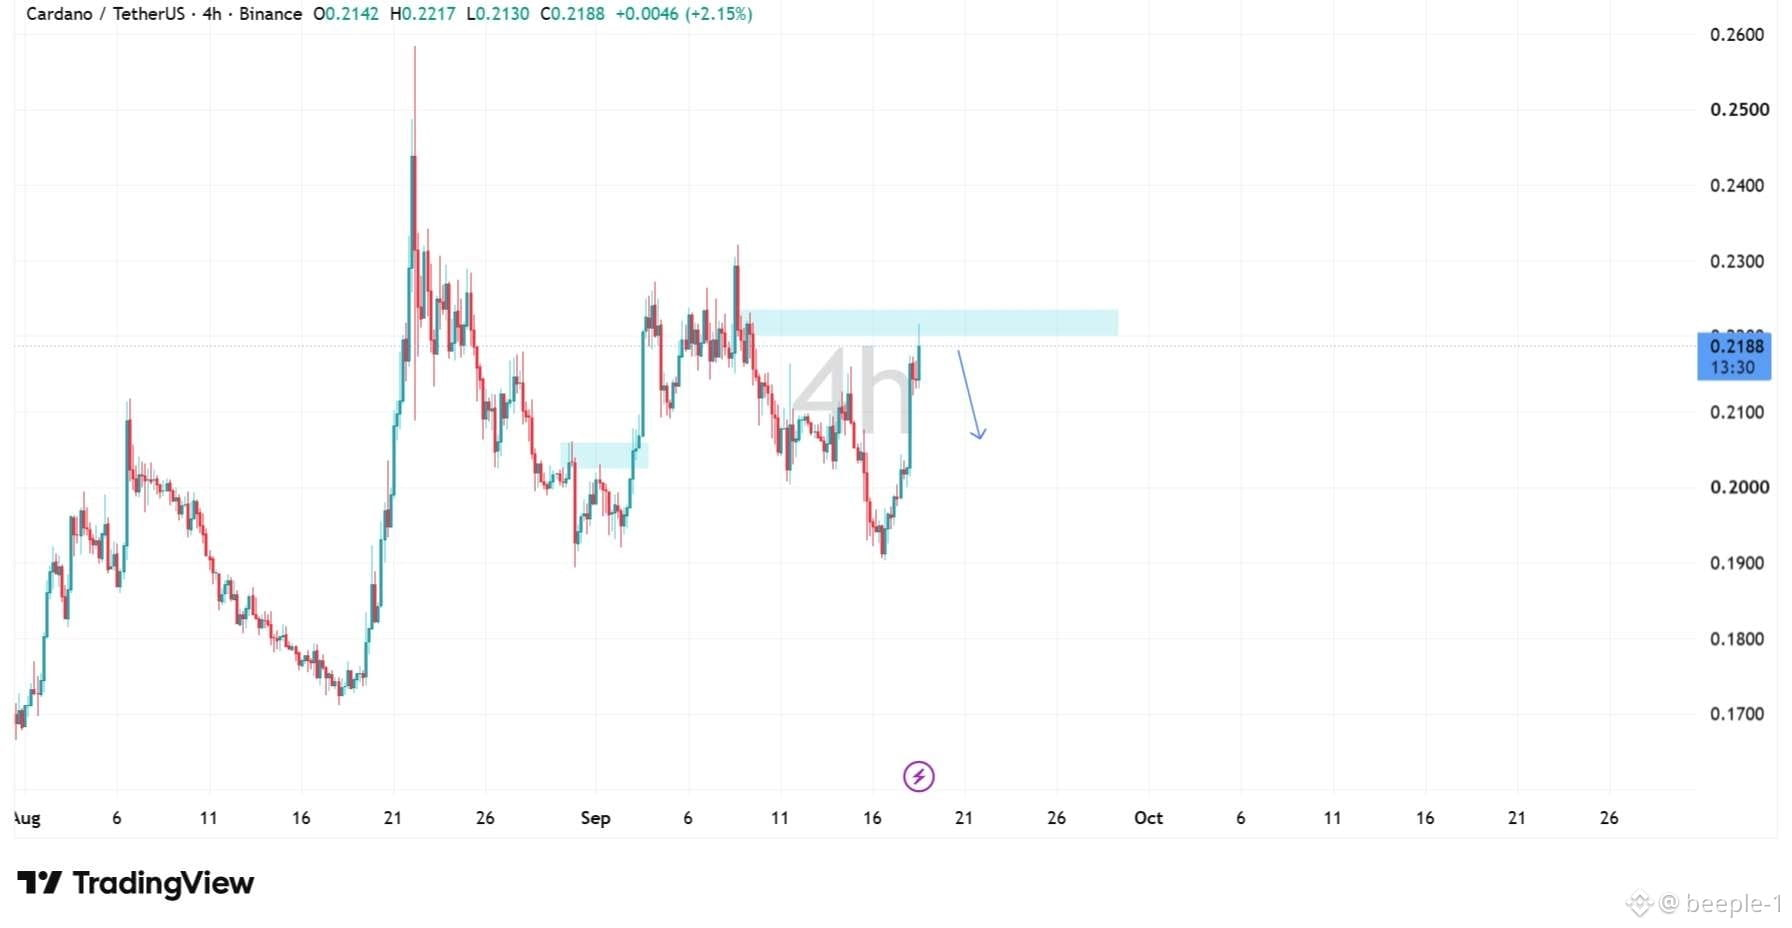
$ADA is back at a level that really matters.
Price has bounced hard from the $0.19 area and is now pushing into the $0.218–$0.223 resistance zone.
This is where I’d expect the real battle.
If ADA gets rejected → $0.205–$0.20 could be the next retest.
If bulls break and hold above $0.223, the chart opens up toward $0.23–$0.25.
I’m not chasing this candle.
Let ADA show the next move first.
#BTC Price Analysis# #Macro Insights# #Altcoin Season# #Meme Alpha# #BNBChain#
$ADA is back at a level that really matters.
Price has bounced hard from the $0.19 area and is now pushing into the $0.218–$0.223 resistance zone.
This is where I’d expect the real battle.
If ADA gets rejected → $0.205–$0.20 could be the next retest.
If bulls break and hold above $0.223, the chart opens up toward $0.23–$0.25.
I’m not chasing this candle.
Let ADA show the next move first.
#BTC Price Analysis# #Macro Insights# #Altcoin Season# #Meme Alpha# #BNBChain#
Price has bounced hard from the $0.19 area and is now pushing into the $0.218–$0.223 resistance zone.
This is where I’d expect the real battle.
If ADA gets rejected → $0.205–$0.20 could be the next retest.
If bulls break and hold above $0.223, the chart opens up toward $0.23–$0.25.
I’m not chasing this candle.
Let ADA show the next move first.
#BTC Price Analysis# #Macro Insights# #Altcoin Season# #Meme Alpha# #BNBChain#
63
·
--
See translation
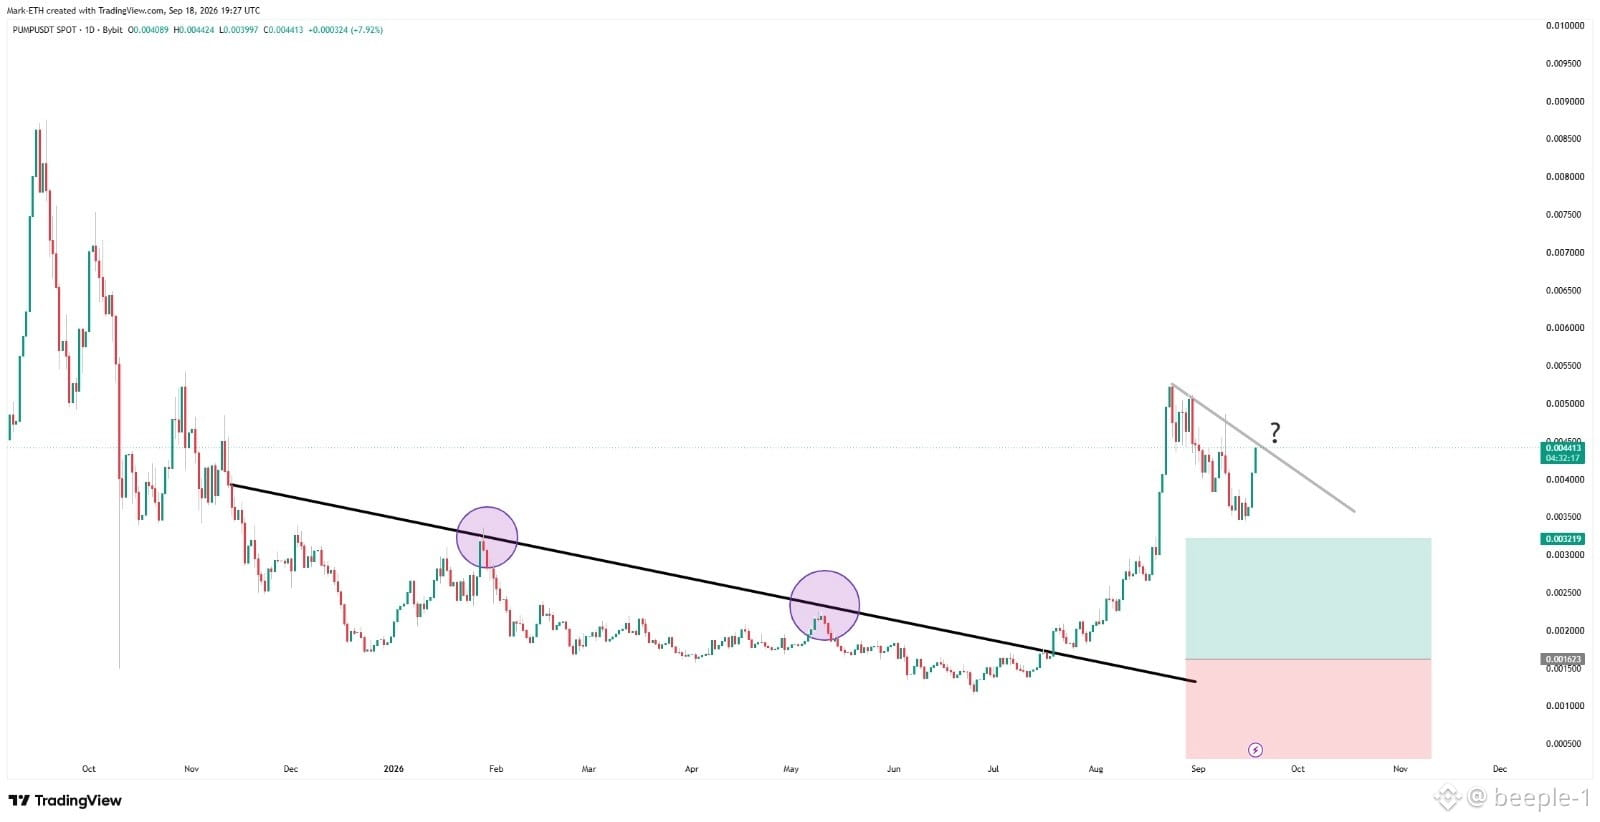
our previous perfect gain $PUMP is getting interesting here again 👀
After months of grinding under that major downtrend, we got the breakout.
Now price is pulling back and testing a smaller descending trendline.
This is the part I’m watching closely.
If $PUMP breaks and holds above it, the next areas I’d watch are $0.0050 → $0.0065 → $0.0080.
No need to chase the candle.
Let the chart confirm the move first. 🔥
Old trend broken.
New trend loading.
#BTC Price Analysis# #Macro Insights# #Altcoin Season# #Meme Alpha# #BNBChain#
our previous perfect gain $PUMP is getting interesting here again 👀
After months of grinding under that major downtrend, we got the breakout.
Now price is pulling back and testing a smaller descending trendline.
This is the part I’m watching closely.
If $PUMP breaks and holds above it, the next areas I’d watch are $0.0050 → $0.0065 → $0.0080.
No need to chase the candle.
Let the chart confirm the move first. 🔥
Old trend broken.
New trend loading.
#BTC Price Analysis# #Macro Insights# #Altcoin Season# #Meme Alpha# #BNBChain#
After months of grinding under that major downtrend, we got the breakout.
Now price is pulling back and testing a smaller descending trendline.
This is the part I’m watching closely.
If $PUMP breaks and holds above it, the next areas I’d watch are $0.0050 → $0.0065 → $0.0080.
No need to chase the candle.
Let the chart confirm the move first. 🔥
Old trend broken.
New trend loading.
#BTC Price Analysis# #Macro Insights# #Altcoin Season# #Meme Alpha# #BNBChain#
70
·
--
See translation
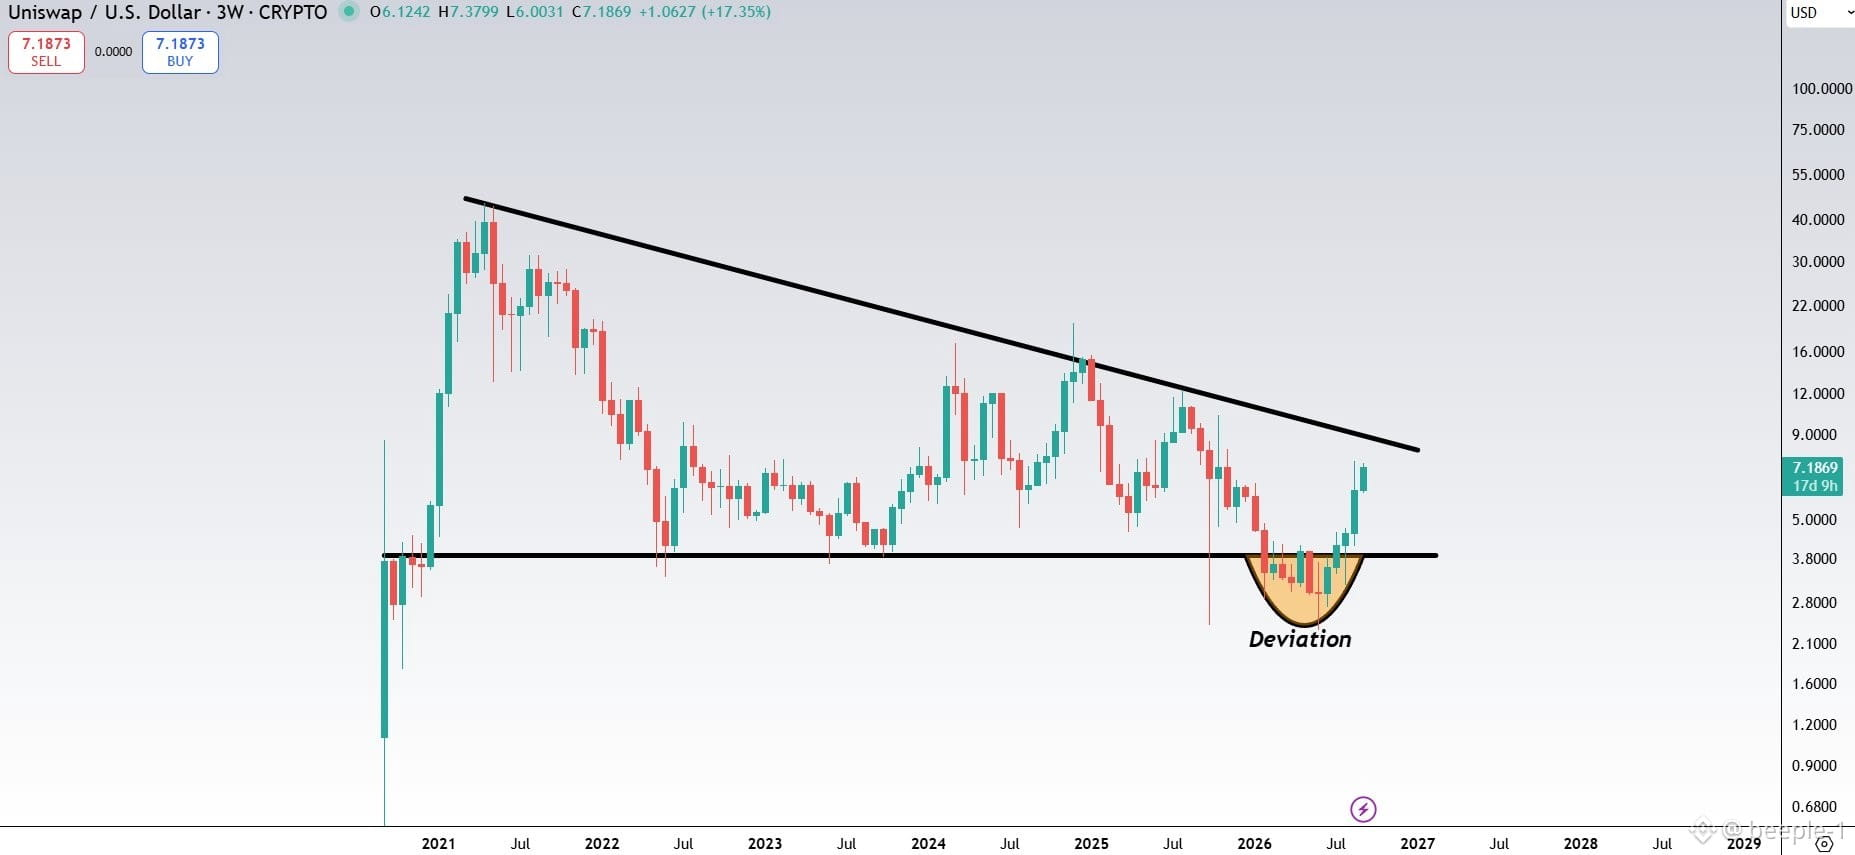
$UNI is finally testing the ceiling it’s been respecting for years 👀
The $3–4 area held as major support, even after that deviation below it.
Now price is back above support and pushing toward the long-term descending trendline.
A clean breakout + retest could completely change the higher-timeframe structure.
Watching this one closely.
Not financial advice.
#BTC Price Analysis# #Macro Insights# #Altcoin Season# #Meme Alpha# #BNBChain#
$UNI is finally testing the ceiling it’s been respecting for years 👀
The $3–4 area held as major support, even after that deviation below it.
Now price is back above support and pushing toward the long-term descending trendline.
A clean breakout + retest could completely change the higher-timeframe structure.
Watching this one closely.
Not financial advice.
#BTC Price Analysis# #Macro Insights# #Altcoin Season# #Meme Alpha# #BNBChain#
The $3–4 area held as major support, even after that deviation below it.
Now price is back above support and pushing toward the long-term descending trendline.
A clean breakout + retest could completely change the higher-timeframe structure.
Watching this one closely.
Not financial advice.
#BTC Price Analysis# #Macro Insights# #Altcoin Season# #Meme Alpha# #BNBChain#
58
·
--
See translation
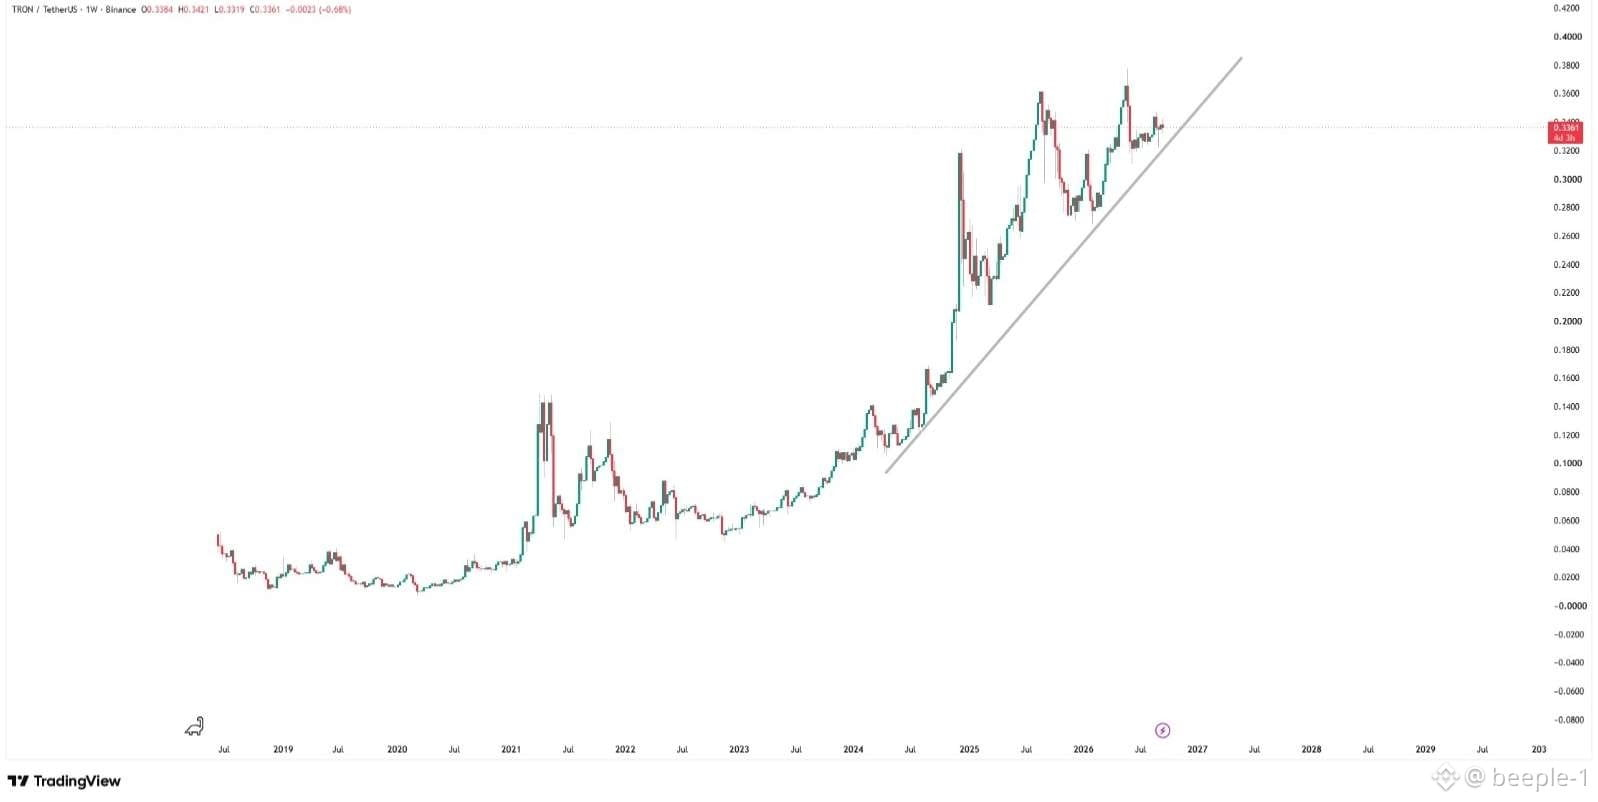
$TRX looks like it’s respecting a multi-year ascending trendline.
Price is consolidating near $0.33 after the recent push toward $0.36.
As long as this trendline holds, the higher-timeframe structure stays bullish. A clean break below it would be the first real warning.
Watching the trendline, not the noise.
#BTC Price Analysis# #Macro Insights# #Altcoin Season# #BNBChain#
$TRX looks like it’s respecting a multi-year ascending trendline.
Price is consolidating near $0.33 after the recent push toward $0.36.
As long as this trendline holds, the higher-timeframe structure stays bullish. A clean break below it would be the first real warning.
Watching the trendline, not the noise.
#BTC Price Analysis# #Macro Insights# #Altcoin Season# #BNBChain#
Price is consolidating near $0.33 after the recent push toward $0.36.
As long as this trendline holds, the higher-timeframe structure stays bullish. A clean break below it would be the first real warning.
Watching the trendline, not the noise.
#BTC Price Analysis# #Macro Insights# #Altcoin Season# #BNBChain#
65
·
--
See translation
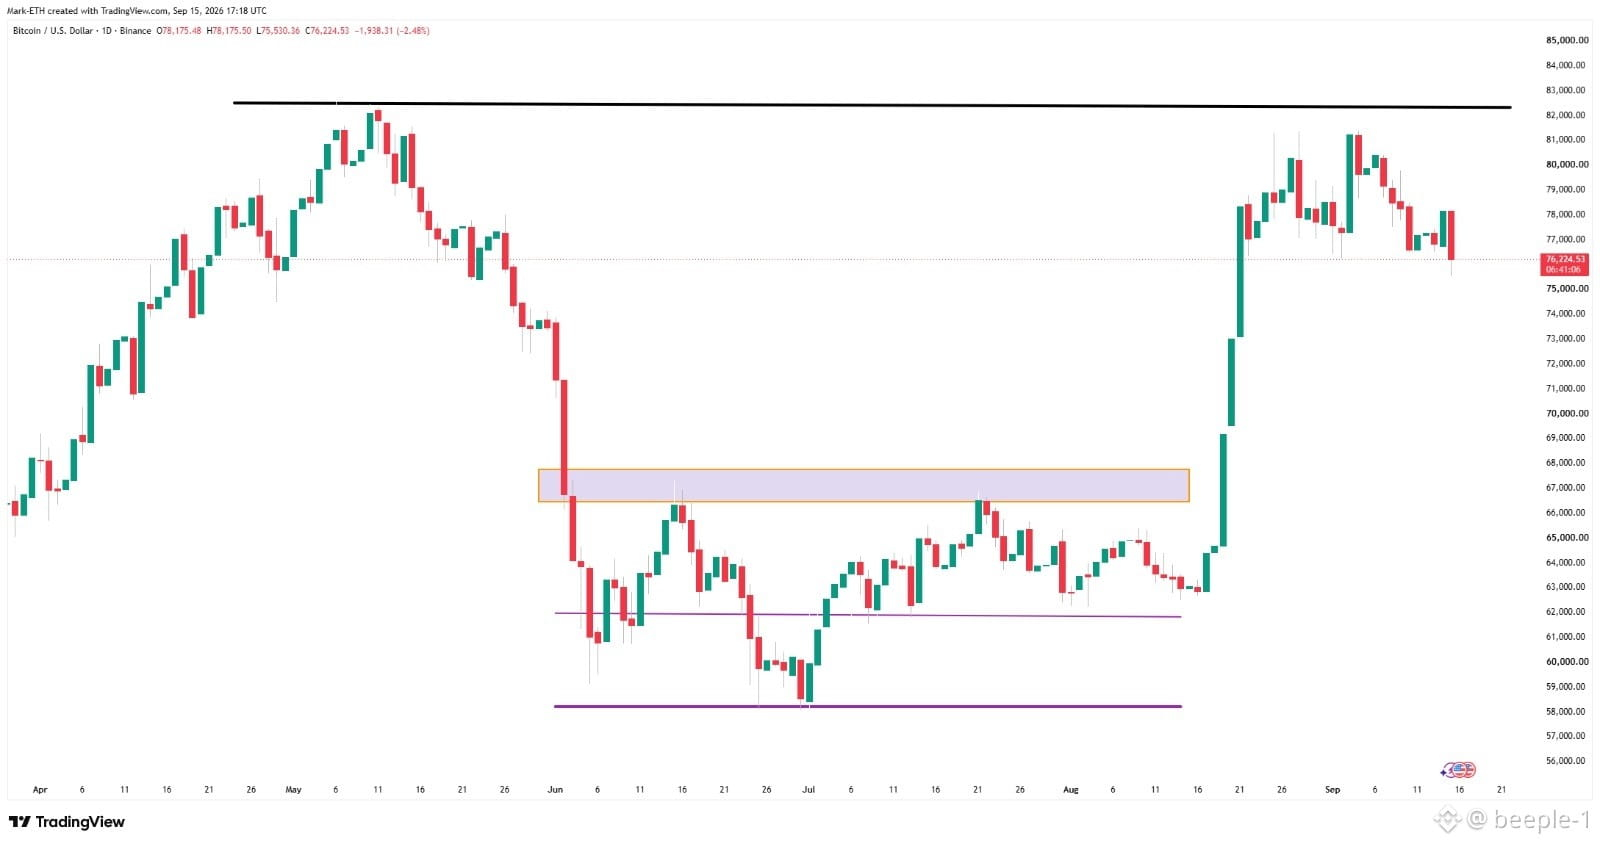
After rejection it was being observed that which i told $BTC tik down to $68k first.
Now fear of not passing clarity Act is also increasing.
Be resilient
#BTC Price Analysis# #Macro Insights# #Altcoin Season# #Meme Alpha# #BNBChain#
After rejection it was being observed that which i told $BTC tik down to $68k first.
Now fear of not passing clarity Act is also increasing.
Be resilient
#BTC Price Analysis# #Macro Insights# #Altcoin Season# #Meme Alpha# #BNBChain#
Now fear of not passing clarity Act is also increasing.
Be resilient
#BTC Price Analysis# #Macro Insights# #Altcoin Season# #Meme Alpha# #BNBChain#
60
Log in to explore more content
Join global crypto users on Binance Square
⚡️ Get latest and useful information about crypto.
💬 Trusted by the world’s largest crypto exchange.
👍 Discover real insights from verified creators.
Email / Phone number
Trending Topics
BinanceWithdrawalScamWarning
1,841 views
159 Discussing
Binance Warns Users of Withdrawal Scams as Services Resume: It Will Never Charge Fees, Sell Queue Spots or Ask You to Move Funds to a “Vault”
Binance News
·1 Likes
·2.1k views
USMidtermElections
545,263 views
2,719 Discussing
USOctoberNFP-AreRateCutsStillPossible
9,386 views
263 Discussing