

AlphaTradesAyan
309 Posts

AlphaTradesAyan
Report
Block User
Spot for Wealth | Futures & Options Trading for Cash Flow | Follow to Grow your Portfolio! 🚀 | NFA | DYOR l
1.3 Years
74 Following
40 Followers
206 Liked
Posts
See translation
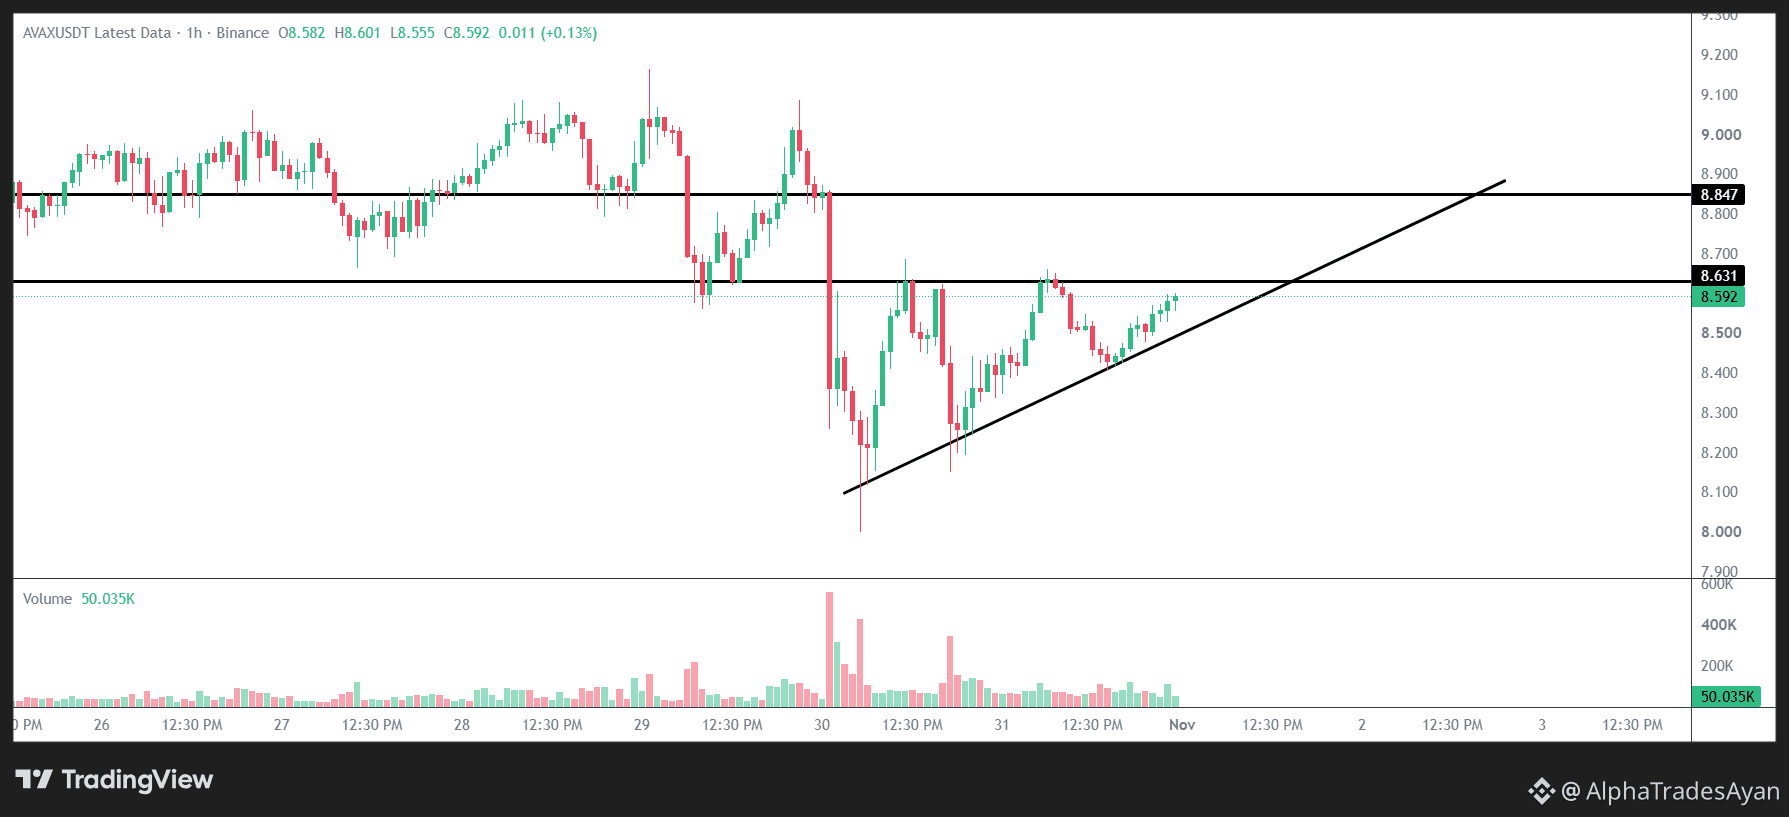
🚨 Tracking the exact price action structure on the $AVAX 1H chart.
Price is currently compressing within a very tight structural zone. We can see a clear ascending trendline providing dynamic support from below, while the price is repeatedly testing the horizontal boundary at 8.631.
Here are the exact price action levels I am observing on this timeframe:
🚧 Immediate Resistance (Pivot): 8.631
🛑 Major Ceiling: 8.847
📈 Dynamic Support: Ascending Trendline
$AVAX
{future}(AVAXUSDT)
I am not front-running any moves here. Just keeping a close watch on how the price reacts as it gets squeezed between this trendline and the 8.631 resistance. A clean 1H candle close outside this compression zone will provide more clarity on the next structural shift.
Let's observe how the market respects these critical boundaries. 👇
NFA | DYOR
🚨 Tracking the exact price action structure on the $AVAX 1H chart.
Price is currently compressing within a very tight structural zone. We can see a clear ascending trendline providing dynamic support from below, while the price is repeatedly testing the horizontal boundary at 8.631.
Here are the exact price action levels I am observing on this timeframe:
🚧 Immediate Resistance (Pivot): 8.631
🛑 Major Ceiling: 8.847
📈 Dynamic Support: Ascending Trendline
$AVAX
I am not front-running any moves here. Just keeping a close watch on how the price reacts as it gets squeezed between this trendline and the 8.631 resistance. A clean 1H candle close outside this compression zone will provide more clarity on the next structural shift.
Let's observe how the market respects these critical boundaries. 👇
NFA | DYOR
Price is currently compressing within a very tight structural zone. We can see a clear ascending trendline providing dynamic support from below, while the price is repeatedly testing the horizontal boundary at 8.631.
Here are the exact price action levels I am observing on this timeframe:
🚧 Immediate Resistance (Pivot): 8.631
🛑 Major Ceiling: 8.847
📈 Dynamic Support: Ascending Trendline
$AVAX
I am not front-running any moves here. Just keeping a close watch on how the price reacts as it gets squeezed between this trendline and the 8.631 resistance. A clean 1H candle close outside this compression zone will provide more clarity on the next structural shift.
Let's observe how the market respects these critical boundaries. 👇
NFA | DYOR
1
1
190
See translation
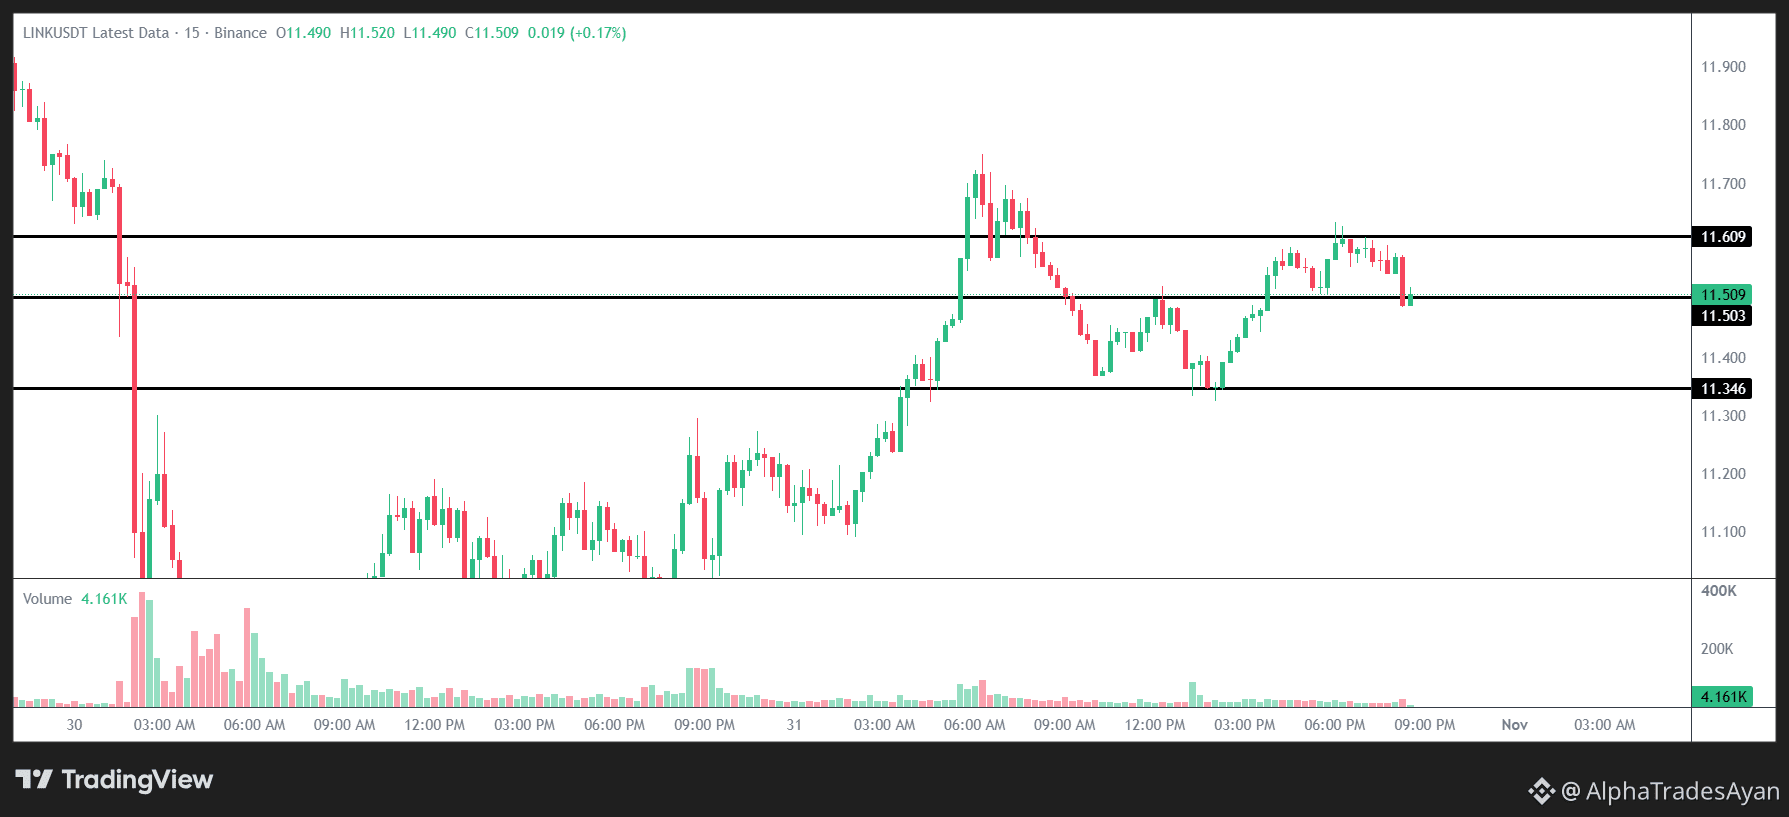
🚨 Tracking the current structure on the $LINK 15m chart.
Price action is currently consolidating within a very defined box. Here are the exact structural boundaries I am observing:
🚧 Resistance (Ceiling): 11.609
📉 Current Support (Floor): 11.503
⚠️ Lower Zone: 11.346
$LINK
{future}(LINKUSDT)
I am keeping a close watch on how the price reacts around the 11.503 pivot. I'm not rushing any decisions, just carefully observing the volume at these key levels to see how the market develops.
What are your thoughts on this setup? Let me know below! 👇
NFA | DYOR
🚨 Tracking the current structure on the $LINK 15m chart.
Price action is currently consolidating within a very defined box. Here are the exact structural boundaries I am observing:
🚧 Resistance (Ceiling): 11.609
📉 Current Support (Floor): 11.503
⚠️ Lower Zone: 11.346
$LINK
I am keeping a close watch on how the price reacts around the 11.503 pivot. I'm not rushing any decisions, just carefully observing the volume at these key levels to see how the market develops.
What are your thoughts on this setup? Let me know below! 👇
NFA | DYOR
Price action is currently consolidating within a very defined box. Here are the exact structural boundaries I am observing:
🚧 Resistance (Ceiling): 11.609
📉 Current Support (Floor): 11.503
⚠️ Lower Zone: 11.346
$LINK
I am keeping a close watch on how the price reacts around the 11.503 pivot. I'm not rushing any decisions, just carefully observing the volume at these key levels to see how the market develops.
What are your thoughts on this setup? Let me know below! 👇
NFA | DYOR
1
1
164
See translation
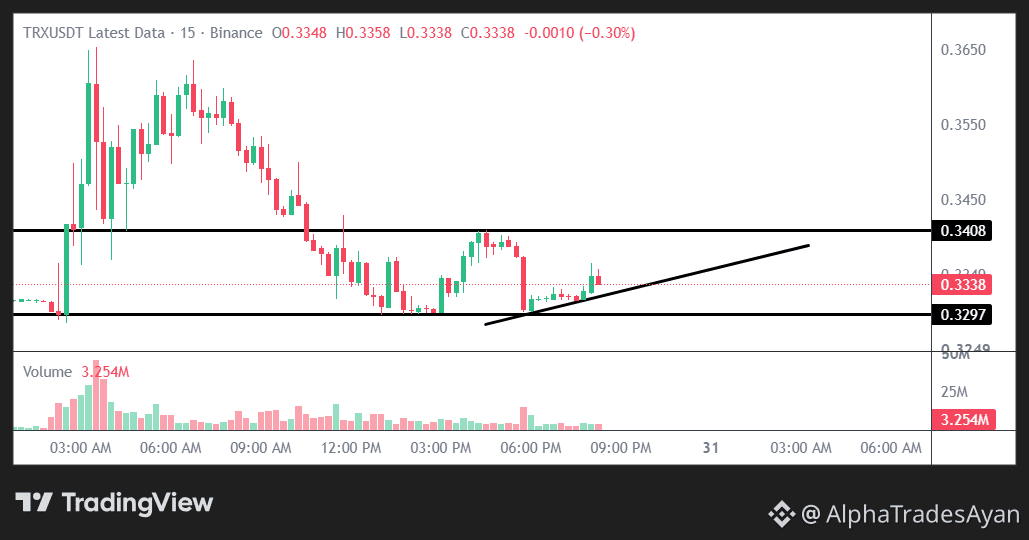
The compression on this $TRX 15m chart is reaching an absolute breaking point right now.
We are wedged right between a heavy ceiling at 0.3408 and a solid floor at 0.3297. The volume profile is completely fading out, which usually indicates that a sharp volatility spike is loading up very soon.
$TRX
{future}(TRXUSDT)
Patience is the real edge here. I am keeping my alerts on and strictly waiting for the market to choose a definitive side before reacting. If the 0.3297 baseline breaks, it completely shifts the local structure.
Let's watch how this next candle plays out and who steps up with the real volume. 👇
NFA | DYOR
The compression on this $TRX 15m chart is reaching an absolute breaking point right now.
We are wedged right between a heavy ceiling at 0.3408 and a solid floor at 0.3297. The volume profile is completely fading out, which usually indicates that a sharp volatility spike is loading up very soon.
$TRX
Patience is the real edge here. I am keeping my alerts on and strictly waiting for the market to choose a definitive side before reacting. If the 0.3297 baseline breaks, it completely shifts the local structure.
Let's watch how this next candle plays out and who steps up with the real volume. 👇
NFA | DYOR
We are wedged right between a heavy ceiling at 0.3408 and a solid floor at 0.3297. The volume profile is completely fading out, which usually indicates that a sharp volatility spike is loading up very soon.
$TRX
Patience is the real edge here. I am keeping my alerts on and strictly waiting for the market to choose a definitive side before reacting. If the 0.3297 baseline breaks, it completely shifts the local structure.
Let's watch how this next candle plays out and who steps up with the real volume. 👇
NFA | DYOR
1
1
104
·
--
Bearish
See translation
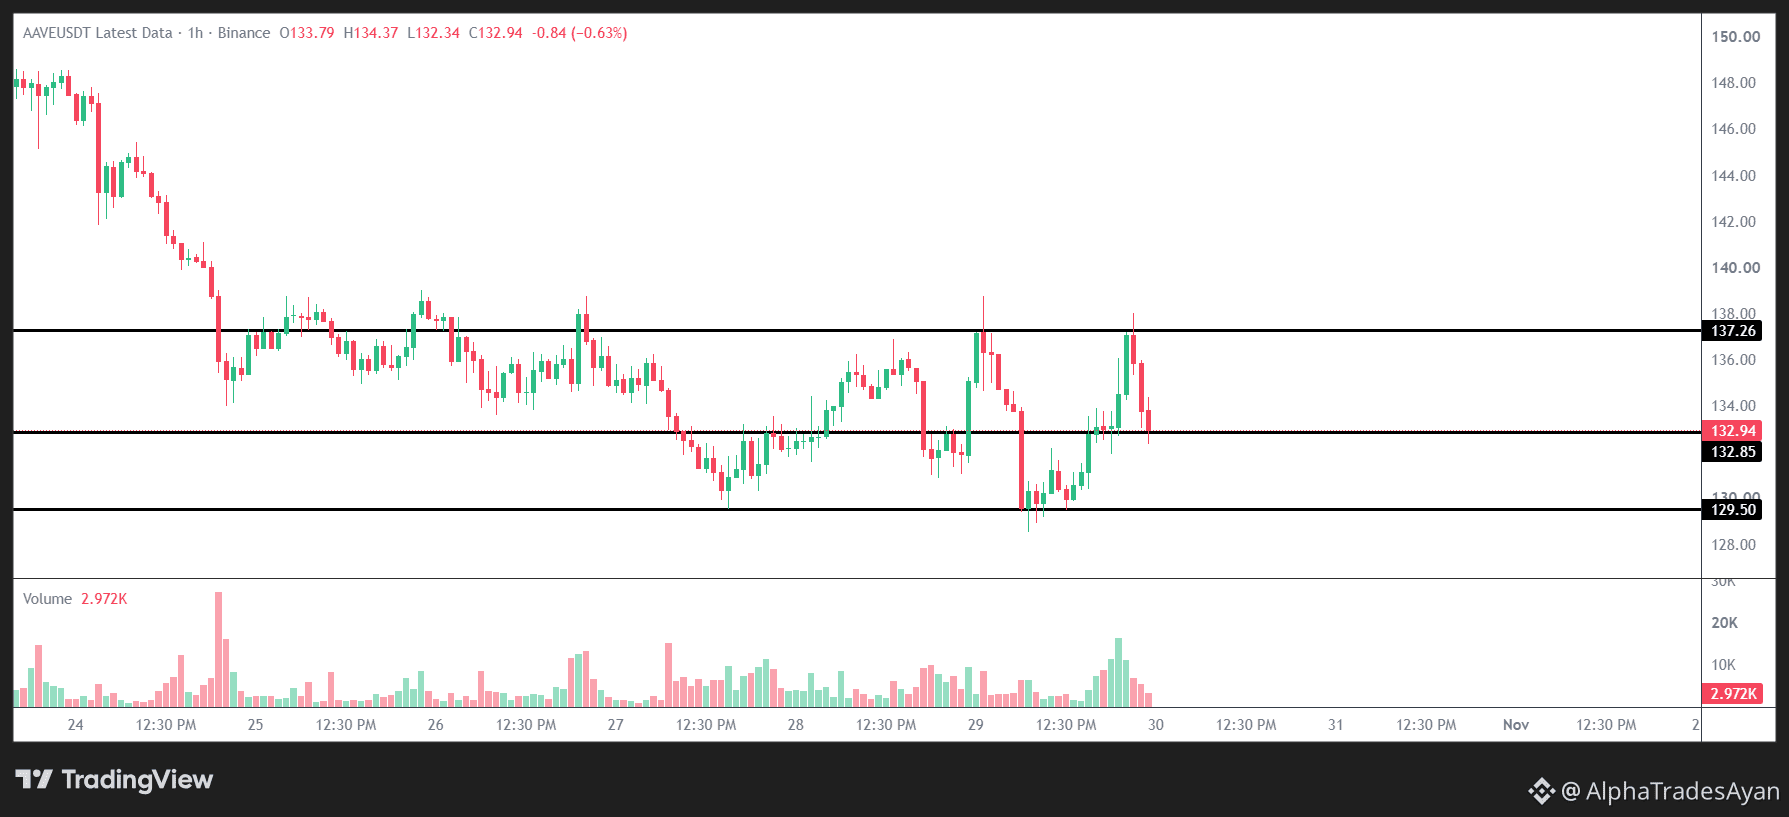
🚨 The $AAVE 1H chart is testing one of the most critical structural boundaries right now.
We are tracking a massive consolidation range here. Price faced a heavy rejection at the 137.26 ceiling and has aggressively pulled back to rest directly on the mid-range pivot at 132.85. The way volume shifts around this exact floor will dictate the next major swing.
$AAVE
{future}(AAVEUSDT)
If this pivot holds strong, the upper resistance zone is fully back on the table. However, a clean breakdown below this line opens up the trapdoor straight toward the 129.50 deep support.
Just mapping out the battlefield and waiting for the 1H candle to make the final decision. Let's see who takes control of this momentum. 👇
NFA | DYOR
🚨 The $AAVE 1H chart is testing one of the most critical structural boundaries right now.
We are tracking a massive consolidation range here. Price faced a heavy rejection at the 137.26 ceiling and has aggressively pulled back to rest directly on the mid-range pivot at 132.85. The way volume shifts around this exact floor will dictate the next major swing.
$AAVE
If this pivot holds strong, the upper resistance zone is fully back on the table. However, a clean breakdown below this line opens up the trapdoor straight toward the 129.50 deep support.
Just mapping out the battlefield and waiting for the 1H candle to make the final decision. Let's see who takes control of this momentum. 👇
NFA | DYOR
We are tracking a massive consolidation range here. Price faced a heavy rejection at the 137.26 ceiling and has aggressively pulled back to rest directly on the mid-range pivot at 132.85. The way volume shifts around this exact floor will dictate the next major swing.
$AAVE
If this pivot holds strong, the upper resistance zone is fully back on the table. However, a clean breakdown below this line opens up the trapdoor straight toward the 129.50 deep support.
Just mapping out the battlefield and waiting for the 1H candle to make the final decision. Let's see who takes control of this momentum. 👇
NFA | DYOR
1
1
97
See translation
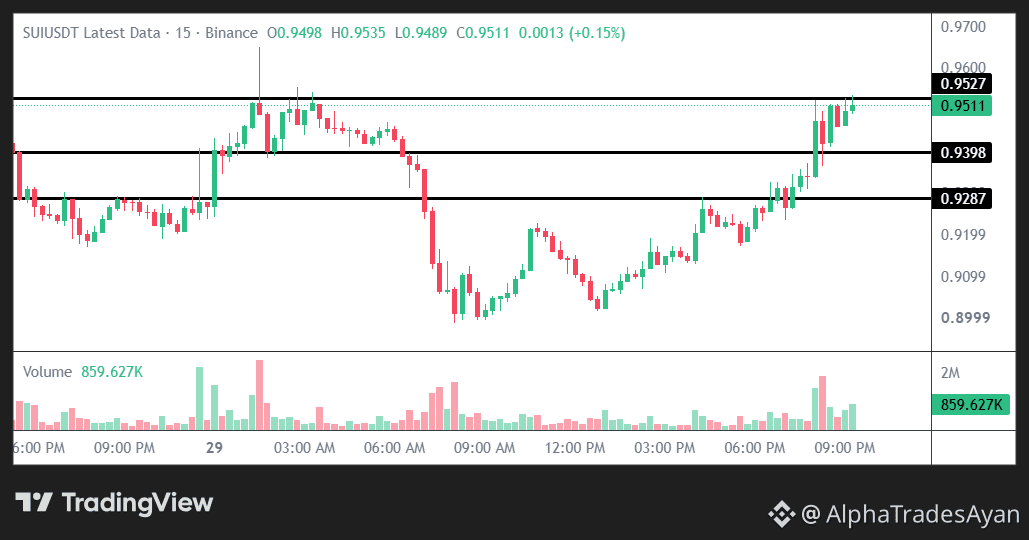
🚨 The tension on this $SUI 15m chart is getting impossible to ignore. 👀
Price is currently sitting at 0.9511, right below a critical resistance zone.
Ceiling: 0.9527
Support: 0.9398, then 0.9287
Momentum is building, but the real test is happening right at this boundary.
$SUI
{future}(SUIUSDT)
If the volume holds up and it clears 0.9527, things could get very interesting. If it gets rejected, I'm watching 0.9398 as the first floor. Not rushing into any positions, just letting the market show its hand first.
Let's see which side takes full control of this setup. 👇
NFA | DYOR
🚨 The tension on this $SUI 15m chart is getting impossible to ignore. 👀
Price is currently sitting at 0.9511, right below a critical resistance zone.
Ceiling: 0.9527
Support: 0.9398, then 0.9287
Momentum is building, but the real test is happening right at this boundary.
$SUI
If the volume holds up and it clears 0.9527, things could get very interesting. If it gets rejected, I'm watching 0.9398 as the first floor. Not rushing into any positions, just letting the market show its hand first.
Let's see which side takes full control of this setup. 👇
NFA | DYOR
Price is currently sitting at 0.9511, right below a critical resistance zone.
Ceiling: 0.9527
Support: 0.9398, then 0.9287
Momentum is building, but the real test is happening right at this boundary.
$SUI
If the volume holds up and it clears 0.9527, things could get very interesting. If it gets rejected, I'm watching 0.9398 as the first floor. Not rushing into any positions, just letting the market show its hand first.
Let's see which side takes full control of this setup. 👇
NFA | DYOR
1
1
193
See translation
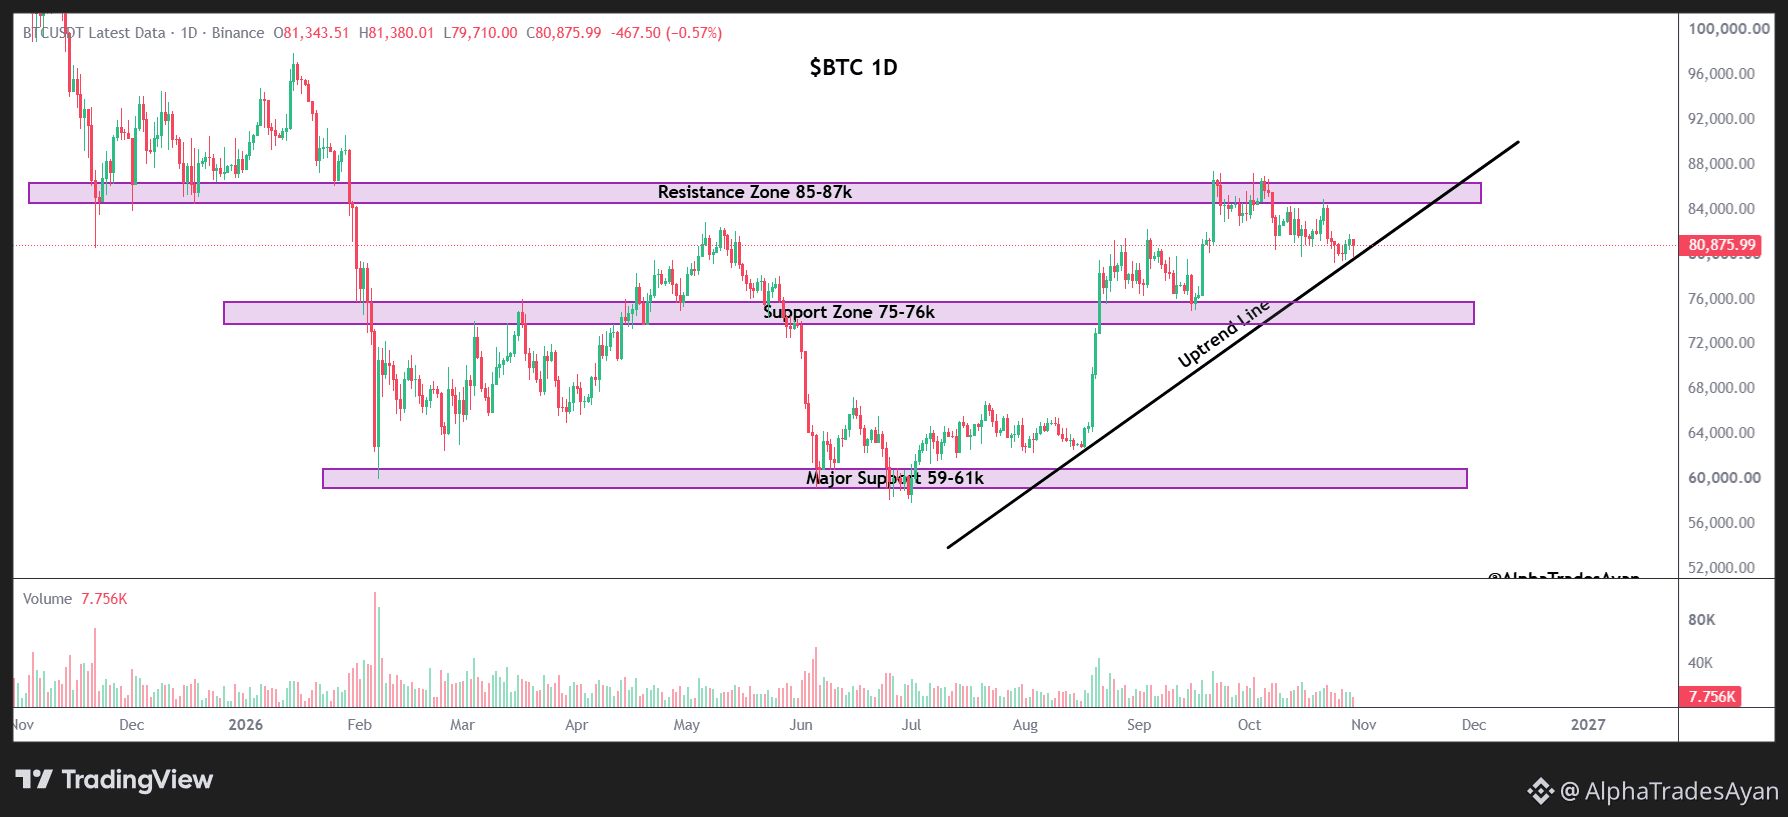
$BTC 1D: sitting right on the trendline
BTC at 80.4k, and the daily is on a decision line.
Ceiling: 85-87k
Support: 75-76k, then 59-61k
Uptrend line is holding for now, volume is fading
$BTC
{future}(BTCUSDT)
If the line holds, 85k comes back into play. If we get a daily close below it, I’m watching 75-76k. Not calling a direction, just waiting for the close.
Where’s your invalidation on BTC? NFA, just my notes.
$BTC 1D: sitting right on the trendline
BTC at 80.4k, and the daily is on a decision line.
Ceiling: 85-87k
Support: 75-76k, then 59-61k
Uptrend line is holding for now, volume is fading
$BTC
If the line holds, 85k comes back into play. If we get a daily close below it, I’m watching 75-76k. Not calling a direction, just waiting for the close.
Where’s your invalidation on BTC? NFA, just my notes.
BTC at 80.4k, and the daily is on a decision line.
Ceiling: 85-87k
Support: 75-76k, then 59-61k
Uptrend line is holding for now, volume is fading
$BTC
If the line holds, 85k comes back into play. If we get a daily close below it, I’m watching 75-76k. Not calling a direction, just waiting for the close.
Where’s your invalidation on BTC? NFA, just my notes.
1
1
197
See translation
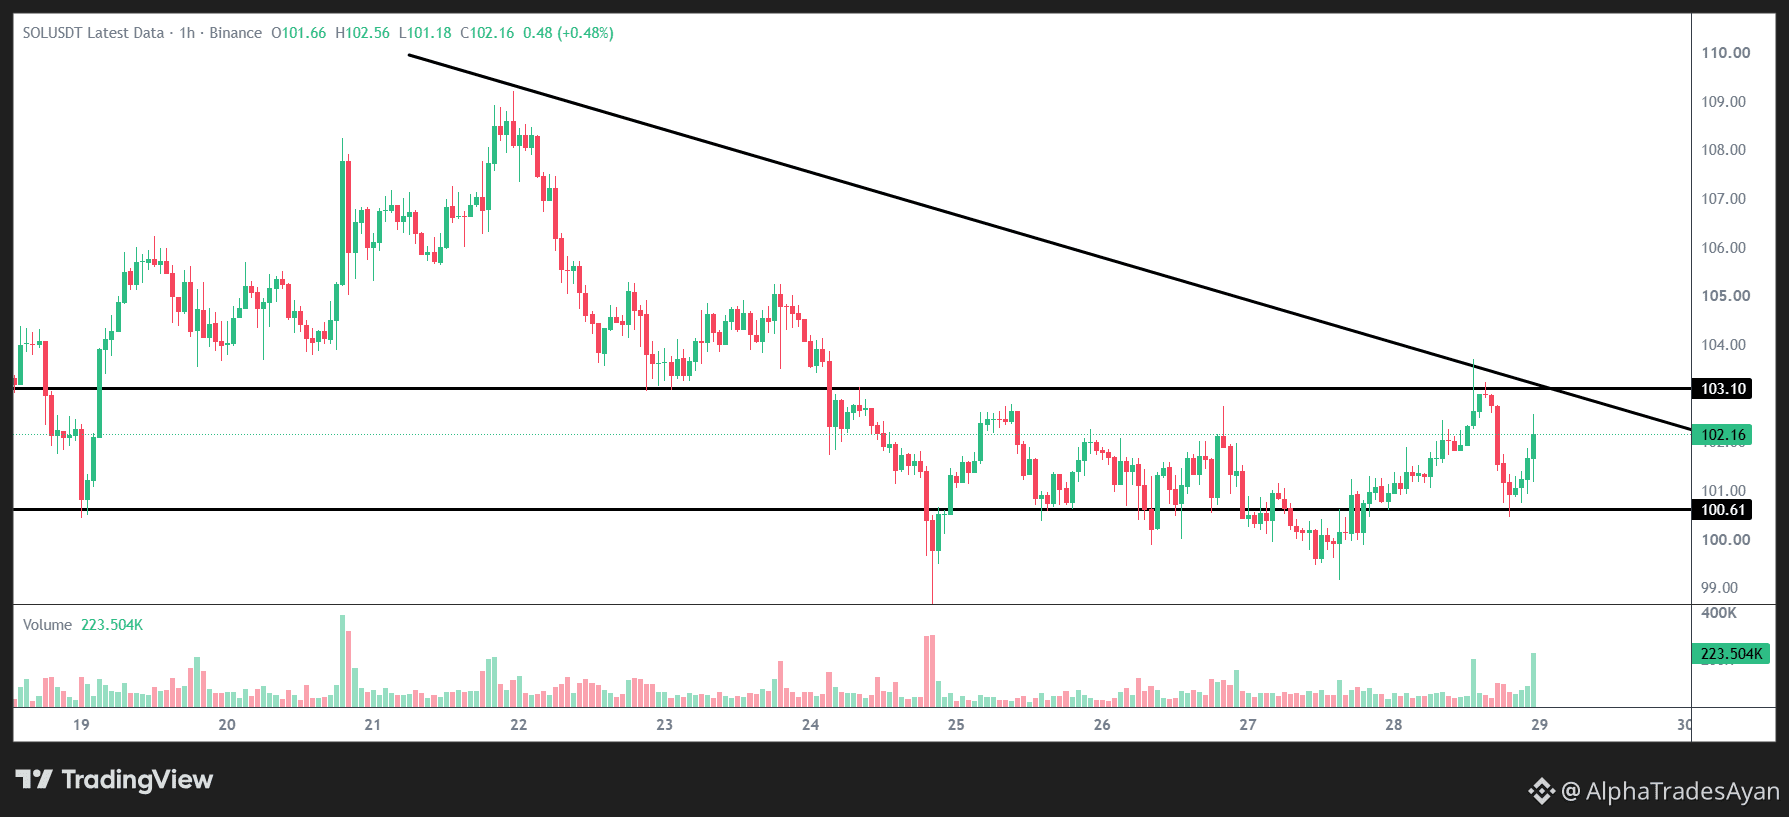
SOL 1H – pressing against the trendline again
SOL is at 102.16 and honestly the chart looks a lot like where we were a few days ago: a range with a falling trendline sitting on top.
What I’m watching:
103.10 is the level that matters. It lines up with the descending trendline from the 22nd high, so there’s double resistance right there. Price poked above it yesterday and got pushed back.
$SOL
{future}(SOLUSDT)
100.61 is the floor for now. It held again last night and the bounce was quick. It also caught the dips on the 19th and the 27th.
The last candle came with a decent volume bump, which is nice to see. But one candle doesn’t confirm anything for me.
My plan is simple: I’d want a proper hourly close above 103.10 and the trendline before considering any move. If 100.61 gives way, I’d be careful, because the next area is the 99 wick from the 27th.
Could be a breakout, could be another fake-out. Waiting for the candle to close.
How are you reading SOL here?
NFA, just my notes.
SOL 1H – pressing against the trendline again
SOL is at 102.16 and honestly the chart looks a lot like where we were a few days ago: a range with a falling trendline sitting on top.
What I’m watching:
103.10 is the level that matters. It lines up with the descending trendline from the 22nd high, so there’s double resistance right there. Price poked above it yesterday and got pushed back.
$SOL
100.61 is the floor for now. It held again last night and the bounce was quick. It also caught the dips on the 19th and the 27th.
The last candle came with a decent volume bump, which is nice to see. But one candle doesn’t confirm anything for me.
My plan is simple: I’d want a proper hourly close above 103.10 and the trendline before considering any move. If 100.61 gives way, I’d be careful, because the next area is the 99 wick from the 27th.
Could be a breakout, could be another fake-out. Waiting for the candle to close.
How are you reading SOL here?
NFA, just my notes.
SOL is at 102.16 and honestly the chart looks a lot like where we were a few days ago: a range with a falling trendline sitting on top.
What I’m watching:
103.10 is the level that matters. It lines up with the descending trendline from the 22nd high, so there’s double resistance right there. Price poked above it yesterday and got pushed back.
$SOL
100.61 is the floor for now. It held again last night and the bounce was quick. It also caught the dips on the 19th and the 27th.
The last candle came with a decent volume bump, which is nice to see. But one candle doesn’t confirm anything for me.
My plan is simple: I’d want a proper hourly close above 103.10 and the trendline before considering any move. If 100.61 gives way, I’d be careful, because the next area is the 99 wick from the 27th.
Could be a breakout, could be another fake-out. Waiting for the candle to close.
How are you reading SOL here?
NFA, just my notes.
1
1
248
See translation
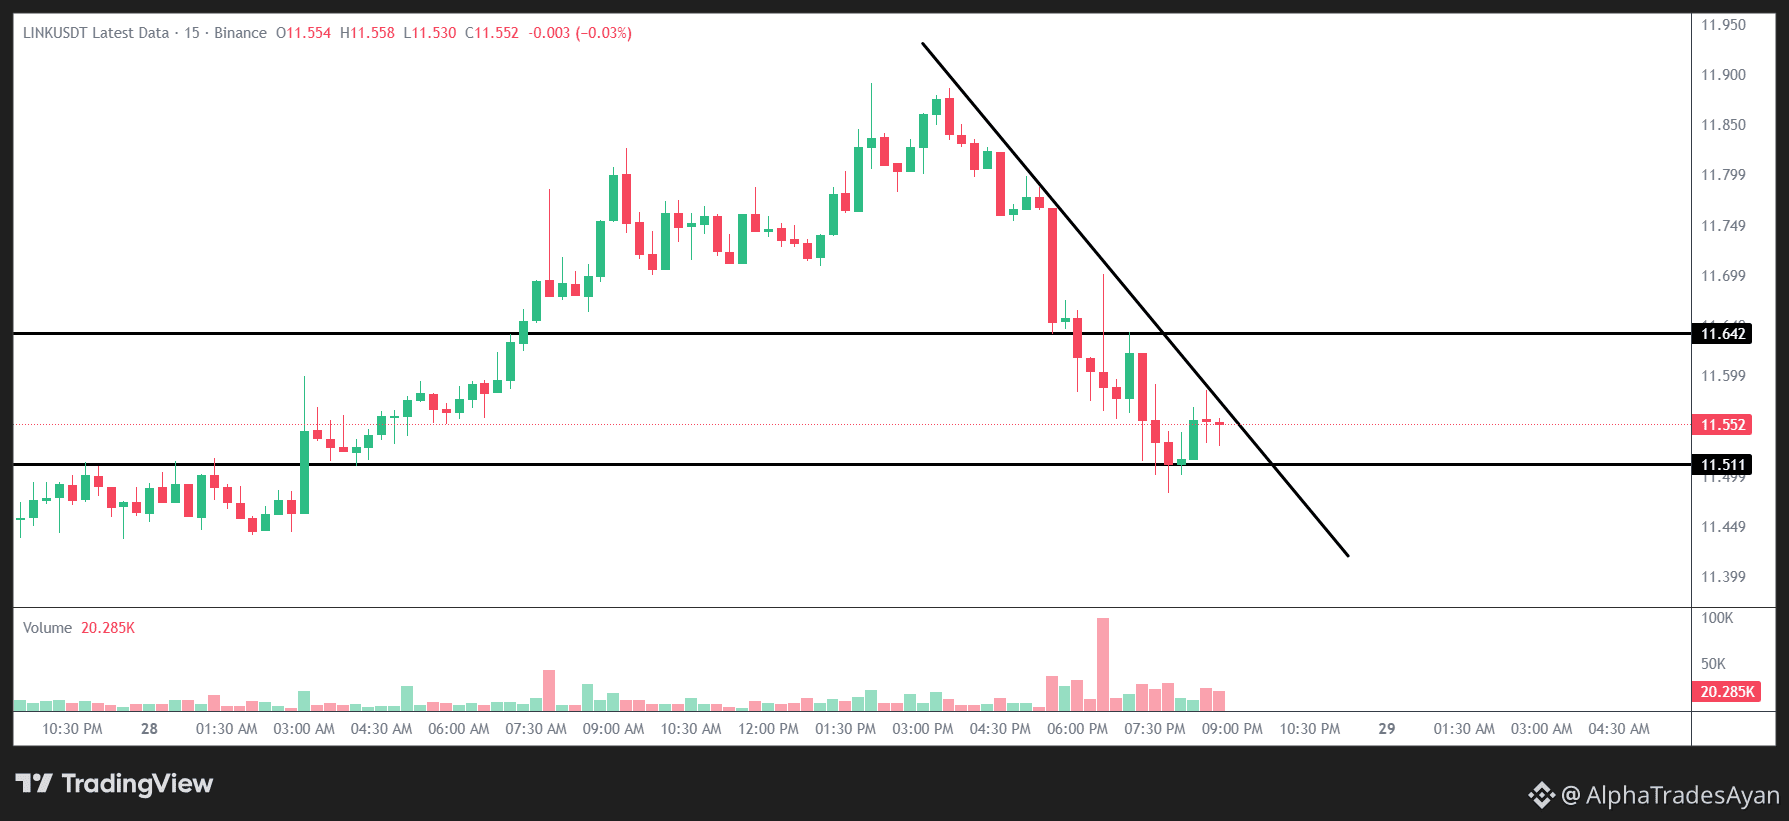
Asset: LINK
⏱️ Timeframe: 15m
📉 Current Vibe: Heavy compression loading.
Quick Thoughts:
Price is getting pinned right on top of a major support zone while being squeezed by a steep descending trendline. When a structure gets this tight, volume usually steps in fast.
I have my alerts set for this exact range:
Ceiling ➔ 11.642
Floor ➔ 11.511
$LINK
{future}(LINKUSDT)
Not forcing any early trades, just letting the market show its hand first.
Are you guys tracking this setup today? 👇
NFA | DYOR
Asset: LINK
⏱️ Timeframe: 15m
📉 Current Vibe: Heavy compression loading.
Quick Thoughts:
Price is getting pinned right on top of a major support zone while being squeezed by a steep descending trendline. When a structure gets this tight, volume usually steps in fast.
I have my alerts set for this exact range:
Ceiling ➔ 11.642
Floor ➔ 11.511
$LINK
Not forcing any early trades, just letting the market show its hand first.
Are you guys tracking this setup today? 👇
NFA | DYOR
⏱️ Timeframe: 15m
📉 Current Vibe: Heavy compression loading.
Quick Thoughts:
Price is getting pinned right on top of a major support zone while being squeezed by a steep descending trendline. When a structure gets this tight, volume usually steps in fast.
I have my alerts set for this exact range:
Ceiling ➔ 11.642
Floor ➔ 11.511
$LINK
Not forcing any early trades, just letting the market show its hand first.
Are you guys tracking this setup today? 👇
NFA | DYOR
1
1
178
See translation
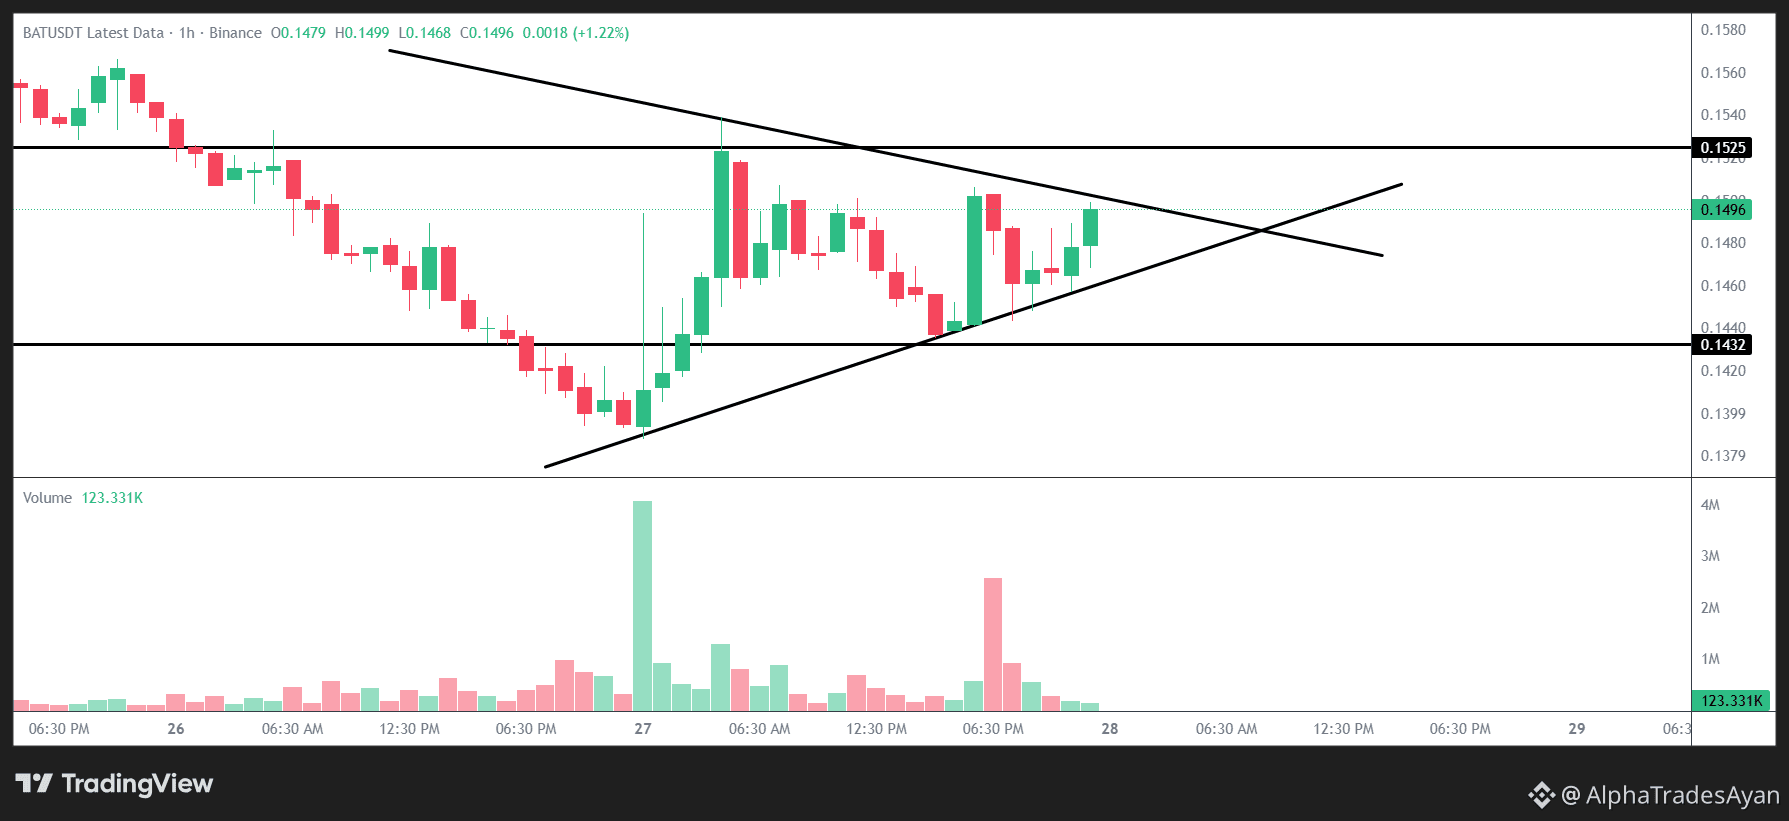
🚨 A massive squeeze is building up on the $BAT chart right now! 👀
We are looking at a classic symmetrical triangle setup. Price is getting tightly compressed between a descending resistance line and an ascending support base.
Rather than anticipating the move, I am strictly observing the volume as we get closer to the apex of this structure.
Key levels on my radar:
🎯 Major Resistance ➔ 0.1525
🛡️ Solid Support ➔ 0.1432
$BAT
{future}(BATUSDT)
A sharp move is loading up here. Let's see which side takes full control of this momentum. 👇
NFA | DYOR
🚨 A massive squeeze is building up on the $BAT chart right now! 👀
We are looking at a classic symmetrical triangle setup. Price is getting tightly compressed between a descending resistance line and an ascending support base.
Rather than anticipating the move, I am strictly observing the volume as we get closer to the apex of this structure.
Key levels on my radar:
🎯 Major Resistance ➔ 0.1525
🛡️ Solid Support ➔ 0.1432
$BAT
A sharp move is loading up here. Let's see which side takes full control of this momentum. 👇
NFA | DYOR
We are looking at a classic symmetrical triangle setup. Price is getting tightly compressed between a descending resistance line and an ascending support base.
Rather than anticipating the move, I am strictly observing the volume as we get closer to the apex of this structure.
Key levels on my radar:
🎯 Major Resistance ➔ 0.1525
🛡️ Solid Support ➔ 0.1432
$BAT
A sharp move is loading up here. Let's see which side takes full control of this momentum. 👇
NFA | DYOR
1
1
307
See translation
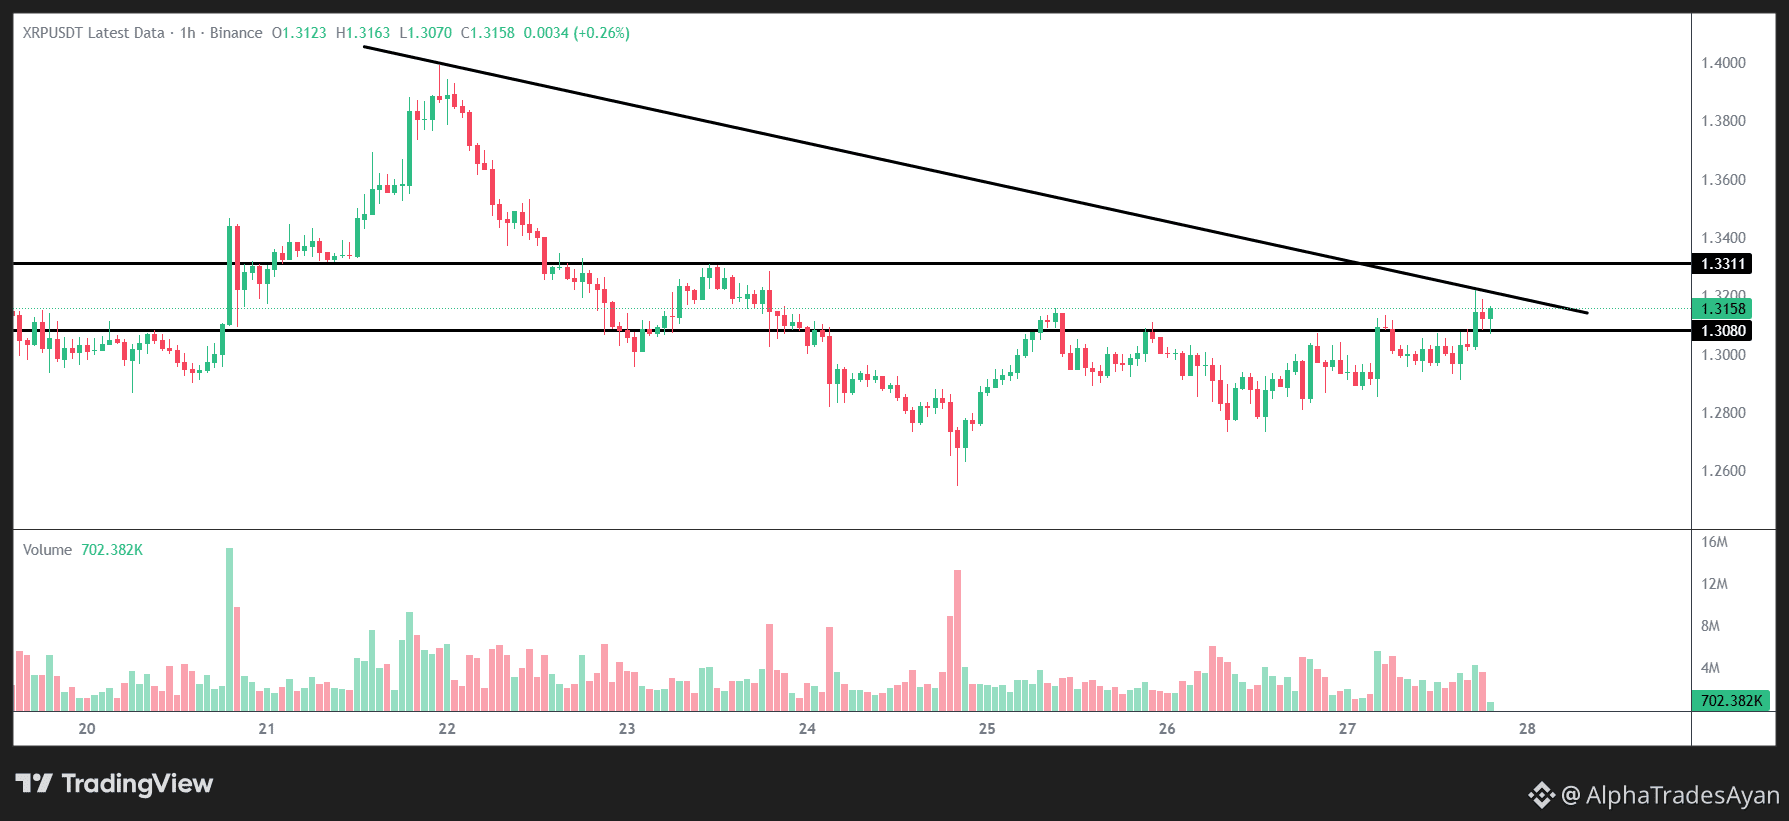
Breaking down the $XRP 1H chart structure today. 📊
We are looking at a classic descending triangle formation. The price is getting squeezed tightly between that overhead descending trendline and the flat horizontal base.
Volume is relatively calm right now, so I am just watching patiently to see how the market reacts at these boundaries.
Key levels on my radar:
🎯 Major Resistance ➔ 1.3311
🛡️ Solid Support ➔ 1.3080
$XRP
{future}(XRPUSDT)
How are you guys reading this current setup? Let me know your thoughts below! 👇
NFA | DYOR
Breaking down the $XRP 1H chart structure today. 📊
We are looking at a classic descending triangle formation. The price is getting squeezed tightly between that overhead descending trendline and the flat horizontal base.
Volume is relatively calm right now, so I am just watching patiently to see how the market reacts at these boundaries.
Key levels on my radar:
🎯 Major Resistance ➔ 1.3311
🛡️ Solid Support ➔ 1.3080
$XRP
How are you guys reading this current setup? Let me know your thoughts below! 👇
NFA | DYOR
We are looking at a classic descending triangle formation. The price is getting squeezed tightly between that overhead descending trendline and the flat horizontal base.
Volume is relatively calm right now, so I am just watching patiently to see how the market reacts at these boundaries.
Key levels on my radar:
🎯 Major Resistance ➔ 1.3311
🛡️ Solid Support ➔ 1.3080
$XRP
How are you guys reading this current setup? Let me know your thoughts below! 👇
NFA | DYOR
8
3
1.4k
See translation
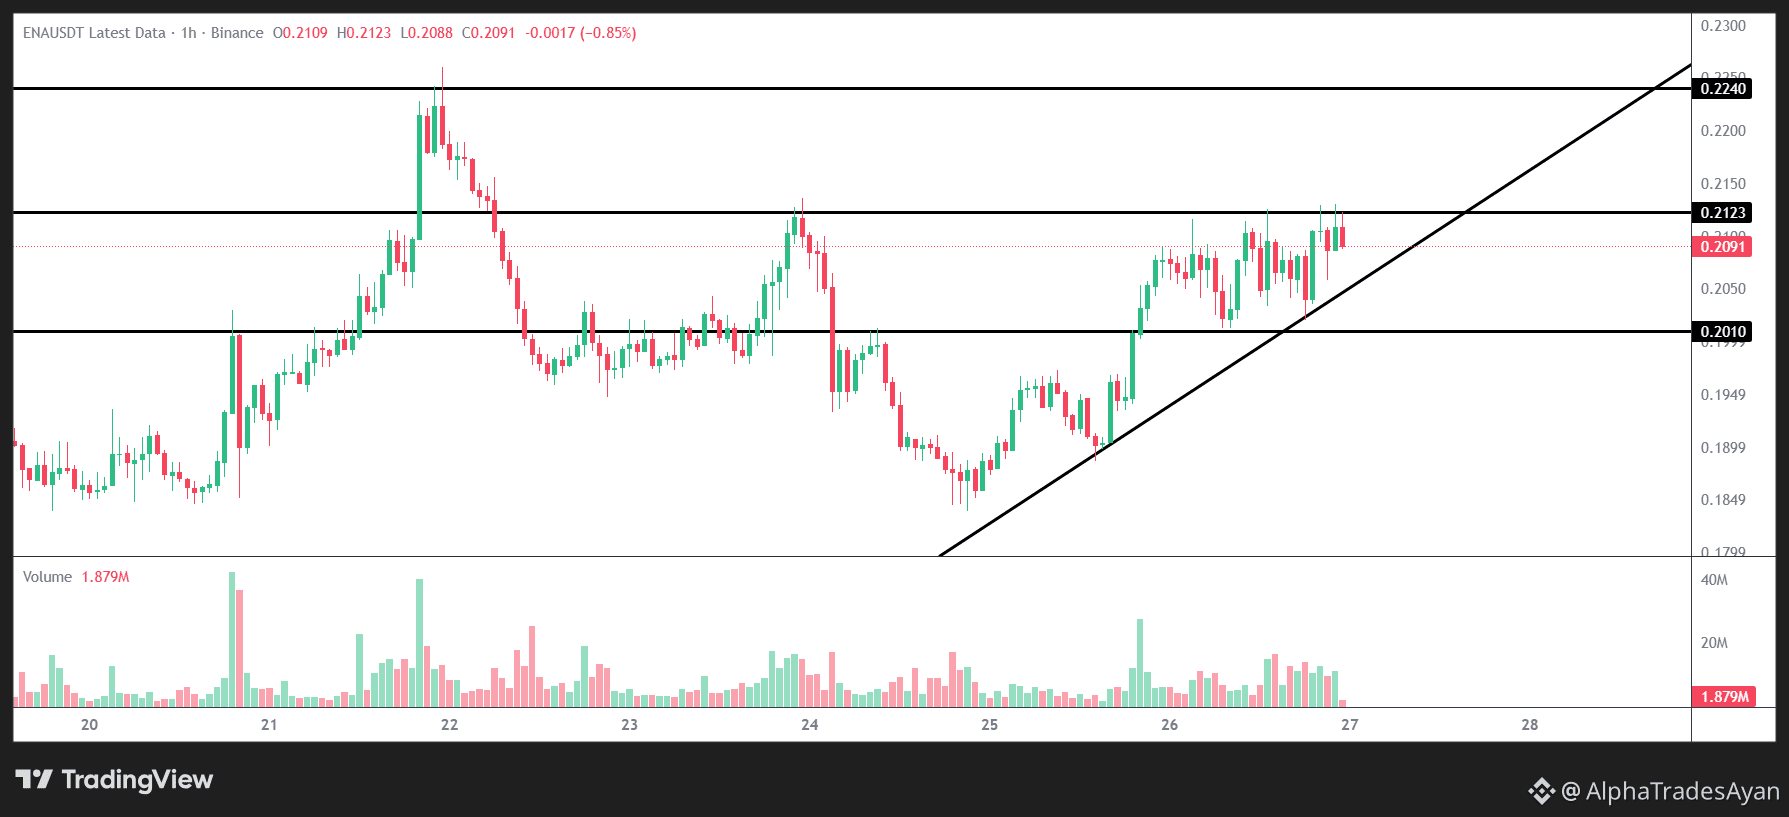
$ENA is giving us a really clean chart to watch today. 👀
Price is steadily grinding up along this ascending trendline, and it looks like it's preparing to test that 0.2123 resistance ceiling again. I am keeping a close eye on how the volume develops around this area. If the momentum fades and the trendline breaks, 0.2010 is the solid support base waiting below.
$ENA
{future}(ENAUSDT)
I'm not rushing into anything, just letting the candles do the talking and waiting for the market to show its hand.
Are you guys actively tracking this ENA structure right now, or are your eyes focused on other altcoins tonight? Let me know below! 👇
NFA | DYOR
$ENA is giving us a really clean chart to watch today. 👀
Price is steadily grinding up along this ascending trendline, and it looks like it's preparing to test that 0.2123 resistance ceiling again. I am keeping a close eye on how the volume develops around this area. If the momentum fades and the trendline breaks, 0.2010 is the solid support base waiting below.
$ENA
I'm not rushing into anything, just letting the candles do the talking and waiting for the market to show its hand.
Are you guys actively tracking this ENA structure right now, or are your eyes focused on other altcoins tonight? Let me know below! 👇
NFA | DYOR
Price is steadily grinding up along this ascending trendline, and it looks like it's preparing to test that 0.2123 resistance ceiling again. I am keeping a close eye on how the volume develops around this area. If the momentum fades and the trendline breaks, 0.2010 is the solid support base waiting below.
$ENA
I'm not rushing into anything, just letting the candles do the talking and waiting for the market to show its hand.
Are you guys actively tracking this ENA structure right now, or are your eyes focused on other altcoins tonight? Let me know below! 👇
NFA | DYOR
1
1
482
See translation
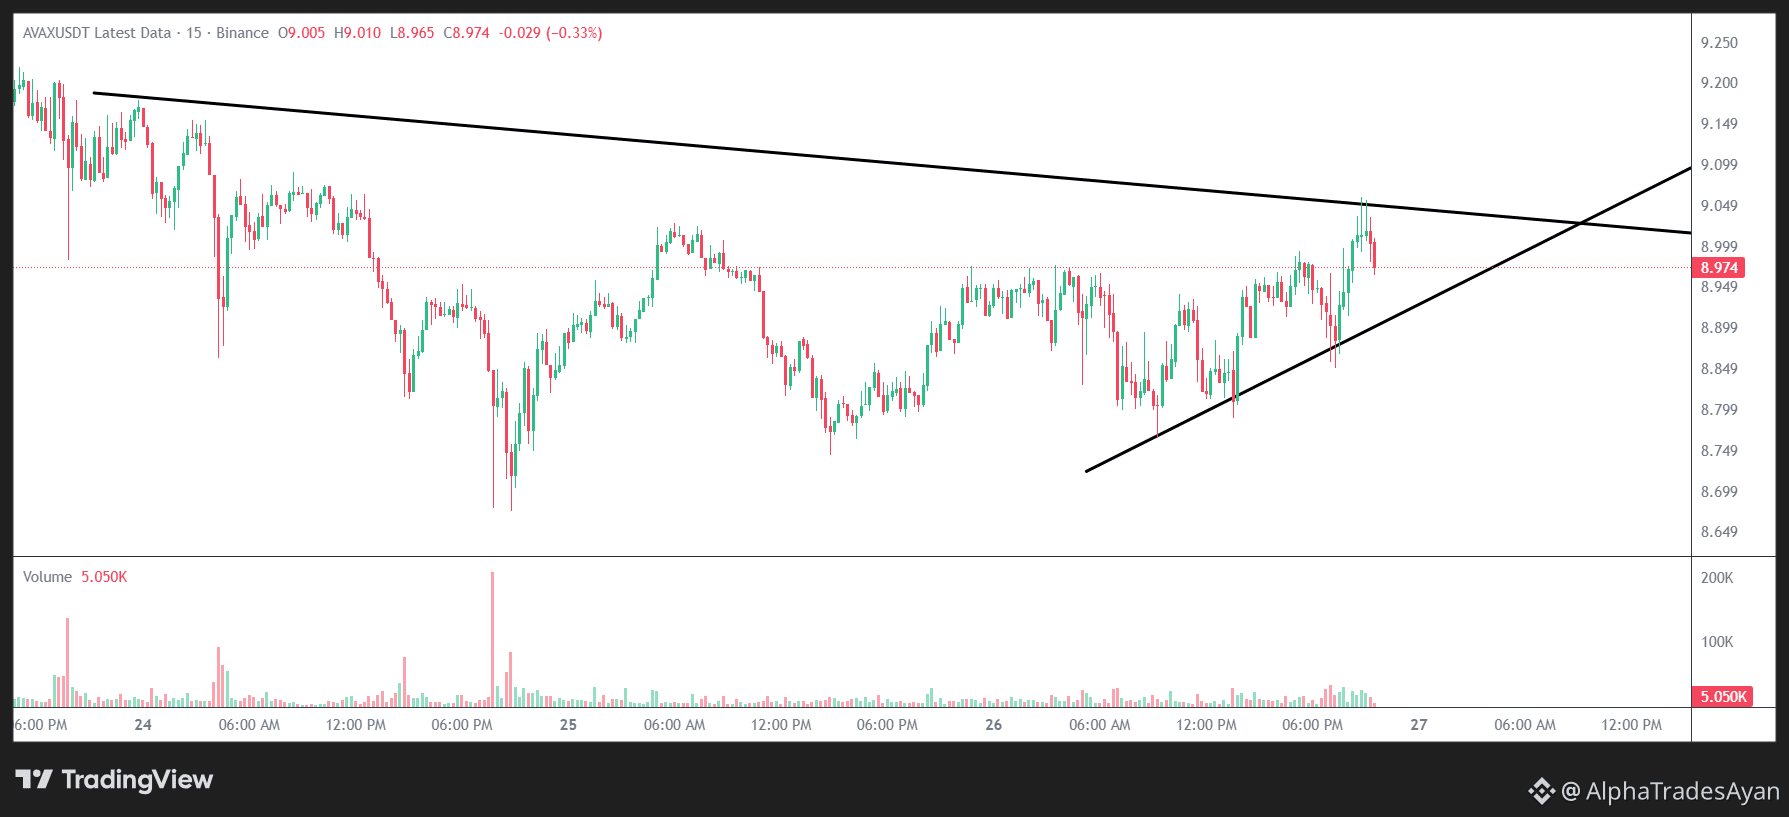
🚨 Love the technical structure forming on $AVAX right now. 📊
We are looking at a classic compression between a heavy descending trendline and a solid support base. Rather than guessing the next move early, I am just observing how the volume reacts as we get closer to the apex.
Key levels on my radar:
🎯 Major Resistance ➔ 9.049
🛡️ Solid Support ➔ 8.900
$AVAX
{future}(AVAXUSDT)
BULLISH 🟢 or BEARISH 🔴?
Drop your emoji in the comments below! 👇
NFA | DYOR
🚨 Love the technical structure forming on $AVAX right now. 📊
We are looking at a classic compression between a heavy descending trendline and a solid support base. Rather than guessing the next move early, I am just observing how the volume reacts as we get closer to the apex.
Key levels on my radar:
🎯 Major Resistance ➔ 9.049
🛡️ Solid Support ➔ 8.900
$AVAX
BULLISH 🟢 or BEARISH 🔴?
Drop your emoji in the comments below! 👇
NFA | DYOR
We are looking at a classic compression between a heavy descending trendline and a solid support base. Rather than guessing the next move early, I am just observing how the volume reacts as we get closer to the apex.
Key levels on my radar:
🎯 Major Resistance ➔ 9.049
🛡️ Solid Support ➔ 8.900
$AVAX
BULLISH 🟢 or BEARISH 🔴?
Drop your emoji in the comments below! 👇
NFA | DYOR
1
1
135
See translation
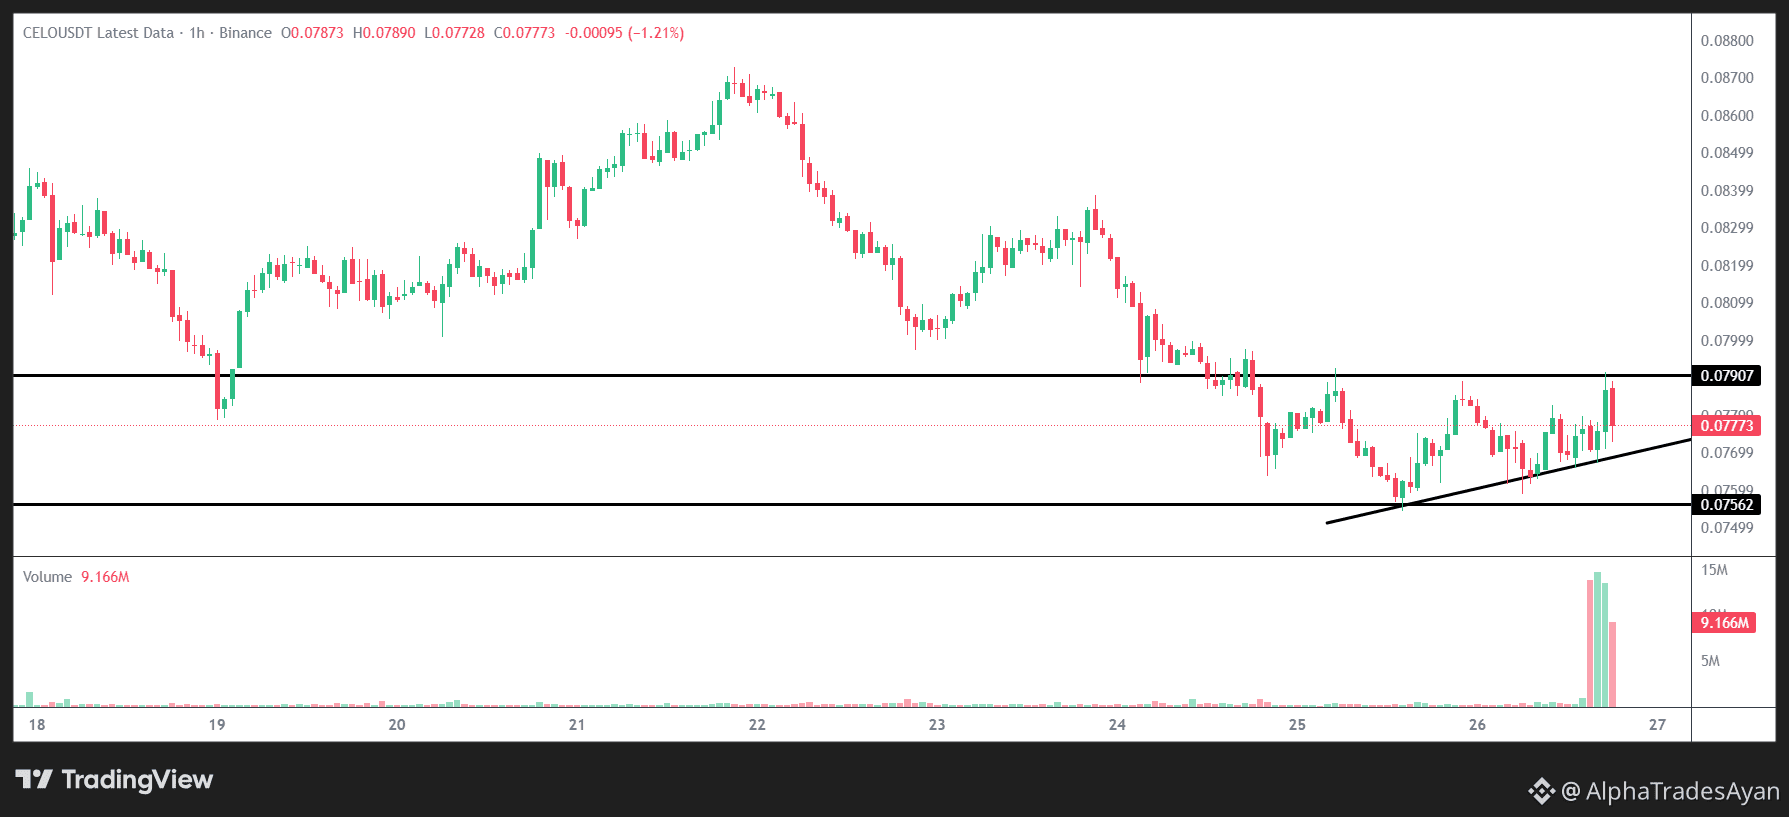
$CELO is printing a beautifully tight structure on the 1H chart right now. 👀
Look at that massive volume spike coming in as the price rides this ascending trendline. We are seeing a perfect squeeze between the lower support base and the overhead ceiling. I am just sitting back and observing how the market handles this heavy volume compression.
Key levels on my radar:
🎯 Major Resistance ➔ 0.07907
🛡️ Solid Support ➔ 0.07562
$CELO
{future}(CELOUSDT)
A sharp move is loading up here. Let's see which side takes full control of this momentum. 👇
NFA | DYOR
$CELO is printing a beautifully tight structure on the 1H chart right now. 👀
Look at that massive volume spike coming in as the price rides this ascending trendline. We are seeing a perfect squeeze between the lower support base and the overhead ceiling. I am just sitting back and observing how the market handles this heavy volume compression.
Key levels on my radar:
🎯 Major Resistance ➔ 0.07907
🛡️ Solid Support ➔ 0.07562
$CELO
A sharp move is loading up here. Let's see which side takes full control of this momentum. 👇
NFA | DYOR
Look at that massive volume spike coming in as the price rides this ascending trendline. We are seeing a perfect squeeze between the lower support base and the overhead ceiling. I am just sitting back and observing how the market handles this heavy volume compression.
Key levels on my radar:
🎯 Major Resistance ➔ 0.07907
🛡️ Solid Support ➔ 0.07562
$CELO
A sharp move is loading up here. Let's see which side takes full control of this momentum. 👇
NFA | DYOR
1
1
215
See translation
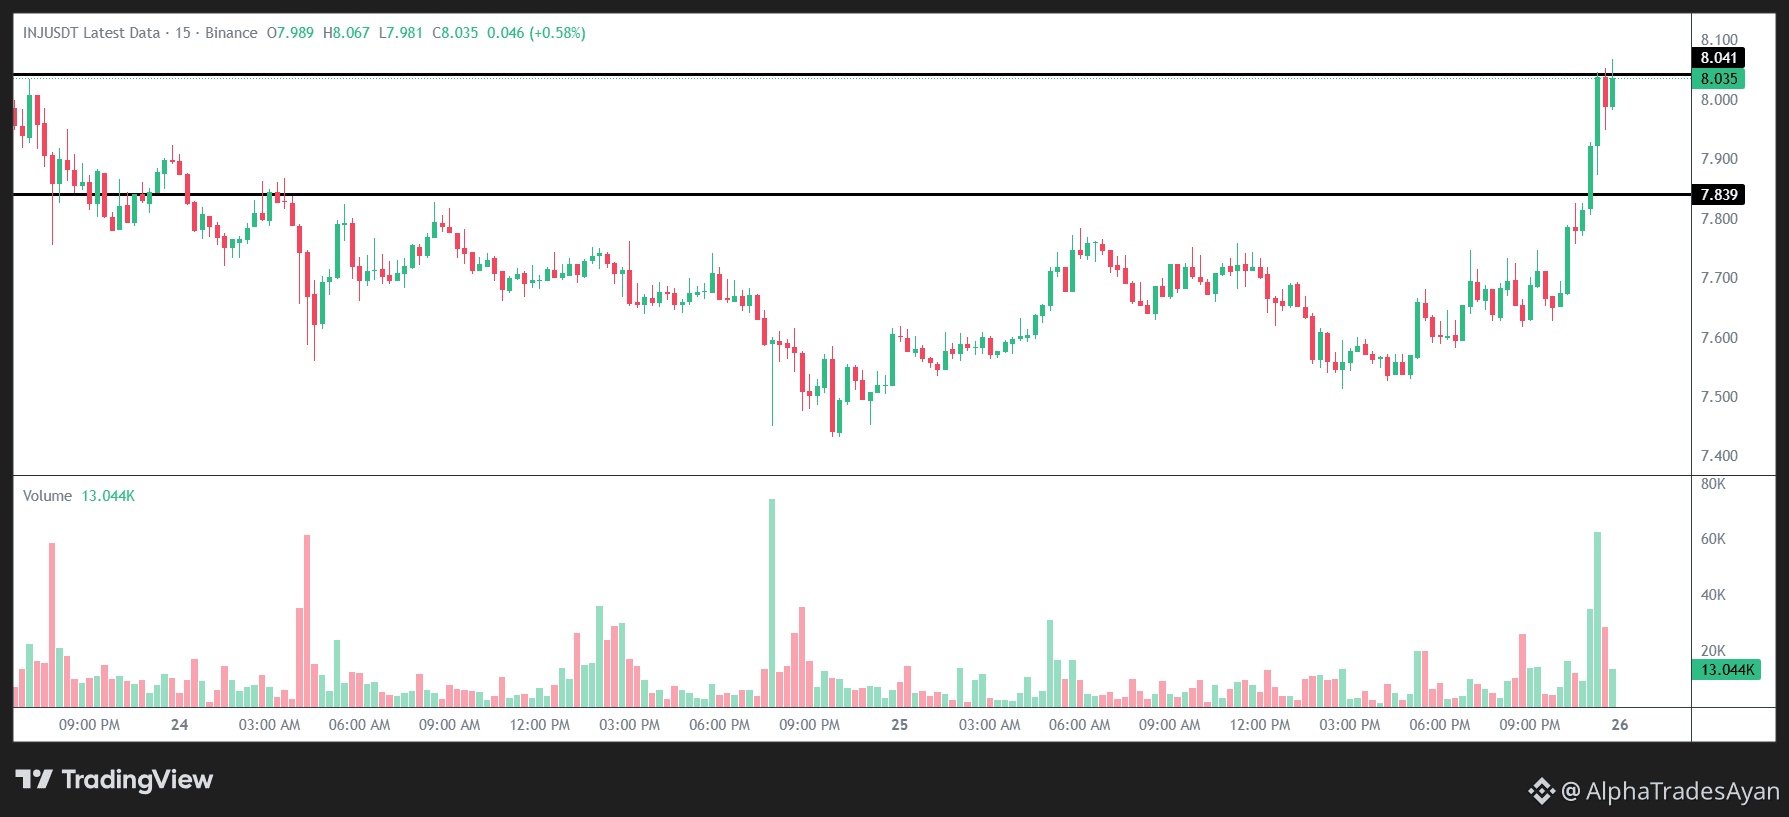
$INJ is giving us a textbook chart to watch right now. 👀
Price just made a massive push upward and is currently testing that major 8.041 boundary. I am keeping a close eye on the volume here to see how the market reacts at this ceiling. If momentum fades and we see a pullback, 7.839 is the solid support base to watch below.
Not rushing into anything, just letting the candles do the talking first.
Key levels on my radar:
🎯 Major Resistance ➔ 8.041
🛡️ Solid Support ➔ 7.839
$INJ
{future}(INJUSDT)
Are you guys actively watching this INJ structure today, or are you focused on other altcoins? Let me know! 👇
NFA | DYOR
$INJ is giving us a textbook chart to watch right now. 👀
Price just made a massive push upward and is currently testing that major 8.041 boundary. I am keeping a close eye on the volume here to see how the market reacts at this ceiling. If momentum fades and we see a pullback, 7.839 is the solid support base to watch below.
Not rushing into anything, just letting the candles do the talking first.
Key levels on my radar:
🎯 Major Resistance ➔ 8.041
🛡️ Solid Support ➔ 7.839
$INJ
Are you guys actively watching this INJ structure today, or are you focused on other altcoins? Let me know! 👇
NFA | DYOR
Price just made a massive push upward and is currently testing that major 8.041 boundary. I am keeping a close eye on the volume here to see how the market reacts at this ceiling. If momentum fades and we see a pullback, 7.839 is the solid support base to watch below.
Not rushing into anything, just letting the candles do the talking first.
Key levels on my radar:
🎯 Major Resistance ➔ 8.041
🛡️ Solid Support ➔ 7.839
$INJ
Are you guys actively watching this INJ structure today, or are you focused on other altcoins? Let me know! 👇
NFA | DYOR
1
1
484
See translation
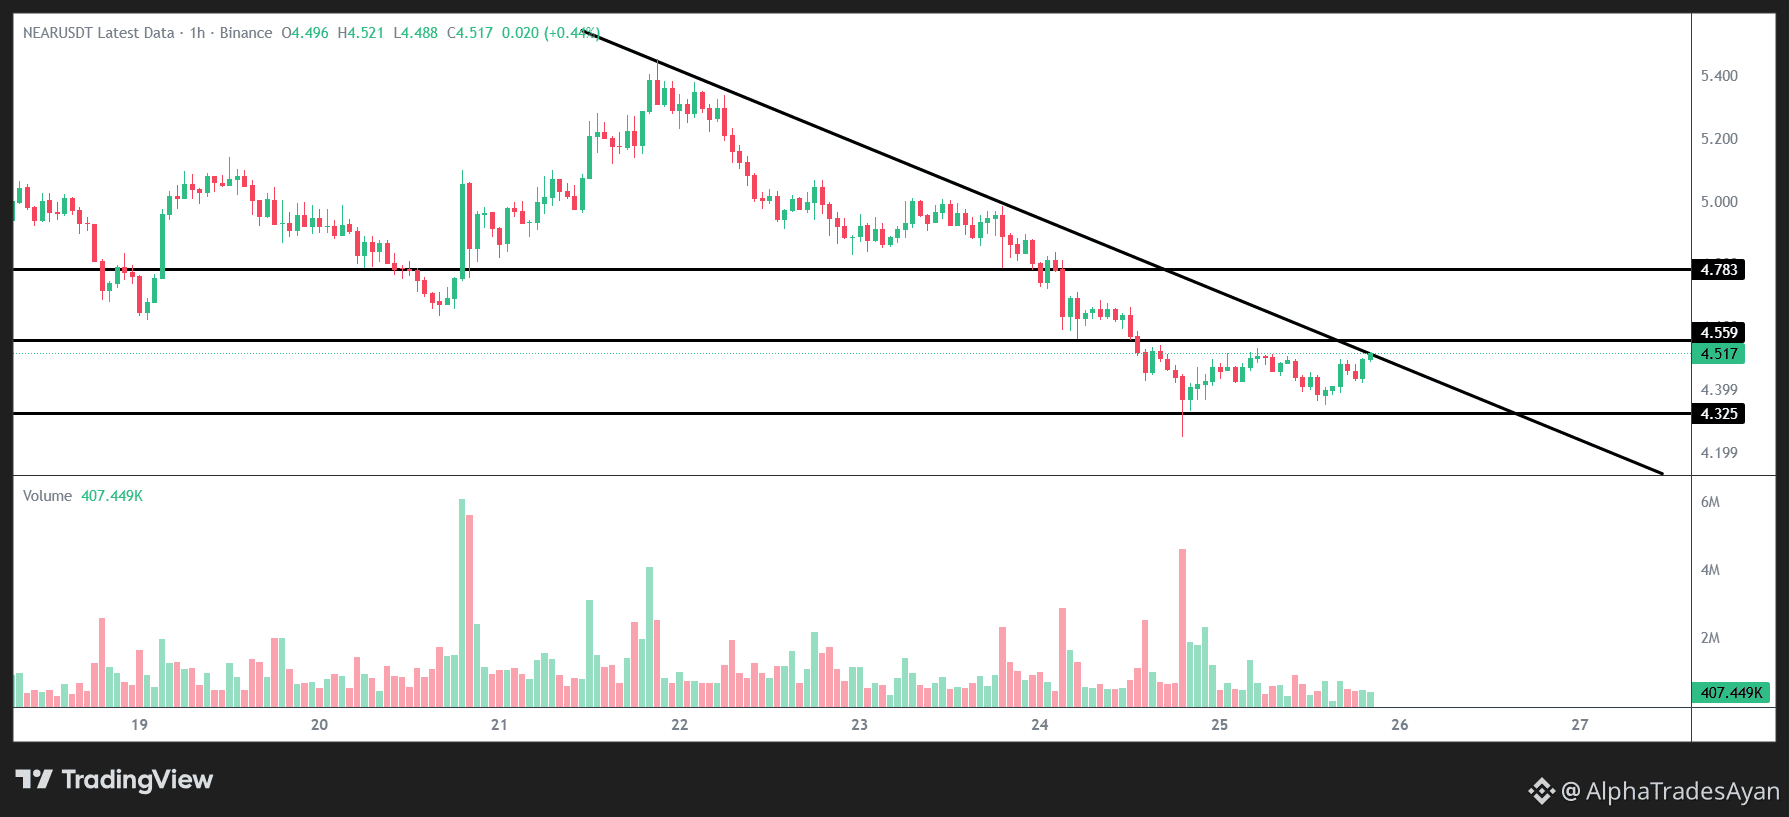
$NEAR is still trading under the descending trendline on the 1H.
Current price is around 4.52.
Key levels I’m watching:
Resistance → 4.56 Major
Resistance → 4.78
Support → 4.33
$NEAR
{future}(NEARUSDT)
Price has been stuck in this range for a while. Volume is quiet today. Just observing how it behaves near these levels.
What are you seeing on $NEAR?
NFA | DYOR
$NEAR is still trading under the descending trendline on the 1H.
Current price is around 4.52.
Key levels I’m watching:
Resistance → 4.56 Major
Resistance → 4.78
Support → 4.33
$NEAR
Price has been stuck in this range for a while. Volume is quiet today. Just observing how it behaves near these levels.
What are you seeing on $NEAR ?
NFA | DYOR
Current price is around 4.52.
Key levels I’m watching:
Resistance → 4.56 Major
Resistance → 4.78
Support → 4.33
$NEAR
Price has been stuck in this range for a while. Volume is quiet today. Just observing how it behaves near these levels.
What are you seeing on $NEAR ?
NFA | DYOR
1
1
219
See translation
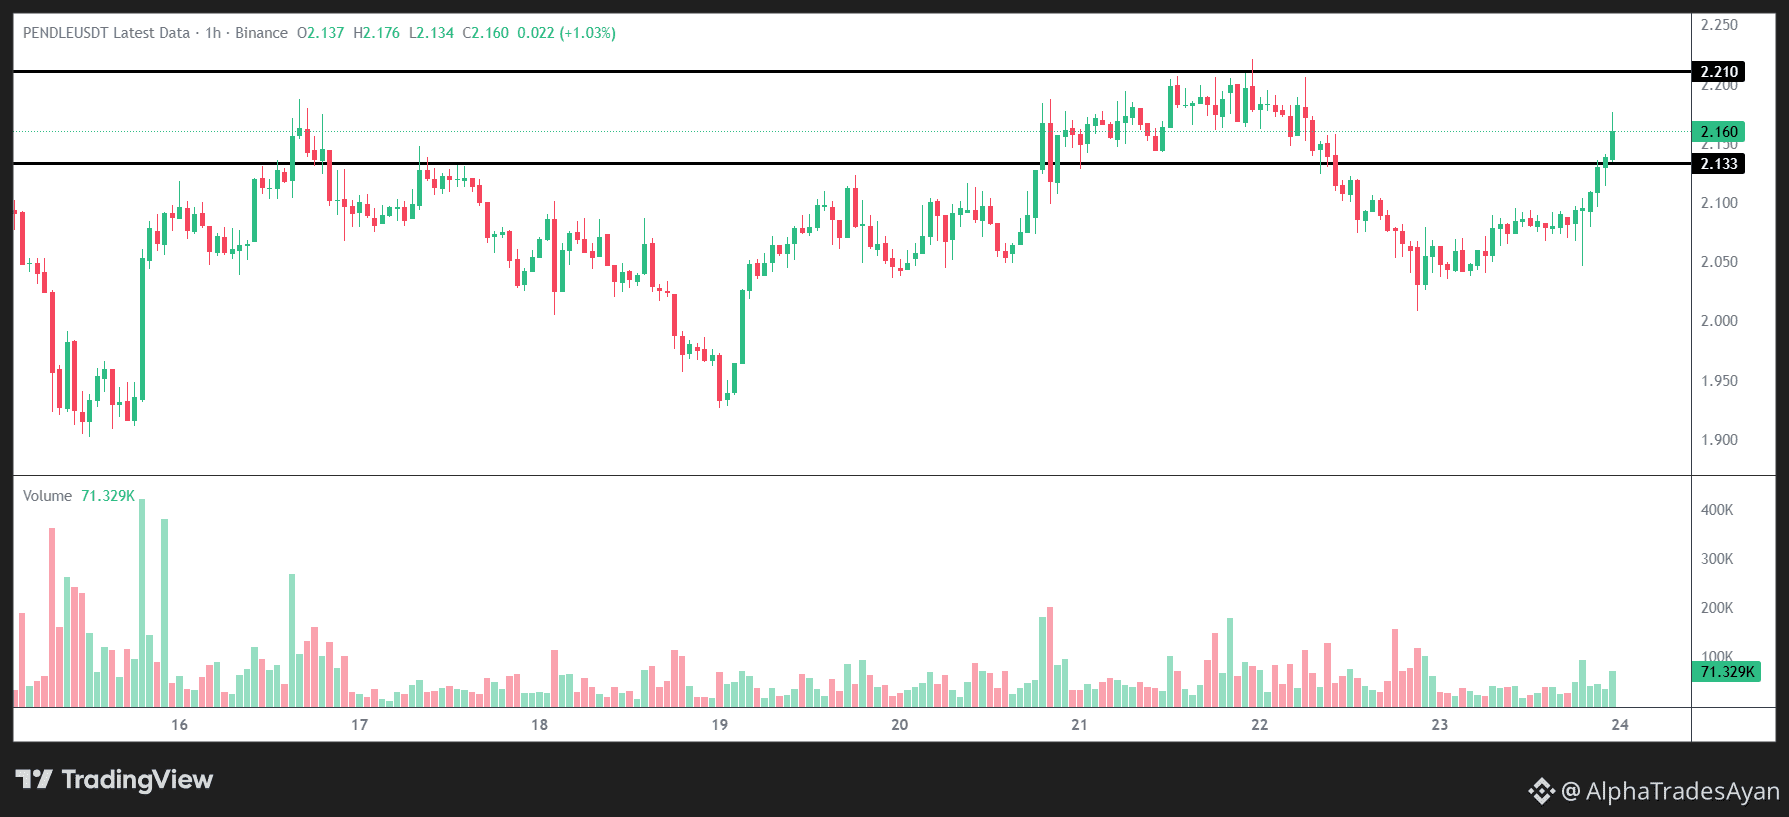
The 1H chart on $PENDLE is looking incredibly clean right now. 👀
Price is currently boxed in, and I am just observing how the volume develops inside this channel. No rushing, just waiting for the market to show its hand.
Key levels on my radar:
🎯 Major Resistance ➔ 2.210
🛡️ Solid Support ➔ 2.133
$PENDLE
{future}(PENDLEUSDT)
Are you guys tracking this $PENDLE range today, or are your eyes on other alt coins? Let me know below! 👇
NFA | DYOR
The 1H chart on $PENDLE is looking incredibly clean right now. 👀
Price is currently boxed in, and I am just observing how the volume develops inside this channel. No rushing, just waiting for the market to show its hand.
Key levels on my radar:
🎯 Major Resistance ➔ 2.210
🛡️ Solid Support ➔ 2.133
$PENDLE
Are you guys tracking this $PENDLE range today, or are your eyes on other alt coins? Let me know below! 👇
NFA | DYOR
Price is currently boxed in, and I am just observing how the volume develops inside this channel. No rushing, just waiting for the market to show its hand.
Key levels on my radar:
🎯 Major Resistance ➔ 2.210
🛡️ Solid Support ➔ 2.133
$PENDLE
Are you guys tracking this $PENDLE range today, or are your eyes on other alt coins? Let me know below! 👇
NFA | DYOR
1
1
173
See translation
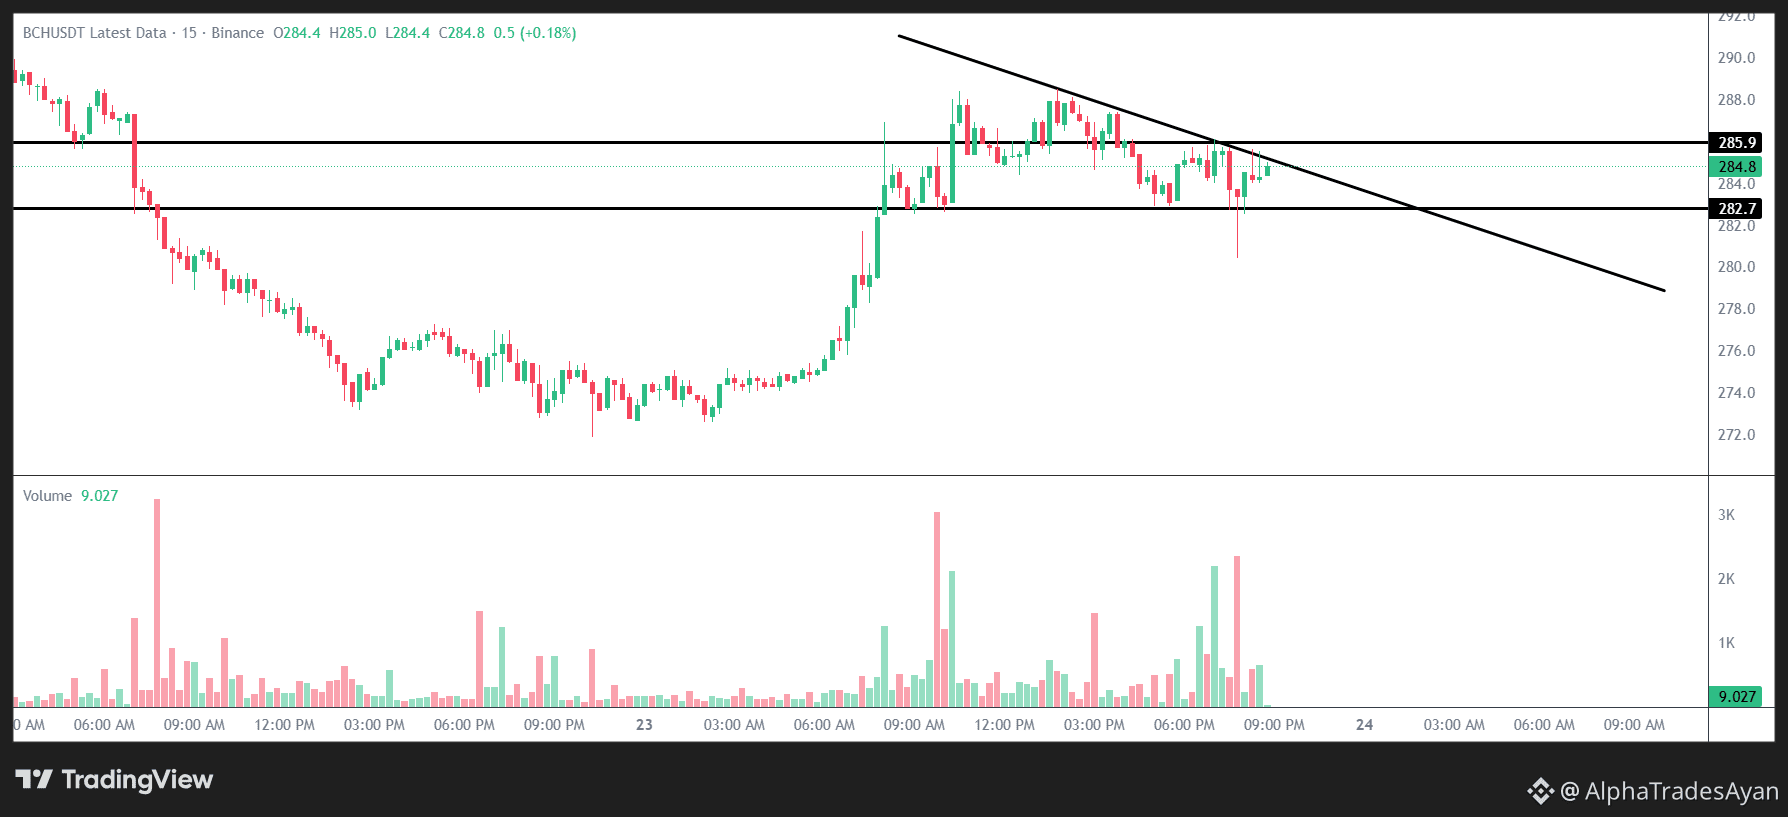
The 15m chart on $BCH is getting incredibly compressed right now. 👀
We are seeing a perfect squeeze between this descending trendline and the 282.7 support base. If momentum picks up, that 285.9 ceiling is the main level that needs to be cleared next.
$BCH
{future}(BCHUSDT)
These tight formations usually lead to a sharp move once a direction is chosen. I’m just setting my alerts and waiting to see which side takes control of this range.
What’s your read on this structure? Are we going to see a breakout above the trend line, or a breakdown below support? Let me know your thoughts! 👇
NFA | DYOR
The 15m chart on $BCH is getting incredibly compressed right now. 👀
We are seeing a perfect squeeze between this descending trendline and the 282.7 support base. If momentum picks up, that 285.9 ceiling is the main level that needs to be cleared next.
$BCH
These tight formations usually lead to a sharp move once a direction is chosen. I’m just setting my alerts and waiting to see which side takes control of this range.
What’s your read on this structure? Are we going to see a breakout above the trend line, or a breakdown below support? Let me know your thoughts! 👇
NFA | DYOR
We are seeing a perfect squeeze between this descending trendline and the 282.7 support base. If momentum picks up, that 285.9 ceiling is the main level that needs to be cleared next.
$BCH
These tight formations usually lead to a sharp move once a direction is chosen. I’m just setting my alerts and waiting to see which side takes control of this range.
What’s your read on this structure? Are we going to see a breakout above the trend line, or a breakdown below support? Let me know your thoughts! 👇
NFA | DYOR
1
1
215
See translation
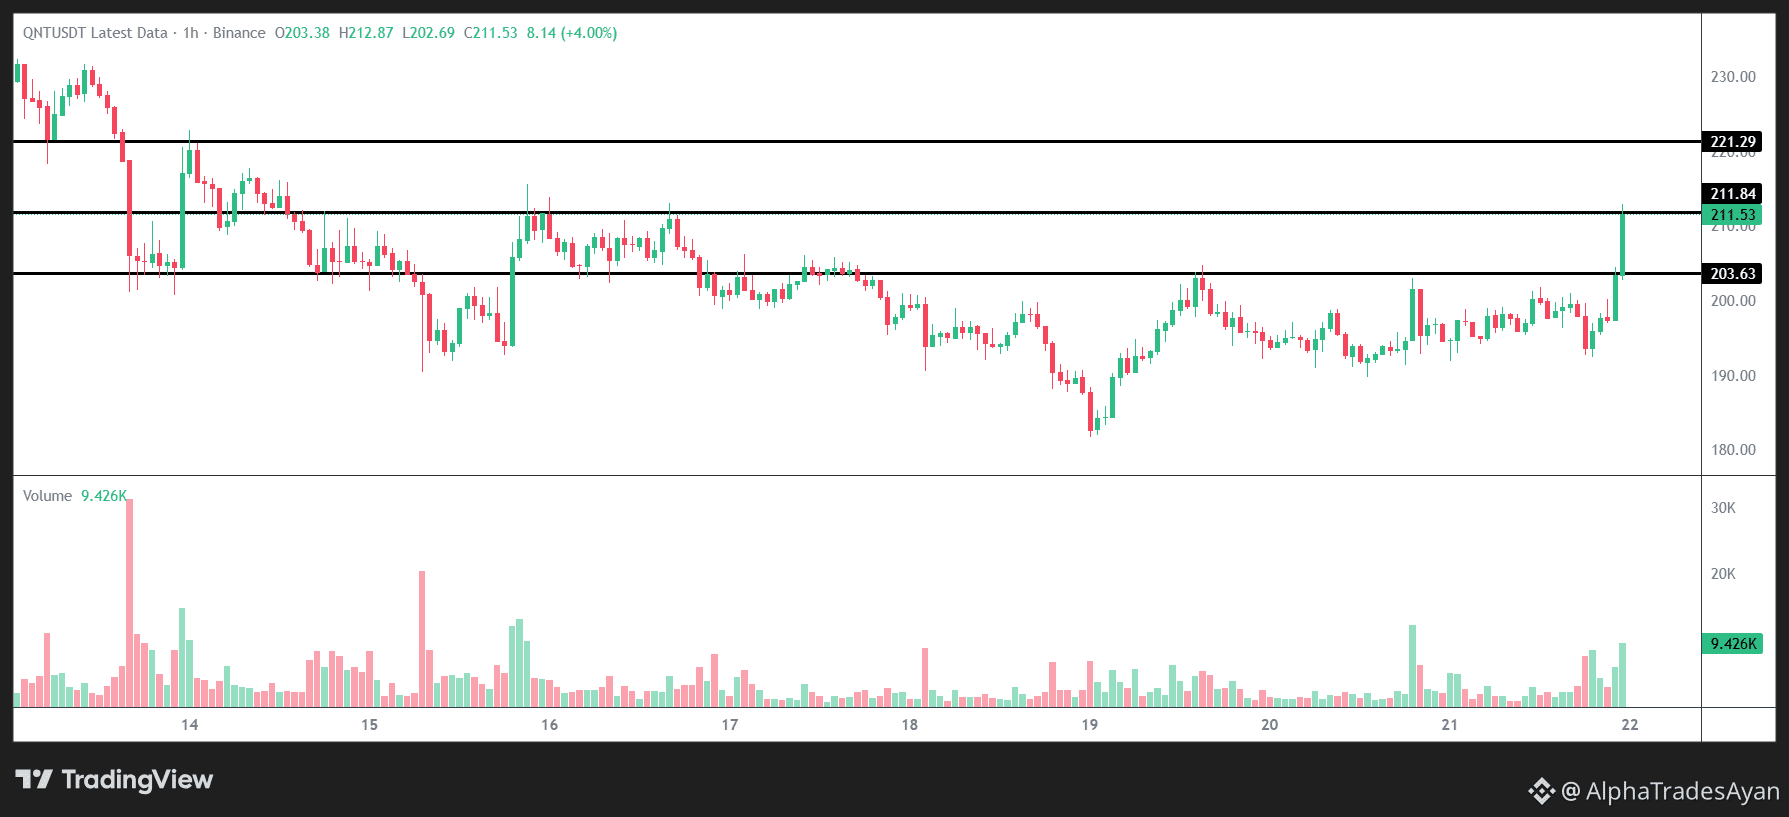
$QNT has been quiet for a while but today’s move is standing out.
Price pushed up strongly and is currently sitting around 211.50. It managed to clear the 203.60 zone cleanly and is now testing the area near 211.80–212.
$QNT
{future}(QNTUSDT)
Volume picked up during this push, which makes the move more noticeable compared to the last few days of sideways action. The next level people will be watching is around 221.
I’m just observing how it holds here. No rush.
NFA | DYOR
$QNT has been quiet for a while but today’s move is standing out.
Price pushed up strongly and is currently sitting around 211.50. It managed to clear the 203.60 zone cleanly and is now testing the area near 211.80–212.
$QNT
Volume picked up during this push, which makes the move more noticeable compared to the last few days of sideways action. The next level people will be watching is around 221.
I’m just observing how it holds here. No rush.
NFA | DYOR
Price pushed up strongly and is currently sitting around 211.50. It managed to clear the 203.60 zone cleanly and is now testing the area near 211.80–212.
$QNT
Volume picked up during this push, which makes the move more noticeable compared to the last few days of sideways action. The next level people will be watching is around 221.
I’m just observing how it holds here. No rush.
NFA | DYOR
1
2
753
See translation
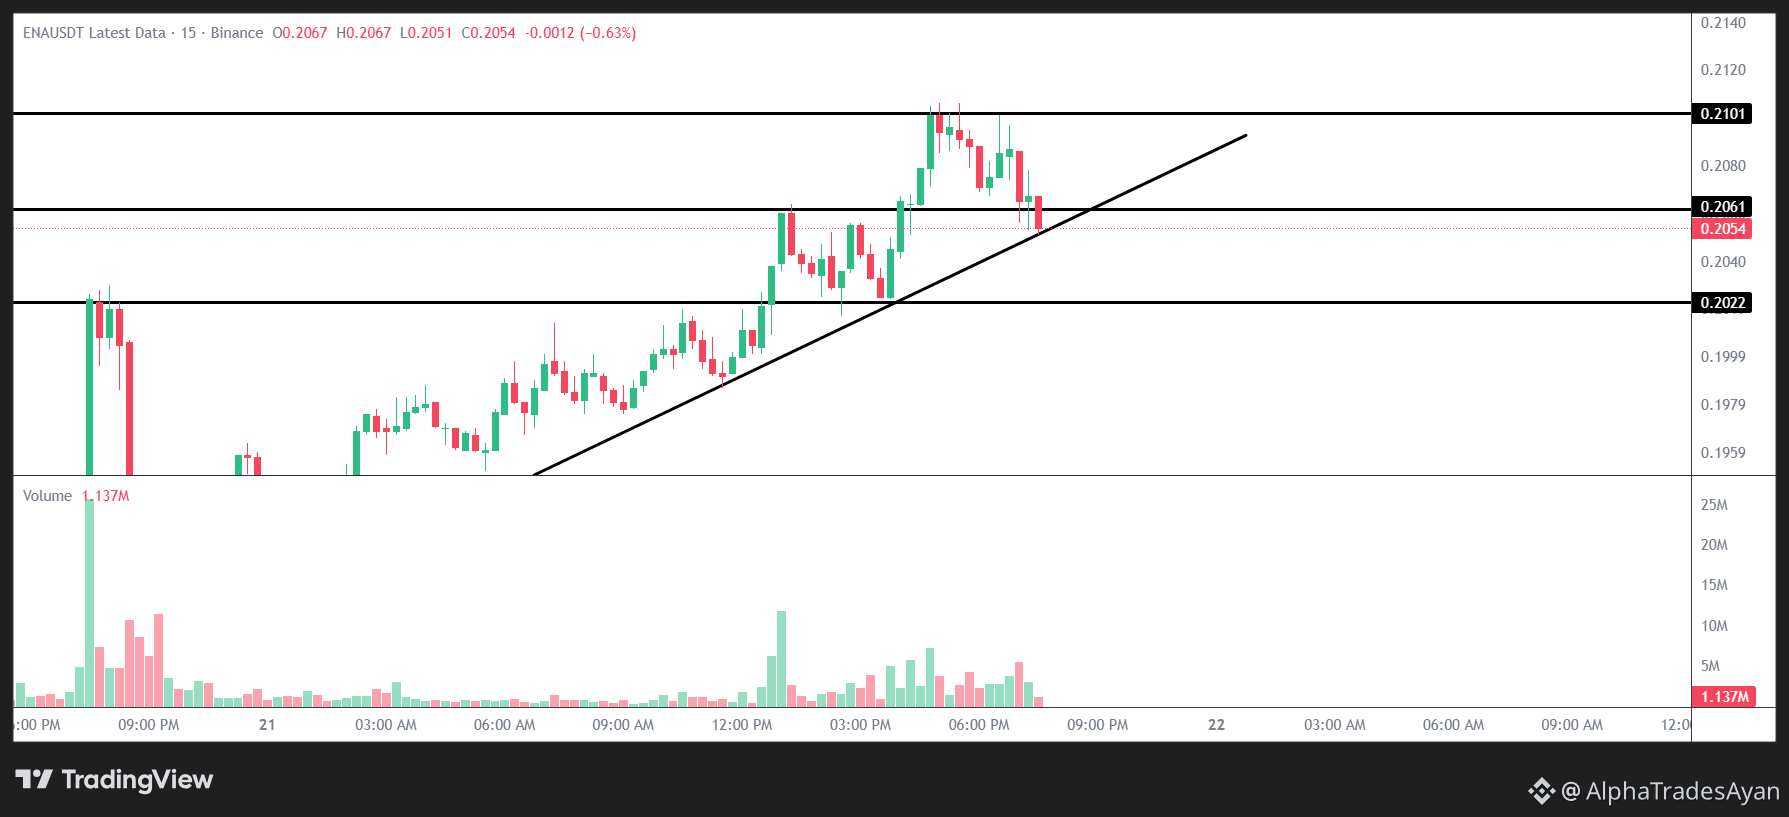
$ENA is pulling back directly into a key trendline test on the 15m chart. 👀
After tapping local highs near 0.2101 earlier today, price action has cooled off toward 0.2054. Right now, it's sitting right on the ascending trendline that has held this entire intraday move together.
The immediate level to reclaim is 0.2061, while 0.2101 remains the upper ceiling. If buyers step up and defend this trendline, the bullish structure stays healthy. But if this line breaks down, the next major demand floor to watch sits around 0.2022.
$ENA
{future}(ENAUSDT)
No reason to jump the gun here. Waiting to see how the current candle closes on the trendline is always the disciplined play.
How are you viewing this ENA retest—bounce from the trendline, or a slide down to 0.2022? Drop your setup below! 👇
NFA | DYOR
$ENA is pulling back directly into a key trendline test on the 15m chart. 👀
After tapping local highs near 0.2101 earlier today, price action has cooled off toward 0.2054. Right now, it's sitting right on the ascending trendline that has held this entire intraday move together.
The immediate level to reclaim is 0.2061, while 0.2101 remains the upper ceiling. If buyers step up and defend this trendline, the bullish structure stays healthy. But if this line breaks down, the next major demand floor to watch sits around 0.2022.
$ENA
No reason to jump the gun here. Waiting to see how the current candle closes on the trendline is always the disciplined play.
How are you viewing this ENA retest—bounce from the trendline, or a slide down to 0.2022? Drop your setup below! 👇
NFA | DYOR
After tapping local highs near 0.2101 earlier today, price action has cooled off toward 0.2054. Right now, it's sitting right on the ascending trendline that has held this entire intraday move together.
The immediate level to reclaim is 0.2061, while 0.2101 remains the upper ceiling. If buyers step up and defend this trendline, the bullish structure stays healthy. But if this line breaks down, the next major demand floor to watch sits around 0.2022.
$ENA
No reason to jump the gun here. Waiting to see how the current candle closes on the trendline is always the disciplined play.
How are you viewing this ENA retest—bounce from the trendline, or a slide down to 0.2022? Drop your setup below! 👇
NFA | DYOR
3
2
347
See translation
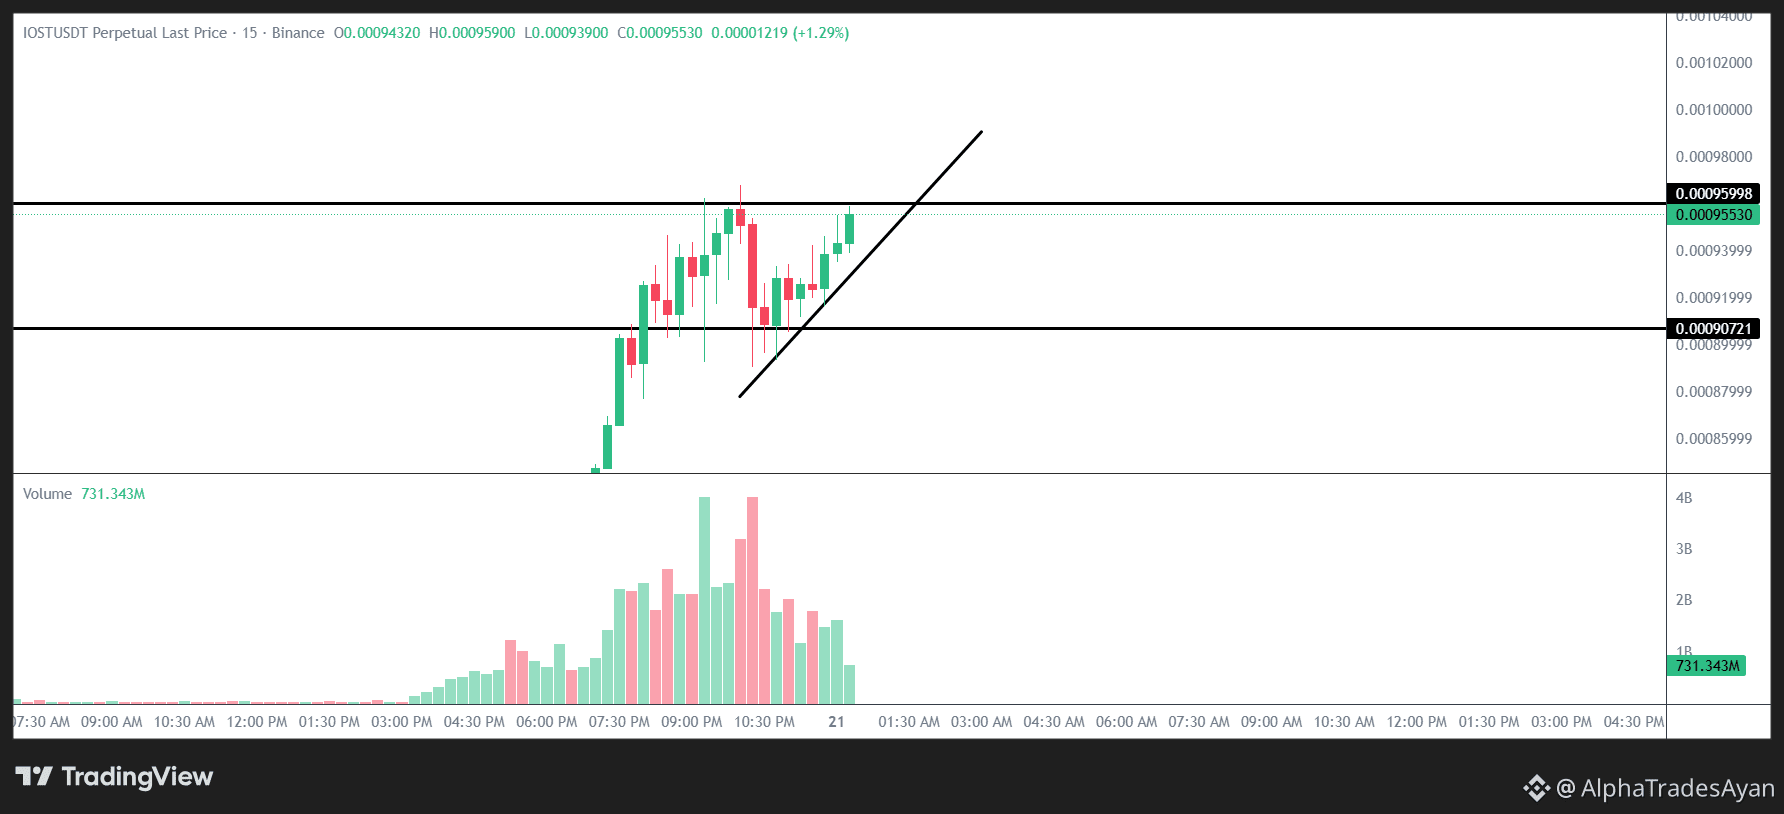
$IOST 15m Setup 📊
Massive 730M+ volume stepping in today. Price is riding a steep trendline and compressing right up against the resistance ceiling.
🎯 Resistance: 0.00095998
🛡️ Base Support: 0.00090721
$IOST
{future}(IOSTUSDT)
Just watching the squeeze here. Waiting for a clear breakout above resistance or a clean retest of the trendline.
NFA | DYOR
$IOST 15m Setup 📊
Massive 730M+ volume stepping in today. Price is riding a steep trendline and compressing right up against the resistance ceiling.
🎯 Resistance: 0.00095998
🛡️ Base Support: 0.00090721
$IOST
Just watching the squeeze here. Waiting for a clear breakout above resistance or a clean retest of the trendline.
NFA | DYOR
Massive 730M+ volume stepping in today. Price is riding a steep trendline and compressing right up against the resistance ceiling.
🎯 Resistance: 0.00095998
🛡️ Base Support: 0.00090721
$IOST
Just watching the squeeze here. Waiting for a clear breakout above resistance or a clean retest of the trendline.
NFA | DYOR
1
1
264
Log in to explore more content
Join global crypto users on Binance Square
⚡️ Get latest and useful information about crypto.
💬 Trusted by the world’s largest crypto exchange.
👍 Discover real insights from verified creators.
Email / Phone number
Trending Topics
BinanceProcesses$4.65BWithdrawals
45,252 views
183 Discussing
Binance Processes $4.65 Billion in Withdrawals After Reopening, Net Outflow of $3.64 Billion Equals 2.1% of Its $171 Billion in Assets
Binance News
·52 Likes
·17.6k views
WithdrawalsBack: 15 networks live
10,195 views
151 Discussing
BitcoinSpotETFsPost$203MWeeklyOutflow
1 views
3 Discussing