

AllInWeb3
1.1k Posts

AllInWeb3
Report
Block User
Open Trade

BNB Holder
High-Frequency Trader
5.5 Years
61 Following
133 Followers
419 Liked
Posts
Portfolio
All
Quotes
·
--
$W In that 13:00 post, I was cautious, because trading volume had increased while the price fell back to a key level. The hour that just ended gave us a new answer: the price reclaimed 0.017580. I’m still inclined to wait and see; whether it can hold after the spike is what’s more worth watching now.
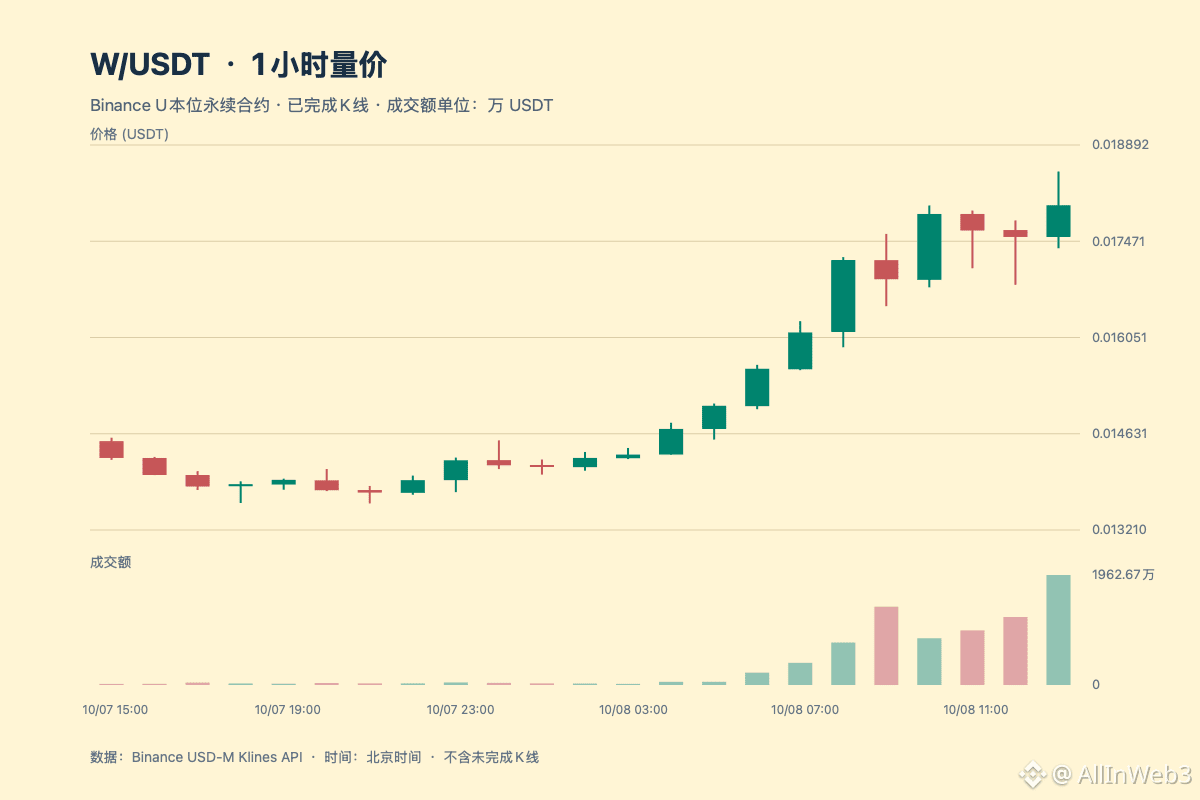
At 14:07 Beijing time on October 8, WUSDT perpetual was quoted at 0.017968, up 23.432% over 24 hours. That’s a striking gain, but I’m more concerned with the newly completed 13:00–14:00 hourly candle. The rolling 24-hour change can’t stand in for what’s happening right now.
This hour closed at 0.018003, up 2.67%, with turnover of about 19.63 million USDT, 61.8% higher than from 12:00 to 13:00. The previous hour saw a high-volume decline; this one turned into a high-volume rise. At least that shows this round of trading did push the closing price higher. The “hourly close back above 0.017580” that I was waiting for in my previous post has now happened—that’s grounds to adjust my view.
But it’s still too early to confidently say that the price has broken out and held above resistance. The intrahour high was 0.018500, but the price closed back at 0.018003, leaving an upper wick. The close above 0.018000 was only marginally higher; we can’t focus only on the new high and ignore the pullback after the spike. Higher turnover is a fact, but the next move still needs to show whether selling pressure has been absorbed.
Open interest is also growing faster than the price. From 13:00 to 14:00, the number of open contracts rose from 622.4 million W to 670.5 million W, an increase of 7.73%. More positions stayed in the market as the price rose, which could make the next battle over key levels more intense. OI here is the outstanding amount of contracts; it shouldn’t be treated as net inflows, and it doesn’t tell us which side has the advantage among the new positions. If open interest keeps rising but the price can’t move higher, the case for chasing the rally weakens.
There’s no new 4-hour closing confirmation yet: the latest completed candle is still the one from 08:00 to 12:00, up 9.28%; the 12:00–16:00 candle is still in progress. The hourly chart has improved, but we can’t call it a 4-hour breakout before it closes. The funding rate settled at 12:00 was +0.001464%, but that doesn’t tell us what the next settlement will be. This figure alone isn’t enough to explain a short squeeze.
I’ll first watch to see whether there’s support if the price pulls back toward 0.018000, then see whether trading above 0.018500 can continue. If an hourly close puts the price back below 0.017580, this reclaim will need to be reassessed. If it also breaks below the 13:00–14:00 low of 0.017368, the short-term recovery will look weaker. A price spike, lively trading, and rising open interest can all happen at once; in the end, what matters is whether the closing price can keep moving higher.
I checked the Wormhole website directory this time and couldn’t verify any new announcement that coincided with this hour. The old W2.0 news can’t be treated as an immediate catalyst for today’s rise, and the risk of token supply being released doesn’t disappear just because the price has gone up. I’ll keep watching the price and volume, and wait for further confirmation. Data from Binance WUSDT perpetual; the chart uses only completed hourly candles. This is market commentary, not a recommendation to buy or sell.
$W In that 13:00 post, I was cautious, because trading volume had increased while the price fell back to a key level. The hour that just ended gave us a new answer: the price reclaimed 0.017580. I’m still inclined to wait and see; whether it can hold after the spike is what’s more worth watching now.
At 14:07 Beijing time on October 8, WUSDT perpetual was quoted at 0.017968, up 23.432% over 24 hours. That’s a striking gain, but I’m more concerned with the newly completed 13:00–14:00 hourly candle. The rolling 24-hour change can’t stand in for what’s happening right now.
This hour closed at 0.018003, up 2.67%, with turnover of about 19.63 million USDT, 61.8% higher than from 12:00 to 13:00. The previous hour saw a high-volume decline; this one turned into a high-volume rise. At least that shows this round of trading did push the closing price higher. The “hourly close back above 0.017580” that I was waiting for in my previous post has now happened—that’s grounds to adjust my view.
But it’s still too early to confidently say that the price has broken out and held above resistance. The intrahour high was 0.018500, but the price closed back at 0.018003, leaving an upper wick. The close above 0.018000 was only marginally higher; we can’t focus only on the new high and ignore the pullback after the spike. Higher turnover is a fact, but the next move still needs to show whether selling pressure has been absorbed.
Open interest is also growing faster than the price. From 13:00 to 14:00, the number of open contracts rose from 622.4 million W to 670.5 million W, an increase of 7.73%. More positions stayed in the market as the price rose, which could make the next battle over key levels more intense. OI here is the outstanding amount of contracts; it shouldn’t be treated as net inflows, and it doesn’t tell us which side has the advantage among the new positions. If open interest keeps rising but the price can’t move higher, the case for chasing the rally weakens.
There’s no new 4-hour closing confirmation yet: the latest completed candle is still the one from 08:00 to 12:00, up 9.28%; the 12:00–16:00 candle is still in progress. The hourly chart has improved, but we can’t call it a 4-hour breakout before it closes. The funding rate settled at 12:00 was +0.001464%, but that doesn’t tell us what the next settlement will be. This figure alone isn’t enough to explain a short squeeze.
I’ll first watch to see whether there’s support if the price pulls back toward 0.018000, then see whether trading above 0.018500 can continue. If an hourly close puts the price back below 0.017580, this reclaim will need to be reassessed. If it also breaks below the 13:00–14:00 low of 0.017368, the short-term recovery will look weaker. A price spike, lively trading, and rising open interest can all happen at once; in the end, what matters is whether the closing price can keep moving higher.
I checked the Wormhole website directory this time and couldn’t verify any new announcement that coincided with this hour. The old W2.0 news can’t be treated as an immediate catalyst for today’s rise, and the risk of token supply being released doesn’t disappear just because the price has gone up. I’ll keep watching the price and volume, and wait for further confirmation. Data from Binance WUSDT perpetual; the chart uses only completed hourly candles. This is market commentary, not a recommendation to buy or sell.
At 14:07 Beijing time on October 8, WUSDT perpetual was quoted at 0.017968, up 23.432% over 24 hours. That’s a striking gain, but I’m more concerned with the newly completed 13:00–14:00 hourly candle. The rolling 24-hour change can’t stand in for what’s happening right now.
This hour closed at 0.018003, up 2.67%, with turnover of about 19.63 million USDT, 61.8% higher than from 12:00 to 13:00. The previous hour saw a high-volume decline; this one turned into a high-volume rise. At least that shows this round of trading did push the closing price higher. The “hourly close back above 0.017580” that I was waiting for in my previous post has now happened—that’s grounds to adjust my view.
But it’s still too early to confidently say that the price has broken out and held above resistance. The intrahour high was 0.018500, but the price closed back at 0.018003, leaving an upper wick. The close above 0.018000 was only marginally higher; we can’t focus only on the new high and ignore the pullback after the spike. Higher turnover is a fact, but the next move still needs to show whether selling pressure has been absorbed.
Open interest is also growing faster than the price. From 13:00 to 14:00, the number of open contracts rose from 622.4 million W to 670.5 million W, an increase of 7.73%. More positions stayed in the market as the price rose, which could make the next battle over key levels more intense. OI here is the outstanding amount of contracts; it shouldn’t be treated as net inflows, and it doesn’t tell us which side has the advantage among the new positions. If open interest keeps rising but the price can’t move higher, the case for chasing the rally weakens.
There’s no new 4-hour closing confirmation yet: the latest completed candle is still the one from 08:00 to 12:00, up 9.28%; the 12:00–16:00 candle is still in progress. The hourly chart has improved, but we can’t call it a 4-hour breakout before it closes. The funding rate settled at 12:00 was +0.001464%, but that doesn’t tell us what the next settlement will be. This figure alone isn’t enough to explain a short squeeze.
I’ll first watch to see whether there’s support if the price pulls back toward 0.018000, then see whether trading above 0.018500 can continue. If an hourly close puts the price back below 0.017580, this reclaim will need to be reassessed. If it also breaks below the 13:00–14:00 low of 0.017368, the short-term recovery will look weaker. A price spike, lively trading, and rising open interest can all happen at once; in the end, what matters is whether the closing price can keep moving higher.
I checked the Wormhole website directory this time and couldn’t verify any new announcement that coincided with this hour. The old W2.0 news can’t be treated as an immediate catalyst for today’s rise, and the risk of token supply being released doesn’t disappear just because the price has gone up. I’ll keep watching the price and volume, and wait for further confirmation. Data from Binance WUSDT perpetual; the chart uses only completed hourly candles. This is market commentary, not a recommendation to buy or sell.
50
·
--
$BTC During the midday dip, what matters more to me is this: trading volume increased, but the price continued to fall. A brief intraday bounce is not enough to rush to say the correction is over.
The article I published overnight looked at the rebound between 23:00 and 24:00: the price recovered from around 83010 to 83454, but trading volume was lower than in the previous two hours. Today’s new development came in two complete hourly candles around midday, so this is no longer simply a continuation of that low-volume rebound.
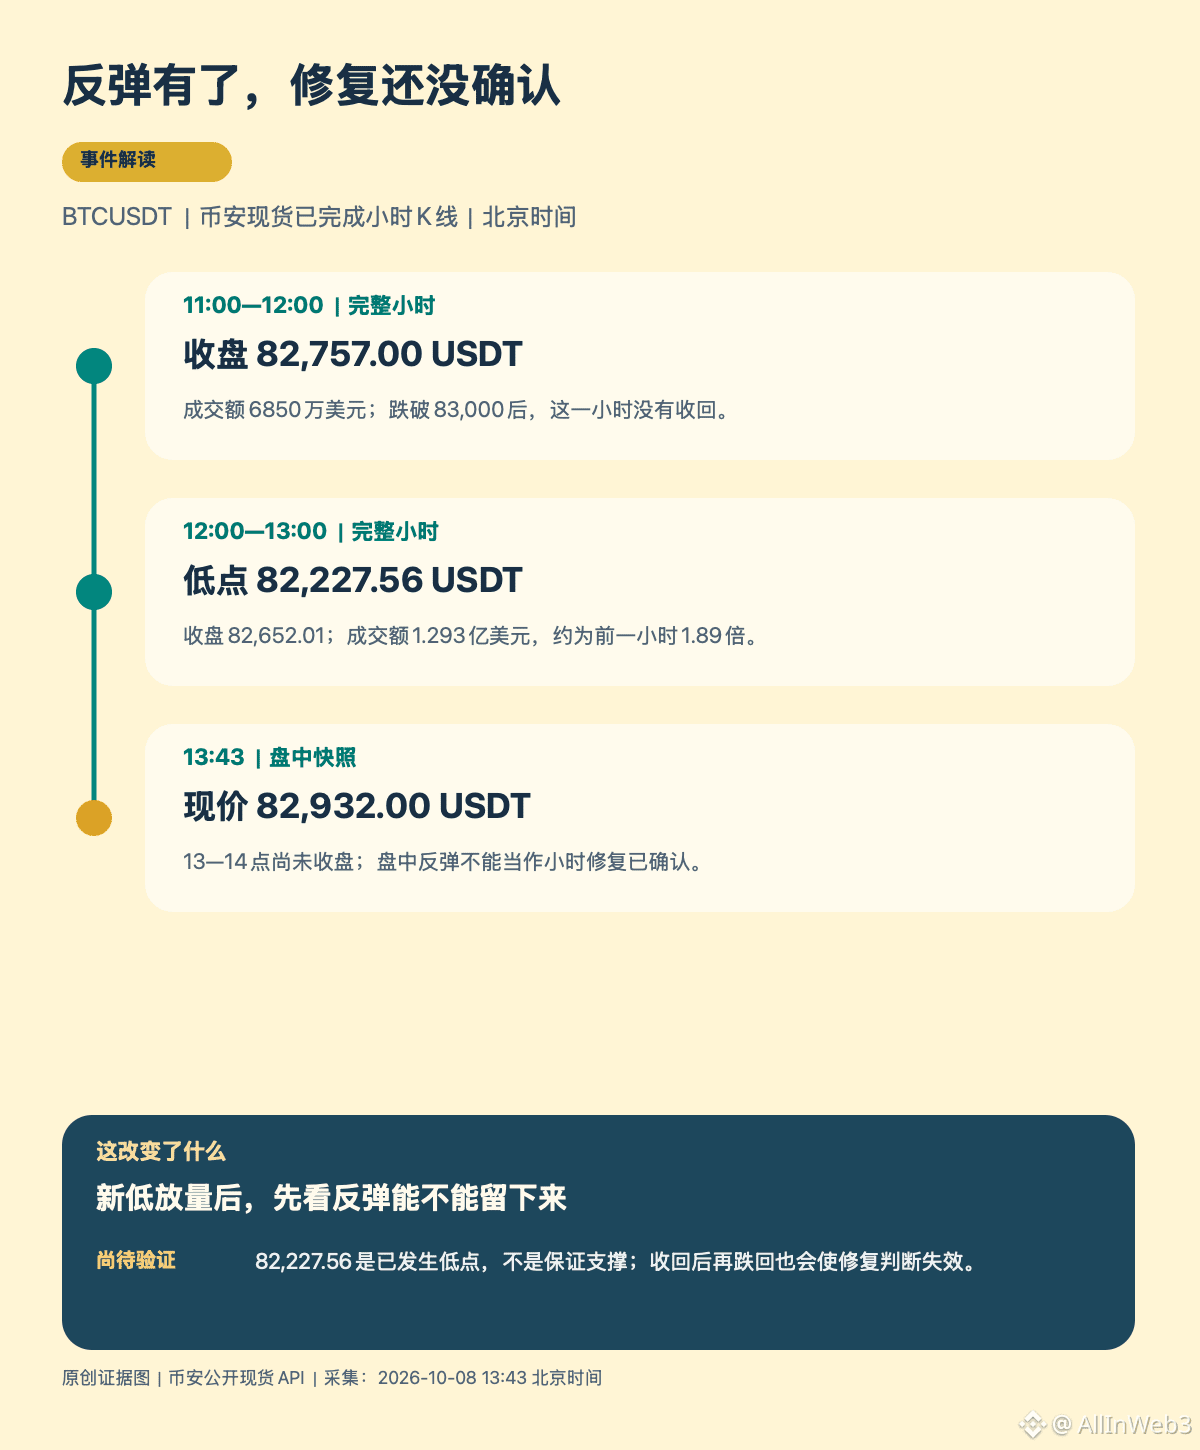
Binance spot market data shows that the 11:00–12:00 candle closed at 82757, with trading volume of about 68.5 million USDT. The 12:00–13:00 candle closed lower at 82652.01, hit a low of 82227.56, and saw trading volume of about 129.3 million USDT—1.89 times that of the previous hour. The price closed lower while trading volume clearly increased over a window of the same length. This is the change that most needs our attention right now. It shows that the decline came with more active trading, but trading volume alone cannot tell us who was selling, nor does it justify calling this “whale accumulation.”
At 13:43, the quoted price was 82932, with a rolling 24-hour decline of about 1.54%. A bounce from around 82227 is certainly better than continuing to hover near the low, but the 13:00–14:00 candle has not closed yet. Briefly reclaiming a price intraday is not the same as holding above it for a full hour. The chart deliberately separates completed candles from the real-time snapshot, so that a rebound still in progress isn’t mistaken for a confirmed signal.
My watchlist from here is simple: first, see whether the price can reclaim the 12:00–13:00 high of 82935.66; then see whether it can hold that reclaimed level on a pullback. If subsequent full hourly candles also close above it, without a marked drop in trading volume over an equally long period, that would add another piece of evidence for a recovery. Further up, 83200 was the high from 11:00–12:00. Reclaiming that level would further weaken the pattern of consecutive declines around midday. These are reference points from price action that has already occurred. They need to be reassessed as quotes change, and should not be treated as guarantees of execution or a breakout.
The 82227.56 low is also just a level reached in the past. I won’t call it unbreakable support just because it is a precise number. If the rebound falls back below it and a subsequent low is broken on rising volume, the recovery thesis should be withdrawn. Conversely, even if it holds for now, we still need to see higher lows and sustained buying support to confirm the move; a reversal does not automatically follow.
The main point of this update is the shift from the low-volume rebound overnight to a new low on higher volume at midday. 84000 is still above the current price, and the “breakdown” touted in popular headlines has already happened. What’s more useful now is watching whether the rebound can hold, rather than repeatedly reporting the same round-number level. For informational analysis only.
Data: Public Binance BTCUSDT spot market data, collected on October 8 at 13:43 Beijing time.
$BTC During the midday dip, what matters more to me is this: trading volume increased, but the price continued to fall. A brief intraday bounce is not enough to rush to say the correction is over.
The article I published overnight looked at the rebound between 23:00 and 24:00: the price recovered from around 83010 to 83454, but trading volume was lower than in the previous two hours. Today’s new development came in two complete hourly candles around midday, so this is no longer simply a continuation of that low-volume rebound.
Binance spot market data shows that the 11:00–12:00 candle closed at 82757, with trading volume of about 68.5 million USDT. The 12:00–13:00 candle closed lower at 82652.01, hit a low of 82227.56, and saw trading volume of about 129.3 million USDT—1.89 times that of the previous hour. The price closed lower while trading volume clearly increased over a window of the same length. This is the change that most needs our attention right now. It shows that the decline came with more active trading, but trading volume alone cannot tell us who was selling, nor does it justify calling this “whale accumulation.”
At 13:43, the quoted price was 82932, with a rolling 24-hour decline of about 1.54%. A bounce from around 82227 is certainly better than continuing to hover near the low, but the 13:00–14:00 candle has not closed yet. Briefly reclaiming a price intraday is not the same as holding above it for a full hour. The chart deliberately separates completed candles from the real-time snapshot, so that a rebound still in progress isn’t mistaken for a confirmed signal.
My watchlist from here is simple: first, see whether the price can reclaim the 12:00–13:00 high of 82935.66; then see whether it can hold that reclaimed level on a pullback. If subsequent full hourly candles also close above it, without a marked drop in trading volume over an equally long period, that would add another piece of evidence for a recovery. Further up, 83200 was the high from 11:00–12:00. Reclaiming that level would further weaken the pattern of consecutive declines around midday. These are reference points from price action that has already occurred. They need to be reassessed as quotes change, and should not be treated as guarantees of execution or a breakout.
The 82227.56 low is also just a level reached in the past. I won’t call it unbreakable support just because it is a precise number. If the rebound falls back below it and a subsequent low is broken on rising volume, the recovery thesis should be withdrawn. Conversely, even if it holds for now, we still need to see higher lows and sustained buying support to confirm the move; a reversal does not automatically follow.
The main point of this update is the shift from the low-volume rebound overnight to a new low on higher volume at midday. 84000 is still above the current price, and the “breakdown” touted in popular headlines has already happened. What’s more useful now is watching whether the rebound can hold, rather than repeatedly reporting the same round-number level. For informational analysis only.
Data: Public Binance BTCUSDT spot market data, collected on October 8 at 13:43 Beijing time.
The article I published overnight looked at the rebound between 23:00 and 24:00: the price recovered from around 83010 to 83454, but trading volume was lower than in the previous two hours. Today’s new development came in two complete hourly candles around midday, so this is no longer simply a continuation of that low-volume rebound.
Binance spot market data shows that the 11:00–12:00 candle closed at 82757, with trading volume of about 68.5 million USDT. The 12:00–13:00 candle closed lower at 82652.01, hit a low of 82227.56, and saw trading volume of about 129.3 million USDT—1.89 times that of the previous hour. The price closed lower while trading volume clearly increased over a window of the same length. This is the change that most needs our attention right now. It shows that the decline came with more active trading, but trading volume alone cannot tell us who was selling, nor does it justify calling this “whale accumulation.”
At 13:43, the quoted price was 82932, with a rolling 24-hour decline of about 1.54%. A bounce from around 82227 is certainly better than continuing to hover near the low, but the 13:00–14:00 candle has not closed yet. Briefly reclaiming a price intraday is not the same as holding above it for a full hour. The chart deliberately separates completed candles from the real-time snapshot, so that a rebound still in progress isn’t mistaken for a confirmed signal.
My watchlist from here is simple: first, see whether the price can reclaim the 12:00–13:00 high of 82935.66; then see whether it can hold that reclaimed level on a pullback. If subsequent full hourly candles also close above it, without a marked drop in trading volume over an equally long period, that would add another piece of evidence for a recovery. Further up, 83200 was the high from 11:00–12:00. Reclaiming that level would further weaken the pattern of consecutive declines around midday. These are reference points from price action that has already occurred. They need to be reassessed as quotes change, and should not be treated as guarantees of execution or a breakout.
The 82227.56 low is also just a level reached in the past. I won’t call it unbreakable support just because it is a precise number. If the rebound falls back below it and a subsequent low is broken on rising volume, the recovery thesis should be withdrawn. Conversely, even if it holds for now, we still need to see higher lows and sustained buying support to confirm the move; a reversal does not automatically follow.
The main point of this update is the shift from the low-volume rebound overnight to a new low on higher volume at midday. 84000 is still above the current price, and the “breakdown” touted in popular headlines has already happened. What’s more useful now is watching whether the rebound can hold, rather than repeatedly reporting the same round-number level. For informational analysis only.
Data: Public Binance BTCUSDT spot market data, collected on October 8 at 13:43 Beijing time.
1
147
·
--
$SUI Compared with 40.6 million TPS, what matters more to me now is whether Samsung Wallet can become an entry point people actually use.
In my previous article, I examined how throughput tests are measured: transactions happen within a channel and are settled on the mainnet later, so they can’t be treated as the base layer’s capacity to process transactions individually. Today, there’s another development: on October 8, Sui announced a partnership to bring USDC to Samsung Wallet. Performance has been demonstrated; now the question is whether people will keep using it for payments.
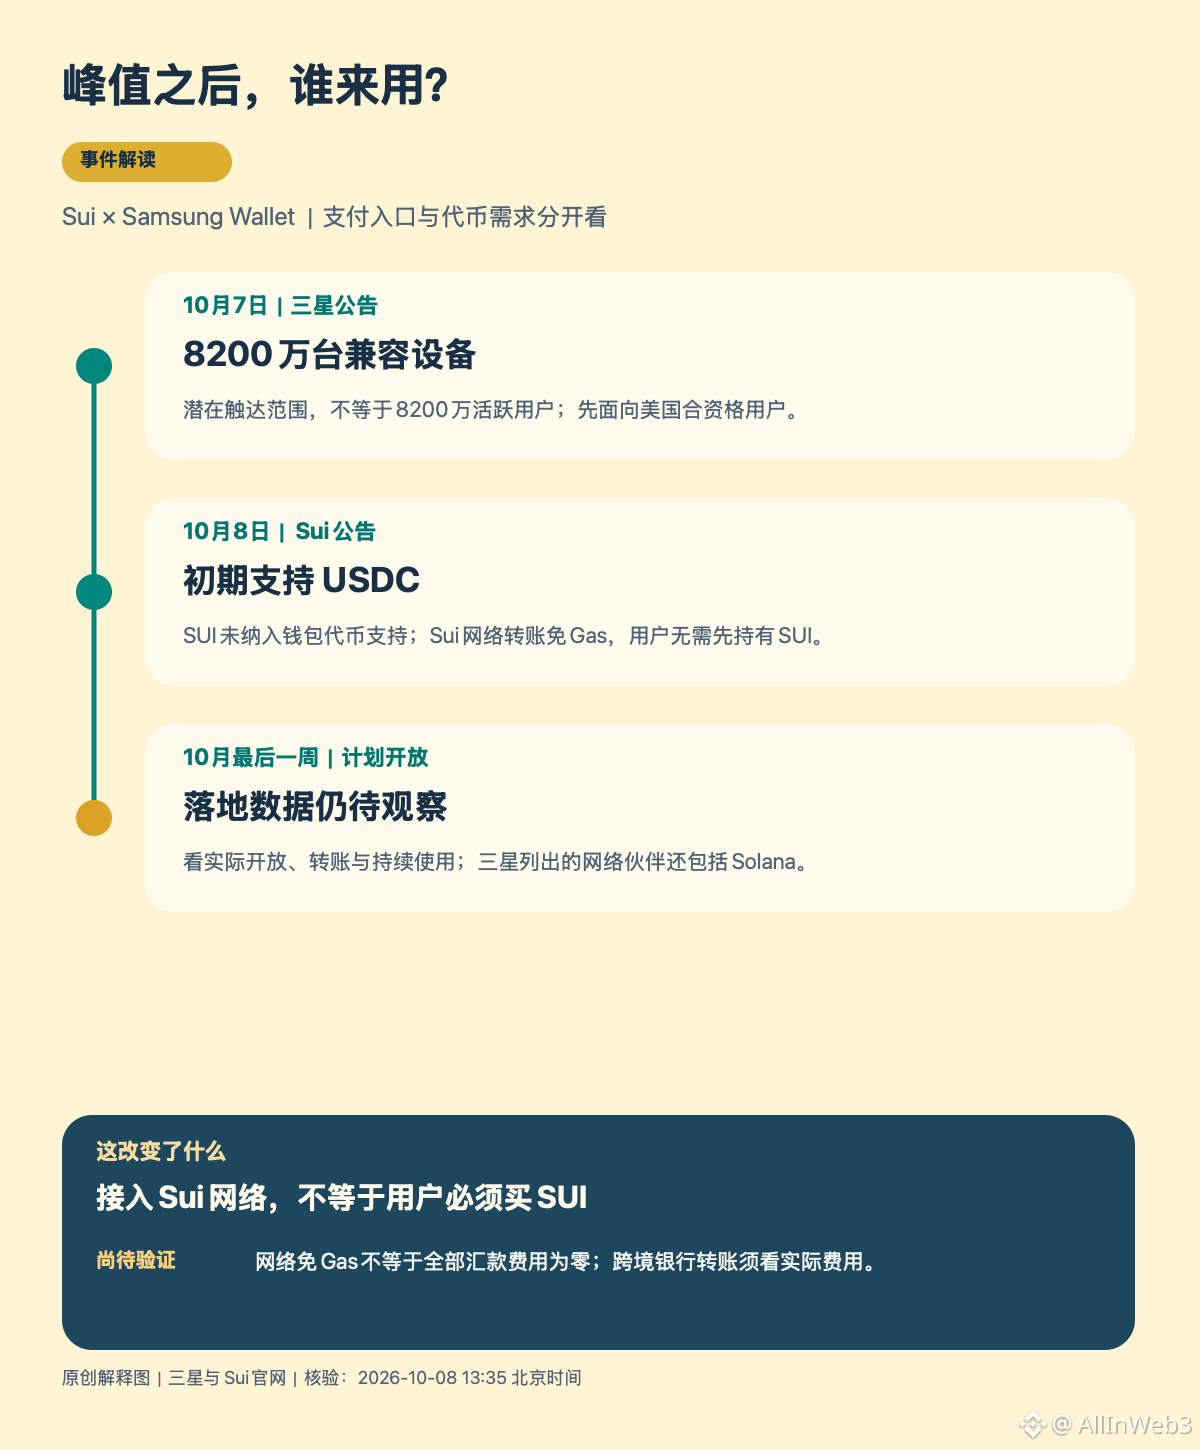
First, let’s get the timeline straight. Samsung’s U.S. website said in its October 7 announcement that it plans to make stablecoin wallet features available to eligible Galaxy users in the U.S. in the last week of October. The 82 million figure refers to the number of compatible devices—not 82 million people who have already opened an account, deposited funds, or made a transfer. Valuing this today as “82 million new on-chain users” skips several steps, in my view.
This entry point is definitely more accessible than asking ordinary users to download a separate wallet and manage their own private keys. Samsung Wallet handles the user-facing experience, Bastion provides the stablecoin custody and payments framework, and Coinbase Prime Vault is involved in asset custody. Greater convenience could lower the barrier to first-time use, but whether people will use it repeatedly depends on the actual transfer experience, fees, and settlement times. Device coverage figures don’t answer those questions.
For SUI holders, the more important question is how demand will flow through. Sui’s announcement explicitly says that USDC will be supported initially, while the SUI token is not yet supported in Samsung Wallet. USDC transfers on Sui are gas-free, so users don’t need to hold SUI first. That can improve the user experience, but it also means the claim that “using the Sui network means users have to buy SUI” doesn’t hold. Whether increased network usage can create sustained token demand requires separate evidence; a partnership headline is no substitute.
There are two other details worth noting. Samsung lists both Solana and Sui among its network partners, so this shouldn’t be described as a Sui-exclusive service. And “free” has limits: Sui is referring to network gas fees, while Samsung Wallet transfers and cross-border bank remittances have different fee structures. Bank routes and third-party charges should be checked against the actual terms; you can’t simply call it “free global remittances.”
My view is that this partnership is more worth following than another test-peak record, but it’s still at the planned-launch stage. Next, I’ll be watching to see whether the feature launches on schedule, how many transfers actually take place, whether users stick around, and how network usage translates into demand for SUI. A bigger entry point is a start; turning it into real usage is the next step. For informational purposes only.
Sources: Samsung U.S. website announcement dated 10/7; Sui website partnership announcement dated 10/8.
$SUI Compared with 40.6 million TPS, what matters more to me now is whether Samsung Wallet can become an entry point people actually use.
In my previous article, I examined how throughput tests are measured: transactions happen within a channel and are settled on the mainnet later, so they can’t be treated as the base layer’s capacity to process transactions individually. Today, there’s another development: on October 8, Sui announced a partnership to bring USDC to Samsung Wallet. Performance has been demonstrated; now the question is whether people will keep using it for payments.
First, let’s get the timeline straight. Samsung’s U.S. website said in its October 7 announcement that it plans to make stablecoin wallet features available to eligible Galaxy users in the U.S. in the last week of October. The 82 million figure refers to the number of compatible devices—not 82 million people who have already opened an account, deposited funds, or made a transfer. Valuing this today as “82 million new on-chain users” skips several steps, in my view.
This entry point is definitely more accessible than asking ordinary users to download a separate wallet and manage their own private keys. Samsung Wallet handles the user-facing experience, Bastion provides the stablecoin custody and payments framework, and Coinbase Prime Vault is involved in asset custody. Greater convenience could lower the barrier to first-time use, but whether people will use it repeatedly depends on the actual transfer experience, fees, and settlement times. Device coverage figures don’t answer those questions.
For SUI holders, the more important question is how demand will flow through. Sui’s announcement explicitly says that USDC will be supported initially, while the SUI token is not yet supported in Samsung Wallet. USDC transfers on Sui are gas-free, so users don’t need to hold SUI first. That can improve the user experience, but it also means the claim that “using the Sui network means users have to buy SUI” doesn’t hold. Whether increased network usage can create sustained token demand requires separate evidence; a partnership headline is no substitute.
There are two other details worth noting. Samsung lists both Solana and Sui among its network partners, so this shouldn’t be described as a Sui-exclusive service. And “free” has limits: Sui is referring to network gas fees, while Samsung Wallet transfers and cross-border bank remittances have different fee structures. Bank routes and third-party charges should be checked against the actual terms; you can’t simply call it “free global remittances.”
My view is that this partnership is more worth following than another test-peak record, but it’s still at the planned-launch stage. Next, I’ll be watching to see whether the feature launches on schedule, how many transfers actually take place, whether users stick around, and how network usage translates into demand for SUI. A bigger entry point is a start; turning it into real usage is the next step. For informational purposes only.
Sources: Samsung U.S. website announcement dated 10/7; Sui website partnership announcement dated 10/8.
In my previous article, I examined how throughput tests are measured: transactions happen within a channel and are settled on the mainnet later, so they can’t be treated as the base layer’s capacity to process transactions individually. Today, there’s another development: on October 8, Sui announced a partnership to bring USDC to Samsung Wallet. Performance has been demonstrated; now the question is whether people will keep using it for payments.
First, let’s get the timeline straight. Samsung’s U.S. website said in its October 7 announcement that it plans to make stablecoin wallet features available to eligible Galaxy users in the U.S. in the last week of October. The 82 million figure refers to the number of compatible devices—not 82 million people who have already opened an account, deposited funds, or made a transfer. Valuing this today as “82 million new on-chain users” skips several steps, in my view.
This entry point is definitely more accessible than asking ordinary users to download a separate wallet and manage their own private keys. Samsung Wallet handles the user-facing experience, Bastion provides the stablecoin custody and payments framework, and Coinbase Prime Vault is involved in asset custody. Greater convenience could lower the barrier to first-time use, but whether people will use it repeatedly depends on the actual transfer experience, fees, and settlement times. Device coverage figures don’t answer those questions.
For SUI holders, the more important question is how demand will flow through. Sui’s announcement explicitly says that USDC will be supported initially, while the SUI token is not yet supported in Samsung Wallet. USDC transfers on Sui are gas-free, so users don’t need to hold SUI first. That can improve the user experience, but it also means the claim that “using the Sui network means users have to buy SUI” doesn’t hold. Whether increased network usage can create sustained token demand requires separate evidence; a partnership headline is no substitute.
There are two other details worth noting. Samsung lists both Solana and Sui among its network partners, so this shouldn’t be described as a Sui-exclusive service. And “free” has limits: Sui is referring to network gas fees, while Samsung Wallet transfers and cross-border bank remittances have different fee structures. Bank routes and third-party charges should be checked against the actual terms; you can’t simply call it “free global remittances.”
My view is that this partnership is more worth following than another test-peak record, but it’s still at the planned-launch stage. Next, I’ll be watching to see whether the feature launches on schedule, how many transfers actually take place, whether users stick around, and how network usage translates into demand for SUI. A bigger entry point is a start; turning it into real usage is the next step. For informational purposes only.
Sources: Samsung U.S. website announcement dated 10/7; Sui website partnership announcement dated 10/8.
1
60
·
--
$W These past two hours have made me more cautious, and I’m now leaning toward waiting on the sidelines. Trading has become increasingly active, but the price hasn’t continued upward. The morning breakout still needs to prove itself again.
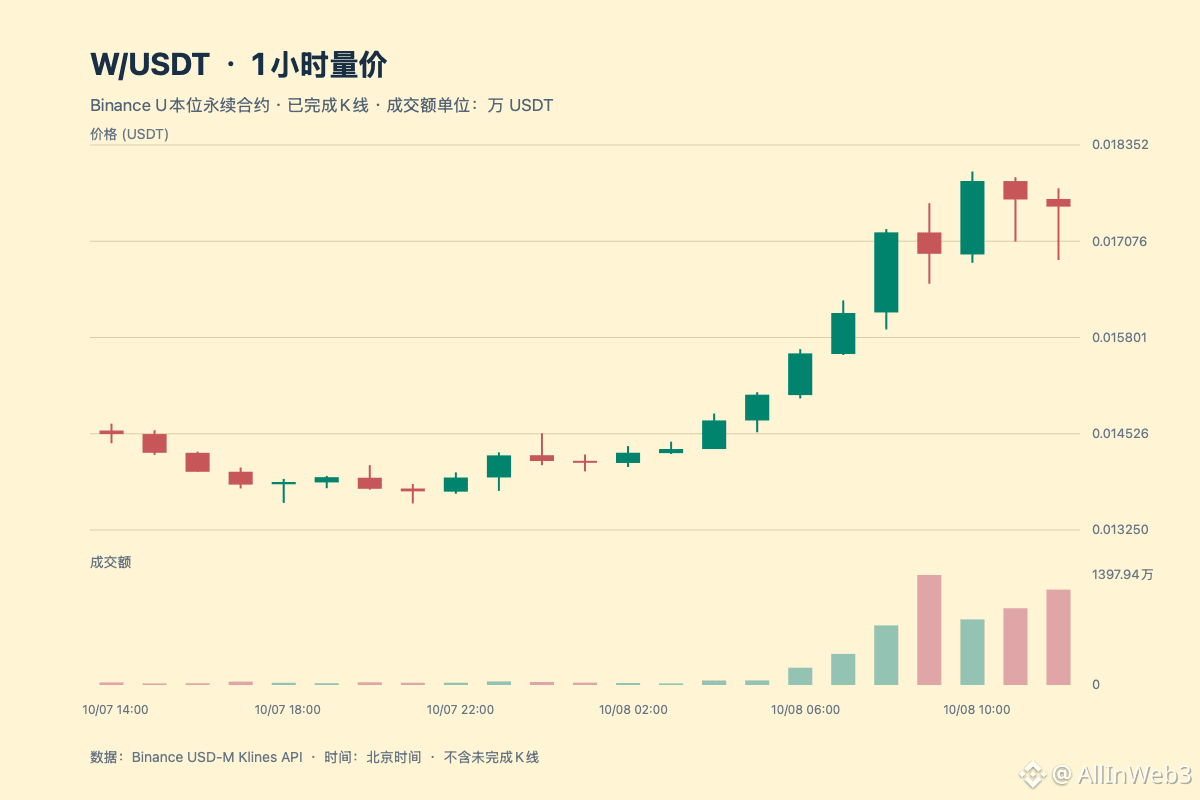
At 13:07 Beijing time on October 8, WUSDT perpetual was trading at 0.017709, up 25.365% over 24 hours. The price has bounced back above 0.017580 intraday, but the 13:00–14:00 hourly candle is not yet complete. We’ll need to wait for the close to confirm whether it can reclaim this key level.
In my 11:00 post, I said 0.017580 was a level that needed to hold. The two additional completed hourly candles show a change: the 11:00–12:00 candle closed at 0.017630, barely holding above it; the 12:00–13:00 candle closed at 0.017535, falling back below. The price also failed to set a new high above 0.018000. This change is worth noting on its own. The 24-hour gain is still substantial, but that doesn’t justify sticking with the morning’s bullish assessment.
Contract trading volume from 12:00 to 13:00 was about 12.13 million USDT, up 24.35% from the previous hour, while the price fell 0.58%. Higher volume alongside a lower close shows that trading during this hour did not push the price meaningfully higher. Sellers may have absorbed the rebound, or two-way turnover may simply have picked up; volume alone doesn’t tell us which. There isn’t enough evidence to call it “whale accumulation.”
Open interest is also still rising. From 11:00 to 13:00, the number of open contracts increased from 586.5 million W to 622.4 million W, a gain of 6.13%. If new positions are being added as the price pulls back, a break below the lows could bring more volatility. But OI is the outstanding stock of contracts; it should not be treated as net capital inflow, much less as proof that all the new positions are longs. The funding rate settled at 12:00 was +0.001464%, lower than the +0.005% reading at 08:00. There’s also no evidence at this point to explain the move as an extreme short squeeze.
On the 4-hour chart, the 08:00–12:00 candle was still up 9.28%, with 39.65 million USDT in trading volume—about 5.44 times that of the previous candle—showing that the morning’s rally was backed by significant trading activity. However, that 4-hour candle closed at 12:00 and does not include the 12:00–13:00 pullback. The broader trend can be up even as the latest hourly action weakens. Relying on the former to dismiss the latter risks overlooking a change in momentum.
W is Wormhole’s governance and staking asset. W2.0, announced on the official website, is background from 2025 and cannot explain today’s sudden increase in volume. Some allocation categories shifting to biweekly releases also doesn’t mean there will be no supply pressure going forward. I haven’t verified any new catalyst coinciding with this rally, so I’d rather first see whether trading activity can push the price higher.
For now, I’ll watch whether the hourly close can reclaim 0.017580, then whether trading activity around 0.018000 is sustained. If the 12:00–13:00 low of 0.016828 breaks again, this pullback will need to be reassessed. If open interest keeps rising while rebounds continue to fail, the case for chasing the rally and staying bullish will weaken further. Let the price confirm it for itself. Data is from Binance WUSDT perpetual; hourly and 4-hour figures use completed candles. This is market commentary, not investment advice.
$W These past two hours have made me more cautious, and I’m now leaning toward waiting on the sidelines. Trading has become increasingly active, but the price hasn’t continued upward. The morning breakout still needs to prove itself again.
At 13:07 Beijing time on October 8, WUSDT perpetual was trading at 0.017709, up 25.365% over 24 hours. The price has bounced back above 0.017580 intraday, but the 13:00–14:00 hourly candle is not yet complete. We’ll need to wait for the close to confirm whether it can reclaim this key level.
In my 11:00 post, I said 0.017580 was a level that needed to hold. The two additional completed hourly candles show a change: the 11:00–12:00 candle closed at 0.017630, barely holding above it; the 12:00–13:00 candle closed at 0.017535, falling back below. The price also failed to set a new high above 0.018000. This change is worth noting on its own. The 24-hour gain is still substantial, but that doesn’t justify sticking with the morning’s bullish assessment.
Contract trading volume from 12:00 to 13:00 was about 12.13 million USDT, up 24.35% from the previous hour, while the price fell 0.58%. Higher volume alongside a lower close shows that trading during this hour did not push the price meaningfully higher. Sellers may have absorbed the rebound, or two-way turnover may simply have picked up; volume alone doesn’t tell us which. There isn’t enough evidence to call it “whale accumulation.”
Open interest is also still rising. From 11:00 to 13:00, the number of open contracts increased from 586.5 million W to 622.4 million W, a gain of 6.13%. If new positions are being added as the price pulls back, a break below the lows could bring more volatility. But OI is the outstanding stock of contracts; it should not be treated as net capital inflow, much less as proof that all the new positions are longs. The funding rate settled at 12:00 was +0.001464%, lower than the +0.005% reading at 08:00. There’s also no evidence at this point to explain the move as an extreme short squeeze.
On the 4-hour chart, the 08:00–12:00 candle was still up 9.28%, with 39.65 million USDT in trading volume—about 5.44 times that of the previous candle—showing that the morning’s rally was backed by significant trading activity. However, that 4-hour candle closed at 12:00 and does not include the 12:00–13:00 pullback. The broader trend can be up even as the latest hourly action weakens. Relying on the former to dismiss the latter risks overlooking a change in momentum.
W is Wormhole’s governance and staking asset. W2.0, announced on the official website, is background from 2025 and cannot explain today’s sudden increase in volume. Some allocation categories shifting to biweekly releases also doesn’t mean there will be no supply pressure going forward. I haven’t verified any new catalyst coinciding with this rally, so I’d rather first see whether trading activity can push the price higher.
For now, I’ll watch whether the hourly close can reclaim 0.017580, then whether trading activity around 0.018000 is sustained. If the 12:00–13:00 low of 0.016828 breaks again, this pullback will need to be reassessed. If open interest keeps rising while rebounds continue to fail, the case for chasing the rally and staying bullish will weaken further. Let the price confirm it for itself. Data is from Binance WUSDT perpetual; hourly and 4-hour figures use completed candles. This is market commentary, not investment advice.
At 13:07 Beijing time on October 8, WUSDT perpetual was trading at 0.017709, up 25.365% over 24 hours. The price has bounced back above 0.017580 intraday, but the 13:00–14:00 hourly candle is not yet complete. We’ll need to wait for the close to confirm whether it can reclaim this key level.
In my 11:00 post, I said 0.017580 was a level that needed to hold. The two additional completed hourly candles show a change: the 11:00–12:00 candle closed at 0.017630, barely holding above it; the 12:00–13:00 candle closed at 0.017535, falling back below. The price also failed to set a new high above 0.018000. This change is worth noting on its own. The 24-hour gain is still substantial, but that doesn’t justify sticking with the morning’s bullish assessment.
Contract trading volume from 12:00 to 13:00 was about 12.13 million USDT, up 24.35% from the previous hour, while the price fell 0.58%. Higher volume alongside a lower close shows that trading during this hour did not push the price meaningfully higher. Sellers may have absorbed the rebound, or two-way turnover may simply have picked up; volume alone doesn’t tell us which. There isn’t enough evidence to call it “whale accumulation.”
Open interest is also still rising. From 11:00 to 13:00, the number of open contracts increased from 586.5 million W to 622.4 million W, a gain of 6.13%. If new positions are being added as the price pulls back, a break below the lows could bring more volatility. But OI is the outstanding stock of contracts; it should not be treated as net capital inflow, much less as proof that all the new positions are longs. The funding rate settled at 12:00 was +0.001464%, lower than the +0.005% reading at 08:00. There’s also no evidence at this point to explain the move as an extreme short squeeze.
On the 4-hour chart, the 08:00–12:00 candle was still up 9.28%, with 39.65 million USDT in trading volume—about 5.44 times that of the previous candle—showing that the morning’s rally was backed by significant trading activity. However, that 4-hour candle closed at 12:00 and does not include the 12:00–13:00 pullback. The broader trend can be up even as the latest hourly action weakens. Relying on the former to dismiss the latter risks overlooking a change in momentum.
W is Wormhole’s governance and staking asset. W2.0, announced on the official website, is background from 2025 and cannot explain today’s sudden increase in volume. Some allocation categories shifting to biweekly releases also doesn’t mean there will be no supply pressure going forward. I haven’t verified any new catalyst coinciding with this rally, so I’d rather first see whether trading activity can push the price higher.
For now, I’ll watch whether the hourly close can reclaim 0.017580, then whether trading activity around 0.018000 is sustained. If the 12:00–13:00 low of 0.016828 breaks again, this pullback will need to be reassessed. If open interest keeps rising while rebounds continue to fail, the case for chasing the rally and staying bullish will weaken further. Let the price confirm it for itself. Data is from Binance WUSDT perpetual; hourly and 4-hour figures use completed candles. This is market commentary, not investment advice.
1
171
·
--
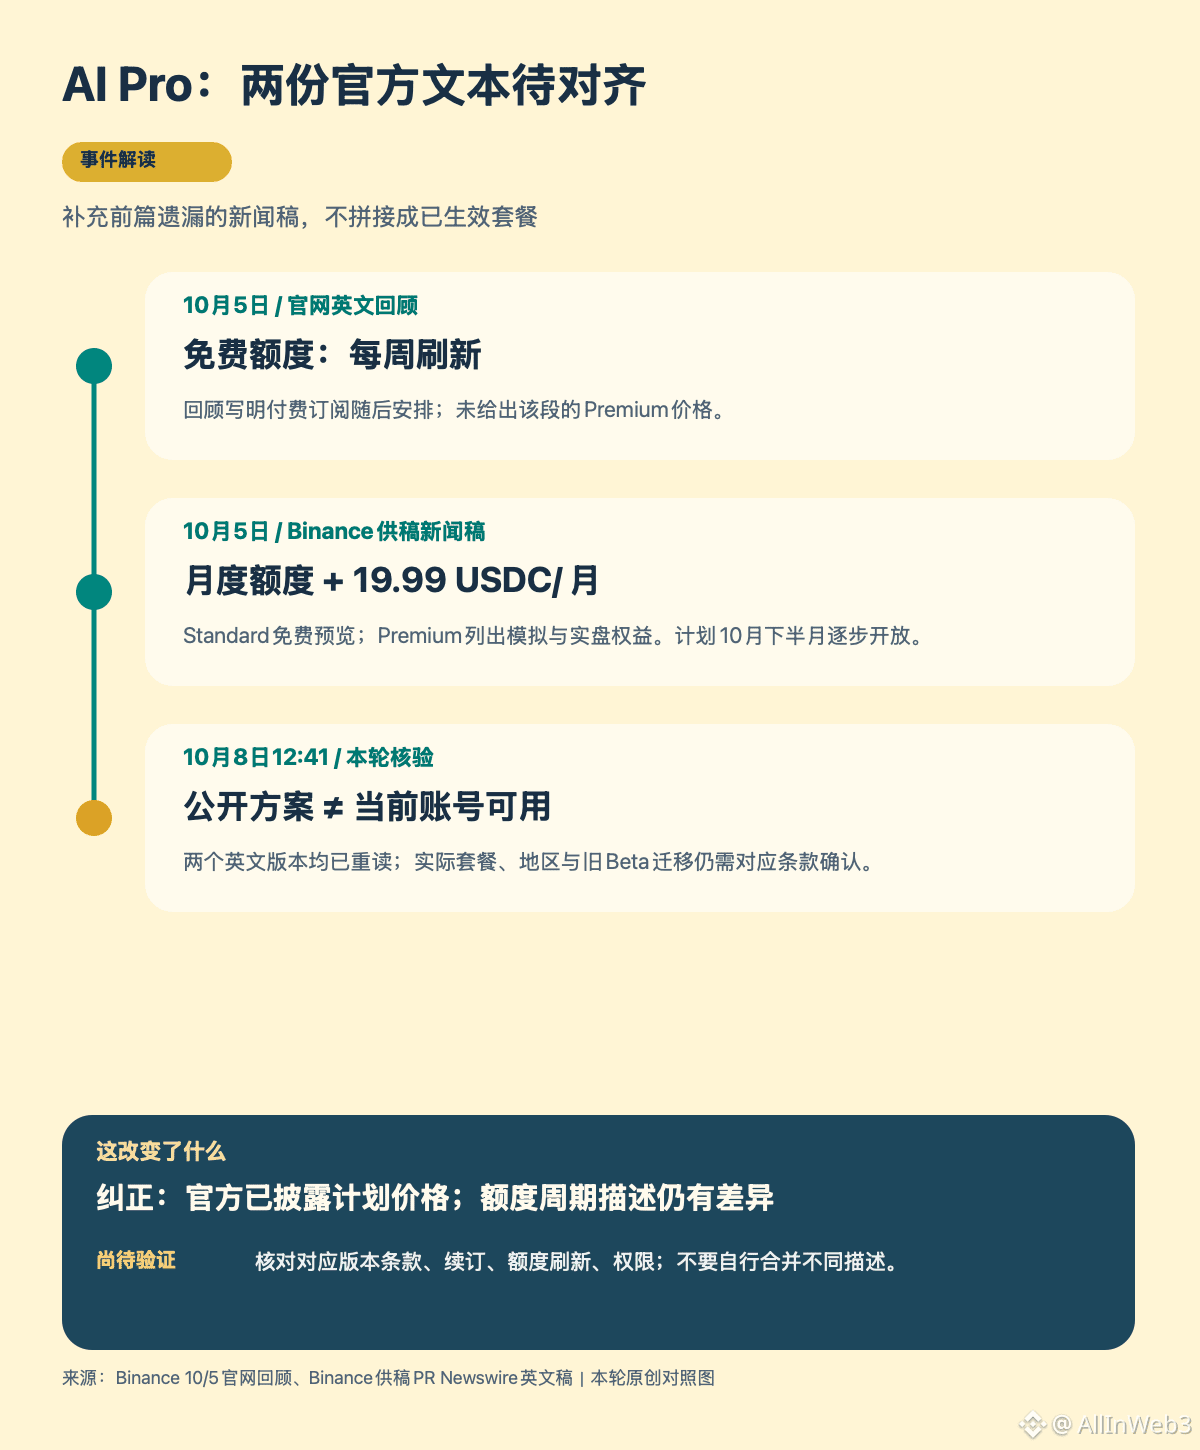
#币安推出BinanceIntelligence A clarification is needed to the previous article’s explanation of the AI Pro timeline: I included only the official website’s livestream recap and omitted Binance’s own press release, distributed via PR Newswire on October 5. The latter already listed the planned pricing and launch window, so the statement that “future pricing has not yet been announced” was incomplete.
This update compares, point by point, two official materials published on the same day. I verified them on October 8 at 12:41 Beijing time. The press release was published on October 5 at 09:22 Eastern Time, or 21:22 Beijing time. This was not a new price announced today. The official website’s recap is also dated October 5. The matching dates and product name do not resolve the different quota rules in the two texts.
1. What does the press release add?
The English-language press release, identified as supplied by Binance, states that the AI Pro plan will roll out gradually starting in the second half of October. The Standard plan offers free queries and strategy previews, with quotas refreshed monthly. The Premium plan is priced at 19.99 USDC per month and includes features such as backtesting, live strategy deployment, model selection, and additional quota top-ups.
These are plan details already made public by the publisher and should be included in the research. The fact that the previous article did not find them does not mean the official source never disclosed them. However, a gradual rollout does not mean the plan is available to all users today, and the monthly price should not be treated as a verified result showing that every account can subscribe right now.
2. How does it differ from the official website’s recap?
I reopened the official website’s English recap dated October 5. The AI Pro section still says that free-version quotas refresh weekly and that paid subscriptions will follow. The press release, by contrast, explicitly gives monthly quotas and a Premium price. This is not a case of a Chinese translation confusing “weekly” with “monthly”: this comparison is between the two English originals, and the APAC English version of the press release was also checked and showed the same monthly plan.
Therefore, we cannot casually combine “weekly free quota” and “Premium at 19.99 USDC per month” into a single plan table as if it were already in effect. Nor should we decide which provision applies based only on publication time or level of detail. What we can confirm is that the public texts describe things differently; the applicable rules for each version and region, or a subsequent clarification that reconciles them, are still needed.
3. What does this mean for users?
I would first consider four things separately: whether free previews are available, whether backtesting is a subscription benefit, the conditions for enabling live deployment, and how often quotas reset. Previewing a strategy and executing one involve different permissions. A price disclosure does not automatically authorize execution, and the feature list is no basis for inferring that a strategy will be profitable.
I could not retrieve verifiable plan terms from the product page through public access during this review, so I have not filled in the current price, available regions, or migration conditions for any account. In particular, we cannot infer how existing Beta users will be transitioned merely because the names match. Before using the product, check the subscription page and applicable terms for your own version to confirm the fees, renewal terms, quota cycle, and scope of authorization.
This article corrects the previous article’s omission of the official press release’s pricing and timeline while preserving the discrepancies between the public materials. I will update the conclusion if unified terms or confirmation of actual availability emerge. For now, the plan details have been disclosed, but the rules that apply in practice still need to be confirmed.
#币安推出BinanceIntelligence A clarification is needed to the previous article’s explanation of the AI Pro timeline: I included only the official website’s livestream recap and omitted Binance’s own press release, distributed via PR Newswire on October 5. The latter already listed the planned pricing and launch window, so the statement that “future pricing has not yet been announced” was incomplete.
This update compares, point by point, two official materials published on the same day. I verified them on October 8 at 12:41 Beijing time. The press release was published on October 5 at 09:22 Eastern Time, or 21:22 Beijing time. This was not a new price announced today. The official website’s recap is also dated October 5. The matching dates and product name do not resolve the different quota rules in the two texts.
1. What does the press release add?
The English-language press release, identified as supplied by Binance, states that the AI Pro plan will roll out gradually starting in the second half of October. The Standard plan offers free queries and strategy previews, with quotas refreshed monthly. The Premium plan is priced at 19.99 USDC per month and includes features such as backtesting, live strategy deployment, model selection, and additional quota top-ups.
These are plan details already made public by the publisher and should be included in the research. The fact that the previous article did not find them does not mean the official source never disclosed them. However, a gradual rollout does not mean the plan is available to all users today, and the monthly price should not be treated as a verified result showing that every account can subscribe right now.
2. How does it differ from the official website’s recap?
I reopened the official website’s English recap dated October 5. The AI Pro section still says that free-version quotas refresh weekly and that paid subscriptions will follow. The press release, by contrast, explicitly gives monthly quotas and a Premium price. This is not a case of a Chinese translation confusing “weekly” with “monthly”: this comparison is between the two English originals, and the APAC English version of the press release was also checked and showed the same monthly plan.
Therefore, we cannot casually combine “weekly free quota” and “Premium at 19.99 USDC per month” into a single plan table as if it were already in effect. Nor should we decide which provision applies based only on publication time or level of detail. What we can confirm is that the public texts describe things differently; the applicable rules for each version and region, or a subsequent clarification that reconciles them, are still needed.
3. What does this mean for users?
I would first consider four things separately: whether free previews are available, whether backtesting is a subscription benefit, the conditions for enabling live deployment, and how often quotas reset. Previewing a strategy and executing one involve different permissions. A price disclosure does not automatically authorize execution, and the feature list is no basis for inferring that a strategy will be profitable.
I could not retrieve verifiable plan terms from the product page through public access during this review, so I have not filled in the current price, available regions, or migration conditions for any account. In particular, we cannot infer how existing Beta users will be transitioned merely because the names match. Before using the product, check the subscription page and applicable terms for your own version to confirm the fees, renewal terms, quota cycle, and scope of authorization.
This article corrects the previous article’s omission of the official press release’s pricing and timeline while preserving the discrepancies between the public materials. I will update the conclusion if unified terms or confirmation of actual availability emerge. For now, the plan details have been disclosed, but the rules that apply in practice still need to be confirmed.
This update compares, point by point, two official materials published on the same day. I verified them on October 8 at 12:41 Beijing time. The press release was published on October 5 at 09:22 Eastern Time, or 21:22 Beijing time. This was not a new price announced today. The official website’s recap is also dated October 5. The matching dates and product name do not resolve the different quota rules in the two texts.
1. What does the press release add?
The English-language press release, identified as supplied by Binance, states that the AI Pro plan will roll out gradually starting in the second half of October. The Standard plan offers free queries and strategy previews, with quotas refreshed monthly. The Premium plan is priced at 19.99 USDC per month and includes features such as backtesting, live strategy deployment, model selection, and additional quota top-ups.
These are plan details already made public by the publisher and should be included in the research. The fact that the previous article did not find them does not mean the official source never disclosed them. However, a gradual rollout does not mean the plan is available to all users today, and the monthly price should not be treated as a verified result showing that every account can subscribe right now.
2. How does it differ from the official website’s recap?
I reopened the official website’s English recap dated October 5. The AI Pro section still says that free-version quotas refresh weekly and that paid subscriptions will follow. The press release, by contrast, explicitly gives monthly quotas and a Premium price. This is not a case of a Chinese translation confusing “weekly” with “monthly”: this comparison is between the two English originals, and the APAC English version of the press release was also checked and showed the same monthly plan.
Therefore, we cannot casually combine “weekly free quota” and “Premium at 19.99 USDC per month” into a single plan table as if it were already in effect. Nor should we decide which provision applies based only on publication time or level of detail. What we can confirm is that the public texts describe things differently; the applicable rules for each version and region, or a subsequent clarification that reconciles them, are still needed.
3. What does this mean for users?
I would first consider four things separately: whether free previews are available, whether backtesting is a subscription benefit, the conditions for enabling live deployment, and how often quotas reset. Previewing a strategy and executing one involve different permissions. A price disclosure does not automatically authorize execution, and the feature list is no basis for inferring that a strategy will be profitable.
I could not retrieve verifiable plan terms from the product page through public access during this review, so I have not filled in the current price, available regions, or migration conditions for any account. In particular, we cannot infer how existing Beta users will be transitioned merely because the names match. Before using the product, check the subscription page and applicable terms for your own version to confirm the fees, renewal terms, quota cycle, and scope of authorization.
This article corrects the previous article’s omission of the official press release’s pricing and timeline while preserving the discrepancies between the public materials. I will update the conclusion if unified terms or confirmation of actual availability emerge. For now, the plan details have been disclosed, but the rules that apply in practice still need to be confirmed.
14
·
--
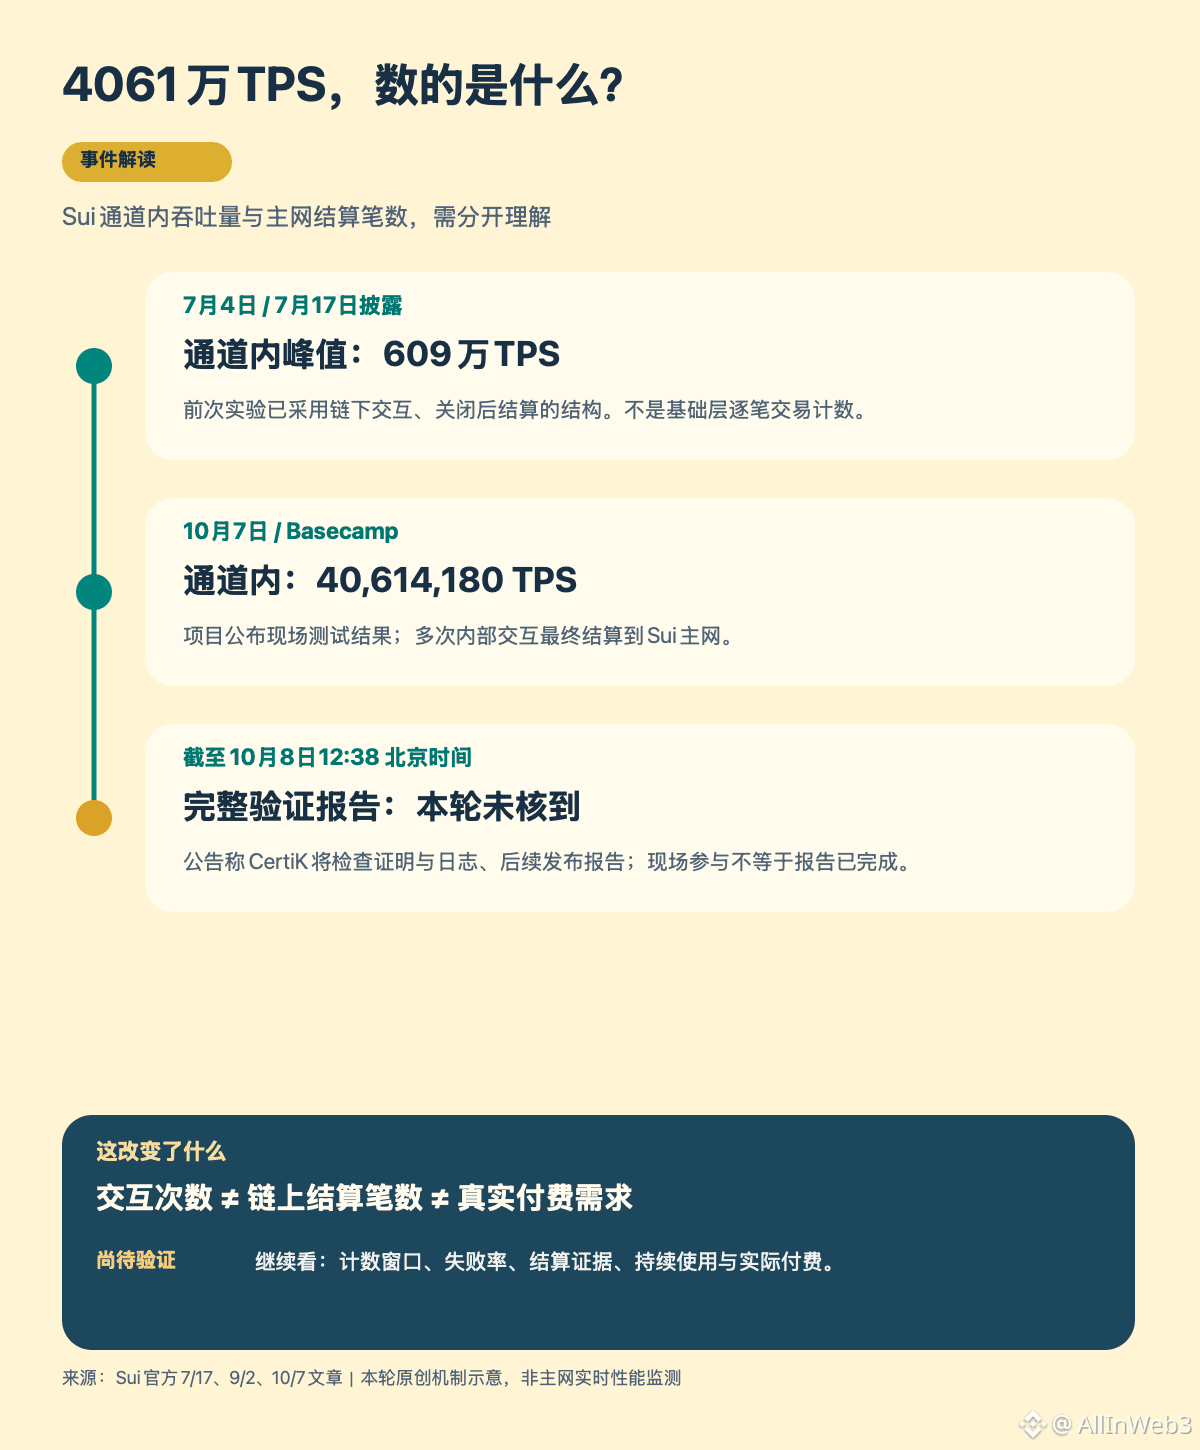
#Sui创4060万TPS纪录 The first thing I checked was “what exactly is being counted?” In its official announcement on October 7, Sui reported 40,614,180 TPS, measured at Basecamp in Singapore. But this throughput came from off-chain activity in Sui tunnels, with the results settled on the mainnet. Treating it directly as the number of transactions confirmed one by one per second by the mainnet consensus layer would give readers a different understanding of its performance.
As of 12:38 p.m. Beijing time on October 8, the original timeline I could verify for this round is: the experiment reached 6,086,766 TPS on July 4, and an introduction was published on July 17; on October 7, the 40.61 million result was announced. Both measurements were taken within channels, so they can be used to describe improvements in this testing framework, but not to rank Sui directly against another chain by mainnet transaction counts.
I. Separate interactions, execution, and settlement
The process described by the project is as follows: open a channel on-chain, complete multiple state or payment interactions within the channel, then submit a settlement when closing it. The mainnet anchors the final state and proof; each action within the channel does not need to be written individually to global consensus. It is like submitting the final ledger for a series of transactions to a settlement layer: the number of interactions and the number of final submissions are naturally different metrics.
This kind of design has value: high-frequency machine interactions do not have to incur the same on-chain write costs for every step. But both “happens off-chain” and “can ultimately be verified on-chain” should be made clear; we should not report only the larger number. A peak figure also does not, by itself, answer questions about duration, failure rates, or congestion when channels are closed.
II. Do not conflate verification progress with a final conclusion
The October 7 announcement named CertiK as the independent auditor and said it would review materials such as proofs and execution logs, with a report to be published in the coming days. I have not yet been able to verify a complete public report for this test. So I am citing the results announced by the project; I am not portraying on-site verification as an independent recalculation by me, or describing a planned report as already completed.
The most important things to look for next are the measurement window, counting rules, how successes and failures are handled, and the settlement evidence after channels are closed. If any of these criteria change, the same TPS figure could mean something different.
III. How can performance capacity translate into real demand?
Sui’s September 2 article on machine payments also emphasized atomic settlement and constrained authorization: a multi-step process either completes as a whole or is not submitted, and an agent’s spending amount, time, and recipient also need limits. I think this explains why real-world applications cannot focus only on the number of actions. A large volume of automated interactions may be no more useful simply because they are faster if permissions are not controllable and settlements cannot be verified.
For the SUI asset, demonstrated throughput cannot be converted proportionally into revenue, token purchases, or a price target. Next, I will look at whether sustained usage, actual payments, and settlement demand keep pace before judging whether the technical results generate economic value. My conclusion today is that the measurement scope has been explained, while commercial adoption and the complete test report still need further verification.
#Sui创4060万TPS纪录 The first thing I checked was “what exactly is being counted?” In its official announcement on October 7, Sui reported 40,614,180 TPS, measured at Basecamp in Singapore. But this throughput came from off-chain activity in Sui tunnels, with the results settled on the mainnet. Treating it directly as the number of transactions confirmed one by one per second by the mainnet consensus layer would give readers a different understanding of its performance.
As of 12:38 p.m. Beijing time on October 8, the original timeline I could verify for this round is: the experiment reached 6,086,766 TPS on July 4, and an introduction was published on July 17; on October 7, the 40.61 million result was announced. Both measurements were taken within channels, so they can be used to describe improvements in this testing framework, but not to rank Sui directly against another chain by mainnet transaction counts.
I. Separate interactions, execution, and settlement
The process described by the project is as follows: open a channel on-chain, complete multiple state or payment interactions within the channel, then submit a settlement when closing it. The mainnet anchors the final state and proof; each action within the channel does not need to be written individually to global consensus. It is like submitting the final ledger for a series of transactions to a settlement layer: the number of interactions and the number of final submissions are naturally different metrics.
This kind of design has value: high-frequency machine interactions do not have to incur the same on-chain write costs for every step. But both “happens off-chain” and “can ultimately be verified on-chain” should be made clear; we should not report only the larger number. A peak figure also does not, by itself, answer questions about duration, failure rates, or congestion when channels are closed.
II. Do not conflate verification progress with a final conclusion
The October 7 announcement named CertiK as the independent auditor and said it would review materials such as proofs and execution logs, with a report to be published in the coming days. I have not yet been able to verify a complete public report for this test. So I am citing the results announced by the project; I am not portraying on-site verification as an independent recalculation by me, or describing a planned report as already completed.
The most important things to look for next are the measurement window, counting rules, how successes and failures are handled, and the settlement evidence after channels are closed. If any of these criteria change, the same TPS figure could mean something different.
III. How can performance capacity translate into real demand?
Sui’s September 2 article on machine payments also emphasized atomic settlement and constrained authorization: a multi-step process either completes as a whole or is not submitted, and an agent’s spending amount, time, and recipient also need limits. I think this explains why real-world applications cannot focus only on the number of actions. A large volume of automated interactions may be no more useful simply because they are faster if permissions are not controllable and settlements cannot be verified.
For the SUI asset, demonstrated throughput cannot be converted proportionally into revenue, token purchases, or a price target. Next, I will look at whether sustained usage, actual payments, and settlement demand keep pace before judging whether the technical results generate economic value. My conclusion today is that the measurement scope has been explained, while commercial adoption and the complete test report still need further verification.
As of 12:38 p.m. Beijing time on October 8, the original timeline I could verify for this round is: the experiment reached 6,086,766 TPS on July 4, and an introduction was published on July 17; on October 7, the 40.61 million result was announced. Both measurements were taken within channels, so they can be used to describe improvements in this testing framework, but not to rank Sui directly against another chain by mainnet transaction counts.
I. Separate interactions, execution, and settlement
The process described by the project is as follows: open a channel on-chain, complete multiple state or payment interactions within the channel, then submit a settlement when closing it. The mainnet anchors the final state and proof; each action within the channel does not need to be written individually to global consensus. It is like submitting the final ledger for a series of transactions to a settlement layer: the number of interactions and the number of final submissions are naturally different metrics.
This kind of design has value: high-frequency machine interactions do not have to incur the same on-chain write costs for every step. But both “happens off-chain” and “can ultimately be verified on-chain” should be made clear; we should not report only the larger number. A peak figure also does not, by itself, answer questions about duration, failure rates, or congestion when channels are closed.
II. Do not conflate verification progress with a final conclusion
The October 7 announcement named CertiK as the independent auditor and said it would review materials such as proofs and execution logs, with a report to be published in the coming days. I have not yet been able to verify a complete public report for this test. So I am citing the results announced by the project; I am not portraying on-site verification as an independent recalculation by me, or describing a planned report as already completed.
The most important things to look for next are the measurement window, counting rules, how successes and failures are handled, and the settlement evidence after channels are closed. If any of these criteria change, the same TPS figure could mean something different.
III. How can performance capacity translate into real demand?
Sui’s September 2 article on machine payments also emphasized atomic settlement and constrained authorization: a multi-step process either completes as a whole or is not submitted, and an agent’s spending amount, time, and recipient also need limits. I think this explains why real-world applications cannot focus only on the number of actions. A large volume of automated interactions may be no more useful simply because they are faster if permissions are not controllable and settlements cannot be verified.
For the SUI asset, demonstrated throughput cannot be converted proportionally into revenue, token purchases, or a price target. Next, I will look at whether sustained usage, actual payments, and settlement demand keep pace before judging whether the technical results generate economic value. My conclusion today is that the measurement scope has been explained, while commercial adoption and the complete test report still need further verification.
1
3
·
--
#IMF豁免萨尔瓦多比特币持仓超限 This headline can easily be misread as meaning that restrictions have already been lifted. After rereading the IMF’s original text this time, I’m focusing more on three distinct records: whether public funds were used in the past, why public-sector assets increased, and what may be done in the future. The waiver addresses how program reviews can proceed; it cannot replace verification of the other two points.
First, let’s put the timeline back in place. On September 3, IMF staff and El Salvador reached a staff-level agreement on the second and third reviews. On October 1, the Executive Board completed the reviews, allowing an immediate disbursement of about $138 million. It is now October 8, Beijing time. The Board’s decision was made a week ago. Its reappearance on trending lists does not mean a new waiver was granted today, nor does it mean a new budget for buying Bitcoin has emerged.
1. Where did the Bitcoin accumulated in the past come from?
The September 3 text said that documentation had been provided showing that Bitcoin accumulated since the first review came from private donations, with no public resources used. The key point here is the explanation of the source of funds. An increase in the balance of a publicly visible wallet can support the claim that “this address received more coins,” but the balance alone cannot establish that “the government spent money to buy more.” The donation documents, recipient, beneficial ownership of the assets, and whether the funds were merely moved between accounts also need to be checked.
This should not be read in reverse as meaning that “all historical Bitcoin purchases never happened.” The IMF’s statement concerns a specific period and review context; it cannot be extended to cover every transaction since the country adopted Bitcoin. This article has not independently audited current wallet balances, nor has it turned program statements into proof of the on-chain source of every transaction.
2. The waiver has conditions, and future commitments remain in force
The October 1 announcement confirmed that some performance criteria related to Bitcoin accumulation had not been met, and that the waiver was based on corrective actions and renewed commitments. The same passage goes on to state that no further accumulation beyond documented donations is expected. Having a past instance of noncompliance waived so that a review can proceed is different from permanently removing future constraints.
So if the market translates “waiver” directly into guaranteed government buying, it is missing new authorization, a source of funds, and evidence of implementation. The roughly $138 million is the current disbursement eligibility under the existing financing arrangement; the fact that the amount or timing is similar does not mean the money will go toward Bitcoin.
3. Private operations and public custody must also be distinguished
The September 3 document explained that majority ownership and operational control of Chivo had been transferred to a private operator, while the government retained a minority stake and responsibility for the custody of customer assets. On October 1, the IMF also called for the residual public-sector risks to be fully unwound. A change in management does not mean that all customer assets have become assets of the private operator, nor does it prove that the government has completely exited the related risks.
Compared with the previous article, which focused mainly on the progress of disbursement approval, this update adds three dimensions: asset sources, ownership, and future constraints. Next, I’ll be watching public disclosures of assets, how the residual custody responsibilities are handled, and whether subsequent reviews confirm that the commitments are being maintained. Only changes at these checkpoints can show whether the policy boundaries have shifted; a trending headline by itself cannot answer that.
#IMF豁免萨尔瓦多比特币持仓超限 This headline can easily be misread as meaning that restrictions have already been lifted. After rereading the IMF’s original text this time, I’m focusing more on three distinct records: whether public funds were used in the past, why public-sector assets increased, and what may be done in the future. The waiver addresses how program reviews can proceed; it cannot replace verification of the other two points.
First, let’s put the timeline back in place. On September 3, IMF staff and El Salvador reached a staff-level agreement on the second and third reviews. On October 1, the Executive Board completed the reviews, allowing an immediate disbursement of about $138 million. It is now October 8, Beijing time. The Board’s decision was made a week ago. Its reappearance on trending lists does not mean a new waiver was granted today, nor does it mean a new budget for buying Bitcoin has emerged.
1. Where did the Bitcoin accumulated in the past come from?
The September 3 text said that documentation had been provided showing that Bitcoin accumulated since the first review came from private donations, with no public resources used. The key point here is the explanation of the source of funds. An increase in the balance of a publicly visible wallet can support the claim that “this address received more coins,” but the balance alone cannot establish that “the government spent money to buy more.” The donation documents, recipient, beneficial ownership of the assets, and whether the funds were merely moved between accounts also need to be checked.
This should not be read in reverse as meaning that “all historical Bitcoin purchases never happened.” The IMF’s statement concerns a specific period and review context; it cannot be extended to cover every transaction since the country adopted Bitcoin. This article has not independently audited current wallet balances, nor has it turned program statements into proof of the on-chain source of every transaction.
2. The waiver has conditions, and future commitments remain in force
The October 1 announcement confirmed that some performance criteria related to Bitcoin accumulation had not been met, and that the waiver was based on corrective actions and renewed commitments. The same passage goes on to state that no further accumulation beyond documented donations is expected. Having a past instance of noncompliance waived so that a review can proceed is different from permanently removing future constraints.
So if the market translates “waiver” directly into guaranteed government buying, it is missing new authorization, a source of funds, and evidence of implementation. The roughly $138 million is the current disbursement eligibility under the existing financing arrangement; the fact that the amount or timing is similar does not mean the money will go toward Bitcoin.
3. Private operations and public custody must also be distinguished
The September 3 document explained that majority ownership and operational control of Chivo had been transferred to a private operator, while the government retained a minority stake and responsibility for the custody of customer assets. On October 1, the IMF also called for the residual public-sector risks to be fully unwound. A change in management does not mean that all customer assets have become assets of the private operator, nor does it prove that the government has completely exited the related risks.
Compared with the previous article, which focused mainly on the progress of disbursement approval, this update adds three dimensions: asset sources, ownership, and future constraints. Next, I’ll be watching public disclosures of assets, how the residual custody responsibilities are handled, and whether subsequent reviews confirm that the commitments are being maintained. Only changes at these checkpoints can show whether the policy boundaries have shifted; a trending headline by itself cannot answer that.
First, let’s put the timeline back in place. On September 3, IMF staff and El Salvador reached a staff-level agreement on the second and third reviews. On October 1, the Executive Board completed the reviews, allowing an immediate disbursement of about $138 million. It is now October 8, Beijing time. The Board’s decision was made a week ago. Its reappearance on trending lists does not mean a new waiver was granted today, nor does it mean a new budget for buying Bitcoin has emerged.
1. Where did the Bitcoin accumulated in the past come from?
The September 3 text said that documentation had been provided showing that Bitcoin accumulated since the first review came from private donations, with no public resources used. The key point here is the explanation of the source of funds. An increase in the balance of a publicly visible wallet can support the claim that “this address received more coins,” but the balance alone cannot establish that “the government spent money to buy more.” The donation documents, recipient, beneficial ownership of the assets, and whether the funds were merely moved between accounts also need to be checked.
This should not be read in reverse as meaning that “all historical Bitcoin purchases never happened.” The IMF’s statement concerns a specific period and review context; it cannot be extended to cover every transaction since the country adopted Bitcoin. This article has not independently audited current wallet balances, nor has it turned program statements into proof of the on-chain source of every transaction.
2. The waiver has conditions, and future commitments remain in force
The October 1 announcement confirmed that some performance criteria related to Bitcoin accumulation had not been met, and that the waiver was based on corrective actions and renewed commitments. The same passage goes on to state that no further accumulation beyond documented donations is expected. Having a past instance of noncompliance waived so that a review can proceed is different from permanently removing future constraints.
So if the market translates “waiver” directly into guaranteed government buying, it is missing new authorization, a source of funds, and evidence of implementation. The roughly $138 million is the current disbursement eligibility under the existing financing arrangement; the fact that the amount or timing is similar does not mean the money will go toward Bitcoin.
3. Private operations and public custody must also be distinguished
The September 3 document explained that majority ownership and operational control of Chivo had been transferred to a private operator, while the government retained a minority stake and responsibility for the custody of customer assets. On October 1, the IMF also called for the residual public-sector risks to be fully unwound. A change in management does not mean that all customer assets have become assets of the private operator, nor does it prove that the government has completely exited the related risks.
Compared with the previous article, which focused mainly on the progress of disbursement approval, this update adds three dimensions: asset sources, ownership, and future constraints. Next, I’ll be watching public disclosures of assets, how the residual custody responsibilities are handled, and whether subsequent reviews confirm that the commitments are being maintained. Only changes at these checkpoints can show whether the policy boundaries have shifted; a trending headline by itself cannot answer that.

155
·
--
$VVV remains under a cautious, bearish watch. The key question is whether a low-level rebound can attract sustained support. At 12:20 Beijing time on October 8, the Binance VVVUSDT perpetual reference price was 24.747, down 7.043% over the rolling 24 hours, with approximately 32.56 million USDT in trading volume. Compared with yesterday’s analysis at 16:53, the price has fallen about 6.97% from 26.60, and the previously watched low of 26.43 has been decisively broken on a completed hourly candle. The observation range needs to move lower this time, rather than continuing to rely on the old support level.
I. A rebound appeared, but the recovery did not hold
Yesterday, from 22:00 to 23:00, the completed hourly candle fell from 26.300 to 25.535, a drop of 2.91%, with 4.1139 million USDT in volume. Then, over the four completed hours from 00:00 to 04:00, the price fell another 2.28%, closing at 25.061, with 6.1951 million USDT in volume. The decline extended from a sharp drop into a new, lower price range.
Today, the price rebounded 1.91% from 04:00 to 08:00, closing at 25.539, but volume was 3.4475 million USDT, 44.35% lower than in the preceding four-hour period of equal length. From 08:00 to 12:00, it fell another 1.48%, closing at 25.162, with 2.8420 million USDT in volume. The rebound did not alter the broader downtrend. Nor can the decline in volume alone be taken as evidence that selling pressure has run its course, since the price failed to hold on to its rebound gains.
The latest completed hourly candle, from 11:00 to 12:00, fell 1.12%, with 904,100 USDT in volume—about 1.28 times the average for the preceding four hours. This shows that trading activity picked up during the final leg down, but it remained far below the volume of yesterday’s sharp-drop hour, so it should not be overstated as outright panic.
II. This decline came with falling open interest, not rising open interest
The number of open contracts fell from 1.0682 million VVV at 16:00 yesterday to 1.0239 million VVV at 12:00 today, a decrease of about 4.15%. It also edged down about 0.26% between 11:00 and 12:00. This comparison is based on the number of tokens, avoiding the distortion of a lower notional value caused by the price decline.
The simultaneous drop in price and open interest is consistent with some positions being closed. These could include both long-position closures and short-position profit-taking; without trade-direction or liquidation evidence, it is impossible to say which side was dominant. The settled funding rate at 12:00 was still +0.005% per four hours, with no extreme reading. This does not support inferring either a short squeeze or a bottom-fishing opportunity.
III. Distinguish an intraday low from a confirmed close
The 12:20 snapshot touched a low of 24.747, below the 25.014 low of the completed hourly candle in the early morning, but the current hourly candle is not yet complete. First, watch whether a subsequent completed hourly candle can reclaim 25.014. A further recovery above 25.474, followed by a successful retest of that level—the high of the 11:00–12:00 hourly candle—would be worth reassessing as a near-term recovery. The higher level of 25.813 is the high from 09:00 to 10:00 today and would still require volume confirmation. If the price continues to close below 25.014 and rebounds fail to reclaim it, the weak outlook remains in place; one intraday low is not enough to declare a bottom.
Venice’s official update on August 5 outlined a phased reduction in annual emissions, including a reduction to 2 million VVV per year on October 1. This is existing project background, not a newly announced catalyst today, and it does not mean net deflation has already been achieved. We found no single project announcement in this review that adequately explains the short-term decline. The assessment remains based on completed Binance candlesticks, open interest, and settled funding rates. #VVV
$VVV remains under a cautious, bearish watch. The key question is whether a low-level rebound can attract sustained support. At 12:20 Beijing time on October 8, the Binance VVVUSDT perpetual reference price was 24.747, down 7.043% over the rolling 24 hours, with approximately 32.56 million USDT in trading volume. Compared with yesterday’s analysis at 16:53, the price has fallen about 6.97% from 26.60, and the previously watched low of 26.43 has been decisively broken on a completed hourly candle. The observation range needs to move lower this time, rather than continuing to rely on the old support level.
I. A rebound appeared, but the recovery did not hold
Yesterday, from 22:00 to 23:00, the completed hourly candle fell from 26.300 to 25.535, a drop of 2.91%, with 4.1139 million USDT in volume. Then, over the four completed hours from 00:00 to 04:00, the price fell another 2.28%, closing at 25.061, with 6.1951 million USDT in volume. The decline extended from a sharp drop into a new, lower price range.
Today, the price rebounded 1.91% from 04:00 to 08:00, closing at 25.539, but volume was 3.4475 million USDT, 44.35% lower than in the preceding four-hour period of equal length. From 08:00 to 12:00, it fell another 1.48%, closing at 25.162, with 2.8420 million USDT in volume. The rebound did not alter the broader downtrend. Nor can the decline in volume alone be taken as evidence that selling pressure has run its course, since the price failed to hold on to its rebound gains.
The latest completed hourly candle, from 11:00 to 12:00, fell 1.12%, with 904,100 USDT in volume—about 1.28 times the average for the preceding four hours. This shows that trading activity picked up during the final leg down, but it remained far below the volume of yesterday’s sharp-drop hour, so it should not be overstated as outright panic.
II. This decline came with falling open interest, not rising open interest
The number of open contracts fell from 1.0682 million VVV at 16:00 yesterday to 1.0239 million VVV at 12:00 today, a decrease of about 4.15%. It also edged down about 0.26% between 11:00 and 12:00. This comparison is based on the number of tokens, avoiding the distortion of a lower notional value caused by the price decline.
The simultaneous drop in price and open interest is consistent with some positions being closed. These could include both long-position closures and short-position profit-taking; without trade-direction or liquidation evidence, it is impossible to say which side was dominant. The settled funding rate at 12:00 was still +0.005% per four hours, with no extreme reading. This does not support inferring either a short squeeze or a bottom-fishing opportunity.
III. Distinguish an intraday low from a confirmed close
The 12:20 snapshot touched a low of 24.747, below the 25.014 low of the completed hourly candle in the early morning, but the current hourly candle is not yet complete. First, watch whether a subsequent completed hourly candle can reclaim 25.014. A further recovery above 25.474, followed by a successful retest of that level—the high of the 11:00–12:00 hourly candle—would be worth reassessing as a near-term recovery. The higher level of 25.813 is the high from 09:00 to 10:00 today and would still require volume confirmation. If the price continues to close below 25.014 and rebounds fail to reclaim it, the weak outlook remains in place; one intraday low is not enough to declare a bottom.
Venice’s official update on August 5 outlined a phased reduction in annual emissions, including a reduction to 2 million VVV per year on October 1. This is existing project background, not a newly announced catalyst today, and it does not mean net deflation has already been achieved. We found no single project announcement in this review that adequately explains the short-term decline. The assessment remains based on completed Binance candlesticks, open interest, and settled funding rates. #VVV
I. A rebound appeared, but the recovery did not hold
Yesterday, from 22:00 to 23:00, the completed hourly candle fell from 26.300 to 25.535, a drop of 2.91%, with 4.1139 million USDT in volume. Then, over the four completed hours from 00:00 to 04:00, the price fell another 2.28%, closing at 25.061, with 6.1951 million USDT in volume. The decline extended from a sharp drop into a new, lower price range.
Today, the price rebounded 1.91% from 04:00 to 08:00, closing at 25.539, but volume was 3.4475 million USDT, 44.35% lower than in the preceding four-hour period of equal length. From 08:00 to 12:00, it fell another 1.48%, closing at 25.162, with 2.8420 million USDT in volume. The rebound did not alter the broader downtrend. Nor can the decline in volume alone be taken as evidence that selling pressure has run its course, since the price failed to hold on to its rebound gains.
The latest completed hourly candle, from 11:00 to 12:00, fell 1.12%, with 904,100 USDT in volume—about 1.28 times the average for the preceding four hours. This shows that trading activity picked up during the final leg down, but it remained far below the volume of yesterday’s sharp-drop hour, so it should not be overstated as outright panic.
II. This decline came with falling open interest, not rising open interest
The number of open contracts fell from 1.0682 million VVV at 16:00 yesterday to 1.0239 million VVV at 12:00 today, a decrease of about 4.15%. It also edged down about 0.26% between 11:00 and 12:00. This comparison is based on the number of tokens, avoiding the distortion of a lower notional value caused by the price decline.
The simultaneous drop in price and open interest is consistent with some positions being closed. These could include both long-position closures and short-position profit-taking; without trade-direction or liquidation evidence, it is impossible to say which side was dominant. The settled funding rate at 12:00 was still +0.005% per four hours, with no extreme reading. This does not support inferring either a short squeeze or a bottom-fishing opportunity.
III. Distinguish an intraday low from a confirmed close
The 12:20 snapshot touched a low of 24.747, below the 25.014 low of the completed hourly candle in the early morning, but the current hourly candle is not yet complete. First, watch whether a subsequent completed hourly candle can reclaim 25.014. A further recovery above 25.474, followed by a successful retest of that level—the high of the 11:00–12:00 hourly candle—would be worth reassessing as a near-term recovery. The higher level of 25.813 is the high from 09:00 to 10:00 today and would still require volume confirmation. If the price continues to close below 25.014 and rebounds fail to reclaim it, the weak outlook remains in place; one intraday low is not enough to declare a bottom.
Venice’s official update on August 5 outlined a phased reduction in annual emissions, including a reduction to 2 million VVV per year on October 1. This is existing project background, not a newly announced catalyst today, and it does not mean net deflation has already been achieved. We found no single project announcement in this review that adequately explains the short-term decline. The assessment remains based on completed Binance candlesticks, open interest, and settled funding rates. #VVV
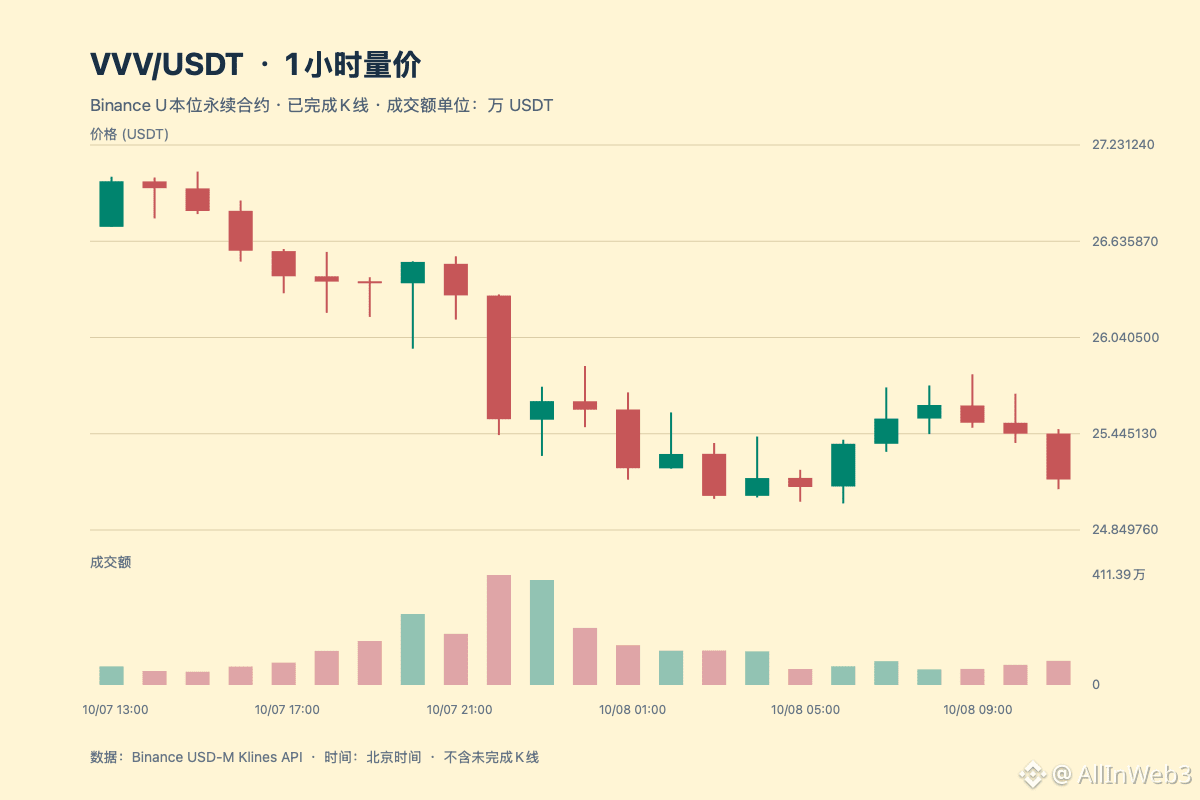
63
·
--
$MET The previous high has finally received confirmation from a completed hourly close, but the quality of the breakout still needs to be tested in the next hour. I’m continuing to wait on the sidelines for now. As of 12:07 Beijing time on October 8, METUSDT’s reference price was 0.4730, with a rolling 24-hour gain of 50.206% and quote volume of approximately 356 million USDT. A full scan of 523 Binance USDⓈ-M USDT perpetual contracts trading normally puts MET at the top of the gainers list. Its ranking only indicates the magnitude of the move.
Compared with my 09:07 analysis, the new developments are that the price closed above 0.4731, open interest rose notably, and the negative funding rate widened again. The higher 24-hour gain alone is not enough to conclude that a breakout has held.
I. From an intraday test to a close above resistance
The complete 4-hour period from 00:00 to 04:00 rose from 0.3314 to 0.4342, up 31.02%; gains slowed to 2.28% from 04:00 to 08:00. From 08:00 to 12:00, the price rose 6.95% again and closed at 0.4752, with quote volume of approximately 101.3 million USDT—just 4.79% more than in the preceding equal-length window. Momentum picked up again, but volume has not expanded sharply in tandem.
The key distinction is on the hourly chart: from 10:00 to 11:00, the price reached a high of 0.4799 but fell back to close at 0.4560. It was only from 11:00 to 12:00 that the price closed at 0.4752, marking the first close above the 0.4731 previous high noted in my last analysis. This is stronger evidence than an intraday touch, but it is only one completed hourly candle, and at 12:07 the live price had already returned to around the previous high; the current hour is not yet complete. Volume for that hour was 24.5052 million USDT, down 16.59% from the prior hour and about 1.01 times the average of the previous four hours. It would be premature to call this a confirmed high-volume breakout.
II. Open interest is rising, while the funding-rate divergence is widening
The Binance hourly open-interest sample increased from 32.4559 million MET at 11:00 to 35.9982 million MET at 12:00, a rise of 10.91%; it was up 15.31% from 09:00. This comparison is in contract units and excludes changes in notional value caused by the price increase. Rising prices alongside increasing open interest may also reflect positions opening on both sides, so it does not prove net inflows into longs.
The settled funding rate was −0.077797% at 08:00 and −0.141298% at 12:00, a further decrease of 0.063501 percentage points. A negative rate means that, for that settlement, shorts paid longs; it may reflect hedging or a divergence in directional views. It does not prove that a short squeeze has occurred, nor does it guarantee the next settlement will be the same.
III. The next test is whether support holds
I’ll first watch to see whether the next completed hourly candle can hold above 0.4731, then whether the price can close above 0.4799 with volume continuing to follow through. If it falls back below 0.4731, confidence in this move above the level should be reduced; if it drops further below the final-hour low of 0.4526, the assessment of post-breakout support would weaken considerably. These are the relevant levels in the current structure and should be reassessed as prices change.
As of this check, the latest report listed on Meteora’s official IR page is still the August monthly report, published on September 15; current business metrics are not available. I haven’t found a single fundamental catalyst that adequately explains this rally, so I won’t use old listing news to imply causation. Data is from Binance futures candlesticks, open interest, and settled funding rates; the accompanying chart contains only completed hourly candles. #MET
$MET The previous high has finally received confirmation from a completed hourly close, but the quality of the breakout still needs to be tested in the next hour. I’m continuing to wait on the sidelines for now. As of 12:07 Beijing time on October 8, METUSDT’s reference price was 0.4730, with a rolling 24-hour gain of 50.206% and quote volume of approximately 356 million USDT. A full scan of 523 Binance USDⓈ-M USDT perpetual contracts trading normally puts MET at the top of the gainers list. Its ranking only indicates the magnitude of the move.
Compared with my 09:07 analysis, the new developments are that the price closed above 0.4731, open interest rose notably, and the negative funding rate widened again. The higher 24-hour gain alone is not enough to conclude that a breakout has held.
I. From an intraday test to a close above resistance
The complete 4-hour period from 00:00 to 04:00 rose from 0.3314 to 0.4342, up 31.02%; gains slowed to 2.28% from 04:00 to 08:00. From 08:00 to 12:00, the price rose 6.95% again and closed at 0.4752, with quote volume of approximately 101.3 million USDT—just 4.79% more than in the preceding equal-length window. Momentum picked up again, but volume has not expanded sharply in tandem.
The key distinction is on the hourly chart: from 10:00 to 11:00, the price reached a high of 0.4799 but fell back to close at 0.4560. It was only from 11:00 to 12:00 that the price closed at 0.4752, marking the first close above the 0.4731 previous high noted in my last analysis. This is stronger evidence than an intraday touch, but it is only one completed hourly candle, and at 12:07 the live price had already returned to around the previous high; the current hour is not yet complete. Volume for that hour was 24.5052 million USDT, down 16.59% from the prior hour and about 1.01 times the average of the previous four hours. It would be premature to call this a confirmed high-volume breakout.
II. Open interest is rising, while the funding-rate divergence is widening
The Binance hourly open-interest sample increased from 32.4559 million MET at 11:00 to 35.9982 million MET at 12:00, a rise of 10.91%; it was up 15.31% from 09:00. This comparison is in contract units and excludes changes in notional value caused by the price increase. Rising prices alongside increasing open interest may also reflect positions opening on both sides, so it does not prove net inflows into longs.
The settled funding rate was −0.077797% at 08:00 and −0.141298% at 12:00, a further decrease of 0.063501 percentage points. A negative rate means that, for that settlement, shorts paid longs; it may reflect hedging or a divergence in directional views. It does not prove that a short squeeze has occurred, nor does it guarantee the next settlement will be the same.
III. The next test is whether support holds
I’ll first watch to see whether the next completed hourly candle can hold above 0.4731, then whether the price can close above 0.4799 with volume continuing to follow through. If it falls back below 0.4731, confidence in this move above the level should be reduced; if it drops further below the final-hour low of 0.4526, the assessment of post-breakout support would weaken considerably. These are the relevant levels in the current structure and should be reassessed as prices change.
As of this check, the latest report listed on Meteora’s official IR page is still the August monthly report, published on September 15; current business metrics are not available. I haven’t found a single fundamental catalyst that adequately explains this rally, so I won’t use old listing news to imply causation. Data is from Binance futures candlesticks, open interest, and settled funding rates; the accompanying chart contains only completed hourly candles. #MET
Compared with my 09:07 analysis, the new developments are that the price closed above 0.4731, open interest rose notably, and the negative funding rate widened again. The higher 24-hour gain alone is not enough to conclude that a breakout has held.
I. From an intraday test to a close above resistance
The complete 4-hour period from 00:00 to 04:00 rose from 0.3314 to 0.4342, up 31.02%; gains slowed to 2.28% from 04:00 to 08:00. From 08:00 to 12:00, the price rose 6.95% again and closed at 0.4752, with quote volume of approximately 101.3 million USDT—just 4.79% more than in the preceding equal-length window. Momentum picked up again, but volume has not expanded sharply in tandem.
The key distinction is on the hourly chart: from 10:00 to 11:00, the price reached a high of 0.4799 but fell back to close at 0.4560. It was only from 11:00 to 12:00 that the price closed at 0.4752, marking the first close above the 0.4731 previous high noted in my last analysis. This is stronger evidence than an intraday touch, but it is only one completed hourly candle, and at 12:07 the live price had already returned to around the previous high; the current hour is not yet complete. Volume for that hour was 24.5052 million USDT, down 16.59% from the prior hour and about 1.01 times the average of the previous four hours. It would be premature to call this a confirmed high-volume breakout.
II. Open interest is rising, while the funding-rate divergence is widening
The Binance hourly open-interest sample increased from 32.4559 million MET at 11:00 to 35.9982 million MET at 12:00, a rise of 10.91%; it was up 15.31% from 09:00. This comparison is in contract units and excludes changes in notional value caused by the price increase. Rising prices alongside increasing open interest may also reflect positions opening on both sides, so it does not prove net inflows into longs.
The settled funding rate was −0.077797% at 08:00 and −0.141298% at 12:00, a further decrease of 0.063501 percentage points. A negative rate means that, for that settlement, shorts paid longs; it may reflect hedging or a divergence in directional views. It does not prove that a short squeeze has occurred, nor does it guarantee the next settlement will be the same.
III. The next test is whether support holds
I’ll first watch to see whether the next completed hourly candle can hold above 0.4731, then whether the price can close above 0.4799 with volume continuing to follow through. If it falls back below 0.4731, confidence in this move above the level should be reduced; if it drops further below the final-hour low of 0.4526, the assessment of post-breakout support would weaken considerably. These are the relevant levels in the current structure and should be reassessed as prices change.
As of this check, the latest report listed on Meteora’s official IR page is still the August monthly report, published on September 15; current business metrics are not available. I haven’t found a single fundamental catalyst that adequately explains this rally, so I won’t use old listing news to imply causation. Data is from Binance futures candlesticks, open interest, and settled funding rates; the accompanying chart contains only completed hourly candles. #MET
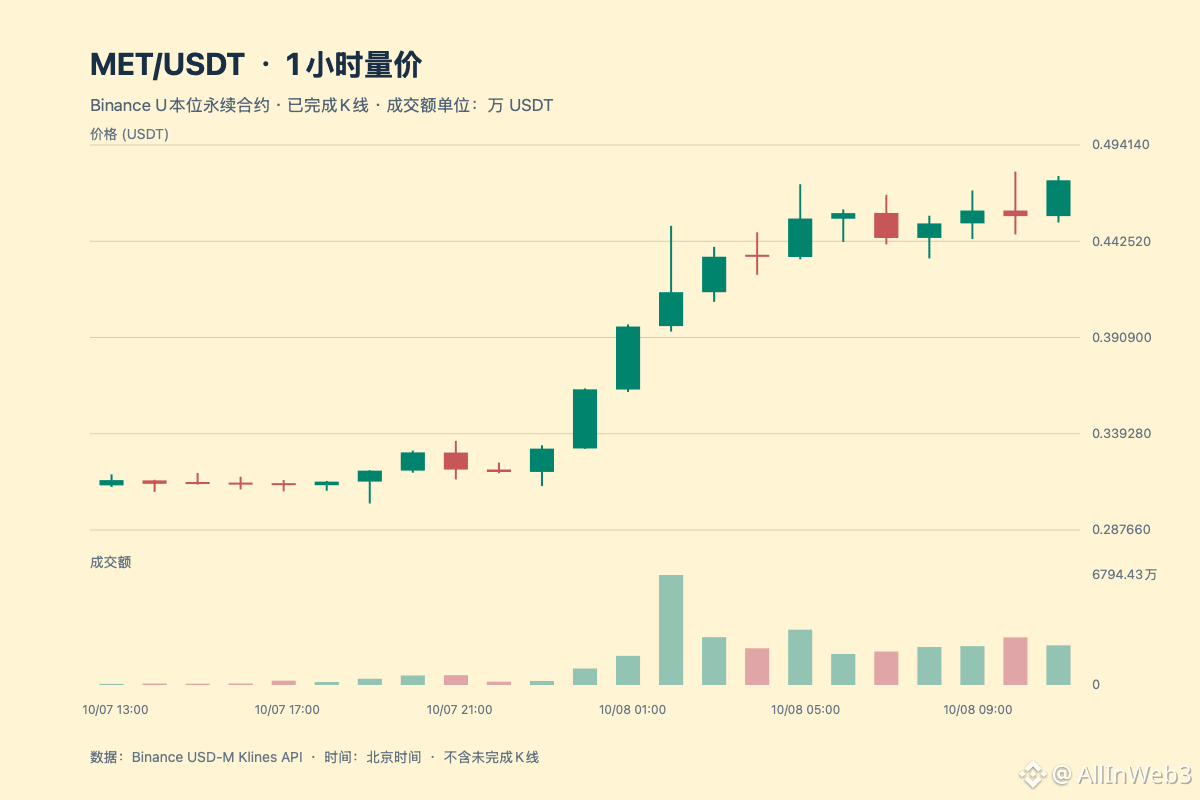
1
182
·
--
#币安推出BinanceIntelligence The trending topic has renewed interest in AI products, but I’m more concerned with the terms attached to the AI Pro name at different stages. Here’s the conclusion first: the March Beta, June upgrade, and October new-workflow proposal cannot be combined into a single current pricing table. The fact that old official announcements are still accessible does not mean their terms automatically apply to newer versions.
The previous article introduced three product lines: Agent OS, Binance AI, and AI Pro. This time, I’m adding details on the Beta timeline and how usage limits were defined—based entirely on Binance’s original announcements. These are historical documents for comparison, not an announcement that anything new is launching today.
The first milestone is the Ai Pro Beta announcement, published on March 24 and revised on April 13. It stated that the service would become available from March 25 at 07:00 UTC, or 15:00 Beijing time, with initial access gradually rolled out to a limited number of users. The monthly fee, monthly usage limits, and trial terms in the announcement were specific to that version. So when you see someone citing a promotional price from the old Beta, the first question should be which phase and access channel it applied to. You cannot infer the price for all users in the current round from an old page.
The second milestone is the June 2 upgrade announcement. Binance added features such as strategy templates, document analysis, and model switching, while continuing to describe usage limits that reset monthly, with unused limits not carrying over. This shows that AI Pro already had a product history and upgrade records before October. It corrects the interpretation that “AI Pro first appeared in October,” but it does not prove that every upgraded feature was available in every region or to every account. Nor can improved trading performance be inferred from the addition of features.
The third milestone is the October 5 livestream recap. Binance introduced building workflows with natural language and simulating them before running them. It also said that a free version with usage limits refreshed weekly was planned, with paid subscriptions to follow. The timeline was still framed as “in the coming weeks.” These terms belong to a different document and a different stage from the old Beta’s monthly limits. The shared name alone does not tell us how users will migrate, whether old plans will be converted, or what future pricing will be. Those questions require the actual rules for the relevant version; they cannot be answered by piecing together two announcements.
My assessment has two parts. The product is evolving from research assistance toward generating and executing workflows. But usage terms need to be checked individually, including account availability, usage-limit reset cycles, and activation permissions. Automatic execution does not mean execution without authorization: the October recap explicitly required review before activation and limited use to user-authorized subaccounts, budgets, and risk parameters. Permission controls also cannot guarantee that a strategy will be effective.
As of 11:35 Beijing time on October 8, this review has not treated a roadmap as proof of global availability. The most informative next step will be the formal release notes: which users are covered, when free usage limits refresh, how paid terms are defined, and how existing Beta users will transition. Confirming those details is more useful for judging what has actually changed than repeating that “the AI product has launched.”
#币安推出BinanceIntelligence The trending topic has renewed interest in AI products, but I’m more concerned with the terms attached to the AI Pro name at different stages. Here’s the conclusion first: the March Beta, June upgrade, and October new-workflow proposal cannot be combined into a single current pricing table. The fact that old official announcements are still accessible does not mean their terms automatically apply to newer versions.
The previous article introduced three product lines: Agent OS, Binance AI, and AI Pro. This time, I’m adding details on the Beta timeline and how usage limits were defined—based entirely on Binance’s original announcements. These are historical documents for comparison, not an announcement that anything new is launching today.
The first milestone is the Ai Pro Beta announcement, published on March 24 and revised on April 13. It stated that the service would become available from March 25 at 07:00 UTC, or 15:00 Beijing time, with initial access gradually rolled out to a limited number of users. The monthly fee, monthly usage limits, and trial terms in the announcement were specific to that version. So when you see someone citing a promotional price from the old Beta, the first question should be which phase and access channel it applied to. You cannot infer the price for all users in the current round from an old page.
The second milestone is the June 2 upgrade announcement. Binance added features such as strategy templates, document analysis, and model switching, while continuing to describe usage limits that reset monthly, with unused limits not carrying over. This shows that AI Pro already had a product history and upgrade records before October. It corrects the interpretation that “AI Pro first appeared in October,” but it does not prove that every upgraded feature was available in every region or to every account. Nor can improved trading performance be inferred from the addition of features.
The third milestone is the October 5 livestream recap. Binance introduced building workflows with natural language and simulating them before running them. It also said that a free version with usage limits refreshed weekly was planned, with paid subscriptions to follow. The timeline was still framed as “in the coming weeks.” These terms belong to a different document and a different stage from the old Beta’s monthly limits. The shared name alone does not tell us how users will migrate, whether old plans will be converted, or what future pricing will be. Those questions require the actual rules for the relevant version; they cannot be answered by piecing together two announcements.
My assessment has two parts. The product is evolving from research assistance toward generating and executing workflows. But usage terms need to be checked individually, including account availability, usage-limit reset cycles, and activation permissions. Automatic execution does not mean execution without authorization: the October recap explicitly required review before activation and limited use to user-authorized subaccounts, budgets, and risk parameters. Permission controls also cannot guarantee that a strategy will be effective.
As of 11:35 Beijing time on October 8, this review has not treated a roadmap as proof of global availability. The most informative next step will be the formal release notes: which users are covered, when free usage limits refresh, how paid terms are defined, and how existing Beta users will transition. Confirming those details is more useful for judging what has actually changed than repeating that “the AI product has launched.”
The previous article introduced three product lines: Agent OS, Binance AI, and AI Pro. This time, I’m adding details on the Beta timeline and how usage limits were defined—based entirely on Binance’s original announcements. These are historical documents for comparison, not an announcement that anything new is launching today.
The first milestone is the Ai Pro Beta announcement, published on March 24 and revised on April 13. It stated that the service would become available from March 25 at 07:00 UTC, or 15:00 Beijing time, with initial access gradually rolled out to a limited number of users. The monthly fee, monthly usage limits, and trial terms in the announcement were specific to that version. So when you see someone citing a promotional price from the old Beta, the first question should be which phase and access channel it applied to. You cannot infer the price for all users in the current round from an old page.
The second milestone is the June 2 upgrade announcement. Binance added features such as strategy templates, document analysis, and model switching, while continuing to describe usage limits that reset monthly, with unused limits not carrying over. This shows that AI Pro already had a product history and upgrade records before October. It corrects the interpretation that “AI Pro first appeared in October,” but it does not prove that every upgraded feature was available in every region or to every account. Nor can improved trading performance be inferred from the addition of features.
The third milestone is the October 5 livestream recap. Binance introduced building workflows with natural language and simulating them before running them. It also said that a free version with usage limits refreshed weekly was planned, with paid subscriptions to follow. The timeline was still framed as “in the coming weeks.” These terms belong to a different document and a different stage from the old Beta’s monthly limits. The shared name alone does not tell us how users will migrate, whether old plans will be converted, or what future pricing will be. Those questions require the actual rules for the relevant version; they cannot be answered by piecing together two announcements.
My assessment has two parts. The product is evolving from research assistance toward generating and executing workflows. But usage terms need to be checked individually, including account availability, usage-limit reset cycles, and activation permissions. Automatic execution does not mean execution without authorization: the October recap explicitly required review before activation and limited use to user-authorized subaccounts, budgets, and risk parameters. Permission controls also cannot guarantee that a strategy will be effective.
As of 11:35 Beijing time on October 8, this review has not treated a roadmap as proof of global availability. The most informative next step will be the formal release notes: which users are covered, when free usage limits refresh, how paid terms are defined, and how existing Beta users will transition. Confirming those details is more useful for judging what has actually changed than repeating that “the AI product has launched.”

1
50
·
--
$W pulled back after breaking above the previous high; the current bias is to wait and see. Trading volume and open interest are giving two different signals.
At 11:09:59 Beijing time on October 8, a comprehensive review was completed of all 523 USDT-margined perpetual contracts on Binance that were trading normally. W was still ranked second, with a rolling 24-hour gain of 21.024%, a price of 0.017367, and trading volume of 44.89 million USDT. MET topped the initial scan for two consecutive rounds; this round, the research focus shifted to W. The price has pulled back from 0.017890 at 11:01, so the strong momentum seen just after its surge should no longer be assumed.
First, let's break down the timeline. In the completed 4-hour candle from 04:00 to 08:00, W rose from 0.014323 to 0.016126, a gain of 12.59%. Trading volume climbed to 13.98 million USDT from 09:00 to 10:00, but the candle closed back at 0.016911. The following candle, from 10:00 to 11:00, rose 5.76% and closed at 0.017874, reaching a high of 0.018000—above the previous hour's high of 0.017580. The hourly candle that began at 11:00 and the 4-hour candle from 08:00 to 12:00 are not yet complete, so they cannot be used to confirm a breakout prematurely.
The most notable feature here is the divergence between volume and price. Trading volume in the later hour was 8.34 million USDT, 40.3% lower than in the previous hour, yet the price closed higher. This could indicate easing selling pressure, or simply a temporarily thinner order book. A decline in volume alone is not enough to conclude that capital is flowing out, let alone to deem the breakout reliable. If a subsequently completed hourly candle can hold above 0.017580, then we can watch for sustained trading above 0.018000. An intraday spike above the high alone is still insufficient evidence.
Now let's look at leveraged participation. From 10:00 to 11:00, open contracts rose from 544.8 million W to 586.5 million W, an increase of 7.64%. They have risen 42.55% cumulatively since 07:00. This is an expansion in outstanding contracts, not an equivalent inflow of funds, and it does not mean that all the new positions are bullish. The funding rate settled at 08:00 was +0.005%, which only indicates that longs paid a fee during that settlement period; it does not prove a short squeeze or extreme crowding.
W is Wormhole's governance asset. W2.0, announced on the official website on September 17, 2025, and the adjusted release schedule for some allocation categories are existing background factors. This review found no contemporaneous new announcement that could explain this rally. Therefore, this article focuses on verifiable changes in volume and open interest, without forcing a catalyst to explain the rise.
My observation criteria: Before publication, the price had already fallen below 0.017580, indicating that intraday support had not yet held. However, the current hourly candle has not closed, so it is too early to declare the pattern invalid. If the price moves back above that level and confirms it with an hourly close, then 0.018000 will remain in focus. If the hourly candle closes below that level, especially if 0.016791 is breached again, the recovery will need to be reassessed. Open-interest expansion and a pullback from the high are occurring at the same time, so the move's staying power still needs to be confirmed by trading volume. This is market commentary, not a recommendation to buy or sell.
#Wormhole #W #Crypto Market
$W pulled back after breaking above the previous high; the current bias is to wait and see. Trading volume and open interest are giving two different signals.
At 11:09:59 Beijing time on October 8, a comprehensive review was completed of all 523 USDT-margined perpetual contracts on Binance that were trading normally. W was still ranked second, with a rolling 24-hour gain of 21.024%, a price of 0.017367, and trading volume of 44.89 million USDT. MET topped the initial scan for two consecutive rounds; this round, the research focus shifted to W. The price has pulled back from 0.017890 at 11:01, so the strong momentum seen just after its surge should no longer be assumed.
First, let's break down the timeline. In the completed 4-hour candle from 04:00 to 08:00, W rose from 0.014323 to 0.016126, a gain of 12.59%. Trading volume climbed to 13.98 million USDT from 09:00 to 10:00, but the candle closed back at 0.016911. The following candle, from 10:00 to 11:00, rose 5.76% and closed at 0.017874, reaching a high of 0.018000—above the previous hour's high of 0.017580. The hourly candle that began at 11:00 and the 4-hour candle from 08:00 to 12:00 are not yet complete, so they cannot be used to confirm a breakout prematurely.
The most notable feature here is the divergence between volume and price. Trading volume in the later hour was 8.34 million USDT, 40.3% lower than in the previous hour, yet the price closed higher. This could indicate easing selling pressure, or simply a temporarily thinner order book. A decline in volume alone is not enough to conclude that capital is flowing out, let alone to deem the breakout reliable. If a subsequently completed hourly candle can hold above 0.017580, then we can watch for sustained trading above 0.018000. An intraday spike above the high alone is still insufficient evidence.
Now let's look at leveraged participation. From 10:00 to 11:00, open contracts rose from 544.8 million W to 586.5 million W, an increase of 7.64%. They have risen 42.55% cumulatively since 07:00. This is an expansion in outstanding contracts, not an equivalent inflow of funds, and it does not mean that all the new positions are bullish. The funding rate settled at 08:00 was +0.005%, which only indicates that longs paid a fee during that settlement period; it does not prove a short squeeze or extreme crowding.
W is Wormhole's governance asset. W2.0, announced on the official website on September 17, 2025, and the adjusted release schedule for some allocation categories are existing background factors. This review found no contemporaneous new announcement that could explain this rally. Therefore, this article focuses on verifiable changes in volume and open interest, without forcing a catalyst to explain the rise.
My observation criteria: Before publication, the price had already fallen below 0.017580, indicating that intraday support had not yet held. However, the current hourly candle has not closed, so it is too early to declare the pattern invalid. If the price moves back above that level and confirms it with an hourly close, then 0.018000 will remain in focus. If the hourly candle closes below that level, especially if 0.016791 is breached again, the recovery will need to be reassessed. Open-interest expansion and a pullback from the high are occurring at the same time, so the move's staying power still needs to be confirmed by trading volume. This is market commentary, not a recommendation to buy or sell.
#Wormhole #W #Crypto Market
At 11:09:59 Beijing time on October 8, a comprehensive review was completed of all 523 USDT-margined perpetual contracts on Binance that were trading normally. W was still ranked second, with a rolling 24-hour gain of 21.024%, a price of 0.017367, and trading volume of 44.89 million USDT. MET topped the initial scan for two consecutive rounds; this round, the research focus shifted to W. The price has pulled back from 0.017890 at 11:01, so the strong momentum seen just after its surge should no longer be assumed.
First, let's break down the timeline. In the completed 4-hour candle from 04:00 to 08:00, W rose from 0.014323 to 0.016126, a gain of 12.59%. Trading volume climbed to 13.98 million USDT from 09:00 to 10:00, but the candle closed back at 0.016911. The following candle, from 10:00 to 11:00, rose 5.76% and closed at 0.017874, reaching a high of 0.018000—above the previous hour's high of 0.017580. The hourly candle that began at 11:00 and the 4-hour candle from 08:00 to 12:00 are not yet complete, so they cannot be used to confirm a breakout prematurely.
The most notable feature here is the divergence between volume and price. Trading volume in the later hour was 8.34 million USDT, 40.3% lower than in the previous hour, yet the price closed higher. This could indicate easing selling pressure, or simply a temporarily thinner order book. A decline in volume alone is not enough to conclude that capital is flowing out, let alone to deem the breakout reliable. If a subsequently completed hourly candle can hold above 0.017580, then we can watch for sustained trading above 0.018000. An intraday spike above the high alone is still insufficient evidence.
Now let's look at leveraged participation. From 10:00 to 11:00, open contracts rose from 544.8 million W to 586.5 million W, an increase of 7.64%. They have risen 42.55% cumulatively since 07:00. This is an expansion in outstanding contracts, not an equivalent inflow of funds, and it does not mean that all the new positions are bullish. The funding rate settled at 08:00 was +0.005%, which only indicates that longs paid a fee during that settlement period; it does not prove a short squeeze or extreme crowding.
W is Wormhole's governance asset. W2.0, announced on the official website on September 17, 2025, and the adjusted release schedule for some allocation categories are existing background factors. This review found no contemporaneous new announcement that could explain this rally. Therefore, this article focuses on verifiable changes in volume and open interest, without forcing a catalyst to explain the rise.
My observation criteria: Before publication, the price had already fallen below 0.017580, indicating that intraday support had not yet held. However, the current hourly candle has not closed, so it is too early to declare the pattern invalid. If the price moves back above that level and confirms it with an hourly close, then 0.018000 will remain in focus. If the hourly candle closes below that level, especially if 0.016791 is breached again, the recovery will need to be reassessed. Open-interest expansion and a pullback from the high are occurring at the same time, so the move's staying power still needs to be confirmed by trading volume. This is market commentary, not a recommendation to buy or sell.
#Wormhole #W #Crypto Market
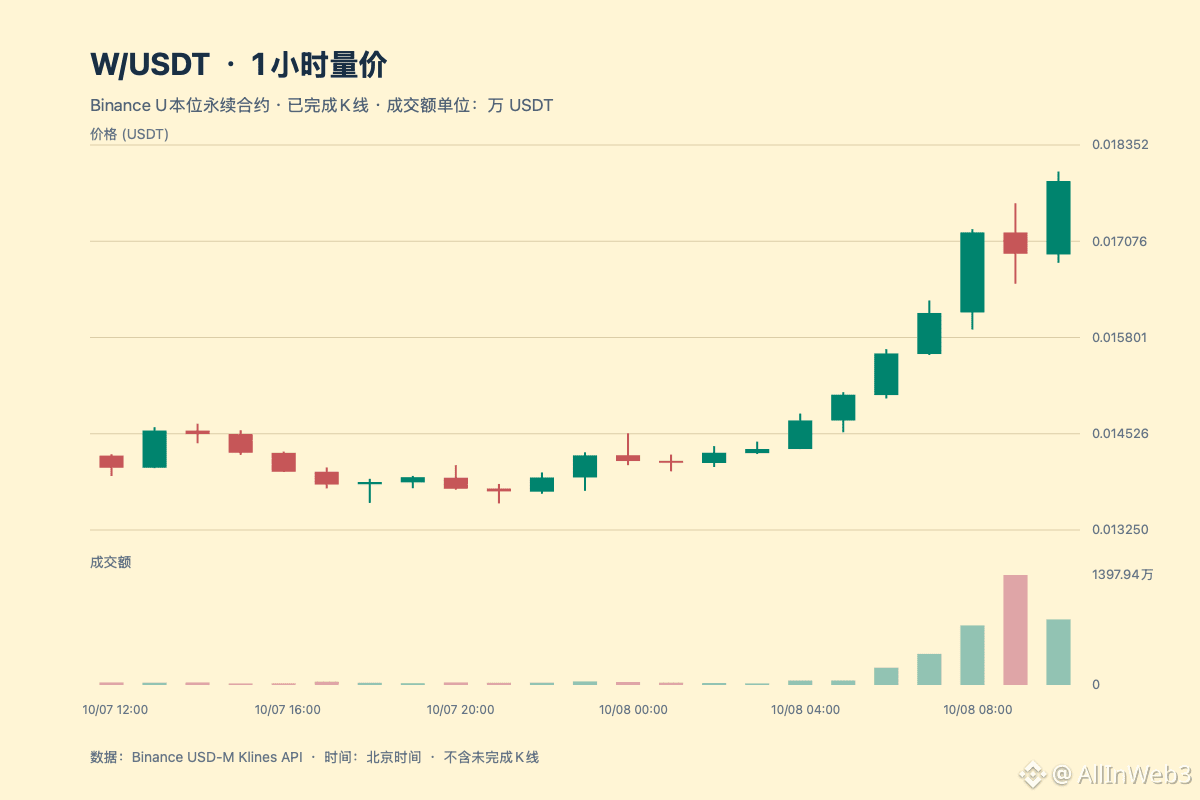
1
198
·
--
$GTC: Cautious in the short term; wait and see rather than chase prices higher. The 24-hour gain is still above 20%, but the hourly chart has seen consecutive pullbacks. In the full scan at 10:00, GTC ranked 2nd among 523 Binance USDT perpetual contracts, up +23.089%. In the rescan at 10:05, it was still up +24.010%, but had fallen to 3rd place, with AIA rising to 2nd. Rank and percentage gain are not the same thing; a still-positive 24-hour return should not be misread as evidence that short-term momentum is still accelerating.
The new structure is visible in two hourly closes: from 08:00 to 09:00, the price surged to a high of 0.19778 before closing at 0.18537; from 09:00 to 10:00, it closed at 0.18333, below the previous hour’s close. Quote volume in the latter hour was about $5.22 million, around 52% less than the roughly $10.94 million in the previous hour. This indicates that trading activity cooled during this window while the price continued to fall; the decline in trading volume alone cannot prove that selling pressure has ended or indicate net capital outflows.
The futures market offers only limited corroboration: open interest rose by about 1.43% from 08:00 to 09:00, but rising OI cannot distinguish new longs from new shorts. The most recent visible settled funding rate sample was -0.107668% at 08:00. A price pullback, rising OI, and a negative funding rate occurring together do not, by themselves, justify concluding that a short squeeze is underway or that longs are stepping in to buy.
The levels to watch have also been updated: 0.19778 was the spike high at 08:00; 0.18537 was the close of the first pullback hour, and 0.18888 was the high of the following hour. Only if a subsequent complete hourly candle recovers these levels with supporting volume would that indicate some repair of the pullback structure. If the close falls below the 09:00 low of 0.18108, the short-term pullback is still continuing. The hourly candle after 10:00 and the four-hour window starting at 08:00 are both incomplete, so they should not be treated as confirmations yet.
I found no verifiable project announcement synchronized with these two hourly candles. The GTC quorum adjustment on the Gitcoin governance forum is still a proposal and should not be treated as an implemented catalyst. The divergence worth watching now is the simultaneous occurrence of price retracement, cooling trading activity, and rising OI. This is market commentary, not investment advice.
$GTC : Cautious in the short term; wait and see rather than chase prices higher. The 24-hour gain is still above 20%, but the hourly chart has seen consecutive pullbacks. In the full scan at 10:00, GTC ranked 2nd among 523 Binance USDT perpetual contracts, up +23.089%. In the rescan at 10:05, it was still up +24.010%, but had fallen to 3rd place, with AIA rising to 2nd. Rank and percentage gain are not the same thing; a still-positive 24-hour return should not be misread as evidence that short-term momentum is still accelerating.
The new structure is visible in two hourly closes: from 08:00 to 09:00, the price surged to a high of 0.19778 before closing at 0.18537; from 09:00 to 10:00, it closed at 0.18333, below the previous hour’s close. Quote volume in the latter hour was about $5.22 million, around 52% less than the roughly $10.94 million in the previous hour. This indicates that trading activity cooled during this window while the price continued to fall; the decline in trading volume alone cannot prove that selling pressure has ended or indicate net capital outflows.
The futures market offers only limited corroboration: open interest rose by about 1.43% from 08:00 to 09:00, but rising OI cannot distinguish new longs from new shorts. The most recent visible settled funding rate sample was -0.107668% at 08:00. A price pullback, rising OI, and a negative funding rate occurring together do not, by themselves, justify concluding that a short squeeze is underway or that longs are stepping in to buy.
The levels to watch have also been updated: 0.19778 was the spike high at 08:00; 0.18537 was the close of the first pullback hour, and 0.18888 was the high of the following hour. Only if a subsequent complete hourly candle recovers these levels with supporting volume would that indicate some repair of the pullback structure. If the close falls below the 09:00 low of 0.18108, the short-term pullback is still continuing. The hourly candle after 10:00 and the four-hour window starting at 08:00 are both incomplete, so they should not be treated as confirmations yet.
I found no verifiable project announcement synchronized with these two hourly candles. The GTC quorum adjustment on the Gitcoin governance forum is still a proposal and should not be treated as an implemented catalyst. The divergence worth watching now is the simultaneous occurrence of price retracement, cooling trading activity, and rising OI. This is market commentary, not investment advice.
The new structure is visible in two hourly closes: from 08:00 to 09:00, the price surged to a high of 0.19778 before closing at 0.18537; from 09:00 to 10:00, it closed at 0.18333, below the previous hour’s close. Quote volume in the latter hour was about $5.22 million, around 52% less than the roughly $10.94 million in the previous hour. This indicates that trading activity cooled during this window while the price continued to fall; the decline in trading volume alone cannot prove that selling pressure has ended or indicate net capital outflows.
The futures market offers only limited corroboration: open interest rose by about 1.43% from 08:00 to 09:00, but rising OI cannot distinguish new longs from new shorts. The most recent visible settled funding rate sample was -0.107668% at 08:00. A price pullback, rising OI, and a negative funding rate occurring together do not, by themselves, justify concluding that a short squeeze is underway or that longs are stepping in to buy.
The levels to watch have also been updated: 0.19778 was the spike high at 08:00; 0.18537 was the close of the first pullback hour, and 0.18888 was the high of the following hour. Only if a subsequent complete hourly candle recovers these levels with supporting volume would that indicate some repair of the pullback structure. If the close falls below the 09:00 low of 0.18108, the short-term pullback is still continuing. The hourly candle after 10:00 and the four-hour window starting at 08:00 are both incomplete, so they should not be treated as confirmations yet.
I found no verifiable project announcement synchronized with these two hourly candles. The GTC quorum adjustment on the Gitcoin governance forum is still a proposal and should not be treated as an implemented catalyst. The divergence worth watching now is the simultaneous occurrence of price retracement, cooling trading activity, and rising OI. This is market commentary, not investment advice.
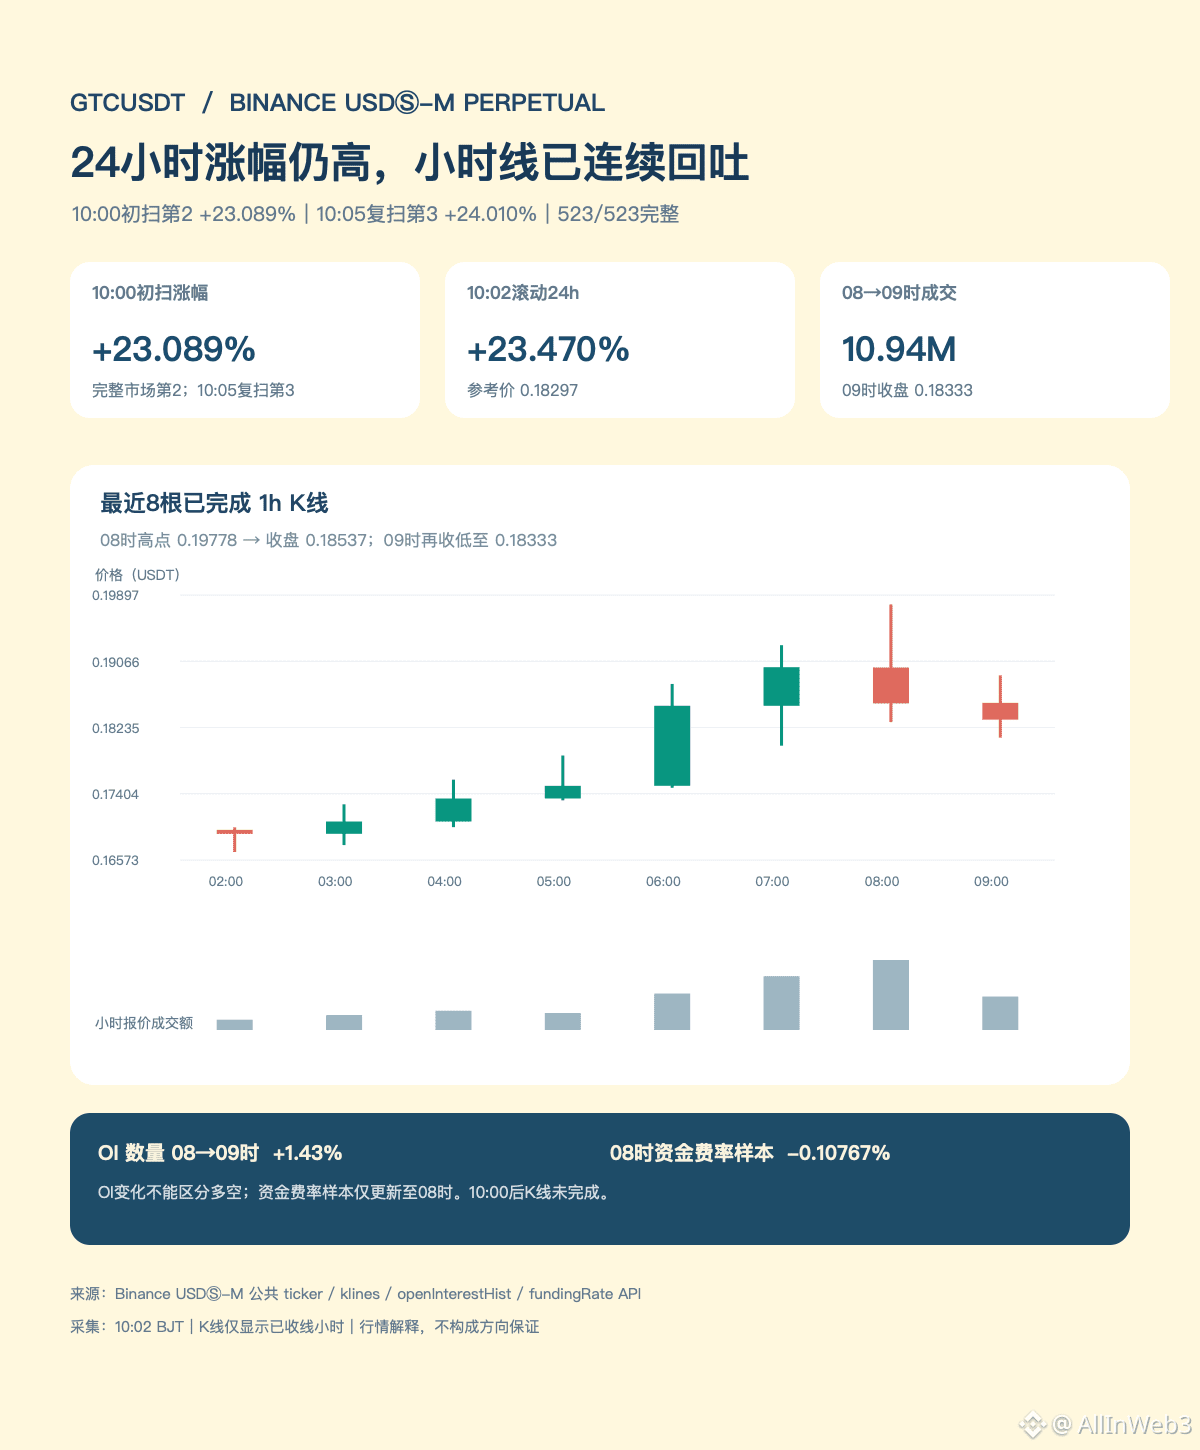
1
202
·
--
【Did the record high last only one day? The U.S. stock market trending list needs to add “the next trading day”】Binance Square’s No. 5 spot still reads “S&P 500 and Nasdaq hit all-time highs,” but as of 09:35 Beijing time on October 8, the headline was already missing a crucial second half: after both indexes set closing records on Tuesday, they retreated from their highs on Wednesday. According to the Associated Press’s closing data, the S&P 500 fell from 7,818.93 on Tuesday to 7,801.77 on Wednesday, down about 0.2%; the Nasdaq Composite closed Wednesday at 27,538.69, also down about 0.2%. Nasdaq’s official index page likewise shows a Wednesday closing value of 27,538.69.
This does not mean the “record was overturned”: the all-time high remains an all-time high. What changed was the direction of the latest trading session. Treating “hit a record” as a signal of continued gains overlooks the fact that prices had already weakened by the next trading day. Conversely, a one-day pullback of about 0.2% does not prove a trend reversal; it only shows that the short-term follow-through after the record close did not materialize. The next session will show whether the indexes climb back toward their highs or their declines deepen.
Wednesday’s market coverage cited rising bond yields, oil prices, and inflation concerns as factors weighing on risk assets. These are the day’s backdrop, but they are not enough on their own to prove that any one factor caused the indexes to fall. A one-day move in stock indexes also cannot be directly extrapolated to the direction of crypto assets. To discuss cross-market transmission, one would also need to track actual moves in Treasury yields, the dollar, and BTC—not infer causation from a single stock-market headline.
Timeline: On Tuesday, October 6, the S&P closed at 7,818.93, a record; on Wednesday, October 7, it fell back to 7,801.77, while the Nasdaq closed at 27,538.69. Here, “record” describes the previous trading day; it does not prove that the market is still accelerating. Sources: Nasdaq Composite official historical data page; AP’s same-day review of index closes.
Headlines like this should be checked against closing data: touching a high intraday and setting a record at the close are two different measures, and rising buzz is no substitute for price confirmation. For those watching cross-market moves, an equity-index pullback is just one facet of risk appetite. To discuss its correlation with BTC, one must also compare yields, the dollar, and crypto trading volume over the same period, rather than treating events that happened one after another as cause and effect.
【Did the record high last only one day? The U.S. stock market trending list needs to add “the next trading day”】Binance Square’s No. 5 spot still reads “S&P 500 and Nasdaq hit all-time highs,” but as of 09:35 Beijing time on October 8, the headline was already missing a crucial second half: after both indexes set closing records on Tuesday, they retreated from their highs on Wednesday. According to the Associated Press’s closing data, the S&P 500 fell from 7,818.93 on Tuesday to 7,801.77 on Wednesday, down about 0.2%; the Nasdaq Composite closed Wednesday at 27,538.69, also down about 0.2%. Nasdaq’s official index page likewise shows a Wednesday closing value of 27,538.69.
This does not mean the “record was overturned”: the all-time high remains an all-time high. What changed was the direction of the latest trading session. Treating “hit a record” as a signal of continued gains overlooks the fact that prices had already weakened by the next trading day. Conversely, a one-day pullback of about 0.2% does not prove a trend reversal; it only shows that the short-term follow-through after the record close did not materialize. The next session will show whether the indexes climb back toward their highs or their declines deepen.
Wednesday’s market coverage cited rising bond yields, oil prices, and inflation concerns as factors weighing on risk assets. These are the day’s backdrop, but they are not enough on their own to prove that any one factor caused the indexes to fall. A one-day move in stock indexes also cannot be directly extrapolated to the direction of crypto assets. To discuss cross-market transmission, one would also need to track actual moves in Treasury yields, the dollar, and BTC—not infer causation from a single stock-market headline.
Timeline: On Tuesday, October 6, the S&P closed at 7,818.93, a record; on Wednesday, October 7, it fell back to 7,801.77, while the Nasdaq closed at 27,538.69. Here, “record” describes the previous trading day; it does not prove that the market is still accelerating. Sources: Nasdaq Composite official historical data page; AP’s same-day review of index closes.
Headlines like this should be checked against closing data: touching a high intraday and setting a record at the close are two different measures, and rising buzz is no substitute for price confirmation. For those watching cross-market moves, an equity-index pullback is just one facet of risk appetite. To discuss its correlation with BTC, one must also compare yields, the dollar, and crypto trading volume over the same period, rather than treating events that happened one after another as cause and effect.
This does not mean the “record was overturned”: the all-time high remains an all-time high. What changed was the direction of the latest trading session. Treating “hit a record” as a signal of continued gains overlooks the fact that prices had already weakened by the next trading day. Conversely, a one-day pullback of about 0.2% does not prove a trend reversal; it only shows that the short-term follow-through after the record close did not materialize. The next session will show whether the indexes climb back toward their highs or their declines deepen.
Wednesday’s market coverage cited rising bond yields, oil prices, and inflation concerns as factors weighing on risk assets. These are the day’s backdrop, but they are not enough on their own to prove that any one factor caused the indexes to fall. A one-day move in stock indexes also cannot be directly extrapolated to the direction of crypto assets. To discuss cross-market transmission, one would also need to track actual moves in Treasury yields, the dollar, and BTC—not infer causation from a single stock-market headline.
Timeline: On Tuesday, October 6, the S&P closed at 7,818.93, a record; on Wednesday, October 7, it fell back to 7,801.77, while the Nasdaq closed at 27,538.69. Here, “record” describes the previous trading day; it does not prove that the market is still accelerating. Sources: Nasdaq Composite official historical data page; AP’s same-day review of index closes.
Headlines like this should be checked against closing data: touching a high intraday and setting a record at the close are two different measures, and rising buzz is no substitute for price confirmation. For those watching cross-market moves, an equity-index pullback is just one facet of risk appetite. To discuss its correlation with BTC, one must also compare yields, the dollar, and crypto trading volume over the same period, rather than treating events that happened one after another as cause and effect.
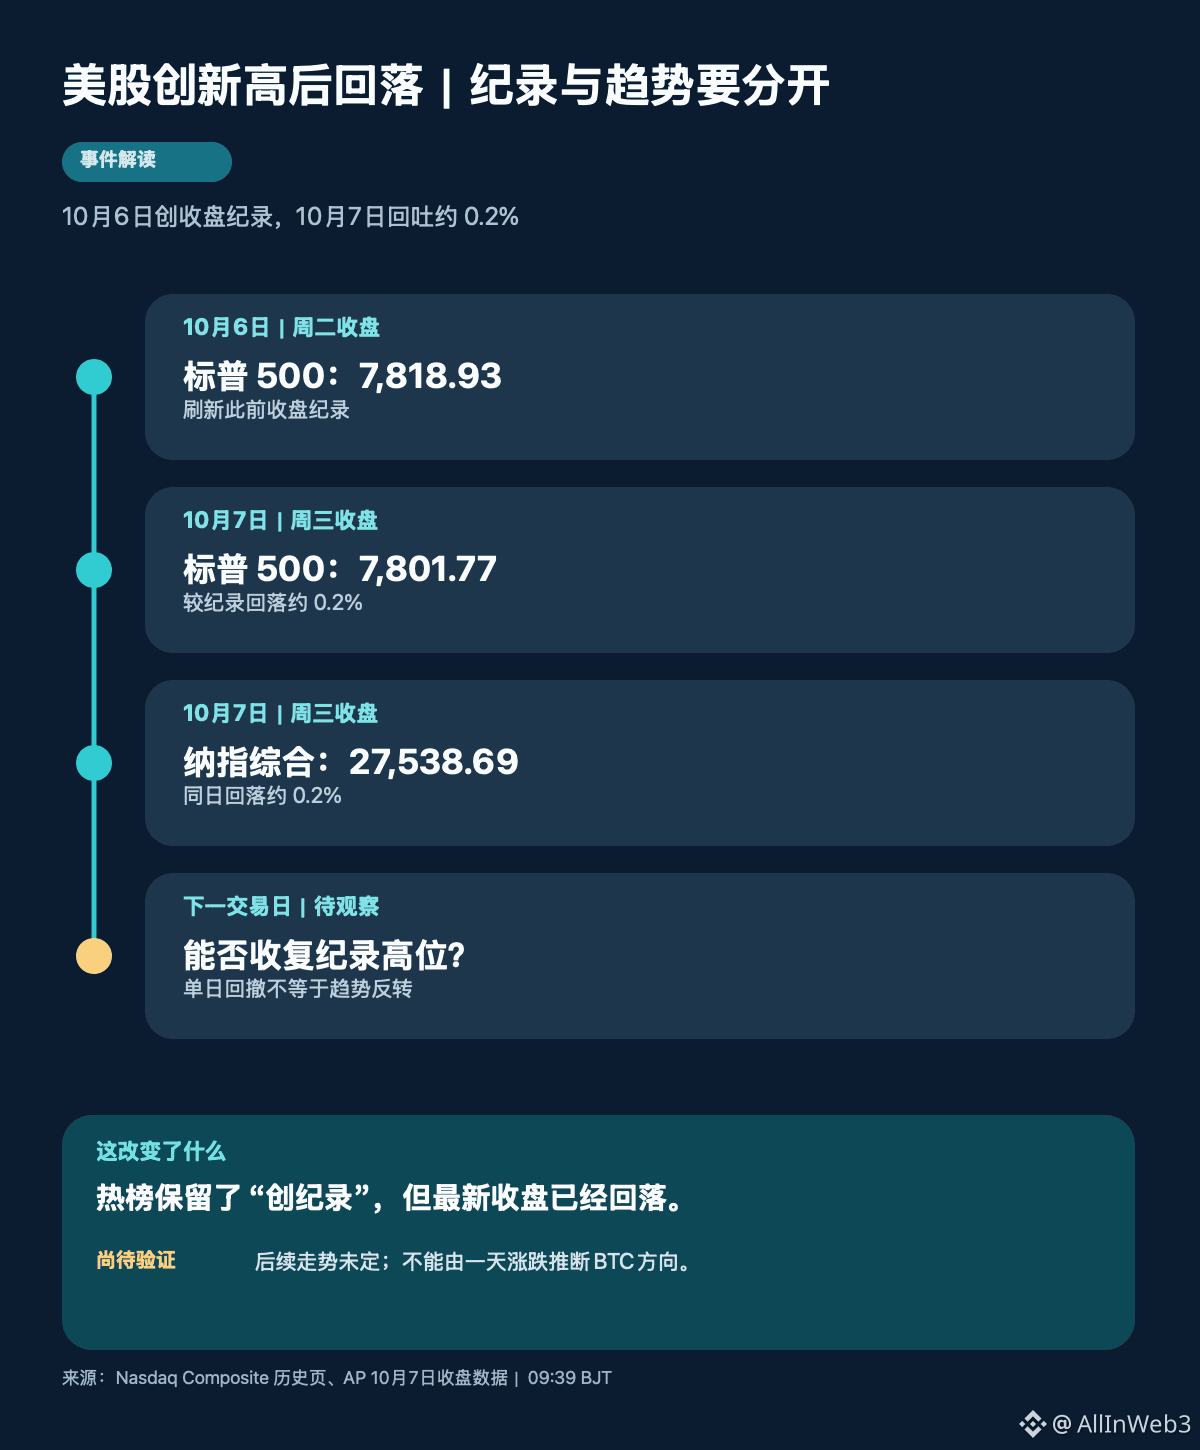
1
42
·
--
【New information in the FOMC minutes: Most participants thought another rate hike this year might still be appropriate】Binance Square’s trending topic summed up the minutes as “focused on an October pause,” but the minutes from the Fed’s September 15–16 meeting, just released, offer a more complex picture: at that meeting, all participants supported raising rates by 25 basis points. As for the path thereafter, most participants thought another increase later in the year might be appropriate. This was not an official commitment to “pause in October,” nor can it simply be read as meaning that participants had decided against further rate hikes.
First, let’s lay out the timeline. The September meeting’s policy decision was to raise the federal funds target range to 3.75%–4.00%, by unanimous vote. The document released at 02:00 Beijing time on October 8 records discussions from the September meeting; it is not the outcome of a vote at the October meeting. The minutes also state that each subsequent meeting would continue to be assessed on a meeting-by-meeting basis, in light of new data and its implications for the outlook and balance of risks. So “most thought another increase later in the year might be appropriate” reflects views at the time, not a fixed commitment; “focused on an October pause” is a trending-topic headline, not the minutes’ conclusion.
The genuinely new takeaway is that the minutes still describe inflation risks as tilted to the upside: participants noted that factors such as energy prices, AI investment, and potential tariffs could prolong cost pressures. At the same time, most viewed risks to the labor market as having moved toward balance. Taken together, the text presents a weighing of risks—not a simple “weaker employment means a pause” narrative. The minutes also review market expectations and policy discussions at the time, so data released after the meeting should not be mistaken for information participants already had. “Most participants” is the minutes’ summary of the discussion, not a publicly disclosed, person-by-person voting record; the wording “might be appropriate” retains an element of conditionality.
For crypto markets, any potential transmission would still run through rate expectations, Treasury yields, the dollar, and risk appetite. The phrase “another increase later in the year” alone is not enough to infer the direction of BTC. The market reaction after the minutes’ release should be observed separately from inflation and employment data released afterward.
Key dates: The meeting was held and the rate increase decided on September 15–16; the minutes were published at 02:00 Beijing time on October 8; the next FOMC meeting is scheduled for October 27–28. Sources: The Federal Reserve’s September meeting minutes and official meeting calendar.
【New information in the FOMC minutes: Most participants thought another rate hike this year might still be appropriate】Binance Square’s trending topic summed up the minutes as “focused on an October pause,” but the minutes from the Fed’s September 15–16 meeting, just released, offer a more complex picture: at that meeting, all participants supported raising rates by 25 basis points. As for the path thereafter, most participants thought another increase later in the year might be appropriate. This was not an official commitment to “pause in October,” nor can it simply be read as meaning that participants had decided against further rate hikes.
First, let’s lay out the timeline. The September meeting’s policy decision was to raise the federal funds target range to 3.75%–4.00%, by unanimous vote. The document released at 02:00 Beijing time on October 8 records discussions from the September meeting; it is not the outcome of a vote at the October meeting. The minutes also state that each subsequent meeting would continue to be assessed on a meeting-by-meeting basis, in light of new data and its implications for the outlook and balance of risks. So “most thought another increase later in the year might be appropriate” reflects views at the time, not a fixed commitment; “focused on an October pause” is a trending-topic headline, not the minutes’ conclusion.
The genuinely new takeaway is that the minutes still describe inflation risks as tilted to the upside: participants noted that factors such as energy prices, AI investment, and potential tariffs could prolong cost pressures. At the same time, most viewed risks to the labor market as having moved toward balance. Taken together, the text presents a weighing of risks—not a simple “weaker employment means a pause” narrative. The minutes also review market expectations and policy discussions at the time, so data released after the meeting should not be mistaken for information participants already had. “Most participants” is the minutes’ summary of the discussion, not a publicly disclosed, person-by-person voting record; the wording “might be appropriate” retains an element of conditionality.
For crypto markets, any potential transmission would still run through rate expectations, Treasury yields, the dollar, and risk appetite. The phrase “another increase later in the year” alone is not enough to infer the direction of BTC. The market reaction after the minutes’ release should be observed separately from inflation and employment data released afterward.
Key dates: The meeting was held and the rate increase decided on September 15–16; the minutes were published at 02:00 Beijing time on October 8; the next FOMC meeting is scheduled for October 27–28. Sources: The Federal Reserve’s September meeting minutes and official meeting calendar.
First, let’s lay out the timeline. The September meeting’s policy decision was to raise the federal funds target range to 3.75%–4.00%, by unanimous vote. The document released at 02:00 Beijing time on October 8 records discussions from the September meeting; it is not the outcome of a vote at the October meeting. The minutes also state that each subsequent meeting would continue to be assessed on a meeting-by-meeting basis, in light of new data and its implications for the outlook and balance of risks. So “most thought another increase later in the year might be appropriate” reflects views at the time, not a fixed commitment; “focused on an October pause” is a trending-topic headline, not the minutes’ conclusion.
The genuinely new takeaway is that the minutes still describe inflation risks as tilted to the upside: participants noted that factors such as energy prices, AI investment, and potential tariffs could prolong cost pressures. At the same time, most viewed risks to the labor market as having moved toward balance. Taken together, the text presents a weighing of risks—not a simple “weaker employment means a pause” narrative. The minutes also review market expectations and policy discussions at the time, so data released after the meeting should not be mistaken for information participants already had. “Most participants” is the minutes’ summary of the discussion, not a publicly disclosed, person-by-person voting record; the wording “might be appropriate” retains an element of conditionality.
For crypto markets, any potential transmission would still run through rate expectations, Treasury yields, the dollar, and risk appetite. The phrase “another increase later in the year” alone is not enough to infer the direction of BTC. The market reaction after the minutes’ release should be observed separately from inflation and employment data released afterward.
Key dates: The meeting was held and the rate increase decided on September 15–16; the minutes were published at 02:00 Beijing time on October 8; the next FOMC meeting is scheduled for October 27–28. Sources: The Federal Reserve’s September meeting minutes and official meeting calendar.
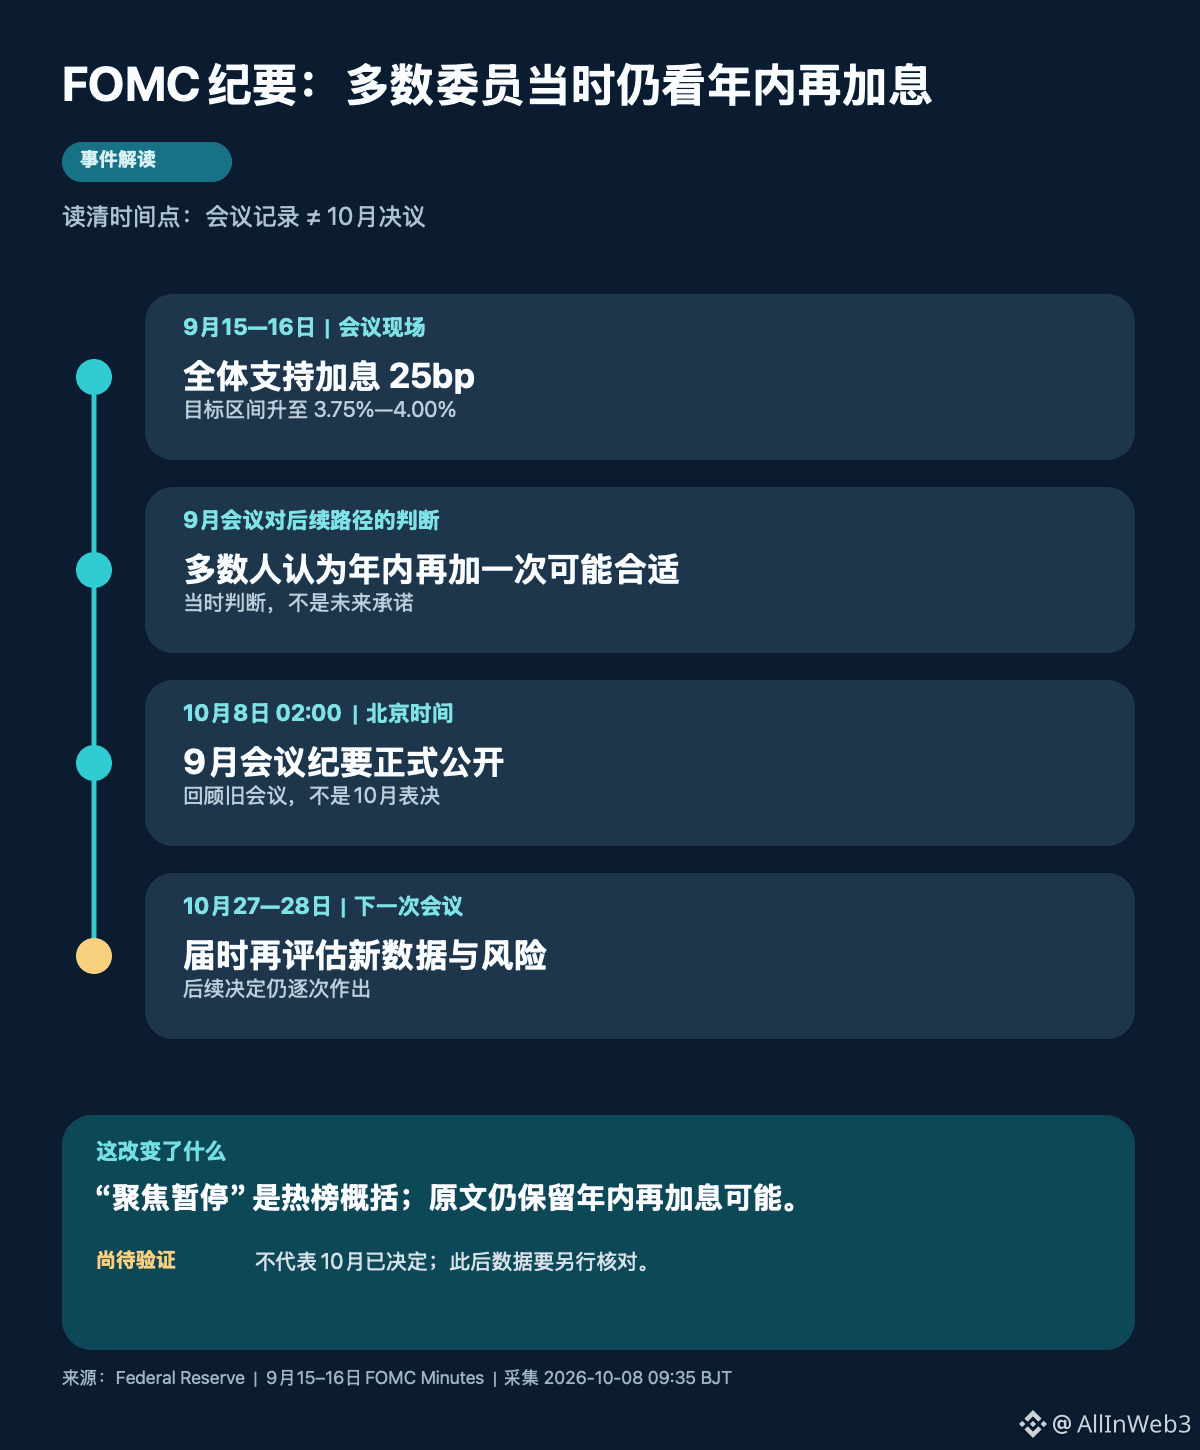
1
64
·
--
I’m staying on the sidelines with MET in the short term and won’t chase the rally. The 09:06 Beijing-time full Binance USD-M scan covered all 523/523 qualifying USDT perpetuals, with MET still ranked No. 1: up +39.170% over 24 hours, priced at 0.4491, with $279.4 million in quote volume. Compared with the 06:00 snapshot when the most recent MET post was published (+38.212%, 0.4561, and $216.2 million in volume), rolling volume is up about 29.3%, while the price is about 1.5% lower. This indicates a significant increase in trading activity during the observation window, not necessarily net buying or further price acceleration.
The price path is more worth watching than the gain itself: over the complete 4-hour period from 00:00 to 04:00, MET climbed from 0.3314 to close at 0.4342, up about 31%. It then gained only about 2.3% from 04:00 to 08:00, after touching 0.4731 intraperiod and pulling back. The most recent completed hourly candle, from 08:00 to 09:00, closed at 0.4521, up 1.76%, with $23.44 million in quote volume—about 0.97 times the average of the previous four complete hours. At 09:06, the current price is already about 0.7% below that hourly close. Volatility remains high after the sharp rally, but the latest completed hour shows no evidence of further acceleration in trading volume.
On the derivatives side, open interest increased from 30.099 million at 08:00 to 31.218 million at 09:00, or about +3.72%; this does not distinguish between longs and shorts. Funding-rate settlement samples changed from -0.5101% at 04:00 to -0.0778% at 08:00, a marked narrowing of the negative rate, but the rate alone cannot establish short covering or a trend reversal. The latest monthly report currently listed on Meteora’s official IR page is the August report, published on September 15. I found no official catalyst synchronized with this round of hourly volatility, and several dynamic protocol metrics on the page also have no displayed values, so the old report should not be treated as the reason for the rally.
Next, I’ll watch whether the recent hourly low near 0.4333 holds, and whether the price can reclaim the previous high of 0.4731 and sustain volume over a full hourly candle. A break below the former would weaken the consolidation structure; the latter would be more meaningful only if confirmed by consecutive hourly closes. These are conditions to monitor, not price targets or buy/sell advice.
I’m staying on the sidelines with MET in the short term and won’t chase the rally. The 09:06 Beijing-time full Binance USD-M scan covered all 523/523 qualifying USDT perpetuals, with MET still ranked No. 1: up +39.170% over 24 hours, priced at 0.4491, with $279.4 million in quote volume. Compared with the 06:00 snapshot when the most recent MET post was published (+38.212%, 0.4561, and $216.2 million in volume), rolling volume is up about 29.3%, while the price is about 1.5% lower. This indicates a significant increase in trading activity during the observation window, not necessarily net buying or further price acceleration.
The price path is more worth watching than the gain itself: over the complete 4-hour period from 00:00 to 04:00, MET climbed from 0.3314 to close at 0.4342, up about 31%. It then gained only about 2.3% from 04:00 to 08:00, after touching 0.4731 intraperiod and pulling back. The most recent completed hourly candle, from 08:00 to 09:00, closed at 0.4521, up 1.76%, with $23.44 million in quote volume—about 0.97 times the average of the previous four complete hours. At 09:06, the current price is already about 0.7% below that hourly close. Volatility remains high after the sharp rally, but the latest completed hour shows no evidence of further acceleration in trading volume.
On the derivatives side, open interest increased from 30.099 million at 08:00 to 31.218 million at 09:00, or about +3.72%; this does not distinguish between longs and shorts. Funding-rate settlement samples changed from -0.5101% at 04:00 to -0.0778% at 08:00, a marked narrowing of the negative rate, but the rate alone cannot establish short covering or a trend reversal. The latest monthly report currently listed on Meteora’s official IR page is the August report, published on September 15. I found no official catalyst synchronized with this round of hourly volatility, and several dynamic protocol metrics on the page also have no displayed values, so the old report should not be treated as the reason for the rally.
Next, I’ll watch whether the recent hourly low near 0.4333 holds, and whether the price can reclaim the previous high of 0.4731 and sustain volume over a full hourly candle. A break below the former would weaken the consolidation structure; the latter would be more meaningful only if confirmed by consecutive hourly closes. These are conditions to monitor, not price targets or buy/sell advice.
The price path is more worth watching than the gain itself: over the complete 4-hour period from 00:00 to 04:00, MET climbed from 0.3314 to close at 0.4342, up about 31%. It then gained only about 2.3% from 04:00 to 08:00, after touching 0.4731 intraperiod and pulling back. The most recent completed hourly candle, from 08:00 to 09:00, closed at 0.4521, up 1.76%, with $23.44 million in quote volume—about 0.97 times the average of the previous four complete hours. At 09:06, the current price is already about 0.7% below that hourly close. Volatility remains high after the sharp rally, but the latest completed hour shows no evidence of further acceleration in trading volume.
On the derivatives side, open interest increased from 30.099 million at 08:00 to 31.218 million at 09:00, or about +3.72%; this does not distinguish between longs and shorts. Funding-rate settlement samples changed from -0.5101% at 04:00 to -0.0778% at 08:00, a marked narrowing of the negative rate, but the rate alone cannot establish short covering or a trend reversal. The latest monthly report currently listed on Meteora’s official IR page is the August report, published on September 15. I found no official catalyst synchronized with this round of hourly volatility, and several dynamic protocol metrics on the page also have no displayed values, so the old report should not be treated as the reason for the rally.
Next, I’ll watch whether the recent hourly low near 0.4333 holds, and whether the price can reclaim the previous high of 0.4731 and sustain volume over a full hourly candle. A break below the former would weaken the consolidation structure; the latter would be more meaningful only if confirmed by consecutive hourly closes. These are conditions to monitor, not price targets or buy/sell advice.
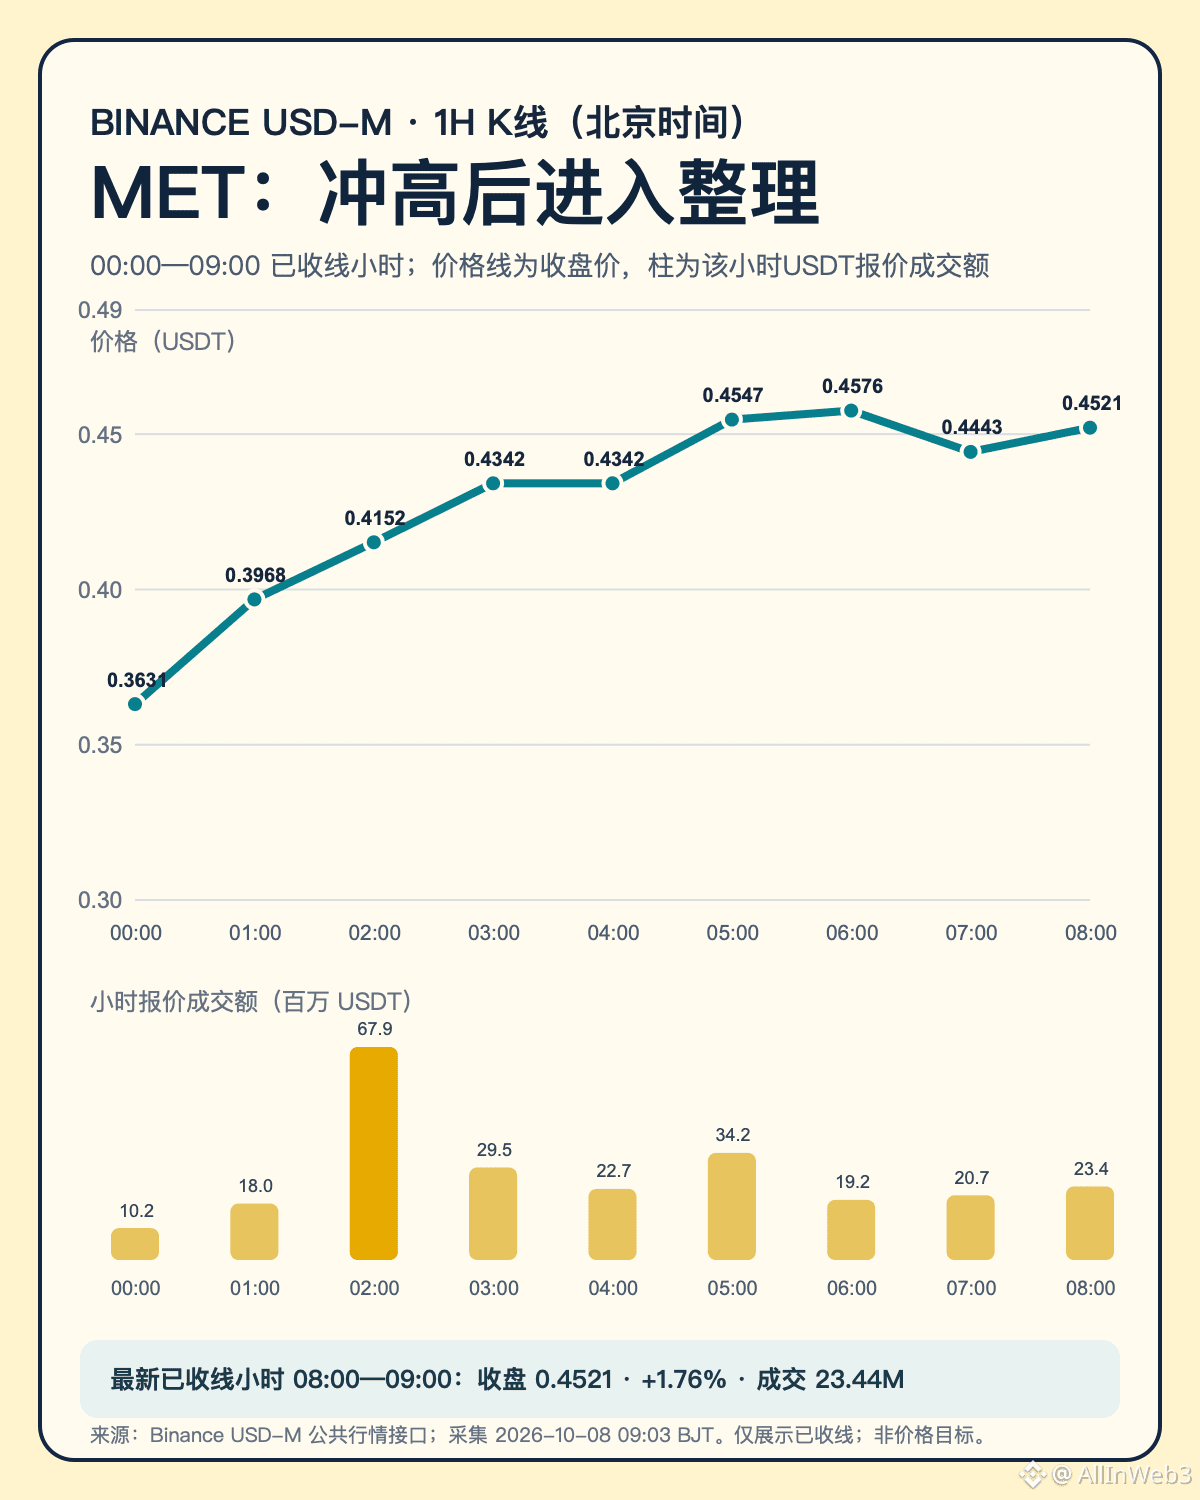
219
·
--
For GTC in the short term, I’d lean toward waiting and not chasing the rally. At 08:00 Beijing time, a scan of all Binance USDT perpetual contracts was complete at 523/523, with GTC ranking second and up +27.450%. A rescan before publication at 08:05 still ranked it second, up +29.165%, with a reference price of 0.19119. The single-contract ticker at 08:02 was 0.18997, with a rolling gain of +27.866%. The 07:03 ticker cited in the previous post was up +22.674% at 0.18368. By comparison, at 08:05 the rolling gain was 6.491 percentage points higher, and the current price was up about 4.09%; the two figures should not be conflated as “up 6% in this hour.”
The new structure is visible in completed candles: from 07:00 to 08:00, the price closed at 0.18991, up 2.62% from 0.18507, with a low of 0.18007 and a high of 0.19267 during the hour. Quote-volume turnover for that hour was $8.409 million, 2.46 times the average of $3.422 million across the previous four complete hours. From 04:00 to 08:00, the complete four-hour candle rose 11.35%, from 0.17055 to 0.18991. This looks more like a clear rebound accompanied by substantial volatility than a smooth, sustained climb; increased turnover only indicates more active trading and does not prove net capital inflows. The new four-hour candle that began at 08:00 has not closed, so it cannot yet be counted as confirmed.
The derivatives side also offers no one-way conclusion: OI quantity increased by about 0.94% from 07:00 to 08:01, a limited change that does not distinguish between longs and shorts. The funding-rate reading at 08:00 was -0.107668%; the global long/short ratio by account was about 1.0509, meaning account numbers tilted slightly long, but this does not reflect position weights. Negative funding, a slight long bias among accounts, and a price rebound occurred together, so it cannot simply be described as a “short squeeze.”
As for project news, an October 1 update from Gitcoin’s official account described Techne as a separate product direction and said the DAO and GTC would continue their existing roles. A Snapshot quorum proposal on the same governance forum called for lowering the quorum from 2.5 million to 1.5 million GTC; the original text states that administrators would make the change only after it passes a vote. I found no evidence that it was implemented in sync with this hourly move, nor any evidence attributing the rise to it as a catalyst.
For now, I’m watching only two verifiable thresholds: whether a complete hourly candle can hold above 0.18007, and whether the price can reclaim 0.19267 with sustained trading volume. Losing the previous low would weaken the rebound structure; reclaiming the previous high would still require confirmation from subsequent hourly candles. These are conditions for verification, not buy or sell signals.
For GTC in the short term, I’d lean toward waiting and not chasing the rally. At 08:00 Beijing time, a scan of all Binance USDT perpetual contracts was complete at 523/523, with GTC ranking second and up +27.450%. A rescan before publication at 08:05 still ranked it second, up +29.165%, with a reference price of 0.19119. The single-contract ticker at 08:02 was 0.18997, with a rolling gain of +27.866%. The 07:03 ticker cited in the previous post was up +22.674% at 0.18368. By comparison, at 08:05 the rolling gain was 6.491 percentage points higher, and the current price was up about 4.09%; the two figures should not be conflated as “up 6% in this hour.”
The new structure is visible in completed candles: from 07:00 to 08:00, the price closed at 0.18991, up 2.62% from 0.18507, with a low of 0.18007 and a high of 0.19267 during the hour. Quote-volume turnover for that hour was $8.409 million, 2.46 times the average of $3.422 million across the previous four complete hours. From 04:00 to 08:00, the complete four-hour candle rose 11.35%, from 0.17055 to 0.18991. This looks more like a clear rebound accompanied by substantial volatility than a smooth, sustained climb; increased turnover only indicates more active trading and does not prove net capital inflows. The new four-hour candle that began at 08:00 has not closed, so it cannot yet be counted as confirmed.
The derivatives side also offers no one-way conclusion: OI quantity increased by about 0.94% from 07:00 to 08:01, a limited change that does not distinguish between longs and shorts. The funding-rate reading at 08:00 was -0.107668%; the global long/short ratio by account was about 1.0509, meaning account numbers tilted slightly long, but this does not reflect position weights. Negative funding, a slight long bias among accounts, and a price rebound occurred together, so it cannot simply be described as a “short squeeze.”
As for project news, an October 1 update from Gitcoin’s official account described Techne as a separate product direction and said the DAO and GTC would continue their existing roles. A Snapshot quorum proposal on the same governance forum called for lowering the quorum from 2.5 million to 1.5 million GTC; the original text states that administrators would make the change only after it passes a vote. I found no evidence that it was implemented in sync with this hourly move, nor any evidence attributing the rise to it as a catalyst.
For now, I’m watching only two verifiable thresholds: whether a complete hourly candle can hold above 0.18007, and whether the price can reclaim 0.19267 with sustained trading volume. Losing the previous low would weaken the rebound structure; reclaiming the previous high would still require confirmation from subsequent hourly candles. These are conditions for verification, not buy or sell signals.
The new structure is visible in completed candles: from 07:00 to 08:00, the price closed at 0.18991, up 2.62% from 0.18507, with a low of 0.18007 and a high of 0.19267 during the hour. Quote-volume turnover for that hour was $8.409 million, 2.46 times the average of $3.422 million across the previous four complete hours. From 04:00 to 08:00, the complete four-hour candle rose 11.35%, from 0.17055 to 0.18991. This looks more like a clear rebound accompanied by substantial volatility than a smooth, sustained climb; increased turnover only indicates more active trading and does not prove net capital inflows. The new four-hour candle that began at 08:00 has not closed, so it cannot yet be counted as confirmed.
The derivatives side also offers no one-way conclusion: OI quantity increased by about 0.94% from 07:00 to 08:01, a limited change that does not distinguish between longs and shorts. The funding-rate reading at 08:00 was -0.107668%; the global long/short ratio by account was about 1.0509, meaning account numbers tilted slightly long, but this does not reflect position weights. Negative funding, a slight long bias among accounts, and a price rebound occurred together, so it cannot simply be described as a “short squeeze.”
As for project news, an October 1 update from Gitcoin’s official account described Techne as a separate product direction and said the DAO and GTC would continue their existing roles. A Snapshot quorum proposal on the same governance forum called for lowering the quorum from 2.5 million to 1.5 million GTC; the original text states that administrators would make the change only after it passes a vote. I found no evidence that it was implemented in sync with this hourly move, nor any evidence attributing the rise to it as a catalyst.
For now, I’m watching only two verifiable thresholds: whether a complete hourly candle can hold above 0.18007, and whether the price can reclaim 0.19267 with sustained trading volume. Losing the previous low would weaken the rebound structure; reclaiming the previous high would still require confirmation from subsequent hourly candles. These are conditions for verification, not buy or sell signals.
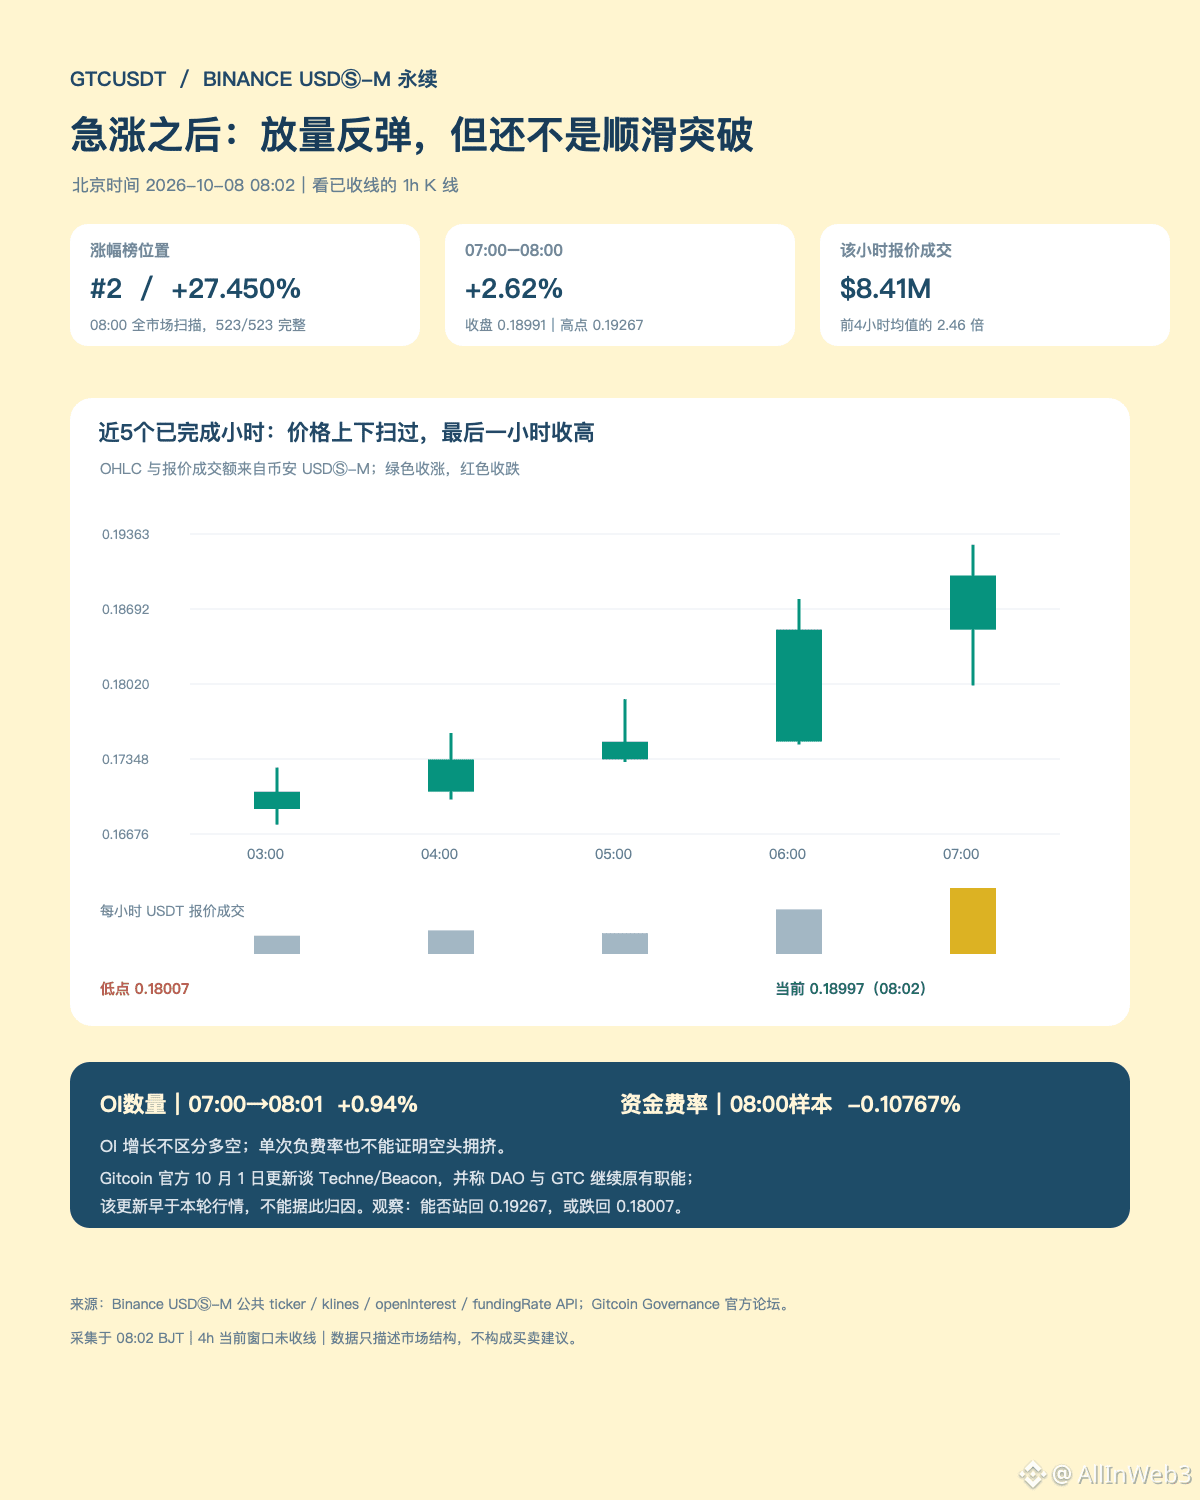
250
·
--
$GTC: Stay on the sidelines in the short term; don't chase the 24-hour gain. At 07:02 Beijing time, it ranked 2nd on the full Binance USDT-margined perpetual leaderboard, up +21.755%. A rescan before publication at 07:06 still showed it in 2nd place, up +23.621%, with a quoted price of 0.185060. Rank and rolling gains do not mean the current price has risen continuously: a single-coin check at 07:03 showed a current price of 0.183680, slightly below the 0.18566 sampled in the previous article at 21:07. The higher 24-hour window gain should not be misread as the current price having risen by about 10% over these 10 hours.
The new development is visible on the hourly chart: the four complete hours from 00:00 to 04:00 fell from 0.17870 to 0.17055, down about 4.56%. The price then recovered: the complete hour from 06:00 to 07:00 closed at 0.18507, up about 5.73% from 0.17504, with approximately $5.69 million in USDT-denominated trading volume—2.37 times the average of the previous four complete hours. The rebound did come with higher volume, but trading volume represents both sides of matched trades and does not prove net buying; one hourly candle is also not enough to confirm a reversal. The previous article tracked through 20:00–21:00; the current 04:00–08:00 four-hour candle has not yet closed, so I count only 06:00–07:00 as a completed hourly rebound.
In Binance open-interest samples, the number of open contracts rose about 2.8% from 06:00 to 07:00. The long/short account ratio was 1.0412 at 07:00, near balance and slightly skewed long. OI does not distinguish between long and short positions, and the account ratio does not reflect position sizes. The latest available funding rate was -0.06165% at the 00:00 settlement; it is not the real-time rate at 07:00. Gitcoin's official October 1 update discussed Techne and Beacon and said the DAO and GTC would continue their existing roles. I found no new announcement timed to this hourly fluctuation, so I am not treating the old update as a catalyst.
Next, watch whether the next complete hourly candle can hold near the previous hourly high of 0.17884 without volume quickly drying up. If a complete hourly candle closes below 0.17478, this rebound structure is invalidated. These price levels are reference points for monitoring, not buy signals.
$GTC : Stay on the sidelines in the short term; don't chase the 24-hour gain. At 07:02 Beijing time, it ranked 2nd on the full Binance USDT-margined perpetual leaderboard, up +21.755%. A rescan before publication at 07:06 still showed it in 2nd place, up +23.621%, with a quoted price of 0.185060. Rank and rolling gains do not mean the current price has risen continuously: a single-coin check at 07:03 showed a current price of 0.183680, slightly below the 0.18566 sampled in the previous article at 21:07. The higher 24-hour window gain should not be misread as the current price having risen by about 10% over these 10 hours.
The new development is visible on the hourly chart: the four complete hours from 00:00 to 04:00 fell from 0.17870 to 0.17055, down about 4.56%. The price then recovered: the complete hour from 06:00 to 07:00 closed at 0.18507, up about 5.73% from 0.17504, with approximately $5.69 million in USDT-denominated trading volume—2.37 times the average of the previous four complete hours. The rebound did come with higher volume, but trading volume represents both sides of matched trades and does not prove net buying; one hourly candle is also not enough to confirm a reversal. The previous article tracked through 20:00–21:00; the current 04:00–08:00 four-hour candle has not yet closed, so I count only 06:00–07:00 as a completed hourly rebound.
In Binance open-interest samples, the number of open contracts rose about 2.8% from 06:00 to 07:00. The long/short account ratio was 1.0412 at 07:00, near balance and slightly skewed long. OI does not distinguish between long and short positions, and the account ratio does not reflect position sizes. The latest available funding rate was -0.06165% at the 00:00 settlement; it is not the real-time rate at 07:00. Gitcoin's official October 1 update discussed Techne and Beacon and said the DAO and GTC would continue their existing roles. I found no new announcement timed to this hourly fluctuation, so I am not treating the old update as a catalyst.
Next, watch whether the next complete hourly candle can hold near the previous hourly high of 0.17884 without volume quickly drying up. If a complete hourly candle closes below 0.17478, this rebound structure is invalidated. These price levels are reference points for monitoring, not buy signals.
The new development is visible on the hourly chart: the four complete hours from 00:00 to 04:00 fell from 0.17870 to 0.17055, down about 4.56%. The price then recovered: the complete hour from 06:00 to 07:00 closed at 0.18507, up about 5.73% from 0.17504, with approximately $5.69 million in USDT-denominated trading volume—2.37 times the average of the previous four complete hours. The rebound did come with higher volume, but trading volume represents both sides of matched trades and does not prove net buying; one hourly candle is also not enough to confirm a reversal. The previous article tracked through 20:00–21:00; the current 04:00–08:00 four-hour candle has not yet closed, so I count only 06:00–07:00 as a completed hourly rebound.
In Binance open-interest samples, the number of open contracts rose about 2.8% from 06:00 to 07:00. The long/short account ratio was 1.0412 at 07:00, near balance and slightly skewed long. OI does not distinguish between long and short positions, and the account ratio does not reflect position sizes. The latest available funding rate was -0.06165% at the 00:00 settlement; it is not the real-time rate at 07:00. Gitcoin's official October 1 update discussed Techne and Beacon and said the DAO and GTC would continue their existing roles. I found no new announcement timed to this hourly fluctuation, so I am not treating the old update as a catalyst.
Next, watch whether the next complete hourly candle can hold near the previous hourly high of 0.17884 without volume quickly drying up. If a complete hourly candle closes below 0.17478, this rebound structure is invalidated. These price levels are reference points for monitoring, not buy signals.
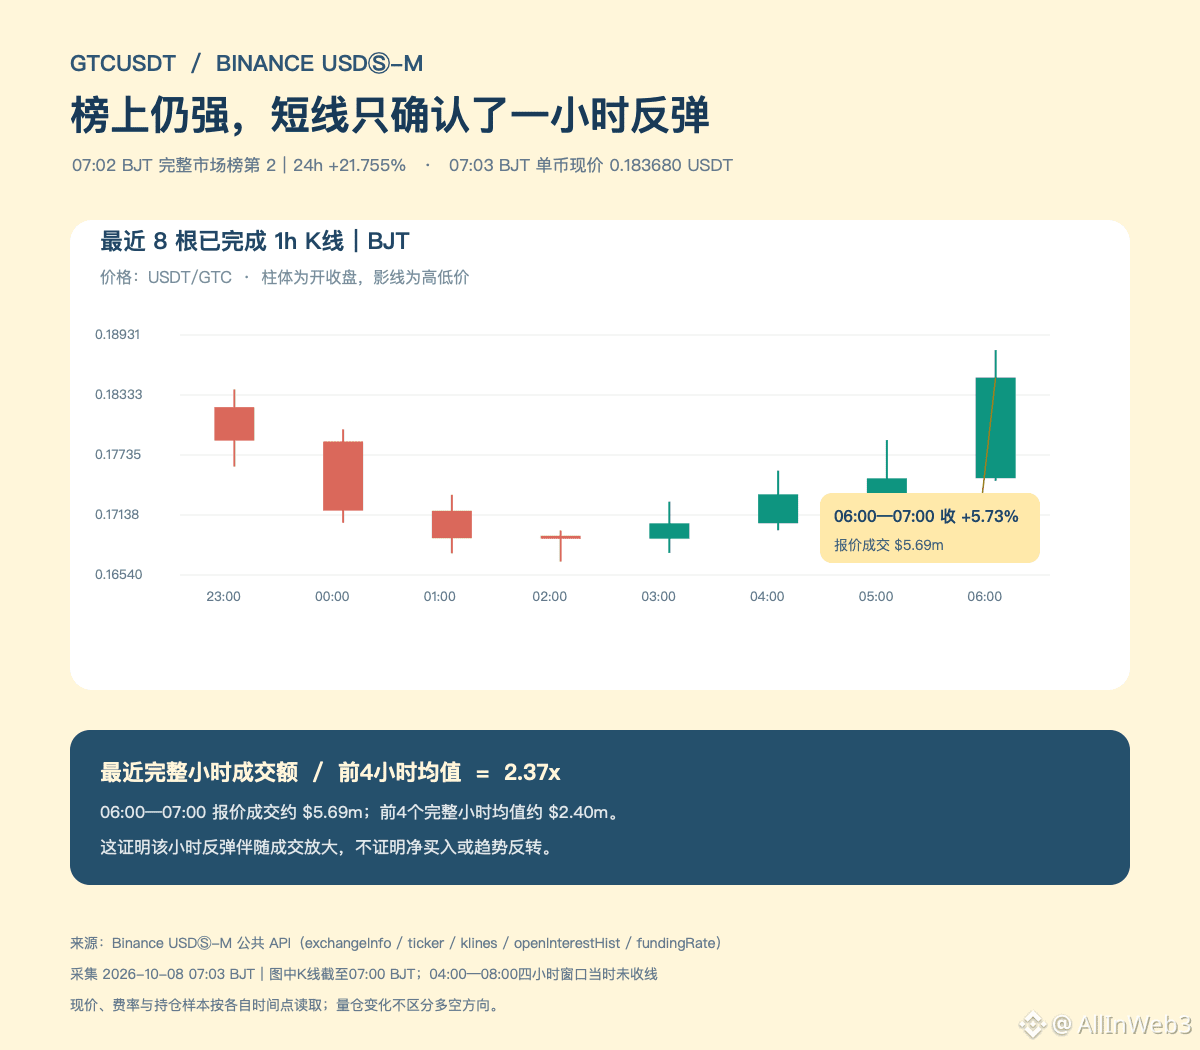
1
164
·
--
For the short term, stay on the sidelines and don’t chase $MET. At 06:00 Beijing time, a full scan covering all 523/523 Binance USDT-margined perpetuals ranked METUSDT first in gains, up 38.212% over 24 hours, with a quoted price of 0.4561 and trading volume of approximately $216.2 million. A rescan before publication at 06:02 still ranked it first, up 38.441% at 0.4581. That is 7.525 percentage points above the +30.916% snapshot in the earlier 04:04 post—a significant additional move over the rolling period, though the ranking is no guarantee of continuation. The previous post’s analysis covered 03:00–04:00; this update adds two complete hours.
From 04:00 to 05:00, the price opened near 0.4344 and closed at 0.4342, with a low of 0.4245 and trading volume of about $22.69 million—essentially flat. From 05:00 to 06:00, it rose from 0.4341 to 0.4547, up about 4.75%, with a high of 0.4731 and trading volume of about $34.17 million. The increase in volume coincided with a higher close, but trades are matched between buyers and sellers, so this cannot be treated as net buying. The new candle after 06:00 has not closed; the chart only shows complete hourly data through 05:00–06:00.
Positioning indicators rose over the same period: Binance open interest (OI) increased from about 28.4 million at 04:00 to about 30.44 million at 06:00, up roughly 7.2%. The account long/short ratio fell from 1.0956 at 04:00 to 1.0121 at 05:00, then recovered to 1.0483 at 06:00. The sample is close to balanced and does not support a conclusion that positioning is crowded in one direction. The latest available historical funding-rate record is still -0.5101% at 04:00, a markedly negative reading tied to that specific timestamp. It should not be treated as the live rate at 06:00, and a negative rate alone does not prove that a short squeeze is underway.
The completed 00:00–04:00 four-hour candle rose from 0.3314 to 0.4342, up about 31%; the current 04:00–08:00 four-hour window has not yet closed. The latest periodic report listed on Meteora’s official IR page is its August monthly report, published on September 15. This round of public searches found no synchronized official announcement directly corresponding to the new hourly surge, so no catalyst is being invented to explain the move. The uptrend will only be confirmed if subsequent full hourly candles hold near 0.4341 and volume continues; if a full hourly candle closes below 0.4245, the current continuation thesis is invalidated. 0.4731 is a level to watch as the previous high; these price levels are not automatically support levels or buy/sell instructions.
For the short term, stay on the sidelines and don’t chase $MET . At 06:00 Beijing time, a full scan covering all 523/523 Binance USDT-margined perpetuals ranked METUSDT first in gains, up 38.212% over 24 hours, with a quoted price of 0.4561 and trading volume of approximately $216.2 million. A rescan before publication at 06:02 still ranked it first, up 38.441% at 0.4581. That is 7.525 percentage points above the +30.916% snapshot in the earlier 04:04 post—a significant additional move over the rolling period, though the ranking is no guarantee of continuation. The previous post’s analysis covered 03:00–04:00; this update adds two complete hours.
From 04:00 to 05:00, the price opened near 0.4344 and closed at 0.4342, with a low of 0.4245 and trading volume of about $22.69 million—essentially flat. From 05:00 to 06:00, it rose from 0.4341 to 0.4547, up about 4.75%, with a high of 0.4731 and trading volume of about $34.17 million. The increase in volume coincided with a higher close, but trades are matched between buyers and sellers, so this cannot be treated as net buying. The new candle after 06:00 has not closed; the chart only shows complete hourly data through 05:00–06:00.
Positioning indicators rose over the same period: Binance open interest (OI) increased from about 28.4 million at 04:00 to about 30.44 million at 06:00, up roughly 7.2%. The account long/short ratio fell from 1.0956 at 04:00 to 1.0121 at 05:00, then recovered to 1.0483 at 06:00. The sample is close to balanced and does not support a conclusion that positioning is crowded in one direction. The latest available historical funding-rate record is still -0.5101% at 04:00, a markedly negative reading tied to that specific timestamp. It should not be treated as the live rate at 06:00, and a negative rate alone does not prove that a short squeeze is underway.
The completed 00:00–04:00 four-hour candle rose from 0.3314 to 0.4342, up about 31%; the current 04:00–08:00 four-hour window has not yet closed. The latest periodic report listed on Meteora’s official IR page is its August monthly report, published on September 15. This round of public searches found no synchronized official announcement directly corresponding to the new hourly surge, so no catalyst is being invented to explain the move. The uptrend will only be confirmed if subsequent full hourly candles hold near 0.4341 and volume continues; if a full hourly candle closes below 0.4245, the current continuation thesis is invalidated. 0.4731 is a level to watch as the previous high; these price levels are not automatically support levels or buy/sell instructions.
From 04:00 to 05:00, the price opened near 0.4344 and closed at 0.4342, with a low of 0.4245 and trading volume of about $22.69 million—essentially flat. From 05:00 to 06:00, it rose from 0.4341 to 0.4547, up about 4.75%, with a high of 0.4731 and trading volume of about $34.17 million. The increase in volume coincided with a higher close, but trades are matched between buyers and sellers, so this cannot be treated as net buying. The new candle after 06:00 has not closed; the chart only shows complete hourly data through 05:00–06:00.
Positioning indicators rose over the same period: Binance open interest (OI) increased from about 28.4 million at 04:00 to about 30.44 million at 06:00, up roughly 7.2%. The account long/short ratio fell from 1.0956 at 04:00 to 1.0121 at 05:00, then recovered to 1.0483 at 06:00. The sample is close to balanced and does not support a conclusion that positioning is crowded in one direction. The latest available historical funding-rate record is still -0.5101% at 04:00, a markedly negative reading tied to that specific timestamp. It should not be treated as the live rate at 06:00, and a negative rate alone does not prove that a short squeeze is underway.
The completed 00:00–04:00 four-hour candle rose from 0.3314 to 0.4342, up about 31%; the current 04:00–08:00 four-hour window has not yet closed. The latest periodic report listed on Meteora’s official IR page is its August monthly report, published on September 15. This round of public searches found no synchronized official announcement directly corresponding to the new hourly surge, so no catalyst is being invented to explain the move. The uptrend will only be confirmed if subsequent full hourly candles hold near 0.4341 and volume continues; if a full hourly candle closes below 0.4245, the current continuation thesis is invalidated. 0.4731 is a level to watch as the previous high; these price levels are not automatically support levels or buy/sell instructions.
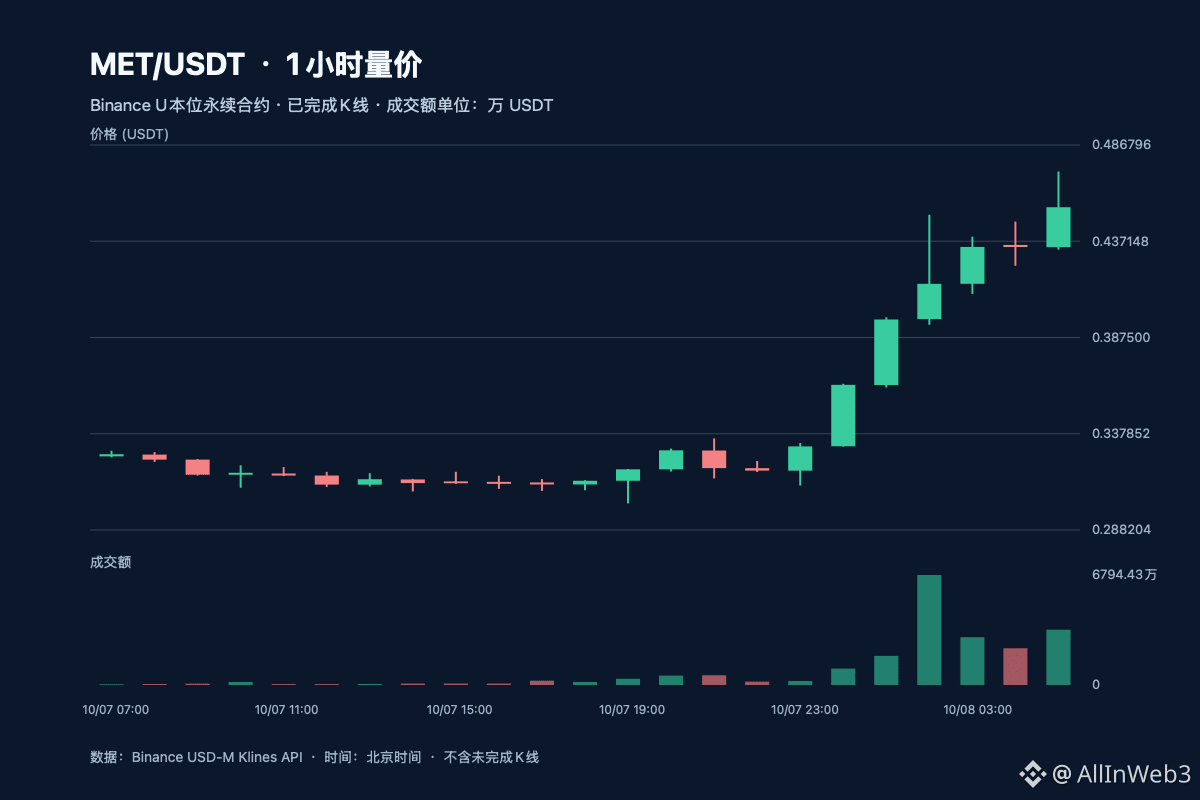
1
10
·
--
For now, watch the short-term action; don’t chase $SAND. The full Binance USDT-margined perpetual scan at 05:01 Beijing time covered 523/523 pairs, with SANDUSDT ranked second in gains. It was still up 18.417% over 24 hours, quoted at 0.07812, with about $524 million in trading volume. A rescan before publication at 05:03 still ranked it second, with a rolling gain of +18.803% and a quote of 0.07822. An earlier post at 01:10 (374791984783075) noted that the price had surged and then pulled back between 00:00 and 01:00, and that the four-hour 00:00–04:00 candle had not yet closed. The newly completed window now gives us the result: from 00:00 to 04:00, the price fell from 0.08425 to 0.07911, or about 6.1%; it then closed down about 1.29% from 04:00 to 05:00, with a low of 0.07684. At the 05:01 quote, it was down about 11.3% from the high of 0.08809. A sharp 24-hour gain and a short-term pullback can both be true; the gainers’ list alone cannot tell us the trend.
Hourly trading volume has cooled steadily: about $95.55 million from 00:00 to 01:00, followed by about $50.71 million, $33.13 million, and $21.27 million over the next three hours, then falling further to about $14.56 million from 04:00 to 05:00. The price still closed lower, but volume this hour was about 31.5% lower than in the previous hour. This points to slower turnover, but by itself it is not enough to prove that selling pressure has ended or that buyers have returned. The chart shows only completed hourly candles; the candle after 05:00 has not yet closed.
The derivatives data also differs from the previous post: open interest in token units fell from about 401.5 million at 01:00 to about 382.3 million at 04:00, a decline of roughly 4.8%. The price pullback alongside contracting OI looks more like a reduction in contract exposure, but OI does not distinguish between longs and shorts, so we cannot conclude that longs are closing positions. The account long/short ratio has been around 1.15–1.16 over the past few hours, still slightly tilted long. The latest available funding-rate record is -0.1149% at 00:00; it is outdated and should not be treated as the real-time rate at 05:00.
Keep the official background separate from the immediate price action: The Sandbox’s latest announcement on its website is the September 8 notice about claiming SAND compensation, referring back to the August 22 bridge incident involving Base and BNB Chain. This provides context on cross-chain risk, but it was published before the current move and is not a catalyst for this hour. The website also explicitly distinguishes the affected chains from SAND on Ethereum and Polygon, so the risk should not be generalized to all chains. No simultaneous announcement directly corresponding to this hourly move has been identified. Next, watch whether a full hourly candle can reclaim 0.08192, and whether a closing break below the 0.07684 low is confirmed. These are levels to monitor, not automatic support levels or trading instructions.
For now, watch the short-term action; don’t chase $SAND . The full Binance USDT-margined perpetual scan at 05:01 Beijing time covered 523/523 pairs, with SANDUSDT ranked second in gains. It was still up 18.417% over 24 hours, quoted at 0.07812, with about $524 million in trading volume. A rescan before publication at 05:03 still ranked it second, with a rolling gain of +18.803% and a quote of 0.07822. An earlier post at 01:10 (374791984783075) noted that the price had surged and then pulled back between 00:00 and 01:00, and that the four-hour 00:00–04:00 candle had not yet closed. The newly completed window now gives us the result: from 00:00 to 04:00, the price fell from 0.08425 to 0.07911, or about 6.1%; it then closed down about 1.29% from 04:00 to 05:00, with a low of 0.07684. At the 05:01 quote, it was down about 11.3% from the high of 0.08809. A sharp 24-hour gain and a short-term pullback can both be true; the gainers’ list alone cannot tell us the trend.
Hourly trading volume has cooled steadily: about $95.55 million from 00:00 to 01:00, followed by about $50.71 million, $33.13 million, and $21.27 million over the next three hours, then falling further to about $14.56 million from 04:00 to 05:00. The price still closed lower, but volume this hour was about 31.5% lower than in the previous hour. This points to slower turnover, but by itself it is not enough to prove that selling pressure has ended or that buyers have returned. The chart shows only completed hourly candles; the candle after 05:00 has not yet closed.
The derivatives data also differs from the previous post: open interest in token units fell from about 401.5 million at 01:00 to about 382.3 million at 04:00, a decline of roughly 4.8%. The price pullback alongside contracting OI looks more like a reduction in contract exposure, but OI does not distinguish between longs and shorts, so we cannot conclude that longs are closing positions. The account long/short ratio has been around 1.15–1.16 over the past few hours, still slightly tilted long. The latest available funding-rate record is -0.1149% at 00:00; it is outdated and should not be treated as the real-time rate at 05:00.
Keep the official background separate from the immediate price action: The Sandbox’s latest announcement on its website is the September 8 notice about claiming SAND compensation, referring back to the August 22 bridge incident involving Base and BNB Chain. This provides context on cross-chain risk, but it was published before the current move and is not a catalyst for this hour. The website also explicitly distinguishes the affected chains from SAND on Ethereum and Polygon, so the risk should not be generalized to all chains. No simultaneous announcement directly corresponding to this hourly move has been identified. Next, watch whether a full hourly candle can reclaim 0.08192, and whether a closing break below the 0.07684 low is confirmed. These are levels to monitor, not automatic support levels or trading instructions.
Hourly trading volume has cooled steadily: about $95.55 million from 00:00 to 01:00, followed by about $50.71 million, $33.13 million, and $21.27 million over the next three hours, then falling further to about $14.56 million from 04:00 to 05:00. The price still closed lower, but volume this hour was about 31.5% lower than in the previous hour. This points to slower turnover, but by itself it is not enough to prove that selling pressure has ended or that buyers have returned. The chart shows only completed hourly candles; the candle after 05:00 has not yet closed.
The derivatives data also differs from the previous post: open interest in token units fell from about 401.5 million at 01:00 to about 382.3 million at 04:00, a decline of roughly 4.8%. The price pullback alongside contracting OI looks more like a reduction in contract exposure, but OI does not distinguish between longs and shorts, so we cannot conclude that longs are closing positions. The account long/short ratio has been around 1.15–1.16 over the past few hours, still slightly tilted long. The latest available funding-rate record is -0.1149% at 00:00; it is outdated and should not be treated as the real-time rate at 05:00.
Keep the official background separate from the immediate price action: The Sandbox’s latest announcement on its website is the September 8 notice about claiming SAND compensation, referring back to the August 22 bridge incident involving Base and BNB Chain. This provides context on cross-chain risk, but it was published before the current move and is not a catalyst for this hour. The website also explicitly distinguishes the affected chains from SAND on Ethereum and Polygon, so the risk should not be generalized to all chains. No simultaneous announcement directly corresponding to this hourly move has been identified. Next, watch whether a full hourly candle can reclaim 0.08192, and whether a closing break below the 0.07684 low is confirmed. These are levels to monitor, not automatic support levels or trading instructions.
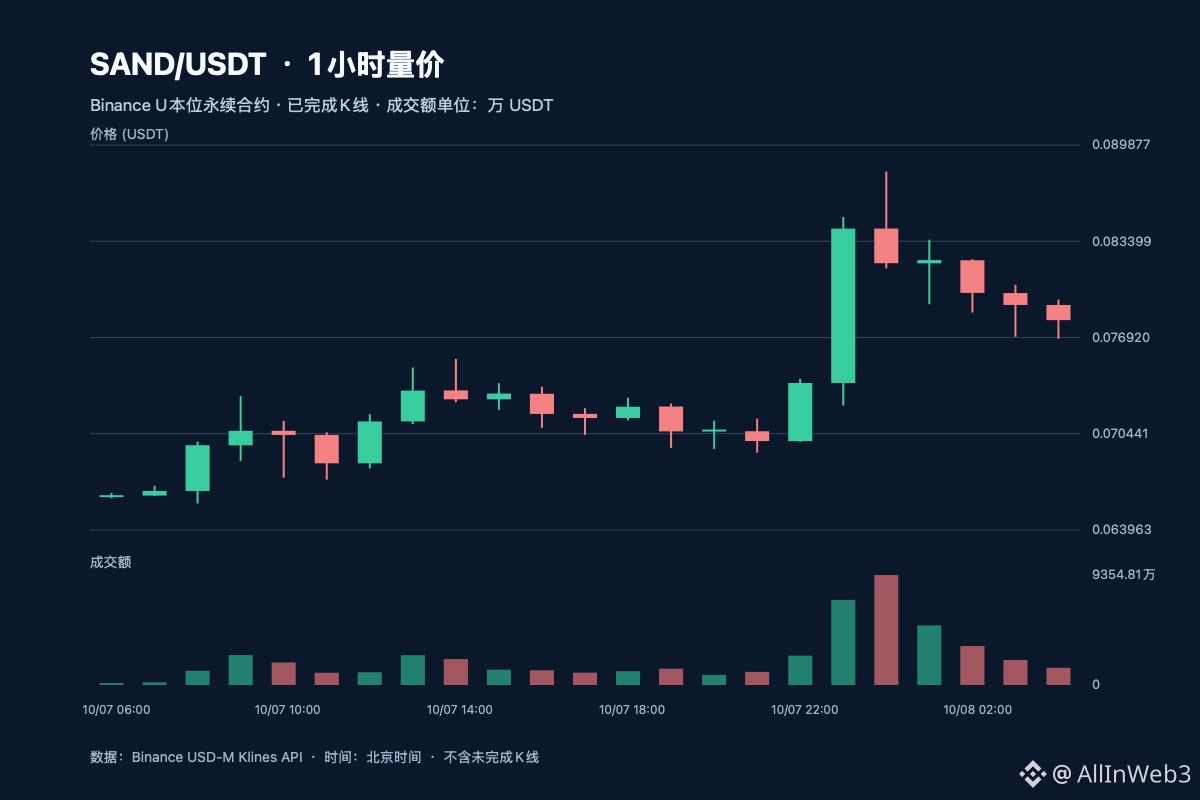
174
·
--
Conclusion: Stay on the sidelines in the short term; don’t chase $MET. It remains a high-volatility asset to watch, and a stronger leaderboard ranking is not a reason to chase the rally. At 04:01 Beijing time, the initial scan covered 523/523 Binance USDT-margined perpetuals. METUSDT ranked first in gains, up 31.443% over 24 hours. A rescan before publication at 04:04 still had it ranked first, with the gain easing to 30.916%, a price of 0.4315, and approximately $163.8 million in quote volume. Compared with the +23.866% snapshot in the earlier post at 03:05, it is still up 7.05 percentage points; this is new information from a rolling leaderboard, not a sign that the ranking will hold.
The latest increment came during the full hour from 03:00 to 04:00: open 0.4152, close 0.4342, up about 4.58%, with a range of 0.4100–0.4395 and approximately $29.5 million in quote volume. Volume was about 43% of the previous hour’s $67.94 million. The price still closed higher, but participation declined. Quote volume is a two-sided total and cannot, on its own, show that aggressive buyers were dominant. The new hourly candle after 04:00 has not yet closed; the single-coin quote briefly hovered around 0.4296, below the previous hour’s close. An incomplete candle should not be described as confirmation of a breakout.
Open interest is also expanding: the Binance OI quantity sample rose from about 26.17 million at 03:00 to about 28.40 million at 04:00, an increase of roughly 8.5%. This indicates greater derivatives exposure, not net inflows, and does not reveal whether positions are long or short. The long-short account ratio fell from 1.1395 to 1.0956, narrowing the advantage in the share of directional accounts. The latest funding-rate record at 04:00 was about -0.5101%, a notably negative reading. It coincided with rising prices and OI, but that does not automatically mean a “short squeeze”; also be alert to possible anomalies in the funding-rate data feed or a rapid reversion.
Meteora’s official investor relations page currently lists the August report, published on September 15, as its latest monthly report. The governance page still shows that the claim period for Season 2 points ends on October 21. I found no official announcement that directly corresponds to this high-volume hour from 03:00 to 04:00, so I won’t invent a catalyst for the market move. The focus now shifts to whether subsequent complete hourly candles can hold the 0.4100–0.4152 range, whether volume recovers, and whether OI expansion is accompanied by price weakness. If a high-volume candle closes back below the range, the current setup needs to be reassessed. If volatility remains high but there are no confirming subsequent closes, the ranking itself provides no confirmation. This is market commentary, not investment advice.
Conclusion: Stay on the sidelines in the short term; don’t chase $MET . It remains a high-volatility asset to watch, and a stronger leaderboard ranking is not a reason to chase the rally. At 04:01 Beijing time, the initial scan covered 523/523 Binance USDT-margined perpetuals. METUSDT ranked first in gains, up 31.443% over 24 hours. A rescan before publication at 04:04 still had it ranked first, with the gain easing to 30.916%, a price of 0.4315, and approximately $163.8 million in quote volume. Compared with the +23.866% snapshot in the earlier post at 03:05, it is still up 7.05 percentage points; this is new information from a rolling leaderboard, not a sign that the ranking will hold.
The latest increment came during the full hour from 03:00 to 04:00: open 0.4152, close 0.4342, up about 4.58%, with a range of 0.4100–0.4395 and approximately $29.5 million in quote volume. Volume was about 43% of the previous hour’s $67.94 million. The price still closed higher, but participation declined. Quote volume is a two-sided total and cannot, on its own, show that aggressive buyers were dominant. The new hourly candle after 04:00 has not yet closed; the single-coin quote briefly hovered around 0.4296, below the previous hour’s close. An incomplete candle should not be described as confirmation of a breakout.
Open interest is also expanding: the Binance OI quantity sample rose from about 26.17 million at 03:00 to about 28.40 million at 04:00, an increase of roughly 8.5%. This indicates greater derivatives exposure, not net inflows, and does not reveal whether positions are long or short. The long-short account ratio fell from 1.1395 to 1.0956, narrowing the advantage in the share of directional accounts. The latest funding-rate record at 04:00 was about -0.5101%, a notably negative reading. It coincided with rising prices and OI, but that does not automatically mean a “short squeeze”; also be alert to possible anomalies in the funding-rate data feed or a rapid reversion.
Meteora’s official investor relations page currently lists the August report, published on September 15, as its latest monthly report. The governance page still shows that the claim period for Season 2 points ends on October 21. I found no official announcement that directly corresponds to this high-volume hour from 03:00 to 04:00, so I won’t invent a catalyst for the market move. The focus now shifts to whether subsequent complete hourly candles can hold the 0.4100–0.4152 range, whether volume recovers, and whether OI expansion is accompanied by price weakness. If a high-volume candle closes back below the range, the current setup needs to be reassessed. If volatility remains high but there are no confirming subsequent closes, the ranking itself provides no confirmation. This is market commentary, not investment advice.
The latest increment came during the full hour from 03:00 to 04:00: open 0.4152, close 0.4342, up about 4.58%, with a range of 0.4100–0.4395 and approximately $29.5 million in quote volume. Volume was about 43% of the previous hour’s $67.94 million. The price still closed higher, but participation declined. Quote volume is a two-sided total and cannot, on its own, show that aggressive buyers were dominant. The new hourly candle after 04:00 has not yet closed; the single-coin quote briefly hovered around 0.4296, below the previous hour’s close. An incomplete candle should not be described as confirmation of a breakout.
Open interest is also expanding: the Binance OI quantity sample rose from about 26.17 million at 03:00 to about 28.40 million at 04:00, an increase of roughly 8.5%. This indicates greater derivatives exposure, not net inflows, and does not reveal whether positions are long or short. The long-short account ratio fell from 1.1395 to 1.0956, narrowing the advantage in the share of directional accounts. The latest funding-rate record at 04:00 was about -0.5101%, a notably negative reading. It coincided with rising prices and OI, but that does not automatically mean a “short squeeze”; also be alert to possible anomalies in the funding-rate data feed or a rapid reversion.
Meteora’s official investor relations page currently lists the August report, published on September 15, as its latest monthly report. The governance page still shows that the claim period for Season 2 points ends on October 21. I found no official announcement that directly corresponds to this high-volume hour from 03:00 to 04:00, so I won’t invent a catalyst for the market move. The focus now shifts to whether subsequent complete hourly candles can hold the 0.4100–0.4152 range, whether volume recovers, and whether OI expansion is accompanied by price weakness. If a high-volume candle closes back below the range, the current setup needs to be reassessed. If volatility remains high but there are no confirming subsequent closes, the ranking itself provides no confirmation. This is market commentary, not investment advice.
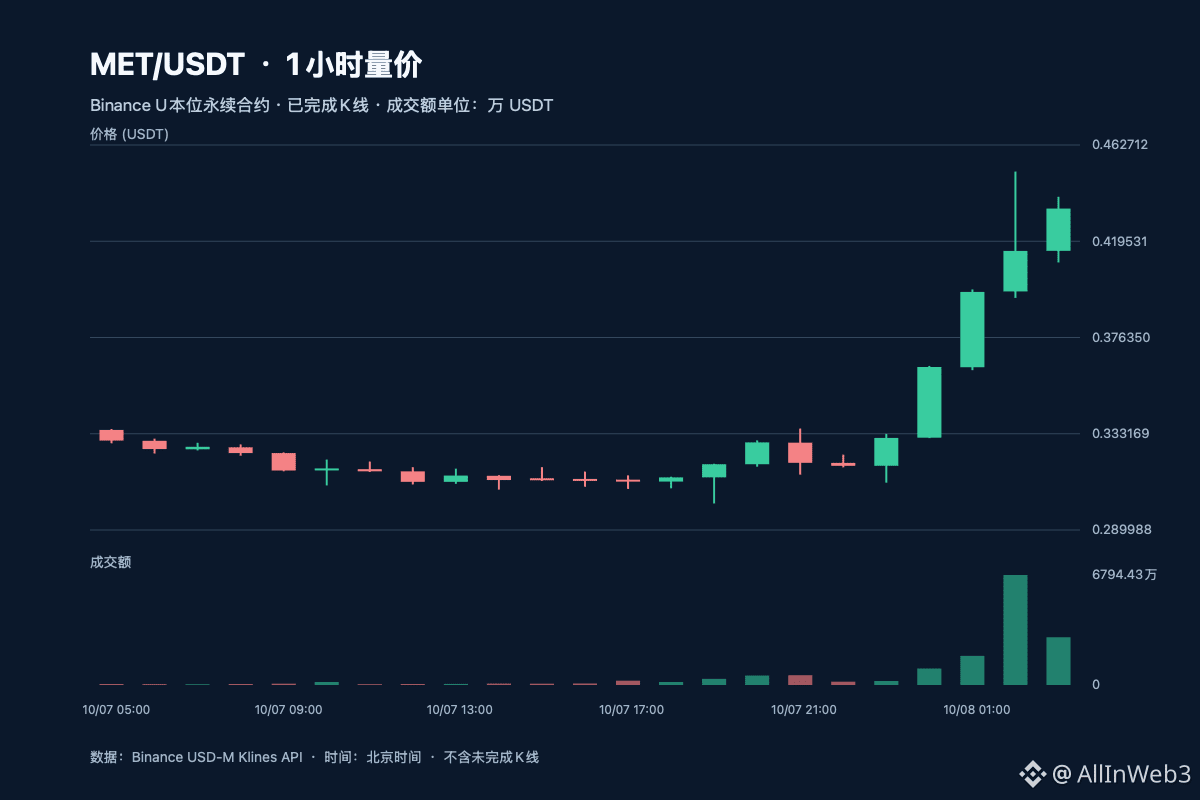
198
Log in to explore more content
Join global crypto users on Binance Square
⚡️ Get latest and useful information about crypto.
💬 Trusted by the world’s largest crypto exchange.
👍 Discover real insights from verified creators.
Email / Phone number
Trending Topics
FedMinutesFocusOnOctoberPause
340,453 views
2,081 Discussing
🚨 THE FED JUST DROPPED A HUGE HINT — OCTOBER PAUSE INCOMING?
Wall Street is betting the Fed will HIT THE BRAKES in October. And crypto traders are watching closely. 👀
The latest FOMC minutes have shifted attention toward a potential pause at the October 27–28 meeting.
📊 The market setup:
🔥 October rate hold: approximately 82.8% in the latest previously reported pricing.
🔥 Rate hike probability: approximately 17.2%.
🔥 Weakening labor-market data is making an immediate hike harder to justify.
But here's the twist.
A PAUSE IS NOT A RATE CUT.
The Fed could hold in October while keeping the door open for additional tightening later.
For $BTC, $ ETH and $XAU, that distinction matters.
A pause could ease immediate pressure on risk assets. But persistent inflation and elevated Treasury yields could still crush bullish momentum.
⚠️ THE BIG QUESTION:
Is Wall Street positioning for a crypto breakout — or setting up another massive bull trap before the next Fed decision?
$BTC $ETH $BNB $SOL $XAU
#fedminutesfocusonoctoberpause #BinanceLaunchesBinanceIntelligence #EvernorthDelaysNasdaqDebutToOct12 #RobinhoodAdds$25MInBitcoinToBalanceSheet #SP500AndNasdaqHitRecordHighs
KimHotbae
·23 Likes
·30.8k views
XRPSpotETFsHold$1.7BWeeklyInflowsSlow
62 views
15 Discussing
FrenchHillUrgesCLARITYActPassageInLameDuck
816 views
66 Discussing