

Ab_CryptoTrading
5.4k Posts

Ab_CryptoTrading
 Square Verified+
Report
Block User
Opportunity Creator🔮 || Full Time Crypto Trader💰 || Free Daily Trades ✅ || Web 3 👨💻 ||Promoter 💎 || Day Trader 📊 || UID 21517050
Open Trade
Occasional Trader
8.8 Years
7.4K+ Following
32.6K+ Followers
27.8K+ Liked
Posts
Portfolio
All
Quotes
Videos
Live
PINNED
Verified
See translation
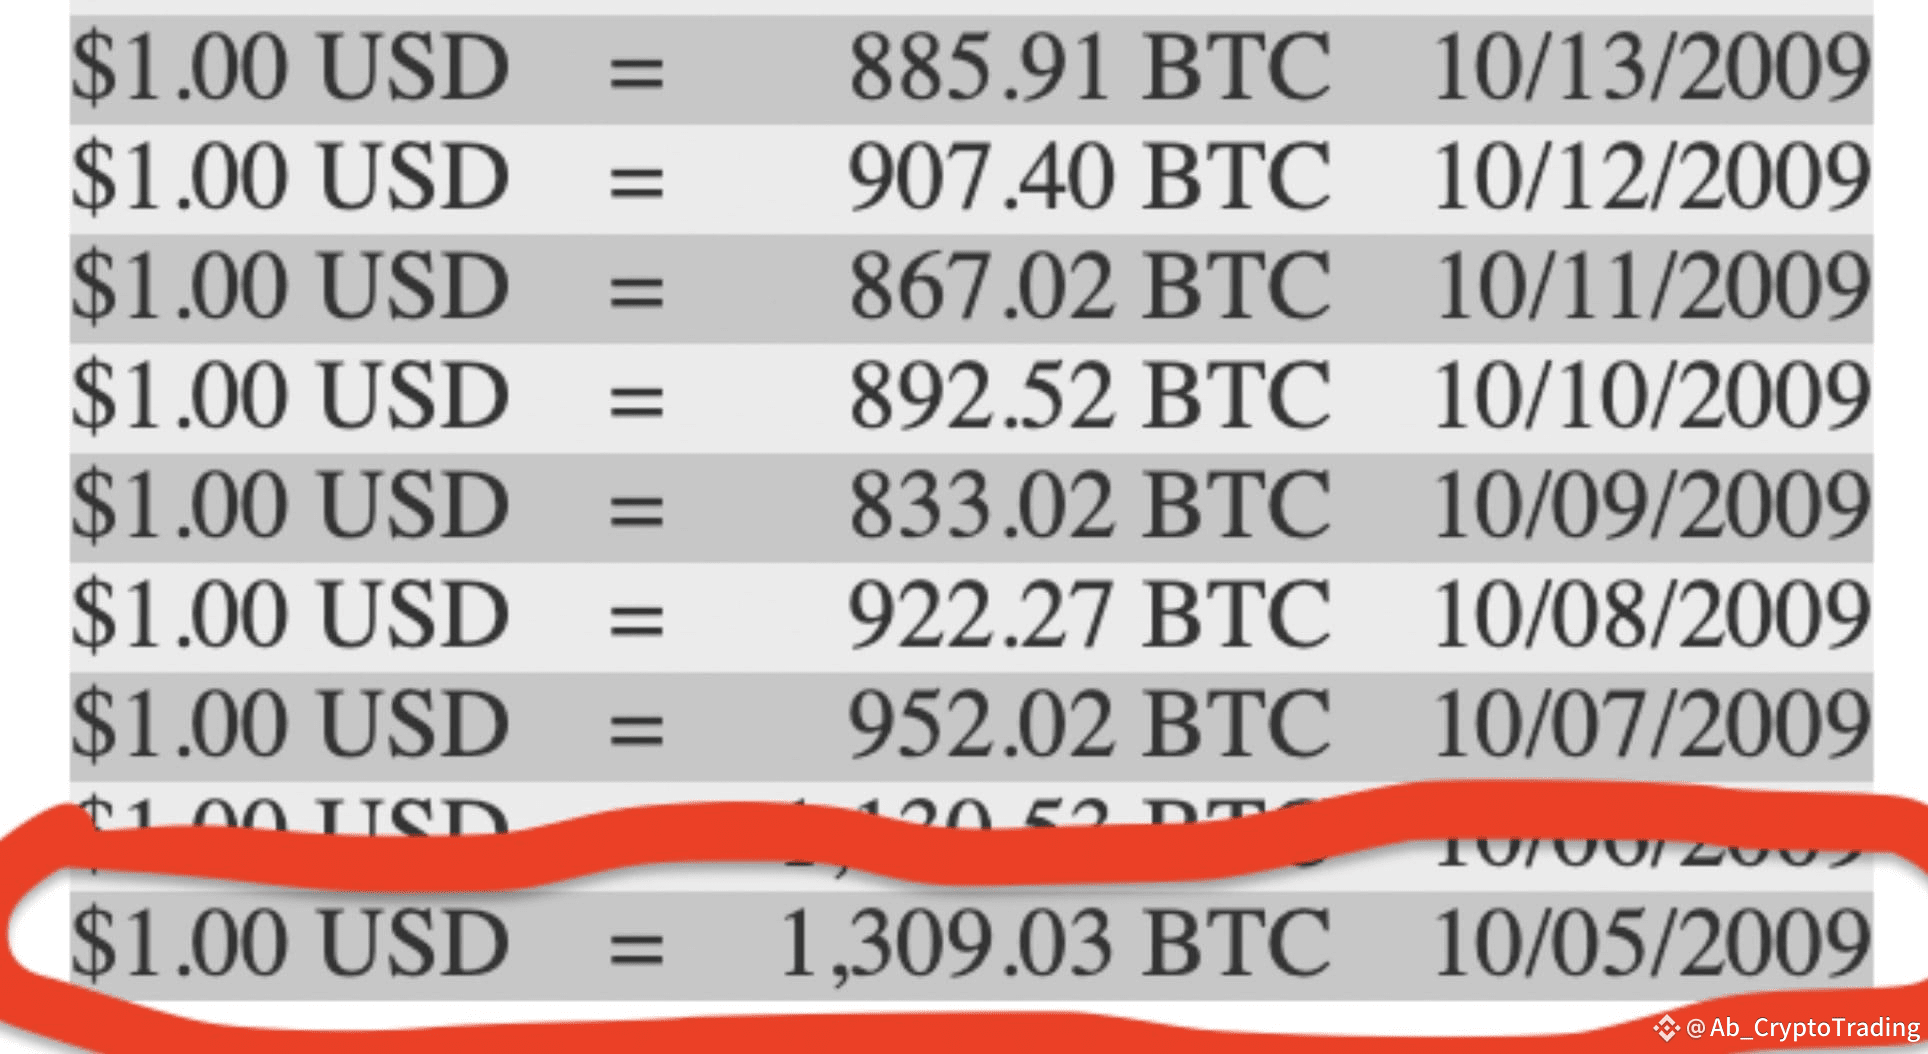
16 years ago, You could buy 1,309 #Bitcoin for $1
$1 = 1,309 BTC 🤯 $BTC
$USDT 1
#BTC 1,309
#BTCReclaims120K
#BNBBreaksATH
#Write2Earn
16 years ago, You could buy 1,309 #Bitcoin for $1
$1 = 1,309 BTC 🤯 $BTC
$USDT 1
#BTC 1,309
#BTCReclaims120K
#BNBBreaksATH
#Write2Earn
$1 = 1,309 BTC 🤯 $BTC
$USDT 1
#BTC 1,309
#BTCReclaims120K
#BNBBreaksATH
#Write2Earn
365
258
864
141.7k
PINNED
See translation
Everyone here is excited.
Why?
$80K $BTC on a Sunday.
But if you’re smart,
You know what this signals.
Let me break it down:
Next week is primed to be EVEN MORE bullish.
Why?
Weekends are typically low-volume,
Low-interest,
And often where pullbacks show up.
But the fact that we’re pushing this high on a weekend???
It’s a signal that buyers are piling in.
Now imagine what happens when the weekday volume kicks in.
When the big players return,
With more eyes on the charts and more liquidity flowing in.
This isn’t just a run-up;
It’s the setup for something much bigger.
Watch closely,
This is how breakouts become parabolic moves.$BTC #BTCBreaks80KATH #BIOProtocol #FedRateStrategy #EthereumRally #Write2Earn!
Why?
$80K $BTC on a Sunday.
But if you’re smart,
You know what this signals.
Let me break it down:
Next week is primed to be EVEN MORE bullish.
Why?
Weekends are typically low-volume,
Low-interest,
And often where pullbacks show up.
But the fact that we’re pushing this high on a weekend???
It’s a signal that buyers are piling in.
Now imagine what happens when the weekday volume kicks in.
When the big players return,
With more eyes on the charts and more liquidity flowing in.
This isn’t just a run-up;
It’s the setup for something much bigger.
Watch closely,
This is how breakouts become parabolic moves.$BTC #BTCBreaks80KATH #BIOProtocol #FedRateStrategy #EthereumRally #Write2Earn!
116
35
601
348.6k
See translation
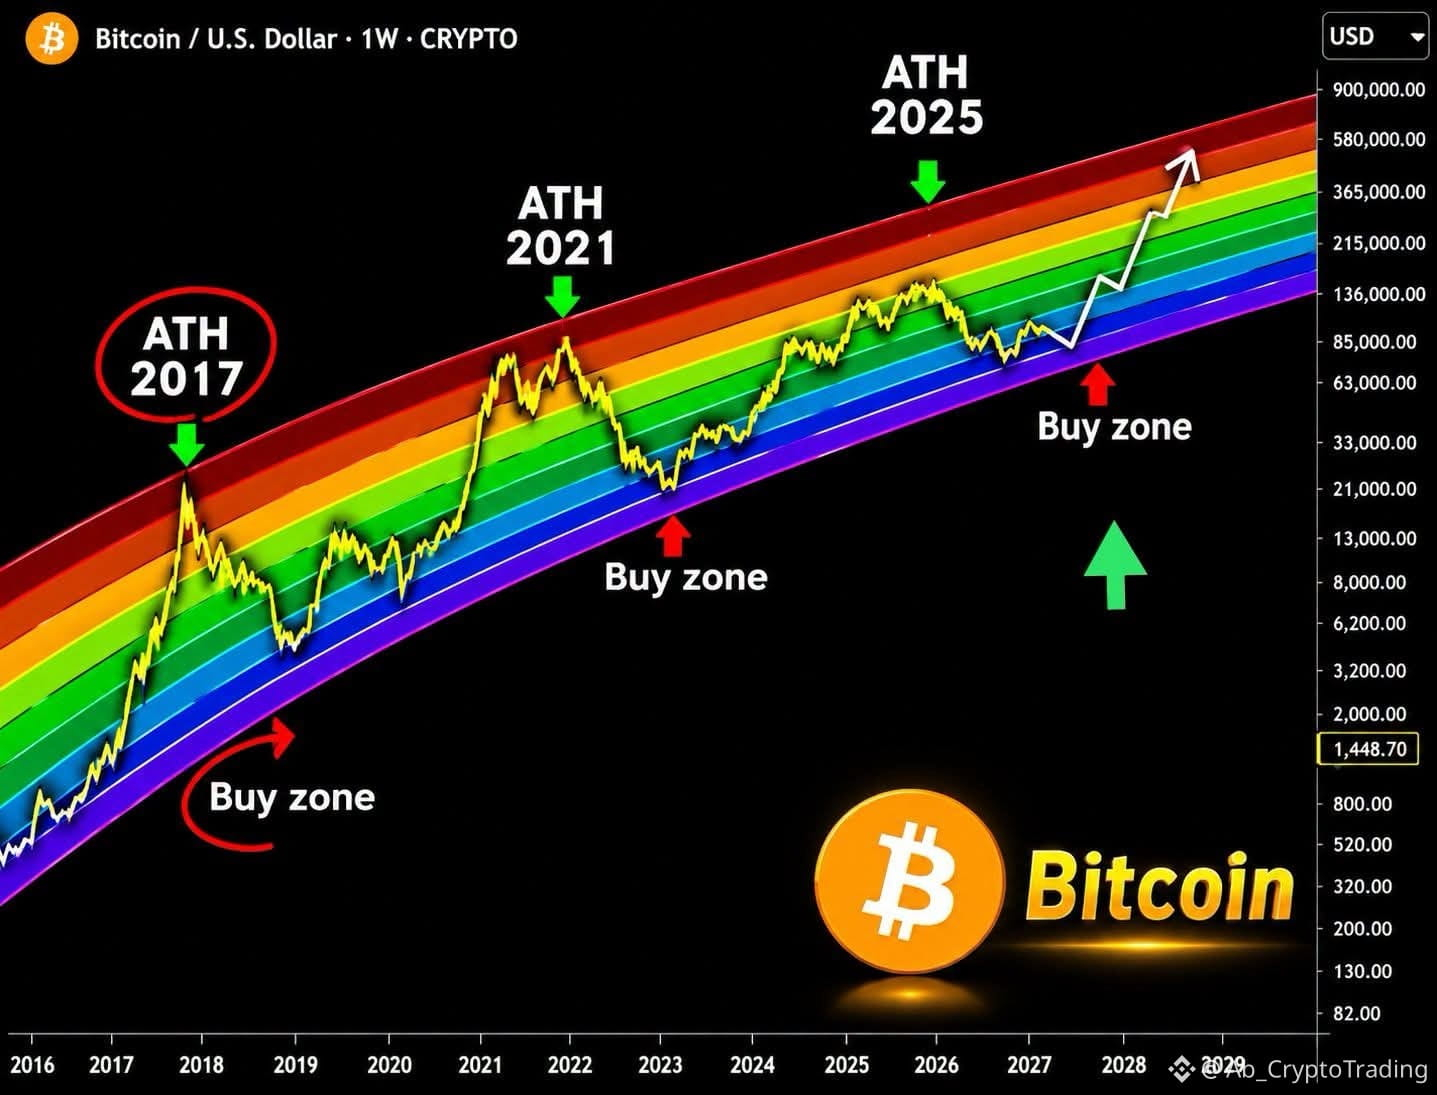
🚨 BITCOIN'S RAINBOW CHART IS POINTING TO A MASSIVE LONG-TERM MOVE. BUT SHOULD WE TRUST IT? 🌈
Look at the historical pattern.
Bitcoin has repeatedly moved through long-term price channels, with major cycle peaks in 2017, 2021, and 2025.
The chart highlights something interesting:
🔴 Previous cycle highs approached the upper bands.
🟢 Major accumulation opportunities appeared closer to the lower bands.
📈 The projected path suggests another potential expansion toward 2028–2029.
But here's the real debate:
Is Bitcoin following a long-term valuation model — or are we simply connecting historical dots and assuming the future will look like the past?
There are two very different ways to interpret this chart:
THE BULLISH ARGUMENT: Bitcoin's long-term adoption and historical cycles could continue supporting a higher price channel.
THE BEARISH ARGUMENT: Market maturity, institutional participation, liquidity, and changing macro conditions could make previous patterns less reliable.
👇 Where do you stand?
A) The Rainbow Channel still offers valuable long-term signals.
B) It's becoming less reliable as Bitcoin matures.
C) The long-term trend remains bullish, but the projected targets are too optimistic.
D) Technical models like this are useful for context, not investment decisions.
One question for experienced Bitcoin investors:
If Bitcoin breaks below the lower channel, would that invalidate the bullish thesis — or create the biggest opportunity of the cycle?
Let's debate the model, not just the price. 🔥 $BTC
#USDCCirculationFallsAbout800MInSevenDays
#CZSaysCompensationIsinPlaceUsersAreProtected
#YiHe:ProofOfReserves:10TokensAt100%Backing #Write2Earn #Write2Earn!
2
120
See translation
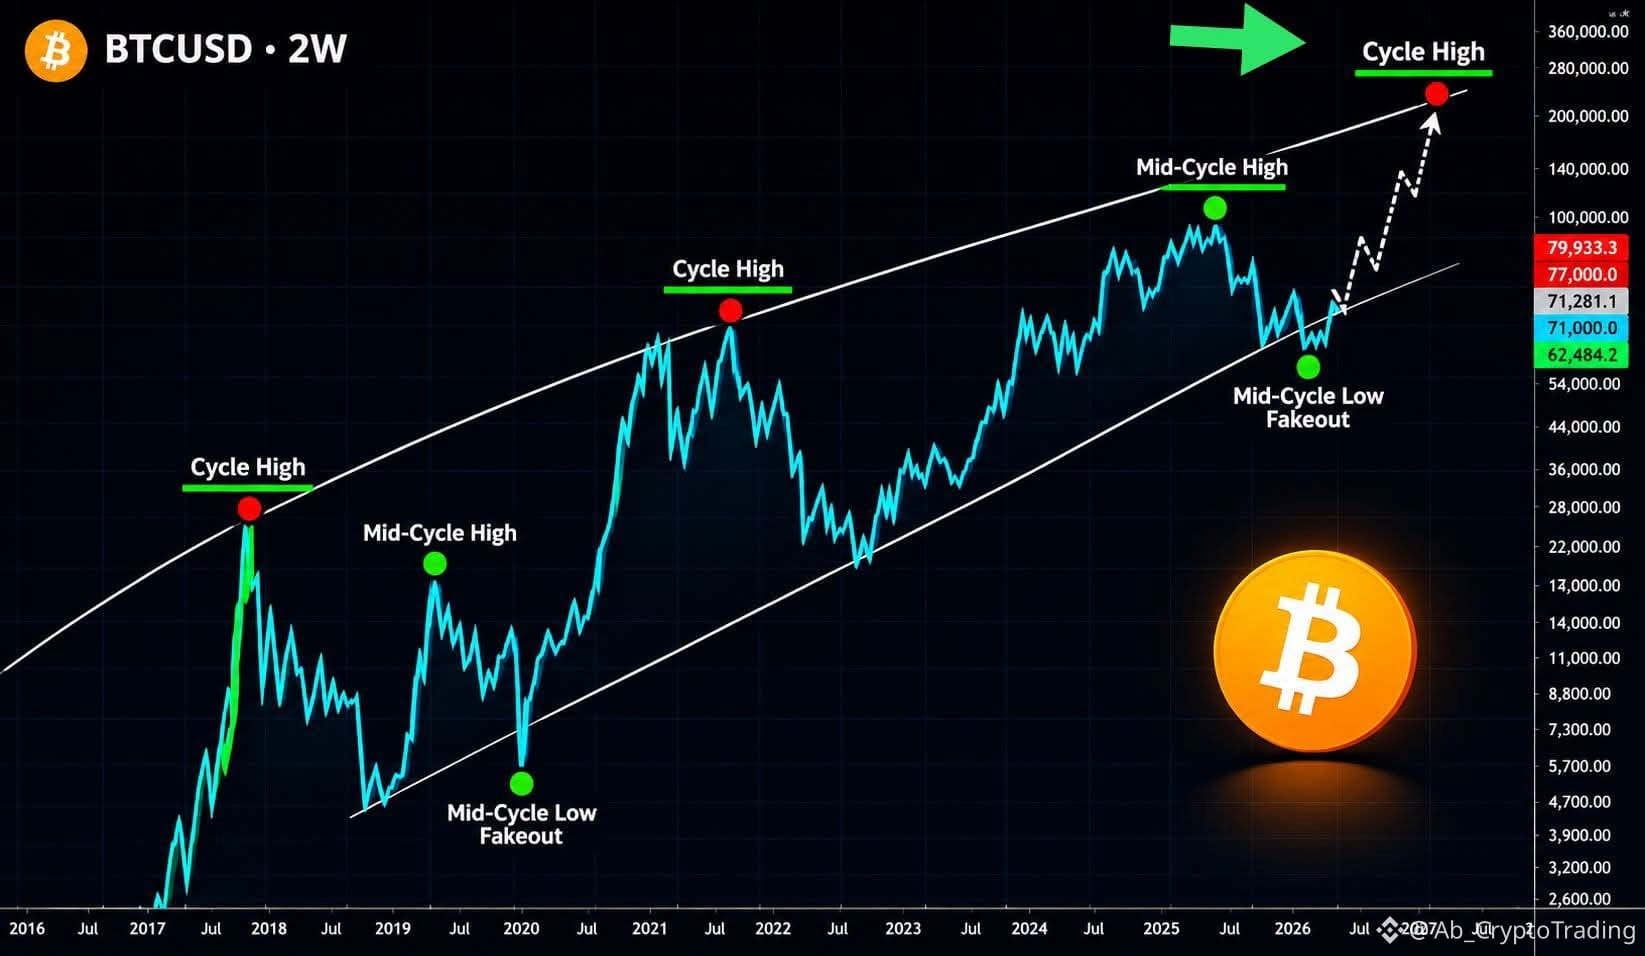
BITCOIN'S NEXT BIG MOVE: A MID-CYCLE SHAKEOUT OR A BROKEN MARKET CYCLE?
Something interesting is happening in Bitcoin's long-term chart.
Previous cycles have shown a recurring structure:
🔴 Major cycle highs.
🟢 Mid-cycle rallies.
🟢 Deep corrections that later turned into major recovery opportunities.
Now, this chart suggests that Bitcoin could be experiencing another mid-cycle shakeout — potentially setting the stage for a move toward new highs.
But there's a problem with this theory…
What if this time is different?
The market has changed. Institutional capital, spot ETFs, liquidity conditions, and macroeconomic forces are reshaping Bitcoin's behavior.
So here's the question:
Are we witnessing another temporary shakeout before the next major leg up, or are investors relying too heavily on historical patterns?
👇 Pick your position:
A) The cycle is still intact. The next major high could be ahead.
B) This is not a fakeout. Bitcoin's market structure is weakening.
C) The long-term trend remains bullish, but the old cycle model is becoming less reliable.
D) Historical patterns are useful for context, not for predicting the future.
And here's the question I really want debated:
What evidence would convince you that the traditional Bitcoin cycle is no longer working?
Let's hear arguments, not just price targets. 🔥 $BTC
#BinanceSAFUFundTransferCompleted7499BTC #YiHe:ProofOfReserves:10TokensAt100%Backing #CZSaysCompensationIsinPlaceUsersAreProtected #USDCCirculationFallsAbout800MInSevenDays #Write2Earn
3
234
See translation
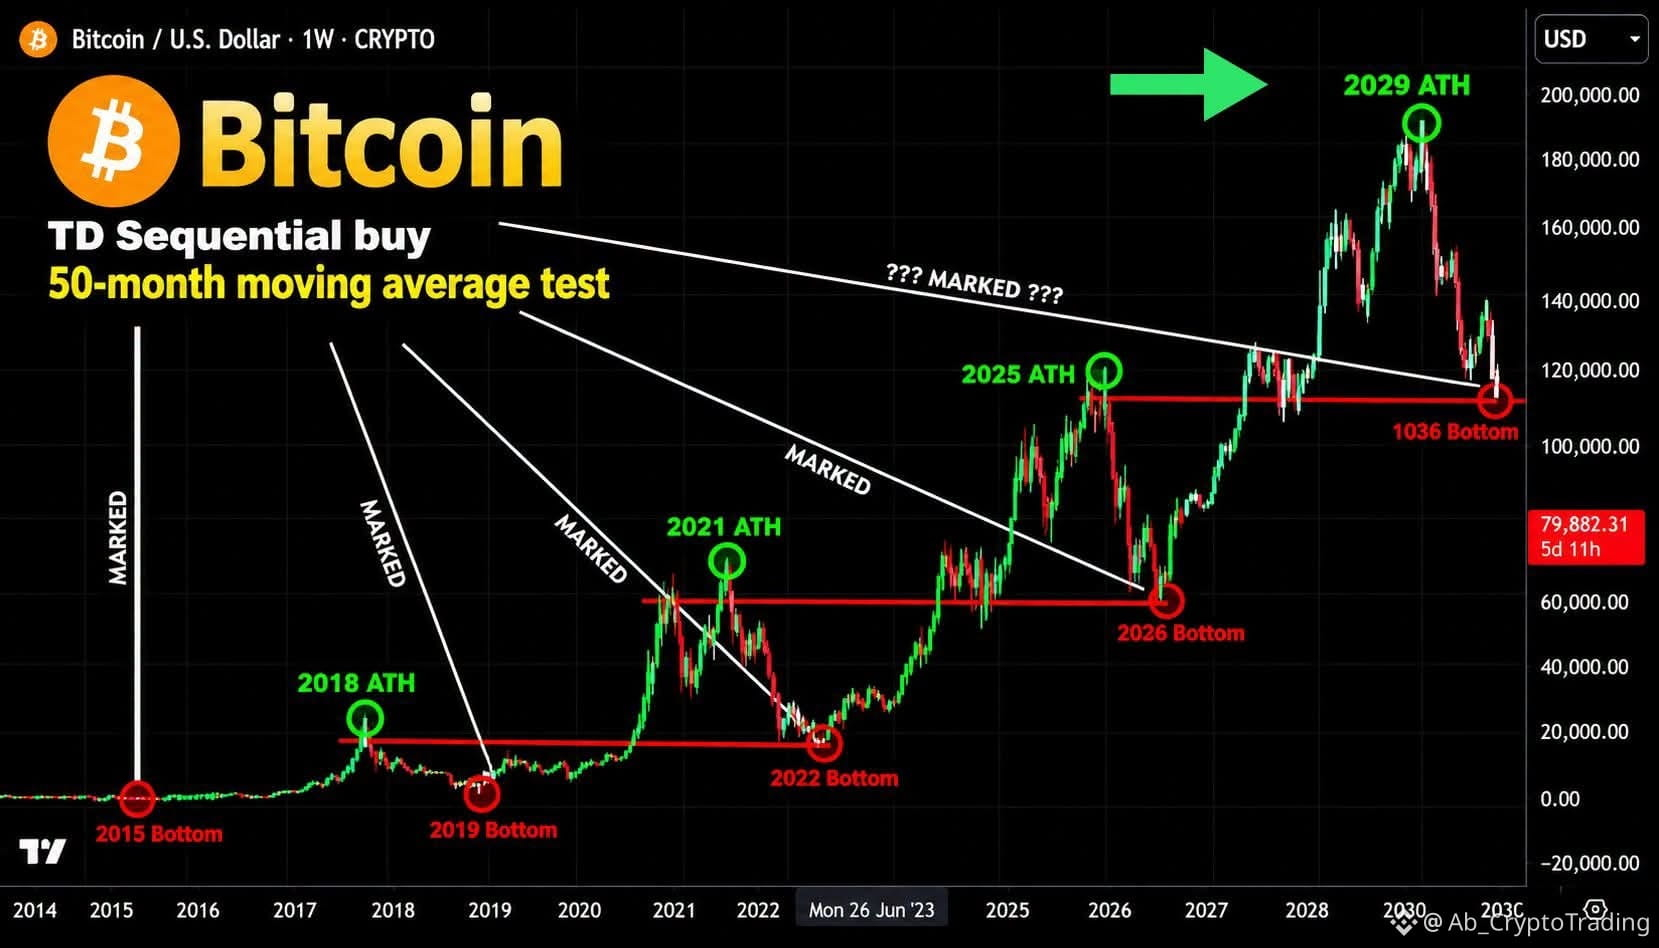
🚨 BITCOIN'S HISTORY MAY BE REPEATING… BUT ARE WE READING THE CYCLE CORRECTLY?
This chart raises an interesting question about Bitcoin's long-term market cycles.
Previous market peaks and bottoms have created patterns that many traders use to anticipate what could come next.
Now, this analysis suggests a possible long-term scenario:
📈 A new cycle high around 2029.
📉 Followed by another major correction toward 2030.
But here's where I want to challenge the idea:
Are Bitcoin's historical cycles still relevant, or has the market evolved too much for these patterns to work the same way?
Consider this:
- Institutional participation is much larger.
- ETFs have changed market access.
- Liquidity and macroeconomic conditions keep evolving.
- Bitcoin's supply dynamics remain different from traditional assets.
So, should we trust historical cycle patterns — or question them?
👇 Which statement do you agree with most?
A) History repeats. Bitcoin's cycle structure is still intact.
B) The cycle is changing. Previous patterns may no longer apply.
C) The long-term bullish trend remains, but the timing is unpredictable.
D) This entire projection is based on pattern-fitting, not reliable evidence.
I'm especially interested in hearing from traders who have followed multiple Bitcoin cycles.
What's the strongest argument AGAINST this chart?
$BTC
#CZSaysCompensationIsinPlaceUsersAreProtected
#YiHe:ProofOfReserves:10TokensAt100%Backing
#USDCCirculationFallsAbout800MInSevenDays
#Write2Earn #EarningsSeason
2
220
See translation
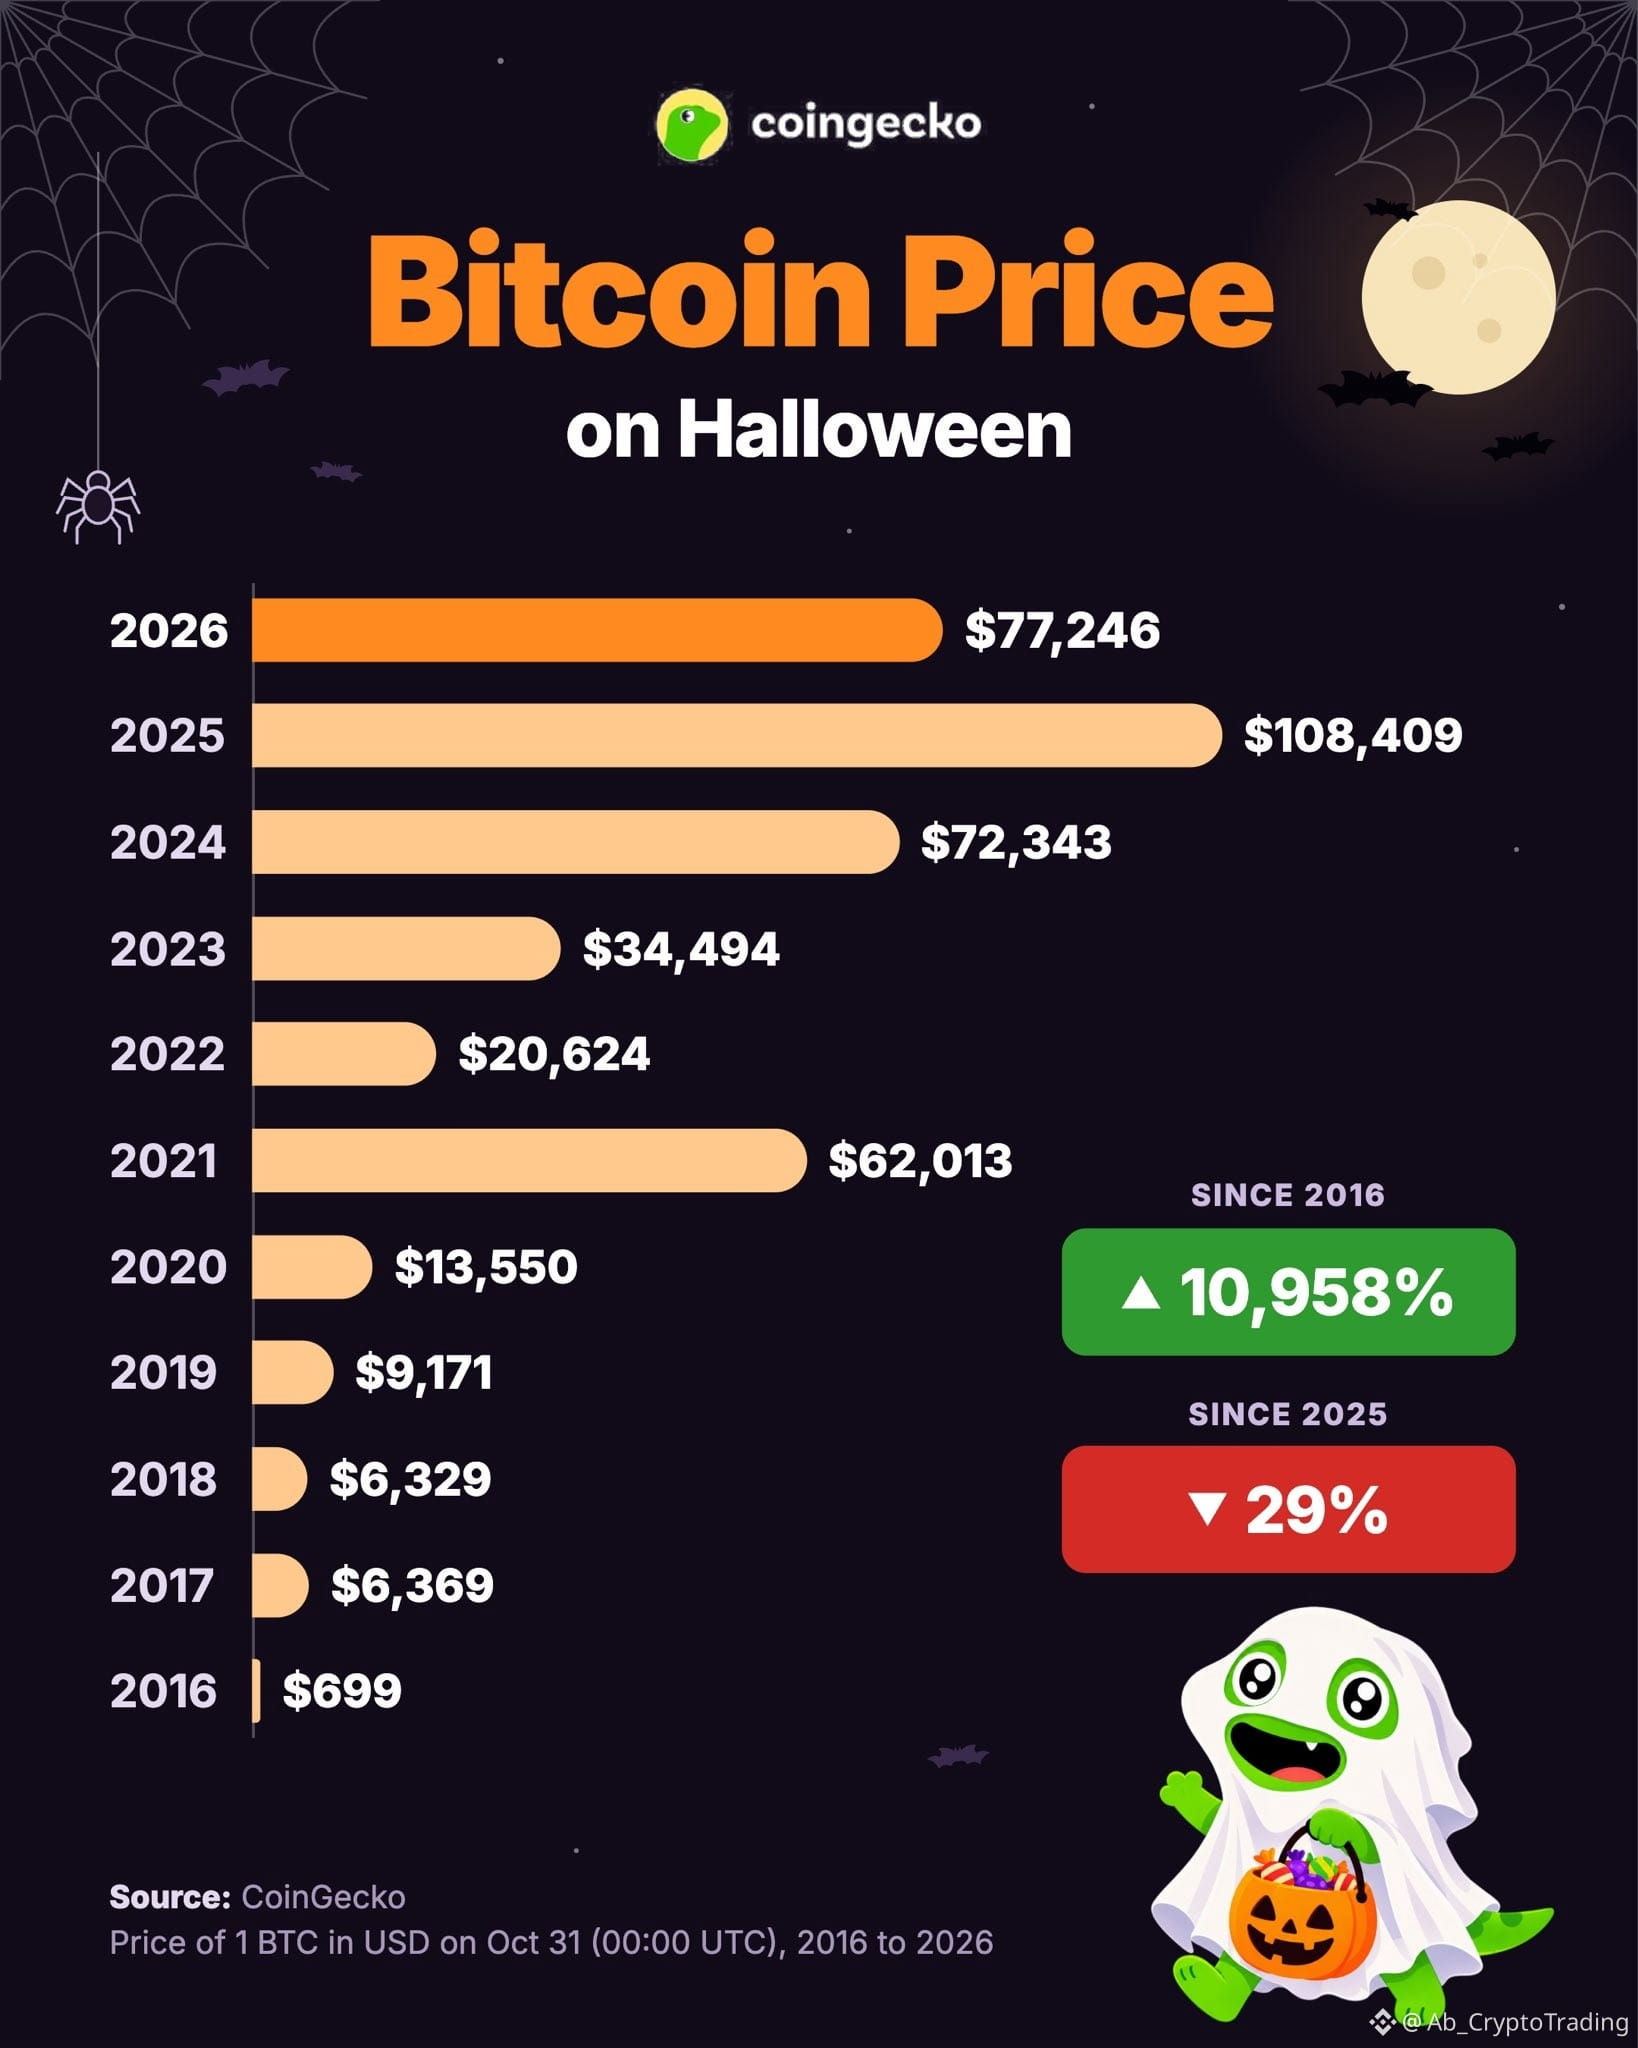
Price of Bitcoin on Halloween Day 🎃
2016: $699
2017: $6,369
2018: $6,329
2019: $9,171
2020: $13,550
2021: $62,013
2022: $20,624
2023: $34,494
2024: $72,343
2025: $108,409
2026: $77,246
$BTC
#HeYiSaysWithdrawalsExpectedtoResumeWithin42Hours #CZSaysCompensationIsinPlaceUsersAreProtected #BTC #Write2Earn #ASICHasReceivedNoPredictionMarketApplications
3
547
See translation
🚨 $ONDO /USDT — LONG SIGNAL 🟢📈
💰 Entry Zone: $0.4050 – $0.4100
🎯 Take Profit 1: $0.4180 🎯 Take Profit 2: $0.4260 🎯 Take Profit 3: $0.4380
🛑 Stop Loss: $0.3970
━━━━━━━━━━━━━━
📊 Trade Confirmation
🟢 Support: $0.4050 – $0.4100 🚀 Resistance: $0.4180 – $0.4260 📈 Watch for 15M & 1H bullish confirmation. 🔥 Look for breakout + successful retest with volume.
⚠️ Avoid chasing the price. Wait for confirmation.
💎 Trade Smart | Manage Risk 📚 DYOR • NFA
#HeYiSaysWithdrawalsExpectedtoResumeWithin42Hours #CZSaysCompensationIsinPlaceUsersAreProtected #ASICHasReceivedNoPredictionMarketApplications #USDCCirculationFallsAbout800MInSevenDays #Write2Earn

1
2
354
See translation
🚨 $BTC /USDT — LONG SIGNAL 🟢📈
🟢 Entry Zone: $77,000 – $77,400
🎯 Take Profit 1: $78,000 🎯 Take Profit 2: $78,800 🎯 Take Profit 3: $79,500
🛑 Stop Loss: $76,400
━━━━━━━━━━━━━━
📊 Trade Confirmation
* 🟢 Support: $77,000 – $77,200
* 🔥 Resistance: $78,000 – $78,500
* 📈 Bullish confirmation: 15m/1H candle close above $77,500
* ✅ Watch for breakout + retest with strong volume.
* ⚠️ Avoid chasing if price moves too far above entry.
━━━━━━━━━━━━━━
⚡ Leverage: 5x (10x = Higher Risk) 🎯 Market: BTC Futures
💎 Trade Smart | Protect Your Capital
⚠️ DYOR • NFA — Levels are illustrative, not verified live market data.
#BTC #Write2Earn #EarningsSeason

2
271
See translation
🚨 $AAVE /USDT — LONG SIGNAL 🟢📈
💰 Entry Zone: $130.50 – $132.00
🎯 Take Profit 1: $134.50 🎯 Take Profit 2: $137.00 🎯 Take Profit 3: $140.00
🛑 Stop Loss: $128.50
━━━━━━━━━━━━━━
📊 Trade Confirmation
🟢 Support: $130.00 – $131.00 🔴 Resistance: $134.50 – $137.00 📈 Watch for bullish 15M/1H candle confirmation. 🔥 Breakout above $134.50 could open the way toward $137–$140. ⚠️ Avoid chasing; wait for a successful retest with volume.
━━━━━━━━━━━━━━
💎 Trade Smart 🛡️ Manage Your Risk 📚 DYOR • NFA
#AAVE #Write2Earn #Write2Earn! #EarningsSeason #UniswapA16zSeekDeFiExemptionFromIllinoisCryptoTax

2
200
See translation
🚨 $ETH /USDT — LONG SIGNAL 🟢📈
💵 Entry Zone: $2,235 – $2,250
🎯 Take Profit 1: $2,275 🎯 Take Profit 2: $2,305 🎯 Take Profit 3: $2,345
🛑 Stop Loss: $2,215
━━━━━━━━━━━━━━
📊 Trade Confirmation
🟢 Support: $2,230 – $2,240 🔴 Resistance: $2,275 – $2,305 📈 Bullish confirmation: 15m candle close above $2,250 🔥 Watch for breakout + retest with strong volume.
⚠️ If ETH loses $2,230, reconsider the long setup. Avoid chasing the price.
💎 Trade Smart | Manage Risk 📚 DYOR • NFA
#ETH #KOSPIFalls3.53%BackBelow6000 #UniswapA16zSeekDeFiExemptionFromIllinoisCryptoTax #Write2Earn #Write2Earn!

4
212
See translation
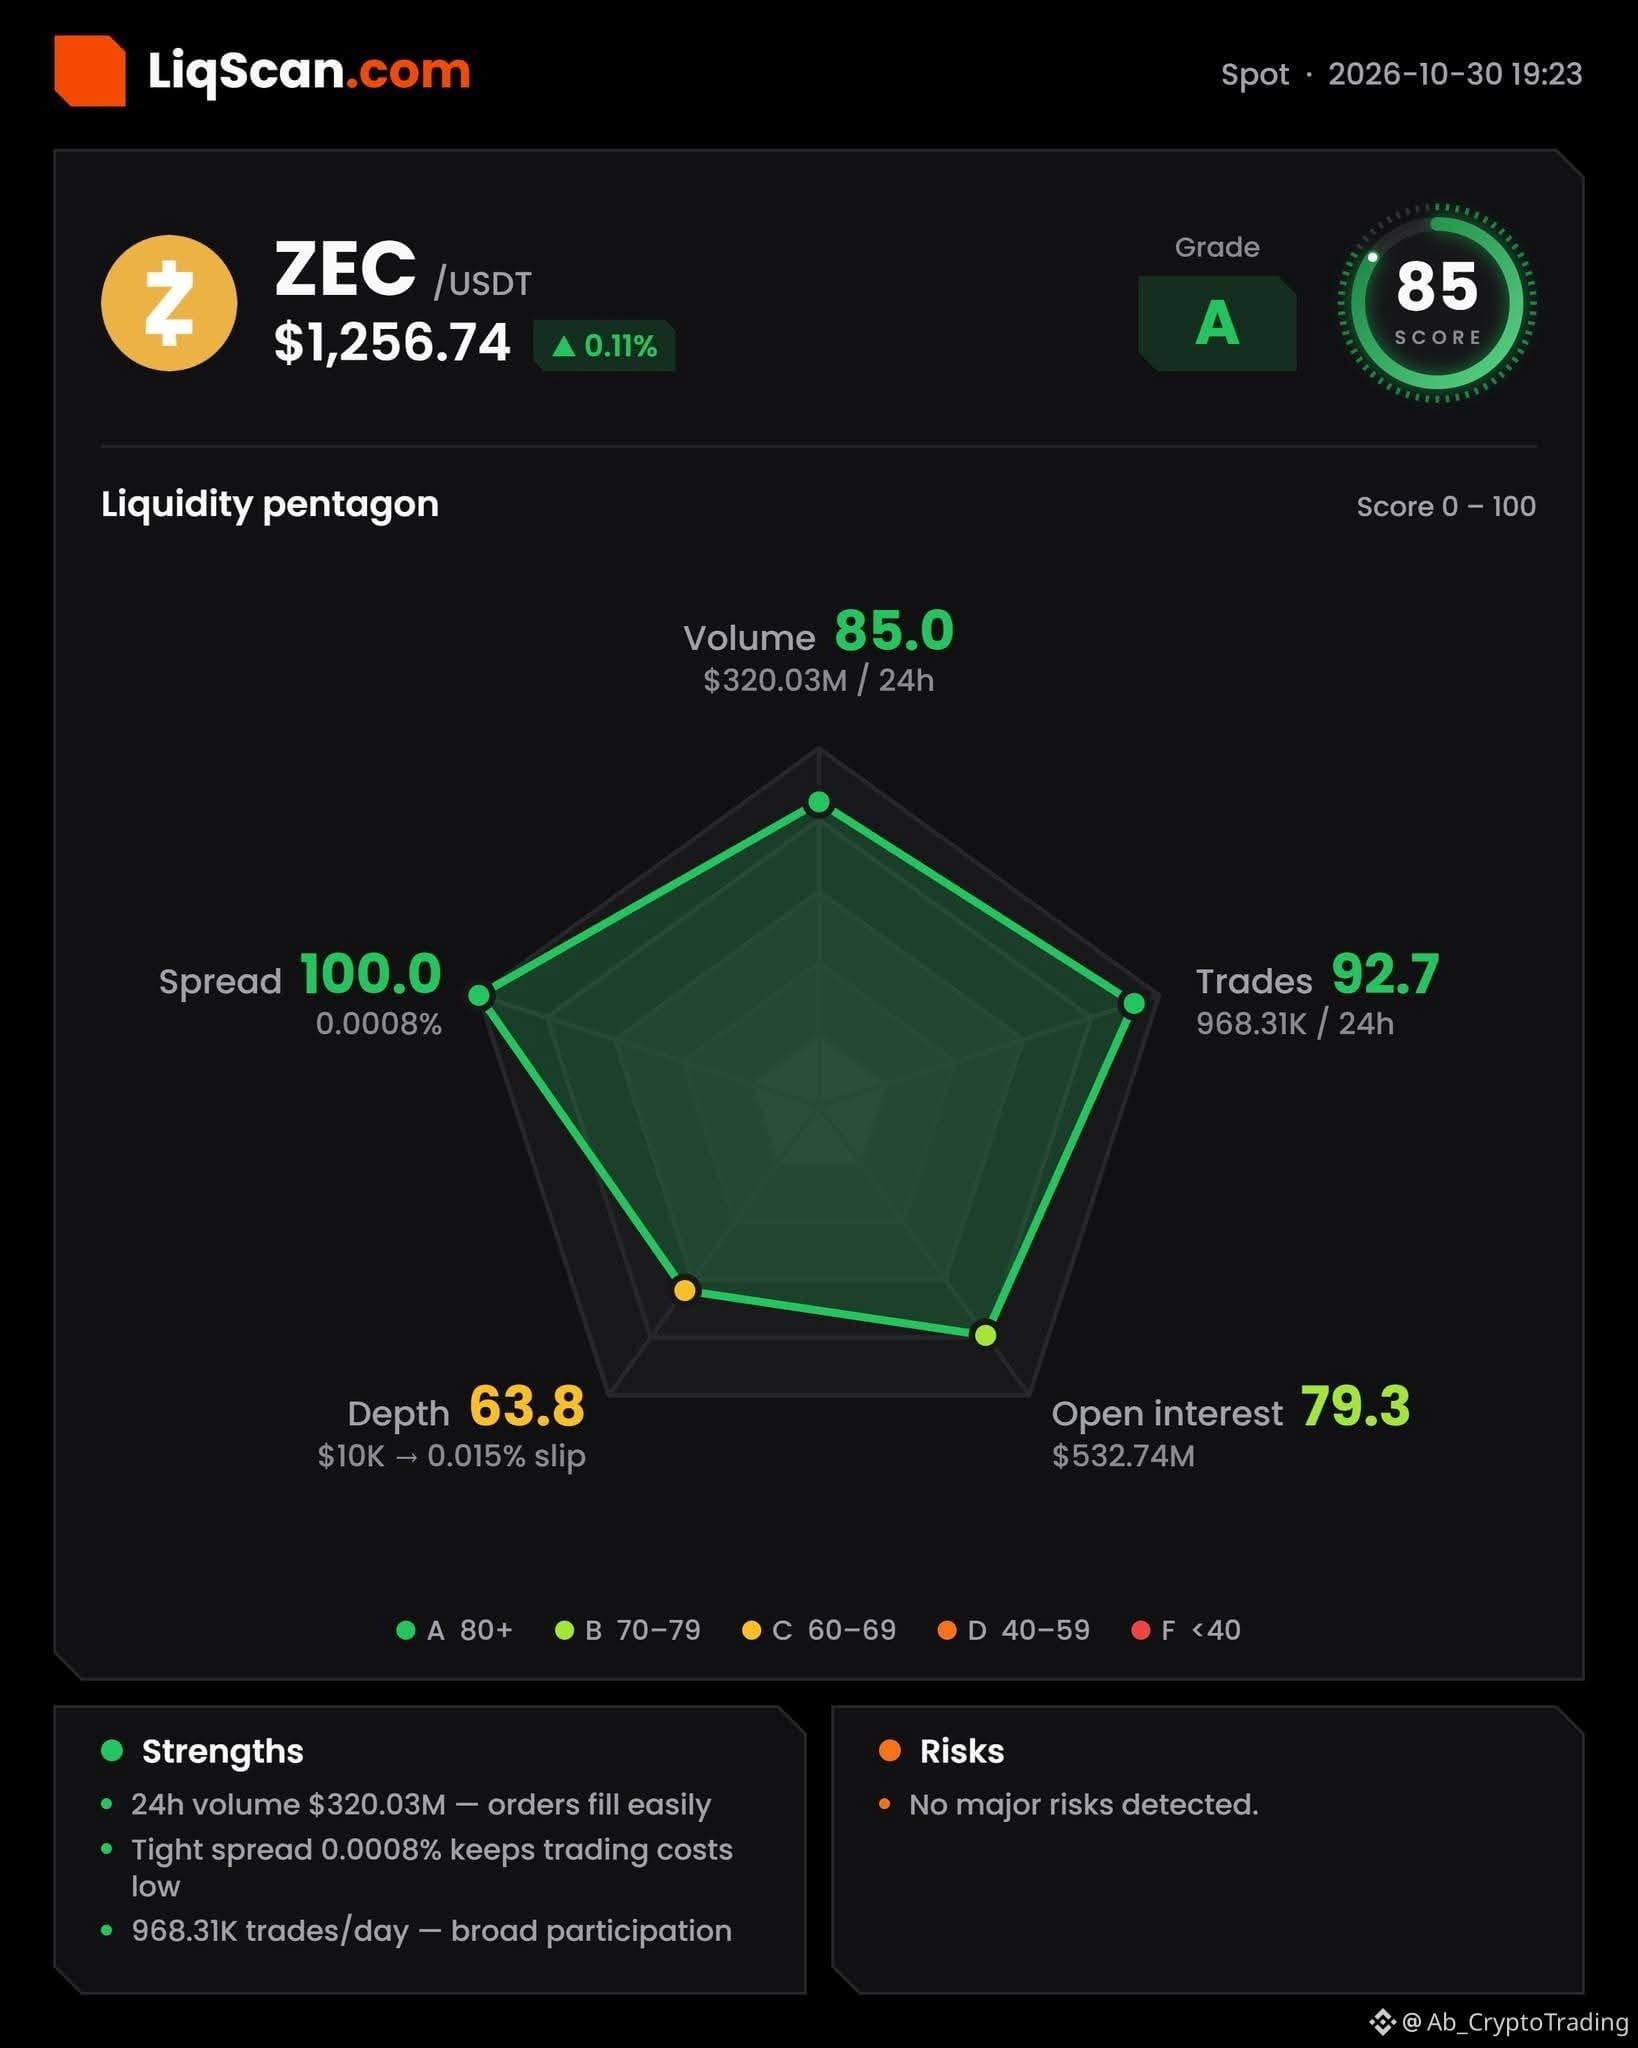
🚨 $ZEC /USDT — LONG SIGNAL 🟢📈
💵 Entry Zone: $1,215 – $1,235
🎯 Take Profit 1: $1,260 🎯 Take Profit 2: $1,290 🎯 Take Profit 3: $1,330
🛑 Stop Loss: $1,190
━━━━━━━━━━━━━━
📊 Trade Confirmation
* 🟢 Support: $1,200 – $1,215
* 🔴 Resistance: $1,260 – $1,285
* ⏳ Timeframe: 15M / 1H
* 📈 Watch for bullish candle confirmation.
* 🔥 Breakout above $1,260 could open the way toward higher targets.
* ⚠️ Avoid chasing pumps; wait for a confirmed retest.
━━━━━━━━━━━━━━
💎 Trade Smart ⚡ Leverage: 5x (10x = Higher Risk) 🛡️ Manage Your Risk
⚠️ DYOR • NFA
#HKDollarStablecoinHKDAPToLaunchOnSolana #KOSPIFalls3.53%BackBelow6000 #AmazonSharesFallAbout7%InPremarketTrading #Write2Earn #Write2Earn!

4
288
See translation
$BTC By the time they believe, Bitcoin will be over $100,000.
$BTC By the time they believe, Bitcoin will be over $100,000.

3
161
See translation
$BTC — testing the downtrend line right now 👀
$81,500, right at resistance ($84.8K-87K) after falling from $126K. RSI near 60 (neutral-bullish), but Stochastic's in overbought territory — watch for a pullback here.
Break above $87K: target $92K-95K 📈
Break below $77K: back to $69K-72K 📉
This is the exact level that's rejected it before. Does $BTC finally break the downtrend, or does history repeat? 👇
#BTC
#USMidtermElections #Write2Earn #EarningsSeason
#UniswapA16zSeekDeFiExemptionFromIllinoisCryptoTax

4
184
See translation
If you could keep only one coin for 5 years, which one?
$DOGE $WLD $SUI 👇
If you could keep only one coin for 5 years, which one?
$DOGE $WLD $SUI 👇
$DOGE $WLD $SUI 👇

3
10
901
See translation
My portfolio: #BTC , #ETH , $LINK , $TSLA , $MUB and some cash.
What would you change?
#USMidtermElections
#EarningsSeason
#KOSPIFalls3.53%BackBelow6000
My portfolio: #BTC , #ETH , $LINK , $TSLA , $MUB and some cash.
What would you change?
#USMidtermElections
#EarningsSeason
#KOSPIFalls3.53%BackBelow6000
What would you change?
#USMidtermElections
#EarningsSeason
#KOSPIFalls3.53%BackBelow6000

1
3
229
🎙️ If it itches, scratch in silence while we make money over here 🔥🤍🔥

End
04 h 57 m 25 s
3.3k
9
4
See translation
Buying Bitcoin at $77k today is like buying it at $30k in 2023. $BTC
Buying Bitcoin at $77k today is like buying it at $30k in 2023. $BTC
1
1
161
See translation
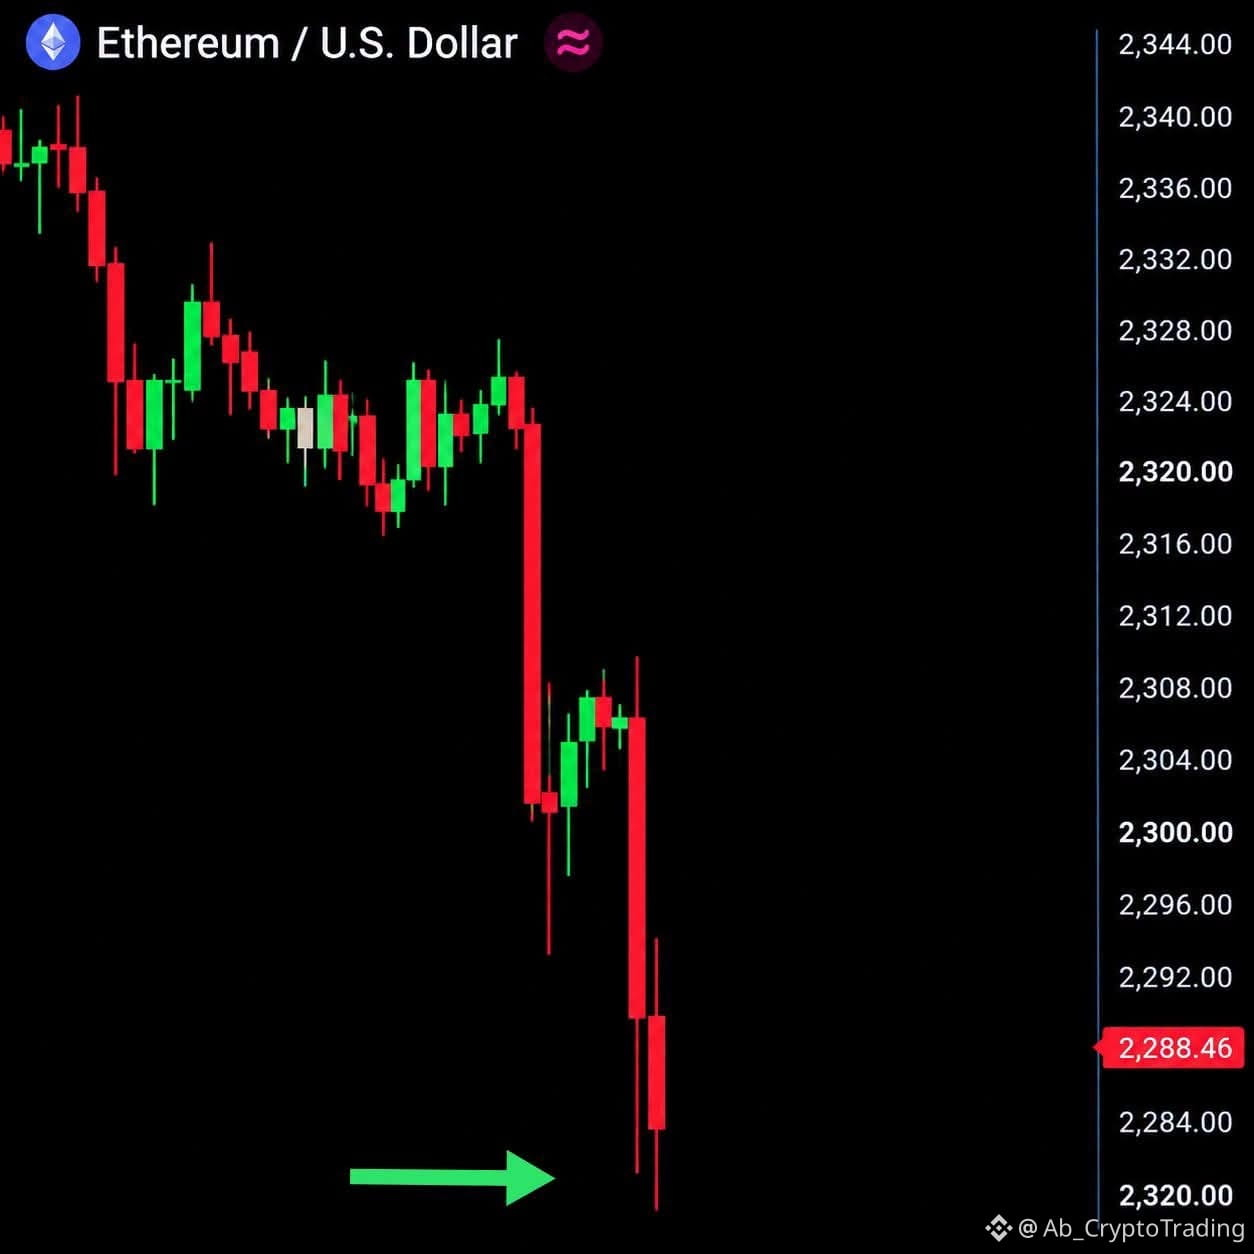
🚨 ETHEREUM IS UNDER PRESSURE — AND THE SELL-OFF IS GETTING HARDER TO IGNORE.
Ethereum has taken another sharp hit, as selling pressure spreads across the crypto market.
The latest market turmoil has raised serious questions about investor confidence, exchange security, leveraged positions, and institutional demand.
But here’s the bigger question:
Is this simply a wave of panic selling — or is the market signaling a deeper problem?
🐻 The Bearish Argument:
- Selling pressure remains elevated.
- Leveraged positions are being forced out.
- ETF outflows are adding to concerns about institutional demand.
- Confidence across the crypto market is being tested.
🐂 The Bullish Argument:
- Sharp liquidations can create temporary market dislocations.
- Fear-driven selling doesn't always reflect long-term value.
- A strong recovery could emerge once forced selling subsides.
What's your take on $ETH right now?
A — More downside is likely.
B — The market is overreacting, and a rebound is coming.
C — Ethereum needs a major catalyst to regain momentum.
D — This is a broader crypto-market confidence issue, not just an $ETH problem.
Don't just pick a letter.
What's the strongest evidence behind your view? 👇
#UniswapA16zSeekDeFiExemptionFromIllinoisCryptoTax #HKDollarStablecoinHKDAPToLaunchOnSolana #BinanceWillListPredictPREDICT #USMidtermElections #Write2Earn!
1
101
See translation
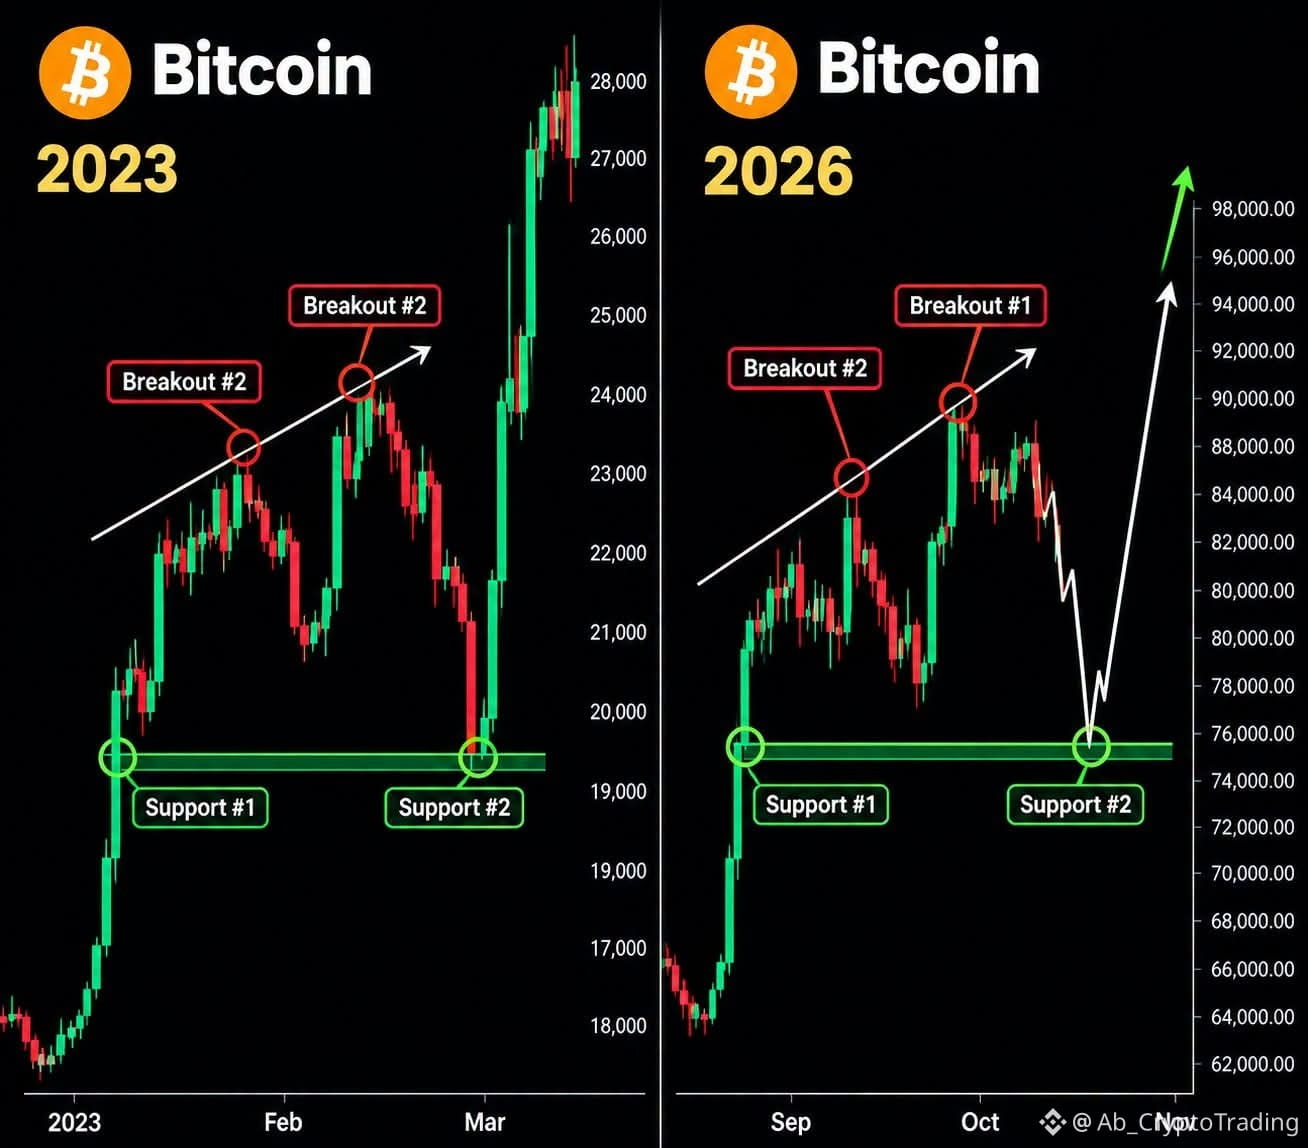
🚨 BITCOIN 2023 vs. 2026 — HISTORY RHYMING AGAIN?
Look closely at these two structures. 👀
In 2023, Bitcoin broke above a key resistance trendline, retested support, and then accelerated higher.
Now, a similar-looking structure is emerging again.
But here’s where the debate gets interesting…
📉 What if Bitcoin experiences another pullback toward support before the next major move?
📈 Could that retest become the launchpad for another leg higher?
Or are traders simply forcing a historical pattern onto a completely different market environment?
One thing is certain: a similar chart doesn’t guarantee a similar outcome.
The real question is whether liquidity, market structure, and buyer demand will confirm the pattern.
Which side are you on?
A) The 2023 structure is repeating — another move higher is possible.
B) This cycle is different, and the comparison is misleading.
C) The pattern may repeat, but the next move depends entirely on how price reacts at support.
I’m more interested in the reasoning behind each view than in a bold price target. 👇 $BTC
#USMidtermElections #BinanceWillListPredictPREDICT #UniswapA16zSeekDeFiExemptionFromIllinoisCryptoTax #Write2Earn #BTC
2
203
Log in to explore more content
Join global crypto users on Binance Square
⚡️ Get latest and useful information about crypto.
💬 Trusted by the world’s largest crypto exchange.
👍 Discover real insights from verified creators.
Email / Phone number
Trending Topics
BinanceSAFUFundTransferCompleted7499BTC
30,017 views
698 Discussing
Binance Says SAFU Fund Transfer Completed, Covering 7,499 BTC
Binance News
·38 Likes
·21.1k views
BinanceRecovery90% of stolen assets
119,955 views
157 Discussing
YiHe:ProofOfReserves:10TokensAt100%Backing
123,741 views
693 Discussing