
#intcb
intcb
22,797 views
646 Discussing
Hot
Latest

·
--
See translation
Is $INTCB building momentum or stalling near recent highs?
The asset trades at $56.12, reflecting a 2.60% daily gain on $12.45M in volume. Notably, recent hourly volume is significantly lower than the preceding average, signaling cautious participation despite the upward move.
Watch for a clean breakout above the 57.00 range high to confirm potential strength. Conversely, a drop below the 52.49 range low would invalidate the current bullish structure.
Does this volume divergence suggest a breakout is imminent, or is the lack of buyer participation a warning of exhaustion?
Tap $INTCB for the live chart. #INTCB #BinanceSquare
Is $INTCB building momentum or stalling near recent highs?
The asset trades at $56.12, reflecting a 2.60% daily gain on $12.45M in volume. Notably, recent hourly volume is significantly lower than the preceding average, signaling cautious participation despite the upward move.
Watch for a clean breakout above the 57.00 range high to confirm potential strength. Conversely, a drop below the 52.49 range low would invalidate the current bullish structure.
Does this volume divergence suggest a breakout is imminent, or is the lack of buyer participation a warning of exhaustion?
Tap $INTCB for the live chart. #INTCB #BinanceSquare
The asset trades at $56.12, reflecting a 2.60% daily gain on $12.45M in volume. Notably, recent hourly volume is significantly lower than the preceding average, signaling cautious participation despite the upward move.
Watch for a clean breakout above the 57.00 range high to confirm potential strength. Conversely, a drop below the 52.49 range low would invalidate the current bullish structure.
Does this volume divergence suggest a breakout is imminent, or is the lack of buyer participation a warning of exhaustion?
Tap $INTCB for the live chart. #INTCB #BinanceSquare
2

·
--
See translation
Is the current $INTCB liquidity sufficient to sustain this recent momentum?
Trading at $55.51, the asset shows a 1.57% gain, though hourly volume has dipped to just 0.31x of the 23-hour average. This suggests potential exhaustion after recent volatility.
A bullish scenario requires a clean breakout above $57 to confirm renewed interest. Conversely, failing to hold the $52.49 range low would invalidate the current structure.
Does the drop in hourly volume signal a genuine cooling off period, or are traders simply waiting for a breakout above $57?
Tap $INTCB for the live chart. #INTCB #BinanceSquare
Is the current $INTCB liquidity sufficient to sustain this recent momentum?
Trading at $55.51, the asset shows a 1.57% gain, though hourly volume has dipped to just 0.31x of the 23-hour average. This suggests potential exhaustion after recent volatility.
A bullish scenario requires a clean breakout above $57 to confirm renewed interest. Conversely, failing to hold the $52.49 range low would invalidate the current structure.
Does the drop in hourly volume signal a genuine cooling off period, or are traders simply waiting for a breakout above $57?
Tap $INTCB for the live chart. #INTCB #BinanceSquare
Trading at $55.51, the asset shows a 1.57% gain, though hourly volume has dipped to just 0.31x of the 23-hour average. This suggests potential exhaustion after recent volatility.
A bullish scenario requires a clean breakout above $57 to confirm renewed interest. Conversely, failing to hold the $52.49 range low would invalidate the current structure.
Does the drop in hourly volume signal a genuine cooling off period, or are traders simply waiting for a breakout above $57?
Tap $INTCB for the live chart. #INTCB #BinanceSquare
56

·
--
Bullish
See translation
🚀 Intel is waking up — and $57.00 is the line that matters
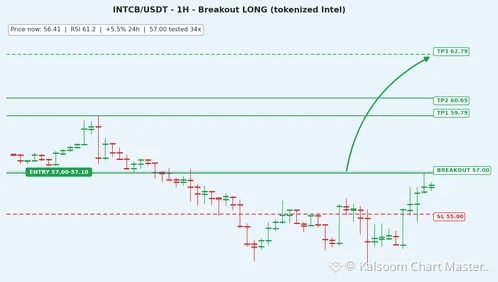
INTCB (tokenized Intel stock on Binance) is +5.5% today at $56.41, riding the chip rally after Nvidia's earnings beat. Hourly closes have climbed all day — $53.51 → $56.41 — and it's above both EMAs with RSI 61.2.
Why $57.00 matters: it's the 24h high, tested 34 times in 48 hours. A break above it opens $59.79, then $60.65.
Roadmap:
$55.00 support → $56.41 → $57.00 breakout → $59.79 → $60.65 → $62.79
🟢 LONG — $INTCB (on breakout)
Entry: $57.00 – $57.10
SL: $55.00
TP1: $59.79 | TP2: $60.65 | TP3: $62.79
⚠️ Don't buy at $56.41 — wait for the break of $57.00. If it rejects $57.00 again, the breakout fails.
Receipts: our calls overnight — SOL TP2 $75, BREV TP2 $0.1200, MMT full TP3, ZEC TP1.
Is Intel the next chip stock to run? 🤔
#intcb #Intel #Stocks
NFA — This is not financial advice, DYOR.
🚀 Intel is waking up — and $57.00 is the line that matters
INTCB (tokenized Intel stock on Binance) is +5.5% today at $56.41, riding the chip rally after Nvidia's earnings beat. Hourly closes have climbed all day — $53.51 → $56.41 — and it's above both EMAs with RSI 61.2.
Why $57.00 matters: it's the 24h high, tested 34 times in 48 hours. A break above it opens $59.79, then $60.65.
Roadmap:
$55.00 support → $56.41 → $57.00 breakout → $59.79 → $60.65 → $62.79
🟢 LONG — $INTCB (on breakout)
Entry: $57.00 – $57.10
SL: $55.00
TP1: $59.79 | TP2: $60.65 | TP3: $62.79
⚠️ Don't buy at $56.41 — wait for the break of $57.00. If it rejects $57.00 again, the breakout fails.
Receipts: our calls overnight — SOL TP2 $75, BREV TP2 $0.1200, MMT full TP3, ZEC TP1.
Is Intel the next chip stock to run? 🤔
#intcb #Intel #Stocks
NFA — This is not financial advice, DYOR.
INTCB (tokenized Intel stock on Binance) is +5.5% today at $56.41, riding the chip rally after Nvidia's earnings beat. Hourly closes have climbed all day — $53.51 → $56.41 — and it's above both EMAs with RSI 61.2.
Why $57.00 matters: it's the 24h high, tested 34 times in 48 hours. A break above it opens $59.79, then $60.65.
Roadmap:
$55.00 support → $56.41 → $57.00 breakout → $59.79 → $60.65 → $62.79
🟢 LONG — $INTCB (on breakout)
Entry: $57.00 – $57.10
SL: $55.00
TP1: $59.79 | TP2: $60.65 | TP3: $62.79
⚠️ Don't buy at $56.41 — wait for the break of $57.00. If it rejects $57.00 again, the breakout fails.
Receipts: our calls overnight — SOL TP2 $75, BREV TP2 $0.1200, MMT full TP3, ZEC TP1.
Is Intel the next chip stock to run? 🤔
#intcb #Intel #Stocks
NFA — This is not financial advice, DYOR.
68

·
--
See translation
$INTCB looks ready to go higher from here 🚀
It is holding strong right near today's high at $56.3200
RSI sits at 58 showing power without being too hot
Volume is up at $15.5M as buyers step in today
🎯 Buy $INTCB 55.2136 to 56.1591
Stop loss 51.8596
Targets 62.1355 / 66.2459 / 72.4114
Tap $INTCB to buy it here
#INTCB #TradingSignals
$INTCB looks ready to go higher from here 🚀
It is holding strong right near today's high at $56.3200
RSI sits at 58 showing power without being too hot
Volume is up at $15.5M as buyers step in today
🎯 Buy $INTCB 55.2136 to 56.1591
Stop loss 51.8596
Targets 62.1355 / 66.2459 / 72.4114
Tap $INTCB to buy it here
#INTCB #TradingSignals
It is holding strong right near today's high at $56.3200
RSI sits at 58 showing power without being too hot
Volume is up at $15.5M as buyers step in today
🎯 Buy $INTCB 55.2136 to 56.1591
Stop loss 51.8596
Targets 62.1355 / 66.2459 / 72.4114
Tap $INTCB to buy it here
#INTCB #TradingSignals

·
--
See translation
$INTCB Price Breaks Below Recent Low into Oversold Zone
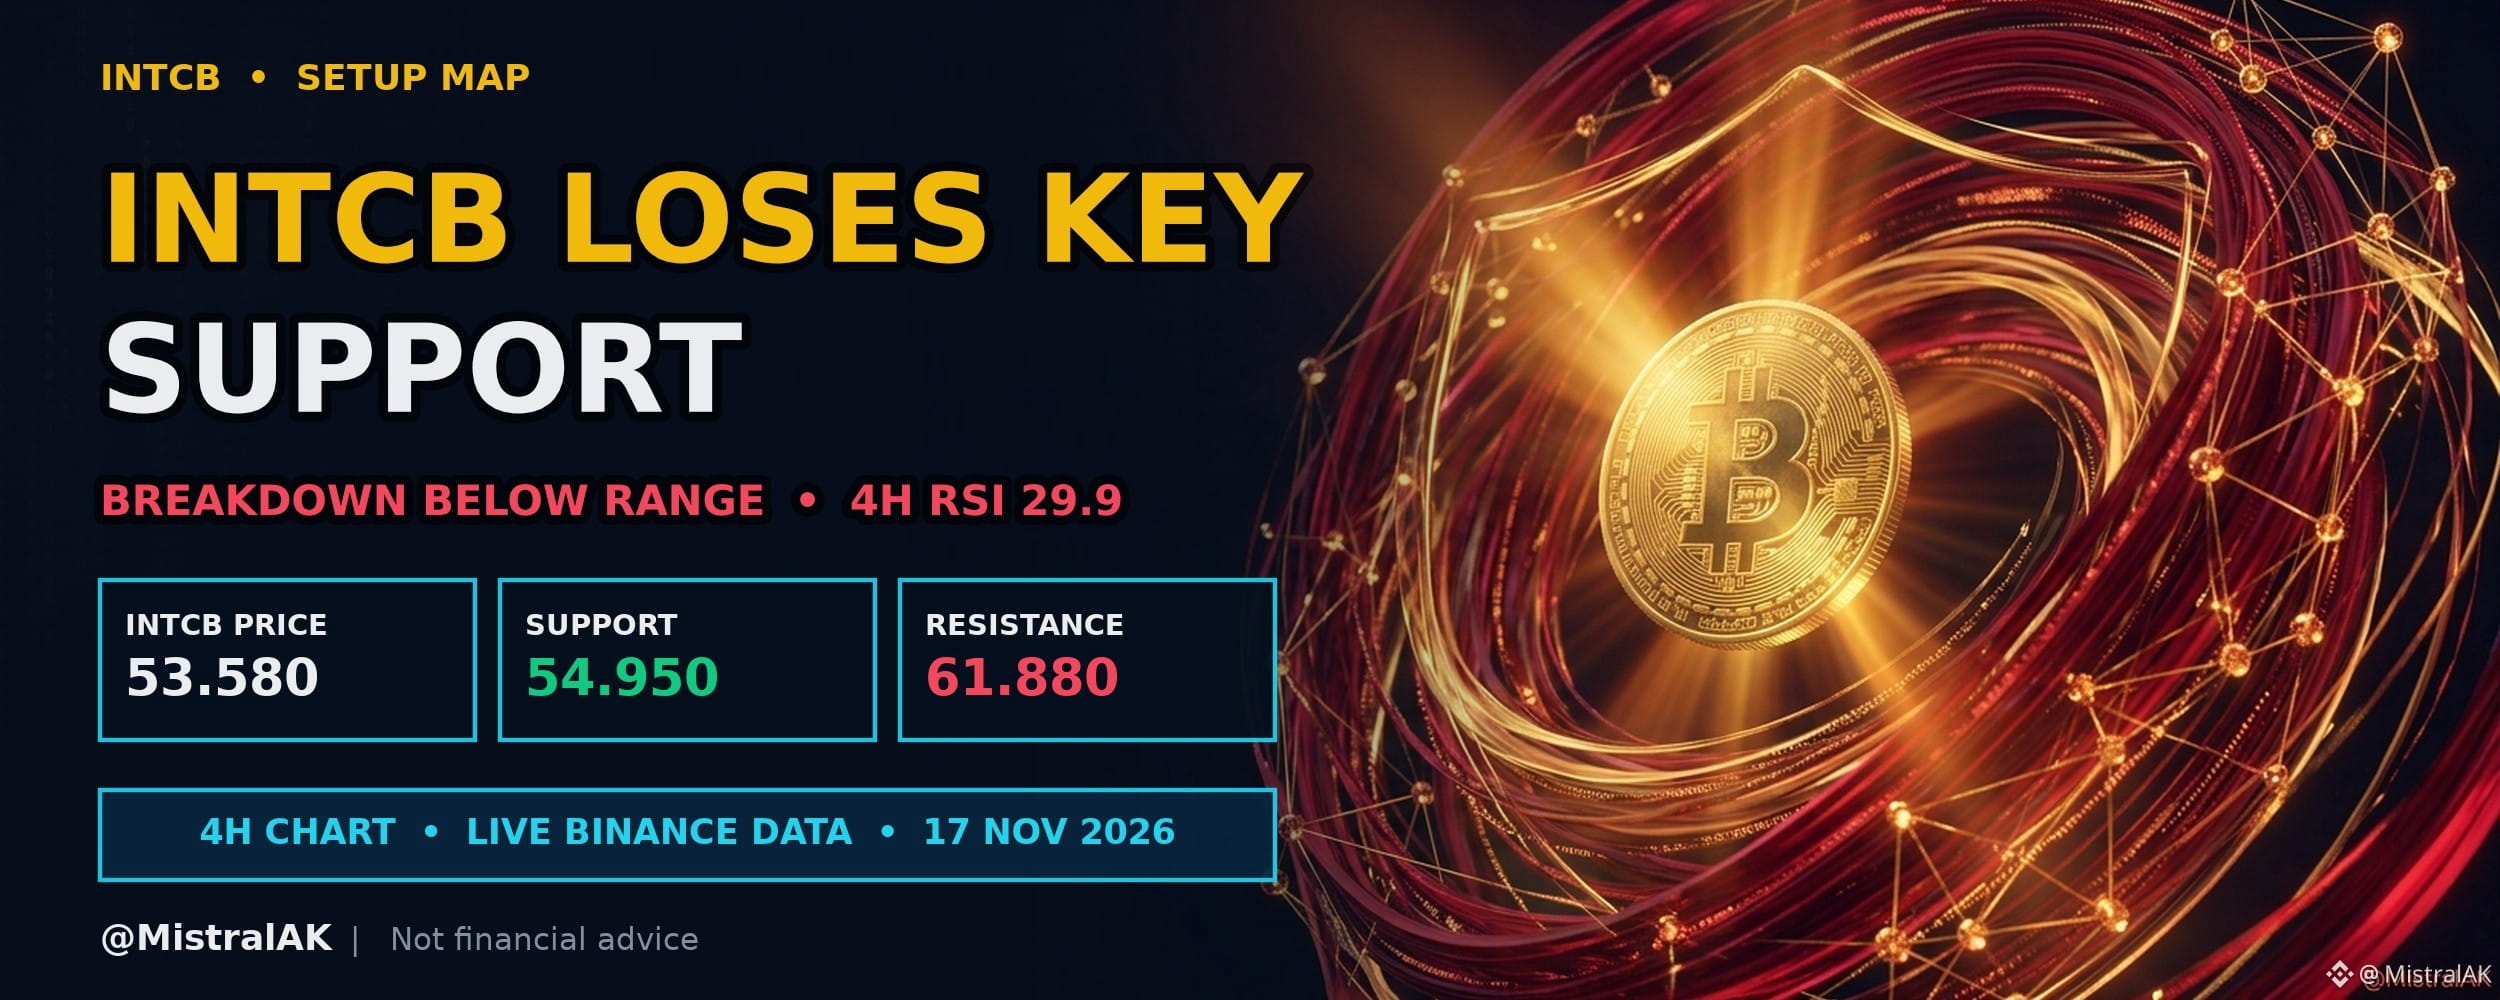
$INTCB trades at 53.580 USD, down 8.2% over the past 24 hours, with 4H RSI at 29.9 (oversold).
Downward pressure over the past twenty-four hours has driven price below its recent low on the four-hour chart. An oversold relative strength index highlights stretched momentum, leaving traders to watch whether key support holds.
KEY LEVELS
▪️ Resistance: 61.880 USD (20-candle 4H swing high)
▪️ Support: 54.950 USD (20-candle 4H swing low)
▪️ EMA 20 / EMA 50: 57.470 / 58.739 USD (short-term trend filter)
WHAT WOULD CONFIRM WEAKNESS
▪️ 4H closes staying below 54.950 USD, turning it into resistance
▪️ Rallies failing near EMA 20 (57.470 USD)
WHAT WOULD INVALIDATE IT
▪️ A 4H close back above 54.950 USD (range reclaimed)
▪️ Price recovering EMA 20 (57.470 USD)
Do you expect a temporary bounce from oversold levels, or will downward momentum continue on the four-hour chart?
Not financial advice. Always DYOR.
Like & Follow for Daily Trade Analytics & Insider News. @MistralAK
#INTCB #Breakdown #TrendingTopic
$INTCB Price Breaks Below Recent Low into Oversold Zone
$INTCB trades at 53.580 USD, down 8.2% over the past 24 hours, with 4H RSI at 29.9 (oversold).
Downward pressure over the past twenty-four hours has driven price below its recent low on the four-hour chart. An oversold relative strength index highlights stretched momentum, leaving traders to watch whether key support holds.
KEY LEVELS
▪️ Resistance: 61.880 USD (20-candle 4H swing high)
▪️ Support: 54.950 USD (20-candle 4H swing low)
▪️ EMA 20 / EMA 50: 57.470 / 58.739 USD (short-term trend filter)
WHAT WOULD CONFIRM WEAKNESS
▪️ 4H closes staying below 54.950 USD, turning it into resistance
▪️ Rallies failing near EMA 20 (57.470 USD)
WHAT WOULD INVALIDATE IT
▪️ A 4H close back above 54.950 USD (range reclaimed)
▪️ Price recovering EMA 20 (57.470 USD)
Do you expect a temporary bounce from oversold levels, or will downward momentum continue on the four-hour chart?
Not financial advice. Always DYOR.
Like & Follow for Daily Trade Analytics & Insider News. @MistralAK
#INTCB #Breakdown #TrendingTopic
$INTCB trades at 53.580 USD, down 8.2% over the past 24 hours, with 4H RSI at 29.9 (oversold).
Downward pressure over the past twenty-four hours has driven price below its recent low on the four-hour chart. An oversold relative strength index highlights stretched momentum, leaving traders to watch whether key support holds.
KEY LEVELS
▪️ Resistance: 61.880 USD (20-candle 4H swing high)
▪️ Support: 54.950 USD (20-candle 4H swing low)
▪️ EMA 20 / EMA 50: 57.470 / 58.739 USD (short-term trend filter)
WHAT WOULD CONFIRM WEAKNESS
▪️ 4H closes staying below 54.950 USD, turning it into resistance
▪️ Rallies failing near EMA 20 (57.470 USD)
WHAT WOULD INVALIDATE IT
▪️ A 4H close back above 54.950 USD (range reclaimed)
▪️ Price recovering EMA 20 (57.470 USD)
Do you expect a temporary bounce from oversold levels, or will downward momentum continue on the four-hour chart?
Not financial advice. Always DYOR.
Like & Follow for Daily Trade Analytics & Insider News. @MistralAK
#INTCB #Breakdown #TrendingTopic
1
273

·
--
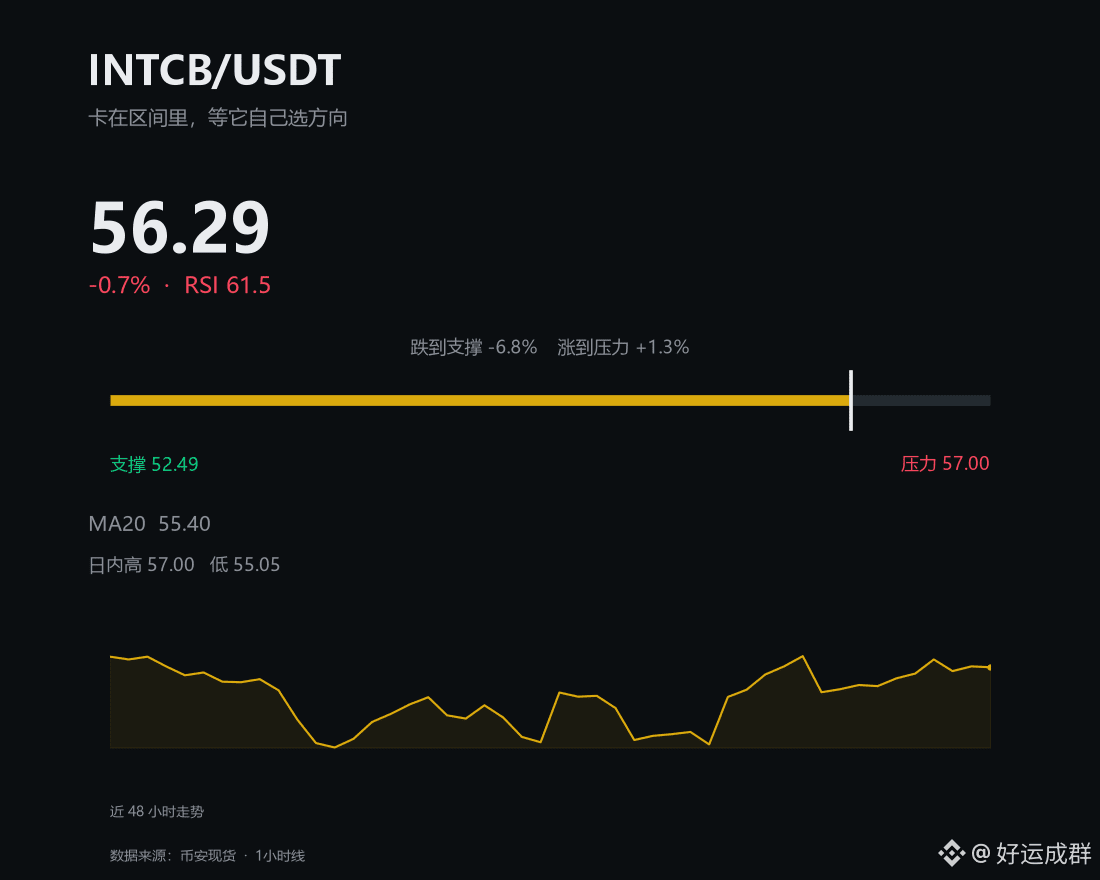
$INTCB Down 0.7% today, about the same as Bitcoin. $BTC Down 0.6% today.
Those who rush in when they see a red candle are usually the first to run when they see a green one.
Current price: 56.29; resistance: 57; support: 52.49; RSI: 61.5.
If you want to make a move, wait until it holds above 57. If it can't, just watch for now—money in your hands won't bite.
Have you made a move at this level?
The market isn't short on opportunities; what's lacking is the patience to wait for them.
#币圈 #INTCB
$INTCB Down 0.7% today, about the same as Bitcoin. $BTC Down 0.6% today.
Those who rush in when they see a red candle are usually the first to run when they see a green one.
Current price: 56.29; resistance: 57; support: 52.49; RSI: 61.5.
If you want to make a move, wait until it holds above 57. If it can't, just watch for now—money in your hands won't bite.
Have you made a move at this level?
The market isn't short on opportunities; what's lacking is the patience to wait for them.
#币圈 #INTCB
Those who rush in when they see a red candle are usually the first to run when they see a green one.
Current price: 56.29; resistance: 57; support: 52.49; RSI: 61.5.
If you want to make a move, wait until it holds above 57. If it can't, just watch for now—money in your hands won't bite.
Have you made a move at this level?
The market isn't short on opportunities; what's lacking is the patience to wait for them.
#币圈 #INTCB
31

·
--
When you see "very large trading volume," first check the unit: is it the amount of the coin, or the amount in the quoted asset? Is the time range the same?
First, let’s look at this set of data in front of $INTCB : Binance spot, 11/17 17:00–18:00 (Beijing time). During this hour, it fell 1.28%, with trading turnover of 435,700 USDT, 4.1 times that of the previous hour. The closing price for the period was 53.78 USDT.
Trading volume can be expressed as the quantity of the base asset, while trading turnover is calculated based on the quoted asset of the trading pair. The two records of the same trade describe the same thing, but the numbers and units are different. An increase in the number of a coin traded does not necessarily mean that the amount calculated in the quoted asset increases by the same proportion. Between different coins, you also cannot directly compare the scale of trading by the number of coins.
#INTCB #crypto chat
When you see "very large trading volume," first check the unit: is it the amount of the coin, or the amount in the quoted asset? Is the time range the same?
First, let’s look at this set of data in front of $INTCB : Binance spot, 11/17 17:00–18:00 (Beijing time). During this hour, it fell 1.28%, with trading turnover of 435,700 USDT, 4.1 times that of the previous hour. The closing price for the period was 53.78 USDT.
Trading volume can be expressed as the quantity of the base asset, while trading turnover is calculated based on the quoted asset of the trading pair. The two records of the same trade describe the same thing, but the numbers and units are different. An increase in the number of a coin traded does not necessarily mean that the amount calculated in the quoted asset increases by the same proportion. Between different coins, you also cannot directly compare the scale of trading by the number of coins.
#INTCB #crypto chat
First, let’s look at this set of data in front of $INTCB : Binance spot, 11/17 17:00–18:00 (Beijing time). During this hour, it fell 1.28%, with trading turnover of 435,700 USDT, 4.1 times that of the previous hour. The closing price for the period was 53.78 USDT.
Trading volume can be expressed as the quantity of the base asset, while trading turnover is calculated based on the quoted asset of the trading pair. The two records of the same trade describe the same thing, but the numbers and units are different. An increase in the number of a coin traded does not necessarily mean that the amount calculated in the quoted asset increases by the same proportion. Between different coins, you also cannot directly compare the scale of trading by the number of coins.
#INTCB #crypto chat
5
·
--
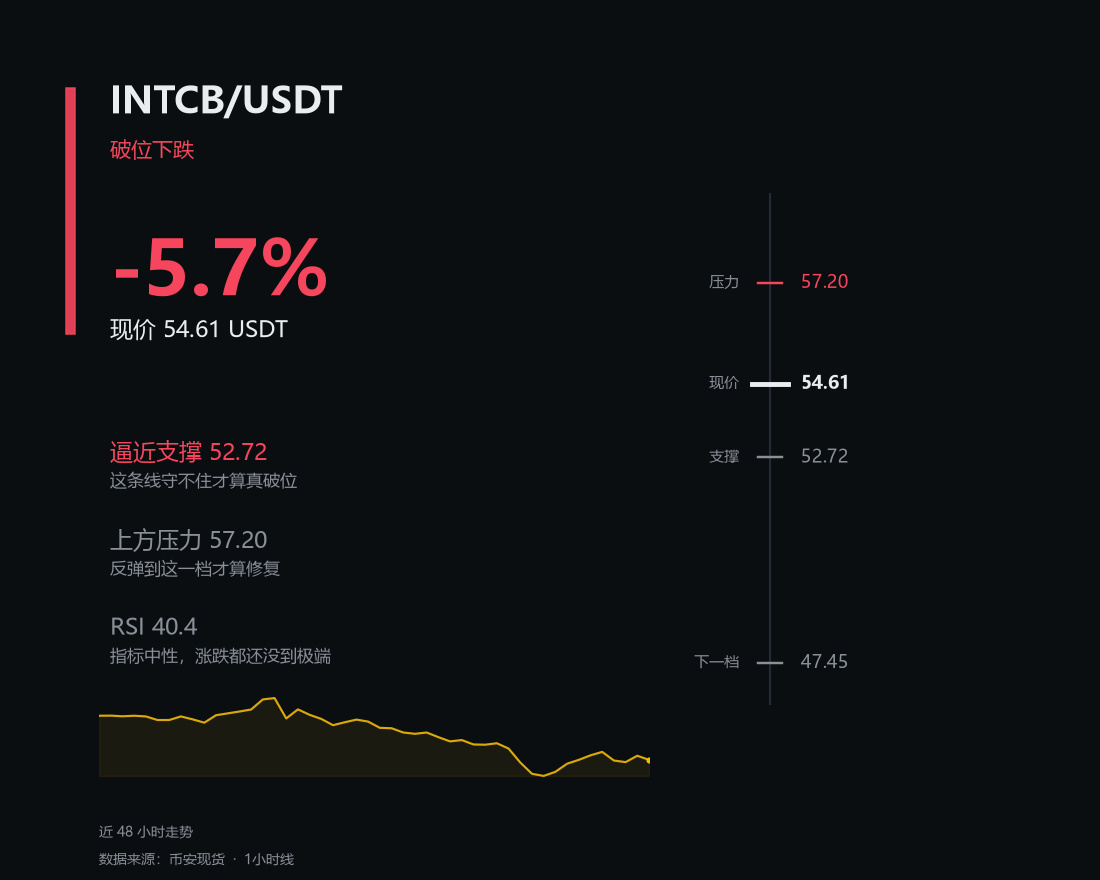
$INTCB is down 5.7% today, weaker than Bitcoin. $BTC is up 0.3% today.
Those who rush in at the sight of a red candlestick are usually the first to bail when it turns green.
Current price: 54.61; resistance: 57.2; support: 52.72; RSI: 40.4.
If you’re going to trade, wait until it holds above 57.2. If it can’t, just sit tight for now—money in your hands won’t bite.
Are you still holding any?
The quick hands that chase rallies and panic-sell eventually just rack up fees.
#币圈 #INTCB
$INTCB is down 5.7% today, weaker than Bitcoin. $BTC is up 0.3% today.
Those who rush in at the sight of a red candlestick are usually the first to bail when it turns green.
Current price: 54.61; resistance: 57.2; support: 52.72; RSI: 40.4.
If you’re going to trade, wait until it holds above 57.2. If it can’t, just sit tight for now—money in your hands won’t bite.
Are you still holding any?
The quick hands that chase rallies and panic-sell eventually just rack up fees.
#币圈 #INTCB
Those who rush in at the sight of a red candlestick are usually the first to bail when it turns green.
Current price: 54.61; resistance: 57.2; support: 52.72; RSI: 40.4.
If you’re going to trade, wait until it holds above 57.2. If it can’t, just sit tight for now—money in your hands won’t bite.
Are you still holding any?
The quick hands that chase rallies and panic-sell eventually just rack up fees.
#币圈 #INTCB
31
·
--
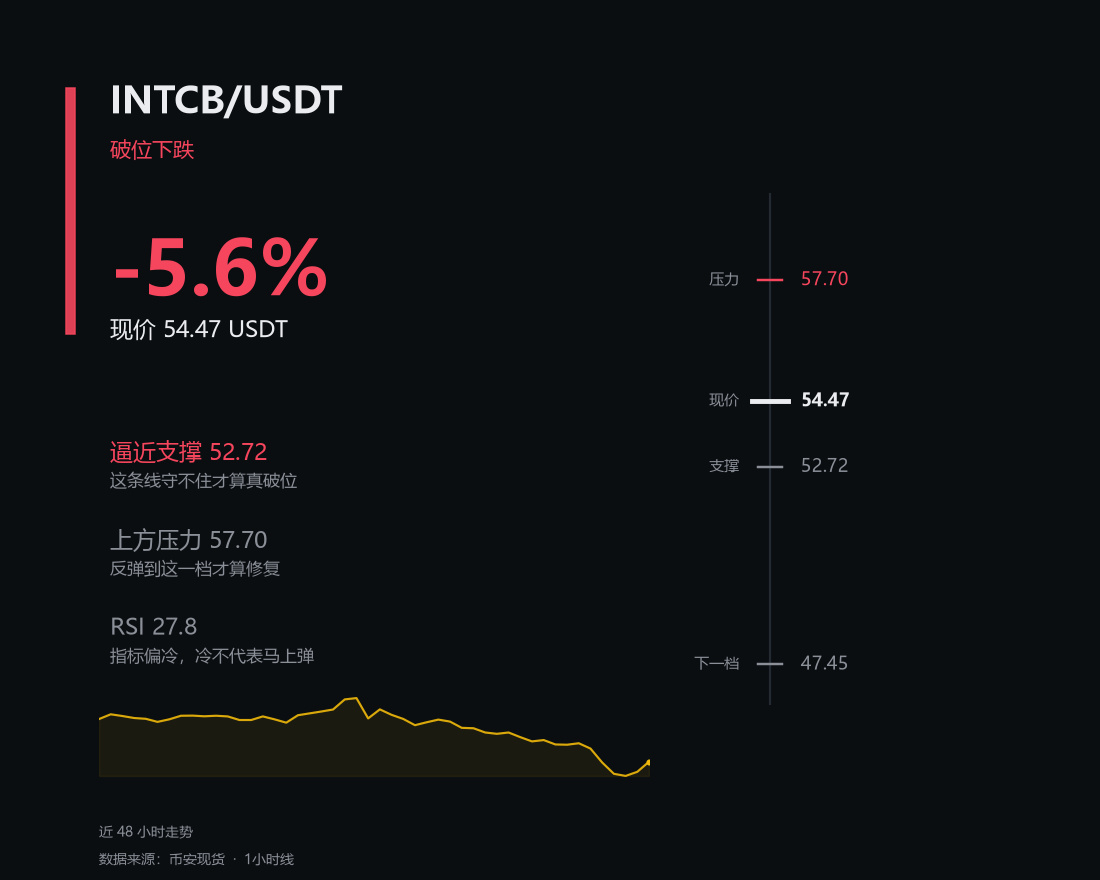
$INTCB closed at 54.47, down 5.6% today, in the lower half of the 52.72–57.7 range.
RSI is 27.8, MA20 is at 55.865, and the intraday high and low were 57.2 and 52.72.
As long as the structure holds, don't rush to write it off.
$BTC is down 0.6% today.
Which side are you on in this move?
The market isn't short on opportunities; what's scarce is the patience to wait for them.
#币圈 #INTCB
$INTCB closed at 54.47, down 5.6% today, in the lower half of the 52.72–57.7 range.
RSI is 27.8, MA20 is at 55.865, and the intraday high and low were 57.2 and 52.72.
As long as the structure holds, don't rush to write it off.
$BTC is down 0.6% today.
Which side are you on in this move?
The market isn't short on opportunities; what's scarce is the patience to wait for them.
#币圈 #INTCB
RSI is 27.8, MA20 is at 55.865, and the intraday high and low were 57.2 and 52.72.
As long as the structure holds, don't rush to write it off.
$BTC is down 0.6% today.
Which side are you on in this move?
The market isn't short on opportunities; what's scarce is the patience to wait for them.
#币圈 #INTCB
30

·
--
Article
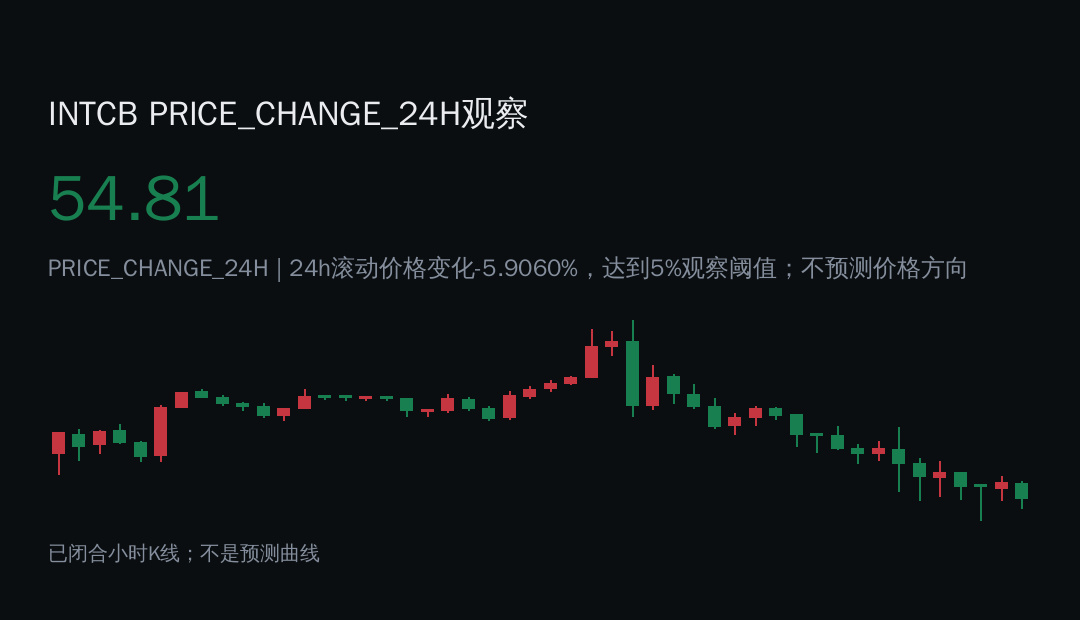
INTCB|Data Notes|2026-11-17Amid all the buzz, keep your eyes on the numbers—$INTCB ’s metric note: PRICE_CHANGE_24H recorded 54.81. The 24-hour rolling price change is -5.9060%, reaching the 5% observation threshold; this does not predict the price direction.
📊 Data Snapshot
· Metric: PRICE_CHANGE_24H
· Reading: 54.81
· Basis: Closed candlestick series
Same as always: don’t rush to take a position. Check the data first, then pick a side.
Join the discussion in the comments 👇
## How to Read This Data
This observation is calculated from the closed candlestick series provided by the source API. The metric is a mathematical transformation of historical prices; it describes only the observation at that point in time, does not predict the price direction, and is not a buy or sell instruction.
INTCB|Data Notes|2026-11-17
Amid all the buzz, keep your eyes on the numbers—$INTCB ’s metric note: PRICE_CHANGE_24H recorded 54.81. The 24-hour rolling price change is -5.9060%, reaching the 5% observation threshold; this does not predict the price direction.
📊 Data Snapshot
· Metric: PRICE_CHANGE_24H
· Reading: 54.81
· Basis: Closed candlestick series
Same as always: don’t rush to take a position. Check the data first, then pick a side.
Join the discussion in the comments 👇
## How to Read This Data
This observation is calculated from the closed candlestick series provided by the source API. The metric is a mathematical transformation of historical prices; it describes only the observation at that point in time, does not predict the price direction, and is not a buy or sell instruction.
📊 Data Snapshot
· Metric: PRICE_CHANGE_24H
· Reading: 54.81
· Basis: Closed candlestick series
Same as always: don’t rush to take a position. Check the data first, then pick a side.
Join the discussion in the comments 👇
## How to Read This Data
This observation is calculated from the closed candlestick series provided by the source API. The metric is a mathematical transformation of historical prices; it describes only the observation at that point in time, does not predict the price direction, and is not a buy or sell instruction.
7
·
--
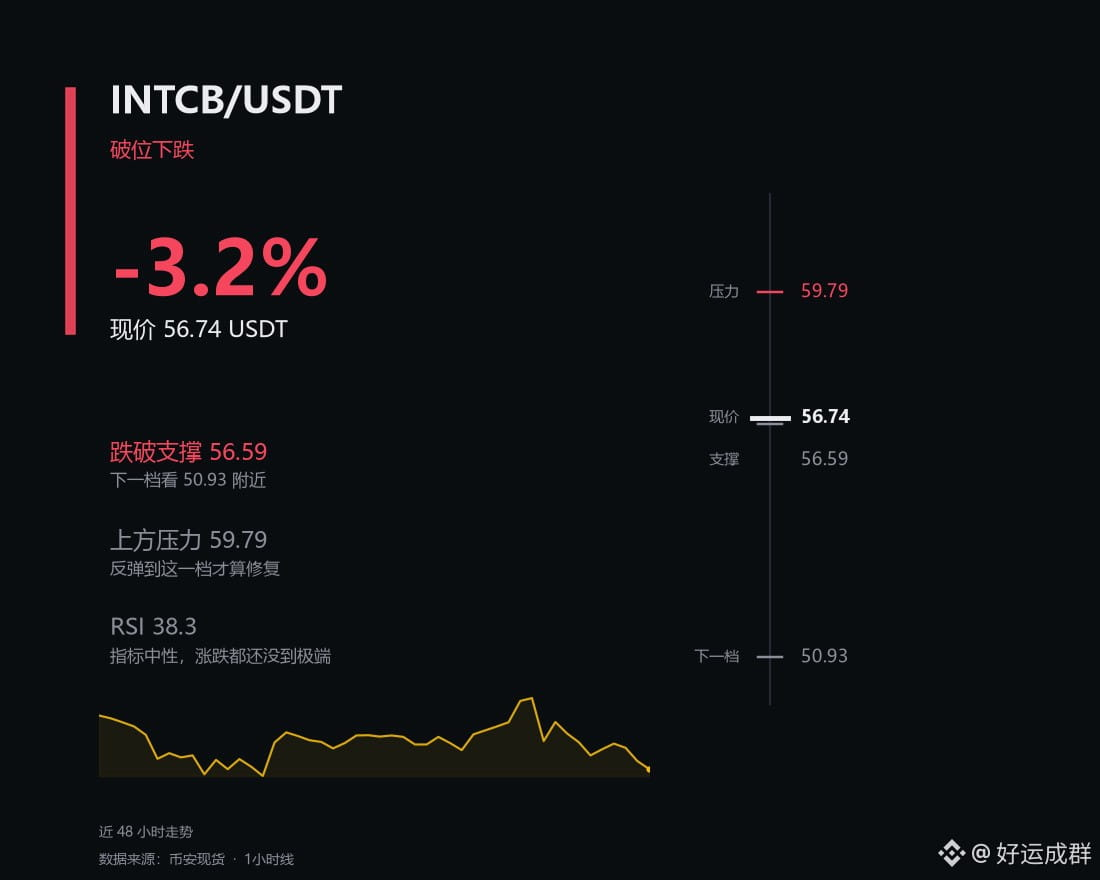
$INTCB Down 3.2% today, grinding sideways along with Bitcoin. Current price: 56.74.
Look at it from another angle: If you were the market maker, what would you do at this level?
Push it up to 59.79 to lure in some longs, then turn around and sweep the stop-losses below 56.59. You could profit from both sides.
An RSI of 38.3 is just enough to stir up some emotion.
Would you add to your position here?
Don’t treat a single candlestick as conclusive—it hasn’t even found its footing yet.
#币圈 #INTCB
$INTCB Down 3.2% today, grinding sideways along with Bitcoin. Current price: 56.74.
Look at it from another angle: If you were the market maker, what would you do at this level?
Push it up to 59.79 to lure in some longs, then turn around and sweep the stop-losses below 56.59. You could profit from both sides.
An RSI of 38.3 is just enough to stir up some emotion.
Would you add to your position here?
Don’t treat a single candlestick as conclusive—it hasn’t even found its footing yet.
#币圈 #INTCB
Look at it from another angle: If you were the market maker, what would you do at this level?
Push it up to 59.79 to lure in some longs, then turn around and sweep the stop-losses below 56.59. You could profit from both sides.
An RSI of 38.3 is just enough to stir up some emotion.
Would you add to your position here?
Don’t treat a single candlestick as conclusive—it hasn’t even found its footing yet.
#币圈 #INTCB
96


See translation
$INTCB: Volume Whisper
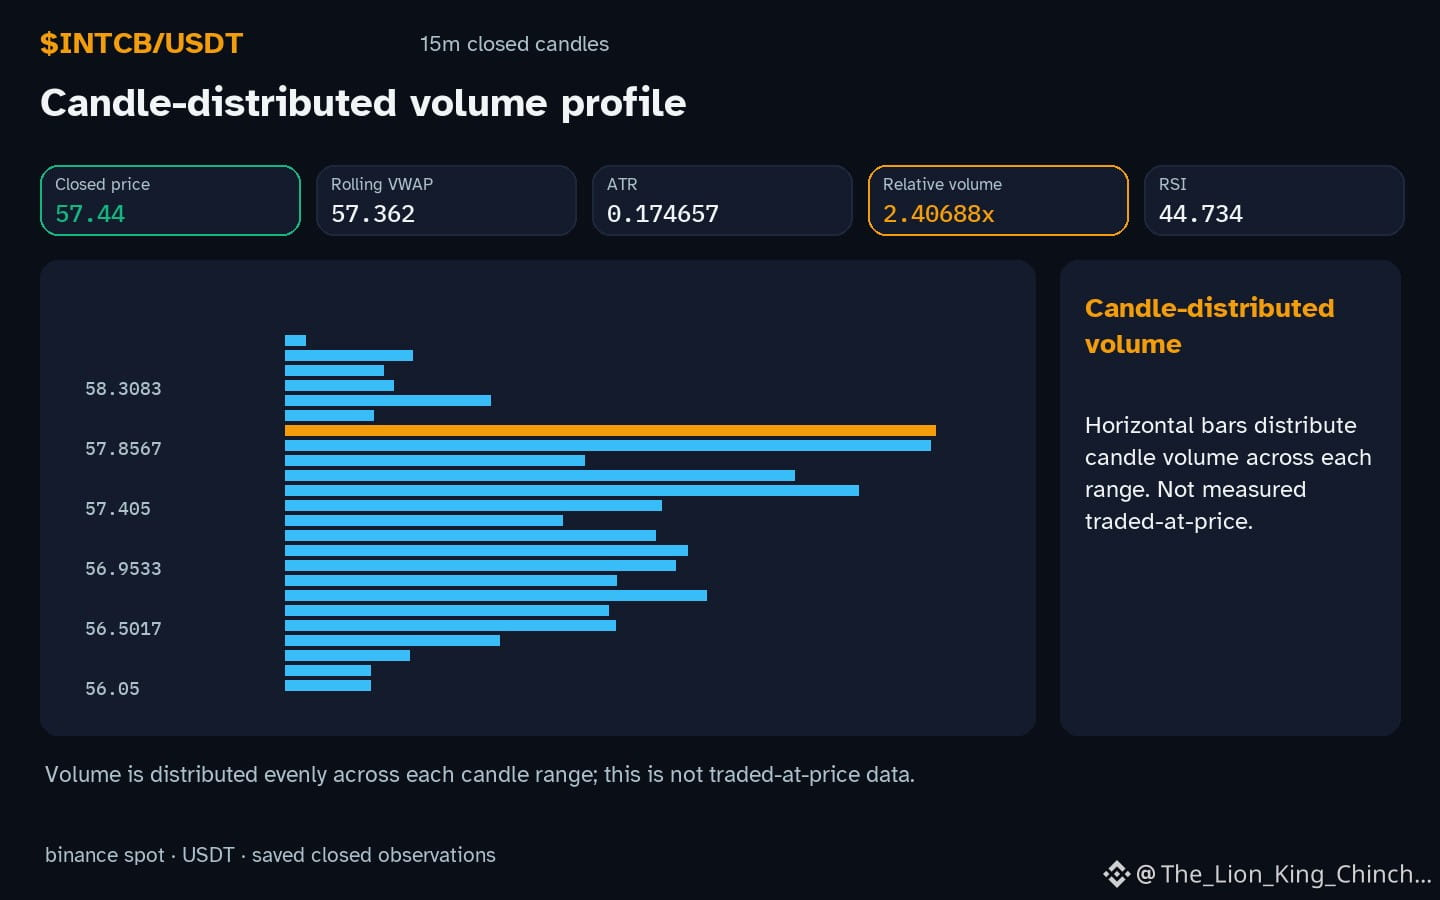
$INTCB: Does elevated volume always mean a shift in perspective? For $INTCB, the readings are 2.41x baseline.
The Question
Think of a busy highway during rain. You slow down. The car ahead is just normal traffic. We often treat ordinary increases as special events. This is apophenia. We see patterns in noise. In market terms, a volume spike above baseline might be routine variation.
Evidence and an Alternative
Supplied data shows hourly movement is down while volume is active. RSI is 44.7. This is a thought experiment. We cannot infer motive or hidden accumulation. A competitor interpretation is simple: routine dispersion. Liquidity may be thin. Different participants react to price ticks. No single buyer exists. The candle does not reveal intent. We must separate observation from narrative.
A Practical Self-Check
Ask before acting: Can baseline data explain this? Relative volume 2.41x is a ratio. It is not a proof of buying. One candle is a snapshot. Wait for the next closed bar. Price action staying above support at 57.42 without fresh confirmation is a reassessment trigger. If the pattern fades, it was noise. Trust the process over the story.
Probabilistic market research, not a recommendation or guaranteed return.
#INTCB #TradingPsychology #CryptoLearning
$INTCB : Volume Whisper
$INTCB : Does elevated volume always mean a shift in perspective? For $INTCB , the readings are 2.41x baseline.
The Question
Think of a busy highway during rain. You slow down. The car ahead is just normal traffic. We often treat ordinary increases as special events. This is apophenia. We see patterns in noise. In market terms, a volume spike above baseline might be routine variation.
Evidence and an Alternative
Supplied data shows hourly movement is down while volume is active. RSI is 44.7. This is a thought experiment. We cannot infer motive or hidden accumulation. A competitor interpretation is simple: routine dispersion. Liquidity may be thin. Different participants react to price ticks. No single buyer exists. The candle does not reveal intent. We must separate observation from narrative.
A Practical Self-Check
Ask before acting: Can baseline data explain this? Relative volume 2.41x is a ratio. It is not a proof of buying. One candle is a snapshot. Wait for the next closed bar. Price action staying above support at 57.42 without fresh confirmation is a reassessment trigger. If the pattern fades, it was noise. Trust the process over the story.
Probabilistic market research, not a recommendation or guaranteed return.
#INTCB #TradingPsychology #CryptoLearning
$INTCB : Does elevated volume always mean a shift in perspective? For $INTCB , the readings are 2.41x baseline.
The Question
Think of a busy highway during rain. You slow down. The car ahead is just normal traffic. We often treat ordinary increases as special events. This is apophenia. We see patterns in noise. In market terms, a volume spike above baseline might be routine variation.
Evidence and an Alternative
Supplied data shows hourly movement is down while volume is active. RSI is 44.7. This is a thought experiment. We cannot infer motive or hidden accumulation. A competitor interpretation is simple: routine dispersion. Liquidity may be thin. Different participants react to price ticks. No single buyer exists. The candle does not reveal intent. We must separate observation from narrative.
A Practical Self-Check
Ask before acting: Can baseline data explain this? Relative volume 2.41x is a ratio. It is not a proof of buying. One candle is a snapshot. Wait for the next closed bar. Price action staying above support at 57.42 without fresh confirmation is a reassessment trigger. If the pattern fades, it was noise. Trust the process over the story.
Probabilistic market research, not a recommendation or guaranteed return.
#INTCB #TradingPsychology #CryptoLearning
67

·
--
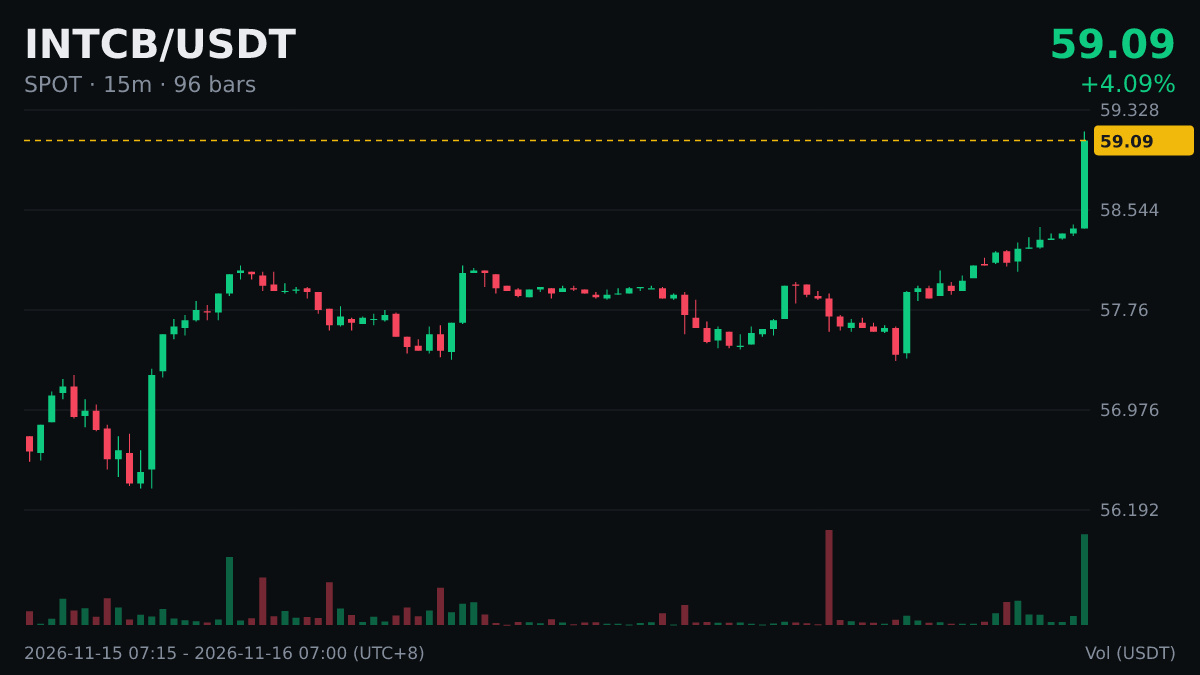
$INTCB 24-hour high, current price 59.13, previous high 58.43.
There are three common patterns after a new high:
① Pull back to the previous high without breaking below it, then make another new high: strongest
② Move sideways near the previous high: consolidation, watch for direction
③ Quickly fall back below the previous high and fail to recover: false breakout
Currently above the previous high; first, let’s see whether it follows ① or ②.
#INTCB
$INTCB 24-hour high, current price 59.13, previous high 58.43.
There are three common patterns after a new high:
① Pull back to the previous high without breaking below it, then make another new high: strongest
② Move sideways near the previous high: consolidation, watch for direction
③ Quickly fall back below the previous high and fail to recover: false breakout
Currently above the previous high; first, let’s see whether it follows ① or ②.
#INTCB
There are three common patterns after a new high:
① Pull back to the previous high without breaking below it, then make another new high: strongest
② Move sideways near the previous high: consolidation, watch for direction
③ Quickly fall back below the previous high and fail to recover: false breakout
Currently above the previous high; first, let’s see whether it follows ① or ②.
#INTCB
333

·
--
See translation
Silicon Slide: $INTCB Dips on Binance Spot 📉
Price action – $INTCB is trading at $56.89, down 3.02 % over the last 24 hours on Binance Spot (INTCB/USDT) with solid volume. The slide matters as Intel heads into its Q3 earnings window while the broader semiconductor sector grapples with a modest demand slowdown.
Key levels – Immediate support sits near $55.00, a strong psychological floor. Nearest resistance caps around $58.50, with the mid‑range corridor between $56.50 and $57.00 acting as a pivot zone this week. A clean break above $58.50 could reopen upside, while a slip back through $55.00 may trigger a deeper correction toward $52.00.
Outlook – Cautious. The recent decline appears stretched; a pullback to the $55‑$56 area looks likely before any rebound. Traders should monitor volume and any earnings guidance for signs of stabilization.
#INTCB #bStocks #BinanceSpot
Silicon Slide: $INTCB Dips on Binance Spot 📉
Price action – $INTCB is trading at $56.89, down 3.02 % over the last 24 hours on Binance Spot (INTCB/USDT) with solid volume. The slide matters as Intel heads into its Q3 earnings window while the broader semiconductor sector grapples with a modest demand slowdown.
Key levels – Immediate support sits near $55.00, a strong psychological floor. Nearest resistance caps around $58.50, with the mid‑range corridor between $56.50 and $57.00 acting as a pivot zone this week. A clean break above $58.50 could reopen upside, while a slip back through $55.00 may trigger a deeper correction toward $52.00.
Outlook – Cautious. The recent decline appears stretched; a pullback to the $55‑$56 area looks likely before any rebound. Traders should monitor volume and any earnings guidance for signs of stabilization.
#INTCB #bStocks #BinanceSpot
Price action – $INTCB is trading at $56.89, down 3.02 % over the last 24 hours on Binance Spot (INTCB/USDT) with solid volume. The slide matters as Intel heads into its Q3 earnings window while the broader semiconductor sector grapples with a modest demand slowdown.
Key levels – Immediate support sits near $55.00, a strong psychological floor. Nearest resistance caps around $58.50, with the mid‑range corridor between $56.50 and $57.00 acting as a pivot zone this week. A clean break above $58.50 could reopen upside, while a slip back through $55.00 may trigger a deeper correction toward $52.00.
Outlook – Cautious. The recent decline appears stretched; a pullback to the $55‑$56 area looks likely before any rebound. Traders should monitor volume and any earnings guidance for signs of stabilization.
#INTCB #bStocks #BinanceSpot
13
See translation
$INTCB: The Signal Friction Dilemma
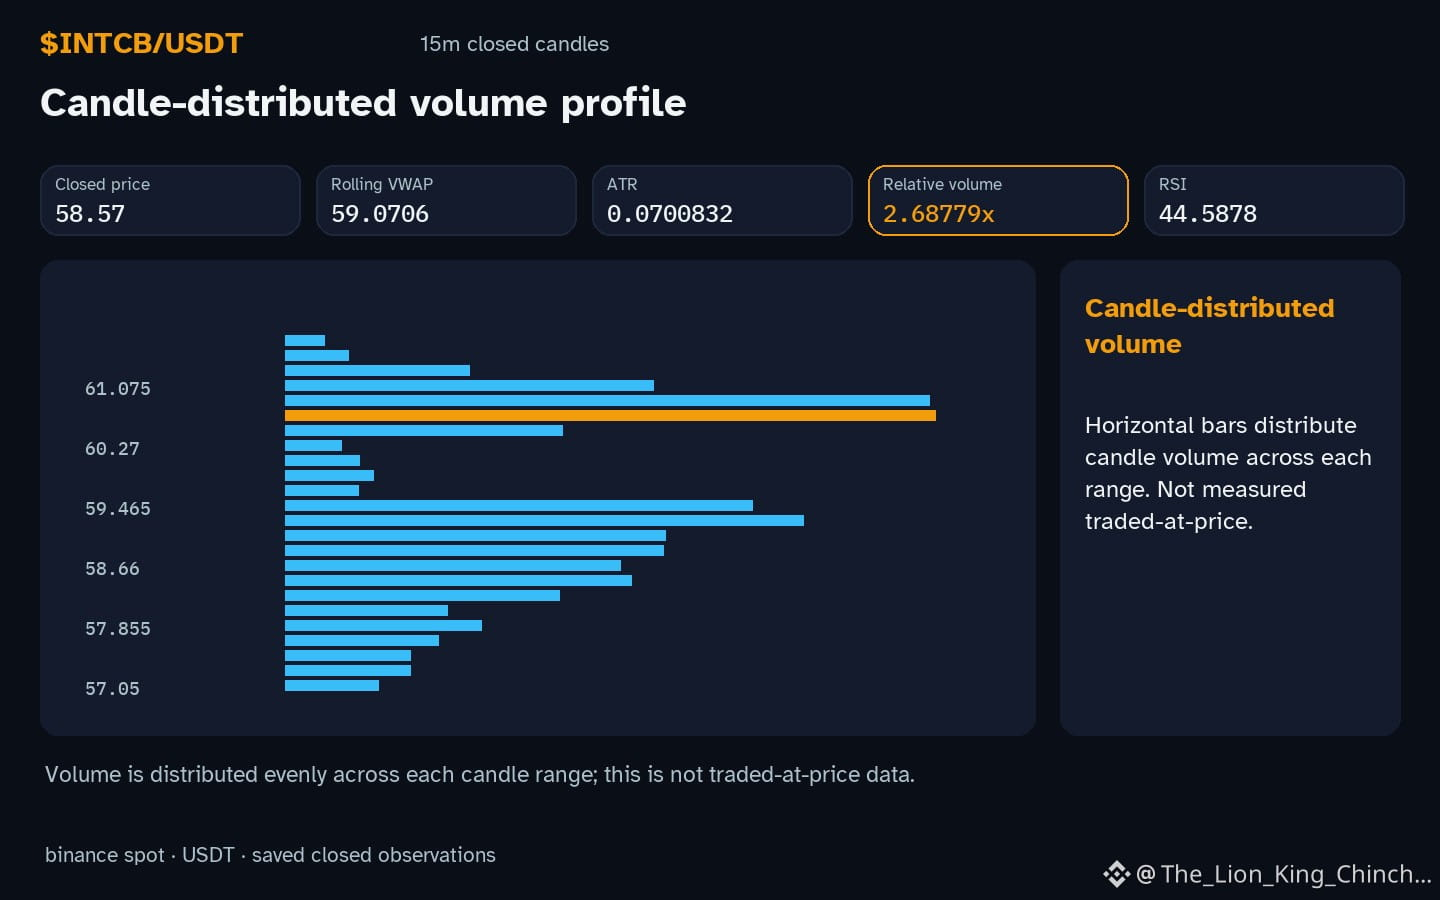
$INTCB: Does a surge in content volume improve price discovery or simply obscure the signal? The current movement of $INTCB inside the recorded range during an hourly direction down suggests that more data is not always more clarity.
Evidence and an alternative
Observers see relative volume at 2.69x the baseline while the daily change is -4.23479%. In a hypothetical quality gate mechanism, a researcher might only share an update if the RSI 44.6 crosses a specific threshold or if price breaks the local resistance of 58.7. The alternative is the spam volume model, where every minor fluctuation triggers a post. This creates an incentive dilemma: does frequency provide value, or does it exploit social proof to gain attention? High volume without a range break might just be noise, regardless of how many people are discussing the asset online.
A practical self-check
To separate evidence from persuasion, ask if the analysis relies on the provided facts or on emotional adjectives. For instance, if the price remains above the local support of 58.49, the technical structure hasn't actually changed. A useful reassessment condition would be a closed candle outside the current boundaries. If the price stays within this range despite high social activity, the perceived urgency may be an artifact of the incentive structure rather than a market shift. 💡
Probabilistic market research, not a recommendation or guaranteed return.
#INTCB #CryptoCommunity #CryptoLearning
$INTCB : The Signal Friction Dilemma
$INTCB : Does a surge in content volume improve price discovery or simply obscure the signal? The current movement of $INTCB inside the recorded range during an hourly direction down suggests that more data is not always more clarity.
Evidence and an alternative
Observers see relative volume at 2.69x the baseline while the daily change is -4.23479%. In a hypothetical quality gate mechanism, a researcher might only share an update if the RSI 44.6 crosses a specific threshold or if price breaks the local resistance of 58.7. The alternative is the spam volume model, where every minor fluctuation triggers a post. This creates an incentive dilemma: does frequency provide value, or does it exploit social proof to gain attention? High volume without a range break might just be noise, regardless of how many people are discussing the asset online.
A practical self-check
To separate evidence from persuasion, ask if the analysis relies on the provided facts or on emotional adjectives. For instance, if the price remains above the local support of 58.49, the technical structure hasn't actually changed. A useful reassessment condition would be a closed candle outside the current boundaries. If the price stays within this range despite high social activity, the perceived urgency may be an artifact of the incentive structure rather than a market shift. 💡
Probabilistic market research, not a recommendation or guaranteed return.
#INTCB #CryptoCommunity #CryptoLearning
$INTCB : Does a surge in content volume improve price discovery or simply obscure the signal? The current movement of $INTCB inside the recorded range during an hourly direction down suggests that more data is not always more clarity.
Evidence and an alternative
Observers see relative volume at 2.69x the baseline while the daily change is -4.23479%. In a hypothetical quality gate mechanism, a researcher might only share an update if the RSI 44.6 crosses a specific threshold or if price breaks the local resistance of 58.7. The alternative is the spam volume model, where every minor fluctuation triggers a post. This creates an incentive dilemma: does frequency provide value, or does it exploit social proof to gain attention? High volume without a range break might just be noise, regardless of how many people are discussing the asset online.
A practical self-check
To separate evidence from persuasion, ask if the analysis relies on the provided facts or on emotional adjectives. For instance, if the price remains above the local support of 58.49, the technical structure hasn't actually changed. A useful reassessment condition would be a closed candle outside the current boundaries. If the price stays within this range despite high social activity, the perceived urgency may be an artifact of the incentive structure rather than a market shift. 💡
Probabilistic market research, not a recommendation or guaranteed return.
#INTCB #CryptoCommunity #CryptoLearning
36

·
--
See translation
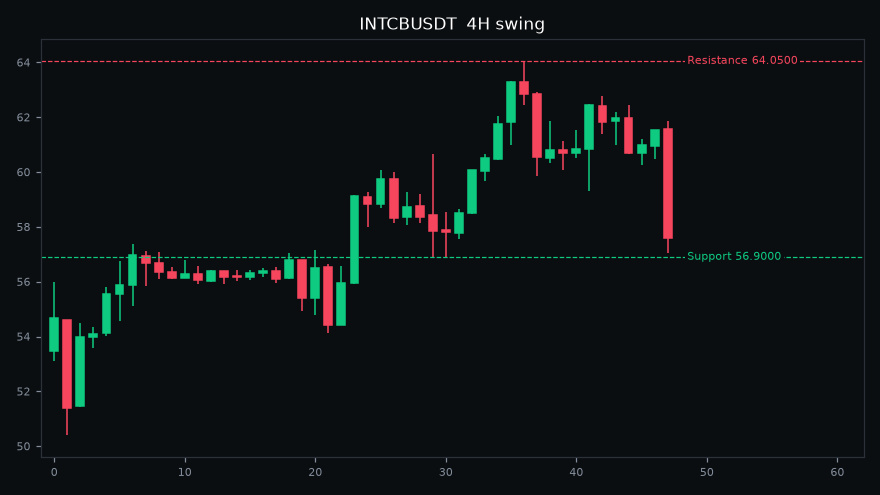
📉 $INTCB among today's top losers (-5.6%)
Price: 57.5400
24h High: 62.7900 | 24h Low: 57.0500
24h Volume: $8.9M
Support: 56.9000 | Resistance: 64.0500
RSI 40 (4H swing)
Volatility is high, protect your capital.
#INTCB #CryptoTrading #BinanceSquare #Binance
⚠️ Not financial advice. Do your own research.
📉 $INTCB among today's top losers (-5.6%)
Price: 57.5400
24h High: 62.7900 | 24h Low: 57.0500
24h Volume: $8.9M
Support: 56.9000 | Resistance: 64.0500
RSI 40 (4H swing)
Volatility is high, protect your capital.
#INTCB #CryptoTrading #BinanceSquare #Binance
⚠️ Not financial advice. Do your own research.
Price: 57.5400
24h High: 62.7900 | 24h Low: 57.0500
24h Volume: $8.9M
Support: 56.9000 | Resistance: 64.0500
RSI 40 (4H swing)
Volatility is high, protect your capital.
#INTCB #CryptoTrading #BinanceSquare #Binance
⚠️ Not financial advice. Do your own research.
12
See translation
$INTCB: Why Volume Climax at the Bottom Often Looks Identical to Panic Collapse
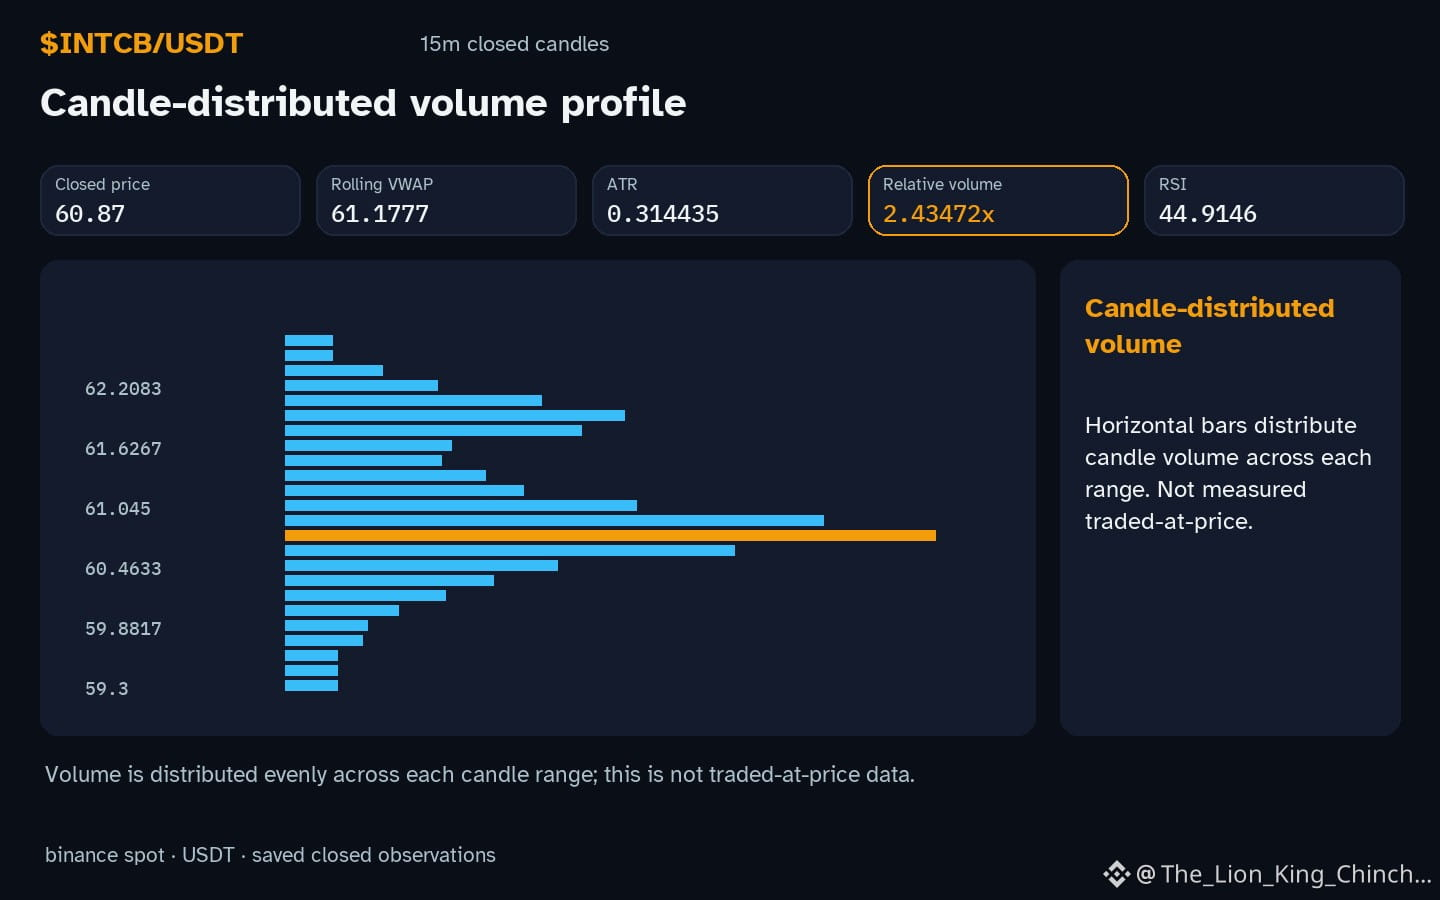
$INTCB: Why does a surge of volume at the lower end of the range sometimes feel like capitulation and other times like a continuation signal? $INTCB is currently moving down inside the recorded range while volume sits above baseline.
**Myth:** High volume automatically means traders are giving up and a bottom is confirmed. **Reality:** Volume alone cannot reveal intent. A large spike may simply reflect a rapid price move that forces many market participants to adjust orders, creating a temporary imbalance. If the price decline is modest, the same volume could be part of normal market churn rather than a panic dump.
**Evidence:** The observation shows hourly direction down, price contained within local support and resistance, and relative volume 2.43x baseline. This pattern matches both a capitulation scenario. where exhausted sellers flood the market. and a continuation scenario. where aggressive buying absorbs the sell pressure and the down move pauses.
**Self‑check:** Track the next closed hourly candle. If the price rebounds sharply and RSI 44.9 rises above neutral, the volume likely represented a continuation cushion. If the price continues lower, breaks support, and volume remains elevated, the spike aligns with capitulation. Either outcome should be treated as a hypothesis, not a guarantee, and further candles are needed to validate the interpretation.
Probabilistic market research, not a recommendation or guaranteed return.
#INTCB #CryptoLearning
$INTCB : Why Volume Climax at the Bottom Often Looks Identical to Panic Collapse
$INTCB : Why does a surge of volume at the lower end of the range sometimes feel like capitulation and other times like a continuation signal? $INTCB is currently moving down inside the recorded range while volume sits above baseline.
**Myth:** High volume automatically means traders are giving up and a bottom is confirmed. **Reality:** Volume alone cannot reveal intent. A large spike may simply reflect a rapid price move that forces many market participants to adjust orders, creating a temporary imbalance. If the price decline is modest, the same volume could be part of normal market churn rather than a panic dump.
**Evidence:** The observation shows hourly direction down, price contained within local support and resistance, and relative volume 2.43x baseline. This pattern matches both a capitulation scenario. where exhausted sellers flood the market. and a continuation scenario. where aggressive buying absorbs the sell pressure and the down move pauses.
**Self‑check:** Track the next closed hourly candle. If the price rebounds sharply and RSI 44.9 rises above neutral, the volume likely represented a continuation cushion. If the price continues lower, breaks support, and volume remains elevated, the spike aligns with capitulation. Either outcome should be treated as a hypothesis, not a guarantee, and further candles are needed to validate the interpretation.
Probabilistic market research, not a recommendation or guaranteed return.
#INTCB #CryptoLearning
$INTCB : Why does a surge of volume at the lower end of the range sometimes feel like capitulation and other times like a continuation signal? $INTCB is currently moving down inside the recorded range while volume sits above baseline.
**Myth:** High volume automatically means traders are giving up and a bottom is confirmed. **Reality:** Volume alone cannot reveal intent. A large spike may simply reflect a rapid price move that forces many market participants to adjust orders, creating a temporary imbalance. If the price decline is modest, the same volume could be part of normal market churn rather than a panic dump.
**Evidence:** The observation shows hourly direction down, price contained within local support and resistance, and relative volume 2.43x baseline. This pattern matches both a capitulation scenario. where exhausted sellers flood the market. and a continuation scenario. where aggressive buying absorbs the sell pressure and the down move pauses.
**Self‑check:** Track the next closed hourly candle. If the price rebounds sharply and RSI 44.9 rises above neutral, the volume likely represented a continuation cushion. If the price continues lower, breaks support, and volume remains elevated, the spike aligns with capitulation. Either outcome should be treated as a hypothesis, not a guarantee, and further candles are needed to validate the interpretation.
Probabilistic market research, not a recommendation or guaranteed return.
#INTCB #CryptoLearning
59
·
--
See translation
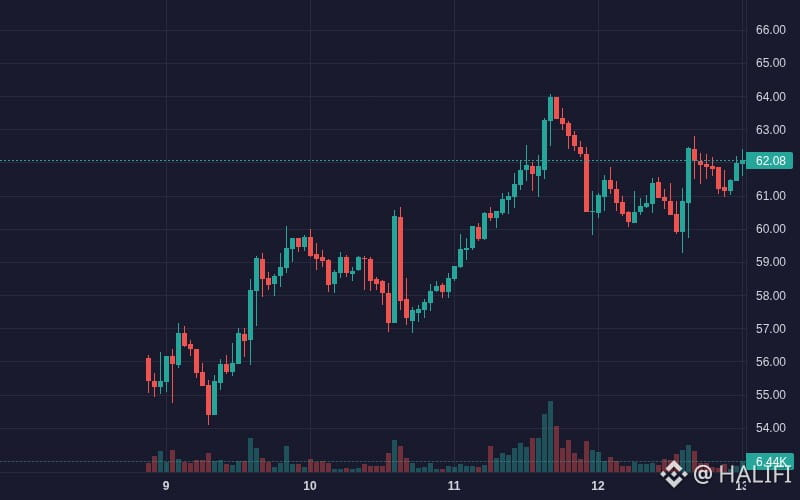
$INTCB INTCB is showing bullish movement: 1.90% (Crypto).
Volume: 9.63M | Last: $62.07
Key signals: high trader activity.
Bias Daily: BULLISH 🟢 | Weekly: BULLISH 🟢
INTCB rose 1.6% over 24h to $61.99, supported by semiconductor optimism and localized volume surges.
**Foundry & AI momentum (High)**: Optimism around domestic chip manufacturing and AI hardware positioning lifted broader sentiment
- **Surge in large buying flow (High)**: Peak net inflow of +$834.6K with +$262.2K in large orders catalyzed a sharp jump from $60.85 to $62.44
- **Bullish trend alignment (Medium)**: Price crossed above EMA 7 and EMA 25 while MACD histogram flipped positive to confirm upward momentum
#INTCB #AGT #sxt #SXT #Crypto
$INTCB INTCB is showing bullish movement: 1.90% (Crypto).
Volume: 9.63M | Last: $62.07
Key signals: high trader activity.
Bias Daily: BULLISH 🟢 | Weekly: BULLISH 🟢
INTCB rose 1.6% over 24h to $61.99, supported by semiconductor optimism and localized volume surges.
**Foundry & AI momentum (High)**: Optimism around domestic chip manufacturing and AI hardware positioning lifted broader sentiment
- **Surge in large buying flow (High)**: Peak net inflow of +$834.6K with +$262.2K in large orders catalyzed a sharp jump from $60.85 to $62.44
- **Bullish trend alignment (Medium)**: Price crossed above EMA 7 and EMA 25 while MACD histogram flipped positive to confirm upward momentum
#INTCB #AGT #sxt #SXT #Crypto
Volume: 9.63M | Last: $62.07
Key signals: high trader activity.
Bias Daily: BULLISH 🟢 | Weekly: BULLISH 🟢
INTCB rose 1.6% over 24h to $61.99, supported by semiconductor optimism and localized volume surges.
**Foundry & AI momentum (High)**: Optimism around domestic chip manufacturing and AI hardware positioning lifted broader sentiment
- **Surge in large buying flow (High)**: Peak net inflow of +$834.6K with +$262.2K in large orders catalyzed a sharp jump from $60.85 to $62.44
- **Bullish trend alignment (Medium)**: Price crossed above EMA 7 and EMA 25 while MACD histogram flipped positive to confirm upward momentum
#INTCB #AGT #sxt #SXT #Crypto
18
·
--
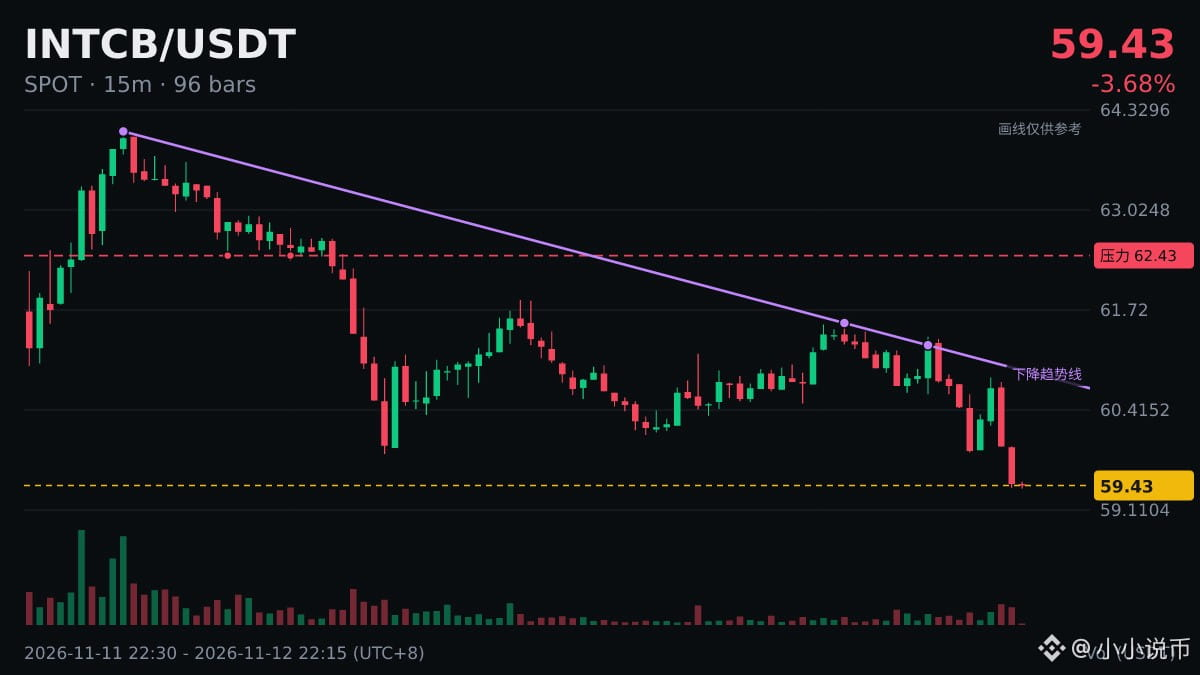
$INTCB A new 24-hour low has appeared.
24h: -3.27%, current price: 59.43, previous low: 59.84.
Structurally, a new low means the bulls' defense has been breached. On a rebound, the first thing to watch is whether price can reclaim the previous low. If it can't, the weakness may continue; if it can, a bottoming structure may form. What reasons do you have for going long or short?
#INTCB
$INTCB A new 24-hour low has appeared.
24h: -3.27%, current price: 59.43, previous low: 59.84.
Structurally, a new low means the bulls' defense has been breached. On a rebound, the first thing to watch is whether price can reclaim the previous low. If it can't, the weakness may continue; if it can, a bottoming structure may form. What reasons do you have for going long or short?
#INTCB
24h: -3.27%, current price: 59.43, previous low: 59.84.
Structurally, a new low means the bulls' defense has been breached. On a rebound, the first thing to watch is whether price can reclaim the previous low. If it can't, the weakness may continue; if it can, a bottoming structure may form. What reasons do you have for going long or short?
#INTCB
107
·
--
See translation
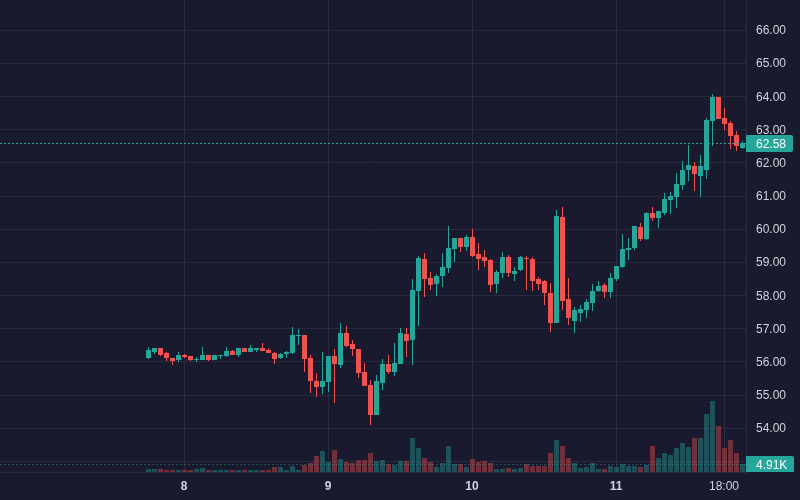
$INTCB INTCB is showing bullish movement: 7.10% (Crypto).
Volume: 20.79M | Last: $62.58
Key signals: strong momentum, high volatility, high trader activity.
Bias Daily: BULLISH 🟢 | Weekly: BULLISH 🟢
INTCB gained 7.2% in 24h, reaching $62.47 after peaking at $63.96 amid sector rotation before profit-taking emerged.
**Foundry turnaround sentiment (High)**: Optimism around U.S. domestic manufacturing and semiconductor sector rotation drove upside interest
- **Bullish momentum breakout (High)**: Price crossed above EMA-7 and Bollinger mid-band, climbing from $58.13 to peak at $63.96
- **Volume surge (Medium)**: Hourly volume spiked above $5.9M at the peak, confirming aggressive momentum buying
#INTCB #BinanceSquareFamily #HotCPIDecemberHikePriced #TRUMP #Crypto
$INTCB INTCB is showing bullish movement: 7.10% (Crypto).
Volume: 20.79M | Last: $62.58
Key signals: strong momentum, high volatility, high trader activity.
Bias Daily: BULLISH 🟢 | Weekly: BULLISH 🟢
INTCB gained 7.2% in 24h, reaching $62.47 after peaking at $63.96 amid sector rotation before profit-taking emerged.
**Foundry turnaround sentiment (High)**: Optimism around U.S. domestic manufacturing and semiconductor sector rotation drove upside interest
- **Bullish momentum breakout (High)**: Price crossed above EMA-7 and Bollinger mid-band, climbing from $58.13 to peak at $63.96
- **Volume surge (Medium)**: Hourly volume spiked above $5.9M at the peak, confirming aggressive momentum buying
#INTCB #BinanceSquareFamily #HotCPIDecemberHikePriced #TRUMP #Crypto
Volume: 20.79M | Last: $62.58
Key signals: strong momentum, high volatility, high trader activity.
Bias Daily: BULLISH 🟢 | Weekly: BULLISH 🟢
INTCB gained 7.2% in 24h, reaching $62.47 after peaking at $63.96 amid sector rotation before profit-taking emerged.
**Foundry turnaround sentiment (High)**: Optimism around U.S. domestic manufacturing and semiconductor sector rotation drove upside interest
- **Bullish momentum breakout (High)**: Price crossed above EMA-7 and Bollinger mid-band, climbing from $58.13 to peak at $63.96
- **Volume surge (Medium)**: Hourly volume spiked above $5.9M at the peak, confirming aggressive momentum buying
#INTCB #BinanceSquareFamily #HotCPIDecemberHikePriced #TRUMP #Crypto
16
Log in to explore more content
Join global crypto users on Binance Square
⚡️ Get latest and useful information about crypto.
💬 Trusted by the world’s largest crypto exchange.
👍 Discover real insights from verified creators.
Email / Phone number
Trending Topics
1
#NvidiaBeatsEstimatesWith$130BQ4Outlook
14,357 views
179 Discussing
2
#AnthropicIPOPriceCouldExceed$80
19,191 views
153 Discussing
3
#CanNvidia’sDataCenterGrowthContinue?
58,675 views
781 Discussing
4
#CanadaAndUSLaunchOperationNiagaraAgainstApprovalPhishing
3,850 views
36 Discussing
5
#BankOfEnglandUnveilsClearingHousePathwayCoveringDLTFirms
2,192 views
50 Discussing
6
#DBSAndCirclePartnerToExpandAsianInstitutionsUSDCAccess
3,459 views
58 Discussing
7
#LedgerHardwareImplantReportsExtendToDubai
25,554 views
328 Discussing
8
#NvidiaBoardNotConsideringHuang’sReturnasCEO
219,545 views
1,579 Discussing
9
#KOSPIFalls2.59%ToLowestCloseSinceFebruary
69,746 views
764 Discussing
10
#AnthropicClearedToListOnNasdaqAsANT
59,494 views
622 Discussing