
#intc
intc
240,602 views
1,937 Discussing
Hot
Latest


·
--
See translation
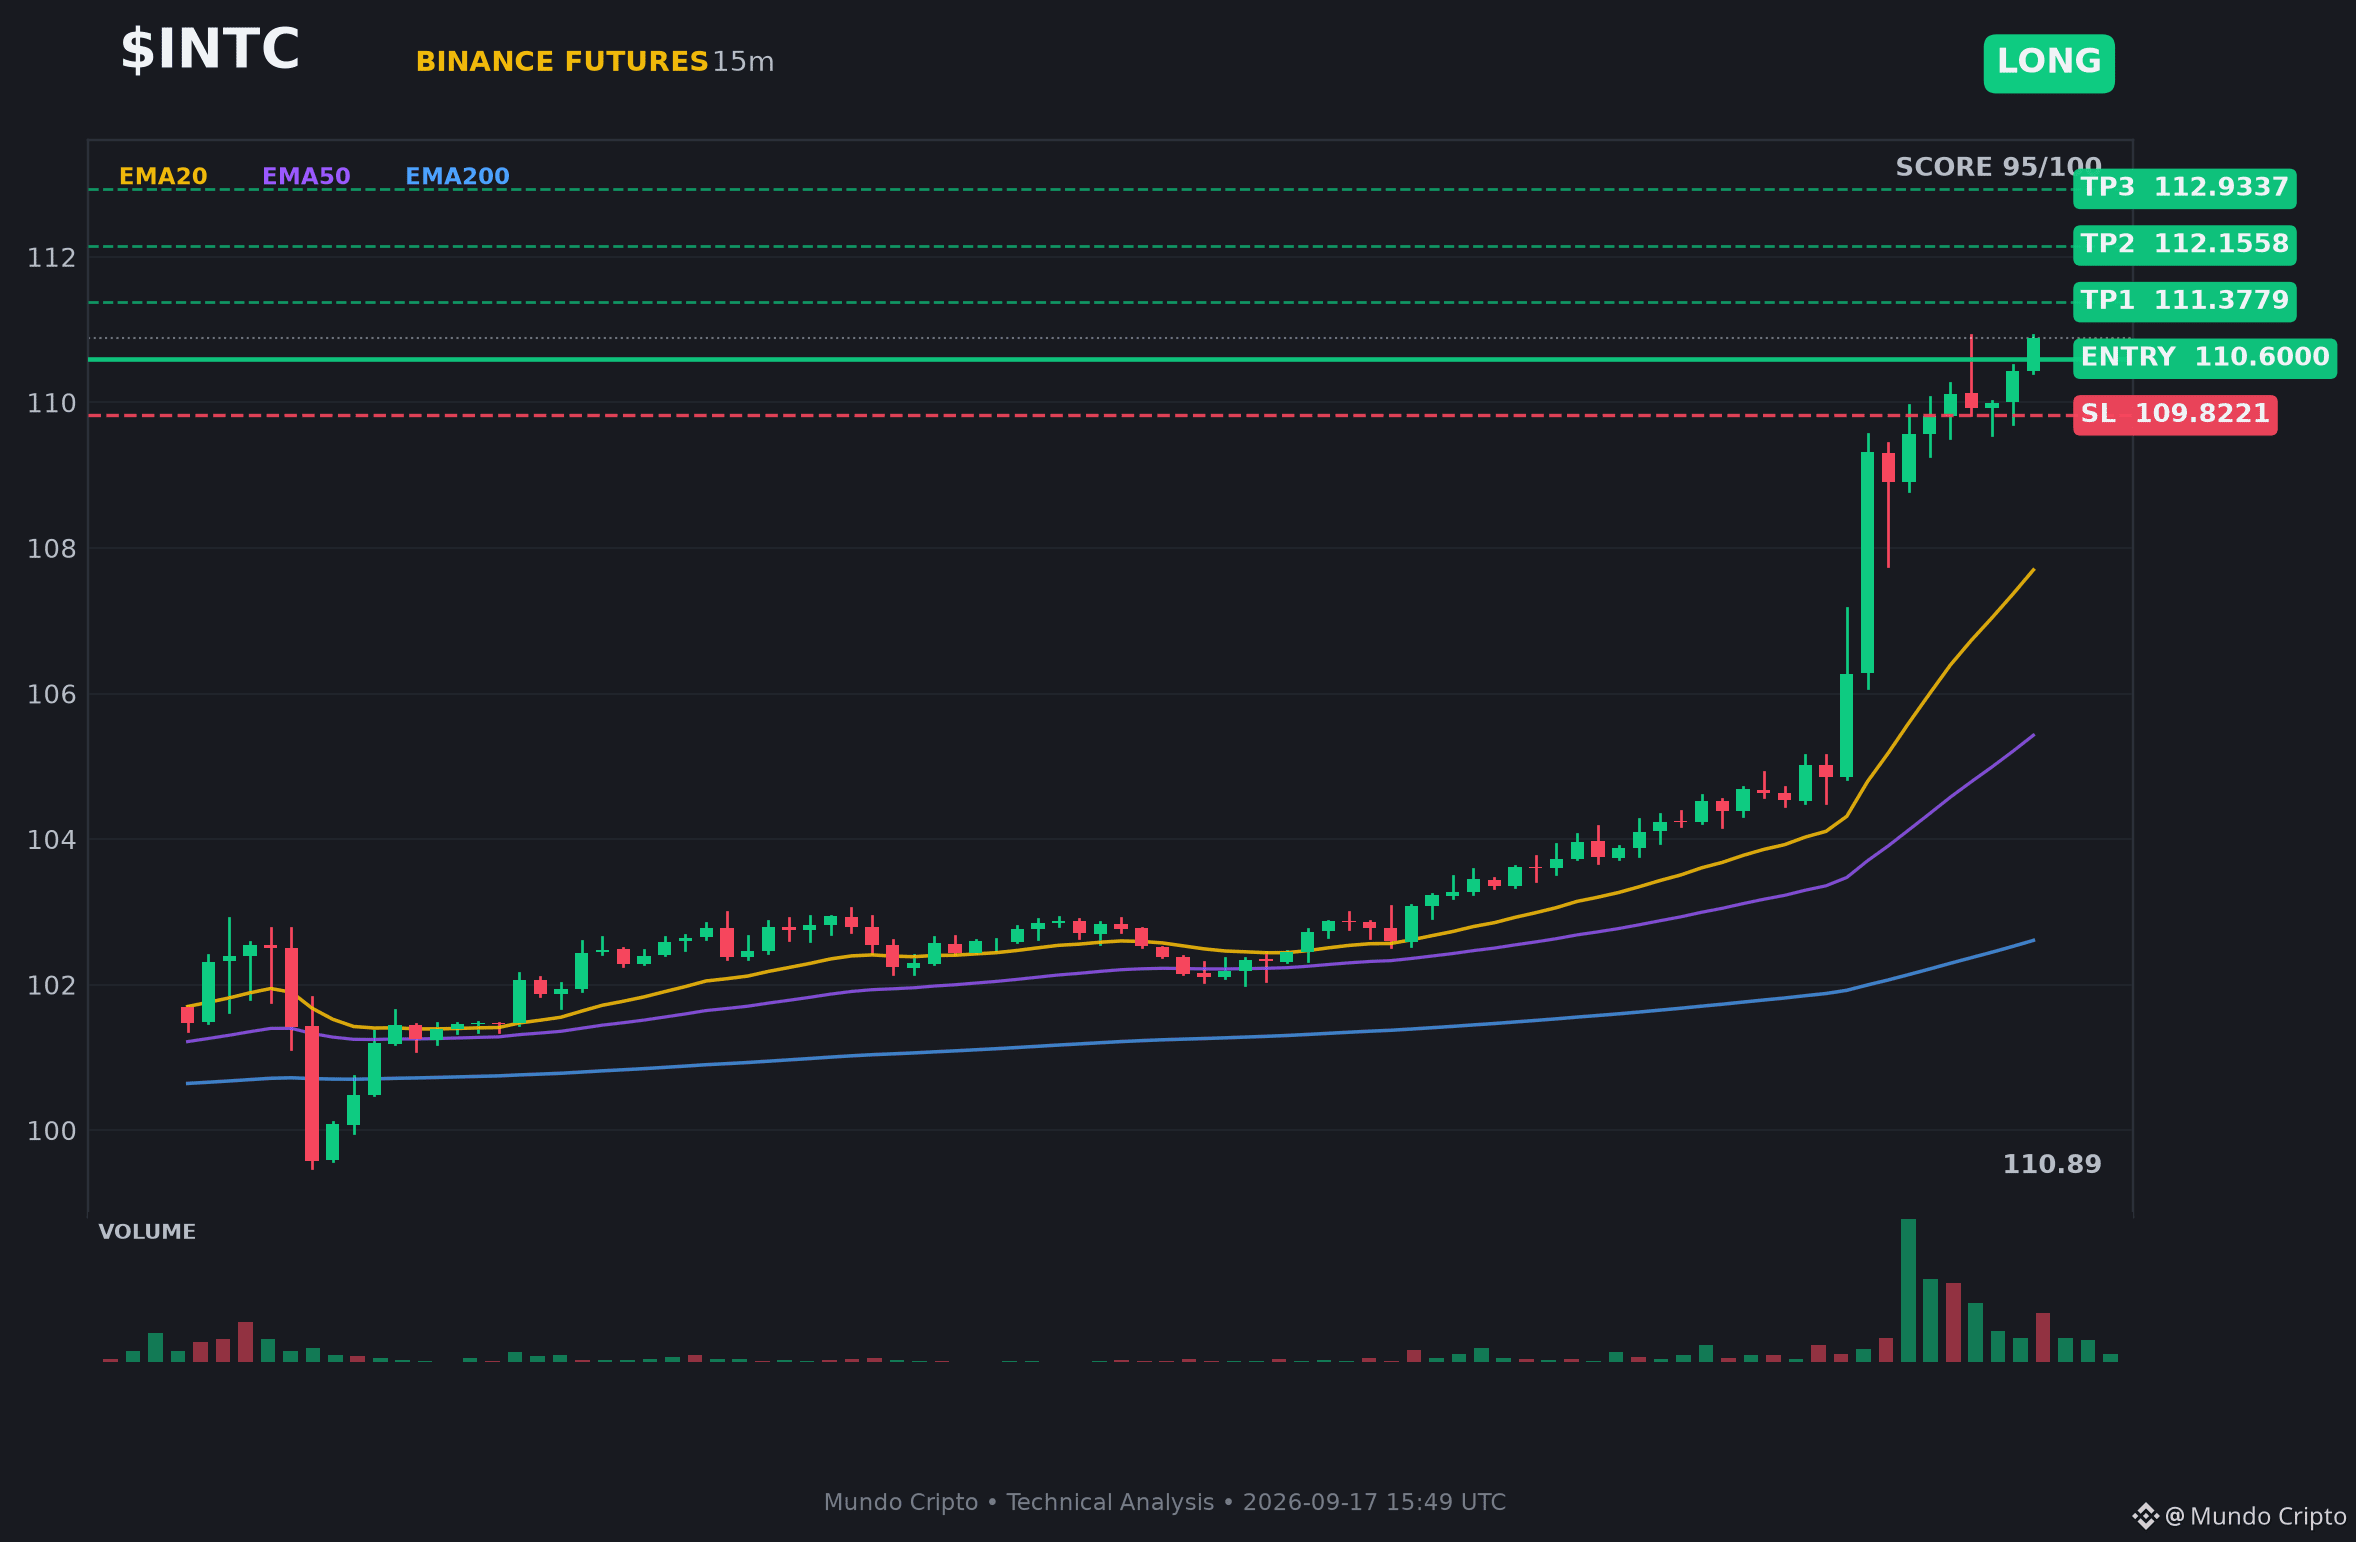
📈 $INTC | LONG SETUP
Strong demand zone confirmed. Buyers absorbing the selling pressure.
Entry: $110.32 - $110.88
TP: $111.38 - $112.16 - $112.93 - $113.71 - $114.88 - $116.82
SL: $109.82
#INTC #MundoCripto #Crypto #Trading
📈 $INTC | LONG SETUP
Strong demand zone confirmed. Buyers absorbing the selling pressure.
Entry: $110.32 - $110.88
TP: $111.38 - $112.16 - $112.93 - $113.71 - $114.88 - $116.82
SL: $109.82
#INTC #MundoCripto #Crypto #Trading
Strong demand zone confirmed. Buyers absorbing the selling pressure.
Entry: $110.32 - $110.88
TP: $111.38 - $112.16 - $112.93 - $113.71 - $114.88 - $116.82
SL: $109.82
#INTC #MundoCripto #Crypto #Trading
53

·
--
See translation
Downside targets are active for $INTC with a clear risk-defined entry.
⚡ $INTC — SHORT SETUP
📍 Entry: 104.88 – 105.5
🎯 TP1: 103.62
🎯 TP2: 102.79
🎯 TP3: 101.54
🛑 Stop Loss: 106.13
Trade here 👇
📌 Trade management rules: see pinned post.
What's your take on $INTC at these levels? Drop your thoughts below and follow for more daily trade setups!
#WriteToEarn #INTC #CryptoTrading #BinanceSquare #Crypto
Downside targets are active for $INTC with a clear risk-defined entry.
⚡ $INTC — SHORT SETUP
📍 Entry: 104.88 – 105.5
🎯 TP1: 103.62
🎯 TP2: 102.79
🎯 TP3: 101.54
🛑 Stop Loss: 106.13
Trade here 👇
📌 Trade management rules: see pinned post.
What's your take on $INTC at these levels? Drop your thoughts below and follow for more daily trade setups!
#WriteToEarn #INTC #CryptoTrading #BinanceSquare #Crypto
⚡ $INTC — SHORT SETUP
📍 Entry: 104.88 – 105.5
🎯 TP1: 103.62
🎯 TP2: 102.79
🎯 TP3: 101.54
🛑 Stop Loss: 106.13
Trade here 👇
📌 Trade management rules: see pinned post.
What's your take on $INTC at these levels? Drop your thoughts below and follow for more daily trade setups!
#WriteToEarn #INTC #CryptoTrading #BinanceSquare #Crypto
1
61

See translation
🚨 $19M WHALE LOADS HEAVY $INTC LONG WITH PRE-SET EXIT ORDERS! 🦈
Entry: 102.29 🟢
Target: 110.00 - 112.00 🎯
📊 Institutional smart money just executed a massive $19M long position on $INTC at an average entry of $102.29. Rather than holding blindly, this whale has already mapped out a methodical exit strategy across the board.
📌 A ladder of 100 reduce-only sell orders is stacked between $110 and $112, aiming for a clean 7.5% to 9.4% profit expansion. 🔍 With smart money locking in precise targets before price even moves, are you front-running this liquidity or waiting on the sidelines? 👇
⚠️ Not financial advice. Always manage your risk. 🛡️
🏷️ #INTC #WhaleAlert #LongSetup #SmartMoney #Crypto
🔥 💎
🚨 $19M WHALE LOADS HEAVY $INTC LONG WITH PRE-SET EXIT ORDERS! 🦈
Entry: 102.29 🟢
Target: 110.00 - 112.00 🎯
📊 Institutional smart money just executed a massive $19M long position on $INTC at an average entry of $102.29. Rather than holding blindly, this whale has already mapped out a methodical exit strategy across the board.
📌 A ladder of 100 reduce-only sell orders is stacked between $110 and $112, aiming for a clean 7.5% to 9.4% profit expansion. 🔍 With smart money locking in precise targets before price even moves, are you front-running this liquidity or waiting on the sidelines? 👇
⚠️ Not financial advice. Always manage your risk. 🛡️
🏷️ #INTC #WhaleAlert #LongSetup #SmartMoney #Crypto
🔥 💎
Entry: 102.29 🟢
Target: 110.00 - 112.00 🎯
📊 Institutional smart money just executed a massive $19M long position on $INTC at an average entry of $102.29. Rather than holding blindly, this whale has already mapped out a methodical exit strategy across the board.
📌 A ladder of 100 reduce-only sell orders is stacked between $110 and $112, aiming for a clean 7.5% to 9.4% profit expansion. 🔍 With smart money locking in precise targets before price even moves, are you front-running this liquidity or waiting on the sidelines? 👇
⚠️ Not financial advice. Always manage your risk. 🛡️
🏷️ #INTC #WhaleAlert #LongSetup #SmartMoney #Crypto
🔥 💎
21

See translation
🚨 INSTITUTIONAL WHALE DEPLOYS $18.9M LONG POSITION ON $INTC WITH DEDICATED TARGETS! 🦈
Entry: 102.29 ⚡
Target: 110.00 - 112.00 🚀
Smart money flow just printed a significant footprint on $INTC . A prominent institutional wallet accumulated a $18.95M long position at an average entry of $102.29, displaying clear conviction in local demand absorption. 🦈
Rather than relying on market order execution during volatile expansion, 100 reduce-only limit sell orders have already been stacked across the $110 to $112 liquidity cluster. 📊 This systematic distribution strategy aims to capture a 7.5% to 9.4% move, absorbing resting bids before momentum fades. 💡
With smart capital fully allocated into this single market structure, institutional bias leans heavily toward an upside liquidity hunt. 💬 Do you align your bids with institutional order blocks or wait for lower timeframe confirmation? 👇
⚠️ Not financial advice. Always manage your risk. 🛡️
🏷️ #INTC #SmartMoney #OrderFlow #Trading #Crypto
🦈 🏦
🚨 INSTITUTIONAL WHALE DEPLOYS $18.9M LONG POSITION ON $INTC WITH DEDICATED TARGETS! 🦈
Entry: 102.29 ⚡
Target: 110.00 - 112.00 🚀
Smart money flow just printed a significant footprint on $INTC . A prominent institutional wallet accumulated a $18.95M long position at an average entry of $102.29, displaying clear conviction in local demand absorption. 🦈
Rather than relying on market order execution during volatile expansion, 100 reduce-only limit sell orders have already been stacked across the $110 to $112 liquidity cluster. 📊 This systematic distribution strategy aims to capture a 7.5% to 9.4% move, absorbing resting bids before momentum fades. 💡
With smart capital fully allocated into this single market structure, institutional bias leans heavily toward an upside liquidity hunt. 💬 Do you align your bids with institutional order blocks or wait for lower timeframe confirmation? 👇
⚠️ Not financial advice. Always manage your risk. 🛡️
🏷️ #INTC #SmartMoney #OrderFlow #Trading #Crypto
🦈 🏦
Entry: 102.29 ⚡
Target: 110.00 - 112.00 🚀
Smart money flow just printed a significant footprint on $INTC . A prominent institutional wallet accumulated a $18.95M long position at an average entry of $102.29, displaying clear conviction in local demand absorption. 🦈
Rather than relying on market order execution during volatile expansion, 100 reduce-only limit sell orders have already been stacked across the $110 to $112 liquidity cluster. 📊 This systematic distribution strategy aims to capture a 7.5% to 9.4% move, absorbing resting bids before momentum fades. 💡
With smart capital fully allocated into this single market structure, institutional bias leans heavily toward an upside liquidity hunt. 💬 Do you align your bids with institutional order blocks or wait for lower timeframe confirmation? 👇
⚠️ Not financial advice. Always manage your risk. 🛡️
🏷️ #INTC #SmartMoney #OrderFlow #Trading #Crypto
🦈 🏦
17

·
--
See translation
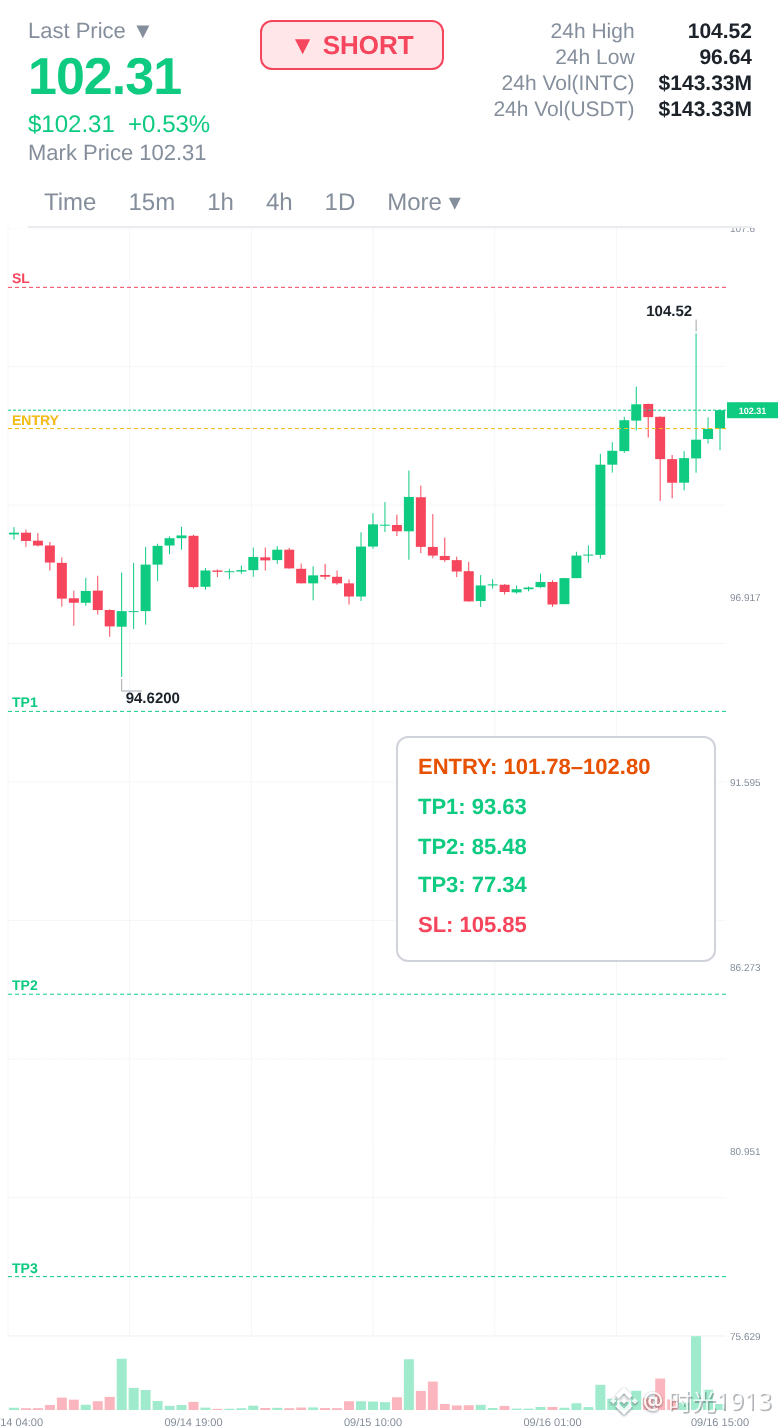
INTC is in a continuation pattern — I'm holding
I'm going to let the market do its thing here. No need to force it.
CONTINUATION — 📉 SHORT
📉 Trade Plan:
📉 Entry: 101.78 – 102.80
🛑 Stop: 105.85
🎯 TP1: 93.63
🎯 TP2: 85.48
🎯 TP3: 77.34
📊 Confidence: 78%
Risk/reward on shorts is exceptional at current levels.
The technical damage cannot be ignored.
Bounce Is Real 👉 $INTC 👈 Catch It
#INTC $SOL $BTC
INTC is in a continuation pattern — I'm holding
I'm going to let the market do its thing here. No need to force it.
CONTINUATION — 📉 SHORT
📉 Trade Plan:
📉 Entry: 101.78 – 102.80
🛑 Stop: 105.85
🎯 TP1: 93.63
🎯 TP2: 85.48
🎯 TP3: 77.34
📊 Confidence: 78%
Risk/reward on shorts is exceptional at current levels.
The technical damage cannot be ignored.
Bounce Is Real 👉 $INTC 👈 Catch It
#INTC $SOL $BTC
I'm going to let the market do its thing here. No need to force it.
CONTINUATION — 📉 SHORT
📉 Trade Plan:
📉 Entry: 101.78 – 102.80
🛑 Stop: 105.85
🎯 TP1: 93.63
🎯 TP2: 85.48
🎯 TP3: 77.34
📊 Confidence: 78%
Risk/reward on shorts is exceptional at current levels.
The technical damage cannot be ignored.
Bounce Is Real 👉 $INTC 👈 Catch It
#INTC $SOL $BTC
218

·
--
See translation
$INTC
{future}(INTCUSDT)
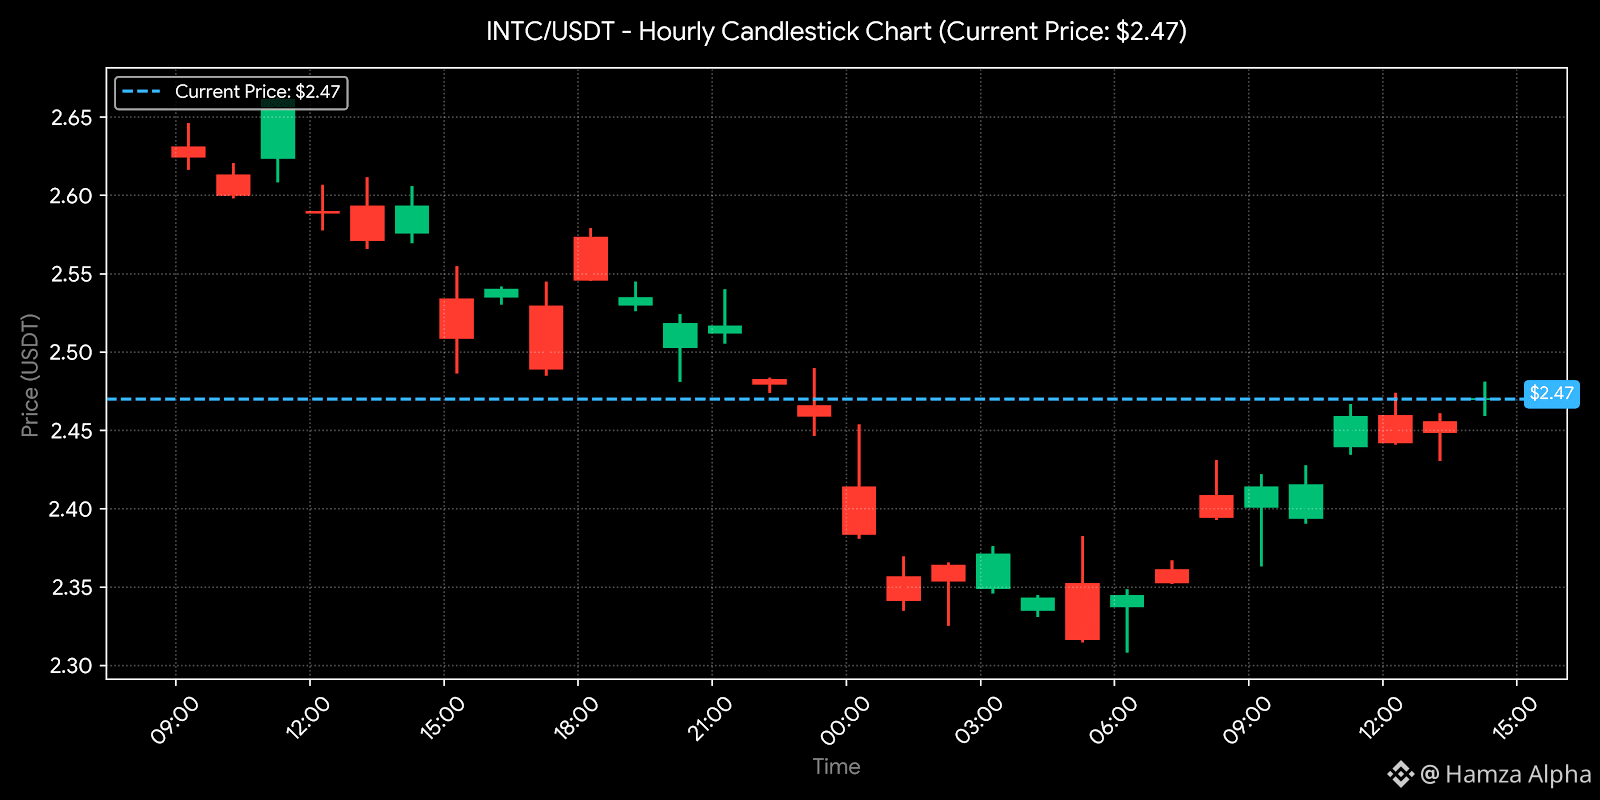
Intel (INTC/USDT) — Market Analysis 📊
INTC/USDT is being watched closely as semiconductor and AI-related market sentiment continues to influence price action. Traders should focus on momentum, volume, and key technical levels.
📈 Bullish Setup: A sustained breakout above nearby resistance with increasing volume could strengthen buying momentum.
📉 Bearish Risk: Rejection at resistance or a breakdown below support could bring additional selling pressure.
🔎 Key Signals: Monitor volume, RSI, moving averages, support/resistance, and higher-high/lower-low formations.
⚡ Trading Focus: Strong volume confirmation is important when assessing whether a breakout has genuine momentum.
#INTC #INTCUSDT #Stocks #BinanceSquare
$INTC
Intel (INTC/USDT) — Market Analysis 📊
INTC/USDT is being watched closely as semiconductor and AI-related market sentiment continues to influence price action. Traders should focus on momentum, volume, and key technical levels.
📈 Bullish Setup: A sustained breakout above nearby resistance with increasing volume could strengthen buying momentum.
📉 Bearish Risk: Rejection at resistance or a breakdown below support could bring additional selling pressure.
🔎 Key Signals: Monitor volume, RSI, moving averages, support/resistance, and higher-high/lower-low formations.
⚡ Trading Focus: Strong volume confirmation is important when assessing whether a breakout has genuine momentum.
#INTC #INTCUSDT #Stocks #BinanceSquare
Intel (INTC/USDT) — Market Analysis 📊
INTC/USDT is being watched closely as semiconductor and AI-related market sentiment continues to influence price action. Traders should focus on momentum, volume, and key technical levels.
📈 Bullish Setup: A sustained breakout above nearby resistance with increasing volume could strengthen buying momentum.
📉 Bearish Risk: Rejection at resistance or a breakdown below support could bring additional selling pressure.
🔎 Key Signals: Monitor volume, RSI, moving averages, support/resistance, and higher-high/lower-low formations.
⚡ Trading Focus: Strong volume confirmation is important when assessing whether a breakout has genuine momentum.
#INTC #INTCUSDT #Stocks #BinanceSquare
62

See translation
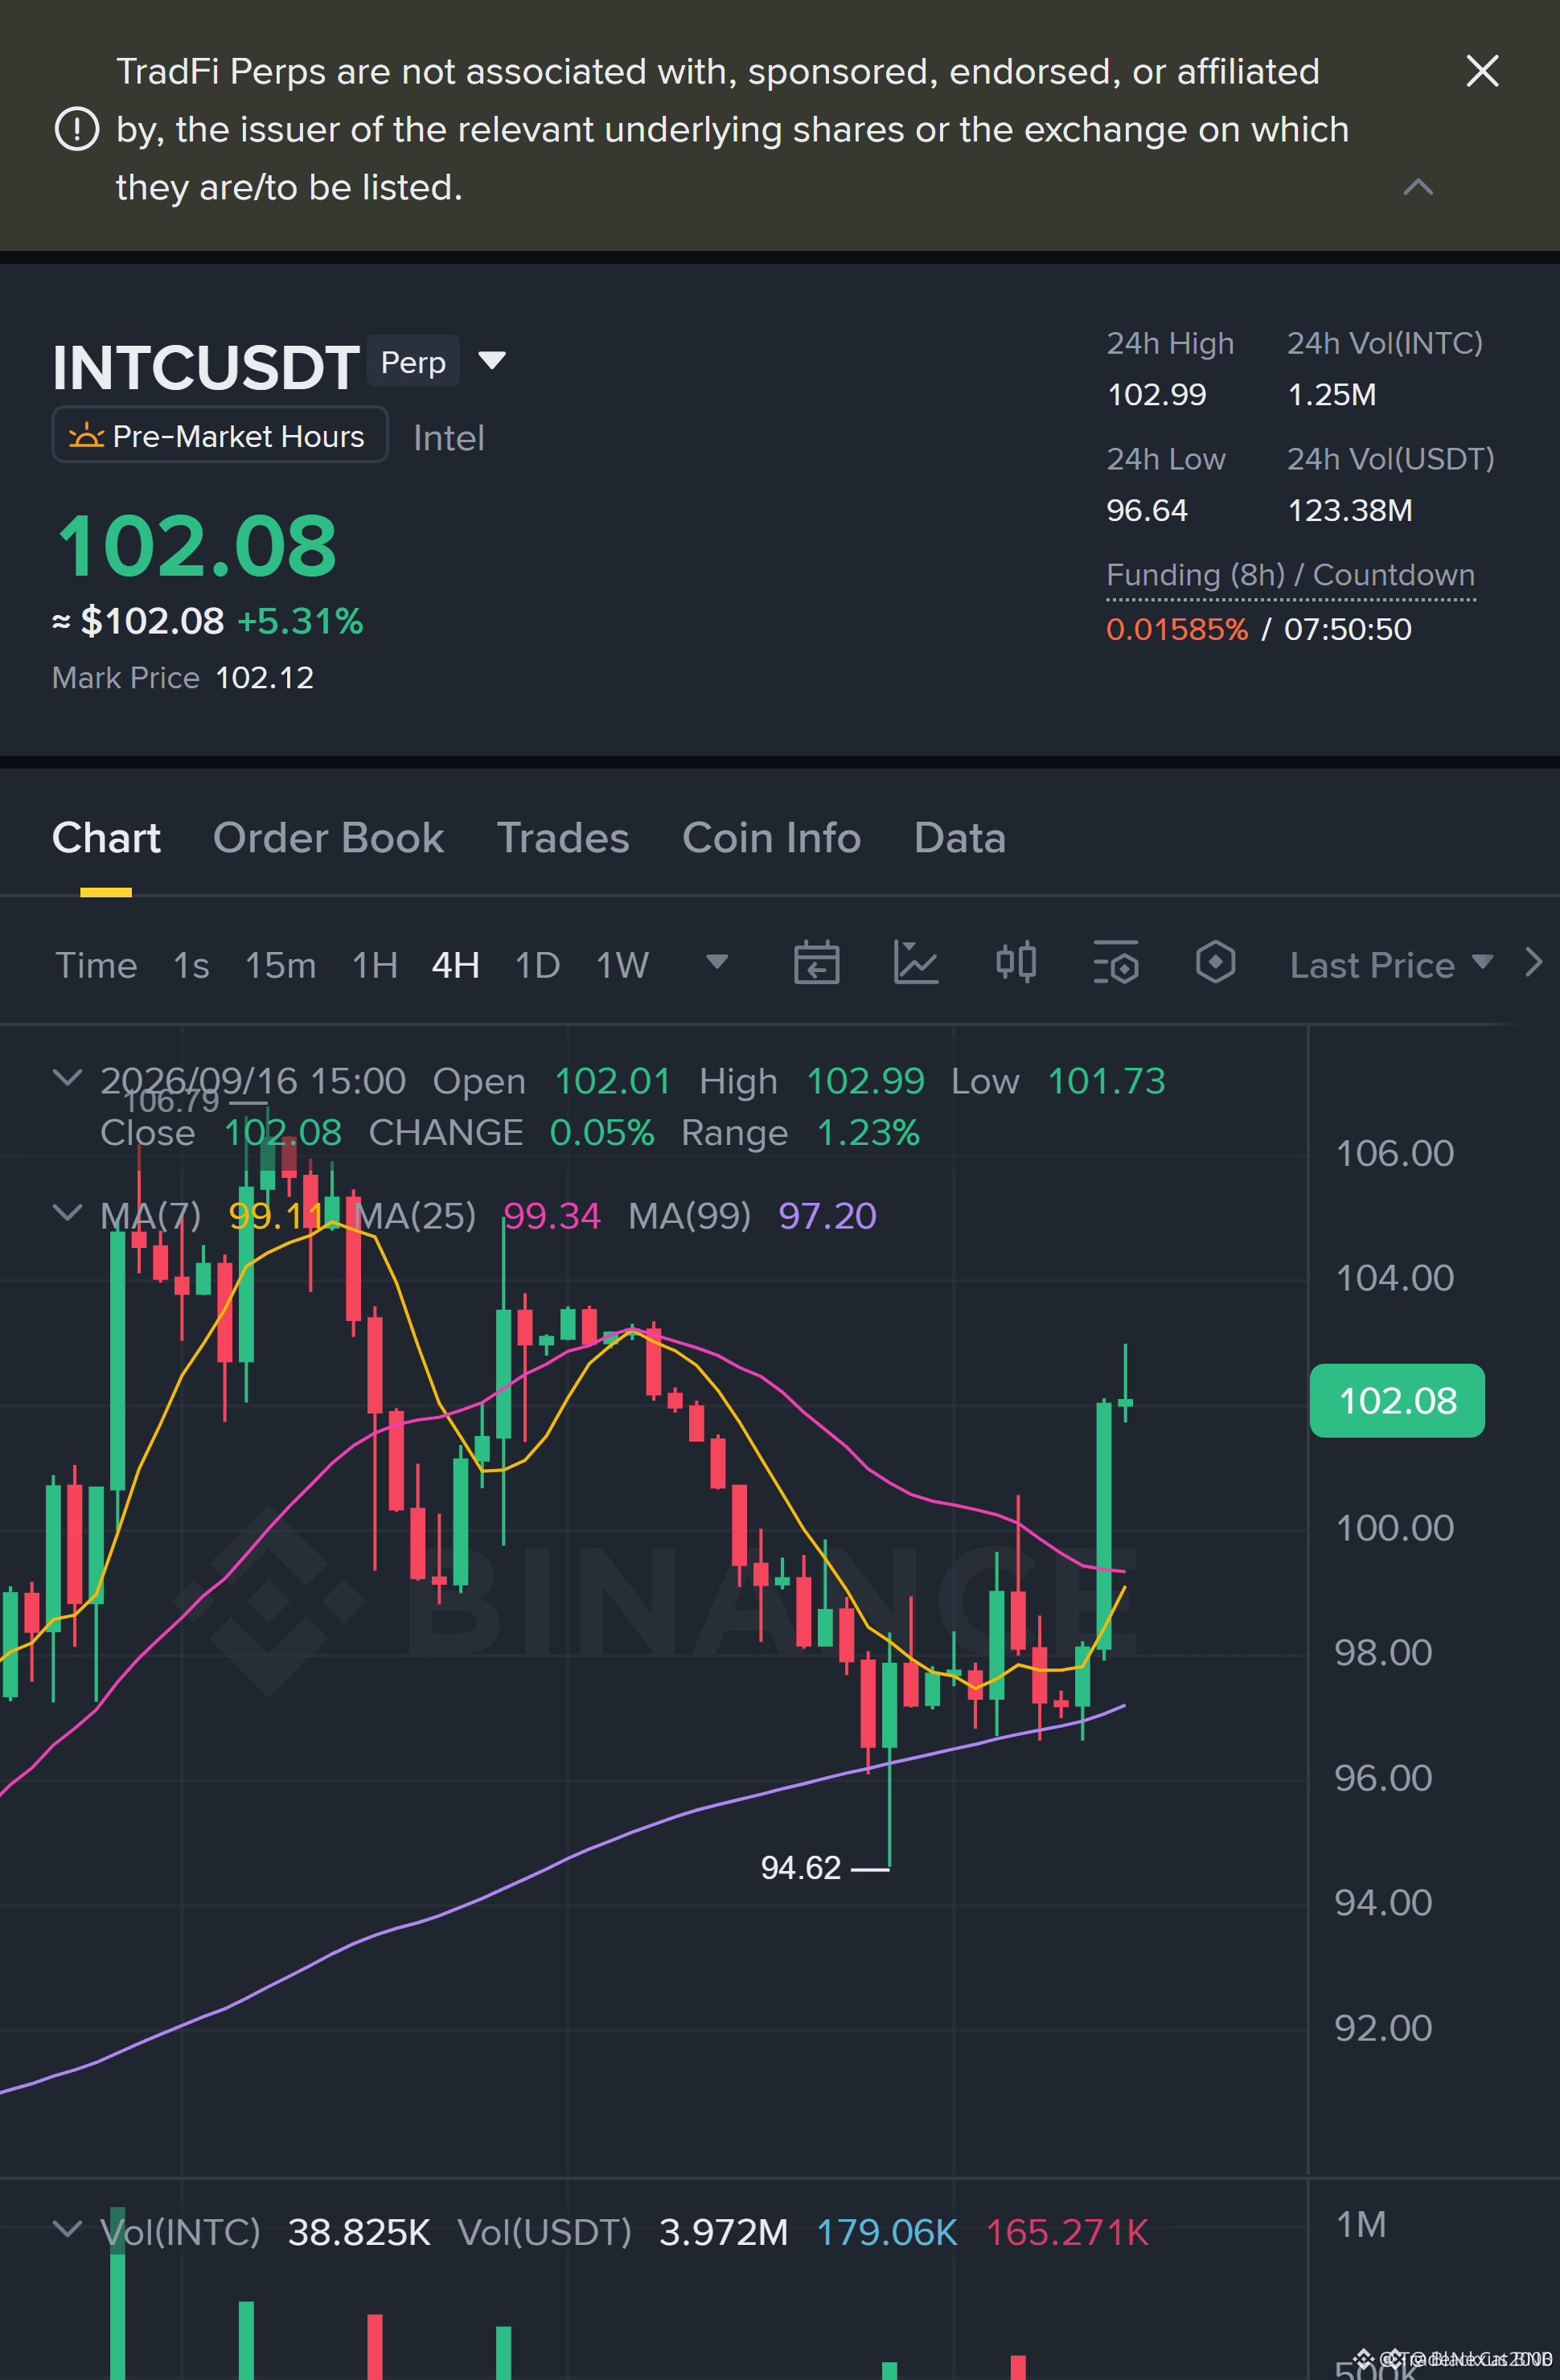
$INTC BREAKOUT RETEST WATCH: WHERE SMART MONEY MAY RELOAD 🦈⚡
Entry: 101.30–101.48 ⚡
Target: 102.29 / 102.98 / 103.67 🚀
Stop Loss: 100.38 ⚠️
📌 The 1H structure favors a retest of the 101.30–101.48 breakout shelf, but the 15M confirmation is still missing. 🦈 Smart money rarely chases; it waits for liquidity to reload at the demand zone.
Scale-out plan: 25% at 102.29, 25% at 102.98, 50% at 103.67. 💡 Risk sits below 100.38, keeping the invalidation tight and the reward ladder clean.
💬 Are you waiting for a reclaim confirmation, or will you fade a deeper sweep into 100.38 first?
⚠️ Not financial advice. Always manage your risk. 🛡️
🏷️ #INTC #LongSetup #Breakout #Watchlist #Crypto
🎯 🦈
$INTC BREAKOUT RETEST WATCH: WHERE SMART MONEY MAY RELOAD 🦈⚡
Entry: 101.30–101.48 ⚡
Target: 102.29 / 102.98 / 103.67 🚀
Stop Loss: 100.38 ⚠️
📌 The 1H structure favors a retest of the 101.30–101.48 breakout shelf, but the 15M confirmation is still missing. 🦈 Smart money rarely chases; it waits for liquidity to reload at the demand zone.
Scale-out plan: 25% at 102.29, 25% at 102.98, 50% at 103.67. 💡 Risk sits below 100.38, keeping the invalidation tight and the reward ladder clean.
💬 Are you waiting for a reclaim confirmation, or will you fade a deeper sweep into 100.38 first?
⚠️ Not financial advice. Always manage your risk. 🛡️
🏷️ #INTC #LongSetup #Breakout #Watchlist #Crypto
🎯 🦈
Entry: 101.30–101.48 ⚡
Target: 102.29 / 102.98 / 103.67 🚀
Stop Loss: 100.38 ⚠️
📌 The 1H structure favors a retest of the 101.30–101.48 breakout shelf, but the 15M confirmation is still missing. 🦈 Smart money rarely chases; it waits for liquidity to reload at the demand zone.
Scale-out plan: 25% at 102.29, 25% at 102.98, 50% at 103.67. 💡 Risk sits below 100.38, keeping the invalidation tight and the reward ladder clean.
💬 Are you waiting for a reclaim confirmation, or will you fade a deeper sweep into 100.38 first?
⚠️ Not financial advice. Always manage your risk. 🛡️
🏷️ #INTC #LongSetup #Breakout #Watchlist #Crypto
🎯 🦈
1
78

·
--
Bearish
See translation
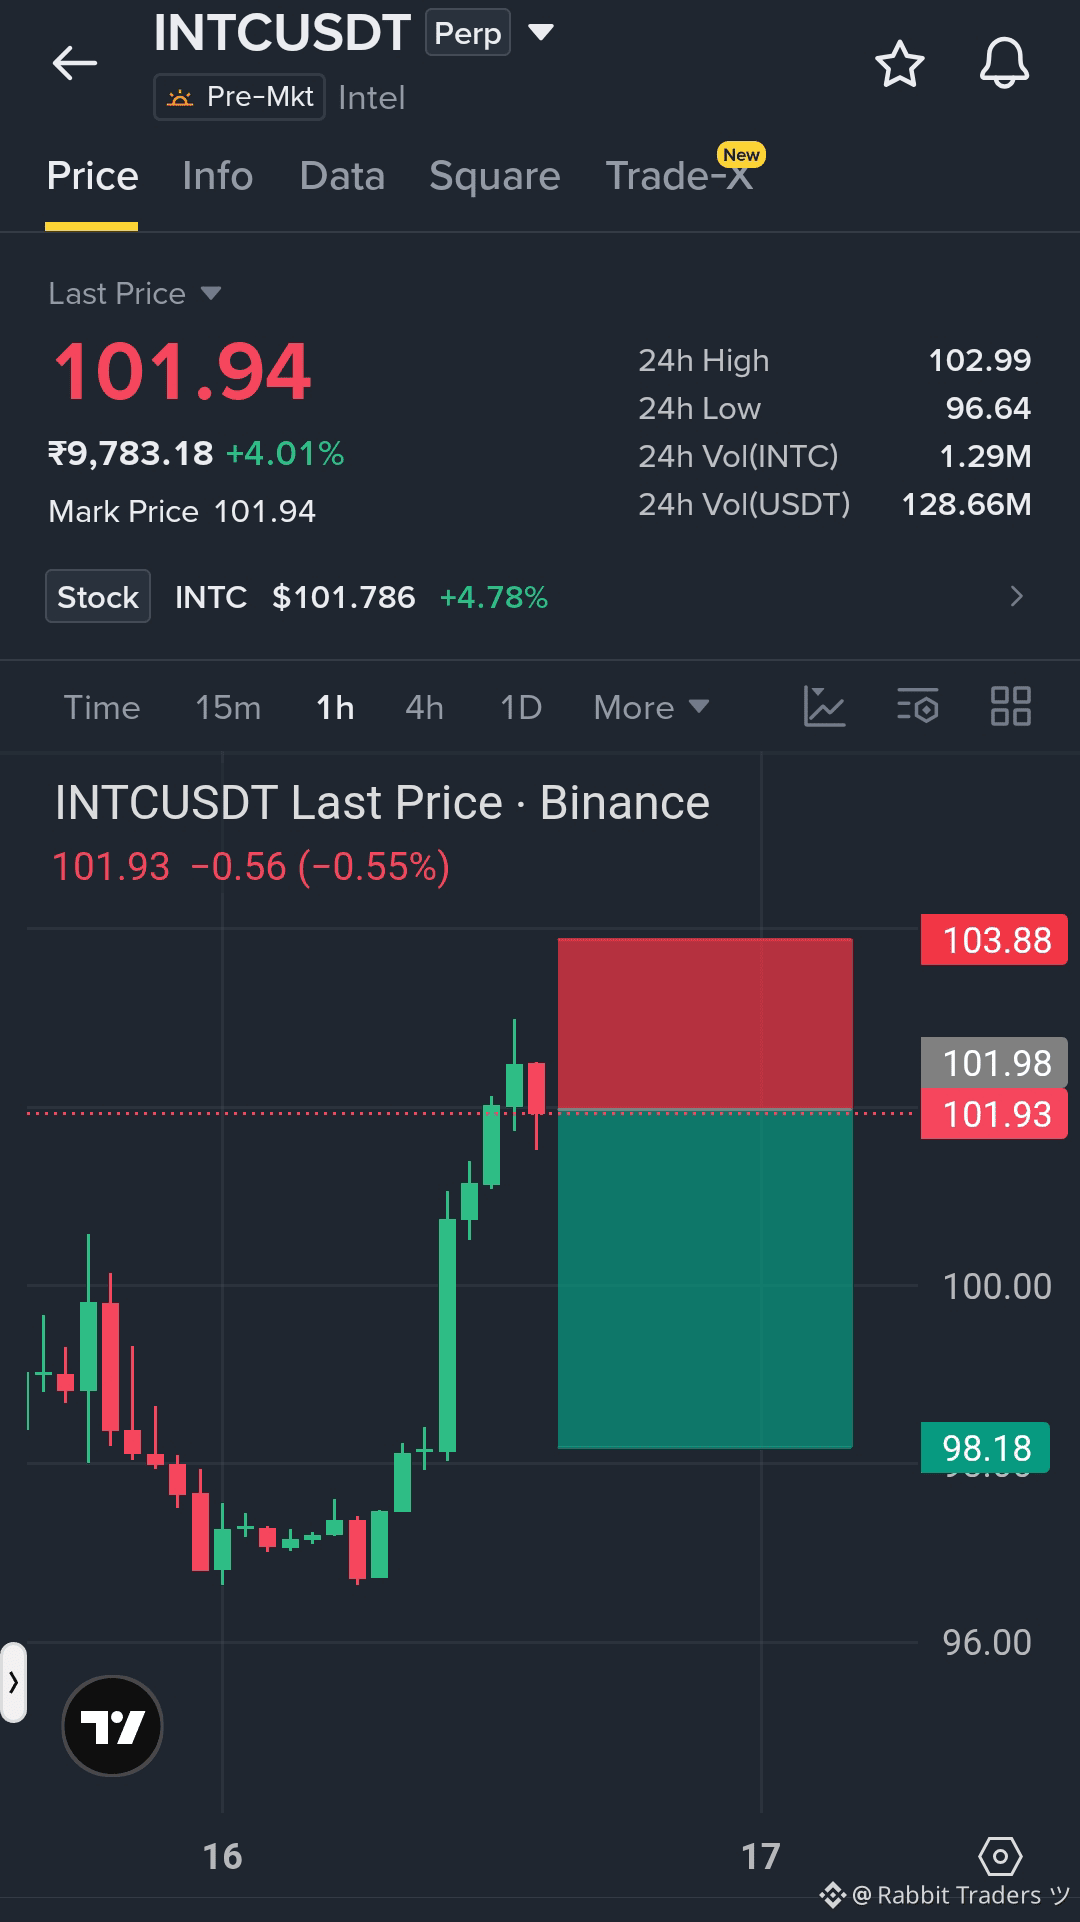
#INTC SHORT ALERT 🤯 I am doing Short here👇
Don’t let this rejection fool you..... I’m watching the downside from here. Short right nowwww 🔥
Entry: 101.98
Stop-loss: 103.88
TP1: 100.71
TP2: 99.45
TP3: 98.18
Click here to trade 👇⬇️⬇️ Short with meeee...👇⬇️ $INTC
{future}(INTCUSDT)
#INTC SHORT ALERT 🤯 I am doing Short here👇
Don’t let this rejection fool you..... I’m watching the downside from here. Short right nowwww 🔥
Entry: 101.98
Stop-loss: 103.88
TP1: 100.71
TP2: 99.45
TP3: 98.18
Click here to trade 👇⬇️⬇️ Short with meeee...👇⬇️ $INTC
Don’t let this rejection fool you..... I’m watching the downside from here. Short right nowwww 🔥
Entry: 101.98
Stop-loss: 103.88
TP1: 100.71
TP2: 99.45
TP3: 98.18
Click here to trade 👇⬇️⬇️ Short with meeee...👇⬇️ $INTC
204

·
--
See translation
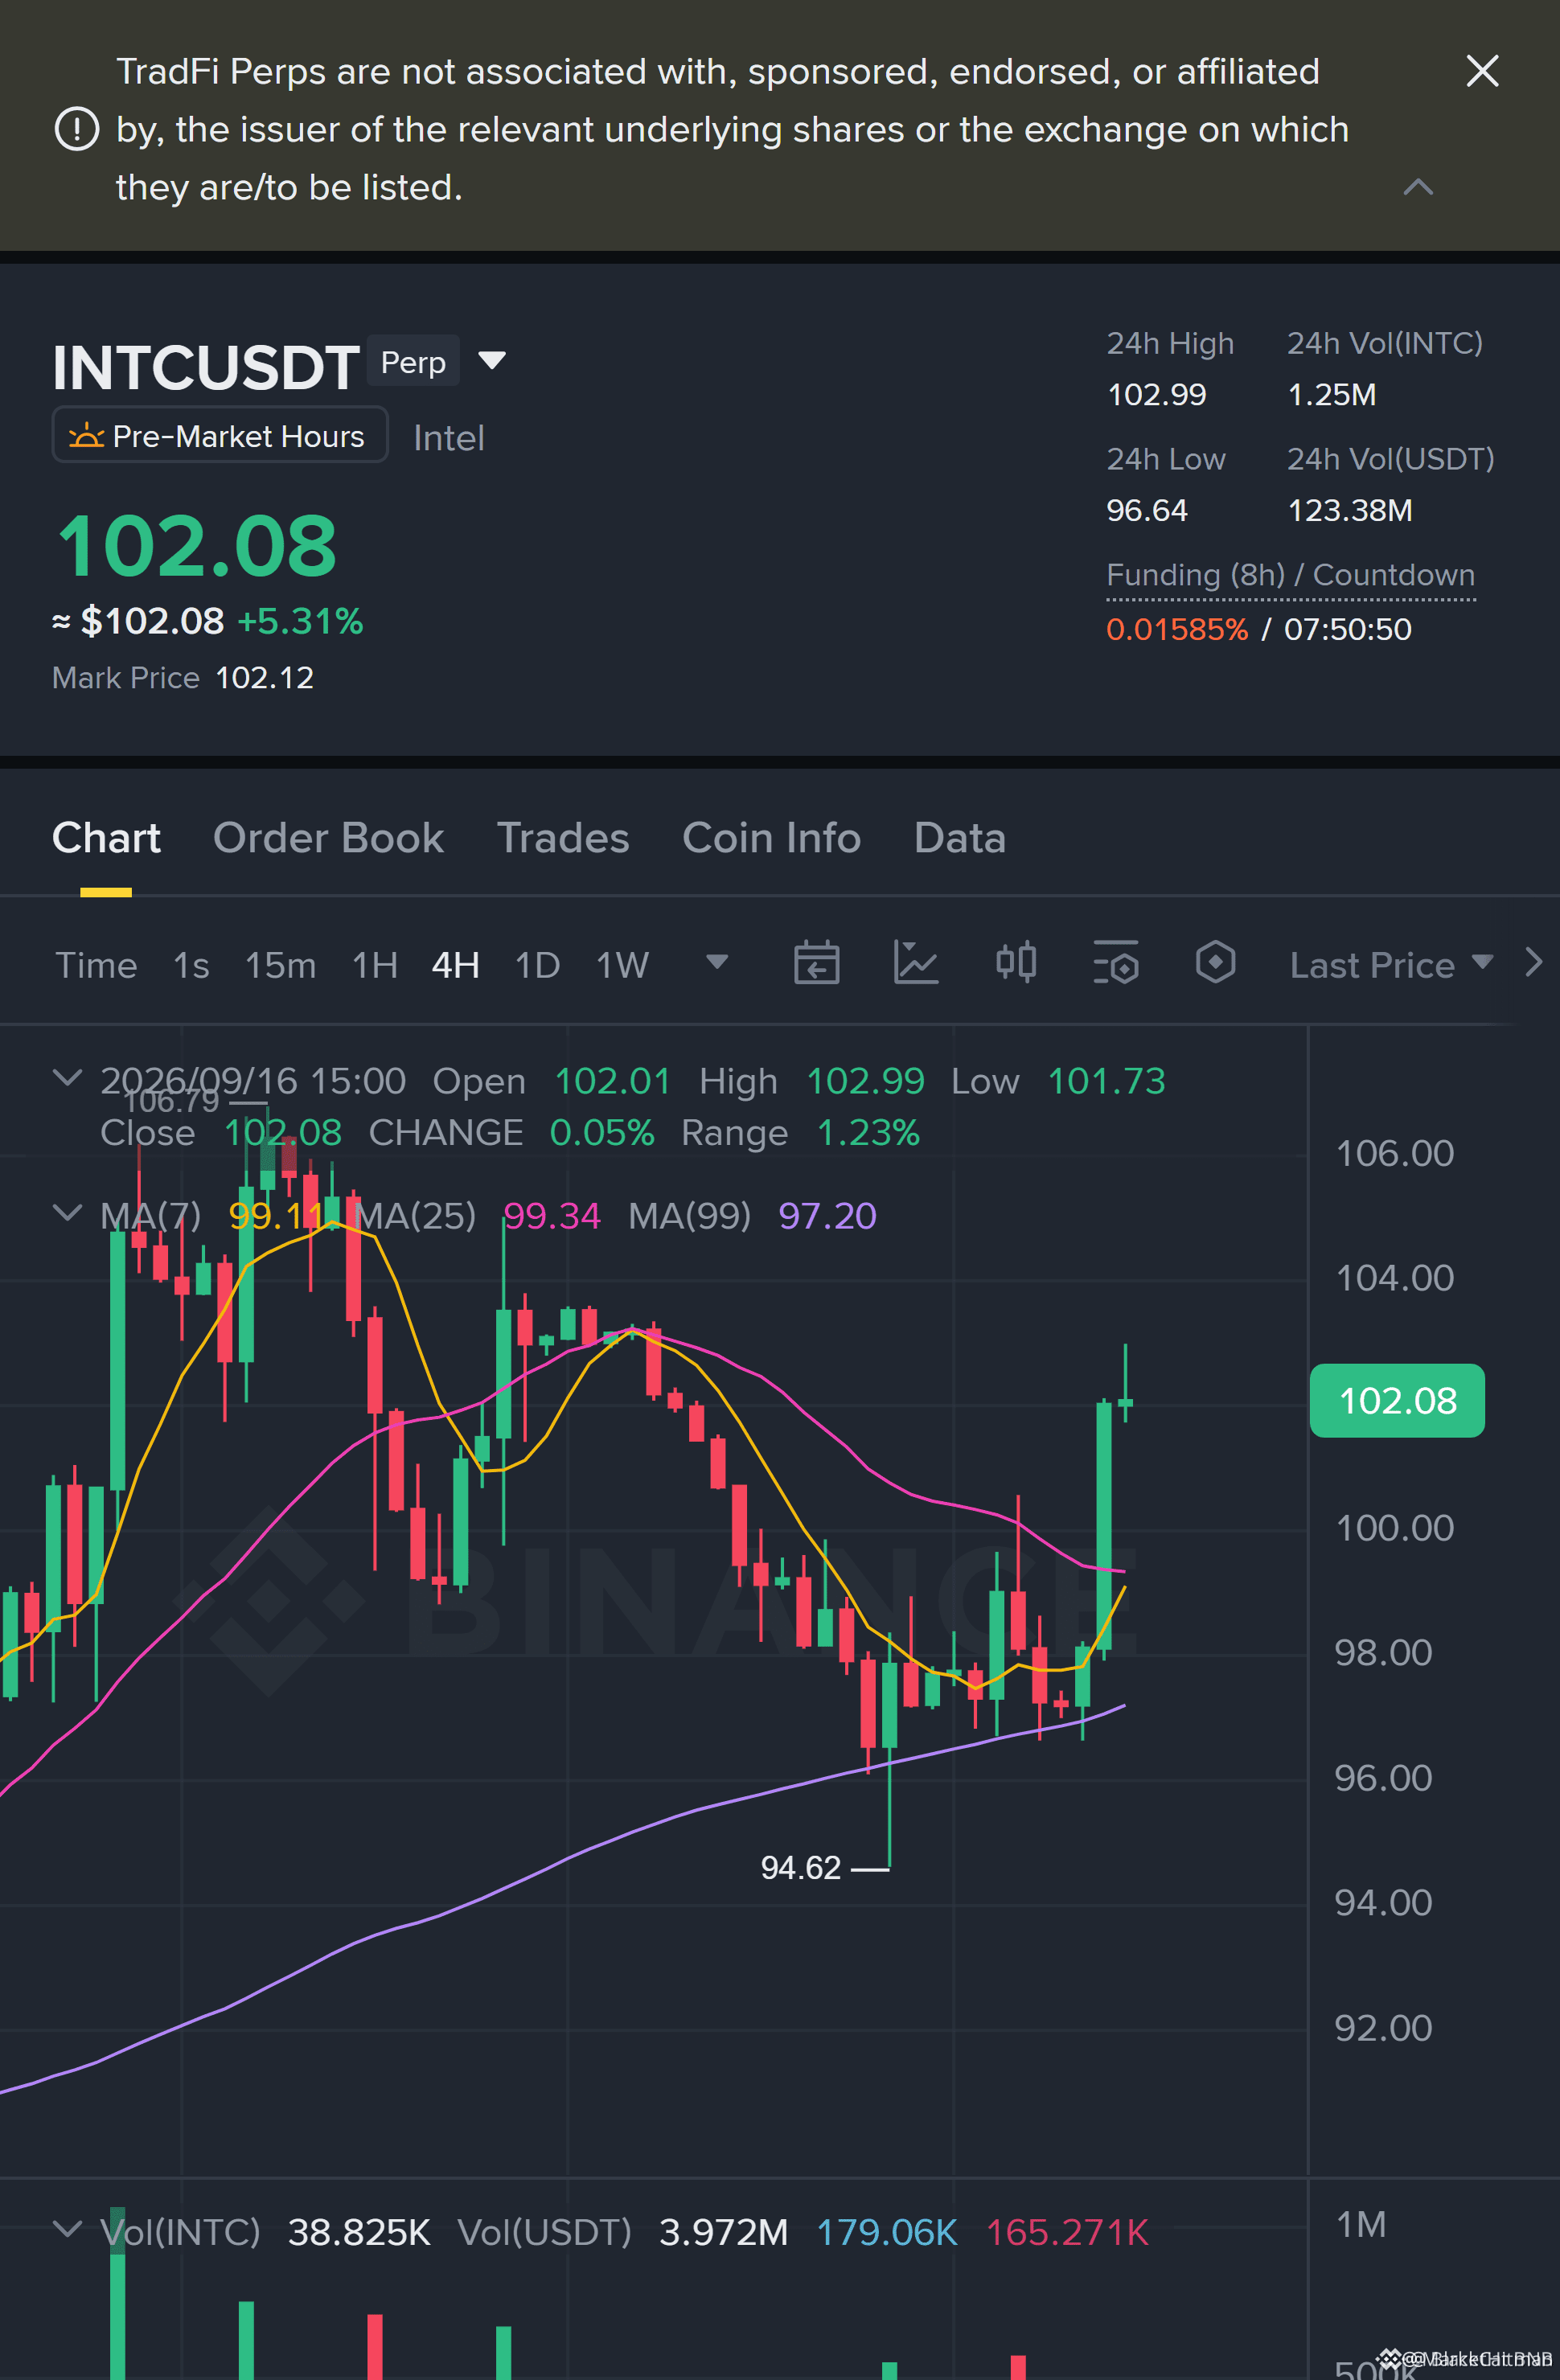
$INTC WATCHLIST: 1H BREAKOUT RETEST HIDES THE NEXT BID 📈
Entry: 101.30-101.48 ⚡
Target: 102.29 / 102.98 / 103.67 🚀
Stop Loss: 100.38 ⚠️
📌 This setup is on the watchlist, not the execution desk. The 1H breakout left a demand zone at 101.30-101.48, but price is away and 15M confirmation is incomplete.
🦈 Wait for the retest to prove buyers are defending, then scale out 25% / 25% / 50% into 102.29, 102.98, and 103.67.
💡 Clean invalidation below 100.38 keeps risk sharp while letting the move breathe. 👇 Are you bidding this retest or waiting for a stronger confirmation?
⚠️ Not financial advice. Always manage your risk. 🛡️
🏷️ #INTC #LongSetup #Breakout #Watchlist #Crypto
🎯 🦈
$INTC WATCHLIST: 1H BREAKOUT RETEST HIDES THE NEXT BID 📈
Entry: 101.30-101.48 ⚡
Target: 102.29 / 102.98 / 103.67 🚀
Stop Loss: 100.38 ⚠️
📌 This setup is on the watchlist, not the execution desk. The 1H breakout left a demand zone at 101.30-101.48, but price is away and 15M confirmation is incomplete.
🦈 Wait for the retest to prove buyers are defending, then scale out 25% / 25% / 50% into 102.29, 102.98, and 103.67.
💡 Clean invalidation below 100.38 keeps risk sharp while letting the move breathe. 👇 Are you bidding this retest or waiting for a stronger confirmation?
⚠️ Not financial advice. Always manage your risk. 🛡️
🏷️ #INTC #LongSetup #Breakout #Watchlist #Crypto
🎯 🦈
Entry: 101.30-101.48 ⚡
Target: 102.29 / 102.98 / 103.67 🚀
Stop Loss: 100.38 ⚠️
📌 This setup is on the watchlist, not the execution desk. The 1H breakout left a demand zone at 101.30-101.48, but price is away and 15M confirmation is incomplete.
🦈 Wait for the retest to prove buyers are defending, then scale out 25% / 25% / 50% into 102.29, 102.98, and 103.67.
💡 Clean invalidation below 100.38 keeps risk sharp while letting the move breathe. 👇 Are you bidding this retest or waiting for a stronger confirmation?
⚠️ Not financial advice. Always manage your risk. 🛡️
🏷️ #INTC #LongSetup #Breakout #Watchlist #Crypto
🎯 🦈
23
·
--
See translation
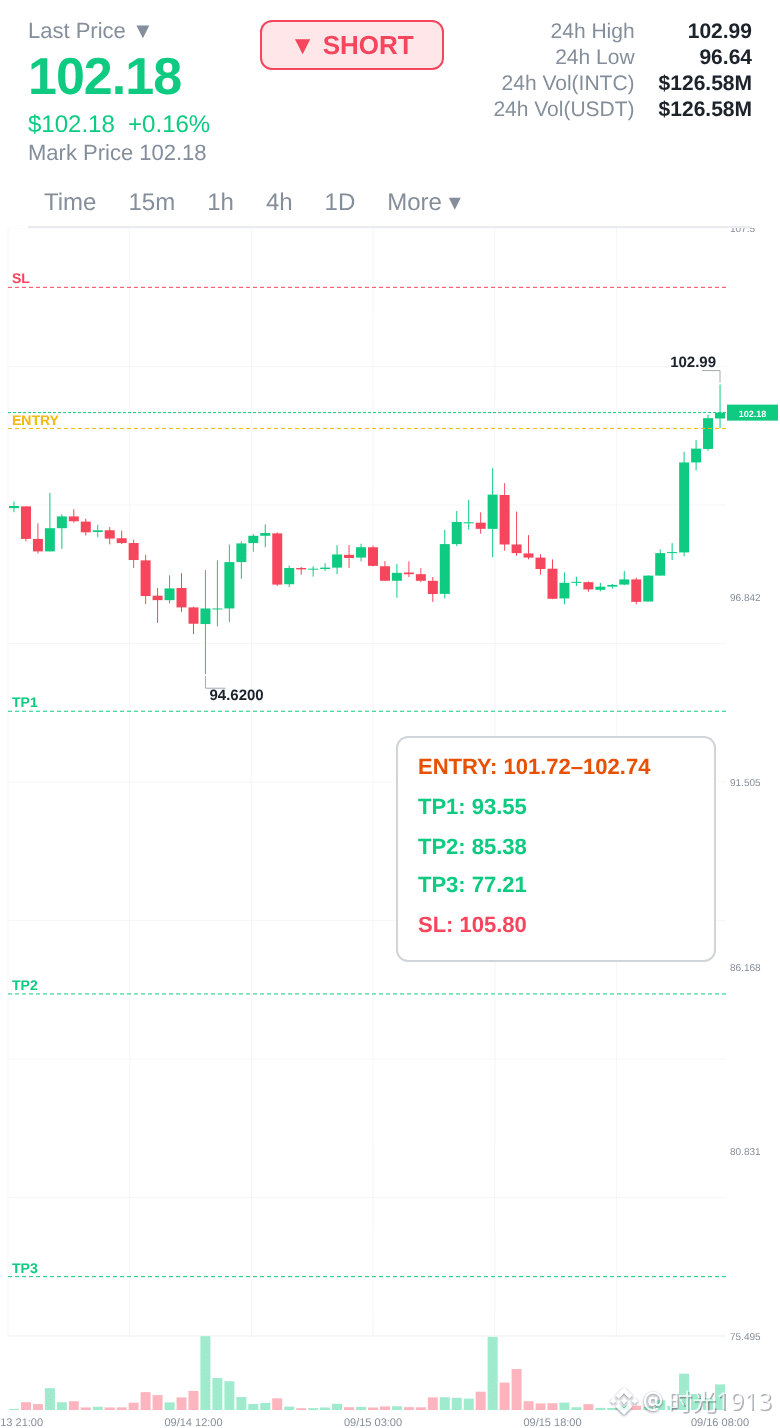
🔴 INTC is in a strong downtrend — I'm not profiting yet
Honestly the chart is telling me something here. I'm listening.
CONTINUATION | 📉 SHORT
📉 Entry: 101.72 – 102.74
🛑 Stop: 105.80
🎯 TP1: 93.55
🎯 TP2: 85.38
🎯 TP3: 77.21
📊 Confidence: 80%
Every pullback in a downtrend is an opportunity.
The decline is orderly and controlled — text
Trend Is Your Friend 👉 $INTC 👈 Now
#INTC $SOL $BTC
🔴 INTC is in a strong downtrend — I'm not profiting yet
Honestly the chart is telling me something here. I'm listening.
CONTINUATION | 📉 SHORT
📉 Entry: 101.72 – 102.74
🛑 Stop: 105.80
🎯 TP1: 93.55
🎯 TP2: 85.38
🎯 TP3: 77.21
📊 Confidence: 80%
Every pullback in a downtrend is an opportunity.
The decline is orderly and controlled — text
Trend Is Your Friend 👉 $INTC 👈 Now
#INTC $SOL $BTC
Honestly the chart is telling me something here. I'm listening.
CONTINUATION | 📉 SHORT
📉 Entry: 101.72 – 102.74
🛑 Stop: 105.80
🎯 TP1: 93.55
🎯 TP2: 85.38
🎯 TP3: 77.21
📊 Confidence: 80%
Every pullback in a downtrend is an opportunity.
The decline is orderly and controlled — text
Trend Is Your Friend 👉 $INTC 👈 Now
#INTC $SOL $BTC
1
229

·
--
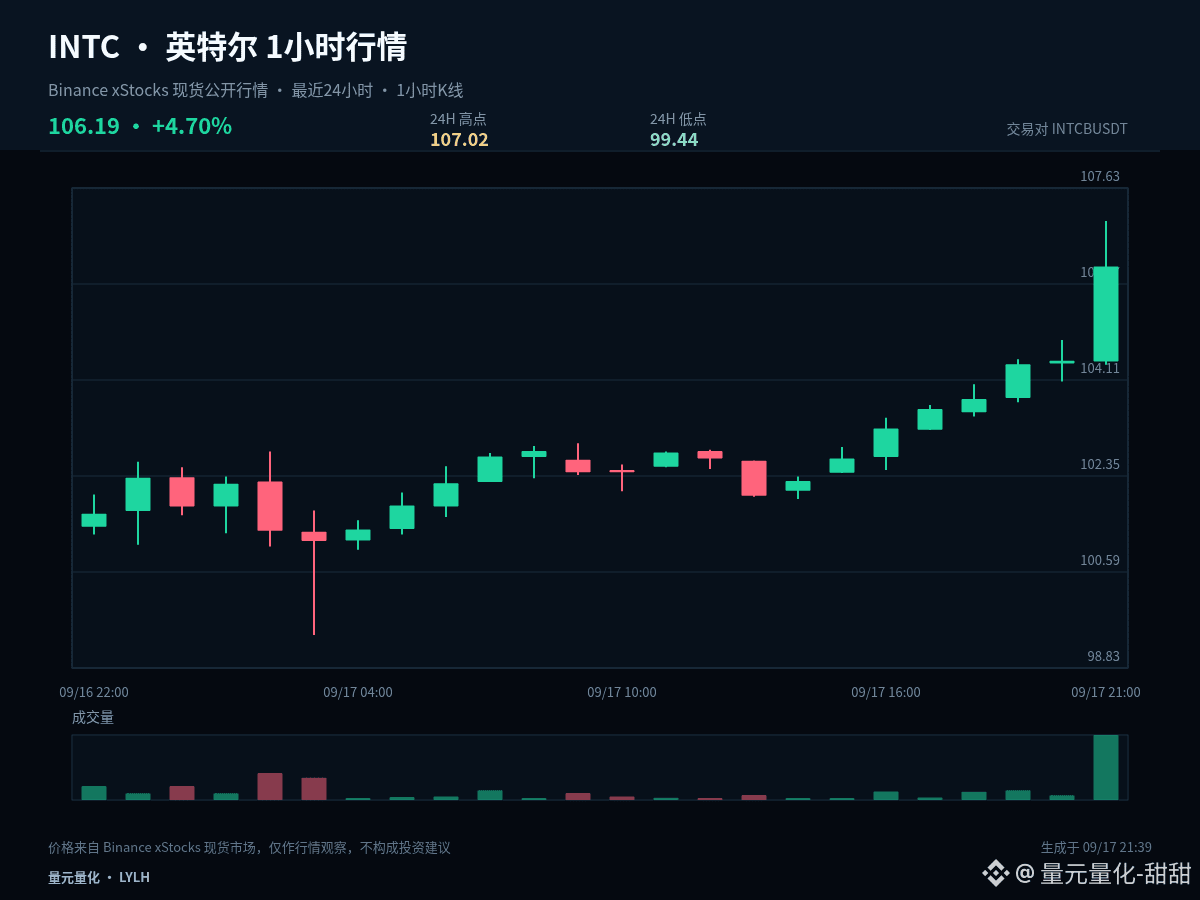
$INTCB #INTC If I can keep only one observation price from this round, I’d choose 103.23. The current price is 106.19: in the last hour +1.66%, in the last 24 hours +3.32%. The gain/loss around the midline can help filter out a lot of intra-day noise.
Keeping the price above 103.23 suggests that pullbacks are still being controlled by the bulls. The next target is to test the pressure at 107.02. If it falls back below the midline, the strength just shown should be discounted, and you should also prevent further return to 99.44.
The current price is near the upper edge of the roughly last 24 hours’ range: +1.66% over 1 hour and +3.32% over 24 hours. The most important thing at the high end is confirmation of “acceptance” after the breakout. If price can stay above the upper edge, it means the market is认可 a higher range. If it only pierces briefly and then quickly snaps back, you need to guard against a false breakout.
Going forward, there are three possible ways to handle the path: if it effectively holds above and stands firm at 107.02, wait to see whether the pullback holds and isn’t broken before reassessing continuation; if it breaks down below 99.44, prioritize risk control and wait for new support; if it continues to range around 103.23, treat it as a range for rotation and don’t chase direction repeatedly from the middle.
Position management should distinguish between swing positions and short-term trades. For existing swing positions, first look at whether the structure is damaged; don’t let repeated fluctuations from a single 1-hour candle affect you. Short-term positions should be executed around support, resistance, and close confirmation. If you’re currently in cash, you don’t need to chase price in the middle of the range—waiting for a clearer level usually has an advantage.
Next, I’ll focus on tracking the gains/losses around 103.23. Do you lean more toward testing 107.02 first, or going back to 99.44 first? Feel free to leave your judgment and reasoning.
#ElSalvadorBTCHoldingsRiseTo7777
$INTCB #INTC If I can keep only one observation price from this round, I’d choose 103.23. The current price is 106.19: in the last hour +1.66%, in the last 24 hours +3.32%. The gain/loss around the midline can help filter out a lot of intra-day noise.
Keeping the price above 103.23 suggests that pullbacks are still being controlled by the bulls. The next target is to test the pressure at 107.02. If it falls back below the midline, the strength just shown should be discounted, and you should also prevent further return to 99.44.
The current price is near the upper edge of the roughly last 24 hours’ range: +1.66% over 1 hour and +3.32% over 24 hours. The most important thing at the high end is confirmation of “acceptance” after the breakout. If price can stay above the upper edge, it means the market is认可 a higher range. If it only pierces briefly and then quickly snaps back, you need to guard against a false breakout.
Going forward, there are three possible ways to handle the path: if it effectively holds above and stands firm at 107.02, wait to see whether the pullback holds and isn’t broken before reassessing continuation; if it breaks down below 99.44, prioritize risk control and wait for new support; if it continues to range around 103.23, treat it as a range for rotation and don’t chase direction repeatedly from the middle.
Position management should distinguish between swing positions and short-term trades. For existing swing positions, first look at whether the structure is damaged; don’t let repeated fluctuations from a single 1-hour candle affect you. Short-term positions should be executed around support, resistance, and close confirmation. If you’re currently in cash, you don’t need to chase price in the middle of the range—waiting for a clearer level usually has an advantage.
Next, I’ll focus on tracking the gains/losses around 103.23. Do you lean more toward testing 107.02 first, or going back to 99.44 first? Feel free to leave your judgment and reasoning.
#ElSalvadorBTCHoldingsRiseTo7777
Keeping the price above 103.23 suggests that pullbacks are still being controlled by the bulls. The next target is to test the pressure at 107.02. If it falls back below the midline, the strength just shown should be discounted, and you should also prevent further return to 99.44.
The current price is near the upper edge of the roughly last 24 hours’ range: +1.66% over 1 hour and +3.32% over 24 hours. The most important thing at the high end is confirmation of “acceptance” after the breakout. If price can stay above the upper edge, it means the market is认可 a higher range. If it only pierces briefly and then quickly snaps back, you need to guard against a false breakout.
Going forward, there are three possible ways to handle the path: if it effectively holds above and stands firm at 107.02, wait to see whether the pullback holds and isn’t broken before reassessing continuation; if it breaks down below 99.44, prioritize risk control and wait for new support; if it continues to range around 103.23, treat it as a range for rotation and don’t chase direction repeatedly from the middle.
Position management should distinguish between swing positions and short-term trades. For existing swing positions, first look at whether the structure is damaged; don’t let repeated fluctuations from a single 1-hour candle affect you. Short-term positions should be executed around support, resistance, and close confirmation. If you’re currently in cash, you don’t need to chase price in the middle of the range—waiting for a clearer level usually has an advantage.
Next, I’ll focus on tracking the gains/losses around 103.23. Do you lean more toward testing 107.02 first, or going back to 99.44 first? Feel free to leave your judgment and reasoning.
#ElSalvadorBTCHoldingsRiseTo7777
3

·
--
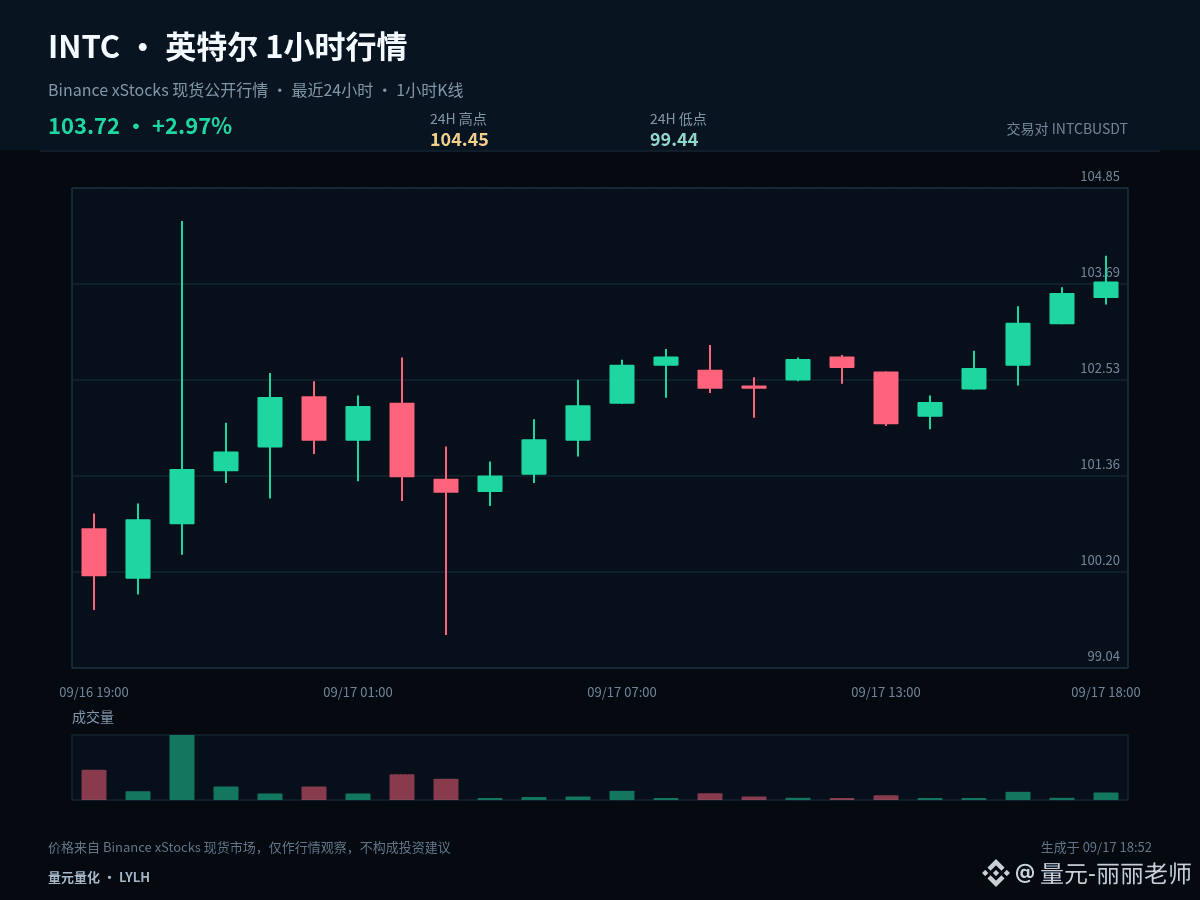
$INTCB #INTC Current price 103.72, +0.14% in 1 hour, +3.16% in 24 hours. Instead of guessing long or short too early, list the possible paths and the corresponding actions clearly.
The current price is near the upper band of the past 24-hour range: +0.14% in the last hour and +3.16% over 24 hours. The most important thing at the top is to confirm acceptance after a breakout. If the price can stay above the upper band, it indicates the market recognizes a higher range. If it only briefly pierces and then quickly reclaims, be on guard against a false breakout.
The first scenario is upward: the price needs to break above 104.45 and form stable closes above it; only then does the confirmation become valid. After that, a retest that does not fail is required for further effectiveness. The second scenario is downward: if 99.44 is broken and the subsequent rebound cannot be reclaimed, it suggests weak support; prioritize defense rather than rushing to add positions.
If the price continues to hover between 104.45 and 99.44, 101.945 should only be treated as a short-term reference for initiative. The midpoint of the range has no clear advantage, so don’t force a trade just for the sake of feeling involved—wait for the market to show a direction.
Existing positions can be handled in stages according to key levels to avoid making all decisions at once. For those with no position, wait for breakout confirmation or a retest and stabilization. For U.S. stock-linked instruments, also watch for volatility caused by trading session transitions. Your plan should be based on price conditions—don’t let emotions replace execution.
Risk control still comes before the conclusion: execute only when the conditions are met; if the price invalidates your setup, reassess promptly. The larger the volatility, the more restrained each trade should be. The above is a scenario projection based on the current 1-hour and 24-hour data and does not constitute a promise of returns.
#AmazonGetsWarrantsToBuyGeneracStock
$INTCB #INTC Current price 103.72, +0.14% in 1 hour, +3.16% in 24 hours. Instead of guessing long or short too early, list the possible paths and the corresponding actions clearly.
The current price is near the upper band of the past 24-hour range: +0.14% in the last hour and +3.16% over 24 hours. The most important thing at the top is to confirm acceptance after a breakout. If the price can stay above the upper band, it indicates the market recognizes a higher range. If it only briefly pierces and then quickly reclaims, be on guard against a false breakout.
The first scenario is upward: the price needs to break above 104.45 and form stable closes above it; only then does the confirmation become valid. After that, a retest that does not fail is required for further effectiveness. The second scenario is downward: if 99.44 is broken and the subsequent rebound cannot be reclaimed, it suggests weak support; prioritize defense rather than rushing to add positions.
If the price continues to hover between 104.45 and 99.44, 101.945 should only be treated as a short-term reference for initiative. The midpoint of the range has no clear advantage, so don’t force a trade just for the sake of feeling involved—wait for the market to show a direction.
Existing positions can be handled in stages according to key levels to avoid making all decisions at once. For those with no position, wait for breakout confirmation or a retest and stabilization. For U.S. stock-linked instruments, also watch for volatility caused by trading session transitions. Your plan should be based on price conditions—don’t let emotions replace execution.
Risk control still comes before the conclusion: execute only when the conditions are met; if the price invalidates your setup, reassess promptly. The larger the volatility, the more restrained each trade should be. The above is a scenario projection based on the current 1-hour and 24-hour data and does not constitute a promise of returns.
#AmazonGetsWarrantsToBuyGeneracStock
The current price is near the upper band of the past 24-hour range: +0.14% in the last hour and +3.16% over 24 hours. The most important thing at the top is to confirm acceptance after a breakout. If the price can stay above the upper band, it indicates the market recognizes a higher range. If it only briefly pierces and then quickly reclaims, be on guard against a false breakout.
The first scenario is upward: the price needs to break above 104.45 and form stable closes above it; only then does the confirmation become valid. After that, a retest that does not fail is required for further effectiveness. The second scenario is downward: if 99.44 is broken and the subsequent rebound cannot be reclaimed, it suggests weak support; prioritize defense rather than rushing to add positions.
If the price continues to hover between 104.45 and 99.44, 101.945 should only be treated as a short-term reference for initiative. The midpoint of the range has no clear advantage, so don’t force a trade just for the sake of feeling involved—wait for the market to show a direction.
Existing positions can be handled in stages according to key levels to avoid making all decisions at once. For those with no position, wait for breakout confirmation or a retest and stabilization. For U.S. stock-linked instruments, also watch for volatility caused by trading session transitions. Your plan should be based on price conditions—don’t let emotions replace execution.
Risk control still comes before the conclusion: execute only when the conditions are met; if the price invalidates your setup, reassess promptly. The larger the volatility, the more restrained each trade should be. The above is a scenario projection based on the current 1-hour and 24-hour data and does not constitute a promise of returns.
#AmazonGetsWarrantsToBuyGeneracStock
7

·
--
$INTC today is up 5%, closing in on 103. The semiconductor sector’s geopolitical premium is back in play. With funding rates at zero, neither side is rushing to pay, but the position volume is rising—new money is testing the waters.
This move isn’t purely technical; it’s a political and military premium. Tensions across the Taiwan Strait and the Middle East are high, and the market is pricing supply-chain security. It’s an old playbook for the chip sector: when geopolitics heats up, funds come in to hedge.
The strongest counterargument is that the semiconductor cycle hasn’t bottomed out yet—this is just an emotion-driven pulse. The invalidation condition is simple: if the price falls below the 100 integer level, this premium logic won’t hold.
Trading tag: #TradFi #链上美股 #INTC
Where do you think this assessment is most likely to be wrong?
$INTC today is up 5%, closing in on 103. The semiconductor sector’s geopolitical premium is back in play. With funding rates at zero, neither side is rushing to pay, but the position volume is rising—new money is testing the waters.
This move isn’t purely technical; it’s a political and military premium. Tensions across the Taiwan Strait and the Middle East are high, and the market is pricing supply-chain security. It’s an old playbook for the chip sector: when geopolitics heats up, funds come in to hedge.
The strongest counterargument is that the semiconductor cycle hasn’t bottomed out yet—this is just an emotion-driven pulse. The invalidation condition is simple: if the price falls below the 100 integer level, this premium logic won’t hold.
Trading tag: #TradFi #链上美股 #INTC
Where do you think this assessment is most likely to be wrong?
This move isn’t purely technical; it’s a political and military premium. Tensions across the Taiwan Strait and the Middle East are high, and the market is pricing supply-chain security. It’s an old playbook for the chip sector: when geopolitics heats up, funds come in to hedge.
The strongest counterargument is that the semiconductor cycle hasn’t bottomed out yet—this is just an emotion-driven pulse. The invalidation condition is simple: if the price falls below the 100 integer level, this premium logic won’t hold.
Trading tag: #TradFi #链上美股 #INTC
Where do you think this assessment is most likely to be wrong?
106

·
--
$INTC pulled 4.587% in the past 24 hours; the price is now above 101.47. Meanwhile, the funding rate for the same period has risen to 0.00019123. I looked into it: the funding rate is higher than that of most U.S.-listed stock tokens in the same period by a noticeable margin. Longs are paying.
From this angle it’s a semiconductor/AI chain play, but the reference list this week is empty, so I can’t do a lateral comparison. I’ll just focus on $INTC itself. As the price is rising and funding is positive, this is a textbook signal of crowded longs—meaning longs are paying to maintain their positions, and market force is pushing upward. The open interest is reported at 506,384.71, and combined with trading volume of $167.6 million, it suggests the order book isn’t overly quiet; however, in a positive funding environment, the entry cost for new longs is being driven higher. Put simply: every 8 hours, longs pay money to shorts. For each additional day the uptrend holds, longs bleed once more—unless the price increase can offset the cost of holding. Right now the 4.587% daily rally is thick enough, but that’s just single-day data; the funding drag is ongoing.
My view is that the momentum for forcing the price higher will likely weaken in the short term. When the funding rate is greater than zero, the hard law of “when longs are crowded, a short-term top is often near” applies—so the most aggressive part of the pull-up may already be behind us. The more likely scenarios next are either sideways consolidation to digest the move, or a pullback—allowing the excessively high funding rate to naturally fall, or waiting until shorts have been squeezed out and then lacking counterparties causes a correction.
If it must move, my trigger conditions are: the price drops back below the 100-round-number level, while the funding rate remains positive—in that case, I’d choose to watch from the sidelines and at least avoid opening any new long positions. Conversely, if it can hold up under positive funding, breaks out above the current price with an increase in volume, and open interest also surges significantly at the same time, that would indicate new capital is rushing in to eat the costs—and I would revise my view. But under positive funding, that kind of situation is relatively rare.
Where this thesis is most likely to be wrong is if it assumes funding pressure is the only dominant factor. If, in the same period, there are material business positives for $INTC that aren’t included in my inputs and the market is pricing them in, then both price and funding could surge together, and my pullback call would fail. Also, if the entire semiconductor sector experiences systemic risks not mentioned in my inputs, then discussing the significance of an individual token’s funding rate becomes much less meaningful. If any of those happens, I’ll admit I’m wrong.
Trading tag: #BinanceFutures #TradFi #USDⓈM #INTC #INTCUSDT $INTC
$INTC pulled 4.587% in the past 24 hours; the price is now above 101.47. Meanwhile, the funding rate for the same period has risen to 0.00019123. I looked into it: the funding rate is higher than that of most U.S.-listed stock tokens in the same period by a noticeable margin. Longs are paying.
From this angle it’s a semiconductor/AI chain play, but the reference list this week is empty, so I can’t do a lateral comparison. I’ll just focus on $INTC itself. As the price is rising and funding is positive, this is a textbook signal of crowded longs—meaning longs are paying to maintain their positions, and market force is pushing upward. The open interest is reported at 506,384.71, and combined with trading volume of $167.6 million, it suggests the order book isn’t overly quiet; however, in a positive funding environment, the entry cost for new longs is being driven higher. Put simply: every 8 hours, longs pay money to shorts. For each additional day the uptrend holds, longs bleed once more—unless the price increase can offset the cost of holding. Right now the 4.587% daily rally is thick enough, but that’s just single-day data; the funding drag is ongoing.
My view is that the momentum for forcing the price higher will likely weaken in the short term. When the funding rate is greater than zero, the hard law of “when longs are crowded, a short-term top is often near” applies—so the most aggressive part of the pull-up may already be behind us. The more likely scenarios next are either sideways consolidation to digest the move, or a pullback—allowing the excessively high funding rate to naturally fall, or waiting until shorts have been squeezed out and then lacking counterparties causes a correction.
If it must move, my trigger conditions are: the price drops back below the 100-round-number level, while the funding rate remains positive—in that case, I’d choose to watch from the sidelines and at least avoid opening any new long positions. Conversely, if it can hold up under positive funding, breaks out above the current price with an increase in volume, and open interest also surges significantly at the same time, that would indicate new capital is rushing in to eat the costs—and I would revise my view. But under positive funding, that kind of situation is relatively rare.
Where this thesis is most likely to be wrong is if it assumes funding pressure is the only dominant factor. If, in the same period, there are material business positives for $INTC that aren’t included in my inputs and the market is pricing them in, then both price and funding could surge together, and my pullback call would fail. Also, if the entire semiconductor sector experiences systemic risks not mentioned in my inputs, then discussing the significance of an individual token’s funding rate becomes much less meaningful. If any of those happens, I’ll admit I’m wrong.
Trading tag: #BinanceFutures #TradFi #USDⓈM #INTC #INTCUSDT $INTC
From this angle it’s a semiconductor/AI chain play, but the reference list this week is empty, so I can’t do a lateral comparison. I’ll just focus on $INTC itself. As the price is rising and funding is positive, this is a textbook signal of crowded longs—meaning longs are paying to maintain their positions, and market force is pushing upward. The open interest is reported at 506,384.71, and combined with trading volume of $167.6 million, it suggests the order book isn’t overly quiet; however, in a positive funding environment, the entry cost for new longs is being driven higher. Put simply: every 8 hours, longs pay money to shorts. For each additional day the uptrend holds, longs bleed once more—unless the price increase can offset the cost of holding. Right now the 4.587% daily rally is thick enough, but that’s just single-day data; the funding drag is ongoing.
My view is that the momentum for forcing the price higher will likely weaken in the short term. When the funding rate is greater than zero, the hard law of “when longs are crowded, a short-term top is often near” applies—so the most aggressive part of the pull-up may already be behind us. The more likely scenarios next are either sideways consolidation to digest the move, or a pullback—allowing the excessively high funding rate to naturally fall, or waiting until shorts have been squeezed out and then lacking counterparties causes a correction.
If it must move, my trigger conditions are: the price drops back below the 100-round-number level, while the funding rate remains positive—in that case, I’d choose to watch from the sidelines and at least avoid opening any new long positions. Conversely, if it can hold up under positive funding, breaks out above the current price with an increase in volume, and open interest also surges significantly at the same time, that would indicate new capital is rushing in to eat the costs—and I would revise my view. But under positive funding, that kind of situation is relatively rare.
Where this thesis is most likely to be wrong is if it assumes funding pressure is the only dominant factor. If, in the same period, there are material business positives for $INTC that aren’t included in my inputs and the market is pricing them in, then both price and funding could surge together, and my pullback call would fail. Also, if the entire semiconductor sector experiences systemic risks not mentioned in my inputs, then discussing the significance of an individual token’s funding rate becomes much less meaningful. If any of those happens, I’ll admit I’m wrong.
Trading tag: #BinanceFutures #TradFi #USDⓈM #INTC #INTCUSDT $INTC
25

·
--
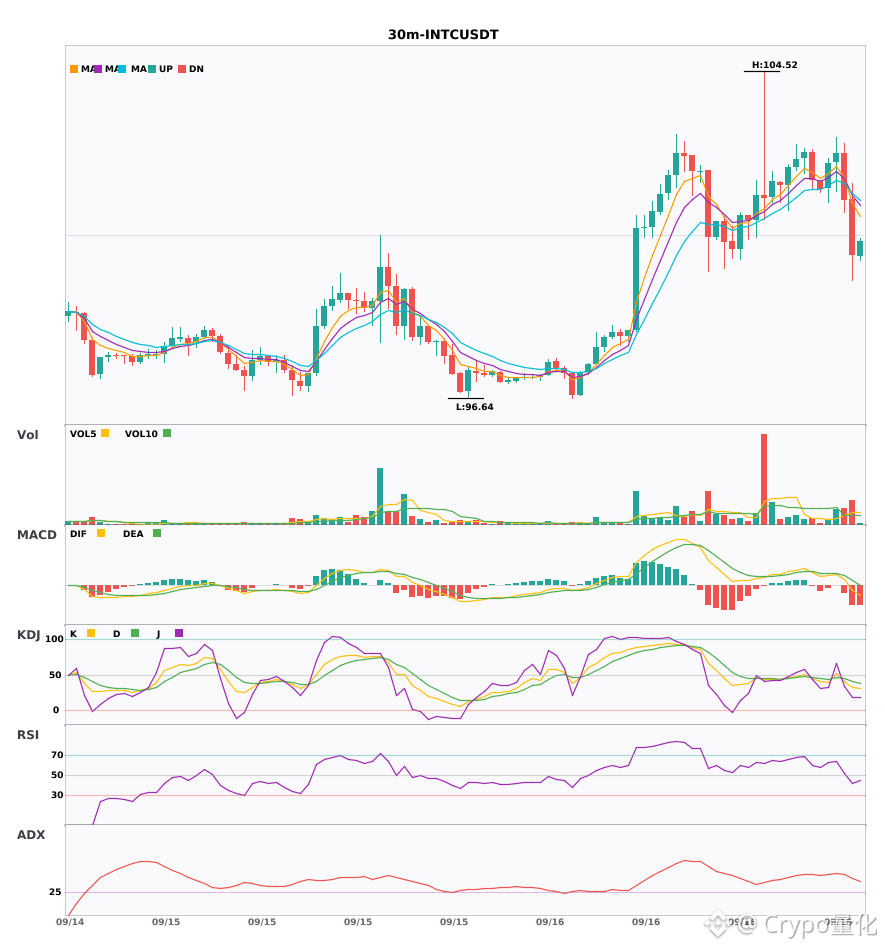
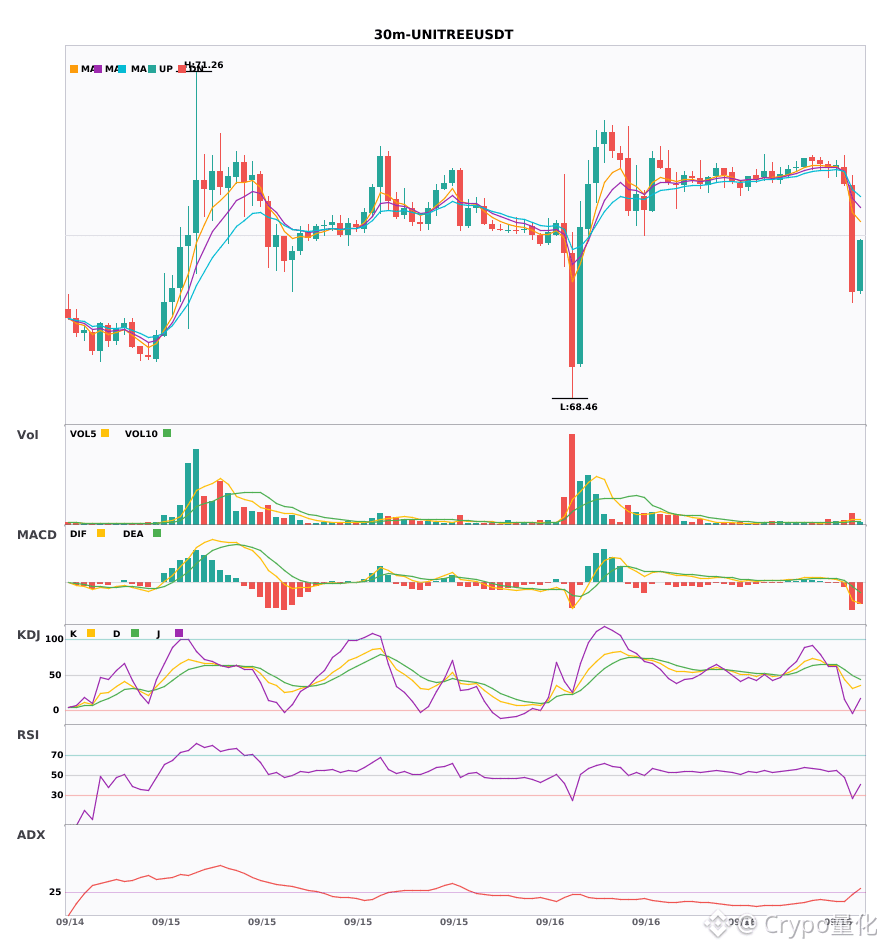
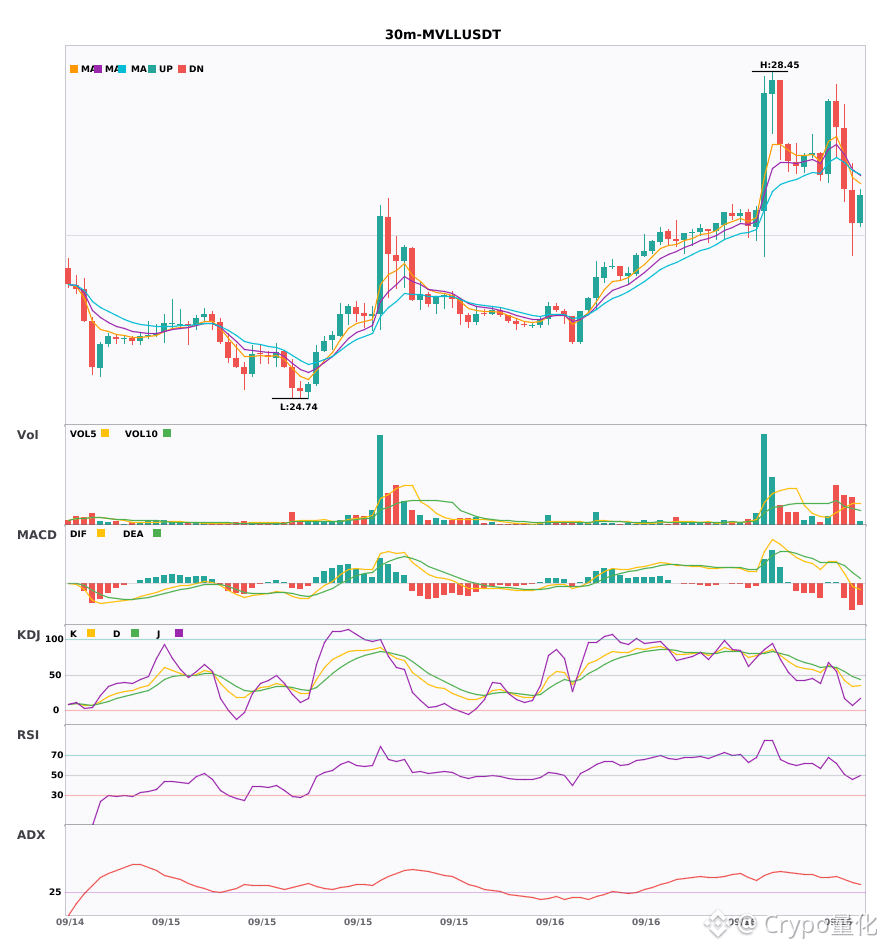
Three 30-minute-level short (bear) alerts: $INTC / $UNITREE / $MVLL🔥
════════════════════
🟢 $INTC 30-minute Bear Signal
⚠️ Technicals: ADX (42) clearly shows a trending market | MACD DIF breaks below the zero line, turning bearish | EMA5 crosses below EMA8, short-term bearish | KDJ is weak, bears in control (K=33.0, D=40.6) | Volume expands (2.5x)
════════════════════
🟢 $UNITREE 30-minute Bear Signal
⚠️ Technicals: ADX (27) the trend is forming—can participate | MACD DIF breaks below the zero line, turning bearish | EMA5 < EMA8 < EMA13 bear alignment | KDJ is weak, bears in control (K=31.4, D=48.8) | Volume surges (3.1x)
════════════════════
🟢 $MVLL 30-minute Bear Signal
⚠️ Technicals: ADX (35) clearly trending market | MACD DIF breaks below the zero line, turning bearish | EMA5 crosses below EMA8, short-term bearish | KDJ is weak, bears in control (K=34.6, D=48.0) | Volume expands (1.7x)
════════════════════
🔔 Watch for first-hand real-time price movements 🔔
#技术分析 #INTC #UNITREE #MVLL
📌 When trading, pay attention to whether the candlestick pattern matches
Three 30-minute-level short (bear) alerts: $INTC / $UNITREE / $MVLL 🔥
════════════════════
🟢 $INTC 30-minute Bear Signal
⚠️ Technicals: ADX (42) clearly shows a trending market | MACD DIF breaks below the zero line, turning bearish | EMA5 crosses below EMA8, short-term bearish | KDJ is weak, bears in control (K=33.0, D=40.6) | Volume expands (2.5x)
════════════════════
🟢 $UNITREE 30-minute Bear Signal
⚠️ Technicals: ADX (27) the trend is forming—can participate | MACD DIF breaks below the zero line, turning bearish | EMA5 < EMA8 < EMA13 bear alignment | KDJ is weak, bears in control (K=31.4, D=48.8) | Volume surges (3.1x)
════════════════════
🟢 $MVLL 30-minute Bear Signal
⚠️ Technicals: ADX (35) clearly trending market | MACD DIF breaks below the zero line, turning bearish | EMA5 crosses below EMA8, short-term bearish | KDJ is weak, bears in control (K=34.6, D=48.0) | Volume expands (1.7x)
════════════════════
🔔 Watch for first-hand real-time price movements 🔔
#技术分析 #INTC #UNITREE #MVLL
📌 When trading, pay attention to whether the candlestick pattern matches
════════════════════
🟢 $INTC 30-minute Bear Signal
⚠️ Technicals: ADX (42) clearly shows a trending market | MACD DIF breaks below the zero line, turning bearish | EMA5 crosses below EMA8, short-term bearish | KDJ is weak, bears in control (K=33.0, D=40.6) | Volume expands (2.5x)
════════════════════
🟢 $UNITREE 30-minute Bear Signal
⚠️ Technicals: ADX (27) the trend is forming—can participate | MACD DIF breaks below the zero line, turning bearish | EMA5 < EMA8 < EMA13 bear alignment | KDJ is weak, bears in control (K=31.4, D=48.8) | Volume surges (3.1x)
════════════════════
🟢 $MVLL 30-minute Bear Signal
⚠️ Technicals: ADX (35) clearly trending market | MACD DIF breaks below the zero line, turning bearish | EMA5 crosses below EMA8, short-term bearish | KDJ is weak, bears in control (K=34.6, D=48.0) | Volume expands (1.7x)
════════════════════
🔔 Watch for first-hand real-time price movements 🔔
#技术分析 #INTC #UNITREE #MVLL
📌 When trading, pay attention to whether the candlestick pattern matches
10

·
--
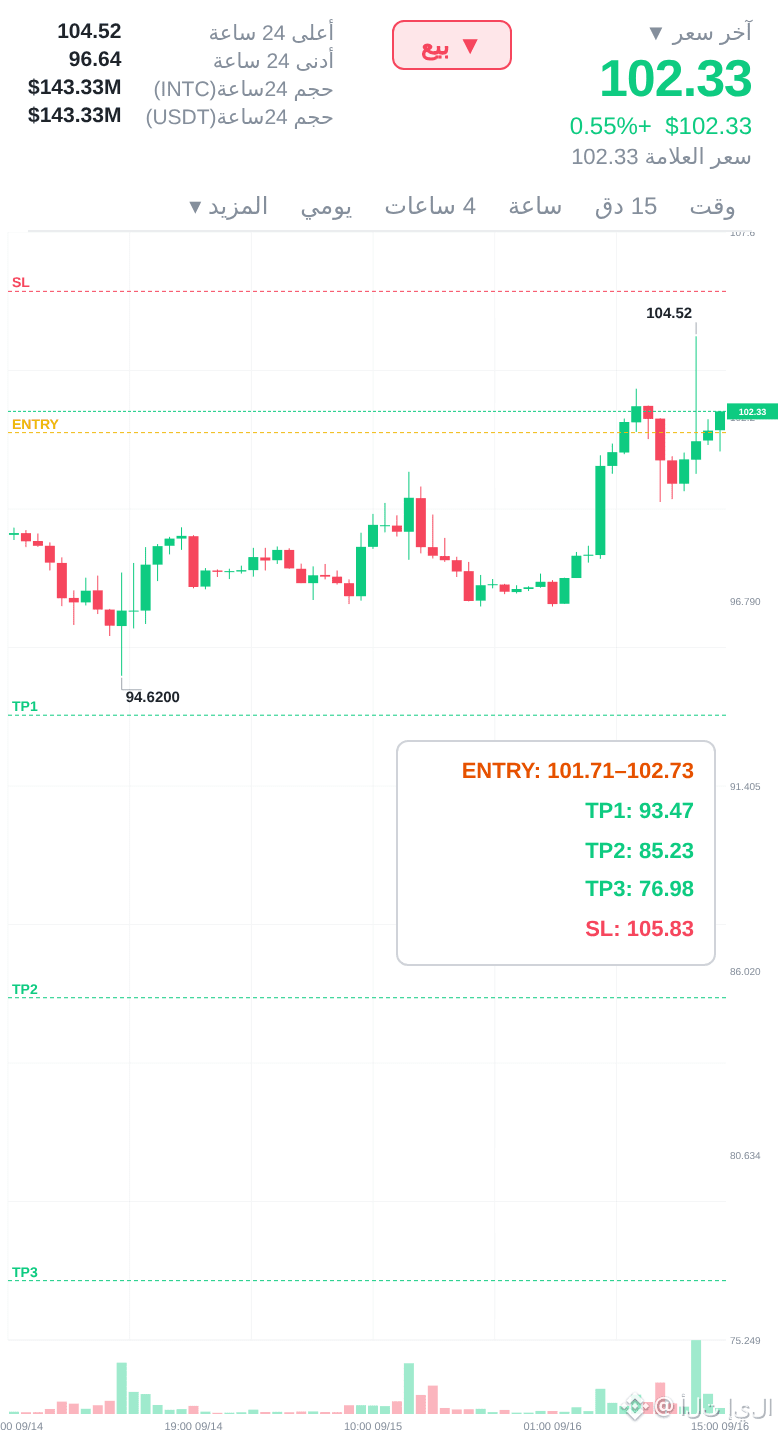
📊 Downtrend channel on INTC holding strong
I waited all day for this kind of setup. Finally.
Continuation | 📉 Sell
📉 Entry: 101.71 – 102.73
🛑 Stop Loss: 105.83
🎯 Target 1: 93.47
🎯 Target 2: 85.23
🎯 Target 3: 76.98
📊 Confidence: 82%
EMA50 is above the current price — the mid-term trend favors the bears.
This resistance level has rejected price several times recently.
Risk management is everything in crypto. Stop first.
A precise analysis confirms 👈 $INTC 👉 Now
#INTC $BTC $SOL
📊 Downtrend channel on INTC holding strong
I waited all day for this kind of setup. Finally.
Continuation | 📉 Sell
📉 Entry: 101.71 – 102.73
🛑 Stop Loss: 105.83
🎯 Target 1: 93.47
🎯 Target 2: 85.23
🎯 Target 3: 76.98
📊 Confidence: 82%
EMA50 is above the current price — the mid-term trend favors the bears.
This resistance level has rejected price several times recently.
Risk management is everything in crypto. Stop first.
A precise analysis confirms 👈 $INTC 👉 Now
#INTC $BTC $SOL
I waited all day for this kind of setup. Finally.
Continuation | 📉 Sell
📉 Entry: 101.71 – 102.73
🛑 Stop Loss: 105.83
🎯 Target 1: 93.47
🎯 Target 2: 85.23
🎯 Target 3: 76.98
📊 Confidence: 82%
EMA50 is above the current price — the mid-term trend favors the bears.
This resistance level has rejected price several times recently.
Risk management is everything in crypto. Stop first.
A precise analysis confirms 👈 $INTC 👉 Now
#INTC $BTC $SOL
5
·
--
📊 TECHNICAL BREAKDOWN & TRADE PLAN | INTCUSDT
━━━━━━━━━━━━━━━━━━━━━
🎯 Position direction: 🔴 SHORT (SHORT)
⚡ Trading leverage: 4x
💰 Allocated volume: $90.97
🛡 Estimated risk: $11.3 USDT
📍 KEY LEVELS (PRICE ACTION):
▫️ Entry: 102.33
▫️ Take-Profit (Target Liquidity): 98.25 (+4.0%)
▫️ Stop-Loss (Invalidation): 105.51 (-3.1%)
💡 ANALYTICAL CONTEXT:
The INTC coin tested the key 4H resistance block. In the order book, market sell orders dominate, with liquidity outflow (OFI: -0.02). The liquidity levels are confirmed. We expect an impulsive downward move from EMA200 (97.23) toward the discount levels. Risk is limited by a protective stop.
#INTC #Trading
📊 TECHNICAL BREAKDOWN & TRADE PLAN | INTCUSDT
━━━━━━━━━━━━━━━━━━━━━
🎯 Position direction: 🔴 SHORT (SHORT)
⚡ Trading leverage: 4x
💰 Allocated volume: $90.97
🛡 Estimated risk: $11.3 USDT
📍 KEY LEVELS (PRICE ACTION):
▫️ Entry: 102.33
▫️ Take-Profit (Target Liquidity): 98.25 (+4.0%)
▫️ Stop-Loss (Invalidation): 105.51 (-3.1%)
💡 ANALYTICAL CONTEXT:
The INTC coin tested the key 4H resistance block. In the order book, market sell orders dominate, with liquidity outflow (OFI: -0.02). The liquidity levels are confirmed. We expect an impulsive downward move from EMA200 (97.23) toward the discount levels. Risk is limited by a protective stop.
#INTC #Trading
━━━━━━━━━━━━━━━━━━━━━
🎯 Position direction: 🔴 SHORT (SHORT)
⚡ Trading leverage: 4x
💰 Allocated volume: $90.97
🛡 Estimated risk: $11.3 USDT
📍 KEY LEVELS (PRICE ACTION):
▫️ Entry: 102.33
▫️ Take-Profit (Target Liquidity): 98.25 (+4.0%)
▫️ Stop-Loss (Invalidation): 105.51 (-3.1%)
💡 ANALYTICAL CONTEXT:
The INTC coin tested the key 4H resistance block. In the order book, market sell orders dominate, with liquidity outflow (OFI: -0.02). The liquidity levels are confirmed. We expect an impulsive downward move from EMA200 (97.23) toward the discount levels. Risk is limited by a protective stop.
#INTC #Trading
4

·
--
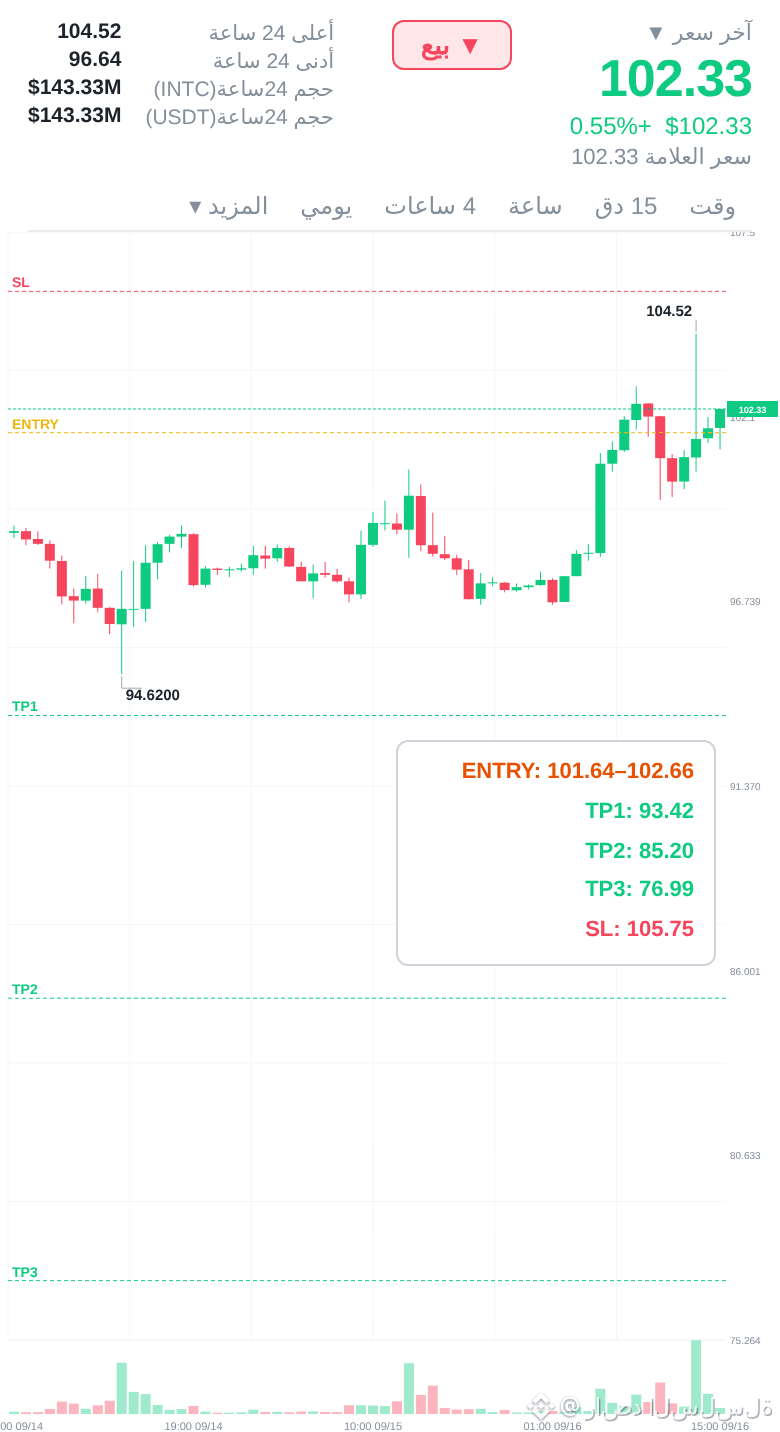
INTC short is still hot... no sign of weakness
Candles send a message. Whoever reads it understands.
Continuation — 📉 sell
Here’s what the data is saying:
📉 If yes, here’s the plan:
📉 Entry: 101.64 – 102.66
🛑 Stop loss: 105.75
🎯 Target 1: 93.42
🎯 Target 2: 85.20
🎯 Target 3: 76.99
📊 Confidence: 82%
Small size—let the trade breathe, let it run.
RSI extended from the overbought zone—high historically likelihood of a pullback.
Stop first, then size, then entry. This is the correct order.
Pros enter 👈 $INTC 👉 now
#INTC $SOL $BTC
INTC short is still hot... no sign of weakness
Candles send a message. Whoever reads it understands.
Continuation — 📉 sell
Here’s what the data is saying:
📉 If yes, here’s the plan:
📉 Entry: 101.64 – 102.66
🛑 Stop loss: 105.75
🎯 Target 1: 93.42
🎯 Target 2: 85.20
🎯 Target 3: 76.99
📊 Confidence: 82%
Small size—let the trade breathe, let it run.
RSI extended from the overbought zone—high historically likelihood of a pullback.
Stop first, then size, then entry. This is the correct order.
Pros enter 👈 $INTC 👉 now
#INTC $SOL $BTC
Candles send a message. Whoever reads it understands.
Continuation — 📉 sell
Here’s what the data is saying:
📉 If yes, here’s the plan:
📉 Entry: 101.64 – 102.66
🛑 Stop loss: 105.75
🎯 Target 1: 93.42
🎯 Target 2: 85.20
🎯 Target 3: 76.99
📊 Confidence: 82%
Small size—let the trade breathe, let it run.
RSI extended from the overbought zone—high historically likelihood of a pullback.
Stop first, then size, then entry. This is the correct order.
Pros enter 👈 $INTC 👉 now
#INTC $SOL $BTC
17
·
--
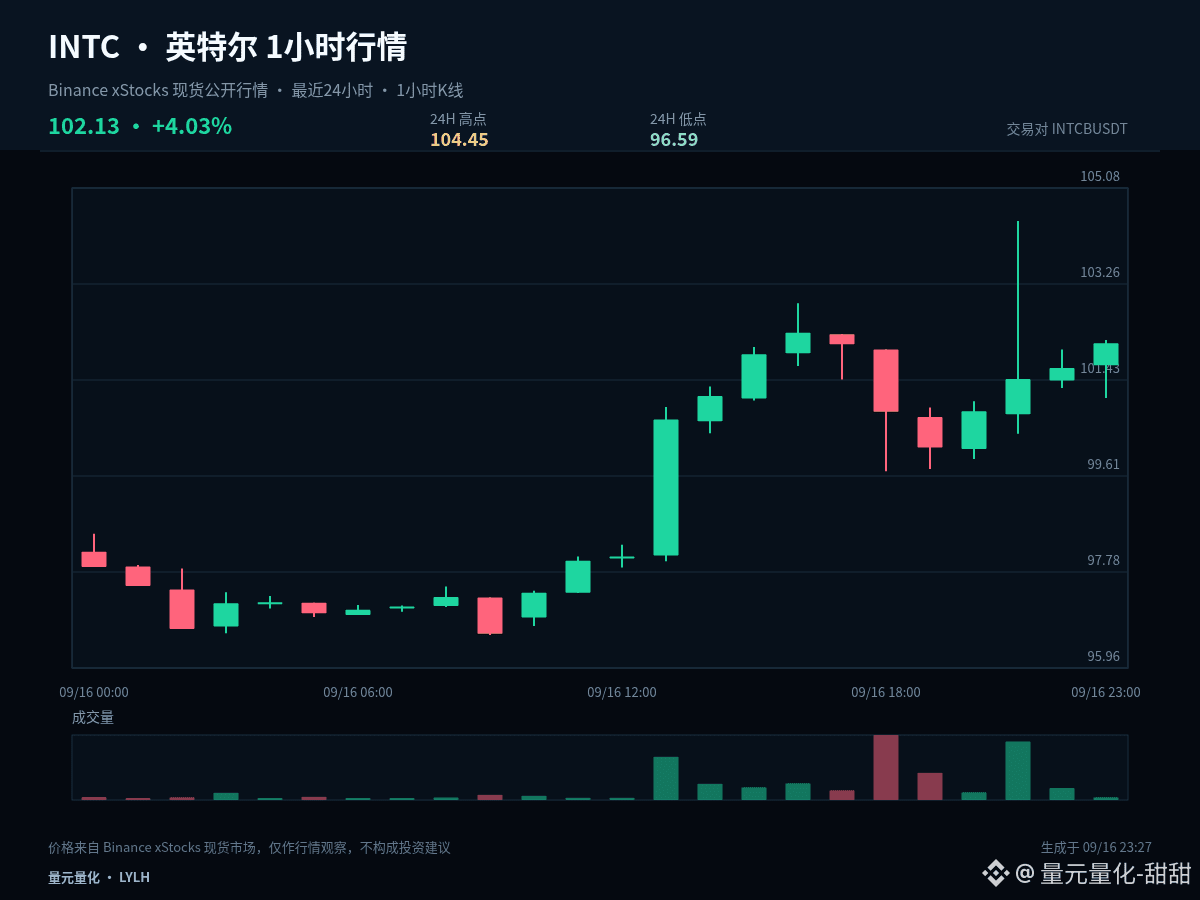
$INTCB #INTC In the past 24 hours, the high-low amplitude is about 7.7%. The current price is 102.13. This is not a calm range that’s suitable for a casual open; when volatility expands, you should adjust your position first before discussing direction.
$INTCB #INTC A clear one-sided trend has not yet formed. The 1-hour and 24-hour rhythms are still in contention. At this stage, you should focus on the boundaries of the range rather than the color of every single candlestick.
Current 1-hour: +0.46%, 24-hour: +3.13%. The two cycles have not formed sufficiently clear directional agreement. In range markets, the tolerance for chasing and killing momentum is lower. It’s more suitable to use the upper band confirmation to confirm direction and the lower band confirmation to confirm the pullback/hold. The midline is only used as the threshold between strength and weakness.
As for key price levels: 100.52 is the current structural midline and the first benchmark for judging whether a retest is healthy. As long as price can stay consistently above it, the bulls still maintain the initiative. On the upside, the first target to watch is 104.45. If price falls back below the midline, then attention should shift to the second support/hold at 96.59.
In high-volatility execution, the principle is to reduce single-trade exposure, avoid chasing prices back and forth in the middle of the range, and write the failure conditions before entering. If price does not give confirmation, it’s better to do fewer trades rather than use a larger position to compensate for uncertainty.
The subsequent path can be handled in three ways: (1) if it successfully holds above 104.45, wait to see whether a pullback holds without breaking before reassessing continuation; (2) if it breaks down below 96.59, prioritize risk control first and wait for new support; (3) if it continues to oscillate around 100.52, treat it as range rotation—don’t repeatedly chase direction in the middle.
Risk control should remain before the conclusion: only execute when conditions appear, and promptly re-evaluate if the price fails. The greater the volatility, the more restraint you should exercise with single-trade position size. The above is a scenario analysis based on the current 1-hour and 24-hour data and does not constitute any promise of returns.
#CircleOpensArcMainnet
$INTCB #INTC In the past 24 hours, the high-low amplitude is about 7.7%. The current price is 102.13. This is not a calm range that’s suitable for a casual open; when volatility expands, you should adjust your position first before discussing direction.
$INTCB #INTC A clear one-sided trend has not yet formed. The 1-hour and 24-hour rhythms are still in contention. At this stage, you should focus on the boundaries of the range rather than the color of every single candlestick.
Current 1-hour: +0.46%, 24-hour: +3.13%. The two cycles have not formed sufficiently clear directional agreement. In range markets, the tolerance for chasing and killing momentum is lower. It’s more suitable to use the upper band confirmation to confirm direction and the lower band confirmation to confirm the pullback/hold. The midline is only used as the threshold between strength and weakness.
As for key price levels: 100.52 is the current structural midline and the first benchmark for judging whether a retest is healthy. As long as price can stay consistently above it, the bulls still maintain the initiative. On the upside, the first target to watch is 104.45. If price falls back below the midline, then attention should shift to the second support/hold at 96.59.
In high-volatility execution, the principle is to reduce single-trade exposure, avoid chasing prices back and forth in the middle of the range, and write the failure conditions before entering. If price does not give confirmation, it’s better to do fewer trades rather than use a larger position to compensate for uncertainty.
The subsequent path can be handled in three ways: (1) if it successfully holds above 104.45, wait to see whether a pullback holds without breaking before reassessing continuation; (2) if it breaks down below 96.59, prioritize risk control first and wait for new support; (3) if it continues to oscillate around 100.52, treat it as range rotation—don’t repeatedly chase direction in the middle.
Risk control should remain before the conclusion: only execute when conditions appear, and promptly re-evaluate if the price fails. The greater the volatility, the more restraint you should exercise with single-trade position size. The above is a scenario analysis based on the current 1-hour and 24-hour data and does not constitute any promise of returns.
#CircleOpensArcMainnet
$INTCB #INTC A clear one-sided trend has not yet formed. The 1-hour and 24-hour rhythms are still in contention. At this stage, you should focus on the boundaries of the range rather than the color of every single candlestick.
Current 1-hour: +0.46%, 24-hour: +3.13%. The two cycles have not formed sufficiently clear directional agreement. In range markets, the tolerance for chasing and killing momentum is lower. It’s more suitable to use the upper band confirmation to confirm direction and the lower band confirmation to confirm the pullback/hold. The midline is only used as the threshold between strength and weakness.
As for key price levels: 100.52 is the current structural midline and the first benchmark for judging whether a retest is healthy. As long as price can stay consistently above it, the bulls still maintain the initiative. On the upside, the first target to watch is 104.45. If price falls back below the midline, then attention should shift to the second support/hold at 96.59.
In high-volatility execution, the principle is to reduce single-trade exposure, avoid chasing prices back and forth in the middle of the range, and write the failure conditions before entering. If price does not give confirmation, it’s better to do fewer trades rather than use a larger position to compensate for uncertainty.
The subsequent path can be handled in three ways: (1) if it successfully holds above 104.45, wait to see whether a pullback holds without breaking before reassessing continuation; (2) if it breaks down below 96.59, prioritize risk control first and wait for new support; (3) if it continues to oscillate around 100.52, treat it as range rotation—don’t repeatedly chase direction in the middle.
Risk control should remain before the conclusion: only execute when conditions appear, and promptly re-evaluate if the price fails. The greater the volatility, the more restraint you should exercise with single-trade position size. The above is a scenario analysis based on the current 1-hour and 24-hour data and does not constitute any promise of returns.
#CircleOpensArcMainnet
29

·
--
$INTC at $100.99, up 3.463% over the past 24 hours. The funding rate remains at 0.00024011. Without seeing any specific tech-stock positive news prompts, on-chain futures contract rates moved first, with trading volume surging to $112 million. Single-signal judgment: this rally lacks confirmation of fundamental bullishness from the spot side, and looks more like an early bet on a vague global risk-avoidance sentiment.
With the funding rate positive and the price rising, it means longs are chasing higher and paying funding costs for their positions. Every eight hours, longs must pay shorts a 0.00024 fee. If the price stalls, this cost keeps accumulating. Shorts are currently holding the funding that longs provide, but the fact of upward price movement puts them at risk of floating losses and liquidation pressure. The current structure is a classic “up + positive funding rate,” and market sentiment is being overdrawn in the short term.
The strongest counterargument is that if there is a real positive catalyst from geopolitics or chip-industry policy, with large-scale spot capital flowing in, it could fully offset the funding-rate costs on the futures side, turning the price increase into a fundamentals-driven move. Then the current overcrowding among longs wouldn’t be the risk—it would be the starting point of consensus. My invalidation conditions are simple: if $INTC’s price falls back below the $100 psychological level, or if the funding rate turns negative, it would mean the current long-sentiment structure has been broken.
From a second-order impact perspective, the most painful are contract traders who chase longs only now. They’re absorbing the high level at 100.99 while also paying positive funding. As long as the price goes sideways, it’s a dull knife cutting into them. If there’s no news to back it up, the first group likely unable to hold their positions will be them. And if shorts have enough patience, they can offset part of the floating losses with funding-rate income and maybe wait until sentiment cools.
So my move is to wait. I’ll watch for two conditions: the price pulls back into the $99–$100 range, and the funding rate drops to around 0.0001. Only then would I consider entering a long. For the aggressive, if they go long at the current price, the stop-loss must be set below $99—because the risk-reward ratio isn’t attractive. For the more conservative, keep waiting until the spot side shows a volume-backed bullish candle as confirmation. If you want to avoid this, ignore these contract moves entirely when there’s no fundamental support. Market consensus is trading $INTC’s “safe-haven” attribute, and I disagree, because there is no specific piece of news that can support this narrative. This looks more like a pre-planned position based on fear.
Trading tag: #TradFi #链上美股 #INTC
Where do you think this set of judgments is most likely to be wrong?
$INTC at $100.99, up 3.463% over the past 24 hours. The funding rate remains at 0.00024011. Without seeing any specific tech-stock positive news prompts, on-chain futures contract rates moved first, with trading volume surging to $112 million. Single-signal judgment: this rally lacks confirmation of fundamental bullishness from the spot side, and looks more like an early bet on a vague global risk-avoidance sentiment.
With the funding rate positive and the price rising, it means longs are chasing higher and paying funding costs for their positions. Every eight hours, longs must pay shorts a 0.00024 fee. If the price stalls, this cost keeps accumulating. Shorts are currently holding the funding that longs provide, but the fact of upward price movement puts them at risk of floating losses and liquidation pressure. The current structure is a classic “up + positive funding rate,” and market sentiment is being overdrawn in the short term.
The strongest counterargument is that if there is a real positive catalyst from geopolitics or chip-industry policy, with large-scale spot capital flowing in, it could fully offset the funding-rate costs on the futures side, turning the price increase into a fundamentals-driven move. Then the current overcrowding among longs wouldn’t be the risk—it would be the starting point of consensus. My invalidation conditions are simple: if $INTC ’s price falls back below the $100 psychological level, or if the funding rate turns negative, it would mean the current long-sentiment structure has been broken.
From a second-order impact perspective, the most painful are contract traders who chase longs only now. They’re absorbing the high level at 100.99 while also paying positive funding. As long as the price goes sideways, it’s a dull knife cutting into them. If there’s no news to back it up, the first group likely unable to hold their positions will be them. And if shorts have enough patience, they can offset part of the floating losses with funding-rate income and maybe wait until sentiment cools.
So my move is to wait. I’ll watch for two conditions: the price pulls back into the $99–$100 range, and the funding rate drops to around 0.0001. Only then would I consider entering a long. For the aggressive, if they go long at the current price, the stop-loss must be set below $99—because the risk-reward ratio isn’t attractive. For the more conservative, keep waiting until the spot side shows a volume-backed bullish candle as confirmation. If you want to avoid this, ignore these contract moves entirely when there’s no fundamental support. Market consensus is trading $INTC ’s “safe-haven” attribute, and I disagree, because there is no specific piece of news that can support this narrative. This looks more like a pre-planned position based on fear.
Trading tag: #TradFi #链上美股 #INTC
Where do you think this set of judgments is most likely to be wrong?
With the funding rate positive and the price rising, it means longs are chasing higher and paying funding costs for their positions. Every eight hours, longs must pay shorts a 0.00024 fee. If the price stalls, this cost keeps accumulating. Shorts are currently holding the funding that longs provide, but the fact of upward price movement puts them at risk of floating losses and liquidation pressure. The current structure is a classic “up + positive funding rate,” and market sentiment is being overdrawn in the short term.
The strongest counterargument is that if there is a real positive catalyst from geopolitics or chip-industry policy, with large-scale spot capital flowing in, it could fully offset the funding-rate costs on the futures side, turning the price increase into a fundamentals-driven move. Then the current overcrowding among longs wouldn’t be the risk—it would be the starting point of consensus. My invalidation conditions are simple: if $INTC ’s price falls back below the $100 psychological level, or if the funding rate turns negative, it would mean the current long-sentiment structure has been broken.
From a second-order impact perspective, the most painful are contract traders who chase longs only now. They’re absorbing the high level at 100.99 while also paying positive funding. As long as the price goes sideways, it’s a dull knife cutting into them. If there’s no news to back it up, the first group likely unable to hold their positions will be them. And if shorts have enough patience, they can offset part of the floating losses with funding-rate income and maybe wait until sentiment cools.
So my move is to wait. I’ll watch for two conditions: the price pulls back into the $99–$100 range, and the funding rate drops to around 0.0001. Only then would I consider entering a long. For the aggressive, if they go long at the current price, the stop-loss must be set below $99—because the risk-reward ratio isn’t attractive. For the more conservative, keep waiting until the spot side shows a volume-backed bullish candle as confirmation. If you want to avoid this, ignore these contract moves entirely when there’s no fundamental support. Market consensus is trading $INTC ’s “safe-haven” attribute, and I disagree, because there is no specific piece of news that can support this narrative. This looks more like a pre-planned position based on fear.
Trading tag: #TradFi #链上美股 #INTC
Where do you think this set of judgments is most likely to be wrong?
121
Log in to explore more content
Join global crypto users on Binance Square
⚡️ Get latest and useful information about crypto.
💬 Trusted by the world’s largest crypto exchange.
👍 Discover real insights from verified creators.
Email / Phone number
Trending Topics
1
#BitcoinSurpasses$77000
3,605 views
76 Discussing
2
#ParadigmDisclosesZECHolding
4,765 views
207 Discussing
3
#BitcoinETFsShed$450M
15,342 views
143 Discussing
4
#USWeeklyJoblessClaimsFallTo196K
1,838 views
134 Discussing
5
#ArkhamSaysBlackRockBuys$1.5BInETH
799 views
23 Discussing
6
#ElSalvadorBTCHoldingsRiseTo7777
19,982 views
454 Discussing
7
#MemeLaunchpads82%OfArcDayOneVolume
26,920 views
658 Discussing
8
#OstiumLoanDisputeHearingSetInNYFederalCourt
22,230 views
469 Discussing
9
#HyperliquidUSDCSupplyOvertakesSolana
9,200 views
229 Discussing
10
#SKPoliceRefer18PolymarketUsersToProsecutors
15,517 views
396 Discussing