
#binancespot
binancespot
1.4M views
1,960 Discussing
Hot
Latest


·
--
$LSK Today I’m letting my emotions run high.
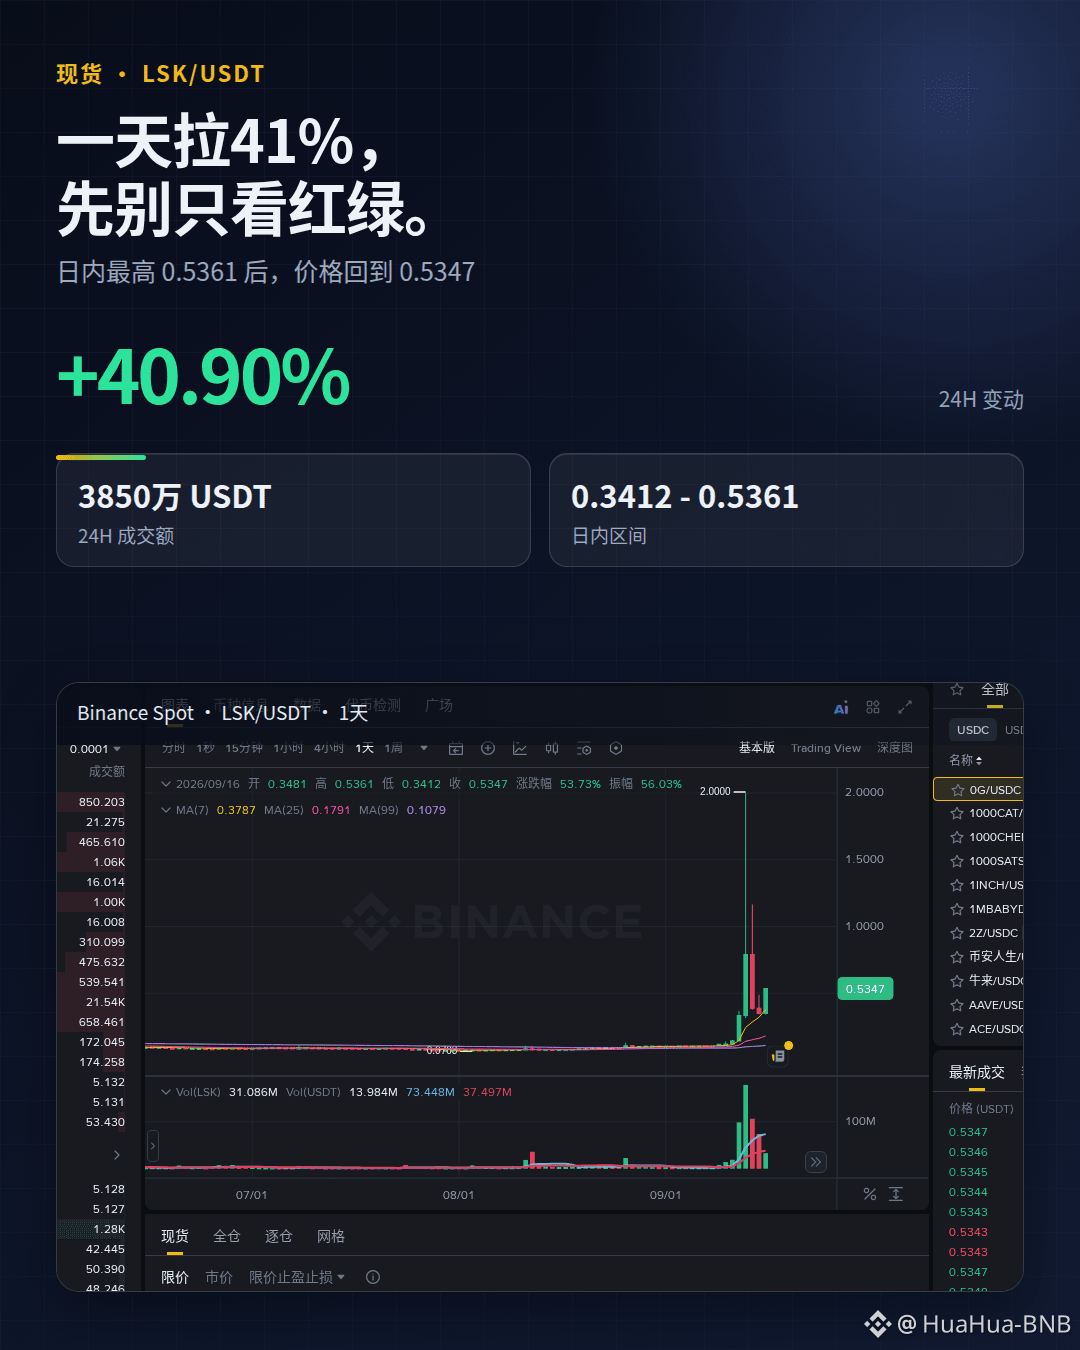
On the Binance spot page shown at the same time: over the past 24 hours +40.90%, trading volume about 38.49 million USDT, intraday range 0.3412 to 0.5361.
This daily bullish candle is very eye-catching, but the price has already pulled back from the day’s high to 0.5347. Before chasing the move, first see whether the post-pullback trading can continue.
What’s more important is that the page also indicates this coin has risk monitoring performance—higher volatility and risk. You can observe this kind of market, but don’t treat a single surge as certainty.
Will you focus on whether volume can continue, or wait for a pullback to take another look?
$LSK #BinanceSpot #Market Watch
$LSK Today I’m letting my emotions run high.
On the Binance spot page shown at the same time: over the past 24 hours +40.90%, trading volume about 38.49 million USDT, intraday range 0.3412 to 0.5361.
This daily bullish candle is very eye-catching, but the price has already pulled back from the day’s high to 0.5347. Before chasing the move, first see whether the post-pullback trading can continue.
What’s more important is that the page also indicates this coin has risk monitoring performance—higher volatility and risk. You can observe this kind of market, but don’t treat a single surge as certainty.
Will you focus on whether volume can continue, or wait for a pullback to take another look?
$LSK #BinanceSpot #Market Watch
On the Binance spot page shown at the same time: over the past 24 hours +40.90%, trading volume about 38.49 million USDT, intraday range 0.3412 to 0.5361.
This daily bullish candle is very eye-catching, but the price has already pulled back from the day’s high to 0.5347. Before chasing the move, first see whether the post-pullback trading can continue.
What’s more important is that the page also indicates this coin has risk monitoring performance—higher volatility and risk. You can observe this kind of market, but don’t treat a single surge as certainty.
Will you focus on whether volume can continue, or wait for a pullback to take another look?
$LSK #BinanceSpot #Market Watch
323
·
--
This UNI daily candle isn’t the most shocking by percentage gain, but the increased volume compared to the rise is what’s truly worth watching.
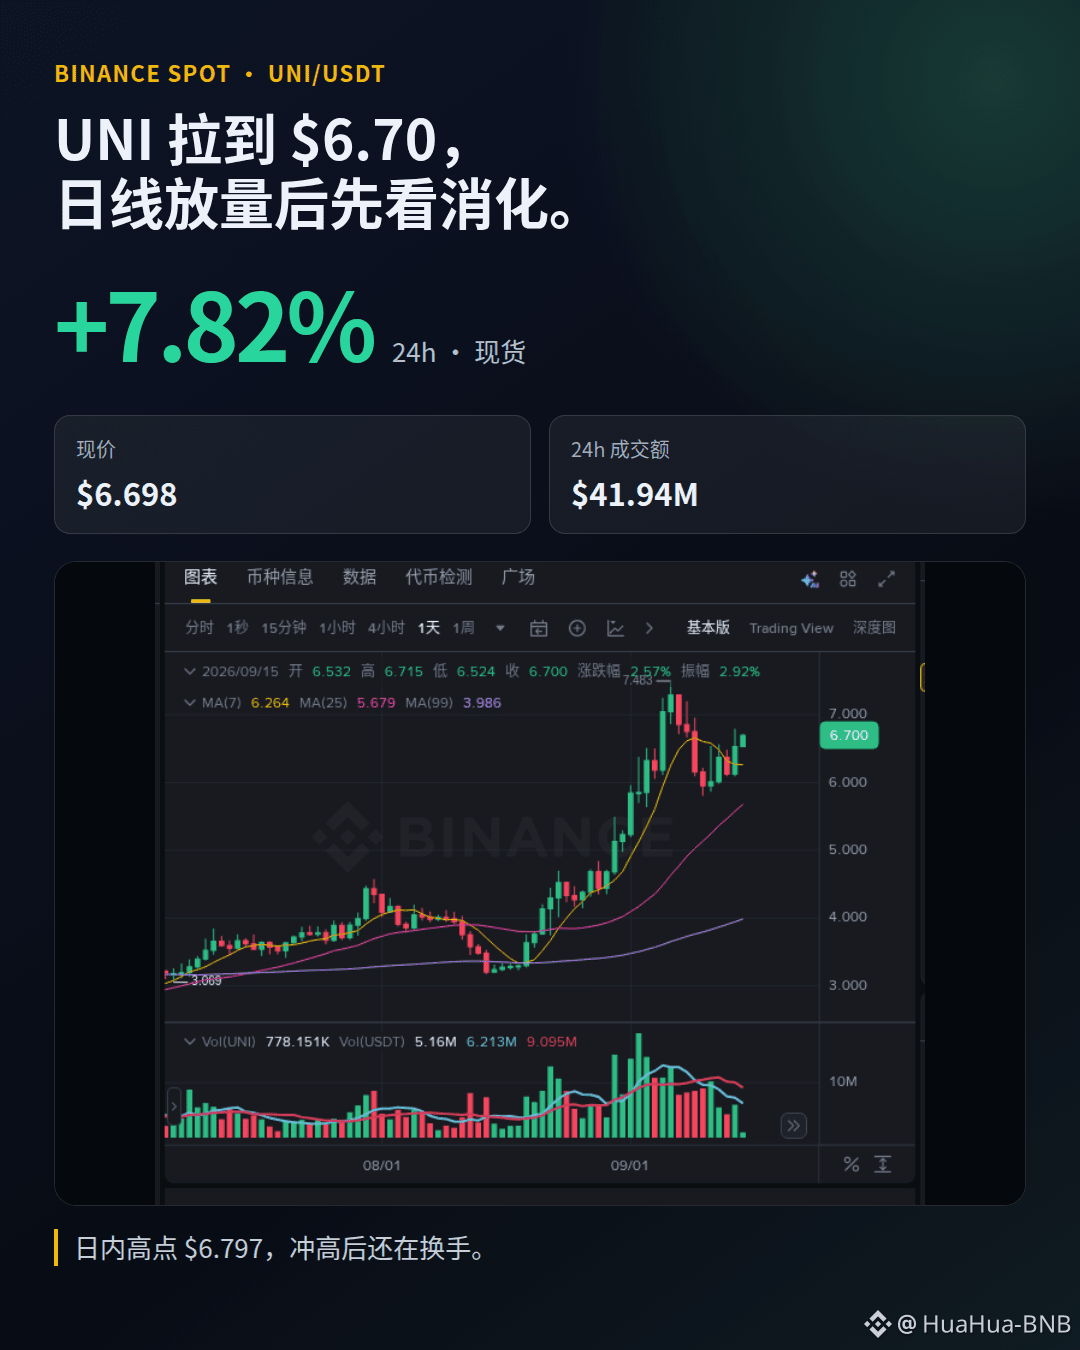
On Binance’s spot UNI/USDT page, the current price is $6.698, up +7.82% in 24h. The intraday high is $6.797, and the 24h trading volume is roughly $41.94 million. After the daily shot up and then pulled back, it’s still trading at a high level with turnover.
For now, I won’t treat a single bullish candle as a conclusion. If the volume can’t keep up afterward, today’s strength could just be an emotion-driven impulse. Only if it can hold sideways (or consolidate) does it show that the follow-through hasn’t immediately fallen apart.
This is an observation of the spot market, not a trading instruction. There are risks from short-term volatility, chasing highs and then retracing, weakening volume, and potential reversals in the news/catalyst.
What do you think about this UNI move—does the trend continue, or is it high-level digestion after the rally?
$UNI #Uniswap #BinanceSpot
This UNI daily candle isn’t the most shocking by percentage gain, but the increased volume compared to the rise is what’s truly worth watching.
On Binance’s spot UNI/USDT page, the current price is $6.698, up +7.82% in 24h. The intraday high is $6.797, and the 24h trading volume is roughly $41.94 million. After the daily shot up and then pulled back, it’s still trading at a high level with turnover.
For now, I won’t treat a single bullish candle as a conclusion. If the volume can’t keep up afterward, today’s strength could just be an emotion-driven impulse. Only if it can hold sideways (or consolidate) does it show that the follow-through hasn’t immediately fallen apart.
This is an observation of the spot market, not a trading instruction. There are risks from short-term volatility, chasing highs and then retracing, weakening volume, and potential reversals in the news/catalyst.
What do you think about this UNI move—does the trend continue, or is it high-level digestion after the rally?
$UNI #Uniswap #BinanceSpot
On Binance’s spot UNI/USDT page, the current price is $6.698, up +7.82% in 24h. The intraday high is $6.797, and the 24h trading volume is roughly $41.94 million. After the daily shot up and then pulled back, it’s still trading at a high level with turnover.
For now, I won’t treat a single bullish candle as a conclusion. If the volume can’t keep up afterward, today’s strength could just be an emotion-driven impulse. Only if it can hold sideways (or consolidate) does it show that the follow-through hasn’t immediately fallen apart.
This is an observation of the spot market, not a trading instruction. There are risks from short-term volatility, chasing highs and then retracing, weakening volume, and potential reversals in the news/catalyst.
What do you think about this UNI move—does the trend continue, or is it high-level digestion after the rally?
$UNI #Uniswap #BinanceSpot
2k
·
--
ETH takes this step back to 2400, and only then does the market start to look at its follow-through seriously.
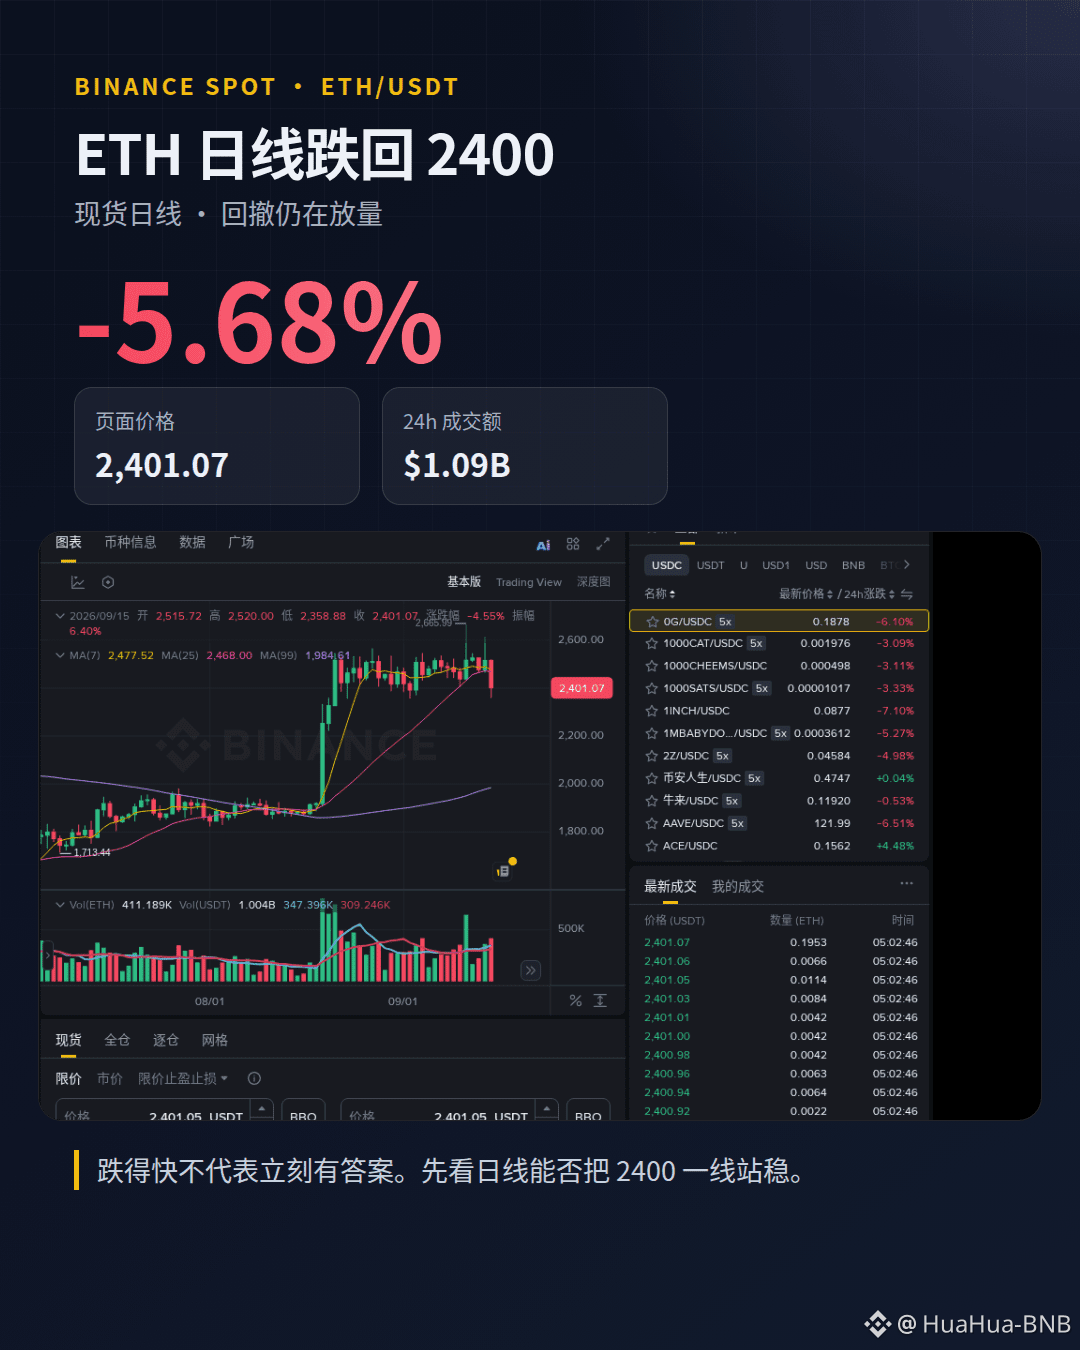
Same Binance spot page: ETH/USDT is at 2,401.07, -5.68% over 24h, with about $1.09B in 24h trading volume. The daily chart has pulled back from around 2,520; after the low reached 2,358.88, there was a rebound, but it’s still not enough to say the pressure has been fully digested.
I’ll first watch whether it can hold above the 2400 area. A fast drop doesn’t automatically mean there’s an answer right away—after a sell-off with increased volume, a rebound could just be continued disagreement working itself out.
Spot market watch only, not a trading instruction. Short-term volatility, failed rebounds, and the risk of a reversal in the news cycle are still there.
Do you think this move is the market overall de-risking, or is ETH’s own follow-through weaker?
$ETH #Ethereum #BinanceSpot
ETH takes this step back to 2400, and only then does the market start to look at its follow-through seriously.
Same Binance spot page: ETH/USDT is at 2,401.07, -5.68% over 24h, with about $1.09B in 24h trading volume. The daily chart has pulled back from around 2,520; after the low reached 2,358.88, there was a rebound, but it’s still not enough to say the pressure has been fully digested.
I’ll first watch whether it can hold above the 2400 area. A fast drop doesn’t automatically mean there’s an answer right away—after a sell-off with increased volume, a rebound could just be continued disagreement working itself out.
Spot market watch only, not a trading instruction. Short-term volatility, failed rebounds, and the risk of a reversal in the news cycle are still there.
Do you think this move is the market overall de-risking, or is ETH’s own follow-through weaker?
$ETH #Ethereum #BinanceSpot
Same Binance spot page: ETH/USDT is at 2,401.07, -5.68% over 24h, with about $1.09B in 24h trading volume. The daily chart has pulled back from around 2,520; after the low reached 2,358.88, there was a rebound, but it’s still not enough to say the pressure has been fully digested.
I’ll first watch whether it can hold above the 2400 area. A fast drop doesn’t automatically mean there’s an answer right away—after a sell-off with increased volume, a rebound could just be continued disagreement working itself out.
Spot market watch only, not a trading instruction. Short-term volatility, failed rebounds, and the risk of a reversal in the news cycle are still there.
Do you think this move is the market overall de-risking, or is ETH’s own follow-through weaker?
$ETH #Ethereum #BinanceSpot
1
376
·
--
$FIL This is not a sudden surge; it’s more like it stepped on the lower end of the 24h range again.
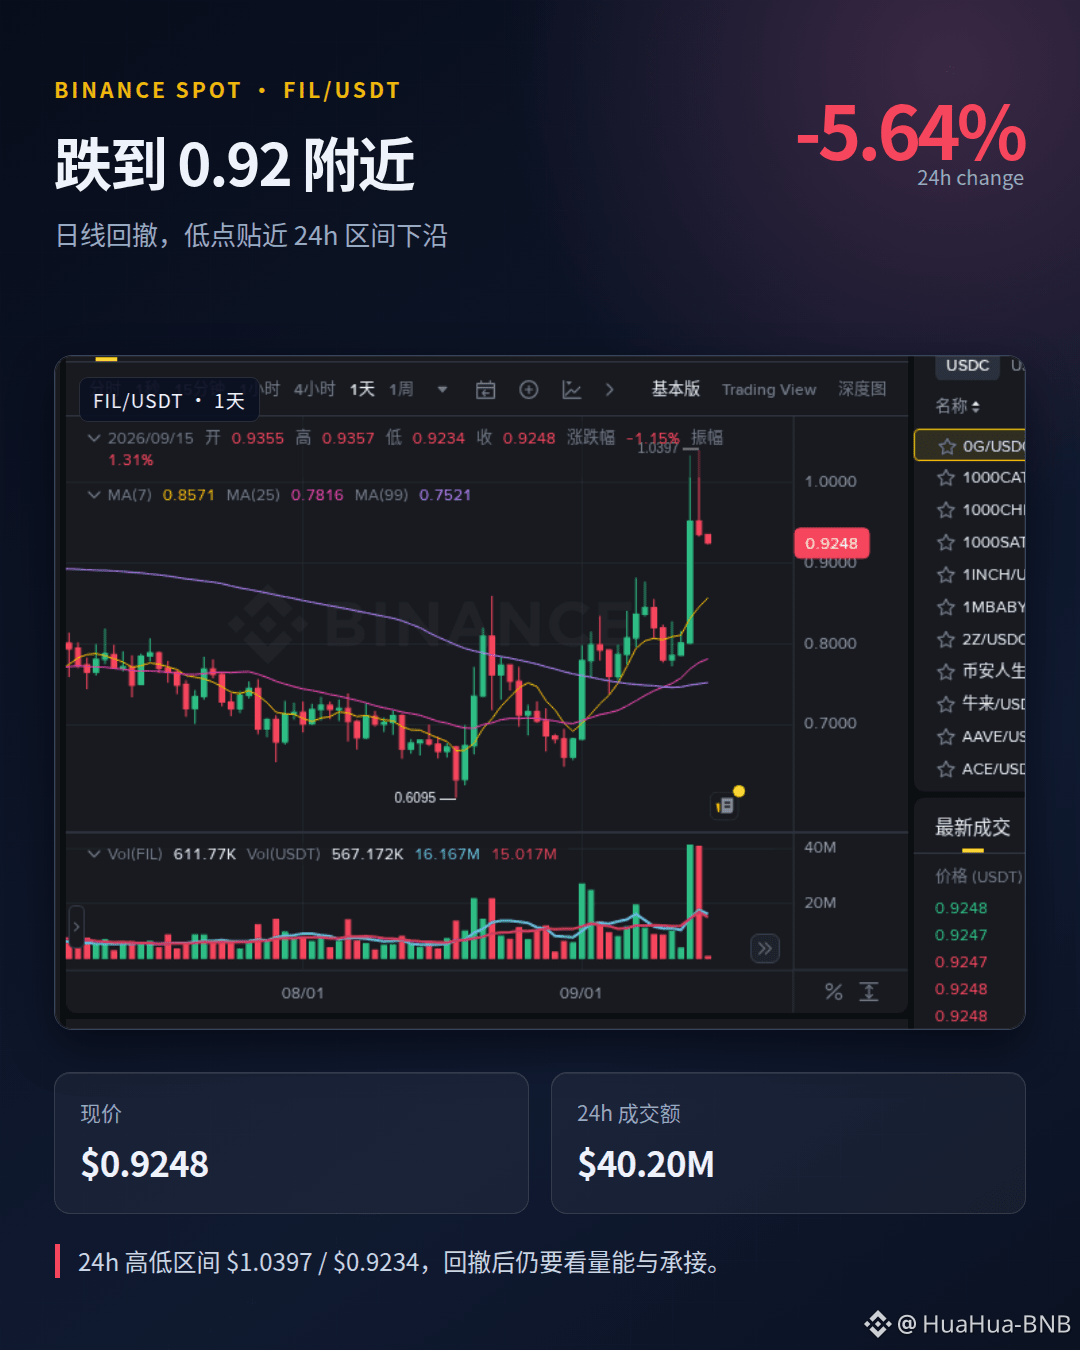
Binance Spot FIL/USDT current price is around $0.9248, down 5.64% in 24h, with trading volume of about $40.20M; the range fell from $1.0397 to $0.9234.
What I’ll be watching is how it holds up after this pullback. I’m not in a hurry to interpret one big bearish candle as a conclusion. Prior day-to-day swings have already been amplified; if volume can’t keep up, price can easily keep bouncing around.
This is spot market observation only—no trading instructions. Risks from high volatility, chasing highs, liquidity, and potential reversals in the news cycle are still present.
Will you first see whether it can hold the low, or wait for the volatility to settle a bit before checking?
$FIL #BinanceSpot
$FIL This is not a sudden surge; it’s more like it stepped on the lower end of the 24h range again.
Binance Spot FIL/USDT current price is around $0.9248, down 5.64% in 24h, with trading volume of about $40.20M; the range fell from $1.0397 to $0.9234.
What I’ll be watching is how it holds up after this pullback. I’m not in a hurry to interpret one big bearish candle as a conclusion. Prior day-to-day swings have already been amplified; if volume can’t keep up, price can easily keep bouncing around.
This is spot market observation only—no trading instructions. Risks from high volatility, chasing highs, liquidity, and potential reversals in the news cycle are still present.
Will you first see whether it can hold the low, or wait for the volatility to settle a bit before checking?
$FIL #BinanceSpot
Binance Spot FIL/USDT current price is around $0.9248, down 5.64% in 24h, with trading volume of about $40.20M; the range fell from $1.0397 to $0.9234.
What I’ll be watching is how it holds up after this pullback. I’m not in a hurry to interpret one big bearish candle as a conclusion. Prior day-to-day swings have already been amplified; if volume can’t keep up, price can easily keep bouncing around.
This is spot market observation only—no trading instructions. Risks from high volatility, chasing highs, liquidity, and potential reversals in the news cycle are still present.
Will you first see whether it can hold the low, or wait for the volatility to settle a bit before checking?
$FIL #BinanceSpot
1
2.7k
·
--
$ARB Today is not one of those moves where you just pull up a single line and then it goes nowhere.
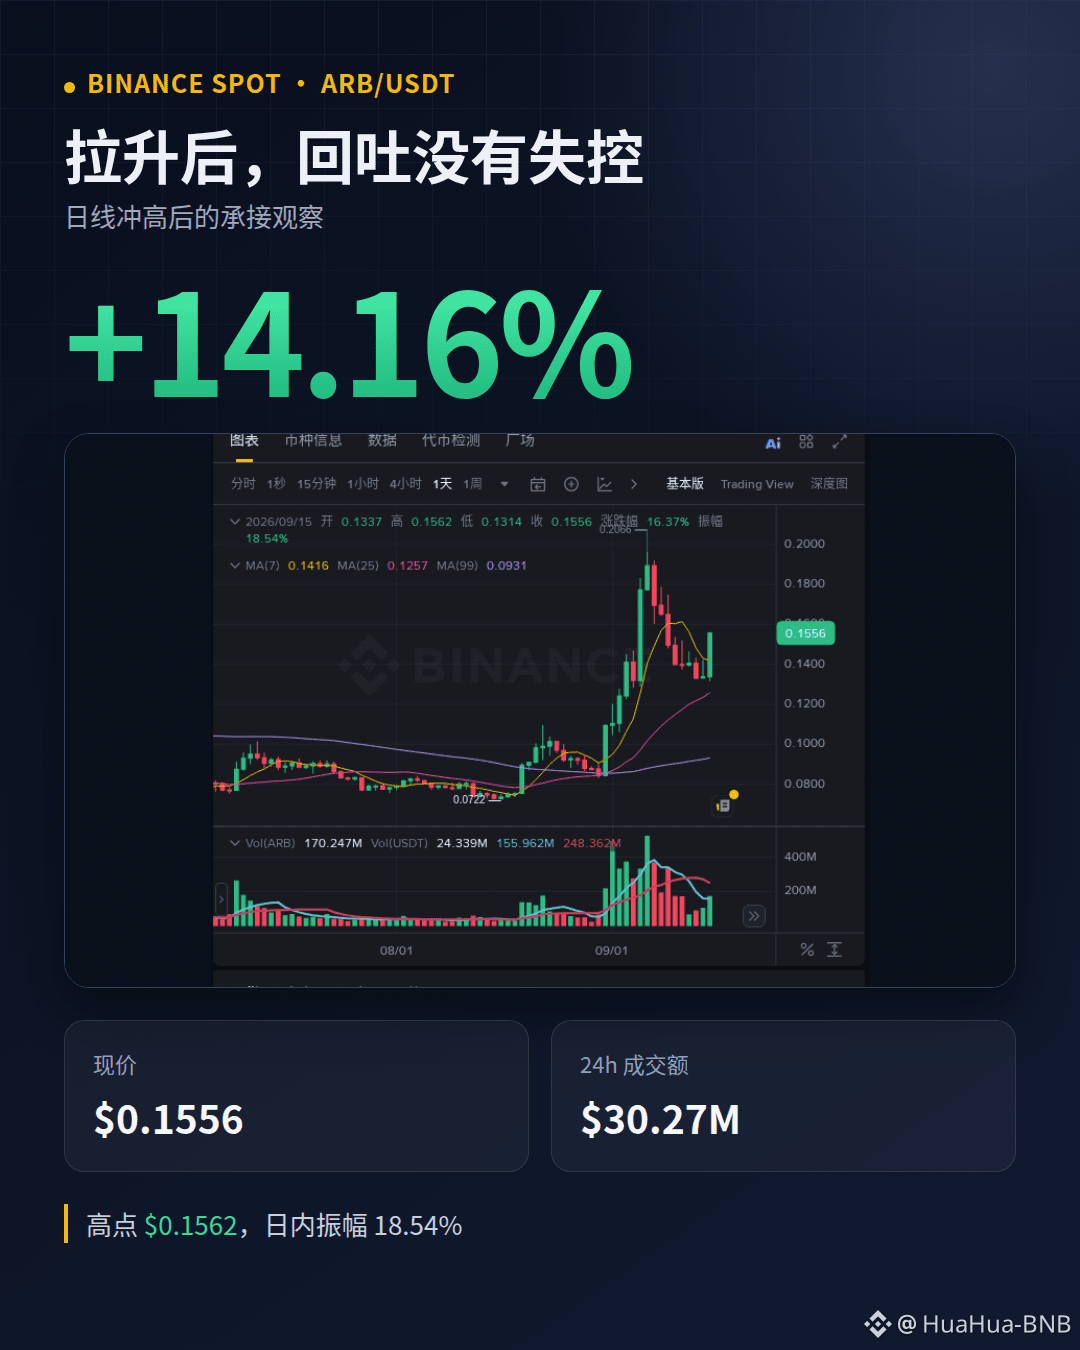
On Binance Spot, ARB/USDT is displayed on the same page: 24h +14.16%, current price $0.1556, with 24h trading volume of about $30.27M; during the day it even touched $0.1562 briefly, with a range of 18.54%.
What I’m watching is whether the pullback after the spike keeps getting bigger. The daily chart is still in a high-range consolidation, which suggests divergence has emerged, but it hasn’t turned into a one-sided liquidation dump yet.
In this kind of position, the worst thing is to treat a single big bullish candle as certainty. You need to guard against short-term fluctuations, a pullback after the spike, weakening momentum/volume, and a reversal in the news.
When you see this kind of pullback after a rally, do you first look at whether buy/sell interest can hold (trade support), or do you just wait for the next daily candle?
$ARB #Arbitrum #BinanceSpot
$ARB Today is not one of those moves where you just pull up a single line and then it goes nowhere.
On Binance Spot, ARB/USDT is displayed on the same page: 24h +14.16%, current price $0.1556, with 24h trading volume of about $30.27M; during the day it even touched $0.1562 briefly, with a range of 18.54%.
What I’m watching is whether the pullback after the spike keeps getting bigger. The daily chart is still in a high-range consolidation, which suggests divergence has emerged, but it hasn’t turned into a one-sided liquidation dump yet.
In this kind of position, the worst thing is to treat a single big bullish candle as certainty. You need to guard against short-term fluctuations, a pullback after the spike, weakening momentum/volume, and a reversal in the news.
When you see this kind of pullback after a rally, do you first look at whether buy/sell interest can hold (trade support), or do you just wait for the next daily candle?
$ARB #Arbitrum #BinanceSpot
On Binance Spot, ARB/USDT is displayed on the same page: 24h +14.16%, current price $0.1556, with 24h trading volume of about $30.27M; during the day it even touched $0.1562 briefly, with a range of 18.54%.
What I’m watching is whether the pullback after the spike keeps getting bigger. The daily chart is still in a high-range consolidation, which suggests divergence has emerged, but it hasn’t turned into a one-sided liquidation dump yet.
In this kind of position, the worst thing is to treat a single big bullish candle as certainty. You need to guard against short-term fluctuations, a pullback after the spike, weakening momentum/volume, and a reversal in the news.
When you see this kind of pullback after a rally, do you first look at whether buy/sell interest can hold (trade support), or do you just wait for the next daily candle?
$ARB #Arbitrum #BinanceSpot
234
·
--
$LSK Today is not a normal callback.
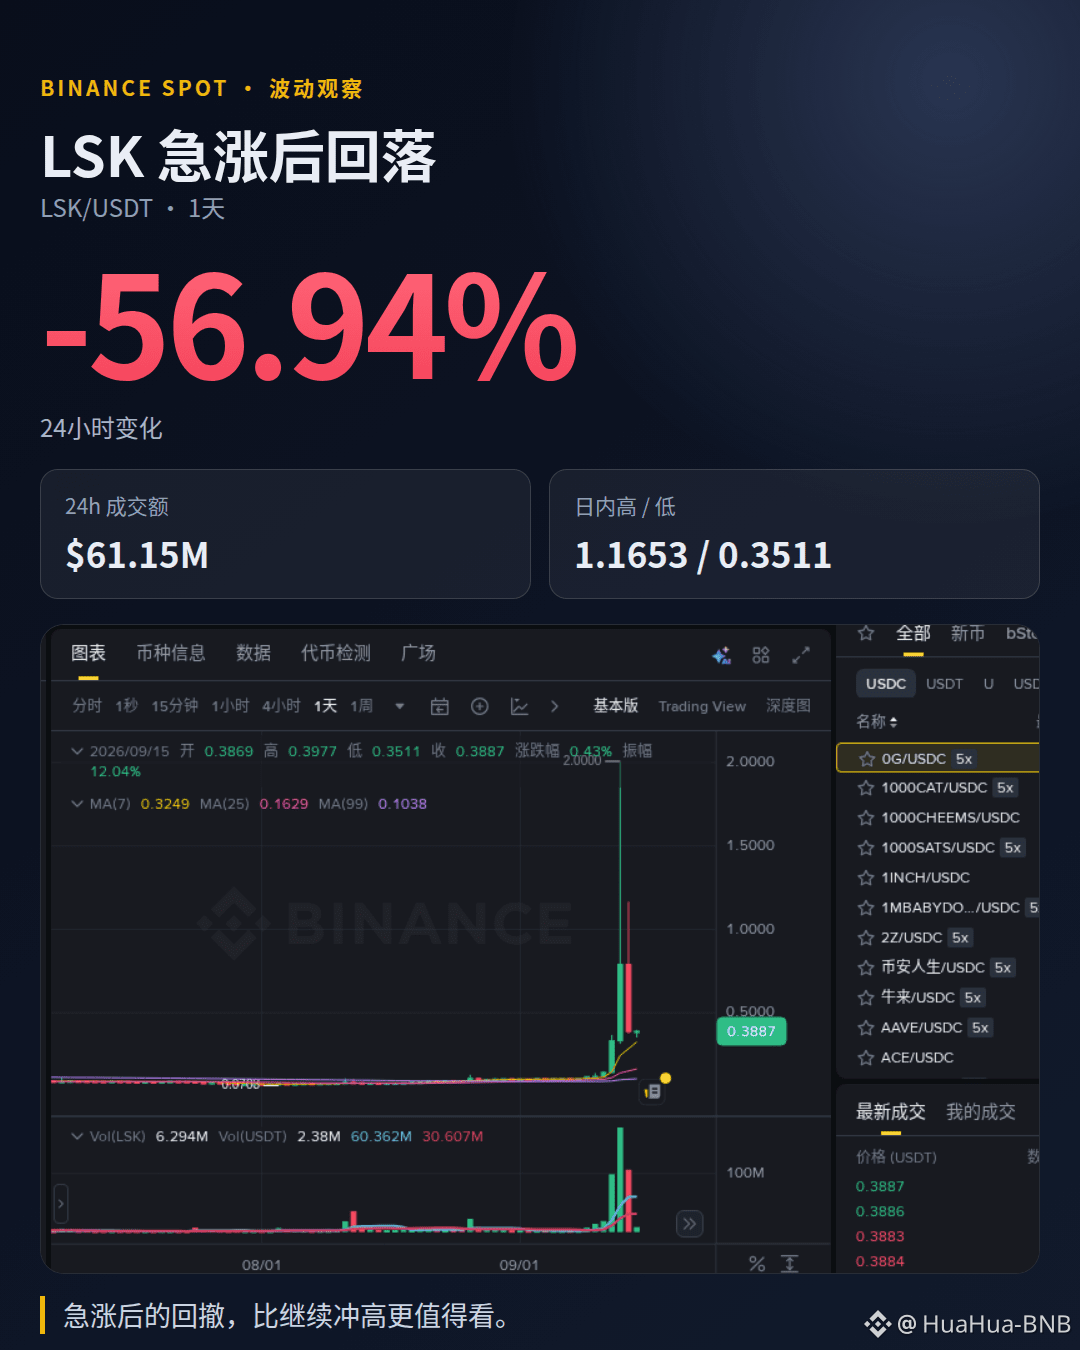
On Binance Spot, LSK/USDT’s 24-hour drop reached -56.94%, with trading volume of about $61.15M. During the day, it slid from 1.1653 all the way back to around 0.3511, and the current price is about 0.3887.
I’m not watching “how much it fell,” but whether the volume after this sudden surge still keeps pressing the price lower. High-volatility coins make it easiest for people to mistake a rebound for a reversal, and also easiest to overlook risk monitoring tags.
This is an observation of spot market conditions, not a trading instruction. Volatility, liquidity, chasing the price, and message-driven reversal risks are all very high.
After a big-amplitude move like this, do you think the market will first repair sentiment, or will it first look for new support?
$LSK #BinanceSpot
$LSK Today is not a normal callback.
On Binance Spot, LSK/USDT’s 24-hour drop reached -56.94%, with trading volume of about $61.15M. During the day, it slid from 1.1653 all the way back to around 0.3511, and the current price is about 0.3887.
I’m not watching “how much it fell,” but whether the volume after this sudden surge still keeps pressing the price lower. High-volatility coins make it easiest for people to mistake a rebound for a reversal, and also easiest to overlook risk monitoring tags.
This is an observation of spot market conditions, not a trading instruction. Volatility, liquidity, chasing the price, and message-driven reversal risks are all very high.
After a big-amplitude move like this, do you think the market will first repair sentiment, or will it first look for new support?
$LSK #BinanceSpot
On Binance Spot, LSK/USDT’s 24-hour drop reached -56.94%, with trading volume of about $61.15M. During the day, it slid from 1.1653 all the way back to around 0.3511, and the current price is about 0.3887.
I’m not watching “how much it fell,” but whether the volume after this sudden surge still keeps pressing the price lower. High-volatility coins make it easiest for people to mistake a rebound for a reversal, and also easiest to overlook risk monitoring tags.
This is an observation of spot market conditions, not a trading instruction. Volatility, liquidity, chasing the price, and message-driven reversal risks are all very high.
After a big-amplitude move like this, do you think the market will first repair sentiment, or will it first look for new support?
$LSK #BinanceSpot
630
·
--
SOL regains $100, but the daily chart hasn’t immediately accelerated—instead, it has started to grind in the high range.
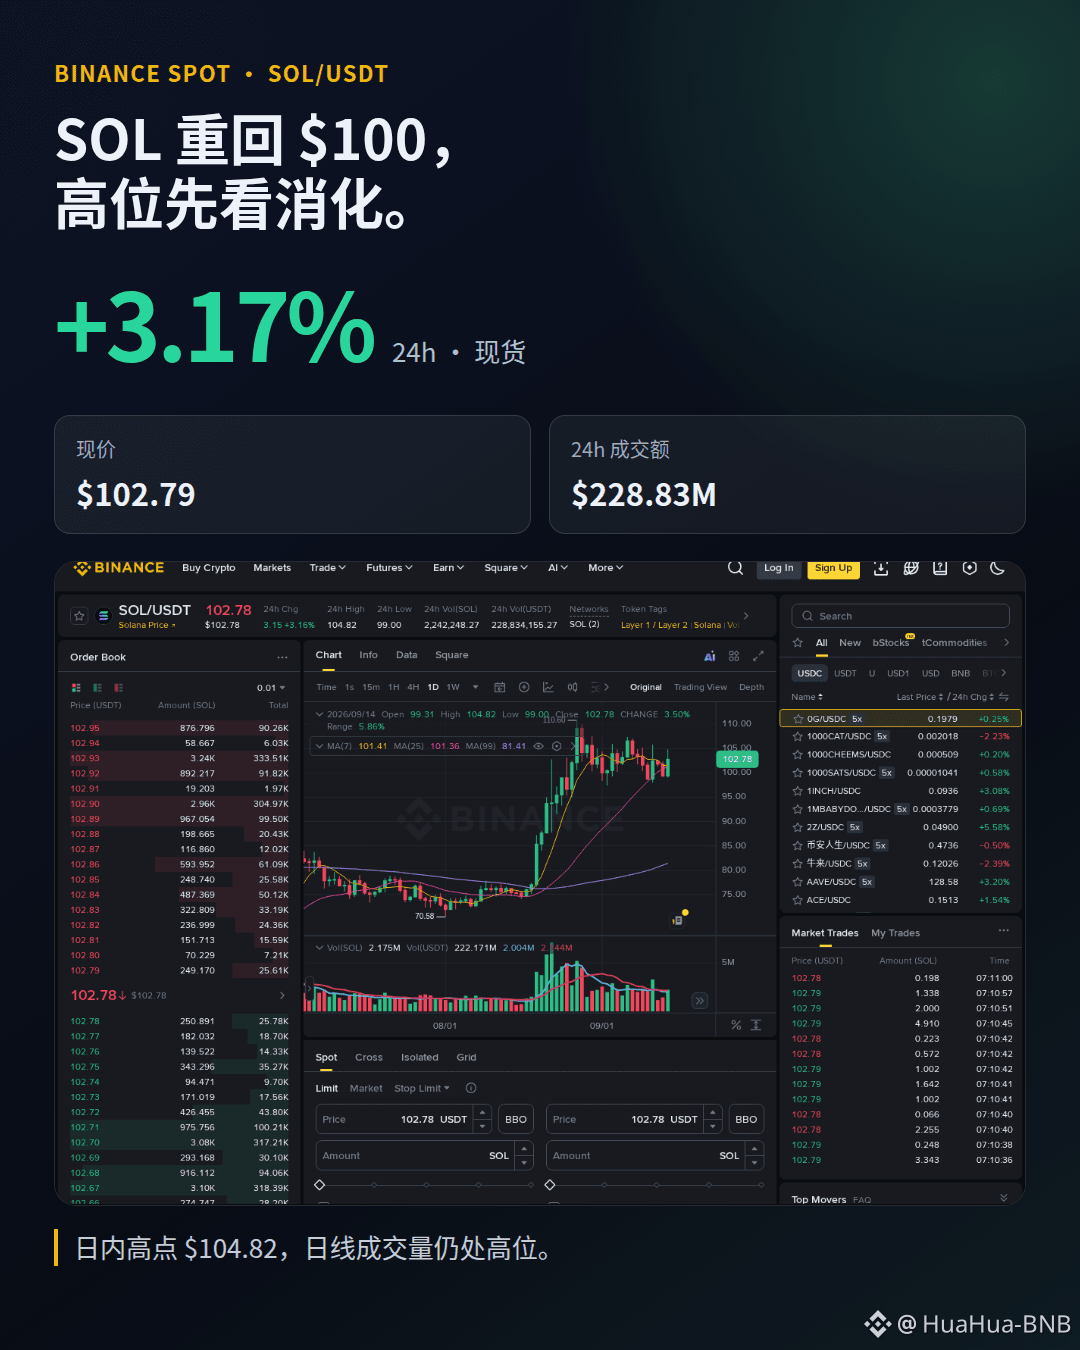
Binance spot page data: 24h +3.17%, current price $102.79, 24h trading volume about $228.83M, intraday high $104.82.
What I’ll be watching is whether this high-range digestion can translate into the next surge in volume. It’s not hard to push back above an integer level; the hard part is whether there will be support during the pullback. Right now, it looks more like a setup that requires patience to read volume and price action, not a situation where you can treat a single bullish candle as the conclusion.
This is market observation, not a trading instruction. In the short term, there are still risks of a push up followed by a pullback, weakening volume, and potential reversal in the news.
After SOL returned to $100 this time, do you think it will first consolidate sideways, or quickly retest the intraday high?
$SOL #BinanceSpot #Solana
SOL regains $100, but the daily chart hasn’t immediately accelerated—instead, it has started to grind in the high range.
Binance spot page data: 24h +3.17%, current price $102.79, 24h trading volume about $228.83M, intraday high $104.82.
What I’ll be watching is whether this high-range digestion can translate into the next surge in volume. It’s not hard to push back above an integer level; the hard part is whether there will be support during the pullback. Right now, it looks more like a setup that requires patience to read volume and price action, not a situation where you can treat a single bullish candle as the conclusion.
This is market observation, not a trading instruction. In the short term, there are still risks of a push up followed by a pullback, weakening volume, and potential reversal in the news.
After SOL returned to $100 this time, do you think it will first consolidate sideways, or quickly retest the intraday high?
$SOL #BinanceSpot #Solana
Binance spot page data: 24h +3.17%, current price $102.79, 24h trading volume about $228.83M, intraday high $104.82.
What I’ll be watching is whether this high-range digestion can translate into the next surge in volume. It’s not hard to push back above an integer level; the hard part is whether there will be support during the pullback. Right now, it looks more like a setup that requires patience to read volume and price action, not a situation where you can treat a single bullish candle as the conclusion.
This is market observation, not a trading instruction. In the short term, there are still risks of a push up followed by a pullback, weakening volume, and potential reversal in the news.
After SOL returned to $100 this time, do you think it will first consolidate sideways, or quickly retest the intraday high?
$SOL #BinanceSpot #Solana
1k
·
--
$CVC This is the most worth watching—it's not the spike higher yesterday, but the pullback speed today.
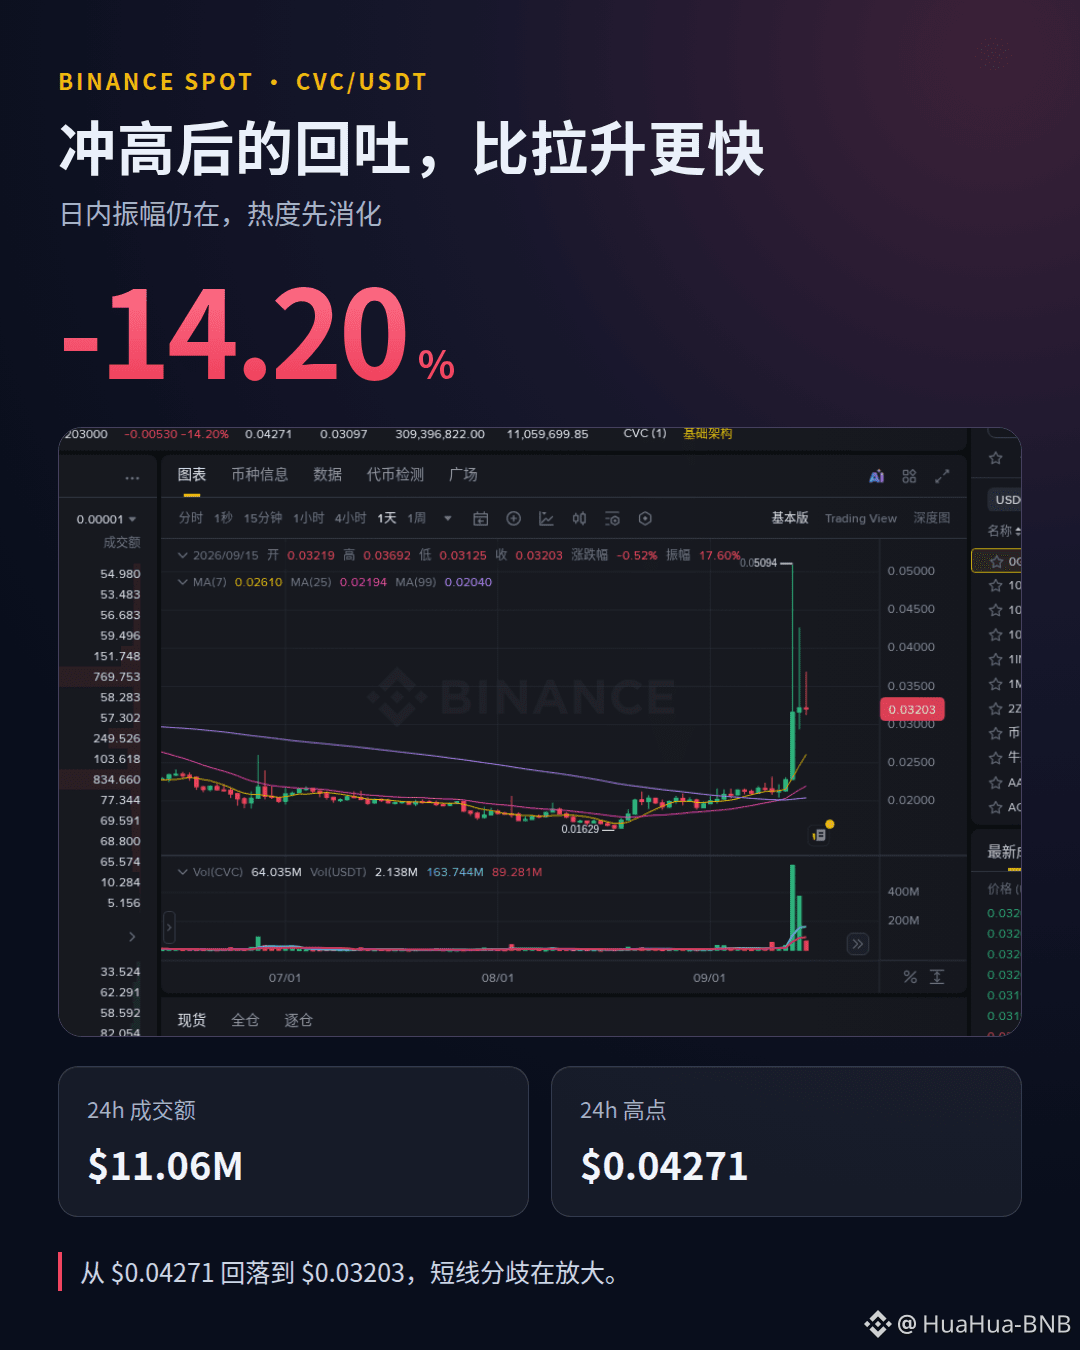
On the Binance spot page, CVC/USDT is currently trading at $0.03203, down 14.20% over the past 24 hours. The intraday high reached $0.04271, with trading volume of about $11.06M.
Yesterday’s big surge ignited the hype, but today’s price action has already laid out the disagreement first. In short-term trading, fast gains don’t necessarily mean it can hold. I’ll first watch whether volume and volatility can start to converge—I’m not rushing to draw a conclusion.
There’s risk from volatility, pullbacks after chasing, changes in liquidity, and potential reversals in the news. After such a sudden run-up, do you think this pullback is just the hype working itself off, or has the sentiment already shifted?
$CVC #BinanceSpot
$CVC This is the most worth watching—it's not the spike higher yesterday, but the pullback speed today.
On the Binance spot page, CVC/USDT is currently trading at $0.03203, down 14.20% over the past 24 hours. The intraday high reached $0.04271, with trading volume of about $11.06M.
Yesterday’s big surge ignited the hype, but today’s price action has already laid out the disagreement first. In short-term trading, fast gains don’t necessarily mean it can hold. I’ll first watch whether volume and volatility can start to converge—I’m not rushing to draw a conclusion.
There’s risk from volatility, pullbacks after chasing, changes in liquidity, and potential reversals in the news. After such a sudden run-up, do you think this pullback is just the hype working itself off, or has the sentiment already shifted?
$CVC #BinanceSpot
On the Binance spot page, CVC/USDT is currently trading at $0.03203, down 14.20% over the past 24 hours. The intraday high reached $0.04271, with trading volume of about $11.06M.
Yesterday’s big surge ignited the hype, but today’s price action has already laid out the disagreement first. In short-term trading, fast gains don’t necessarily mean it can hold. I’ll first watch whether volume and volatility can start to converge—I’m not rushing to draw a conclusion.
There’s risk from volatility, pullbacks after chasing, changes in liquidity, and potential reversals in the news. After such a sudden run-up, do you think this pullback is just the hype working itself off, or has the sentiment already shifted?
$CVC #BinanceSpot
183
·
--
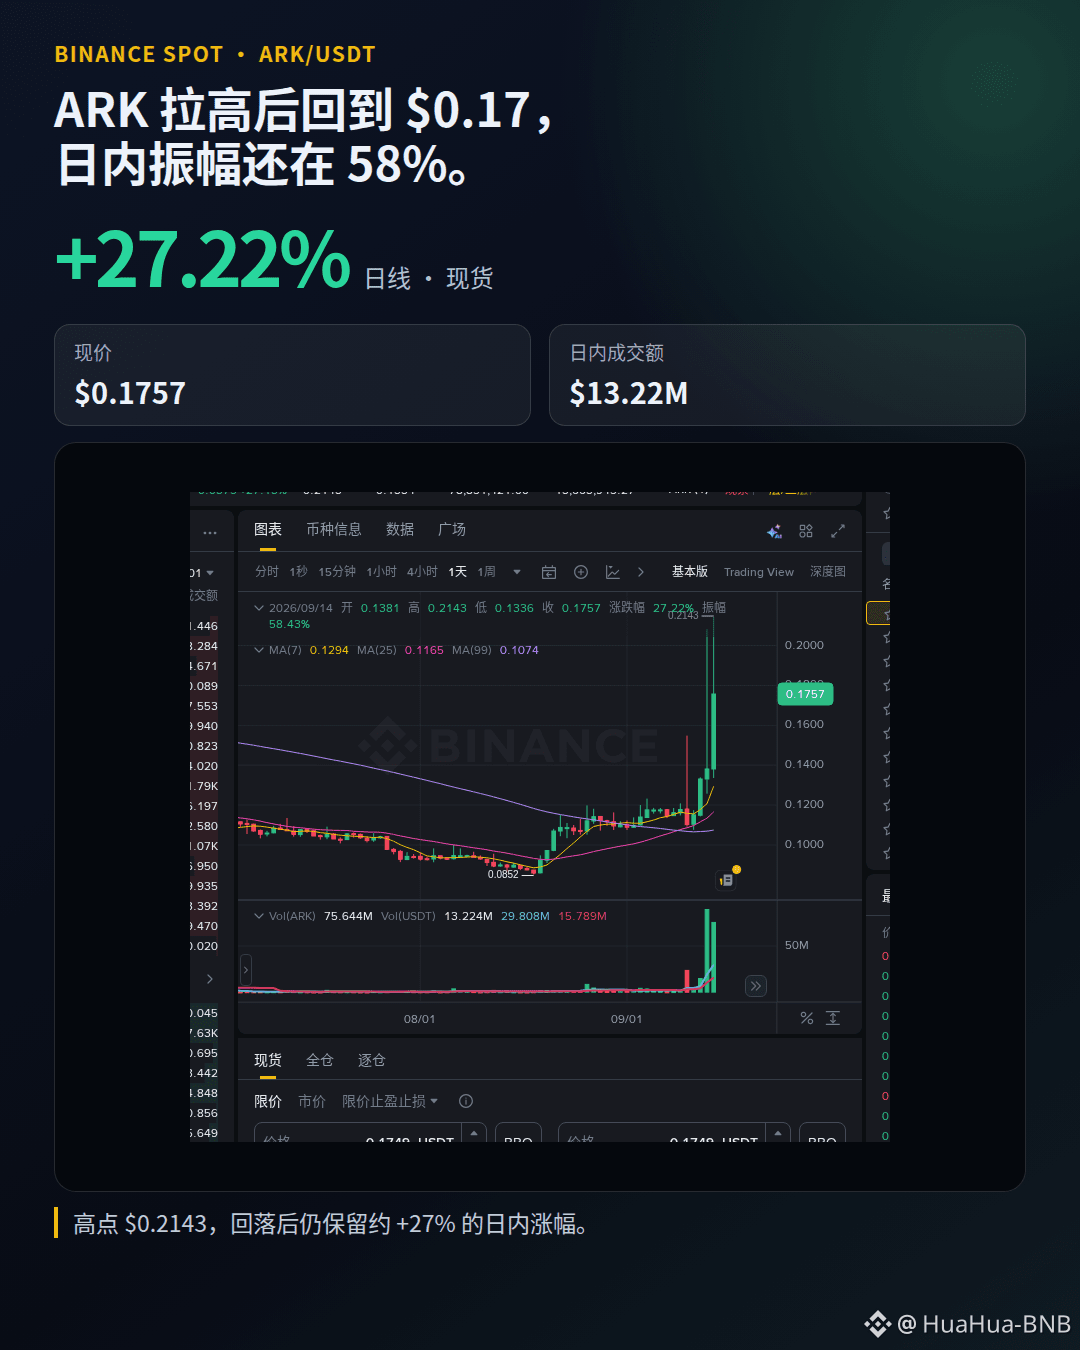
ARK is not simply pumping today—it has also pulled out the divergence at the same time.
On the Binance Spot daily chart, it surged to $0.2143 at one point, then returned to around $0.1757. Intraday, it’s still roughly +27% on the chart; the trading volume is about $13.22M, with a range of 58.43%.
I’ll watch how the selloff is being supported—I'm not going to turn a single big bullish candle directly into certainty. As the gains are there, so is the volatility, and the page already has risk monitoring alerts.
High-volatility assets fear chasing price spikes most, along with liquidity changes and message reversals. When you see this kind of rally that then fades, do you look first at trading volume, or first at the candlestick chart?
$ARK #BinanceSpot #High-Volatility
ARK is not simply pumping today—it has also pulled out the divergence at the same time.
On the Binance Spot daily chart, it surged to $0.2143 at one point, then returned to around $0.1757. Intraday, it’s still roughly +27% on the chart; the trading volume is about $13.22M, with a range of 58.43%.
I’ll watch how the selloff is being supported—I'm not going to turn a single big bullish candle directly into certainty. As the gains are there, so is the volatility, and the page already has risk monitoring alerts.
High-volatility assets fear chasing price spikes most, along with liquidity changes and message reversals. When you see this kind of rally that then fades, do you look first at trading volume, or first at the candlestick chart?
$ARK #BinanceSpot #High-Volatility
On the Binance Spot daily chart, it surged to $0.2143 at one point, then returned to around $0.1757. Intraday, it’s still roughly +27% on the chart; the trading volume is about $13.22M, with a range of 58.43%.
I’ll watch how the selloff is being supported—I'm not going to turn a single big bullish candle directly into certainty. As the gains are there, so is the volatility, and the page already has risk monitoring alerts.
High-volatility assets fear chasing price spikes most, along with liquidity changes and message reversals. When you see this kind of rally that then fades, do you look first at trading volume, or first at the candlestick chart?
$ARK #BinanceSpot #High-Volatility
2
423
·
--
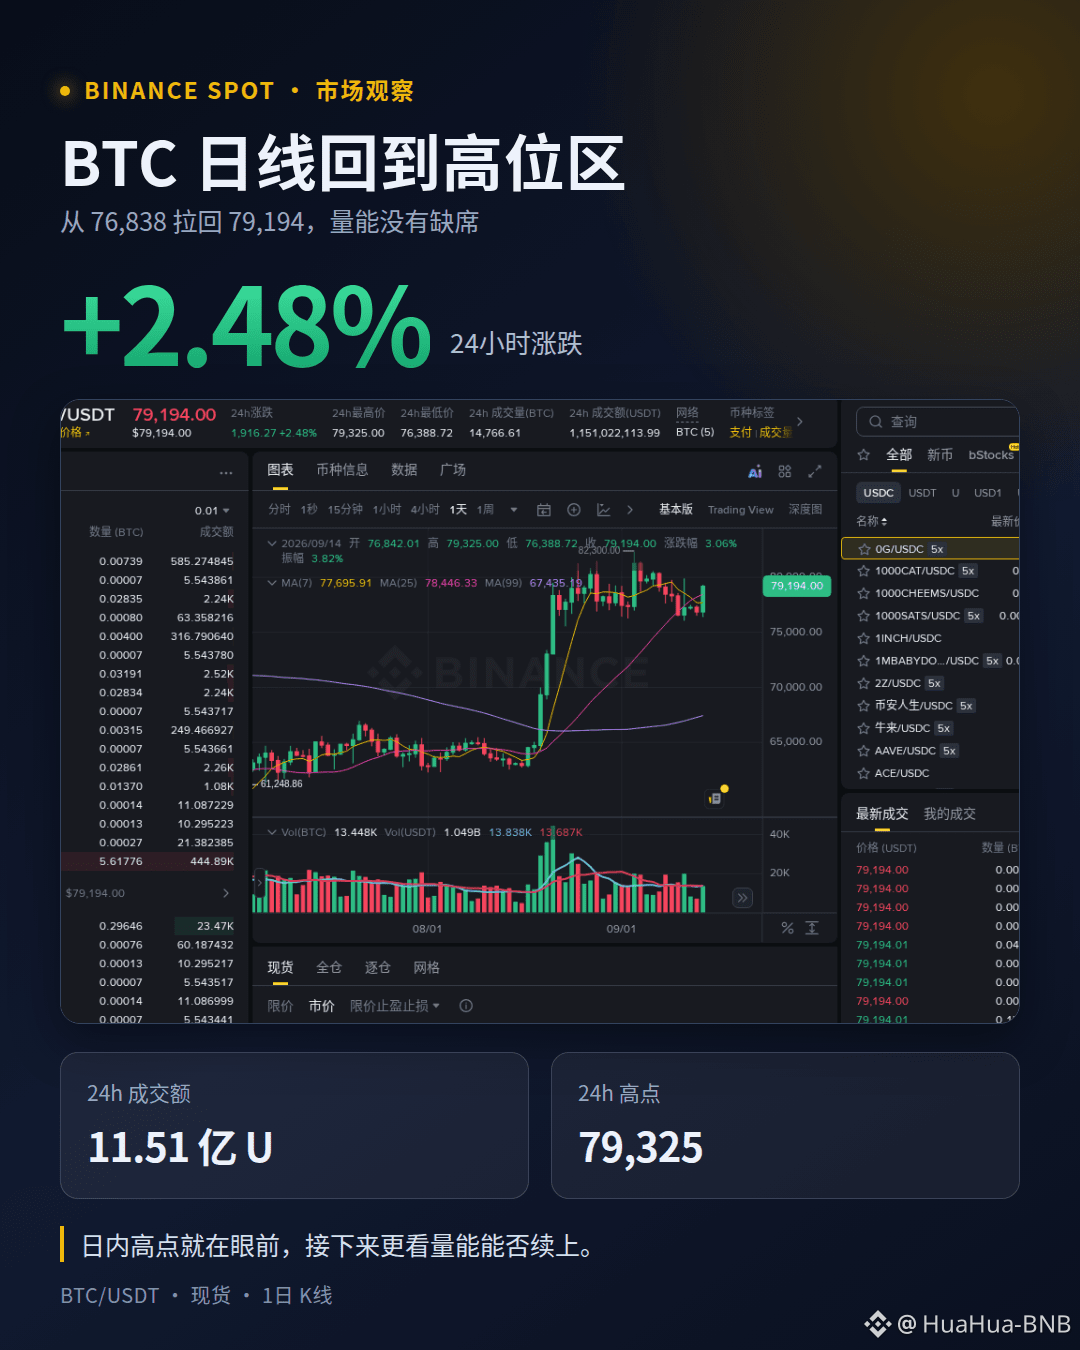
$BTC This daily candle isn’t a vertical surge, but it’s kind of interesting.
On the Binance spot page, BTC/USDT is currently at 79,194, up 2.48% over the past 24 hours, with trading volume of about 1.151 billion U; during the day it pulled back from 76,838, and the high has already touched 79,325.
What I’m watching isn’t just a simple “breakout,” but whether the volume near the high can keep up. If the volume can’t follow, it wouldn’t be surprising to surge and then fall back into the range again.
Observing the spot market only (excluding futures, leverage, or trading instructions). Short-term price action can still be volatile, with risks of a pullback after a run-up and reversals in the news.
Do you think this move will keep raising the overall base, or will it first wash out the chasing sentiment?
$BTC #BinanceSpot
$BTC This daily candle isn’t a vertical surge, but it’s kind of interesting.
On the Binance spot page, BTC/USDT is currently at 79,194, up 2.48% over the past 24 hours, with trading volume of about 1.151 billion U; during the day it pulled back from 76,838, and the high has already touched 79,325.
What I’m watching isn’t just a simple “breakout,” but whether the volume near the high can keep up. If the volume can’t follow, it wouldn’t be surprising to surge and then fall back into the range again.
Observing the spot market only (excluding futures, leverage, or trading instructions). Short-term price action can still be volatile, with risks of a pullback after a run-up and reversals in the news.
Do you think this move will keep raising the overall base, or will it first wash out the chasing sentiment?
$BTC #BinanceSpot
On the Binance spot page, BTC/USDT is currently at 79,194, up 2.48% over the past 24 hours, with trading volume of about 1.151 billion U; during the day it pulled back from 76,838, and the high has already touched 79,325.
What I’m watching isn’t just a simple “breakout,” but whether the volume near the high can keep up. If the volume can’t follow, it wouldn’t be surprising to surge and then fall back into the range again.
Observing the spot market only (excluding futures, leverage, or trading instructions). Short-term price action can still be volatile, with risks of a pullback after a run-up and reversals in the news.
Do you think this move will keep raising the overall base, or will it first wash out the chasing sentiment?
$BTC #BinanceSpot
339
·
--
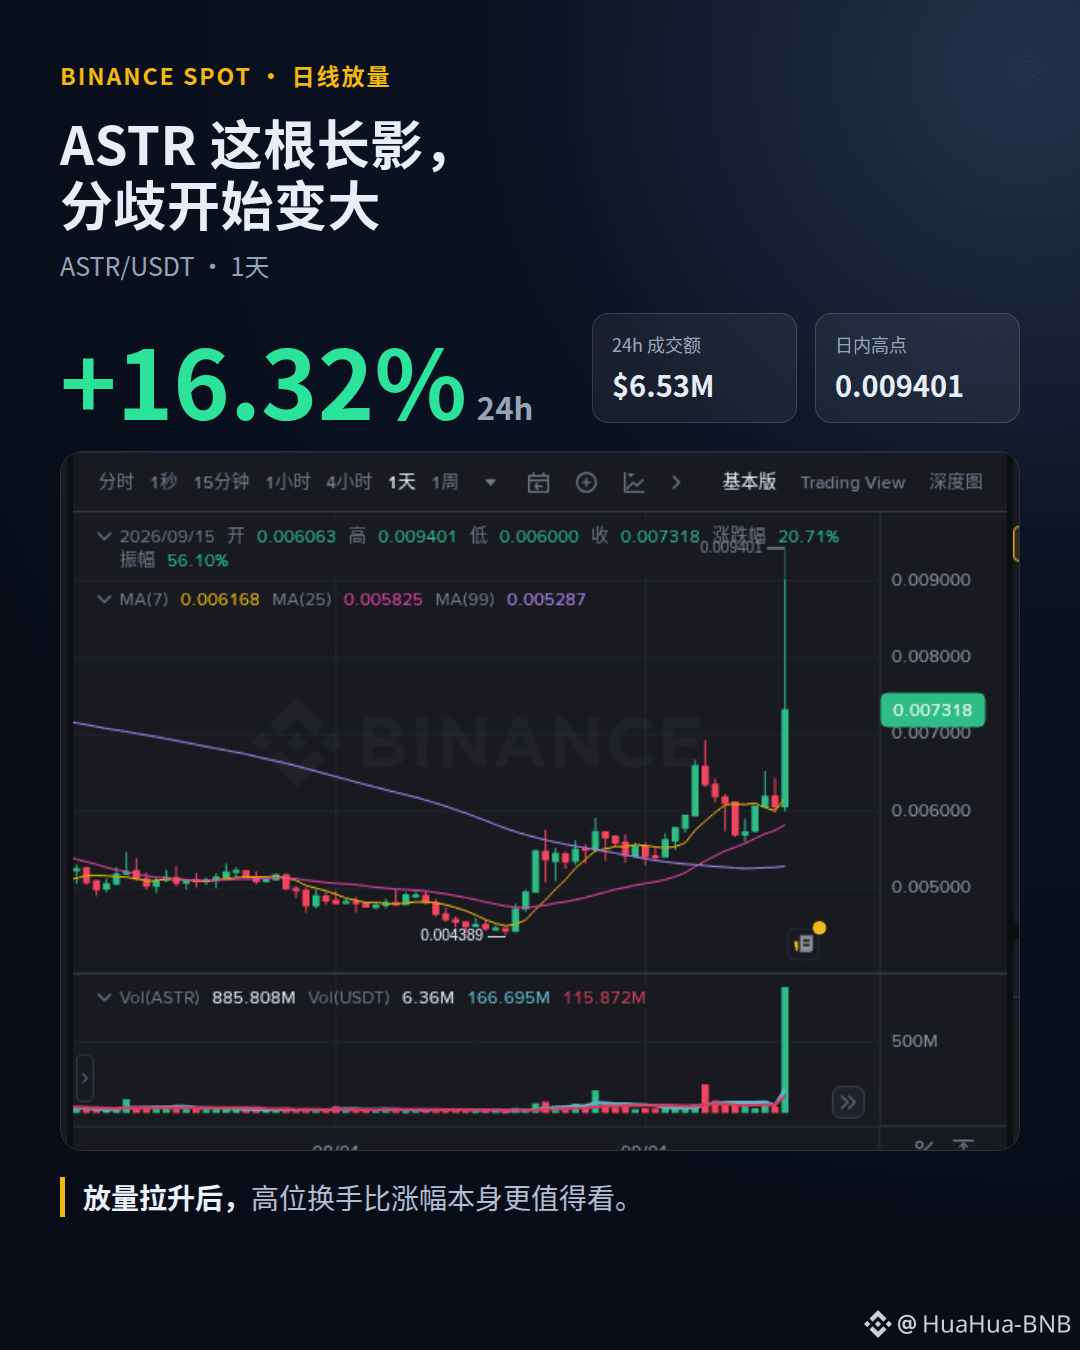
$ASTR This daily candle is the easiest place for people to get itchy hands today.
Binance Spot’s ASTR/USDT current price is about 0.007318, up +16.32% over the past 24 hours. The intraday high is 0.009401, and the traded value is around $6.53M. A long lower wick appearing together with increased volume suggests the disagreement is already not small.
I’ll watch whether it can stabilize the volatility after the surge in volume, not just whether it keeps rising. Chasing after the push is made—what’s most feared is mistaking heavy handoff/turnover at the highs for a trend confirmation.
This is spot-market observation only; it does not include trading instructions. There are risks including short-term volatility, chasing into a pullback, weakening volume, and message/news-driven reversals.
When you see this kind of high-volume long-wick candle, will you keep observing, or just swipe past it?
$ASTR #BinanceSpot
$ASTR This daily candle is the easiest place for people to get itchy hands today.
Binance Spot’s ASTR/USDT current price is about 0.007318, up +16.32% over the past 24 hours. The intraday high is 0.009401, and the traded value is around $6.53M. A long lower wick appearing together with increased volume suggests the disagreement is already not small.
I’ll watch whether it can stabilize the volatility after the surge in volume, not just whether it keeps rising. Chasing after the push is made—what’s most feared is mistaking heavy handoff/turnover at the highs for a trend confirmation.
This is spot-market observation only; it does not include trading instructions. There are risks including short-term volatility, chasing into a pullback, weakening volume, and message/news-driven reversals.
When you see this kind of high-volume long-wick candle, will you keep observing, or just swipe past it?
$ASTR #BinanceSpot
Binance Spot’s ASTR/USDT current price is about 0.007318, up +16.32% over the past 24 hours. The intraday high is 0.009401, and the traded value is around $6.53M. A long lower wick appearing together with increased volume suggests the disagreement is already not small.
I’ll watch whether it can stabilize the volatility after the surge in volume, not just whether it keeps rising. Chasing after the push is made—what’s most feared is mistaking heavy handoff/turnover at the highs for a trend confirmation.
This is spot-market observation only; it does not include trading instructions. There are risks including short-term volatility, chasing into a pullback, weakening volume, and message/news-driven reversals.
When you see this kind of high-volume long-wick candle, will you keep observing, or just swipe past it?
$ASTR #BinanceSpot
243
·
--
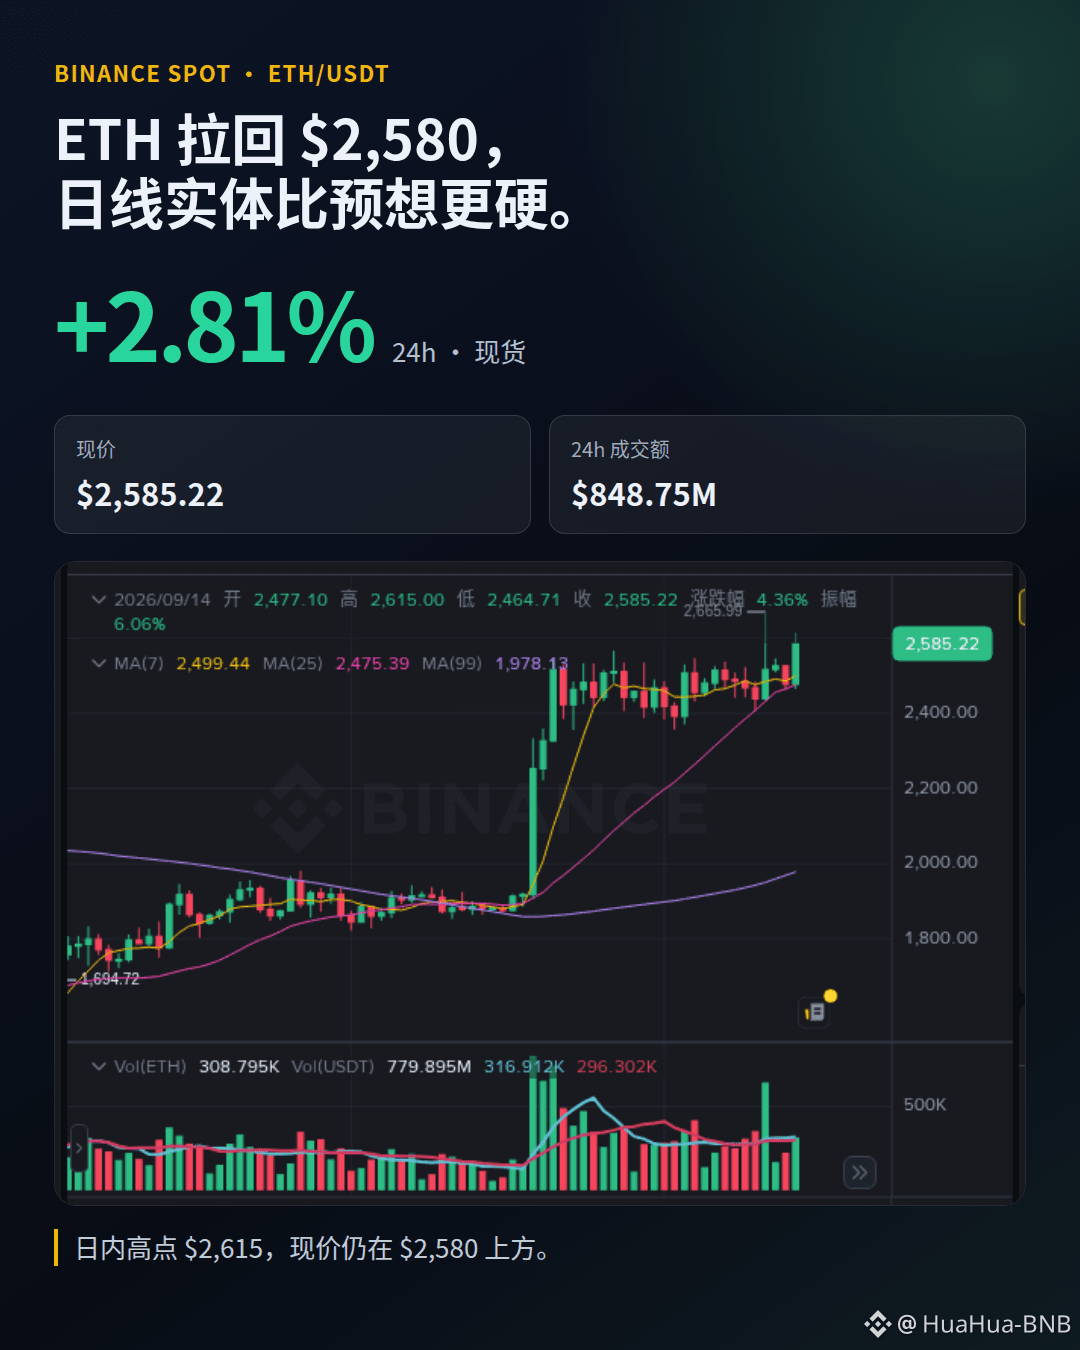
ETH This daily chart on the line is more interesting than looking only at the 24-hour percentage change.
On Binance’s spot ETH/USDT page, the current price is $2,585.22, with a 24h change of +2.81%. During the day it briefly touched $2,615, and the 24h trading volume is about $849 million. The daily body has already moved back above $2,580.
What I’m watching is whether, after ranging sideways at the high level, the trading volume can keep the momentum going. Pulling up quickly doesn’t mean it can keep pulling—what’s really hard is digesting the disagreement after the push to higher prices.
This is an observation of the spot market situation, not a trading instruction. Risks remain, including short-term price fluctuations, chasing and then pulling back, and news-driven reversals.
Do you think this ETH move looks more like a trend continuation, or like rotation and turnover at a high level?
$ETH #Ethereum #BinanceSpot
ETH This daily chart on the line is more interesting than looking only at the 24-hour percentage change.
On Binance’s spot ETH/USDT page, the current price is $2,585.22, with a 24h change of +2.81%. During the day it briefly touched $2,615, and the 24h trading volume is about $849 million. The daily body has already moved back above $2,580.
What I’m watching is whether, after ranging sideways at the high level, the trading volume can keep the momentum going. Pulling up quickly doesn’t mean it can keep pulling—what’s really hard is digesting the disagreement after the push to higher prices.
This is an observation of the spot market situation, not a trading instruction. Risks remain, including short-term price fluctuations, chasing and then pulling back, and news-driven reversals.
Do you think this ETH move looks more like a trend continuation, or like rotation and turnover at a high level?
$ETH #Ethereum #BinanceSpot
On Binance’s spot ETH/USDT page, the current price is $2,585.22, with a 24h change of +2.81%. During the day it briefly touched $2,615, and the 24h trading volume is about $849 million. The daily body has already moved back above $2,580.
What I’m watching is whether, after ranging sideways at the high level, the trading volume can keep the momentum going. Pulling up quickly doesn’t mean it can keep pulling—what’s really hard is digesting the disagreement after the push to higher prices.
This is an observation of the spot market situation, not a trading instruction. Risks remain, including short-term price fluctuations, chasing and then pulling back, and news-driven reversals.
Do you think this ETH move looks more like a trend continuation, or like rotation and turnover at a high level?
$ETH #Ethereum #BinanceSpot
93
·
--
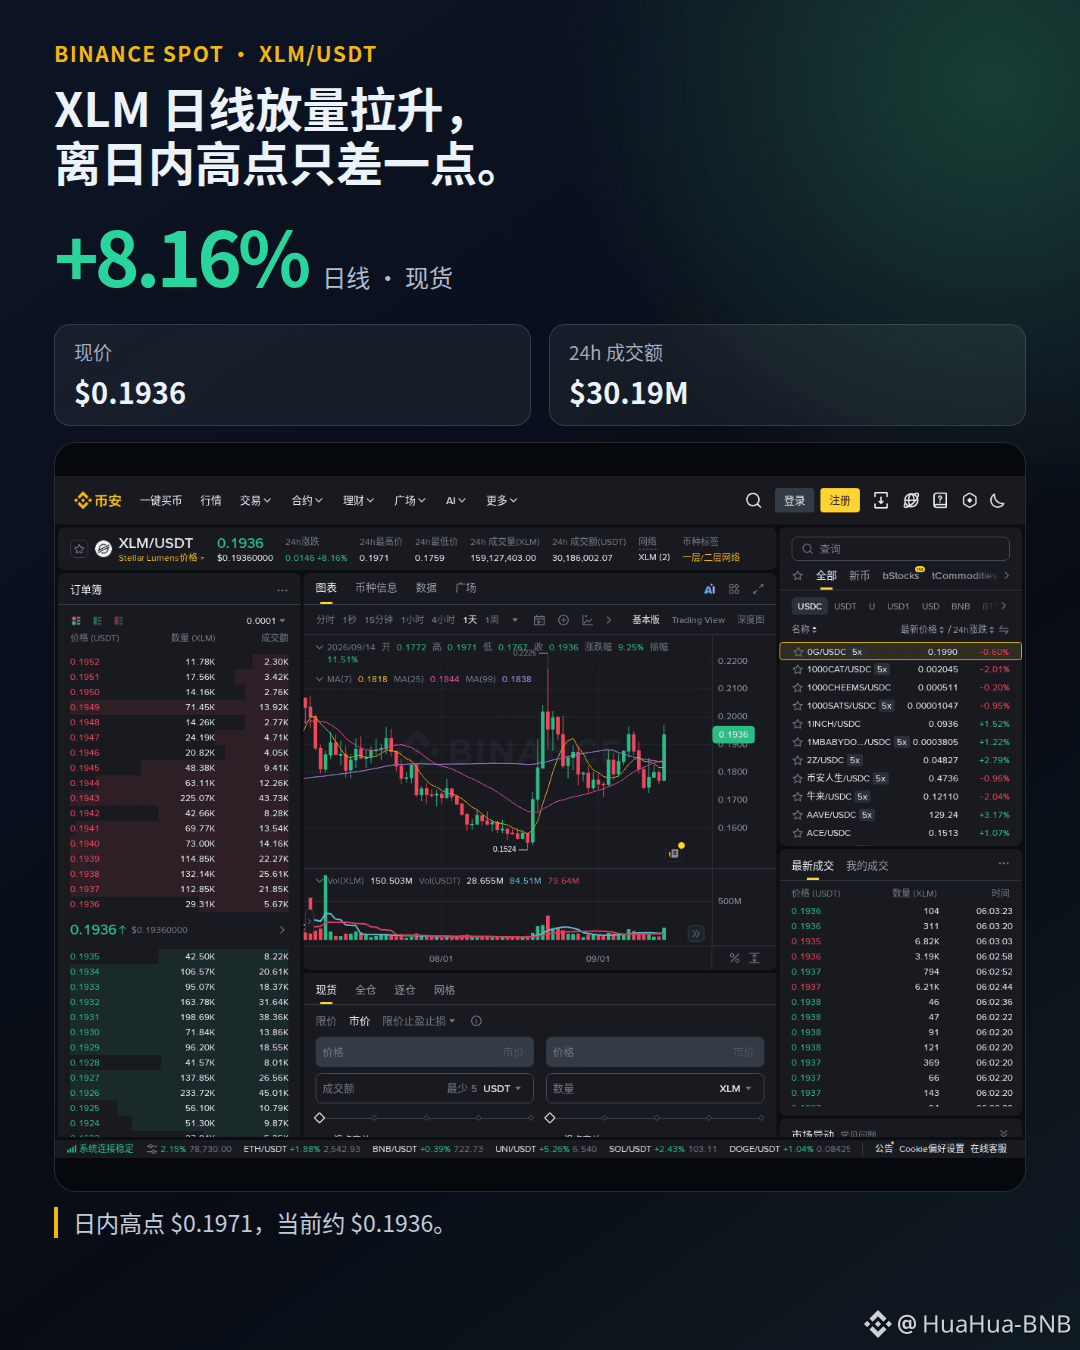
XLM—this daily candle has finally not quietly moved.
Binance spot same-page data: 24h +8.16%, current price $0.1936, 24h trading volume about $30.19M. The intraday high touched $0.1971—not far off.
What I’m watching is whether this volume-spike move can continue. Pulling the price up isn’t unusual; what matters is whether it can hold after the rally—this is what shows whether the move is sustained turnover, or just a short-lived market sentiment spike.
Spot market observation, not a trading instruction. In the short term, there are still risks of a push up followed by a pullback, weakening volume, and a reversal in the news backdrop.
Do you think this XLM move looks more like a catch-up rally, or just following the broader market to catch its breath?
$XLM #BinanceSpot #Stellar
XLM—this daily candle has finally not quietly moved.
Binance spot same-page data: 24h +8.16%, current price $0.1936, 24h trading volume about $30.19M. The intraday high touched $0.1971—not far off.
What I’m watching is whether this volume-spike move can continue. Pulling the price up isn’t unusual; what matters is whether it can hold after the rally—this is what shows whether the move is sustained turnover, or just a short-lived market sentiment spike.
Spot market observation, not a trading instruction. In the short term, there are still risks of a push up followed by a pullback, weakening volume, and a reversal in the news backdrop.
Do you think this XLM move looks more like a catch-up rally, or just following the broader market to catch its breath?
$XLM #BinanceSpot #Stellar
Binance spot same-page data: 24h +8.16%, current price $0.1936, 24h trading volume about $30.19M. The intraday high touched $0.1971—not far off.
What I’m watching is whether this volume-spike move can continue. Pulling the price up isn’t unusual; what matters is whether it can hold after the rally—this is what shows whether the move is sustained turnover, or just a short-lived market sentiment spike.
Spot market observation, not a trading instruction. In the short term, there are still risks of a push up followed by a pullback, weakening volume, and a reversal in the news backdrop.
Do you think this XLM move looks more like a catch-up rally, or just following the broader market to catch its breath?
$XLM #BinanceSpot #Stellar
189
·
--
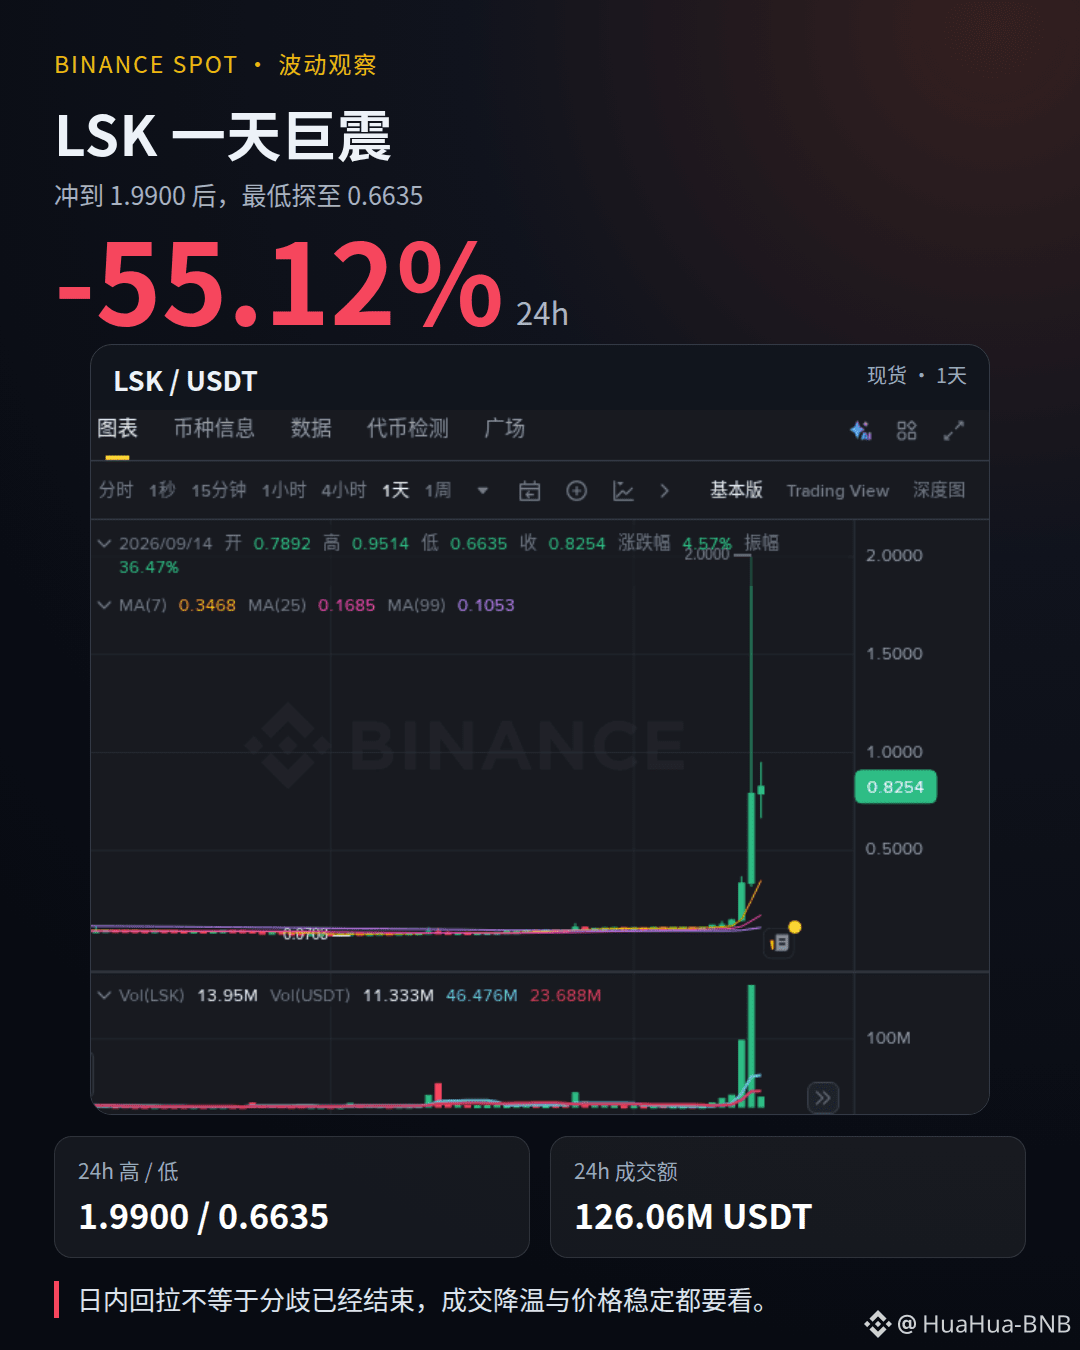
$LSK Today’s daily candle is more worth watching than the “gainers/losers board.”
On the Binance Spot page, the LSK/USDT 24-hour drop is about 55.12%, falling from 1.9900 to 0.6635, with approximately 126 million USDT in 24-hour trading volume. Intraday, it bounced back from the low point to 0.8253, but this feels more like disagreement after a massive liquidation shock—not something you can dismiss with a single “it bounced.”
I’ll first look to see whether subsequent trading activity continues to cool off. Once the price expands quickly driven by sentiment, pullbacks often don’t follow any logic. The page itself also includes risk-monitoring warnings—risks from chasing price, liquidity changes, and potential reversals in the news backdrop are still there.
When you see a long-wick massive shake like this, is your first reaction to look at trading volume, or to check whether the price can hold steady?
$LSK #BinanceSpot #High Volatility
$LSK Today’s daily candle is more worth watching than the “gainers/losers board.”
On the Binance Spot page, the LSK/USDT 24-hour drop is about 55.12%, falling from 1.9900 to 0.6635, with approximately 126 million USDT in 24-hour trading volume. Intraday, it bounced back from the low point to 0.8253, but this feels more like disagreement after a massive liquidation shock—not something you can dismiss with a single “it bounced.”
I’ll first look to see whether subsequent trading activity continues to cool off. Once the price expands quickly driven by sentiment, pullbacks often don’t follow any logic. The page itself also includes risk-monitoring warnings—risks from chasing price, liquidity changes, and potential reversals in the news backdrop are still there.
When you see a long-wick massive shake like this, is your first reaction to look at trading volume, or to check whether the price can hold steady?
$LSK #BinanceSpot #High Volatility
On the Binance Spot page, the LSK/USDT 24-hour drop is about 55.12%, falling from 1.9900 to 0.6635, with approximately 126 million USDT in 24-hour trading volume. Intraday, it bounced back from the low point to 0.8253, but this feels more like disagreement after a massive liquidation shock—not something you can dismiss with a single “it bounced.”
I’ll first look to see whether subsequent trading activity continues to cool off. Once the price expands quickly driven by sentiment, pullbacks often don’t follow any logic. The page itself also includes risk-monitoring warnings—risks from chasing price, liquidity changes, and potential reversals in the news backdrop are still there.
When you see a long-wick massive shake like this, is your first reaction to look at trading volume, or to check whether the price can hold steady?
$LSK #BinanceSpot #High Volatility
乱情:
阿祖收手机,不要玩山寨币
1
676
·
--
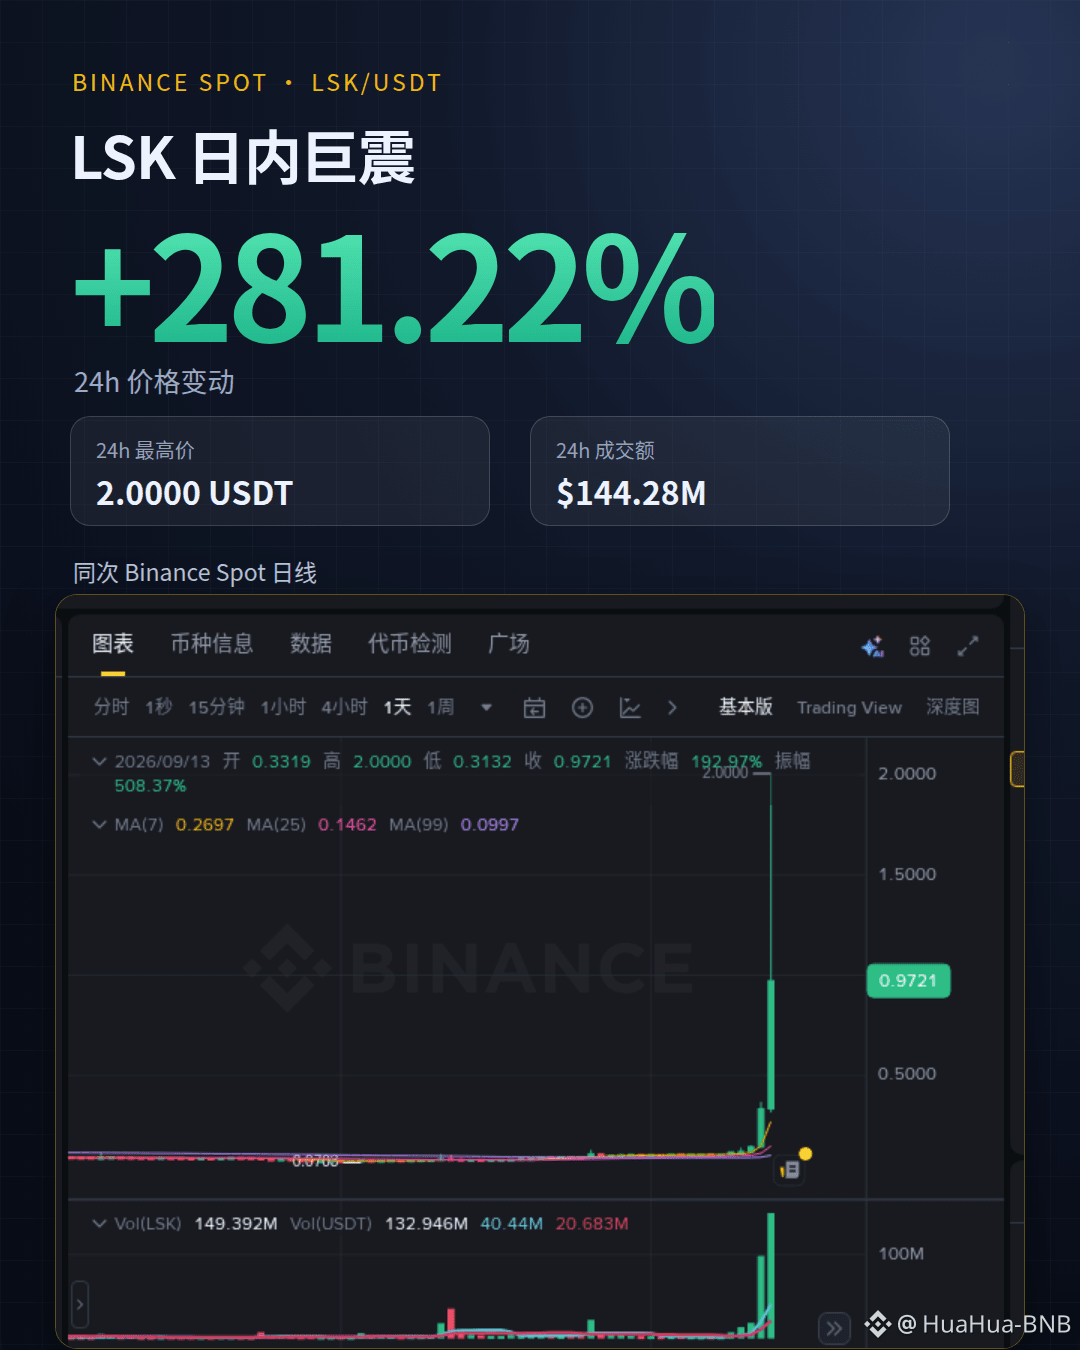
LSK’s daily candle today isn’t a normal surge.
Binance Spot same-period data: 24h +281.22%, peaking at 2.0000 USDT, with a 24h trading volume of 144 million USDT. After spiking up, it fell back to around 0.97—the intraday range has already expanded to 508.37%.
I’m treating this as a sample where both sentiment and liquidity are pushed to the limit. The upside is fierce, but the pullback hasn’t been polite either.
The page includes a risk monitoring notice. Risks such as high volatility, chasing and then seeing a drawdown, and message-driven reversals are all present—this isn’t a trading instruction.
In a market like this where one daily candle is pulled so straight up, would you look first at the trading volume, or first at the drawdown?
$LSK #BinanceSpot #high volatility
LSK’s daily candle today isn’t a normal surge.
Binance Spot same-period data: 24h +281.22%, peaking at 2.0000 USDT, with a 24h trading volume of 144 million USDT. After spiking up, it fell back to around 0.97—the intraday range has already expanded to 508.37%.
I’m treating this as a sample where both sentiment and liquidity are pushed to the limit. The upside is fierce, but the pullback hasn’t been polite either.
The page includes a risk monitoring notice. Risks such as high volatility, chasing and then seeing a drawdown, and message-driven reversals are all present—this isn’t a trading instruction.
In a market like this where one daily candle is pulled so straight up, would you look first at the trading volume, or first at the drawdown?
$LSK #BinanceSpot #high volatility
Binance Spot same-period data: 24h +281.22%, peaking at 2.0000 USDT, with a 24h trading volume of 144 million USDT. After spiking up, it fell back to around 0.97—the intraday range has already expanded to 508.37%.
I’m treating this as a sample where both sentiment and liquidity are pushed to the limit. The upside is fierce, but the pullback hasn’t been polite either.
The page includes a risk monitoring notice. Risks such as high volatility, chasing and then seeing a drawdown, and message-driven reversals are all present—this isn’t a trading instruction.
In a market like this where one daily candle is pulled so straight up, would you look first at the trading volume, or first at the drawdown?
$LSK #BinanceSpot #high volatility
732
·
--
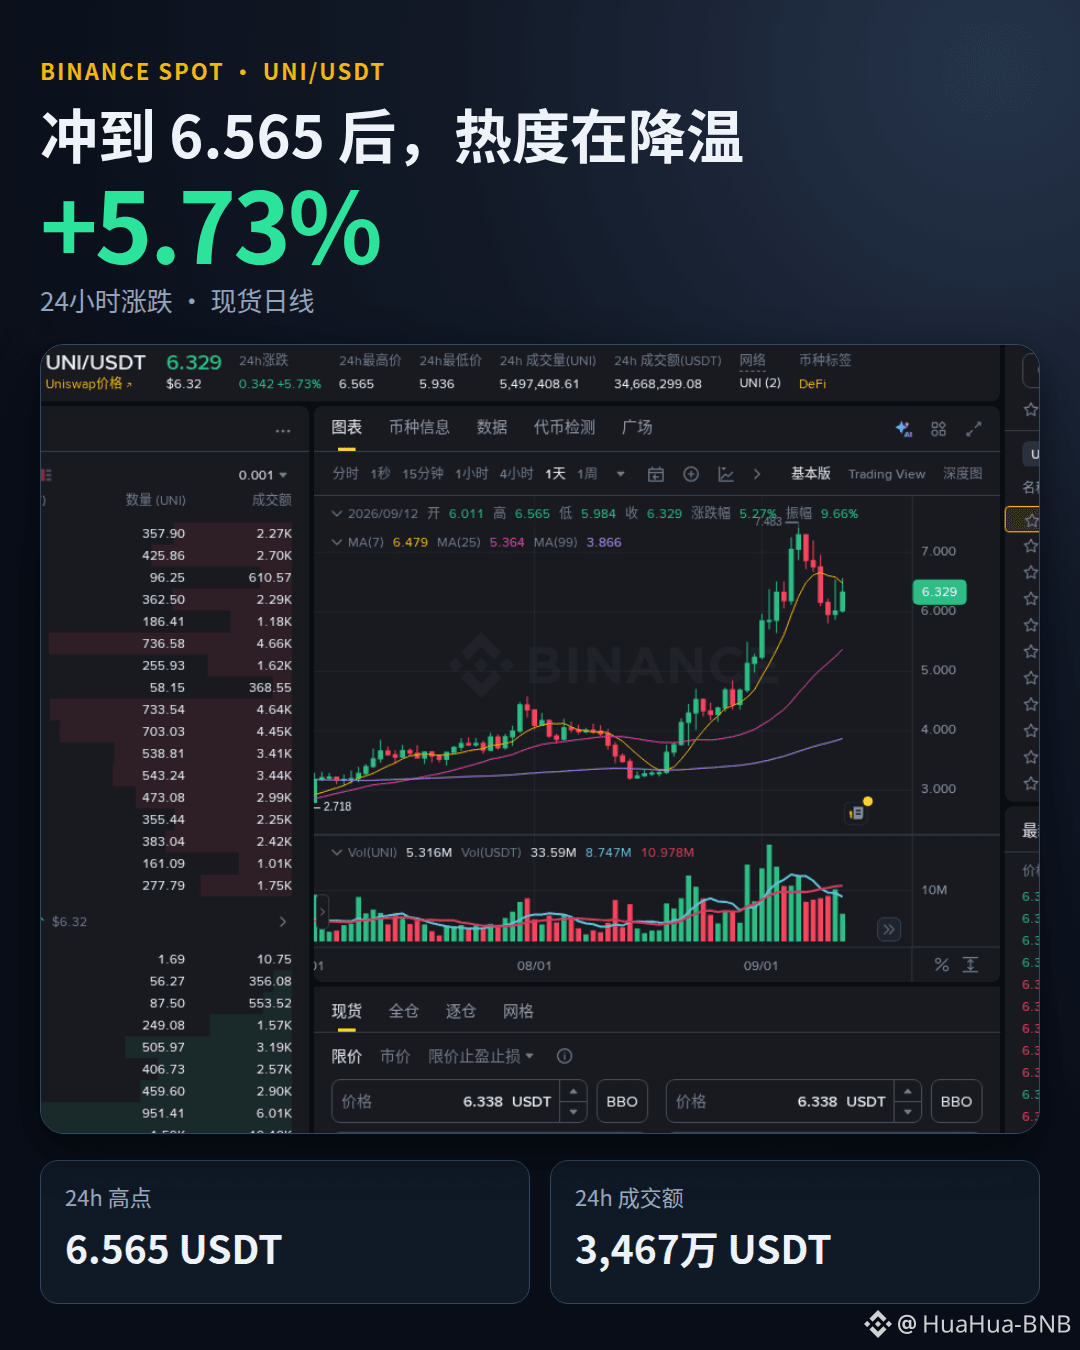
$UNI Today first push to 6.565, then return to 6.329. In the past 24 hours, it’s still up 5.73%, with trading volume of 34.67 million USDT.
The key point on this daily chart is not just a single acceleration bullish candle. After the spike, we saw pullback, indicating that disagreement has begun above 6.5. I’ll keep watching whether the volume can keep up—not treating the intraday gain as trend confirmation by itself.
Spot observation is not trading advice. Short-term volatility, chasing highs followed by pullbacks, and possible reversals from news are still in play.
Do you think this is just a washout and then it keeps going, or is the heat done for now?
$UNI #BinanceSpot #DeFi
$UNI Today first push to 6.565, then return to 6.329. In the past 24 hours, it’s still up 5.73%, with trading volume of 34.67 million USDT.
The key point on this daily chart is not just a single acceleration bullish candle. After the spike, we saw pullback, indicating that disagreement has begun above 6.5. I’ll keep watching whether the volume can keep up—not treating the intraday gain as trend confirmation by itself.
Spot observation is not trading advice. Short-term volatility, chasing highs followed by pullbacks, and possible reversals from news are still in play.
Do you think this is just a washout and then it keeps going, or is the heat done for now?
$UNI #BinanceSpot #DeFi
The key point on this daily chart is not just a single acceleration bullish candle. After the spike, we saw pullback, indicating that disagreement has begun above 6.5. I’ll keep watching whether the volume can keep up—not treating the intraday gain as trend confirmation by itself.
Spot observation is not trading advice. Short-term volatility, chasing highs followed by pullbacks, and possible reversals from news are still in play.
Do you think this is just a washout and then it keeps going, or is the heat done for now?
$UNI #BinanceSpot #DeFi
4
763
·
--
$HEMI Don’t rush to treat this rebound as “it’s back again.”
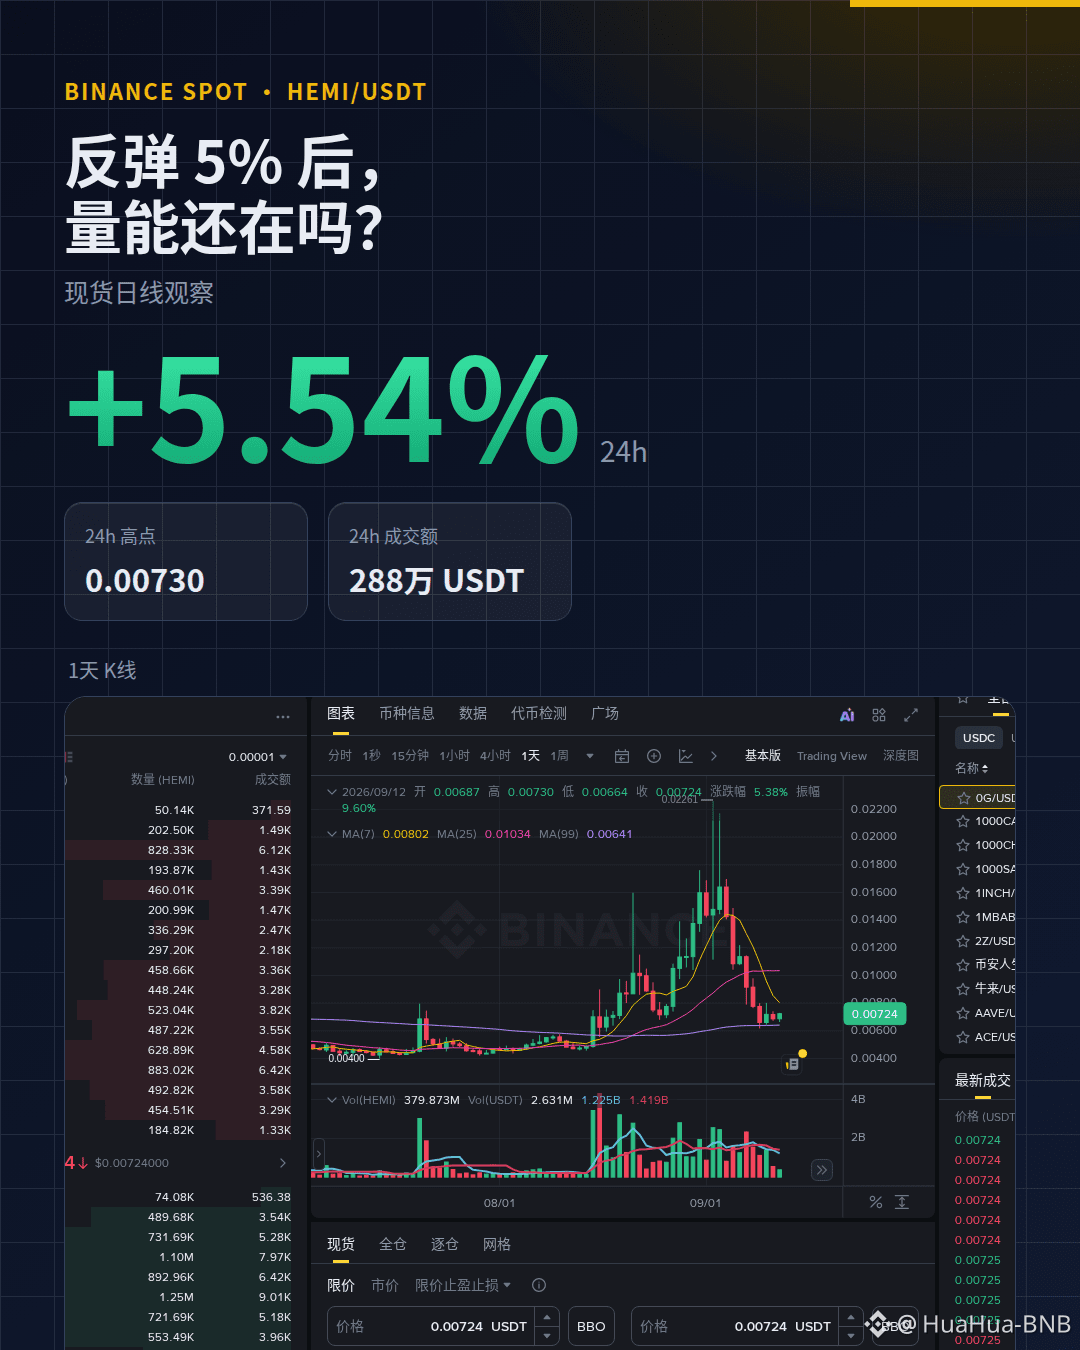
On Binance’s spot page: HEMI/USDT shows a 24h change of +5.54%. The current price is around 0.00724, the intraday high is 0.00730, and the 24h trading volume is about 2.88 million USDT.
What I’ll be watching is whether it can keep drawing support near the higher end of the day. The rebound after pulling back from the highs is pretty clear on the chart, but the price is still in a big-volatility zone—just looking at one green candle is enough to make you want to jump in.
The Binance page also warns that this coin is highly volatile and carries a “seed” label. Chasing price, changes in liquidity, and message/news reversals can all make the momentum flip very quickly.
Will you treat this kind of rebound as a repair signal, or just as a one-time sentiment pullback?
$HEMI #BinanceSpot
$HEMI Don’t rush to treat this rebound as “it’s back again.”
On Binance’s spot page: HEMI/USDT shows a 24h change of +5.54%. The current price is around 0.00724, the intraday high is 0.00730, and the 24h trading volume is about 2.88 million USDT.
What I’ll be watching is whether it can keep drawing support near the higher end of the day. The rebound after pulling back from the highs is pretty clear on the chart, but the price is still in a big-volatility zone—just looking at one green candle is enough to make you want to jump in.
The Binance page also warns that this coin is highly volatile and carries a “seed” label. Chasing price, changes in liquidity, and message/news reversals can all make the momentum flip very quickly.
Will you treat this kind of rebound as a repair signal, or just as a one-time sentiment pullback?
$HEMI #BinanceSpot
On Binance’s spot page: HEMI/USDT shows a 24h change of +5.54%. The current price is around 0.00724, the intraday high is 0.00730, and the 24h trading volume is about 2.88 million USDT.
What I’ll be watching is whether it can keep drawing support near the higher end of the day. The rebound after pulling back from the highs is pretty clear on the chart, but the price is still in a big-volatility zone—just looking at one green candle is enough to make you want to jump in.
The Binance page also warns that this coin is highly volatile and carries a “seed” label. Chasing price, changes in liquidity, and message/news reversals can all make the momentum flip very quickly.
Will you treat this kind of rebound as a repair signal, or just as a one-time sentiment pullback?
$HEMI #BinanceSpot
273
·
--
LSK This daily candle is no longer a quiet rebound.
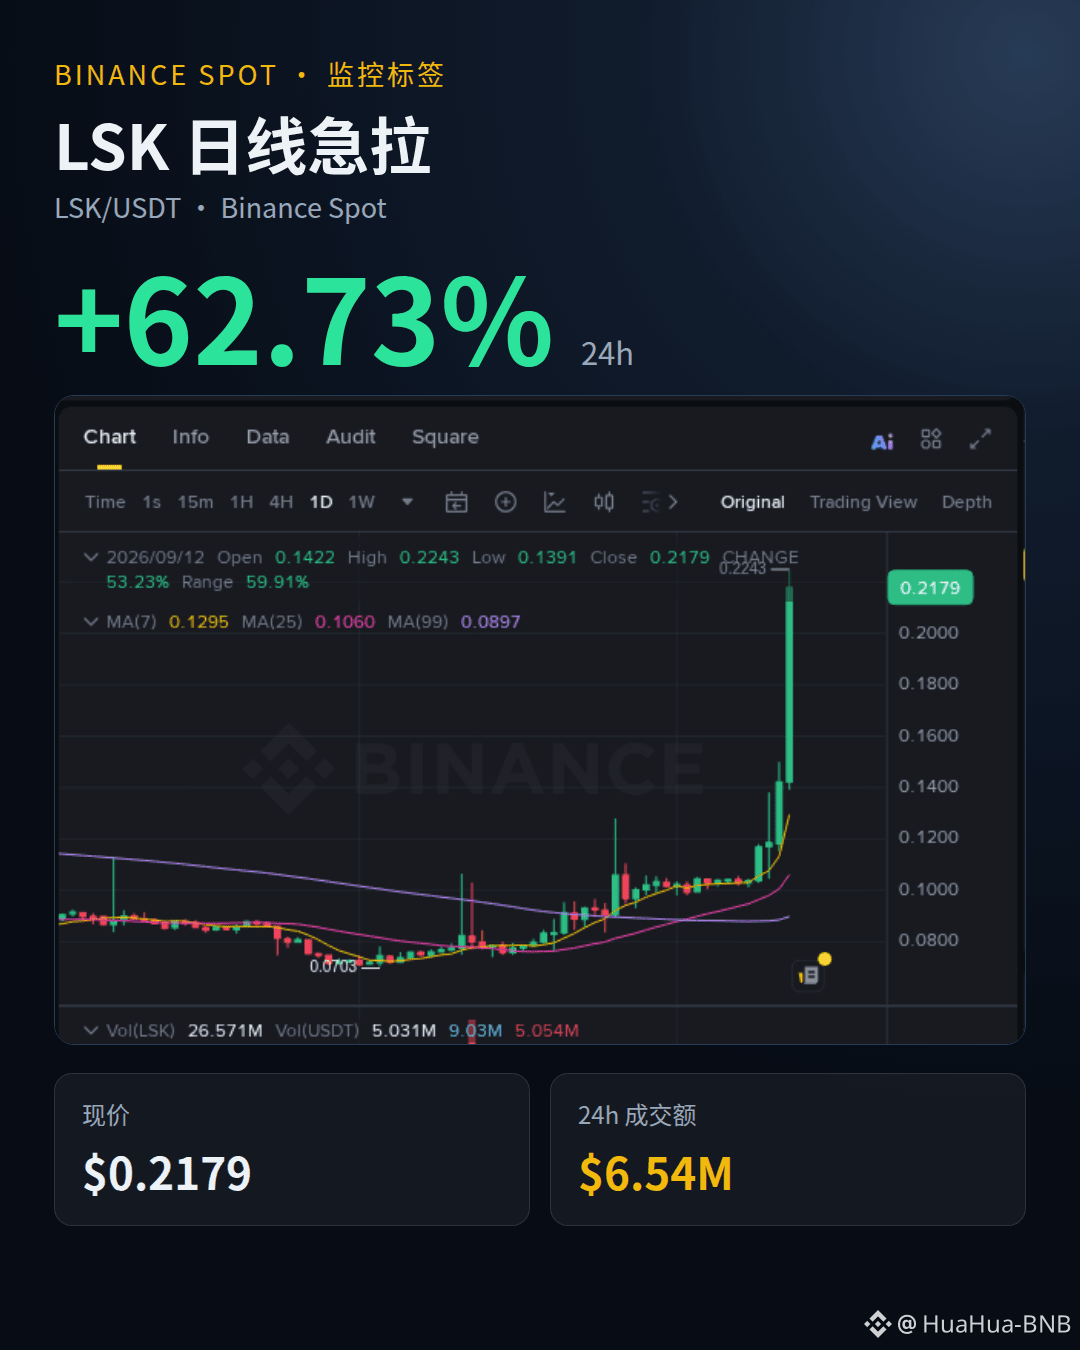
On the Binance spot page, LSK/USDT is up 62.73% in the last 24 hours, with the current price at $0.2179 and about $6.54M in 24-hour trading volume. The daily chart shows a steep straight-line surge—price is already close to the intraday high of $0.2243.
I’ll treat it first as a sample of sentiment and volatility, and I won’t chase just because there’s a big bullish candle. Whether volume can keep following through—whether there’s support after the push to higher prices—is what’s worth watching next.
The page includes a Monitoring tag, which means both risk and volatility are higher. Chasing after a spike, a sudden drawdown, changes in liquidity, and reversals in the news cycle can all come very quickly.
With this kind of straight-line rally, will you keep watching for the order-book support/continuation, or will you move on as soon as you see the Monitoring tag?
$LSK #BinanceSpot #High volatility
LSK This daily candle is no longer a quiet rebound.
On the Binance spot page, LSK/USDT is up 62.73% in the last 24 hours, with the current price at $0.2179 and about $6.54M in 24-hour trading volume. The daily chart shows a steep straight-line surge—price is already close to the intraday high of $0.2243.
I’ll treat it first as a sample of sentiment and volatility, and I won’t chase just because there’s a big bullish candle. Whether volume can keep following through—whether there’s support after the push to higher prices—is what’s worth watching next.
The page includes a Monitoring tag, which means both risk and volatility are higher. Chasing after a spike, a sudden drawdown, changes in liquidity, and reversals in the news cycle can all come very quickly.
With this kind of straight-line rally, will you keep watching for the order-book support/continuation, or will you move on as soon as you see the Monitoring tag?
$LSK #BinanceSpot #High volatility
On the Binance spot page, LSK/USDT is up 62.73% in the last 24 hours, with the current price at $0.2179 and about $6.54M in 24-hour trading volume. The daily chart shows a steep straight-line surge—price is already close to the intraday high of $0.2243.
I’ll treat it first as a sample of sentiment and volatility, and I won’t chase just because there’s a big bullish candle. Whether volume can keep following through—whether there’s support after the push to higher prices—is what’s worth watching next.
The page includes a Monitoring tag, which means both risk and volatility are higher. Chasing after a spike, a sudden drawdown, changes in liquidity, and reversals in the news cycle can all come very quickly.
With this kind of straight-line rally, will you keep watching for the order-book support/continuation, or will you move on as soon as you see the Monitoring tag?
$LSK #BinanceSpot #High volatility
213
·
--
RAY: This daily candle just touched $1.5843 and bounced back to $1.4968—buyers chasing the breakout and those waiting to sell off are now sitting at the same table.
On Binance’s spot RAY/USDT page, the 24-hour gain is +23.86%, with trading volume around 27.5449 million U. The candlestick is surging quickly and volume has also expanded, but near the high there are already signs of profit-taking. For now, I’d rather see whether it can hold onto the volume than just focus on the percentage gain.
Spot market check—no trading instructions included. Risks to watch include short-term volatility, pullbacks after chasing higher, declining volume, and potential reversals in the news flow.
When you see this kind of acceleration followed by profit-taking, do you look first at the trading volume, or first at whether the price can reclaim the high?
$RAY #Solana #BinanceSpot
RAY: This daily candle just touched $1.5843 and bounced back to $1.4968—buyers chasing the breakout and those waiting to sell off are now sitting at the same table.
On Binance’s spot RAY/USDT page, the 24-hour gain is +23.86%, with trading volume around 27.5449 million U. The candlestick is surging quickly and volume has also expanded, but near the high there are already signs of profit-taking. For now, I’d rather see whether it can hold onto the volume than just focus on the percentage gain.
Spot market check—no trading instructions included. Risks to watch include short-term volatility, pullbacks after chasing higher, declining volume, and potential reversals in the news flow.
When you see this kind of acceleration followed by profit-taking, do you look first at the trading volume, or first at whether the price can reclaim the high?
$RAY #Solana #BinanceSpot
On Binance’s spot RAY/USDT page, the 24-hour gain is +23.86%, with trading volume around 27.5449 million U. The candlestick is surging quickly and volume has also expanded, but near the high there are already signs of profit-taking. For now, I’d rather see whether it can hold onto the volume than just focus on the percentage gain.
Spot market check—no trading instructions included. Risks to watch include short-term volatility, pullbacks after chasing higher, declining volume, and potential reversals in the news flow.
When you see this kind of acceleration followed by profit-taking, do you look first at the trading volume, or first at whether the price can reclaim the high?
$RAY #Solana #BinanceSpot

1
247

·
--
Partly True
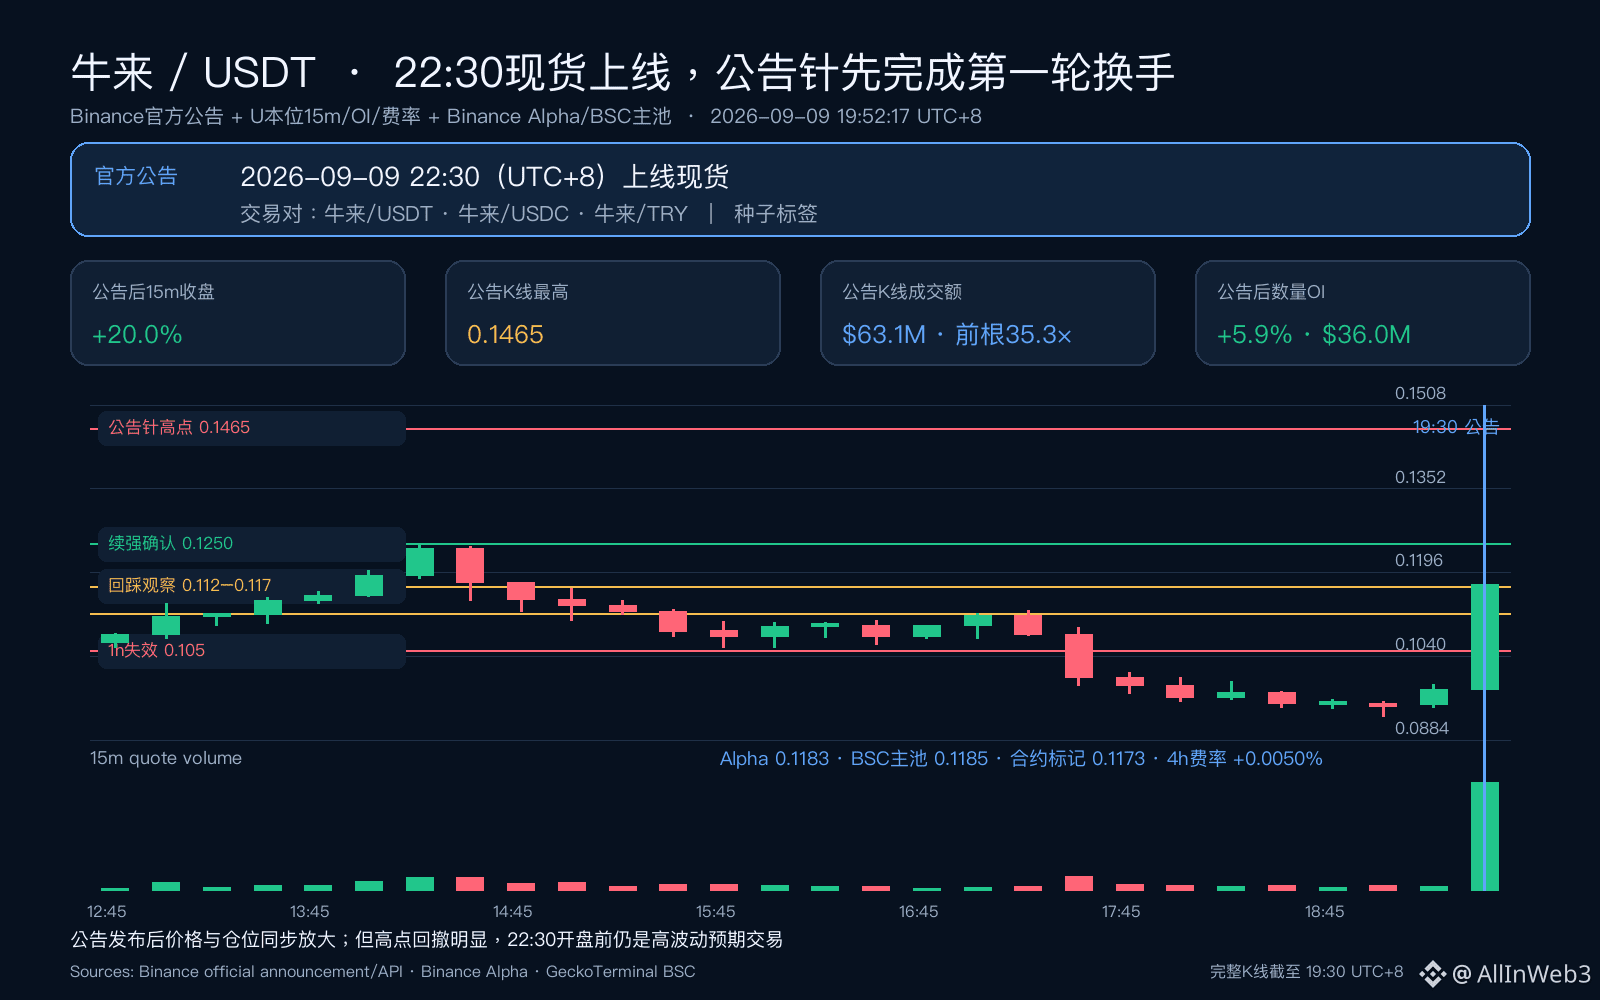
I’m seeing more hype in the emotions around the news being fulfilled, but I won’t chase this needle-like rumor. The direct catalyst for the short-term rally has already been confirmed: Binance officially announced that it will list spot trading tonight at 22:30. Spot pairs will be opened for <牛来>/USDT, <牛来>/USDC, and <牛来>/TRY, and a seed tag will be added.
After the announcement was published at 19:30, the same 15-minute contract candlestick surged from 0.09784 to a high of 0.14650, then closed at 0.11743—up 20.0%. Trading volume was about $63.13 million, which is 35.3 times that of the previous candle. More importantly, after the announcement, OI (open interest) still increased by 5.9% to around 307 million coins, indicating this isn’t just shorts passively covering; there’s also fresh buying and new positions being opened. Alpha, the BSC main pool, and the marked contract price are currently clustered around 0.117–0.118, with basically consistent sources.
I only look for two types of participation signals: a pullback to 0.112–0.117 that holds with shrinking volume, and with two consecutive 15-minute candles forming higher lows; or a 15-minute surge in volume that closes above 0.125, followed by holding for the next hour. If the 1-hour close breaks below 0.105, the strengthening structure formed after the announcement fails. Around the start of trading at 22:30, closely watch the spot’s first-hour trading volume and the spread versus the contract price—if the spread suddenly widens, wait for turnover/rotation first. #牛来 #BinanceSpot #BNBChain #Market Structure
I’m seeing more hype in the emotions around the news being fulfilled, but I won’t chase this needle-like rumor. The direct catalyst for the short-term rally has already been confirmed: Binance officially announced that it will list spot trading tonight at 22:30. Spot pairs will be opened for <牛来>/USDT, <牛来>/USDC, and <牛来>/TRY, and a seed tag will be added.
After the announcement was published at 19:30, the same 15-minute contract candlestick surged from 0.09784 to a high of 0.14650, then closed at 0.11743—up 20.0%. Trading volume was about $63.13 million, which is 35.3 times that of the previous candle. More importantly, after the announcement, OI (open interest) still increased by 5.9% to around 307 million coins, indicating this isn’t just shorts passively covering; there’s also fresh buying and new positions being opened. Alpha, the BSC main pool, and the marked contract price are currently clustered around 0.117–0.118, with basically consistent sources.
I only look for two types of participation signals: a pullback to 0.112–0.117 that holds with shrinking volume, and with two consecutive 15-minute candles forming higher lows; or a 15-minute surge in volume that closes above 0.125, followed by holding for the next hour. If the 1-hour close breaks below 0.105, the strengthening structure formed after the announcement fails. Around the start of trading at 22:30, closely watch the spot’s first-hour trading volume and the spread versus the contract price—if the spread suddenly widens, wait for turnover/rotation first. #牛来 #BinanceSpot #BNBChain #Market Structure
After the announcement was published at 19:30, the same 15-minute contract candlestick surged from 0.09784 to a high of 0.14650, then closed at 0.11743—up 20.0%. Trading volume was about $63.13 million, which is 35.3 times that of the previous candle. More importantly, after the announcement, OI (open interest) still increased by 5.9% to around 307 million coins, indicating this isn’t just shorts passively covering; there’s also fresh buying and new positions being opened. Alpha, the BSC main pool, and the marked contract price are currently clustered around 0.117–0.118, with basically consistent sources.
I only look for two types of participation signals: a pullback to 0.112–0.117 that holds with shrinking volume, and with two consecutive 15-minute candles forming higher lows; or a 15-minute surge in volume that closes above 0.125, followed by holding for the next hour. If the 1-hour close breaks below 0.105, the strengthening structure formed after the announcement fails. Around the start of trading at 22:30, closely watch the spot’s first-hour trading volume and the spread versus the contract price—if the spread suddenly widens, wait for turnover/rotation first. #牛来 #BinanceSpot #BNBChain #Market Structure
1
213
Log in to explore more content
Join global crypto users on Binance Square
⚡️ Get latest and useful information about crypto.
💬 Trusted by the world’s largest crypto exchange.
👍 Discover real insights from verified creators.
Email / Phone number
Trending Topics
1
#FedRateWatch
947,540 views
4,569 Discussing
2
#MSTRTradingVolumeSurpassesMorganStanley
4,404 views
186 Discussing
3
#BitcoinFalls4%
13,066 views
440 Discussing
4
#SKHynixInTalksToMakeMemoryChipsInUS
5,219 views
161 Discussing
5
#OpenAIDiscussesNewFundingAt$1.2TValuation
2,073 views
38 Discussing
6
#ArgentinaCommitsToOECDCryptoReportingBy2029
14,908 views
342 Discussing
7
#EthereumFallsBelow$2400
6,034 views
87 Discussing
8
#USDTLaunchesOnZamaPrivacyProtocol
5,980 views
189 Discussing
9
#USSenateBlocksClarityAct
49,416 views
463 Discussing
10
#BitcoinSlidesTo$76000
39,390 views
179 Discussing