
#be
be
87,133 views
899 Discussing
Hot
Latest

·
--
See translation
We are waiting for price to tap our exact trigger zone. The blueprint for a potential $BE short is now active.
⚡ $BE — SHORT SETUP
📍 Entry: 279.01 – 280.68
🎯 TP1: 275.68
🎯 TP2: 273.45
🎯 TP3: 270.12
🛑 Stop Loss: 282.35
Trade here 👇
📌 Trade management rules: see pinned post.
Are you looking for further downside on $BE here, or expecting a bounce? Drop your outlook below!
#WriteToEarn #BE #CryptoTrading #BinanceSquare #Crypto
We are waiting for price to tap our exact trigger zone. The blueprint for a potential $BE short is now active.
⚡ $BE — SHORT SETUP
📍 Entry: 279.01 – 280.68
🎯 TP1: 275.68
🎯 TP2: 273.45
🎯 TP3: 270.12
🛑 Stop Loss: 282.35
Trade here 👇
📌 Trade management rules: see pinned post.
Are you looking for further downside on $BE here, or expecting a bounce? Drop your outlook below!
#WriteToEarn #BE #CryptoTrading #BinanceSquare #Crypto
⚡ $BE — SHORT SETUP
📍 Entry: 279.01 – 280.68
🎯 TP1: 275.68
🎯 TP2: 273.45
🎯 TP3: 270.12
🛑 Stop Loss: 282.35
Trade here 👇
📌 Trade management rules: see pinned post.
Are you looking for further downside on $BE here, or expecting a bounce? Drop your outlook below!
#WriteToEarn #BE #CryptoTrading #BinanceSquare #Crypto
1
55

·
--
See translation
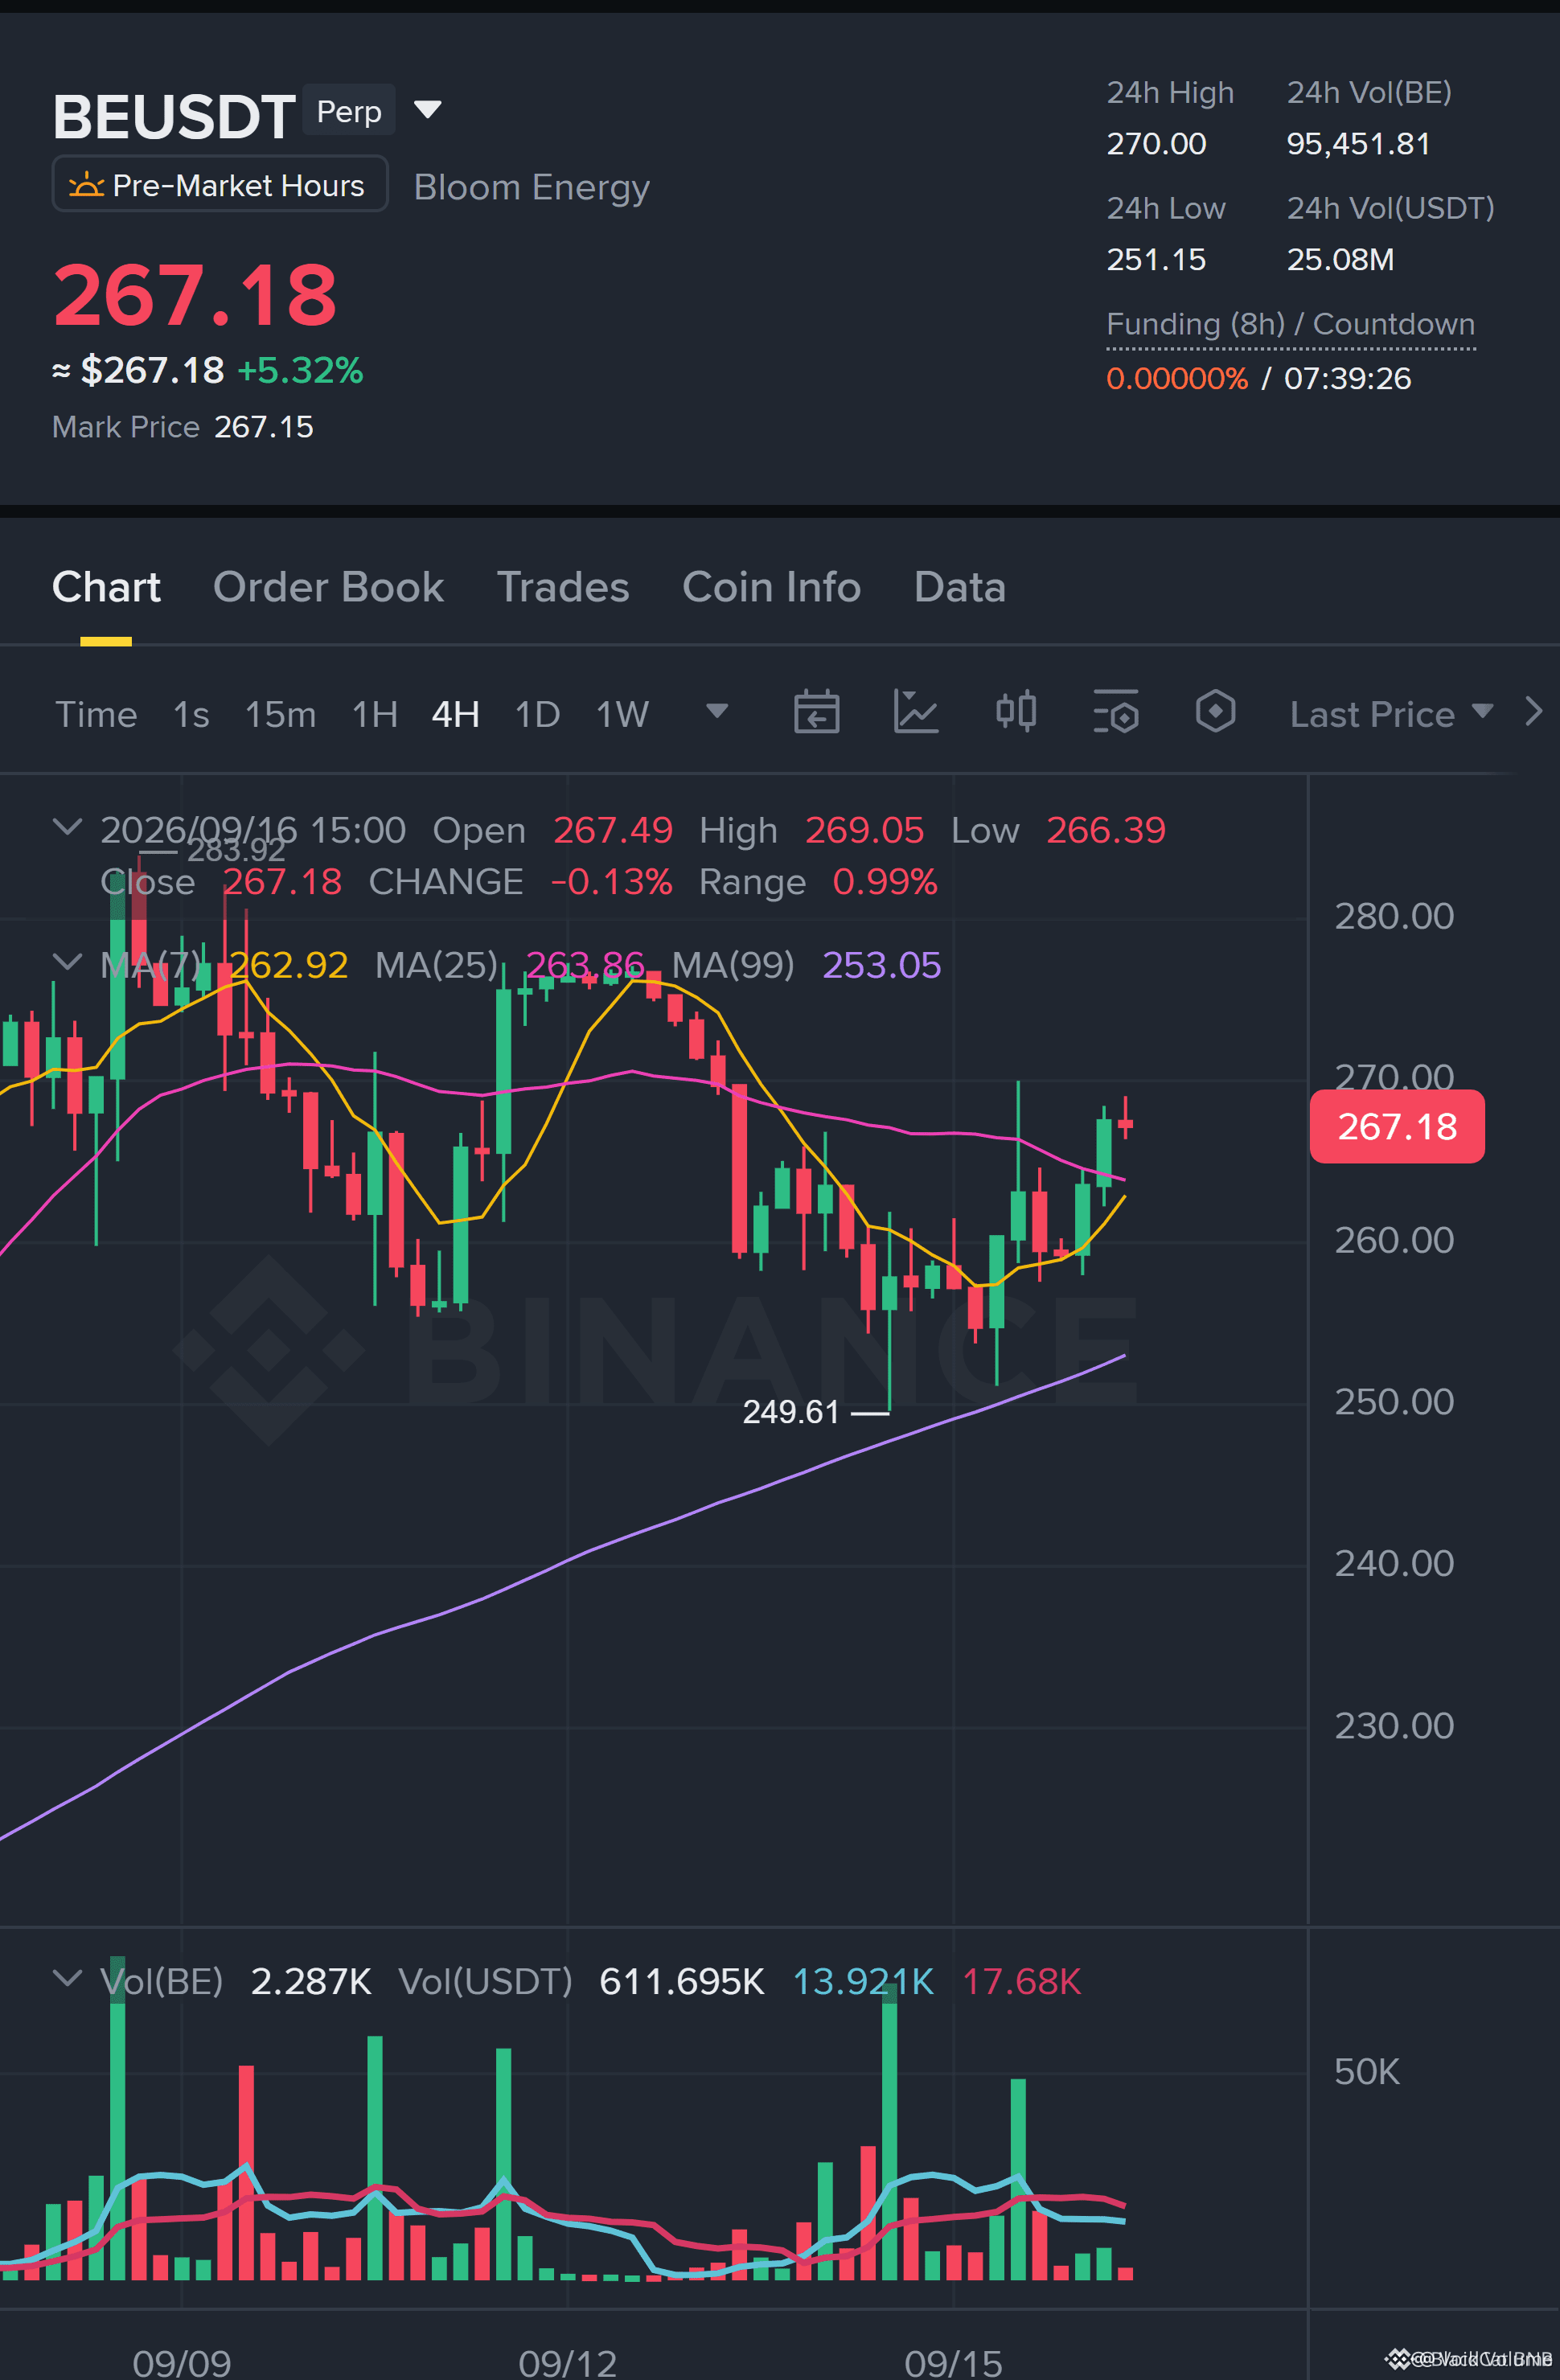
🚨 $BE WATCHLIST: CAN 1H DEMAND RECLAIM TRIGGER $275.29? 🦈
Entry: 264.96-265.37 ⚡
Target: 268.45 / 270 / 275.29 🚀
Stop Loss: 261.9 ⚠️
📌 This is a watchlist long, not a chase: $BE needs a clean 1H reclaim of 264.96-265.37 before the order block has any edge. 🦈 The 261.9 stop keeps risk tight while TP3 at 275.29 offers a 3.11R payoff.
📊 The conflict with the $BTC 4H filter matters—without higher-timeframe confirmation, this is only a liquidity hunt setup, not a directional call. Scale out 20% / 30% / 50% if price respects the zone. 💬 Will you wait for a confirmed 1H close above the demand, or fade it into another sweep below 261.9?
⚠️ Not financial advice. Always manage your risk. 🛡️
🏷️ #BE #LongSetup #1H #SmartMoney #Crypto
🎯 🦈
🚨 $BE WATCHLIST: CAN 1H DEMAND RECLAIM TRIGGER $275.29? 🦈
Entry: 264.96-265.37 ⚡
Target: 268.45 / 270 / 275.29 🚀
Stop Loss: 261.9 ⚠️
📌 This is a watchlist long, not a chase: $BE needs a clean 1H reclaim of 264.96-265.37 before the order block has any edge. 🦈 The 261.9 stop keeps risk tight while TP3 at 275.29 offers a 3.11R payoff.
📊 The conflict with the $BTC 4H filter matters—without higher-timeframe confirmation, this is only a liquidity hunt setup, not a directional call. Scale out 20% / 30% / 50% if price respects the zone. 💬 Will you wait for a confirmed 1H close above the demand, or fade it into another sweep below 261.9?
⚠️ Not financial advice. Always manage your risk. 🛡️
🏷️ #BE #LongSetup #1H #SmartMoney #Crypto
🎯 🦈
Entry: 264.96-265.37 ⚡
Target: 268.45 / 270 / 275.29 🚀
Stop Loss: 261.9 ⚠️
📌 This is a watchlist long, not a chase: $BE needs a clean 1H reclaim of 264.96-265.37 before the order block has any edge. 🦈 The 261.9 stop keeps risk tight while TP3 at 275.29 offers a 3.11R payoff.
📊 The conflict with the $BTC 4H filter matters—without higher-timeframe confirmation, this is only a liquidity hunt setup, not a directional call. Scale out 20% / 30% / 50% if price respects the zone. 💬 Will you wait for a confirmed 1H close above the demand, or fade it into another sweep below 261.9?
⚠️ Not financial advice. Always manage your risk. 🛡️
🏷️ #BE #LongSetup #1H #SmartMoney #Crypto
🎯 🦈
33

See translation
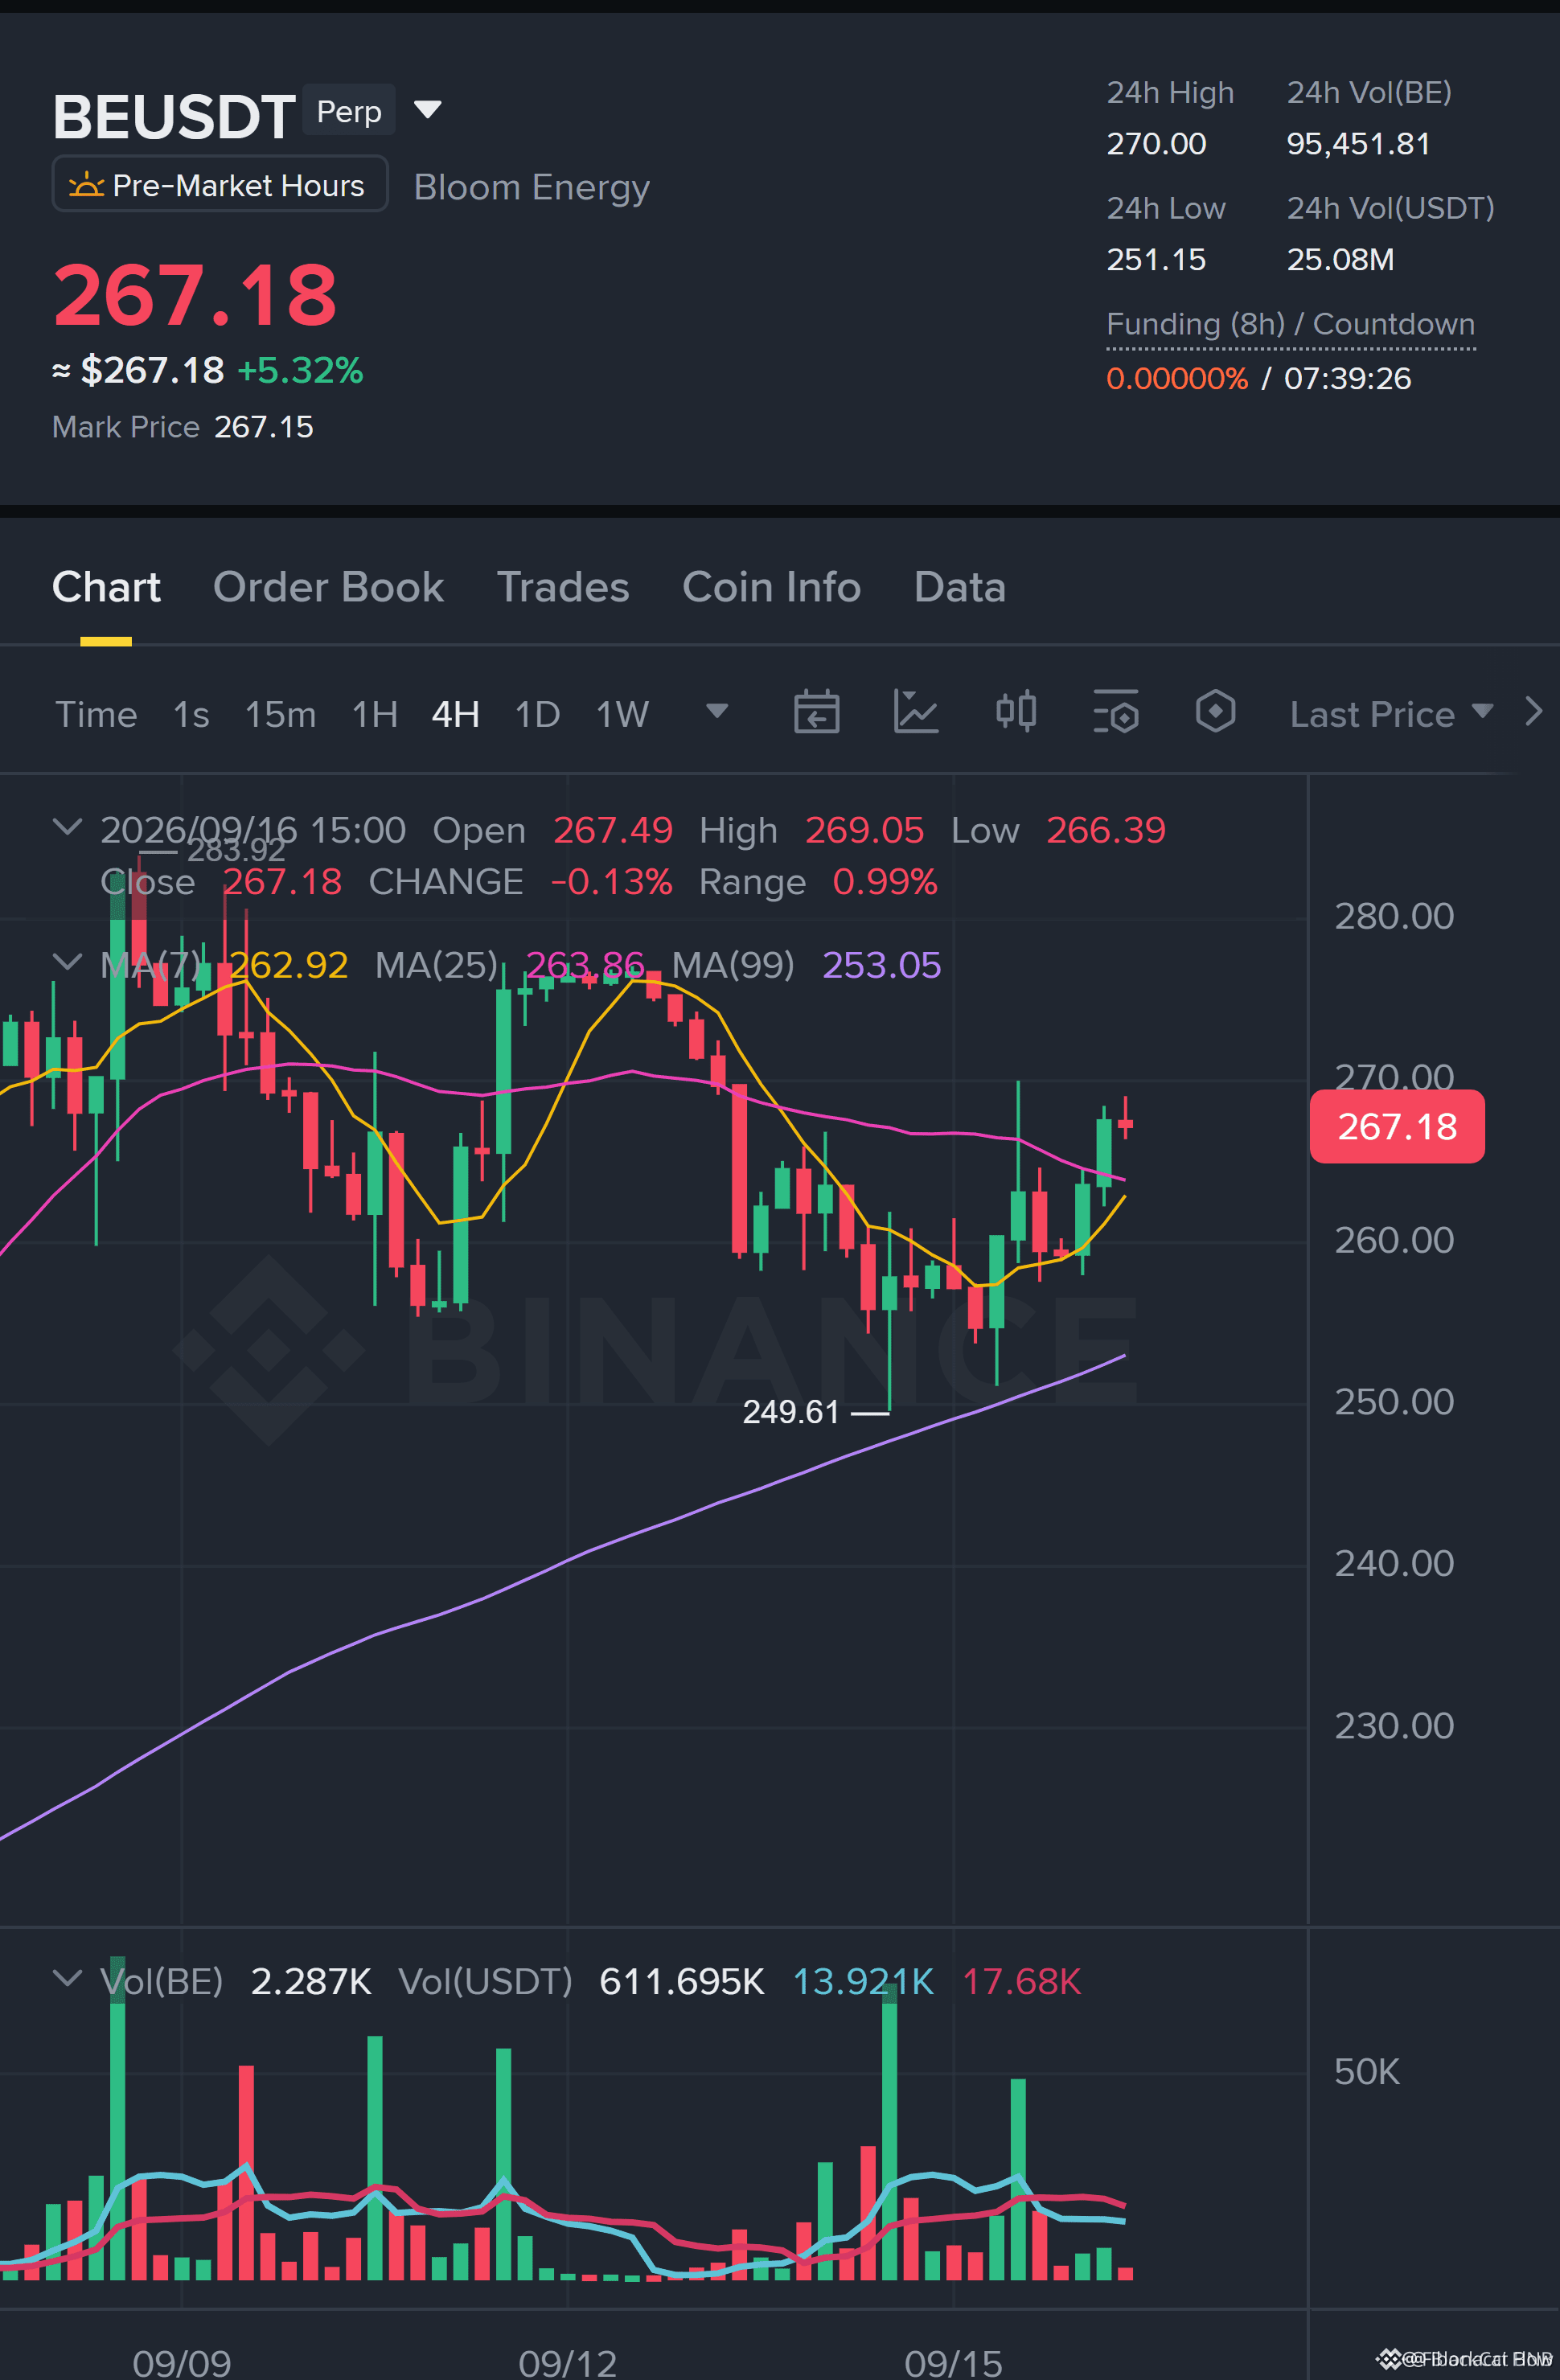
$BE $1H LONG: WAIT FOR THE RETEST, DON'T CHASE THE BOUNCE 🦈⚡
Entry: 264.96–265.37 ⚡
Target: 268.45 / 270 / 275.29 🚀
Stop Loss: 261.9 ⚠️
The $BE 1H trend is flashing a long watchlist setup, but price is already away from the planned zone. 🦈 That means patience: let the market come back to 264.96–265.37 before calling it valid. 📌
$BTC 4H is not aligned, so this is not a chase trade. 📊 If the retest holds and sellers get absorbed, TP1 268.45, TP2 270, and TP3 275.29 scale out cleanly. 💡
Are you waiting for the retest or skipping it while $BTC sets the tone? 👇
⚠️ Not financial advice. Always manage your risk. 🛡️
🏷️ #BE #LongSetup #Watchlist #Crypto #Trading
🎯 🦈
$BE $1H LONG: WAIT FOR THE RETEST, DON'T CHASE THE BOUNCE 🦈⚡
Entry: 264.96–265.37 ⚡
Target: 268.45 / 270 / 275.29 🚀
Stop Loss: 261.9 ⚠️
The $BE 1H trend is flashing a long watchlist setup, but price is already away from the planned zone. 🦈 That means patience: let the market come back to 264.96–265.37 before calling it valid. 📌
$BTC 4H is not aligned, so this is not a chase trade. 📊 If the retest holds and sellers get absorbed, TP1 268.45, TP2 270, and TP3 275.29 scale out cleanly. 💡
Are you waiting for the retest or skipping it while $BTC sets the tone? 👇
⚠️ Not financial advice. Always manage your risk. 🛡️
🏷️ #BE #LongSetup #Watchlist #Crypto #Trading
🎯 🦈
Entry: 264.96–265.37 ⚡
Target: 268.45 / 270 / 275.29 🚀
Stop Loss: 261.9 ⚠️
The $BE 1H trend is flashing a long watchlist setup, but price is already away from the planned zone. 🦈 That means patience: let the market come back to 264.96–265.37 before calling it valid. 📌
$BTC 4H is not aligned, so this is not a chase trade. 📊 If the retest holds and sellers get absorbed, TP1 268.45, TP2 270, and TP3 275.29 scale out cleanly. 💡
Are you waiting for the retest or skipping it while $BTC sets the tone? 👇
⚠️ Not financial advice. Always manage your risk. 🛡️
🏷️ #BE #LongSetup #Watchlist #Crypto #Trading
🎯 🦈
28

·
--
See translation
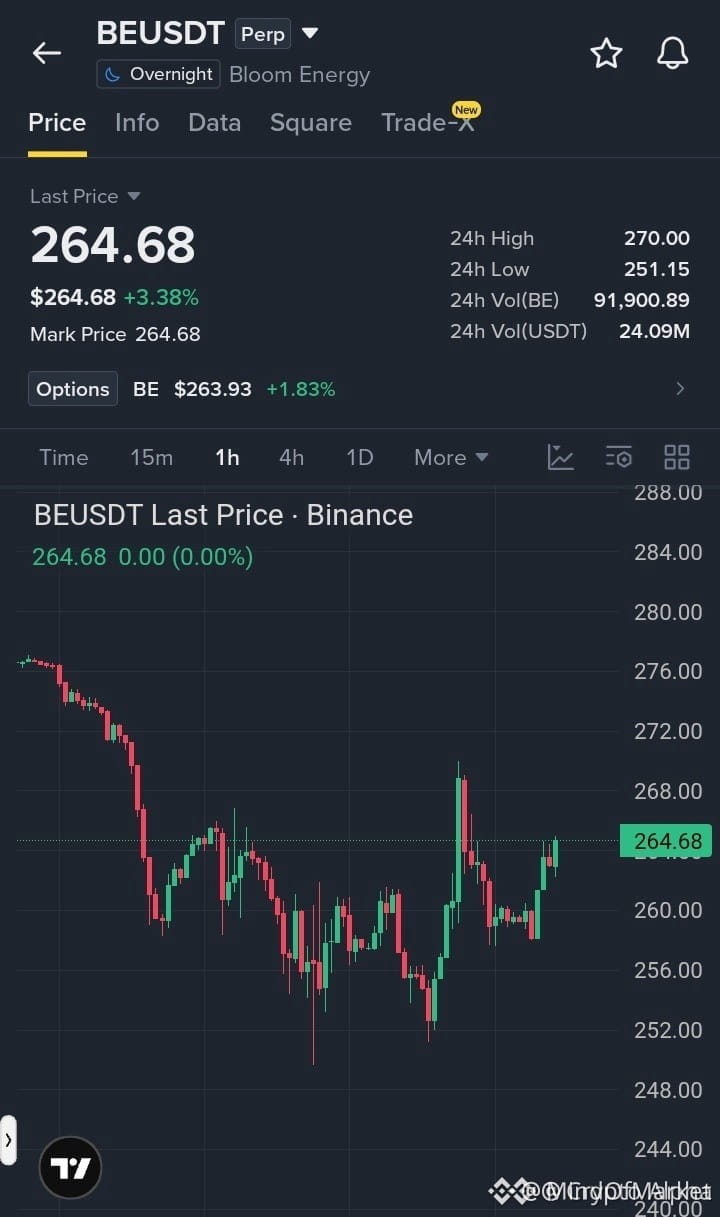
🦈 $BE RECLAIMS $260 AS BUYERS EYE $268 BREAKOUT ⚡
Entry: $263.00–$265.00 ⚡
Target: $268.00 🚀
Target: $272.00 🎯
Target: $276.00 💥
Stop Loss: $258.00 ⚠️
📌 For $BE , the $252–$256 order block acted as a liquidity floor, and reclaiming $260 shifts short-term structure bullish.
🦈 Buyers are absorbing overhead supply into $268, where a clean break would open the next imbalance. This is a structure-led recovery, not just candle momentum.
Entry near $263.00–$265.00 keeps risk defined below $258.00, while targets stack toward $276.00. 💬 Are you expecting a breakout close above $268.00, or a sweep first? 👇
⚠️ Not financial advice. Always manage your risk. 🛡️
🏷️ #BE #LongSetup #Breakout #Crypto #TechnicalAnalysis
🎯 🦈
🦈 $BE RECLAIMS $260 AS BUYERS EYE $268 BREAKOUT ⚡
Entry: $263.00–$265.00 ⚡
Target: $268.00 🚀
Target: $272.00 🎯
Target: $276.00 💥
Stop Loss: $258.00 ⚠️
📌 For $BE , the $252–$256 order block acted as a liquidity floor, and reclaiming $260 shifts short-term structure bullish.
🦈 Buyers are absorbing overhead supply into $268, where a clean break would open the next imbalance. This is a structure-led recovery, not just candle momentum.
Entry near $263.00–$265.00 keeps risk defined below $258.00, while targets stack toward $276.00. 💬 Are you expecting a breakout close above $268.00, or a sweep first? 👇
⚠️ Not financial advice. Always manage your risk. 🛡️
🏷️ #BE #LongSetup #Breakout #Crypto #TechnicalAnalysis
🎯 🦈
Entry: $263.00–$265.00 ⚡
Target: $268.00 🚀
Target: $272.00 🎯
Target: $276.00 💥
Stop Loss: $258.00 ⚠️
📌 For $BE , the $252–$256 order block acted as a liquidity floor, and reclaiming $260 shifts short-term structure bullish.
🦈 Buyers are absorbing overhead supply into $268, where a clean break would open the next imbalance. This is a structure-led recovery, not just candle momentum.
Entry near $263.00–$265.00 keeps risk defined below $258.00, while targets stack toward $276.00. 💬 Are you expecting a breakout close above $268.00, or a sweep first? 👇
⚠️ Not financial advice. Always manage your risk. 🛡️
🏷️ #BE #LongSetup #Breakout #Crypto #TechnicalAnalysis
🎯 🦈
18

·
--
See translation
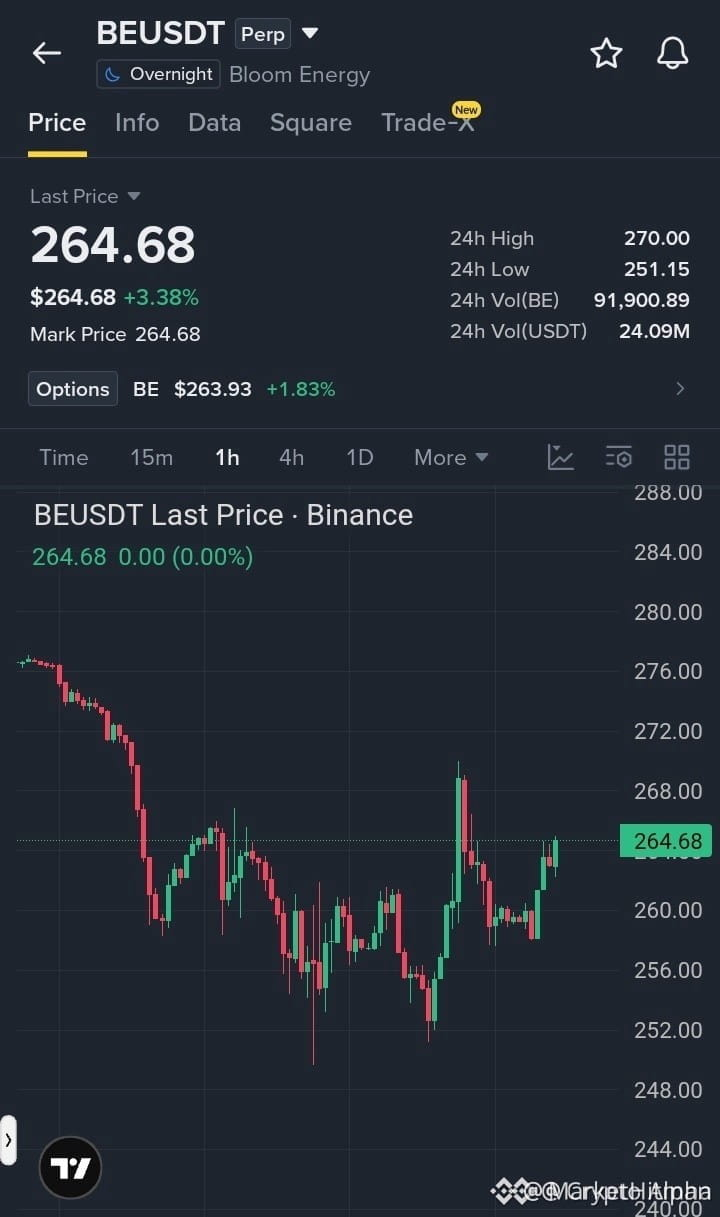
🚨 $BE BUYERS RECLAIM $260 AND EYE $268 BREAKOUT 🚀
Entry: $263.00–$265.00 ⚡
Target: $268.00 → $272.00 → $276.00 🚀
Stop Loss: $258.00 ⚠️
📌 $BE is carving a recovery ladder off the $252–$256 demand shelf, with bulls reclaiming $260 and testing the $268 gate. If that gate cracks, the next liquidity pockets at $272 and $276 could accelerate fast.
💡 This is a momentum flip, not a blind chase: $263–$265 is the clean retest zone, while $258 keeps the invalidation line close. 📊 Watch volume expansion above $268 to confirm the move. 💬 Will you bid the retest or wait for a confirmed $268 reclaim?
⚠️ Not financial advice. Always manage your risk. 🛡️
🏷️ #BE #LongSetup #Breakout #Crypto
🔥 🎯
🚨 $BE BUYERS RECLAIM $260 AND EYE $268 BREAKOUT 🚀
Entry: $263.00–$265.00 ⚡
Target: $268.00 → $272.00 → $276.00 🚀
Stop Loss: $258.00 ⚠️
📌 $BE is carving a recovery ladder off the $252–$256 demand shelf, with bulls reclaiming $260 and testing the $268 gate. If that gate cracks, the next liquidity pockets at $272 and $276 could accelerate fast.
💡 This is a momentum flip, not a blind chase: $263–$265 is the clean retest zone, while $258 keeps the invalidation line close. 📊 Watch volume expansion above $268 to confirm the move. 💬 Will you bid the retest or wait for a confirmed $268 reclaim?
⚠️ Not financial advice. Always manage your risk. 🛡️
🏷️ #BE #LongSetup #Breakout #Crypto
🔥 🎯
Entry: $263.00–$265.00 ⚡
Target: $268.00 → $272.00 → $276.00 🚀
Stop Loss: $258.00 ⚠️
📌 $BE is carving a recovery ladder off the $252–$256 demand shelf, with bulls reclaiming $260 and testing the $268 gate. If that gate cracks, the next liquidity pockets at $272 and $276 could accelerate fast.
💡 This is a momentum flip, not a blind chase: $263–$265 is the clean retest zone, while $258 keeps the invalidation line close. 📊 Watch volume expansion above $268 to confirm the move. 💬 Will you bid the retest or wait for a confirmed $268 reclaim?
⚠️ Not financial advice. Always manage your risk. 🛡️
🏷️ #BE #LongSetup #Breakout #Crypto
🔥 🎯
36

·
--
$BE 24 hours rises 6.47% to 285.38; the funding rate is perfectly still—stuck above zero.
A zero funding rate paired with a rising price is very clean structurally. When funding > 0, longs pay shorts; chasing longs are effectively handing rent to opposite positions. When funding < 0, shorts pay longs—too many bears chasing, too crowded in the bearish consensus. Now both sides aren’t paying, which suggests this upswing has almost no leverage build-up; there are stronger signs that spot-driven demand or fundamentals are being re-priced.
Open interest is 31,101.64 contracts. Marked at 285.38, the notional open positions are about $8.87 million. In the past 24 hours, trading volume is $35.55 million; the volume/OI ratio is about 4x. Intraday turnover is active but not frantic. With price moving up, financing costs at zero, and turnover at a reasonable level, this is a relatively healthy push structure in TradFi perpetuals—not a late-stage, crowded long frenzy.
The strongest counter-argument: a zero funding rate could simply reflect low market participation—there aren’t enough speculative positions to generate any meaningful funding-rate deviation. If, going forward, OI expands rapidly while the funding rate stays pinned at zero, incremental capital entering on both sides in balance would reinforce the current view. But if price keeps climbing, the funding rate suddenly jumps positive, and OI inflates in sync, that would be a long-chasing signal—and the current clean structure would be broken.
Trading tag: #TradFi #链上美股 #BE
Where do you think this thesis is most likely to be wrong?
$BE 24 hours rises 6.47% to 285.38; the funding rate is perfectly still—stuck above zero.
A zero funding rate paired with a rising price is very clean structurally. When funding > 0, longs pay shorts; chasing longs are effectively handing rent to opposite positions. When funding < 0, shorts pay longs—too many bears chasing, too crowded in the bearish consensus. Now both sides aren’t paying, which suggests this upswing has almost no leverage build-up; there are stronger signs that spot-driven demand or fundamentals are being re-priced.
Open interest is 31,101.64 contracts. Marked at 285.38, the notional open positions are about $8.87 million. In the past 24 hours, trading volume is $35.55 million; the volume/OI ratio is about 4x. Intraday turnover is active but not frantic. With price moving up, financing costs at zero, and turnover at a reasonable level, this is a relatively healthy push structure in TradFi perpetuals—not a late-stage, crowded long frenzy.
The strongest counter-argument: a zero funding rate could simply reflect low market participation—there aren’t enough speculative positions to generate any meaningful funding-rate deviation. If, going forward, OI expands rapidly while the funding rate stays pinned at zero, incremental capital entering on both sides in balance would reinforce the current view. But if price keeps climbing, the funding rate suddenly jumps positive, and OI inflates in sync, that would be a long-chasing signal—and the current clean structure would be broken.
Trading tag: #TradFi #链上美股 #BE
Where do you think this thesis is most likely to be wrong?
A zero funding rate paired with a rising price is very clean structurally. When funding > 0, longs pay shorts; chasing longs are effectively handing rent to opposite positions. When funding < 0, shorts pay longs—too many bears chasing, too crowded in the bearish consensus. Now both sides aren’t paying, which suggests this upswing has almost no leverage build-up; there are stronger signs that spot-driven demand or fundamentals are being re-priced.
Open interest is 31,101.64 contracts. Marked at 285.38, the notional open positions are about $8.87 million. In the past 24 hours, trading volume is $35.55 million; the volume/OI ratio is about 4x. Intraday turnover is active but not frantic. With price moving up, financing costs at zero, and turnover at a reasonable level, this is a relatively healthy push structure in TradFi perpetuals—not a late-stage, crowded long frenzy.
The strongest counter-argument: a zero funding rate could simply reflect low market participation—there aren’t enough speculative positions to generate any meaningful funding-rate deviation. If, going forward, OI expands rapidly while the funding rate stays pinned at zero, incremental capital entering on both sides in balance would reinforce the current view. But if price keeps climbing, the funding rate suddenly jumps positive, and OI inflates in sync, that would be a long-chasing signal—and the current clean structure would be broken.
Trading tag: #TradFi #链上美股 #BE
Where do you think this thesis is most likely to be wrong?
34

·
--
$BE current price 278.59, up 6.117% over the past 24 hours, but the funding rate is 0. This is an uncommon combination.
Price increases are usually accompanied by long positions paying positive funding fees to shorts. With the funding rate at zero, it suggests leveraged longs are not chasing higher costs, and the market hasn’t formed an one-sided bullish positioning yet. Open interest stays around 29386.53 and hasn’t surged alongside the price rally, indicating new money is hesitant to enter. This up move may be driven by spot or low-leverage positions—there’s a lack of futures-market “fuel” to accelerate it.
This is a single-signal read. The strongest counter-evidence is trading volume: the 24-hour trading value is $34.38 million. That’s not low for a contract of this size, but the price rise hasn’t attracted a significant increase in open interest, suggesting traders are doubtful about a breakout above the 280 level. If over the next few hours the price chops sideways or pulls back slightly, while the funding rate remains around 0, then the sustainability of this rally should be questioned.
In the current state, going long lacks funding-cost protection, and going short also appears less advantageous because shorts aren’t paying fees. The safest move is to wait.
Trading tag: #TradFi #链上美股 #BE
Where do you think this assessment is most likely to be wrong?
$BE current price 278.59, up 6.117% over the past 24 hours, but the funding rate is 0. This is an uncommon combination.
Price increases are usually accompanied by long positions paying positive funding fees to shorts. With the funding rate at zero, it suggests leveraged longs are not chasing higher costs, and the market hasn’t formed an one-sided bullish positioning yet. Open interest stays around 29386.53 and hasn’t surged alongside the price rally, indicating new money is hesitant to enter. This up move may be driven by spot or low-leverage positions—there’s a lack of futures-market “fuel” to accelerate it.
This is a single-signal read. The strongest counter-evidence is trading volume: the 24-hour trading value is $34.38 million. That’s not low for a contract of this size, but the price rise hasn’t attracted a significant increase in open interest, suggesting traders are doubtful about a breakout above the 280 level. If over the next few hours the price chops sideways or pulls back slightly, while the funding rate remains around 0, then the sustainability of this rally should be questioned.
In the current state, going long lacks funding-cost protection, and going short also appears less advantageous because shorts aren’t paying fees. The safest move is to wait.
Trading tag: #TradFi #链上美股 #BE
Where do you think this assessment is most likely to be wrong?
Price increases are usually accompanied by long positions paying positive funding fees to shorts. With the funding rate at zero, it suggests leveraged longs are not chasing higher costs, and the market hasn’t formed an one-sided bullish positioning yet. Open interest stays around 29386.53 and hasn’t surged alongside the price rally, indicating new money is hesitant to enter. This up move may be driven by spot or low-leverage positions—there’s a lack of futures-market “fuel” to accelerate it.
This is a single-signal read. The strongest counter-evidence is trading volume: the 24-hour trading value is $34.38 million. That’s not low for a contract of this size, but the price rise hasn’t attracted a significant increase in open interest, suggesting traders are doubtful about a breakout above the 280 level. If over the next few hours the price chops sideways or pulls back slightly, while the funding rate remains around 0, then the sustainability of this rally should be questioned.
In the current state, going long lacks funding-cost protection, and going short also appears less advantageous because shorts aren’t paying fees. The safest move is to wait.
Trading tag: #TradFi #链上美股 #BE
Where do you think this assessment is most likely to be wrong?
71
·
--
$BE price has jumped 6.326% over the past 24 hours, but the funding rate for perpetual futures is 0. This combination is not common among futures contracts.
Although the price has broken upward, the derivatives market is relatively quiet. This suggests the drive behind this rally may be coming from spot or low-leverage buying, with neither the long nor short side in the futures market forming a strong confrontation at the current level. A funding rate of zero means longs are not paying shorts, and there are no signs that shorts are panic-covering. The single signal here is trading volume of $32.74 million; it’s not exactly “volume expansion and frenzy,” more like a mild push from existing liquidity.
Under this structure, the sustainability of the rally is questionable. Without coordinated leverage participation, price is prone to quickly retrace when it meets prior trapped positions or new selling pressure. The strongest counter-evidence is this: if this is the beginning of the main players quietly accumulating, then a neutral funding rate is actually a good thing—it implies the initial phase of the rally isn’t drawing much attention. But based on current futures market conventions, genuinely explosive moves usually come with a rapid rise in the funding rate.
Next, what needs to be watched is whether, if the price continues to push above $280, the funding rate will be quickly turned positive. If the funding rate strengthens before the price, it would indicate that leveraged longs are starting to enter and the market may enter an acceleration phase; if the funding rate remains steady and subdued, it’s a warning sign that this is a rebound lacking momentum.
Trading tag: #TradFi #链上美股 #BE
Where do you think this analysis is most likely to be wrong?
$BE price has jumped 6.326% over the past 24 hours, but the funding rate for perpetual futures is 0. This combination is not common among futures contracts.
Although the price has broken upward, the derivatives market is relatively quiet. This suggests the drive behind this rally may be coming from spot or low-leverage buying, with neither the long nor short side in the futures market forming a strong confrontation at the current level. A funding rate of zero means longs are not paying shorts, and there are no signs that shorts are panic-covering. The single signal here is trading volume of $32.74 million; it’s not exactly “volume expansion and frenzy,” more like a mild push from existing liquidity.
Under this structure, the sustainability of the rally is questionable. Without coordinated leverage participation, price is prone to quickly retrace when it meets prior trapped positions or new selling pressure. The strongest counter-evidence is this: if this is the beginning of the main players quietly accumulating, then a neutral funding rate is actually a good thing—it implies the initial phase of the rally isn’t drawing much attention. But based on current futures market conventions, genuinely explosive moves usually come with a rapid rise in the funding rate.
Next, what needs to be watched is whether, if the price continues to push above $280, the funding rate will be quickly turned positive. If the funding rate strengthens before the price, it would indicate that leveraged longs are starting to enter and the market may enter an acceleration phase; if the funding rate remains steady and subdued, it’s a warning sign that this is a rebound lacking momentum.
Trading tag: #TradFi #链上美股 #BE
Where do you think this analysis is most likely to be wrong?
Although the price has broken upward, the derivatives market is relatively quiet. This suggests the drive behind this rally may be coming from spot or low-leverage buying, with neither the long nor short side in the futures market forming a strong confrontation at the current level. A funding rate of zero means longs are not paying shorts, and there are no signs that shorts are panic-covering. The single signal here is trading volume of $32.74 million; it’s not exactly “volume expansion and frenzy,” more like a mild push from existing liquidity.
Under this structure, the sustainability of the rally is questionable. Without coordinated leverage participation, price is prone to quickly retrace when it meets prior trapped positions or new selling pressure. The strongest counter-evidence is this: if this is the beginning of the main players quietly accumulating, then a neutral funding rate is actually a good thing—it implies the initial phase of the rally isn’t drawing much attention. But based on current futures market conventions, genuinely explosive moves usually come with a rapid rise in the funding rate.
Next, what needs to be watched is whether, if the price continues to push above $280, the funding rate will be quickly turned positive. If the funding rate strengthens before the price, it would indicate that leveraged longs are starting to enter and the market may enter an acceleration phase; if the funding rate remains steady and subdued, it’s a warning sign that this is a rebound lacking momentum.
Trading tag: #TradFi #链上美股 #BE
Where do you think this analysis is most likely to be wrong?

·
--
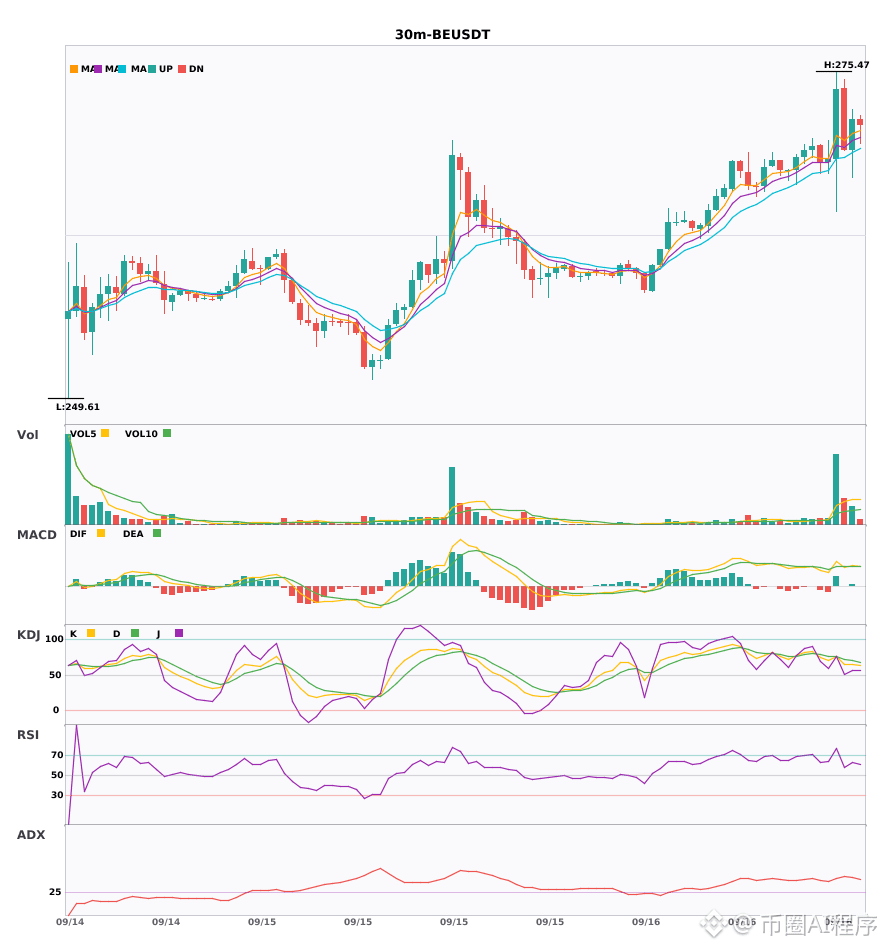
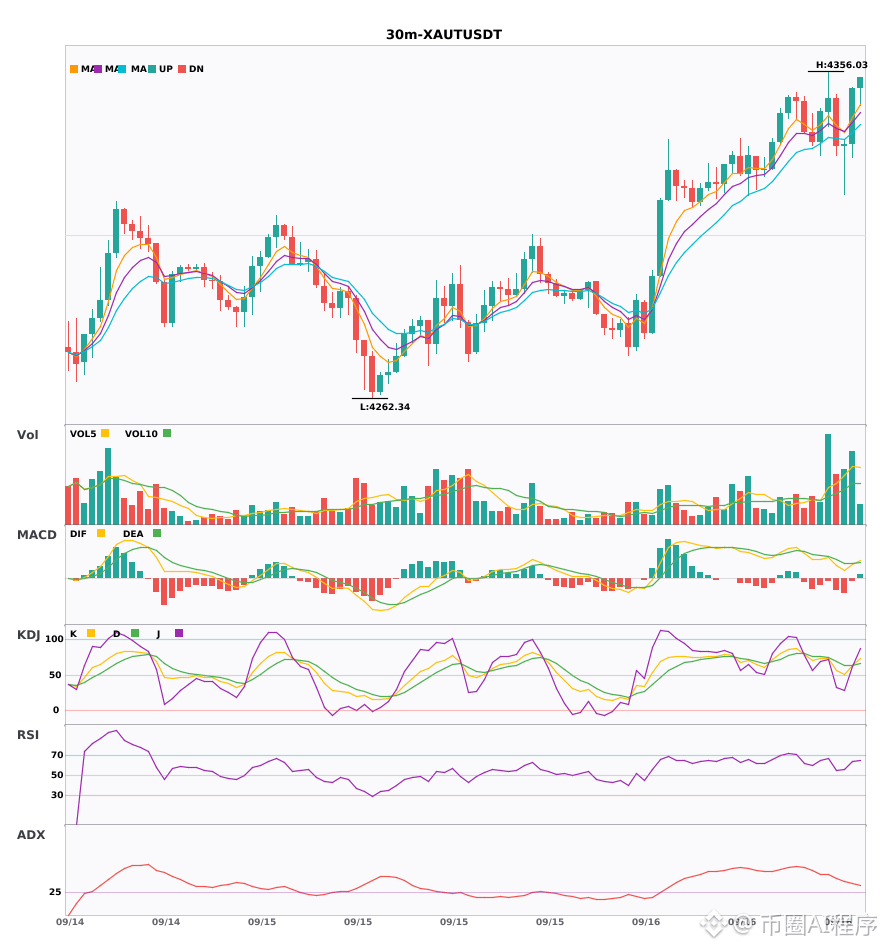
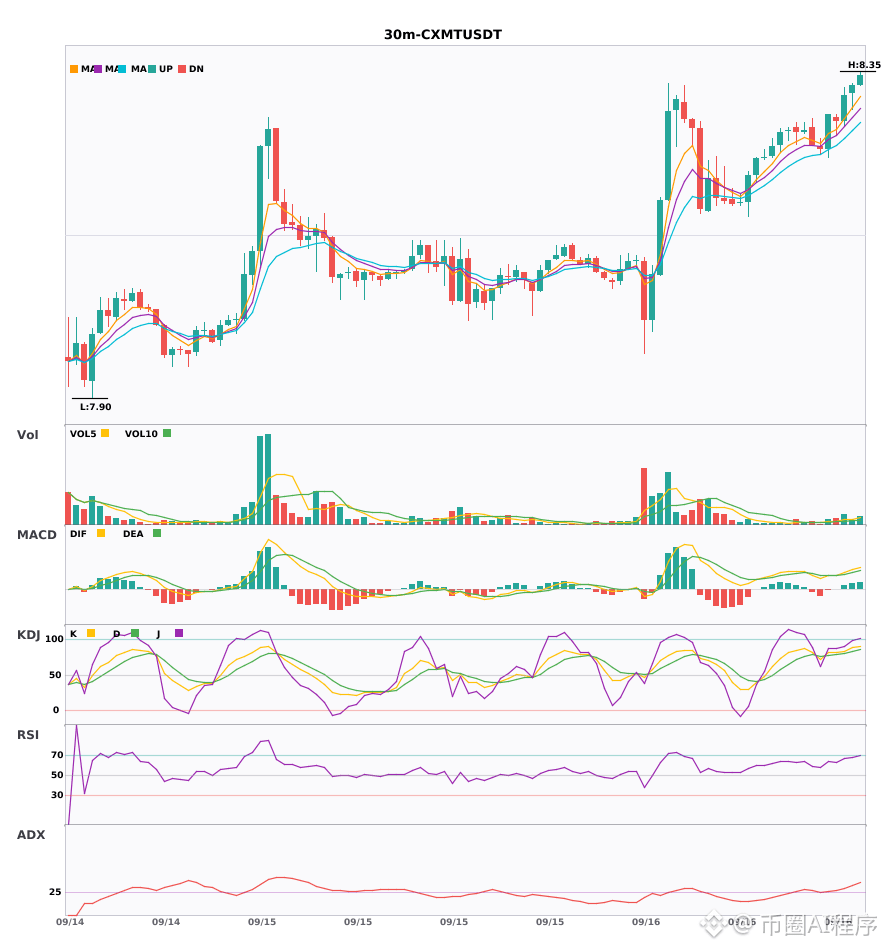
$BE / $XAUT / $CXMT 30 minutes long signal, 4-hour bullish trend confirmation🔥
════════════════════
🔴 $BE 30 minutes long signal
⚠️ Technicals: A multi-timeframe resonance bullish signal! 4-hour bullish confirmation; 30-minute entry/exit points: MACD golden cross above zero with increased volume, bullish moving-average alignment, volume is 2x, and KDJ is bullish.
════════════════════
🔴 $XAUT 30 minutes long signal
⚠️ Technicals: Multi-timeframe resonance! 4-hour bullish confirmation; 30-minute entry/exit signal: EMA5 crosses above EMA8 and turns short-term bullish; KDJ is bullish and not overbought; volume surges by 1.7x.
════════════════════
🔴 $CXMT 30 minutes long signal
⚠️ Technicals: 4-hour bullish resonance confirmation | 30-minute entry: MACD golden cross above zero; bullish momentum released | EMA5 > EMA8 > EMA13 with bullish alignment | KDJ in the overbought zone—watch for pullback risk (K is 83.6, D is 80.5) | Trading volume explodes (2.7x)
════════════════════
🔔 Follow to get first-hand alerts on market anomalies 🔔
#多周期共振 #BE #XAUT #CXMT
📌 When trading, pay attention to whether the candlestick pattern matches
$BE / $XAUT / $CXMT 30 minutes long signal, 4-hour bullish trend confirmation🔥
════════════════════
🔴 $BE 30 minutes long signal
⚠️ Technicals: A multi-timeframe resonance bullish signal! 4-hour bullish confirmation; 30-minute entry/exit points: MACD golden cross above zero with increased volume, bullish moving-average alignment, volume is 2x, and KDJ is bullish.
════════════════════
🔴 $XAUT 30 minutes long signal
⚠️ Technicals: Multi-timeframe resonance! 4-hour bullish confirmation; 30-minute entry/exit signal: EMA5 crosses above EMA8 and turns short-term bullish; KDJ is bullish and not overbought; volume surges by 1.7x.
════════════════════
🔴 $CXMT 30 minutes long signal
⚠️ Technicals: 4-hour bullish resonance confirmation | 30-minute entry: MACD golden cross above zero; bullish momentum released | EMA5 > EMA8 > EMA13 with bullish alignment | KDJ in the overbought zone—watch for pullback risk (K is 83.6, D is 80.5) | Trading volume explodes (2.7x)
════════════════════
🔔 Follow to get first-hand alerts on market anomalies 🔔
#多周期共振 #BE #XAUT #CXMT
📌 When trading, pay attention to whether the candlestick pattern matches
════════════════════
🔴 $BE 30 minutes long signal
⚠️ Technicals: A multi-timeframe resonance bullish signal! 4-hour bullish confirmation; 30-minute entry/exit points: MACD golden cross above zero with increased volume, bullish moving-average alignment, volume is 2x, and KDJ is bullish.
════════════════════
🔴 $XAUT 30 minutes long signal
⚠️ Technicals: Multi-timeframe resonance! 4-hour bullish confirmation; 30-minute entry/exit signal: EMA5 crosses above EMA8 and turns short-term bullish; KDJ is bullish and not overbought; volume surges by 1.7x.
════════════════════
🔴 $CXMT 30 minutes long signal
⚠️ Technicals: 4-hour bullish resonance confirmation | 30-minute entry: MACD golden cross above zero; bullish momentum released | EMA5 > EMA8 > EMA13 with bullish alignment | KDJ in the overbought zone—watch for pullback risk (K is 83.6, D is 80.5) | Trading volume explodes (2.7x)
════════════════════
🔔 Follow to get first-hand alerts on market anomalies 🔔
#多周期共振 #BE #XAUT #CXMT
📌 When trading, pay attention to whether the candlestick pattern matches
175
·
--
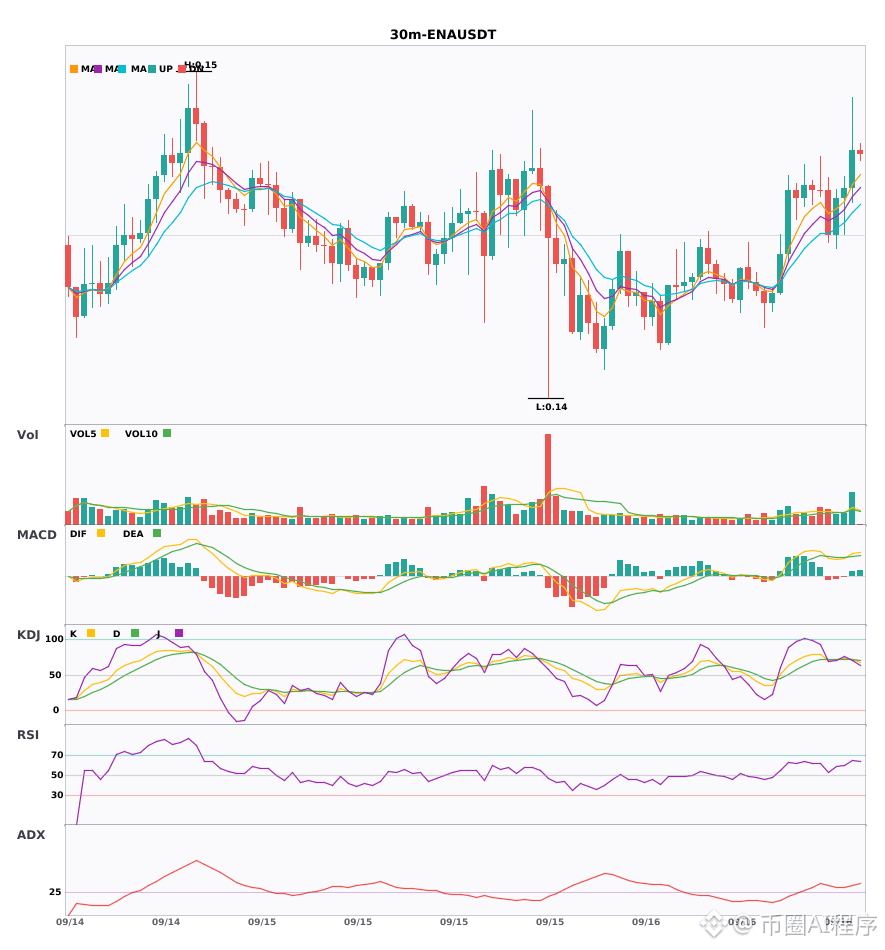
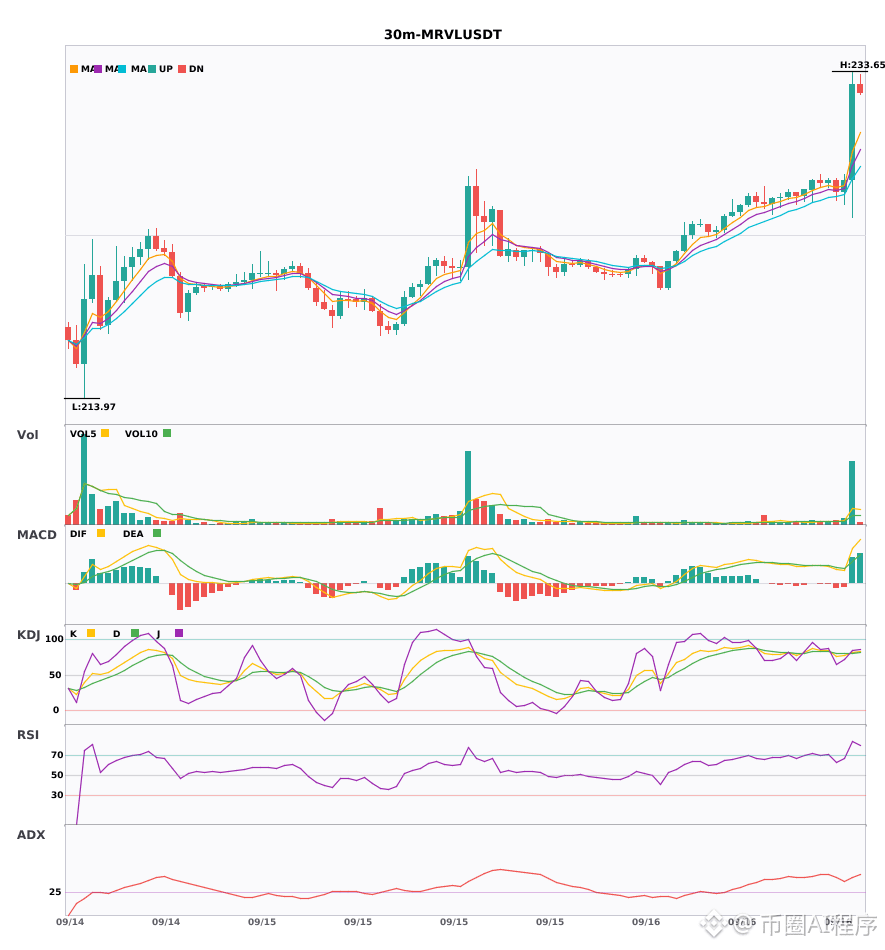
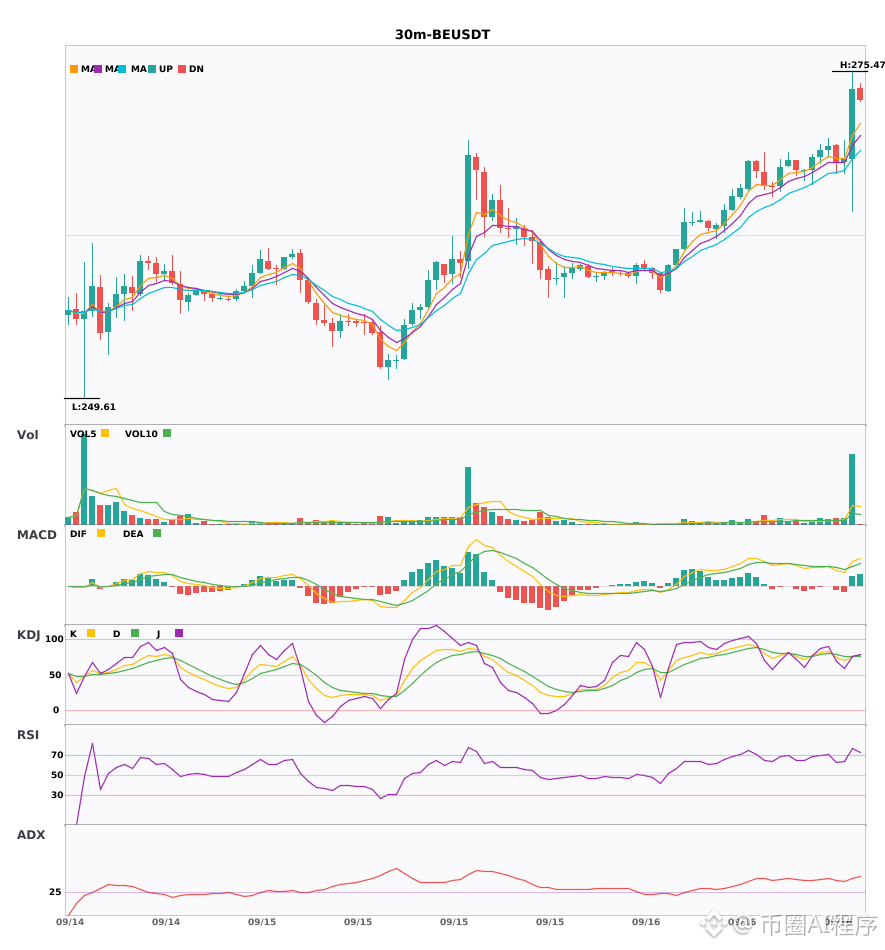
$ENA / $MRVL / $BE 30 minutes long + 4-hour long in the same direction, multiple-cycle resonance shifts to 🔥
════════════════════
🔴 $ENA 30 minutes long signal
⚠️ Technical analysis: 4-hour long resonance confirmed | 30-minute entry: MACD golden cross above zero, long momentum released | EMA5 > EMA8 > EMA13 bullish alignment | KDJ dead cross; near-term bearish (K is 71.2, D is 71.8) | Volume 확대 (2.2x)
════════════════════
🔴 $MRVL 30 minutes long signal
⚠️ Technical analysis: 4-hour long resonance confirmed | 30-minute entry: MACD golden cross above zero, long momentum released | EMA5 > EMA8 > EMA13 bullish alignment | KDJ golden cross; near-term bullish (K is 81.6, D is 80.2) | Volume explosion (6.6x)
════════════════════
🔴 $BE 30 minutes long signal
⚠️ Technical analysis: 4-hour long resonance confirmed | 30-minute entry: MACD golden cross above zero, long momentum released | EMA5 > EMA8 > EMA13 bullish alignment | KDJ golden cross; near-term bullish (K is 75.7, D is 75.5) | Volume explosion (6.2x)
════════════════════
🔔 Watch for first-hand market updates on sudden moves 🔔
#多周期共振 #ENA #MRVL #BE
📌 When trading, pay attention to whether the candlestick pattern matches
$ENA / $MRVL / $BE 30 minutes long + 4-hour long in the same direction, multiple-cycle resonance shifts to 🔥
════════════════════
🔴 $ENA 30 minutes long signal
⚠️ Technical analysis: 4-hour long resonance confirmed | 30-minute entry: MACD golden cross above zero, long momentum released | EMA5 > EMA8 > EMA13 bullish alignment | KDJ dead cross; near-term bearish (K is 71.2, D is 71.8) | Volume 확대 (2.2x)
════════════════════
🔴 $MRVL 30 minutes long signal
⚠️ Technical analysis: 4-hour long resonance confirmed | 30-minute entry: MACD golden cross above zero, long momentum released | EMA5 > EMA8 > EMA13 bullish alignment | KDJ golden cross; near-term bullish (K is 81.6, D is 80.2) | Volume explosion (6.6x)
════════════════════
🔴 $BE 30 minutes long signal
⚠️ Technical analysis: 4-hour long resonance confirmed | 30-minute entry: MACD golden cross above zero, long momentum released | EMA5 > EMA8 > EMA13 bullish alignment | KDJ golden cross; near-term bullish (K is 75.7, D is 75.5) | Volume explosion (6.2x)
════════════════════
🔔 Watch for first-hand market updates on sudden moves 🔔
#多周期共振 #ENA #MRVL #BE
📌 When trading, pay attention to whether the candlestick pattern matches
════════════════════
🔴 $ENA 30 minutes long signal
⚠️ Technical analysis: 4-hour long resonance confirmed | 30-minute entry: MACD golden cross above zero, long momentum released | EMA5 > EMA8 > EMA13 bullish alignment | KDJ dead cross; near-term bearish (K is 71.2, D is 71.8) | Volume 확대 (2.2x)
════════════════════
🔴 $MRVL 30 minutes long signal
⚠️ Technical analysis: 4-hour long resonance confirmed | 30-minute entry: MACD golden cross above zero, long momentum released | EMA5 > EMA8 > EMA13 bullish alignment | KDJ golden cross; near-term bullish (K is 81.6, D is 80.2) | Volume explosion (6.6x)
════════════════════
🔴 $BE 30 minutes long signal
⚠️ Technical analysis: 4-hour long resonance confirmed | 30-minute entry: MACD golden cross above zero, long momentum released | EMA5 > EMA8 > EMA13 bullish alignment | KDJ golden cross; near-term bullish (K is 75.7, D is 75.5) | Volume explosion (6.2x)
════════════════════
🔔 Watch for first-hand market updates on sudden moves 🔔
#多周期共振 #ENA #MRVL #BE
📌 When trading, pay attention to whether the candlestick pattern matches
107

$BE 24 hours up 4.18% to 266.33, funding rate 0, with long/short zero-cost standoff. The price was pushed higher but the funding didn’t follow, which suggests there isn’t one-sided overcrowding. On-chain US stock futures contracts are proceeding on their own in the Trump policy vacuum period. I lean toward going long, using 2x leverage, stop-loss at 260, take-profit at 280, position size 10%. If it breaks below 258, cut immediately. If there’s any noise or changes on the political front, this level is likely to break easily.
Trading tags: #TradFi #链上美股 #BE
Where do you think this set of judgment is most likely to be wrong?
$BE 24 hours up 4.18% to 266.33, funding rate 0, with long/short zero-cost standoff. The price was pushed higher but the funding didn’t follow, which suggests there isn’t one-sided overcrowding. On-chain US stock futures contracts are proceeding on their own in the Trump policy vacuum period. I lean toward going long, using 2x leverage, stop-loss at 260, take-profit at 280, position size 10%. If it breaks below 258, cut immediately. If there’s any noise or changes on the political front, this level is likely to break easily.
Trading tags: #TradFi #链上美股 #BE
Where do you think this set of judgment is most likely to be wrong?
Trading tags: #TradFi #链上美股 #BE
Where do you think this set of judgment is most likely to be wrong?
22
$BE at 266.33, up 4.18% in 24 hours. I’m going long.
This rally is steady enough but there’s no big volume spike. The funding rate is 0, which means the longs aren’t paying interest. Also, the position cost is low. However, not many people chase longs at this level, so in the short term it’s easy for the shorts to target it.
The strongest counterpoint: if the overall market turns colder and $BE pulls back as well, then the long orders chasing right now will have to take a hit. A second-order effect is that longs reducing exposure can accelerate the sell-off.
Set a stop-loss at 260; if it breaks, it means the long momentum is gone. Take profit around 280—grab a short-term swing. Use a 10% position size to test the waters. Go long with 5x leverage.
Trading tag: #TradFi #链上美股 #BE
Where do you think this thesis is most likely to be wrong?
$BE at 266.33, up 4.18% in 24 hours. I’m going long.
This rally is steady enough but there’s no big volume spike. The funding rate is 0, which means the longs aren’t paying interest. Also, the position cost is low. However, not many people chase longs at this level, so in the short term it’s easy for the shorts to target it.
The strongest counterpoint: if the overall market turns colder and $BE pulls back as well, then the long orders chasing right now will have to take a hit. A second-order effect is that longs reducing exposure can accelerate the sell-off.
Set a stop-loss at 260; if it breaks, it means the long momentum is gone. Take profit around 280—grab a short-term swing. Use a 10% position size to test the waters. Go long with 5x leverage.
Trading tag: #TradFi #链上美股 #BE
Where do you think this thesis is most likely to be wrong?
This rally is steady enough but there’s no big volume spike. The funding rate is 0, which means the longs aren’t paying interest. Also, the position cost is low. However, not many people chase longs at this level, so in the short term it’s easy for the shorts to target it.
The strongest counterpoint: if the overall market turns colder and $BE pulls back as well, then the long orders chasing right now will have to take a hit. A second-order effect is that longs reducing exposure can accelerate the sell-off.
Set a stop-loss at 260; if it breaks, it means the long momentum is gone. Take profit around 280—grab a short-term swing. Use a 10% position size to test the waters. Go long with 5x leverage.
Trading tag: #TradFi #链上美股 #BE
Where do you think this thesis is most likely to be wrong?
12
In 4.18% price growth over $BE 24 hours, the price is 266.33, and the funding rate is zero. This data is interesting: it’s rising, but the funding rate doesn’t move at all, which suggests the market priced in no risk premium for this leg up. Both longs and shorts have no extra costs, and the positioning structure is very clean.
With no funding-rate drag, longs can hold their positions for free. But this also means that if the price goes sideways or stalls, there won’t be any funding-rate incentive to bring in fresh longs to take over, and the upside momentum will quickly fade. If tomorrow the funding rate stays near zero and the price can’t hold above 270, then this move is just a dead-cat bounce.
Trading tag: #TradFi #链上美股 #BE
Where do you think this analysis is most likely to be wrong?
In 4.18% price growth over $BE 24 hours, the price is 266.33, and the funding rate is zero. This data is interesting: it’s rising, but the funding rate doesn’t move at all, which suggests the market priced in no risk premium for this leg up. Both longs and shorts have no extra costs, and the positioning structure is very clean.
With no funding-rate drag, longs can hold their positions for free. But this also means that if the price goes sideways or stalls, there won’t be any funding-rate incentive to bring in fresh longs to take over, and the upside momentum will quickly fade. If tomorrow the funding rate stays near zero and the price can’t hold above 270, then this move is just a dead-cat bounce.
Trading tag: #TradFi #链上美股 #BE
Where do you think this analysis is most likely to be wrong?
With no funding-rate drag, longs can hold their positions for free. But this also means that if the price goes sideways or stalls, there won’t be any funding-rate incentive to bring in fresh longs to take over, and the upside momentum will quickly fade. If tomorrow the funding rate stays near zero and the price can’t hold above 270, then this move is just a dead-cat bounce.
Trading tag: #TradFi #链上美股 #BE
Where do you think this analysis is most likely to be wrong?
13

·
--
See translation
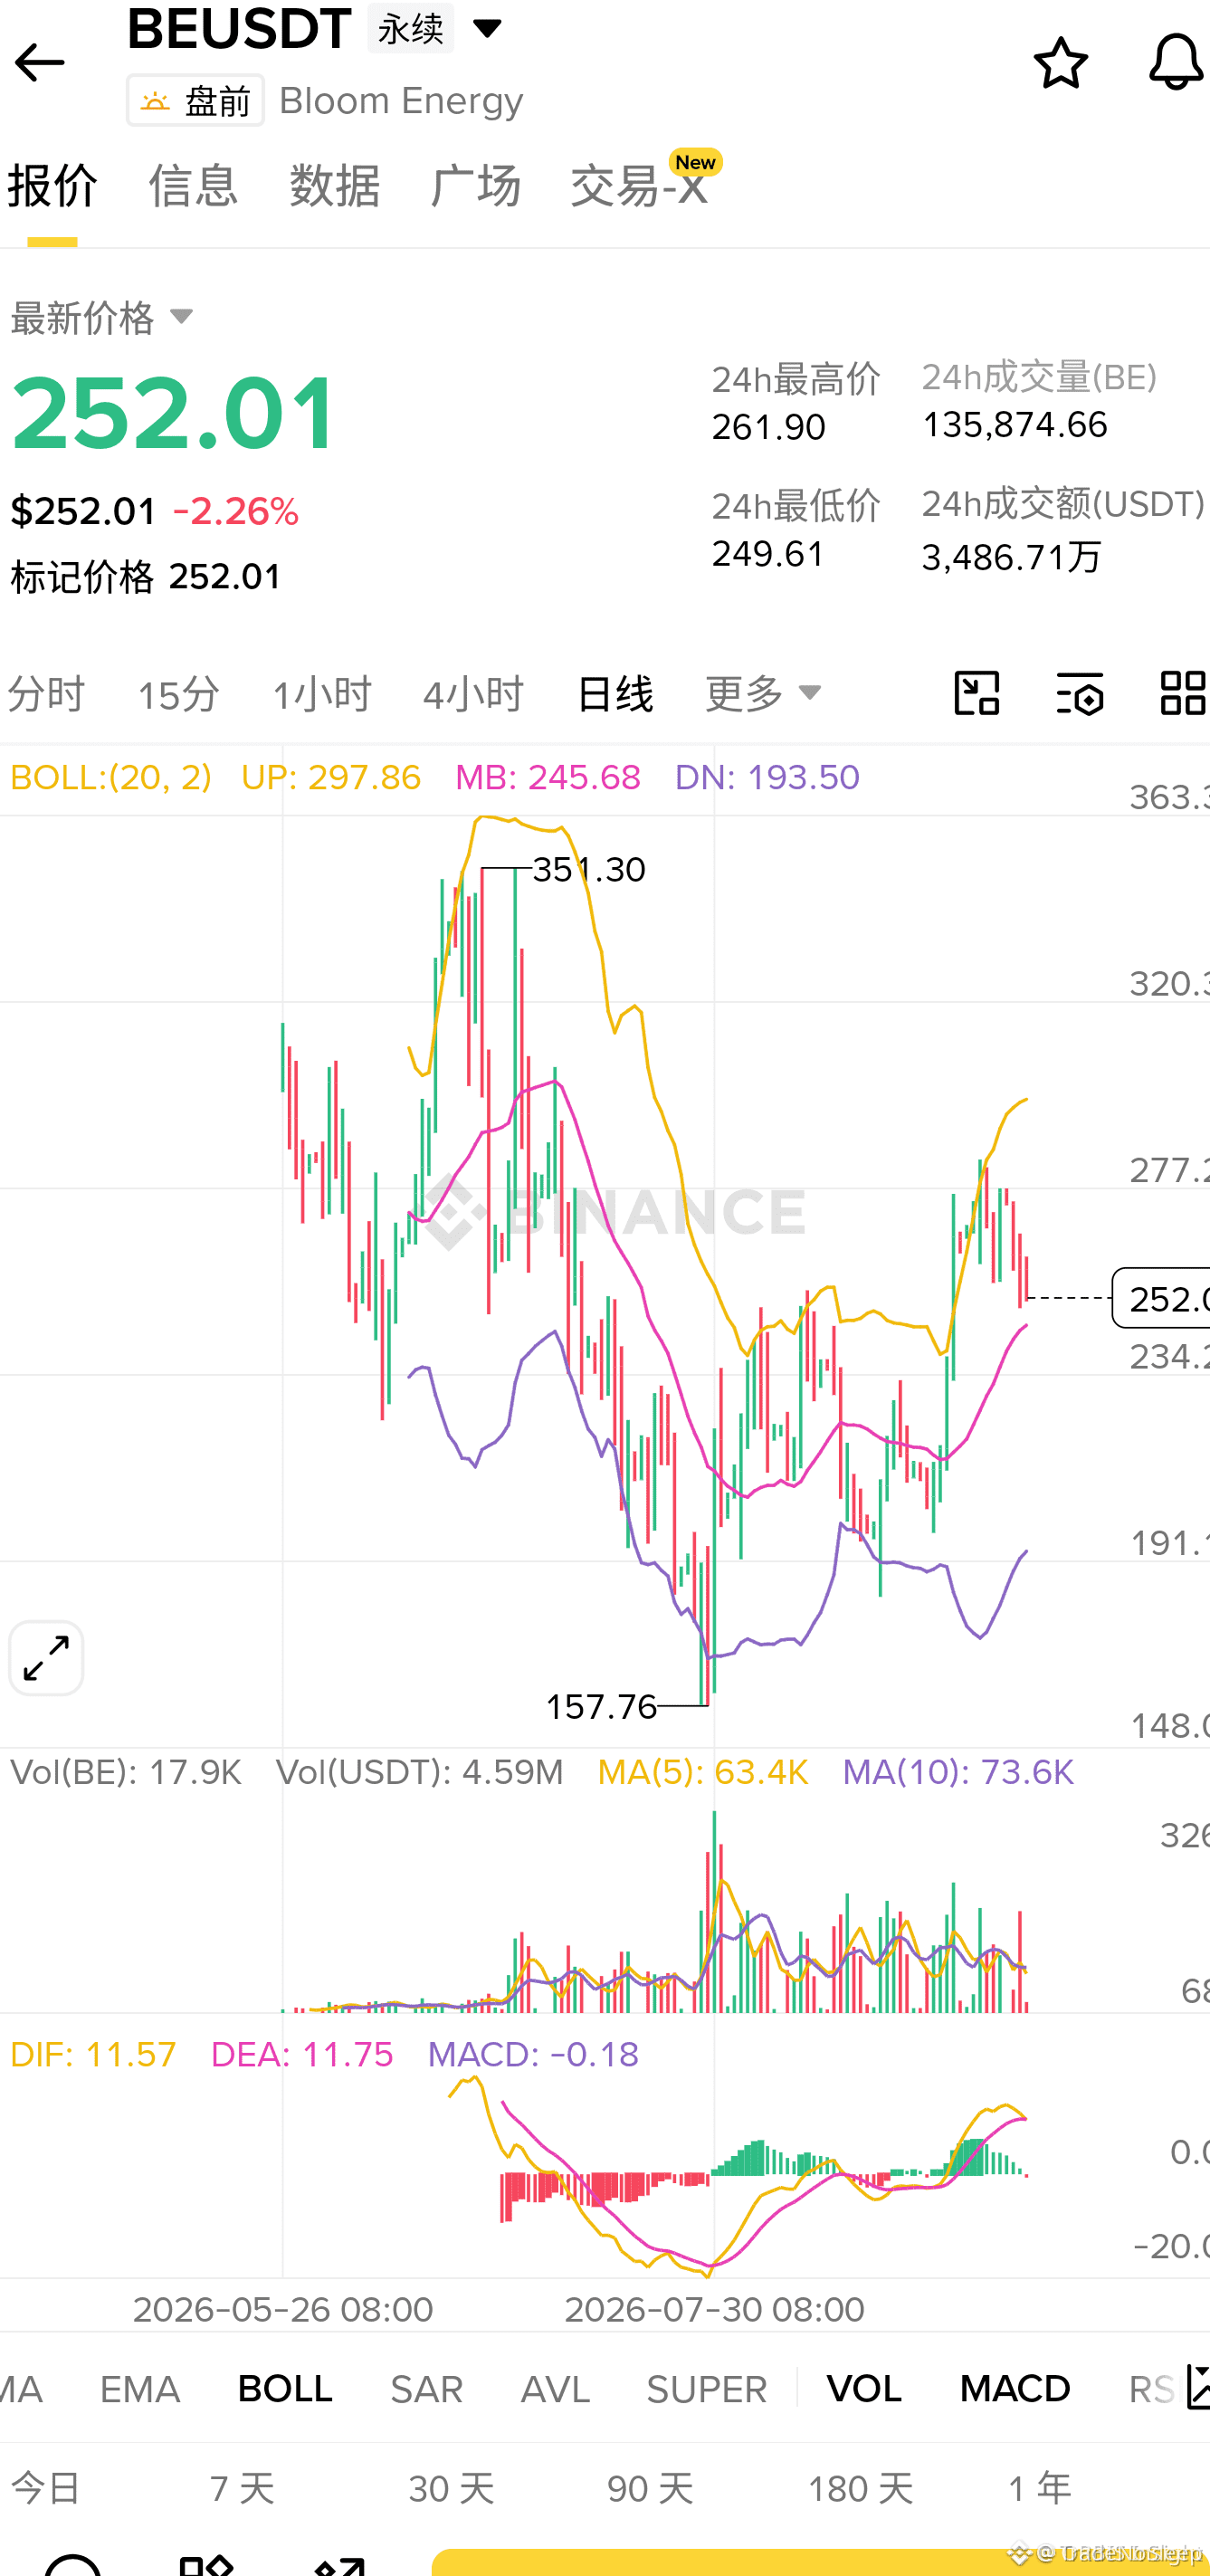
🚨 $BE REJECTS AT SUPPLY, DEAD CROSS CONFIRMS BEARISH LIQUIDITY SWEEP 📉
Entry: 252.01 ⚡
Target: 222.34 🚀
Stop Loss: 261.90 ⚠️
📌 $BE is showing distribution after a sweep into the 252.01 supply zone. The weak bounce and fading buy volume suggest smart money is using higher prices to offload exposure. 📊
⚡ MACD's bearish cross near the high adds confirmation that momentum has rolled over. A close below 252.01 keeps the path toward 222.34 structurally favored, while 261.90 invalidates the short thesis.
🤔 Are you fading this bounce, or waiting for another liquidity hunt before pressing shorts?
⚠️ Not financial advice. Always manage your risk. 🛡️
🏷️ #BE #ShortSetup #Bearish #LiquiditySweep #Crypto
🦈 📉
🚨 $BE REJECTS AT SUPPLY, DEAD CROSS CONFIRMS BEARISH LIQUIDITY SWEEP 📉
Entry: 252.01 ⚡
Target: 222.34 🚀
Stop Loss: 261.90 ⚠️
📌 $BE is showing distribution after a sweep into the 252.01 supply zone. The weak bounce and fading buy volume suggest smart money is using higher prices to offload exposure. 📊
⚡ MACD's bearish cross near the high adds confirmation that momentum has rolled over. A close below 252.01 keeps the path toward 222.34 structurally favored, while 261.90 invalidates the short thesis.
🤔 Are you fading this bounce, or waiting for another liquidity hunt before pressing shorts?
⚠️ Not financial advice. Always manage your risk. 🛡️
🏷️ #BE #ShortSetup #Bearish #LiquiditySweep #Crypto
🦈 📉
Entry: 252.01 ⚡
Target: 222.34 🚀
Stop Loss: 261.90 ⚠️
📌 $BE is showing distribution after a sweep into the 252.01 supply zone. The weak bounce and fading buy volume suggest smart money is using higher prices to offload exposure. 📊
⚡ MACD's bearish cross near the high adds confirmation that momentum has rolled over. A close below 252.01 keeps the path toward 222.34 structurally favored, while 261.90 invalidates the short thesis.
🤔 Are you fading this bounce, or waiting for another liquidity hunt before pressing shorts?
⚠️ Not financial advice. Always manage your risk. 🛡️
🏷️ #BE #ShortSetup #Bearish #LiquiditySweep #Crypto
🦈 📉
33

·
--
See translation
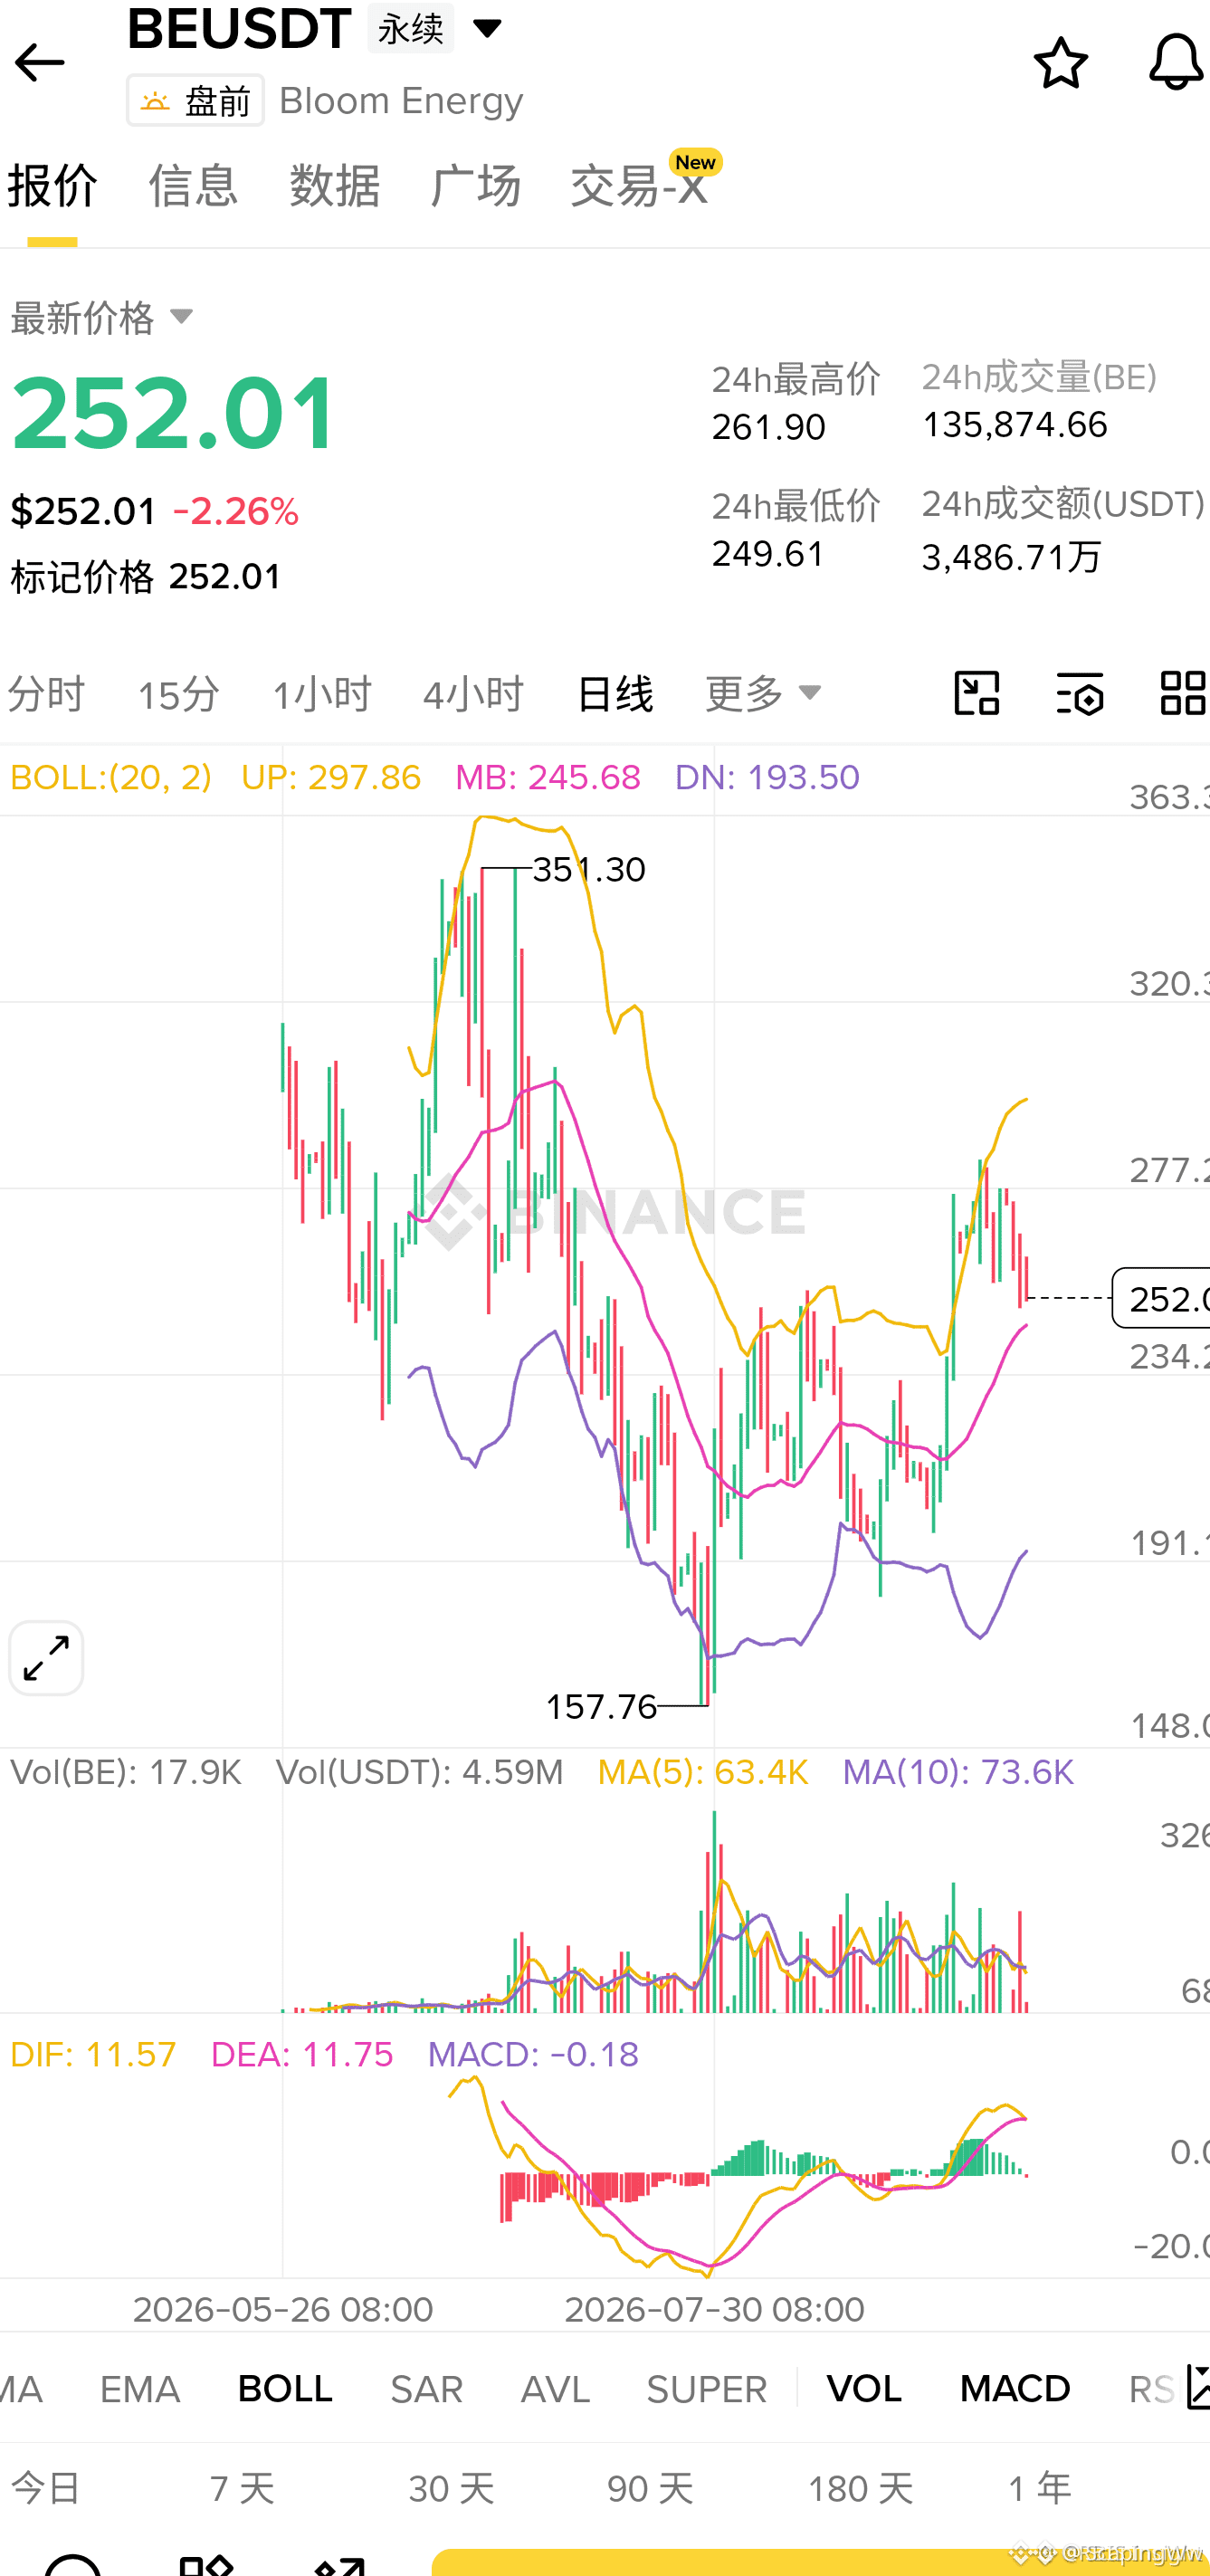
🚨 $BE BEAR TRAP AT 252 AS DEAD CROSS FLIPS SHORTS INTO LIQUIDITY 💣
Entry: 252.01 🔥
Target: 222.34 🚀
Stop Loss: 261.90 ⚠️
📌 The $BE chart is flashing a classic exhaustion top: MACD is rolling into a dead cross while bid-side volume thins out, leaving longs without fresh fuel. 📊
💡 Short bias looks favored from 252.01, with 222.34 as the first magnet if sellers reclaim control. A close above 261.90 would flip the narrative and force shorts to step aside.
💬 Are you fading this bounce, or waiting for a deeper trap before pressing the short button?
⚠️ Not financial advice. Always manage your risk. 🛡️
🏷️ #BE #ShortSetup #Bearish #Crypto
🐻 📉
🚨 $BE BEAR TRAP AT 252 AS DEAD CROSS FLIPS SHORTS INTO LIQUIDITY 💣
Entry: 252.01 🔥
Target: 222.34 🚀
Stop Loss: 261.90 ⚠️
📌 The $BE chart is flashing a classic exhaustion top: MACD is rolling into a dead cross while bid-side volume thins out, leaving longs without fresh fuel. 📊
💡 Short bias looks favored from 252.01, with 222.34 as the first magnet if sellers reclaim control. A close above 261.90 would flip the narrative and force shorts to step aside.
💬 Are you fading this bounce, or waiting for a deeper trap before pressing the short button?
⚠️ Not financial advice. Always manage your risk. 🛡️
🏷️ #BE #ShortSetup #Bearish #Crypto
🐻 📉
Entry: 252.01 🔥
Target: 222.34 🚀
Stop Loss: 261.90 ⚠️
📌 The $BE chart is flashing a classic exhaustion top: MACD is rolling into a dead cross while bid-side volume thins out, leaving longs without fresh fuel. 📊
💡 Short bias looks favored from 252.01, with 222.34 as the first magnet if sellers reclaim control. A close above 261.90 would flip the narrative and force shorts to step aside.
💬 Are you fading this bounce, or waiting for a deeper trap before pressing the short button?
⚠️ Not financial advice. Always manage your risk. 🛡️
🏷️ #BE #ShortSetup #Bearish #Crypto
🐻 📉
22

·
--
$BE 24 hours dropped 3.67%. The price touched 263.52, but the funding rate is negative: -0.00006753. Shorts are paying longs, yet the price hasn’t rebounded. This suggests the bearish consensus is strong, but the downside momentum may be weakening—shorts are hard-carrying their costs into the next breakdown.
Core judgment: This is a weak setup where shorts are piling up. The negative funding rate is shorts’ holding cost, not longs’ free coupon. Since the price isn’t moving up, it means buy pressure simply can’t absorb the sell pressure at all. One-signal conclusion: a divergence between price and funding rate.
Strongest counter-evidence: If a high-volume bullish candle appears here, reclaiming the prior candles’ downside (i.e., eating through their losses), then the negative funding rate could become fuel for a short squeeze and directly blow up the shorts. But the current price is still below 264, and longs haven’t made a move.
Second-order impact: Shorts are paying money every day to stay short. If the price continues to trade sideways without dropping further, their costs will accumulate and they may be forced to partially cover, which could cause a modest rebound. But the real liquidity will show up when the prior low is broken.
Invalidation condition: If the price breaks above 264.2 with volume (intra-day high), then this weak-bias judgment is invalidated. A breakout means new capital has entered to take over, and the negative funding structure could reverse.
Action: At the current price of 263.5, you can try a small short position; set the stop-loss at 264.2.
Trading tag: #TradFi #链上美股 #BE
Where do you think this setup is most likely to be wrong?
$BE 24 hours dropped 3.67%. The price touched 263.52, but the funding rate is negative: -0.00006753. Shorts are paying longs, yet the price hasn’t rebounded. This suggests the bearish consensus is strong, but the downside momentum may be weakening—shorts are hard-carrying their costs into the next breakdown.
Core judgment: This is a weak setup where shorts are piling up. The negative funding rate is shorts’ holding cost, not longs’ free coupon. Since the price isn’t moving up, it means buy pressure simply can’t absorb the sell pressure at all. One-signal conclusion: a divergence between price and funding rate.
Strongest counter-evidence: If a high-volume bullish candle appears here, reclaiming the prior candles’ downside (i.e., eating through their losses), then the negative funding rate could become fuel for a short squeeze and directly blow up the shorts. But the current price is still below 264, and longs haven’t made a move.
Second-order impact: Shorts are paying money every day to stay short. If the price continues to trade sideways without dropping further, their costs will accumulate and they may be forced to partially cover, which could cause a modest rebound. But the real liquidity will show up when the prior low is broken.
Invalidation condition: If the price breaks above 264.2 with volume (intra-day high), then this weak-bias judgment is invalidated. A breakout means new capital has entered to take over, and the negative funding structure could reverse.
Action: At the current price of 263.5, you can try a small short position; set the stop-loss at 264.2.
Trading tag: #TradFi #链上美股 #BE
Where do you think this setup is most likely to be wrong?
Core judgment: This is a weak setup where shorts are piling up. The negative funding rate is shorts’ holding cost, not longs’ free coupon. Since the price isn’t moving up, it means buy pressure simply can’t absorb the sell pressure at all. One-signal conclusion: a divergence between price and funding rate.
Strongest counter-evidence: If a high-volume bullish candle appears here, reclaiming the prior candles’ downside (i.e., eating through their losses), then the negative funding rate could become fuel for a short squeeze and directly blow up the shorts. But the current price is still below 264, and longs haven’t made a move.
Second-order impact: Shorts are paying money every day to stay short. If the price continues to trade sideways without dropping further, their costs will accumulate and they may be forced to partially cover, which could cause a modest rebound. But the real liquidity will show up when the prior low is broken.
Invalidation condition: If the price breaks above 264.2 with volume (intra-day high), then this weak-bias judgment is invalidated. A breakout means new capital has entered to take over, and the negative funding structure could reverse.
Action: At the current price of 263.5, you can try a small short position; set the stop-loss at 264.2.
Trading tag: #TradFi #链上美股 #BE
Where do you think this setup is most likely to be wrong?
4
·
--
$BE fell 3.67% over the past 24 hours to a quote of 263.52. But the funding rate is negative—shorts are paying longs.
Price drop plus negative funding is a typical structure of an accumulation of shorts. Shorts are now paying longs every 8 hours; bearish sentiment is getting overheated. Open interest at 26893.85 shows positions are still open—shorts haven’t exited.
The point against the consensus is here: if geopolitical tensions ease, or market risk-off sentiment relaxes, these piled-up shorts can become the targets of a squeeze. They’re paying fees while waiting for more downside. Once the price rebounds by more than half of the past 24-hour drop, or if the funding rate continues to stay negative, a short-squeeze setup is easier to trigger.
What I’m watching is the short-squeeze opportunity. I’m not chasing shorts right now—I’m waiting. If price stabilizes in the 250–265 range, and the funding rate continues to hold negative or deepens further, I’ll try going long with a small position, with a stop-loss set just below the recent low. If the funding rate suddenly turns positive, or if the price breaks below 250 on higher volume, this thesis is invalid.
Trading tag: #TradFi #链上美股 #BE
Where do you think this assessment is most likely to be wrong?
$BE fell 3.67% over the past 24 hours to a quote of 263.52. But the funding rate is negative—shorts are paying longs.
Price drop plus negative funding is a typical structure of an accumulation of shorts. Shorts are now paying longs every 8 hours; bearish sentiment is getting overheated. Open interest at 26893.85 shows positions are still open—shorts haven’t exited.
The point against the consensus is here: if geopolitical tensions ease, or market risk-off sentiment relaxes, these piled-up shorts can become the targets of a squeeze. They’re paying fees while waiting for more downside. Once the price rebounds by more than half of the past 24-hour drop, or if the funding rate continues to stay negative, a short-squeeze setup is easier to trigger.
What I’m watching is the short-squeeze opportunity. I’m not chasing shorts right now—I’m waiting. If price stabilizes in the 250–265 range, and the funding rate continues to hold negative or deepens further, I’ll try going long with a small position, with a stop-loss set just below the recent low. If the funding rate suddenly turns positive, or if the price breaks below 250 on higher volume, this thesis is invalid.
Trading tag: #TradFi #链上美股 #BE
Where do you think this assessment is most likely to be wrong?
Price drop plus negative funding is a typical structure of an accumulation of shorts. Shorts are now paying longs every 8 hours; bearish sentiment is getting overheated. Open interest at 26893.85 shows positions are still open—shorts haven’t exited.
The point against the consensus is here: if geopolitical tensions ease, or market risk-off sentiment relaxes, these piled-up shorts can become the targets of a squeeze. They’re paying fees while waiting for more downside. Once the price rebounds by more than half of the past 24-hour drop, or if the funding rate continues to stay negative, a short-squeeze setup is easier to trigger.
What I’m watching is the short-squeeze opportunity. I’m not chasing shorts right now—I’m waiting. If price stabilizes in the 250–265 range, and the funding rate continues to hold negative or deepens further, I’ll try going long with a small position, with a stop-loss set just below the recent low. If the funding rate suddenly turns positive, or if the price breaks below 250 on higher volume, this thesis is invalid.
Trading tag: #TradFi #链上美股 #BE
Where do you think this assessment is most likely to be wrong?
81
·
--
$BE funding rate -0.00006753. Shorts pay longs, but the price at 263.52 is still falling, down -3.67% in 24 hours. This setup is uncommon.
Single-signal interpretation: A negative funding rate usually suggests crowded shorts, and the price should see a rebound. But $BE continues to grind lower under a negative funding rate, indicating the current selling pressure is driven by real sell orders—not a psychological tug-of-war. Shorts are effectively paying longs, but longs can’t absorb the flow; the order-book discourse power is on the short side.
If macro events like geopolitical risk start to escalate, equity assets are often the first to get hammered. Since $BE is an on-chain U.S. stock contract underlying, it’s hard to escape this logic. A negative funding rate actually gives shorts a cushion: their holding cost is reduced because they receive the funding rate, so they can hold up better.
Next, if the price breaks below 260, I’ll add to the short position with 2x leverage. Stop loss at 270, take profit at 250. If the price rebounds and breaks above 270 and the funding rate turns positive, it means the short consensus has been broken—I will撤 (cancel).
Trading tag: #TradFi #链上美股 #BE
Where do you think this judgment is most likely to be wrong?
$BE funding rate -0.00006753. Shorts pay longs, but the price at 263.52 is still falling, down -3.67% in 24 hours. This setup is uncommon.
Single-signal interpretation: A negative funding rate usually suggests crowded shorts, and the price should see a rebound. But $BE continues to grind lower under a negative funding rate, indicating the current selling pressure is driven by real sell orders—not a psychological tug-of-war. Shorts are effectively paying longs, but longs can’t absorb the flow; the order-book discourse power is on the short side.
If macro events like geopolitical risk start to escalate, equity assets are often the first to get hammered. Since $BE is an on-chain U.S. stock contract underlying, it’s hard to escape this logic. A negative funding rate actually gives shorts a cushion: their holding cost is reduced because they receive the funding rate, so they can hold up better.
Next, if the price breaks below 260, I’ll add to the short position with 2x leverage. Stop loss at 270, take profit at 250. If the price rebounds and breaks above 270 and the funding rate turns positive, it means the short consensus has been broken—I will撤 (cancel).
Trading tag: #TradFi #链上美股 #BE
Where do you think this judgment is most likely to be wrong?
Single-signal interpretation: A negative funding rate usually suggests crowded shorts, and the price should see a rebound. But $BE continues to grind lower under a negative funding rate, indicating the current selling pressure is driven by real sell orders—not a psychological tug-of-war. Shorts are effectively paying longs, but longs can’t absorb the flow; the order-book discourse power is on the short side.
If macro events like geopolitical risk start to escalate, equity assets are often the first to get hammered. Since $BE is an on-chain U.S. stock contract underlying, it’s hard to escape this logic. A negative funding rate actually gives shorts a cushion: their holding cost is reduced because they receive the funding rate, so they can hold up better.
Next, if the price breaks below 260, I’ll add to the short position with 2x leverage. Stop loss at 270, take profit at 250. If the price rebounds and breaks above 270 and the funding rate turns positive, it means the short consensus has been broken—I will撤 (cancel).
Trading tag: #TradFi #链上美股 #BE
Where do you think this judgment is most likely to be wrong?
36

·
--
$BE In the past 24 hours, it has fallen 5.084%. The price is set at 262.69, the funding rate is reported as negative -0.00013683, and open interest is 28695.54 contracts. The numbers come directly from contract data with no processing.
A negative funding rate means shorts are paying longs, which is a classic signal of crowded shorts. The price has dropped 5%, so short accounts are in profit, but they still have to keep pulling out funding. This structure is awkward: once the price rebounds slightly, shorts may collectively cut losses, triggering a stampede. With open interest of 28695 contracts, there is no obvious surge or drop in volume, suggesting the existing position is not exiting in a large-scale way—they’re holding on.
From the semiconductor/AI sector perspective, $BE as a sector bellwether is currently in a short-dominated行情. But with the funding rate so deeply negative, longs are actually “rent collecting,” while the market is ignoring the cost shorts are stuck paying into the funding rate.
My view: in the short term, $BE is more likely to rise than fall, because shorts can’t carry the funding cost for too long. As for action, I choose to go long with a light position. The trigger is: the price holds above 262.69 and the funding rate remains negative. If the price breaks below 255, I withdraw, because that would mean the short force is overpowering the funding-rate support.
Where I’m against the consensus: the market may think the downtrend will continue, but I disagree. The reason is that when the funding rate is negative to this extent, shorts are profitable yet still paying—making them prone to being squeezed.
Position stance is clear: I’ll watch changes in the funding rate. Once it narrows from negative to within -0.0001, I’ll add to the position, but I will never go all-in.
The strongest counter-evidence is: if the semiconductor/AI chain as a whole sees systemic negative news, $BE could be dragged lower and the negative funding rate won’t be able to stop the selling pressure. Second-order effects: if a short squeeze happens, shorts being forced to close will push the price up; liquidity will instantly flow toward longs, and shorts will bear the closing costs. Conversely, if the price keeps grinding lower, longs may not receive enough funding and will be forced to reduce positions.
Failure conditions are clear: my view is most likely wrong if the funding rate does not narrow as expected, or if open interest surges when the price breaks below 255—meaning shorts are adding aggressively and the rebound logic is invalid. If these signals appear, I immediately revoke my bullish view and switch to waiting and observing.
Trading tags: #BinanceFutures #TradFi #USDⓈM #BE #BEUSDT $BE
$BE In the past 24 hours, it has fallen 5.084%. The price is set at 262.69, the funding rate is reported as negative -0.00013683, and open interest is 28695.54 contracts. The numbers come directly from contract data with no processing.
A negative funding rate means shorts are paying longs, which is a classic signal of crowded shorts. The price has dropped 5%, so short accounts are in profit, but they still have to keep pulling out funding. This structure is awkward: once the price rebounds slightly, shorts may collectively cut losses, triggering a stampede. With open interest of 28695 contracts, there is no obvious surge or drop in volume, suggesting the existing position is not exiting in a large-scale way—they’re holding on.
From the semiconductor/AI sector perspective, $BE as a sector bellwether is currently in a short-dominated行情. But with the funding rate so deeply negative, longs are actually “rent collecting,” while the market is ignoring the cost shorts are stuck paying into the funding rate.
My view: in the short term, $BE is more likely to rise than fall, because shorts can’t carry the funding cost for too long. As for action, I choose to go long with a light position. The trigger is: the price holds above 262.69 and the funding rate remains negative. If the price breaks below 255, I withdraw, because that would mean the short force is overpowering the funding-rate support.
Where I’m against the consensus: the market may think the downtrend will continue, but I disagree. The reason is that when the funding rate is negative to this extent, shorts are profitable yet still paying—making them prone to being squeezed.
Position stance is clear: I’ll watch changes in the funding rate. Once it narrows from negative to within -0.0001, I’ll add to the position, but I will never go all-in.
The strongest counter-evidence is: if the semiconductor/AI chain as a whole sees systemic negative news, $BE could be dragged lower and the negative funding rate won’t be able to stop the selling pressure. Second-order effects: if a short squeeze happens, shorts being forced to close will push the price up; liquidity will instantly flow toward longs, and shorts will bear the closing costs. Conversely, if the price keeps grinding lower, longs may not receive enough funding and will be forced to reduce positions.
Failure conditions are clear: my view is most likely wrong if the funding rate does not narrow as expected, or if open interest surges when the price breaks below 255—meaning shorts are adding aggressively and the rebound logic is invalid. If these signals appear, I immediately revoke my bullish view and switch to waiting and observing.
Trading tags: #BinanceFutures #TradFi #USDⓈM #BE #BEUSDT $BE
A negative funding rate means shorts are paying longs, which is a classic signal of crowded shorts. The price has dropped 5%, so short accounts are in profit, but they still have to keep pulling out funding. This structure is awkward: once the price rebounds slightly, shorts may collectively cut losses, triggering a stampede. With open interest of 28695 contracts, there is no obvious surge or drop in volume, suggesting the existing position is not exiting in a large-scale way—they’re holding on.
From the semiconductor/AI sector perspective, $BE as a sector bellwether is currently in a short-dominated行情. But with the funding rate so deeply negative, longs are actually “rent collecting,” while the market is ignoring the cost shorts are stuck paying into the funding rate.
My view: in the short term, $BE is more likely to rise than fall, because shorts can’t carry the funding cost for too long. As for action, I choose to go long with a light position. The trigger is: the price holds above 262.69 and the funding rate remains negative. If the price breaks below 255, I withdraw, because that would mean the short force is overpowering the funding-rate support.
Where I’m against the consensus: the market may think the downtrend will continue, but I disagree. The reason is that when the funding rate is negative to this extent, shorts are profitable yet still paying—making them prone to being squeezed.
Position stance is clear: I’ll watch changes in the funding rate. Once it narrows from negative to within -0.0001, I’ll add to the position, but I will never go all-in.
The strongest counter-evidence is: if the semiconductor/AI chain as a whole sees systemic negative news, $BE could be dragged lower and the negative funding rate won’t be able to stop the selling pressure. Second-order effects: if a short squeeze happens, shorts being forced to close will push the price up; liquidity will instantly flow toward longs, and shorts will bear the closing costs. Conversely, if the price keeps grinding lower, longs may not receive enough funding and will be forced to reduce positions.
Failure conditions are clear: my view is most likely wrong if the funding rate does not narrow as expected, or if open interest surges when the price breaks below 255—meaning shorts are adding aggressively and the rebound logic is invalid. If these signals appear, I immediately revoke my bullish view and switch to waiting and observing.
Trading tags: #BinanceFutures #TradFi #USDⓈM #BE #BEUSDT $BE
51
·
--
$BE 24 hours down 2.33%, and the funding rate is -0.00025. This combination is a typical feature of short-side dominance: a price decline compounded by shorts paying fees indicates crowded positioning for a downward move, with bearish consensus reinforcing itself. From a political-policy perspective, the current market is sensitive to issues such as tariffs, which could easily pull the related underlying assets into a liquidity-contraction vortex. The strongest counter-evidence is that any signal of a policy shift could instantly trigger short covering. Next, if the price cannot reclaim the level above 270, long liquidation stop orders may be triggered, accelerating the move toward further lows.
Trading tag: #TradFi #链上美股 #BE
Where do you think this assessment is most likely to be wrong?
$BE 24 hours down 2.33%, and the funding rate is -0.00025. This combination is a typical feature of short-side dominance: a price decline compounded by shorts paying fees indicates crowded positioning for a downward move, with bearish consensus reinforcing itself. From a political-policy perspective, the current market is sensitive to issues such as tariffs, which could easily pull the related underlying assets into a liquidity-contraction vortex. The strongest counter-evidence is that any signal of a policy shift could instantly trigger short covering. Next, if the price cannot reclaim the level above 270, long liquidation stop orders may be triggered, accelerating the move toward further lows.
Trading tag: #TradFi #链上美股 #BE
Where do you think this assessment is most likely to be wrong?
Trading tag: #TradFi #链上美股 #BE
Where do you think this assessment is most likely to be wrong?
100
Log in to explore more content
Join global crypto users on Binance Square
⚡️ Get latest and useful information about crypto.
💬 Trusted by the world’s largest crypto exchange.
👍 Discover real insights from verified creators.
Email / Phone number
Trending Topics
1
#BitcoinSurpasses$77000
10,818 views
167 Discussing
2
#ParadigmDisclosesZECHolding
41,714 views
796 Discussing
3
#BitcoinETFsShed$450M
20,835 views
187 Discussing
4
#USWeeklyJoblessClaimsFallTo196K
21,998 views
469 Discussing
5
#ArkhamSaysBlackRockBuys$1.5BInETH
3,991 views
51 Discussing
6
#ElSalvadorBTCHoldingsRiseTo7777
48,194 views
776 Discussing
7
#MemeLaunchpads82%OfArcDayOneVolume
52,250 views
959 Discussing
8
#OstiumLoanDisputeHearingSetInNYFederalCourt
42,423 views
685 Discussing
9
#HyperliquidUSDCSupplyOvertakesSolana
18,804 views
339 Discussing
10
#SKPoliceRefer18PolymarketUsersToProsecutors
24,339 views
501 Discussing