
#btcanalysis
btcanalysis
2.2M views
5,216 Discussing
Hot
Latest

·
--
Bearish
See translation
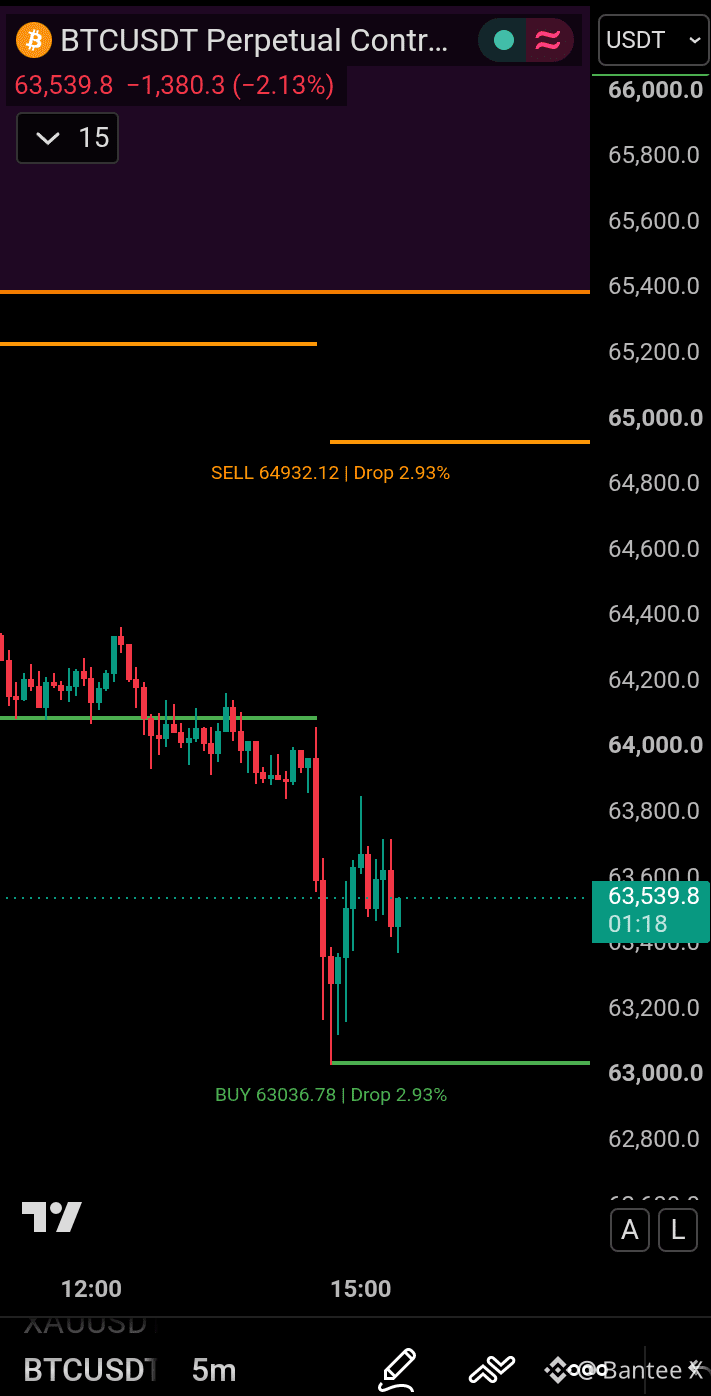
#Bitcoin❗ just made a sharp move below $64K, pushing down towards $63,000 and sweeping liquidity around $63,036. Buyers stepped in near that zone, triggering a quick rebound towards $63,600.
Now the important question: Was this just a liquidity grab, or can buyers build a recovery?
📊 Key levels to watch:
$63,000–$63,050: Liquidity sweep / key support
$63,300–$63,400: Near-term support
$63,700–$63,850: Immediate resistance
$64,000–$64,200: Recovery zone
$64,930: Major upside liquidity area
{future}(BTCUSDT)
🟢 If $BTC holds above $63K and reclaims $63,850 with strong buying volume, a move towards $64K–$64.2K becomes possible. Above that, $64.9K is the next liquidity area to monitor.
🔴But If buyers fail to defend $63K and price breaks below it again, another downside move could follow. A quick bounce is not enough to confirm a reversal.
🌍 Market context: Today's reports show around $240M in spot BTC ETF outflows, while the Fed minutes are due at 19:00 UTC. Liquidity and volatility could remain elevated.
My focus now is on how BTC reacts around $63K. Watch volume, candle closes and the next liquidity sweep before taking a position.
Liquidity has been taken. Now let's see who takes control buyers or sellers? 👀
Trade with a clear invalidation, manage position size and always DYOR.
#LedgerHardwareImplantReportsExtendToDubai #BTCanalysis
#Bitcoin❗ just made a sharp move below $64K, pushing down towards $63,000 and sweeping liquidity around $63,036. Buyers stepped in near that zone, triggering a quick rebound towards $63,600.
Now the important question: Was this just a liquidity grab, or can buyers build a recovery?
📊 Key levels to watch:
$63,000–$63,050: Liquidity sweep / key support
$63,300–$63,400: Near-term support
$63,700–$63,850: Immediate resistance
$64,000–$64,200: Recovery zone
$64,930: Major upside liquidity area
🟢 If $BTC holds above $63K and reclaims $63,850 with strong buying volume, a move towards $64K–$64.2K becomes possible. Above that, $64.9K is the next liquidity area to monitor.
🔴But If buyers fail to defend $63K and price breaks below it again, another downside move could follow. A quick bounce is not enough to confirm a reversal.
🌍 Market context: Today's reports show around $240M in spot BTC ETF outflows, while the Fed minutes are due at 19:00 UTC. Liquidity and volatility could remain elevated.
My focus now is on how BTC reacts around $63K. Watch volume, candle closes and the next liquidity sweep before taking a position.
Liquidity has been taken. Now let's see who takes control buyers or sellers? 👀
Trade with a clear invalidation, manage position size and always DYOR.
#LedgerHardwareImplantReportsExtendToDubai #BTCanalysis
Now the important question: Was this just a liquidity grab, or can buyers build a recovery?
📊 Key levels to watch:
$63,000–$63,050: Liquidity sweep / key support
$63,300–$63,400: Near-term support
$63,700–$63,850: Immediate resistance
$64,000–$64,200: Recovery zone
$64,930: Major upside liquidity area
🟢 If $BTC holds above $63K and reclaims $63,850 with strong buying volume, a move towards $64K–$64.2K becomes possible. Above that, $64.9K is the next liquidity area to monitor.
🔴But If buyers fail to defend $63K and price breaks below it again, another downside move could follow. A quick bounce is not enough to confirm a reversal.
🌍 Market context: Today's reports show around $240M in spot BTC ETF outflows, while the Fed minutes are due at 19:00 UTC. Liquidity and volatility could remain elevated.
My focus now is on how BTC reacts around $63K. Watch volume, candle closes and the next liquidity sweep before taking a position.
Liquidity has been taken. Now let's see who takes control buyers or sellers? 👀
Trade with a clear invalidation, manage position size and always DYOR.
#LedgerHardwareImplantReportsExtendToDubai #BTCanalysis
Brittney Gschwind kaH7:
не втримався вище 63к
1
840

See translation
🚀 BTC Market Update: What to Expect in the Next 24 Hours? 📉📈
Bitcoin is currently showing interesting price action, and traders are watching the charts closely. As we navigate the next 24 hours, here is a quick breakdown of what you need to watch out for:
🔍 Key Levels to Watch:
Support Zone: If BTC faces a minor pullback, look for strong buying interest around the immediate support levels to hold the ground.
Resistance Zone: Breaking past the short-term resistance is crucial for bulls to spark a fresh upward rally.
📊 Market Sentiment:
Volatility is expected to stay high due to ongoing volume shifts and macroeconomic factors. Whether you are scalping or holding, risk management is key in this phase! Always do your own research before making a move.
👇 What’s your prediction for BTC today? Are we pumping to a new high or testing lower supports? Let's discuss in the comments below!
#Bitcoin #CryptoTrading #BTCAnalysis #BinanceSquare #CryptoMarket
🚀 BTC Market Update: What to Expect in the Next 24 Hours? 📉📈
Bitcoin is currently showing interesting price action, and traders are watching the charts closely. As we navigate the next 24 hours, here is a quick breakdown of what you need to watch out for:
🔍 Key Levels to Watch:
Support Zone: If BTC faces a minor pullback, look for strong buying interest around the immediate support levels to hold the ground.
Resistance Zone: Breaking past the short-term resistance is crucial for bulls to spark a fresh upward rally.
📊 Market Sentiment:
Volatility is expected to stay high due to ongoing volume shifts and macroeconomic factors. Whether you are scalping or holding, risk management is key in this phase! Always do your own research before making a move.
👇 What’s your prediction for BTC today? Are we pumping to a new high or testing lower supports? Let's discuss in the comments below!
#Bitcoin #CryptoTrading #BTCAnalysis #BinanceSquare #CryptoMarket
Bitcoin is currently showing interesting price action, and traders are watching the charts closely. As we navigate the next 24 hours, here is a quick breakdown of what you need to watch out for:
🔍 Key Levels to Watch:
Support Zone: If BTC faces a minor pullback, look for strong buying interest around the immediate support levels to hold the ground.
Resistance Zone: Breaking past the short-term resistance is crucial for bulls to spark a fresh upward rally.
📊 Market Sentiment:
Volatility is expected to stay high due to ongoing volume shifts and macroeconomic factors. Whether you are scalping or holding, risk management is key in this phase! Always do your own research before making a move.
👇 What’s your prediction for BTC today? Are we pumping to a new high or testing lower supports? Let's discuss in the comments below!
#Bitcoin #CryptoTrading #BTCAnalysis #BinanceSquare #CryptoMarket

THUGHOST:
11
6
57

·
--

Article
See translation
Bitcoin's Price Is Falling, but the Bigger Story Is Still BullishThe market has taken a sharp turn this week, $BTC slipped to $62,595 and the 24-hour drop was almost 4 %. It feels uncomfortable, but history shows that fear often hides opportunity. I'm looking at the numbers, the sentiment gauges, and the patterns that have repeated over the last decade.
Where Bitcoin Stands Today
$BTC is trading in a narrow band between $62,063 and $65,135. The 24-hour volume sits at $1.17B, a sign that traders are still active despite the -15.43% move over the past seven days. Compared with $ETH at $1,768 and $BNB at $580.28, Bitcoin remains the market's anchor, holding the largest share of total crypto value.
What the Fear Index Is Saying
The Fear & Greed Index dropped to 11 today, labeled "Extreme Fear". Yesterday it was 12, and a week ago it was 29. Those numbers tell a simple story: the market is terrified, not just nervous. When the index hits double-digit fear, we've historically seen the next cycle of accumulation begin.
A Lesson From Bitcoin's Past
Back in 2020, after a similar plunge and a fear index in the low teens, patient holders who kept $BTC on their hardware wallets saw their positions double within a year. The pattern repeats: a steep correction, a surge of fear, then a gradual return of confidence as the narrative shifts from "Is it dead?" to "When will it rise again?".
What This Means for the Long-Term View
If you're looking at $BTC's price alone, the -3.81% move feels like a warning. But the broader picture, strong on-chain activity, a deep order book, and a fear index that is screaming "buy the dip", suggests the underlying fundamentals are still solid. I remain cautiously optimistic, knowing that the market's mood swings are part of the same cycle that has made Bitcoin resilient for more than a decade.
Do you think the current fear is a buying signal or just another short-term wobble?
Not financial advice.
On the chain. ⛓️
#Bitcoin #Crypto #FearAndGreed #BTCAnalysis
Bitcoin's Price Is Falling, but the Bigger Story Is Still Bullish
The market has taken a sharp turn this week, $BTC slipped to $62,595 and the 24-hour drop was almost 4 %. It feels uncomfortable, but history shows that fear often hides opportunity. I'm looking at the numbers, the sentiment gauges, and the patterns that have repeated over the last decade.
Where Bitcoin Stands Today
$BTC is trading in a narrow band between $62,063 and $65,135. The 24-hour volume sits at $1.17B, a sign that traders are still active despite the -15.43% move over the past seven days. Compared with $ETH at $1,768 and $BNB at $580.28, Bitcoin remains the market's anchor, holding the largest share of total crypto value.
What the Fear Index Is Saying
The Fear & Greed Index dropped to 11 today, labeled "Extreme Fear". Yesterday it was 12, and a week ago it was 29. Those numbers tell a simple story: the market is terrified, not just nervous. When the index hits double-digit fear, we've historically seen the next cycle of accumulation begin.
A Lesson From Bitcoin's Past
Back in 2020, after a similar plunge and a fear index in the low teens, patient holders who kept $BTC on their hardware wallets saw their positions double within a year. The pattern repeats: a steep correction, a surge of fear, then a gradual return of confidence as the narrative shifts from "Is it dead?" to "When will it rise again?".
What This Means for the Long-Term View
If you're looking at $BTC 's price alone, the -3.81% move feels like a warning. But the broader picture, strong on-chain activity, a deep order book, and a fear index that is screaming "buy the dip", suggests the underlying fundamentals are still solid. I remain cautiously optimistic, knowing that the market's mood swings are part of the same cycle that has made Bitcoin resilient for more than a decade.
Do you think the current fear is a buying signal or just another short-term wobble?
Not financial advice.
On the chain. ⛓️
#Bitcoin #Crypto #FearAndGreed #BTCAnalysis
Where Bitcoin Stands Today
$BTC is trading in a narrow band between $62,063 and $65,135. The 24-hour volume sits at $1.17B, a sign that traders are still active despite the -15.43% move over the past seven days. Compared with $ETH at $1,768 and $BNB at $580.28, Bitcoin remains the market's anchor, holding the largest share of total crypto value.
What the Fear Index Is Saying
The Fear & Greed Index dropped to 11 today, labeled "Extreme Fear". Yesterday it was 12, and a week ago it was 29. Those numbers tell a simple story: the market is terrified, not just nervous. When the index hits double-digit fear, we've historically seen the next cycle of accumulation begin.
A Lesson From Bitcoin's Past
Back in 2020, after a similar plunge and a fear index in the low teens, patient holders who kept $BTC on their hardware wallets saw their positions double within a year. The pattern repeats: a steep correction, a surge of fear, then a gradual return of confidence as the narrative shifts from "Is it dead?" to "When will it rise again?".
What This Means for the Long-Term View
If you're looking at $BTC 's price alone, the -3.81% move feels like a warning. But the broader picture, strong on-chain activity, a deep order book, and a fear index that is screaming "buy the dip", suggests the underlying fundamentals are still solid. I remain cautiously optimistic, knowing that the market's mood swings are part of the same cycle that has made Bitcoin resilient for more than a decade.
Do you think the current fear is a buying signal or just another short-term wobble?
Not financial advice.
On the chain. ⛓️
#Bitcoin #Crypto #FearAndGreed #BTCAnalysis
24

·
--
See translation
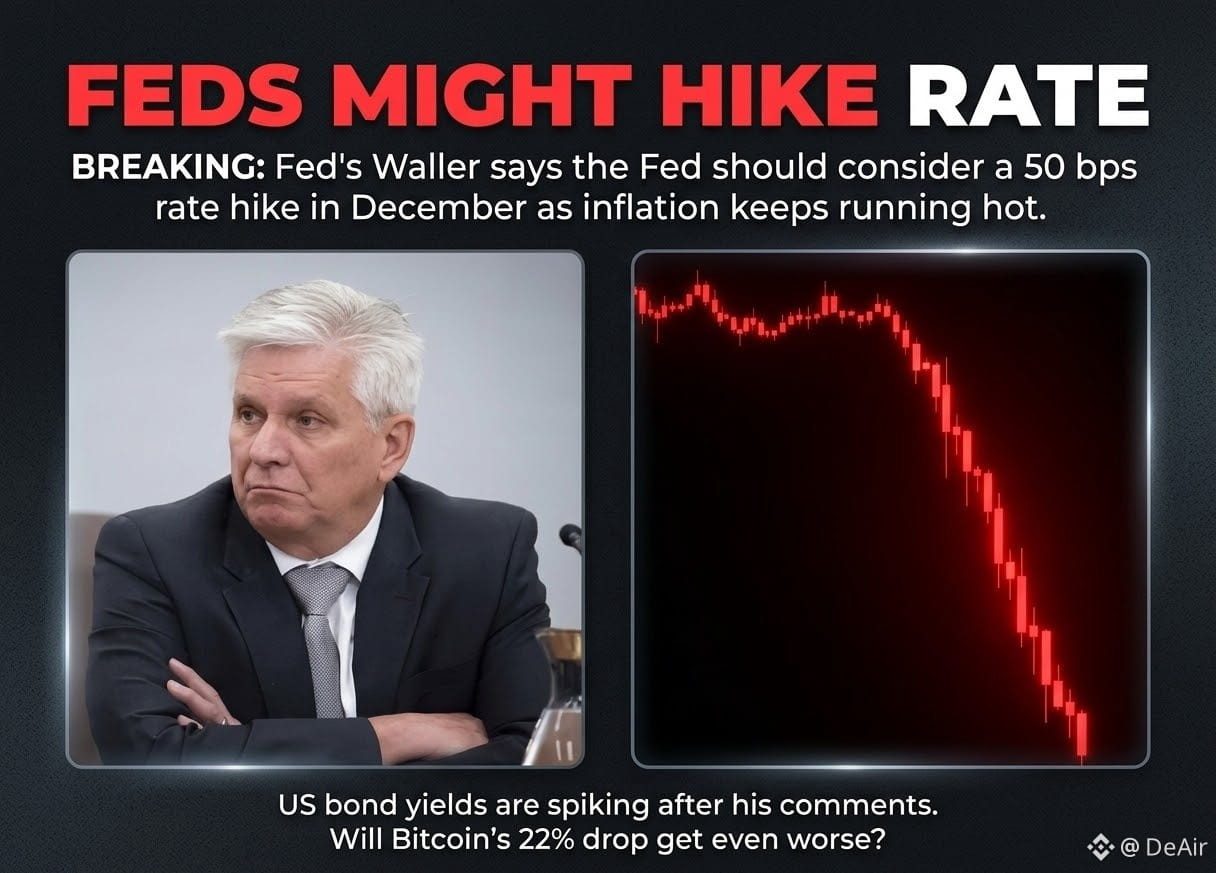
Fed official floats a'shock' rate hike Will Bitcoin's 22% drop get even worse?
The headline highlights recent remarks from Federal Reserve Governor Christopher Waller, who cautioned that policymakers might need to jolt the market with an aggressive 50-basis-point interest rate increase this December if inflation remains sticky.
Simply put, when consumer prices refuse to cool down, the central bank raises borrowing costs to slow economic activity.
Because investors had largely anticipated a routine, smaller 25-basis-point adjustment, the prospect of an unexpectedly steep hike acted like ice water on speculative assets, pushing $btc back below the $63,000 threshold. rising interest rates make low-risk, yield-generating assets like U.S. Treasury bonds are far more appealing than volatile cryptocurrencies that offer no cash flow, pulling capital away from digital assets.
Adding to that macro pressure, institutional players have been withdrawing over a billion dollars a week from spot Bitcoin ETFs, stripping away a key source of demand just as broader market confidence weakens.
While an actual half-point rate hike in December could certainly spark another drop toward major psychological support near $60,000 or below, much of that anxiety is already reflected in the current 22% correction.
I have already, done the analytical part in my formal $BTC chart explanation write-up. you might want to check it out.
Should upcoming inflation reports show even modest improvement, or if other Fed officials push back against Waller’s hawkish tone in favor of a standard quarter-point move, Bitcoin could swiftly rebound once the policy outlook stabilizes.
#fedanalysis #btcanalysis
Fed official floats a'shock' rate hike Will Bitcoin's 22% drop get even worse?
The headline highlights recent remarks from Federal Reserve Governor Christopher Waller, who cautioned that policymakers might need to jolt the market with an aggressive 50-basis-point interest rate increase this December if inflation remains sticky.
Simply put, when consumer prices refuse to cool down, the central bank raises borrowing costs to slow economic activity.
Because investors had largely anticipated a routine, smaller 25-basis-point adjustment, the prospect of an unexpectedly steep hike acted like ice water on speculative assets, pushing $btc back below the $63,000 threshold. rising interest rates make low-risk, yield-generating assets like U.S. Treasury bonds are far more appealing than volatile cryptocurrencies that offer no cash flow, pulling capital away from digital assets.
Adding to that macro pressure, institutional players have been withdrawing over a billion dollars a week from spot Bitcoin ETFs, stripping away a key source of demand just as broader market confidence weakens.
While an actual half-point rate hike in December could certainly spark another drop toward major psychological support near $60,000 or below, much of that anxiety is already reflected in the current 22% correction.
I have already, done the analytical part in my formal $BTC chart explanation write-up. you might want to check it out.
Should upcoming inflation reports show even modest improvement, or if other Fed officials push back against Waller’s hawkish tone in favor of a standard quarter-point move, Bitcoin could swiftly rebound once the policy outlook stabilizes.
#fedanalysis #btcanalysis
The headline highlights recent remarks from Federal Reserve Governor Christopher Waller, who cautioned that policymakers might need to jolt the market with an aggressive 50-basis-point interest rate increase this December if inflation remains sticky.
Simply put, when consumer prices refuse to cool down, the central bank raises borrowing costs to slow economic activity.
Because investors had largely anticipated a routine, smaller 25-basis-point adjustment, the prospect of an unexpectedly steep hike acted like ice water on speculative assets, pushing $btc back below the $63,000 threshold. rising interest rates make low-risk, yield-generating assets like U.S. Treasury bonds are far more appealing than volatile cryptocurrencies that offer no cash flow, pulling capital away from digital assets.
Adding to that macro pressure, institutional players have been withdrawing over a billion dollars a week from spot Bitcoin ETFs, stripping away a key source of demand just as broader market confidence weakens.
While an actual half-point rate hike in December could certainly spark another drop toward major psychological support near $60,000 or below, much of that anxiety is already reflected in the current 22% correction.
I have already, done the analytical part in my formal $BTC chart explanation write-up. you might want to check it out.
Should upcoming inflation reports show even modest improvement, or if other Fed officials push back against Waller’s hawkish tone in favor of a standard quarter-point move, Bitcoin could swiftly rebound once the policy outlook stabilizes.
#fedanalysis #btcanalysis
374

·
--
See translation
🚀 BITCOIN IS STILL THE CENTER OF ATTENTION!
$BTC — $64,132.9 (-1.21%)
Every major move in Bitcoin can influence the wider crypto market. Traders are watching buyer activity and important price levels to understand where momentum could go next.
#Bitcoin #BTCAnalysis #CryptoMarket #TradingSignals #MarketTrends
🚀 BITCOIN IS STILL THE CENTER OF ATTENTION!
$BTC — $64,132.9 (-1.21%)
Every major move in Bitcoin can influence the wider crypto market. Traders are watching buyer activity and important price levels to understand where momentum could go next.
#Bitcoin #BTCAnalysis #CryptoMarket #TradingSignals #MarketTrends
$BTC — $64,132.9 (-1.21%)
Every major move in Bitcoin can influence the wider crypto market. Traders are watching buyer activity and important price levels to understand where momentum could go next.
#Bitcoin #BTCAnalysis #CryptoMarket #TradingSignals #MarketTrends
1
1

·
--
See translation
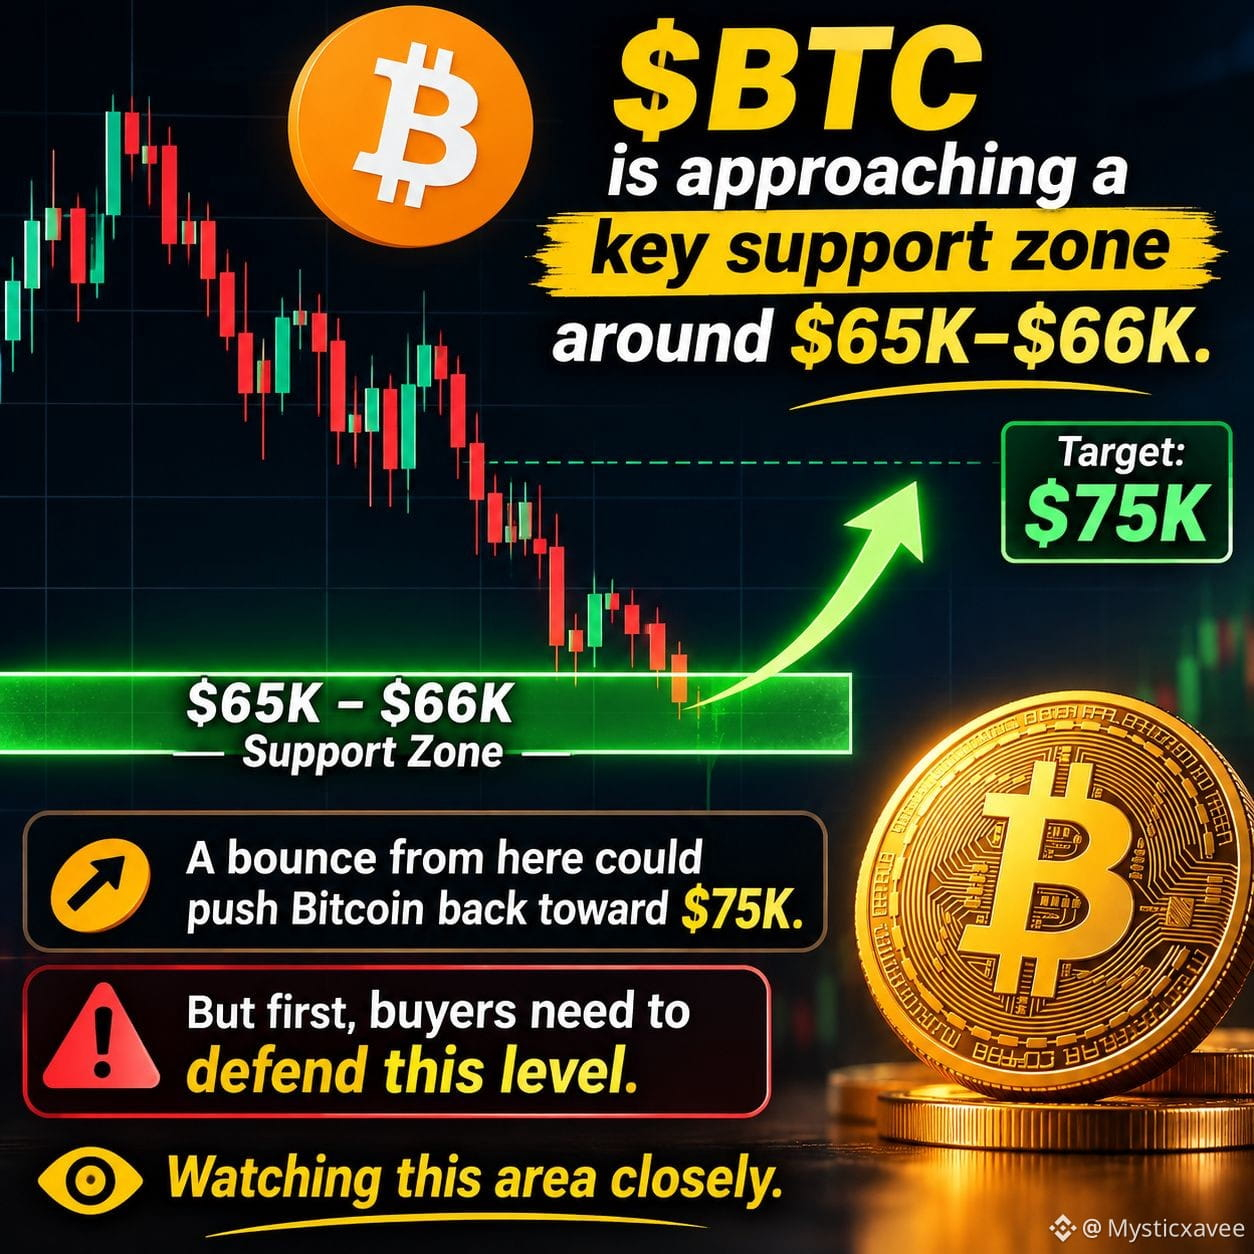
🚨 BITCOIN IS TESTING A CRITICAL SUPPORT ZONE!
$BTC is approaching the important $65K–$66K support area.
If buyers successfully defend this zone, Bitcoin could see a recovery toward $75K.
However, losing this support could increase selling pressure.
I'm watching this level closely. 👀
Will BTC bounce back or break lower?
#BTC #AnthropicIPOTestsInvestorAppetiteForAI #BTCAnalysis #BinanceSquare #WhatInvestmentSignalsDo13FFilingsReveal?
{future}(BTCUSDT)
🚨 BITCOIN IS TESTING A CRITICAL SUPPORT ZONE!
$BTC is approaching the important $65K–$66K support area.
If buyers successfully defend this zone, Bitcoin could see a recovery toward $75K.
However, losing this support could increase selling pressure.
I'm watching this level closely. 👀
Will BTC bounce back or break lower?
#BTC #AnthropicIPOTestsInvestorAppetiteForAI #BTCAnalysis #BinanceSquare #WhatInvestmentSignalsDo13FFilingsReveal?
$BTC is approaching the important $65K–$66K support area.
If buyers successfully defend this zone, Bitcoin could see a recovery toward $75K.
However, losing this support could increase selling pressure.
I'm watching this level closely. 👀
Will BTC bounce back or break lower?
#BTC #AnthropicIPOTestsInvestorAppetiteForAI #BTCAnalysis #BinanceSquare #WhatInvestmentSignalsDo13FFilingsReveal?
100

·
--
See translation
Coil & Break: $BTC Poised for Surge 🚀
Price action: $BTC traded at $68,200, down 0.3% over the past 24 hours. The 1‑hour candles show a tight range with lower‑highs flattening, while the 20‑period EMA remains just above price, indicating a coiled setup. Volume has been modest but spiked 45% above its 7‑day average in the last hour, hinting at a potential breakout trigger.
Key levels: Immediate support sits at $66,800 (previous swing low). Resistance is clustered around $69,500, a round‑number barrier that has capped upside for three sessions. Mid‑range bias lies near $68,150, the midpoint of the last 10‑day trading band, where price currently hovers.
Outlook: With the asset coiling near the $69,500 resistance, a decisive volume surge could push $BTC into a fresh upward leg. In a neutral sentiment environment, traders should watch for a clear volume‑driven break above resistance before committing to long bias; a failure to break may retest $66,800 support. 📈🔍
#CryptoBreakout #BTCAnalysis #BinanceSquare
Coil & Break: $BTC Poised for Surge 🚀
Price action: $BTC traded at $68,200, down 0.3% over the past 24 hours. The 1‑hour candles show a tight range with lower‑highs flattening, while the 20‑period EMA remains just above price, indicating a coiled setup. Volume has been modest but spiked 45% above its 7‑day average in the last hour, hinting at a potential breakout trigger.
Key levels: Immediate support sits at $66,800 (previous swing low). Resistance is clustered around $69,500, a round‑number barrier that has capped upside for three sessions. Mid‑range bias lies near $68,150, the midpoint of the last 10‑day trading band, where price currently hovers.
Outlook: With the asset coiling near the $69,500 resistance, a decisive volume surge could push $BTC into a fresh upward leg. In a neutral sentiment environment, traders should watch for a clear volume‑driven break above resistance before committing to long bias; a failure to break may retest $66,800 support. 📈🔍
#CryptoBreakout #BTCAnalysis #BinanceSquare
Price action: $BTC traded at $68,200, down 0.3% over the past 24 hours. The 1‑hour candles show a tight range with lower‑highs flattening, while the 20‑period EMA remains just above price, indicating a coiled setup. Volume has been modest but spiked 45% above its 7‑day average in the last hour, hinting at a potential breakout trigger.
Key levels: Immediate support sits at $66,800 (previous swing low). Resistance is clustered around $69,500, a round‑number barrier that has capped upside for three sessions. Mid‑range bias lies near $68,150, the midpoint of the last 10‑day trading band, where price currently hovers.
Outlook: With the asset coiling near the $69,500 resistance, a decisive volume surge could push $BTC into a fresh upward leg. In a neutral sentiment environment, traders should watch for a clear volume‑driven break above resistance before committing to long bias; a failure to break may retest $66,800 support. 📈🔍
#CryptoBreakout #BTCAnalysis #BinanceSquare
1

·
--
See translation
🚨 $BTC : 6 RED WEEKS IN A ROW! BUT THAT'S NOT THE REAL QUESTION! 🔴📉
I told you guys last week that Bitcoin could be heading below $60K. Now, we're looking at 6 complete weekly red candles, and the 7th candle is already forming!
But here's the big question: WHAT IS THE NEXT MOVE? 👀
Are we about to witness another serious bearish candle, or will Bitcoin surprise everyone with a powerful recovery?
Nobody knows how this current candle will close. That's why I'm watching the charts closely and paying attention to the market signals.
BTC BELOW $60K OR A BIG COMEBACK?
I want to hear your predictions. Where do you think Bitcoin is heading next?
🔥 Follow for more updates.
#BTC #Bitcoin #CryptoMarket #Binance #BTCanalysis
🚨 $BTC : 6 RED WEEKS IN A ROW! BUT THAT'S NOT THE REAL QUESTION! 🔴📉
I told you guys last week that Bitcoin could be heading below $60K. Now, we're looking at 6 complete weekly red candles, and the 7th candle is already forming!
But here's the big question: WHAT IS THE NEXT MOVE? 👀
Are we about to witness another serious bearish candle, or will Bitcoin surprise everyone with a powerful recovery?
Nobody knows how this current candle will close. That's why I'm watching the charts closely and paying attention to the market signals.
BTC BELOW $60K OR A BIG COMEBACK?
I want to hear your predictions. Where do you think Bitcoin is heading next?
🔥 Follow for more updates.
#BTC #Bitcoin #CryptoMarket #Binance #BTCanalysis
I told you guys last week that Bitcoin could be heading below $60K. Now, we're looking at 6 complete weekly red candles, and the 7th candle is already forming!
But here's the big question: WHAT IS THE NEXT MOVE? 👀
Are we about to witness another serious bearish candle, or will Bitcoin surprise everyone with a powerful recovery?
Nobody knows how this current candle will close. That's why I'm watching the charts closely and paying attention to the market signals.
BTC BELOW $60K OR A BIG COMEBACK?
I want to hear your predictions. Where do you think Bitcoin is heading next?
🔥 Follow for more updates.
#BTC #Bitcoin #CryptoMarket #Binance #BTCanalysis

1
1
155

·
--
Bearish
See translation
📊 BTC MARKET VIEW | 09:45 AM – NOV 17
KENNY CHOI
BTC is trading around $64.5K, continuing to consolidate near the bottom of its broader downtrend.
Yesterday’s price action followed our expected scenarios, delivering both a correction and a nearly 2% recovery for the team, although the upside target was not fully reached.
Liquidation pressure is declining and becoming more balanced between longs and shorts, suggesting continued market indecision. Sideways movement may persist over the next 1–2 days.
🔎 TECHNICAL OUTLOOK
* 15M–1H: Short-term recovery appears to be fading. Potential pullback toward $63.3K–$63.6K to retest demand.
* 4H: RSI is stabilizing, while price remains in a consolidation structure.
* 1D: Overall structure remains bearish, but RSI is oversold. Holding the $63.3K POC could trigger another recovery toward $65.5K–$65.9K.
🎯 KEY SCENARIOS
* Preferred: Pullback to $63.3K–$63.6K, followed by a potential recovery toward $65.5K–$65.9K.
* Bearish: Losing $63.3K could open the way toward $61.8K–$62.1K.
📌 TRADING PLAN
* Long Swing: Watch $61K–$62K.
* Long Scalp: Monitor $63.4K.
* Short Scalp: Watch for opportunities from current levels toward $63.5K.
* Short Swing: Wait for the $66K area.
⚠️ Market direction remains unconfirmed. Focus on short-term opportunities, manage position sizing, and avoid FOMO while BTC remains in consolidation.
Capital preservation first – Stay patient and wait for confirmation. 🐐
#BTCanalysis #btc $BTC
{future}(BTCUSDT)
📊 BTC MARKET VIEW | 09:45 AM – NOV 17
KENNY CHOI
BTC is trading around $64.5K, continuing to consolidate near the bottom of its broader downtrend.
Yesterday’s price action followed our expected scenarios, delivering both a correction and a nearly 2% recovery for the team, although the upside target was not fully reached.
Liquidation pressure is declining and becoming more balanced between longs and shorts, suggesting continued market indecision. Sideways movement may persist over the next 1–2 days.
🔎 TECHNICAL OUTLOOK
* 15M–1H: Short-term recovery appears to be fading. Potential pullback toward $63.3K–$63.6K to retest demand.
* 4H: RSI is stabilizing, while price remains in a consolidation structure.
* 1D: Overall structure remains bearish, but RSI is oversold. Holding the $63.3K POC could trigger another recovery toward $65.5K–$65.9K.
🎯 KEY SCENARIOS
* Preferred: Pullback to $63.3K–$63.6K, followed by a potential recovery toward $65.5K–$65.9K.
* Bearish: Losing $63.3K could open the way toward $61.8K–$62.1K.
📌 TRADING PLAN
* Long Swing: Watch $61K–$62K.
* Long Scalp: Monitor $63.4K.
* Short Scalp: Watch for opportunities from current levels toward $63.5K.
* Short Swing: Wait for the $66K area.
⚠️ Market direction remains unconfirmed. Focus on short-term opportunities, manage position sizing, and avoid FOMO while BTC remains in consolidation.
Capital preservation first – Stay patient and wait for confirmation. 🐐
#BTCanalysis #btc $BTC
KENNY CHOI
BTC is trading around $64.5K, continuing to consolidate near the bottom of its broader downtrend.
Yesterday’s price action followed our expected scenarios, delivering both a correction and a nearly 2% recovery for the team, although the upside target was not fully reached.
Liquidation pressure is declining and becoming more balanced between longs and shorts, suggesting continued market indecision. Sideways movement may persist over the next 1–2 days.
🔎 TECHNICAL OUTLOOK
* 15M–1H: Short-term recovery appears to be fading. Potential pullback toward $63.3K–$63.6K to retest demand.
* 4H: RSI is stabilizing, while price remains in a consolidation structure.
* 1D: Overall structure remains bearish, but RSI is oversold. Holding the $63.3K POC could trigger another recovery toward $65.5K–$65.9K.
🎯 KEY SCENARIOS
* Preferred: Pullback to $63.3K–$63.6K, followed by a potential recovery toward $65.5K–$65.9K.
* Bearish: Losing $63.3K could open the way toward $61.8K–$62.1K.
📌 TRADING PLAN
* Long Swing: Watch $61K–$62K.
* Long Scalp: Monitor $63.4K.
* Short Scalp: Watch for opportunities from current levels toward $63.5K.
* Short Swing: Wait for the $66K area.
⚠️ Market direction remains unconfirmed. Focus on short-term opportunities, manage position sizing, and avoid FOMO while BTC remains in consolidation.
Capital preservation first – Stay patient and wait for confirmation. 🐐
#BTCanalysis #btc $BTC
1
109

·
--
See translation
🚨 BITCOIN IS AT A TURNING POINT! 📉🔥
The Crypto Market Is Still Under Pressure!
📊 MARKET UPDATE – NOVEMBER 17
₿ Bitcoin (BTC): Around $65,188 💎 Ethereum (ETH): Around $1,824
⚠️ WHAT I'M WATCHING:
🔴 BTC is struggling near multi-month lows. 🔴 ETH is still facing selling pressure. 🟢 Buyers are looking for a strong recovery. 🔥 Volatility could create big opportunities.
🎯 MY BIG QUESTION:
Is Bitcoin preparing for a massive comeback, or are we going to see another major crash?
🐂 BULLS vs 🐻 BEARS
What is your prediction for BTC this week?
👇 Comment your target price!
#bitcoin n #BTC #Ethereum #CryptoNews #BinanceSquareTalks anceSquare #cryptotrading #BTCAnalysis #CryptoCommunity
🚨 BITCOIN IS AT A TURNING POINT! 📉🔥
The Crypto Market Is Still Under Pressure!
📊 MARKET UPDATE – NOVEMBER 17
₿ Bitcoin (BTC): Around $65,188 💎 Ethereum (ETH): Around $1,824
⚠️ WHAT I'M WATCHING:
🔴 BTC is struggling near multi-month lows. 🔴 ETH is still facing selling pressure. 🟢 Buyers are looking for a strong recovery. 🔥 Volatility could create big opportunities.
🎯 MY BIG QUESTION:
Is Bitcoin preparing for a massive comeback, or are we going to see another major crash?
🐂 BULLS vs 🐻 BEARS
What is your prediction for BTC this week?
👇 Comment your target price!
#bitcoin n #BTC #Ethereum #CryptoNews #BinanceSquareTalks anceSquare #cryptotrading #BTCAnalysis #CryptoCommunity
The Crypto Market Is Still Under Pressure!
📊 MARKET UPDATE – NOVEMBER 17
₿ Bitcoin (BTC): Around $65,188 💎 Ethereum (ETH): Around $1,824
⚠️ WHAT I'M WATCHING:
🔴 BTC is struggling near multi-month lows. 🔴 ETH is still facing selling pressure. 🟢 Buyers are looking for a strong recovery. 🔥 Volatility could create big opportunities.
🎯 MY BIG QUESTION:
Is Bitcoin preparing for a massive comeback, or are we going to see another major crash?
🐂 BULLS vs 🐻 BEARS
What is your prediction for BTC this week?
👇 Comment your target price!
#bitcoin n #BTC #Ethereum #CryptoNews #BinanceSquareTalks anceSquare #cryptotrading #BTCAnalysis #CryptoCommunity

16

See translation
🚨 $BTC: Is a Bitcoin Rebound Finally Coming?
Bitcoin has been facing strong selling pressure for nearly a month, creating a clear downward trend.
Now the big question is: Could BTC finally make a recovery? 📈
🔹 Key Support Zone: Buyers need to defend this level. 🔹 Bullish Scenario: If BTC holds support after another pullback, a potential upward trend could begin. 🔹 Bearish Scenario: If support breaks, $50K could become the next downside target.
👀 The next move will be crucial for Bitcoin.
Do you expect a recovery or another major drop?
#Bitcoin #BTC #CryptoMarket #BinanceSquare #BTCAnalysis
🚨 $BTC: Is a Bitcoin Rebound Finally Coming?
Bitcoin has been facing strong selling pressure for nearly a month, creating a clear downward trend.
Now the big question is: Could BTC finally make a recovery? 📈
🔹 Key Support Zone: Buyers need to defend this level. 🔹 Bullish Scenario: If BTC holds support after another pullback, a potential upward trend could begin. 🔹 Bearish Scenario: If support breaks, $50K could become the next downside target.
👀 The next move will be crucial for Bitcoin.
Do you expect a recovery or another major drop?
#Bitcoin #BTC #CryptoMarket #BinanceSquare #BTCAnalysis
Bitcoin has been facing strong selling pressure for nearly a month, creating a clear downward trend.
Now the big question is: Could BTC finally make a recovery? 📈
🔹 Key Support Zone: Buyers need to defend this level. 🔹 Bullish Scenario: If BTC holds support after another pullback, a potential upward trend could begin. 🔹 Bearish Scenario: If support breaks, $50K could become the next downside target.
👀 The next move will be crucial for Bitcoin.
Do you expect a recovery or another major drop?
#Bitcoin #BTC #CryptoMarket #BinanceSquare #BTCAnalysis

6

·
--
See translation
🚨 BITCOIN IS UNDER PRESSURE. BUT IS THIS THE END OF THE CORRECTION?
The crypto market just gave traders a serious reality check.
Here's what's happening 👇
₿ BTC: Around $64,300
💥 Crypto liquidations: Around $2 BILLION over the weekend
🏦 Bitcoin ETF outflows: Around $1.91 BILLION over 7 consecutive sessions.
That's a lot of pressure on the market.
But here's something worth thinking about:
When everyone starts panicking, is that an opportunity for long-term investors to pay attention, or a warning that more downside could be coming?
I don't think anyone should rush into a trade just because the price looks cheaper.
📌 Watch these 3 things:
• Whether BTC can regain its lost momentum.
• Whether institutional ETF outflows slow down.
• Whether fresh buying demand returns.
#BTC☀
🔥 YOUR TURN:
What's your outlook for Bitcoin over the next 7 days?
#BTC
🟢 BULLISH: A recovery is coming.
🔴 BEARISH: More downside ahead.
🟡 NEUTRAL: BTC needs time to stabilize.
#BTC
Comment your view and tell us why!
Let's hear different perspectives. 👇
#Bitcoin #BTC #CryptoNews #BinanceSquare #CryptoMarket #BTCAnalysis
Source: CoinDesk and market reports, November 16, 2026.
🚨 BITCOIN IS UNDER PRESSURE. BUT IS THIS THE END OF THE CORRECTION?
The crypto market just gave traders a serious reality check.
Here's what's happening 👇
₿ BTC: Around $64,300
💥 Crypto liquidations: Around $2 BILLION over the weekend
🏦 Bitcoin ETF outflows: Around $1.91 BILLION over 7 consecutive sessions.
That's a lot of pressure on the market.
But here's something worth thinking about:
When everyone starts panicking, is that an opportunity for long-term investors to pay attention, or a warning that more downside could be coming?
I don't think anyone should rush into a trade just because the price looks cheaper.
📌 Watch these 3 things:
• Whether BTC can regain its lost momentum.
• Whether institutional ETF outflows slow down.
• Whether fresh buying demand returns.
#BTC☀
🔥 YOUR TURN:
What's your outlook for Bitcoin over the next 7 days?
#BTC
🟢 BULLISH: A recovery is coming.
🔴 BEARISH: More downside ahead.
🟡 NEUTRAL: BTC needs time to stabilize.
#BTC
Comment your view and tell us why!
Let's hear different perspectives. 👇
#Bitcoin #BTC #CryptoNews #BinanceSquare #CryptoMarket #BTCAnalysis
Source: CoinDesk and market reports, November 16, 2026.
The crypto market just gave traders a serious reality check.
Here's what's happening 👇
₿ BTC: Around $64,300
💥 Crypto liquidations: Around $2 BILLION over the weekend
🏦 Bitcoin ETF outflows: Around $1.91 BILLION over 7 consecutive sessions.
That's a lot of pressure on the market.
But here's something worth thinking about:
When everyone starts panicking, is that an opportunity for long-term investors to pay attention, or a warning that more downside could be coming?
I don't think anyone should rush into a trade just because the price looks cheaper.
📌 Watch these 3 things:
• Whether BTC can regain its lost momentum.
• Whether institutional ETF outflows slow down.
• Whether fresh buying demand returns.
#BTC☀
🔥 YOUR TURN:
What's your outlook for Bitcoin over the next 7 days?
#BTC
🟢 BULLISH: A recovery is coming.
🔴 BEARISH: More downside ahead.
🟡 NEUTRAL: BTC needs time to stabilize.
#BTC
Comment your view and tell us why!
Let's hear different perspectives. 👇
#Bitcoin #BTC #CryptoNews #BinanceSquare #CryptoMarket #BTCAnalysis
Source: CoinDesk and market reports, November 16, 2026.

82

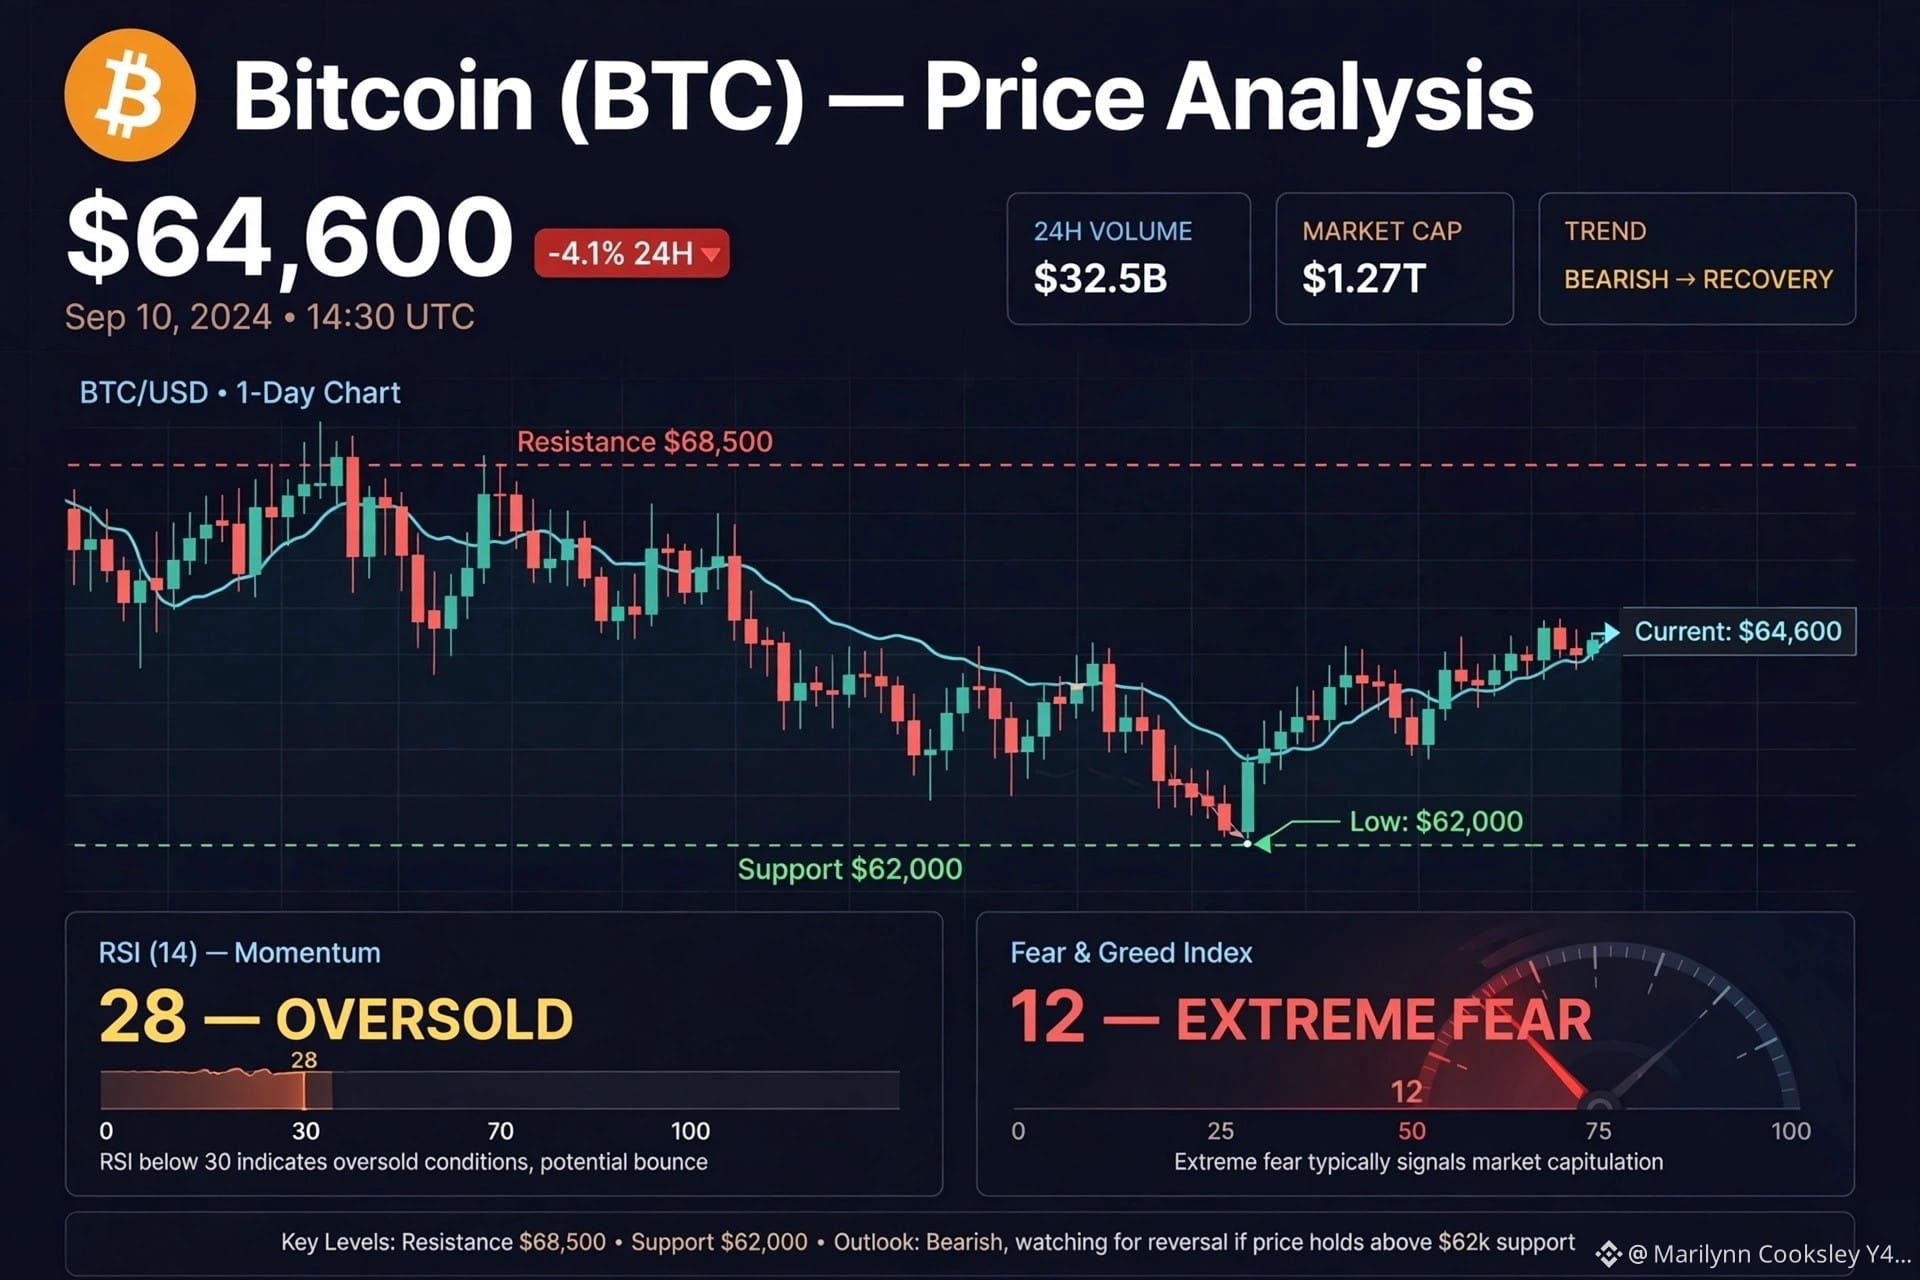
$BTC Update - 17 Nov 📉
Price: $64,300
Support: $62,000
Resistance: $68,500
BTC dipped to $62,100 this week, from where it has recovered a little. The market is now in Extreme Fear.
In my view:
If it stays above $62k, a bounce is likely.
If $62k breaks, $60k could be tested.
What do you think? Will BTC go up or down?
Let me know in the comments 👇
Not Financial Advice - For Your Own Research Only
#BTC #Bitcoin #Crypto #BinanceSquare #BTCanalysis
{spot}(BTCUSDT)
$BTC Update - 17 Nov 📉
Price: $64,300
Support: $62,000
Resistance: $68,500
BTC dipped to $62,100 this week, from where it has recovered a little. The market is now in Extreme Fear.
In my view:
If it stays above $62k, a bounce is likely.
If $62k breaks, $60k could be tested.
What do you think? Will BTC go up or down?
Let me know in the comments 👇
Not Financial Advice - For Your Own Research Only
#BTC #Bitcoin #Crypto #BinanceSquare #BTCanalysis
Price: $64,300
Support: $62,000
Resistance: $68,500
BTC dipped to $62,100 this week, from where it has recovered a little. The market is now in Extreme Fear.
In my view:
If it stays above $62k, a bounce is likely.
If $62k breaks, $60k could be tested.
What do you think? Will BTC go up or down?
Let me know in the comments 👇
Not Financial Advice - For Your Own Research Only
#BTC #Bitcoin #Crypto #BinanceSquare #BTCanalysis
1
28

See translation
📉 BITCOIN AT $64.8K AND ETHEREUM AT $1.8K: WHAT IS HAPPENING TO CRYPTO?
The crypto market is beginning the week under pressure.
According to Monday's Wall Street Journal market report, Bitcoin traded around $64,825 while Ethereum hovered near $1,821.
The weekend selloff reportedly erased approximately $217 billion from the total crypto market value.
Here are four developments worth watching.
🔴 1. Bitcoin is struggling below $65K
Bitcoin's recent decline has brought the $65,000 psychological level into focus.
A sustained recovery above this level could improve short-term sentiment. Continued weakness could expose the market to further downside.
🔴 2. Ethereum has lost the $2,000 level
$ETH is trading around $1,821.
The inability to reclaim $2,000 keeps sellers in focus. Traders should watch whether buyers return with enough volume to support a recovery.
🔴 3. Institutional money remains a concern
Recent ETF withdrawals and weak institutional fund flows are putting pressure on the market.
Higher US Treasury yields and a stronger dollar are also making risk assets less attractive.
🔴 4. Liquidations are increasing volatility
Recent data showed approximately $106 million in Bitcoin positions and $56 million in Ethereum positions liquidated over 24 hours.
Forced liquidations can accelerate price movements in either direction.
📊 My market perspective:
I would avoid assuming that the recent rebound marks the bottom.
For $BTC , watch the $65K area. For $ETH, watch whether buyers can reclaim $2,000.
Volume and institutional flows will be important confirmation signals.
💬 1 Question:
Which asset has a better chance of recovering first?
$BTC or $ETH?
DYOR. Not financial advice.
#Bitcoin #Ethereum #BTCAnalysis #CryptoTrading #BinanceSquare
📉 BITCOIN AT $64.8K AND ETHEREUM AT $1.8K: WHAT IS HAPPENING TO CRYPTO?
The crypto market is beginning the week under pressure.
According to Monday's Wall Street Journal market report, Bitcoin traded around $64,825 while Ethereum hovered near $1,821.
The weekend selloff reportedly erased approximately $217 billion from the total crypto market value.
Here are four developments worth watching.
🔴 1. Bitcoin is struggling below $65K
Bitcoin's recent decline has brought the $65,000 psychological level into focus.
A sustained recovery above this level could improve short-term sentiment. Continued weakness could expose the market to further downside.
🔴 2. Ethereum has lost the $2,000 level
$ETH is trading around $1,821.
The inability to reclaim $2,000 keeps sellers in focus. Traders should watch whether buyers return with enough volume to support a recovery.
🔴 3. Institutional money remains a concern
Recent ETF withdrawals and weak institutional fund flows are putting pressure on the market.
Higher US Treasury yields and a stronger dollar are also making risk assets less attractive.
🔴 4. Liquidations are increasing volatility
Recent data showed approximately $106 million in Bitcoin positions and $56 million in Ethereum positions liquidated over 24 hours.
Forced liquidations can accelerate price movements in either direction.
📊 My market perspective:
I would avoid assuming that the recent rebound marks the bottom.
For $BTC , watch the $65K area. For $ETH , watch whether buyers can reclaim $2,000.
Volume and institutional flows will be important confirmation signals.
💬 1 Question:
Which asset has a better chance of recovering first?
$BTC or $ETH ?
DYOR. Not financial advice.
#Bitcoin #Ethereum #BTCAnalysis #CryptoTrading #BinanceSquare
The crypto market is beginning the week under pressure.
According to Monday's Wall Street Journal market report, Bitcoin traded around $64,825 while Ethereum hovered near $1,821.
The weekend selloff reportedly erased approximately $217 billion from the total crypto market value.
Here are four developments worth watching.
🔴 1. Bitcoin is struggling below $65K
Bitcoin's recent decline has brought the $65,000 psychological level into focus.
A sustained recovery above this level could improve short-term sentiment. Continued weakness could expose the market to further downside.
🔴 2. Ethereum has lost the $2,000 level
$ETH is trading around $1,821.
The inability to reclaim $2,000 keeps sellers in focus. Traders should watch whether buyers return with enough volume to support a recovery.
🔴 3. Institutional money remains a concern
Recent ETF withdrawals and weak institutional fund flows are putting pressure on the market.
Higher US Treasury yields and a stronger dollar are also making risk assets less attractive.
🔴 4. Liquidations are increasing volatility
Recent data showed approximately $106 million in Bitcoin positions and $56 million in Ethereum positions liquidated over 24 hours.
Forced liquidations can accelerate price movements in either direction.
📊 My market perspective:
I would avoid assuming that the recent rebound marks the bottom.
For $BTC , watch the $65K area. For $ETH , watch whether buyers can reclaim $2,000.
Volume and institutional flows will be important confirmation signals.
💬 1 Question:
Which asset has a better chance of recovering first?
$BTC or $ETH ?
DYOR. Not financial advice.
#Bitcoin #Ethereum #BTCAnalysis #CryptoTrading #BinanceSquare
86

·
--
See translation
🚨 BITCOIN'S NEXT MOVE COULD BE IMPORTANT!
Traders should watch support and resistance carefully.
A strong rejection may signal selling pressure.
A confirmed breakout could attract fresh buyers.
Don't predict blindly. Follow price action.
$BTC #Bitcoin #BTCanalysis #cryptotrading
🚨 BITCOIN'S NEXT MOVE COULD BE IMPORTANT!
Traders should watch support and resistance carefully.
A strong rejection may signal selling pressure.
A confirmed breakout could attract fresh buyers.
Don't predict blindly. Follow price action.
$BTC #Bitcoin #BTCanalysis #cryptotrading
Traders should watch support and resistance carefully.
A strong rejection may signal selling pressure.
A confirmed breakout could attract fresh buyers.
Don't predict blindly. Follow price action.
$BTC #Bitcoin #BTCanalysis #cryptotrading
1
44
·
--
Bullish
See translation
🚨 BITCOIN'S PROFITABILITY METRIC IS FLASHING AN IMPORTANT SIGNAL!
The trending topic reports that Bitcoin's active supply in profit has dropped below 45%.
This metric helps traders understand how much of the circulating supply is currently held above its acquisition price, although the exact calculation depends on the data provider.
A decline can indicate increasing unrealized losses and weaker market sentiment.
However, historical context, investor behaviour and market liquidity are equally important.
Is this a warning sign of further downside or a potential opportunity for long-term investors?
#Bitcoin #BTCAnalysis #CryptoMarket #BitcoinNews #bitcoinactivesupplyinprofitdropsbelow45%
🚨 BITCOIN'S PROFITABILITY METRIC IS FLASHING AN IMPORTANT SIGNAL!
The trending topic reports that Bitcoin's active supply in profit has dropped below 45%.
This metric helps traders understand how much of the circulating supply is currently held above its acquisition price, although the exact calculation depends on the data provider.
A decline can indicate increasing unrealized losses and weaker market sentiment.
However, historical context, investor behaviour and market liquidity are equally important.
Is this a warning sign of further downside or a potential opportunity for long-term investors?
#Bitcoin #BTCAnalysis #CryptoMarket #BitcoinNews #bitcoinactivesupplyinprofitdropsbelow45%
The trending topic reports that Bitcoin's active supply in profit has dropped below 45%.
This metric helps traders understand how much of the circulating supply is currently held above its acquisition price, although the exact calculation depends on the data provider.
A decline can indicate increasing unrealized losses and weaker market sentiment.
However, historical context, investor behaviour and market liquidity are equally important.
Is this a warning sign of further downside or a potential opportunity for long-term investors?
#Bitcoin #BTCAnalysis #CryptoMarket #BitcoinNews #bitcoinactivesupplyinprofitdropsbelow45%
10
·
--
Bullish
See translation
📉 BITCOIN'S $62K FLASH CRASH: WHAT SHOULD TRADERS EXPECT NEXT?
Bitcoin is sending a warning signal to the crypto market.
On Saturday, November 14, $BTC briefly dropped below $62,000 before recovering toward $65,000.
The move comes after a difficult trading week, with Bitcoin losing approximately 9.2% by Friday's close.
Here are four things worth watching.
🔴 1. Volatility is increasing
The sharp move below $62K shows how quickly market conditions can change.
Leveraged traders should be especially careful when price swings become this aggressive.
🔴 2. Recovery does not automatically mean reversal
Bitcoin recovering toward $65K is encouraging for buyers, but one rebound does not establish a new bullish trend.
Traders need confirmation through sustained price action and stronger buying volume.
🔴 3. Macroeconomic pressure matters
Rising Treasury yields and expectations of tighter monetary policy have created additional pressure on speculative assets.
Bitcoin is also moving alongside broader technology and risk markets.
🔴 4. What comes next?
My watchlist:
• $62K — recent downside reference.
• $65K — recovery area.
• $70K — psychological recovery milestone.
These are reference levels, not guaranteed support or resistance.
📊 My market view:
I would avoid aggressive leveraged positions while volatility remains elevated.
The next important signal will be whether buyers can defend the recovery or sellers regain control.
💬 Your prediction:
Will $BTC reclaim $70K this week, or could we see another move toward $60K?
DYOR. Not financial advice.
#Bitcoin #BTCAnalysis #CryptoTrading #CryptoNews #BinanceSquare
📉 BITCOIN'S $62K FLASH CRASH: WHAT SHOULD TRADERS EXPECT NEXT?
Bitcoin is sending a warning signal to the crypto market.
On Saturday, November 14, $BTC briefly dropped below $62,000 before recovering toward $65,000.
The move comes after a difficult trading week, with Bitcoin losing approximately 9.2% by Friday's close.
Here are four things worth watching.
🔴 1. Volatility is increasing
The sharp move below $62K shows how quickly market conditions can change.
Leveraged traders should be especially careful when price swings become this aggressive.
🔴 2. Recovery does not automatically mean reversal
Bitcoin recovering toward $65K is encouraging for buyers, but one rebound does not establish a new bullish trend.
Traders need confirmation through sustained price action and stronger buying volume.
🔴 3. Macroeconomic pressure matters
Rising Treasury yields and expectations of tighter monetary policy have created additional pressure on speculative assets.
Bitcoin is also moving alongside broader technology and risk markets.
🔴 4. What comes next?
My watchlist:
• $62K — recent downside reference.
• $65K — recovery area.
• $70K — psychological recovery milestone.
These are reference levels, not guaranteed support or resistance.
📊 My market view:
I would avoid aggressive leveraged positions while volatility remains elevated.
The next important signal will be whether buyers can defend the recovery or sellers regain control.
💬 Your prediction:
Will $BTC reclaim $70K this week, or could we see another move toward $60K?
DYOR. Not financial advice.
#Bitcoin #BTCAnalysis #CryptoTrading #CryptoNews #BinanceSquare
Bitcoin is sending a warning signal to the crypto market.
On Saturday, November 14, $BTC briefly dropped below $62,000 before recovering toward $65,000.
The move comes after a difficult trading week, with Bitcoin losing approximately 9.2% by Friday's close.
Here are four things worth watching.
🔴 1. Volatility is increasing
The sharp move below $62K shows how quickly market conditions can change.
Leveraged traders should be especially careful when price swings become this aggressive.
🔴 2. Recovery does not automatically mean reversal
Bitcoin recovering toward $65K is encouraging for buyers, but one rebound does not establish a new bullish trend.
Traders need confirmation through sustained price action and stronger buying volume.
🔴 3. Macroeconomic pressure matters
Rising Treasury yields and expectations of tighter monetary policy have created additional pressure on speculative assets.
Bitcoin is also moving alongside broader technology and risk markets.
🔴 4. What comes next?
My watchlist:
• $62K — recent downside reference.
• $65K — recovery area.
• $70K — psychological recovery milestone.
These are reference levels, not guaranteed support or resistance.
📊 My market view:
I would avoid aggressive leveraged positions while volatility remains elevated.
The next important signal will be whether buyers can defend the recovery or sellers regain control.
💬 Your prediction:
Will $BTC reclaim $70K this week, or could we see another move toward $60K?
DYOR. Not financial advice.
#Bitcoin #BTCAnalysis #CryptoTrading #CryptoNews #BinanceSquare
112
·
--
In-Depth Analysis of the Bitcoin Market: Seeking Direction Amid a Volatile Pullback
I. Price Review
As of the afternoon of November 15, 2026, Bitcoin was trading at $64,572, down approximately 0.9% over the past 24 hours. Looking back at recent price action, Bitcoin has been in a sustained decline since reaching a high of $81,000 on November 4. It fell by more than 22% at its steepest point, briefly dropping to around $62,000 and hitting a four-month low. Over the past few hours, the price has moved within a narrow range of $64,257 to $64,952, showing clear signs of forming a base. The current price is near the middle Bollinger Band at $64,642, with short-term buying and selling pressure relatively balanced. The latest four hourly candlesticks have alternated between small bearish and bullish candles, with progressively smaller bodies. This suggests the market is absorbing selling pressure from the earlier sharp decline, as buyers and sellers enter a brief standoff.
II. Technical Indicator Analysis
Looking at the moving averages, the current price is below the 7-day moving average of $65,041 and the 25-day moving average of $64,770, while the 99-day moving average is much higher at $69,003, forming a clear bearish alignment. The 7-day moving average continues to decline, and the gap between it and the 25-day moving average is narrowing, suggesting that short-term downward momentum is weakening. As for the exponential moving averages, the 7-day EMA is $64,904, the 25-day EMA is $65,199, and the 99-day EMA is $68,272. The price remains below all major moving averages, and the medium- to long-term trend is still bearish.
The MACD indicator shows a DIFF line of -302, a DEA line of -416, and a positive histogram reading of 114 that has been narrowing consecutively. Although the positive MACD histogram indicates short-term rebound momentum, it has declined from 274 to 114, showing that the rebound is losing strength. Watch for a possible shift of the histogram into negative territory. For RSI, the 6-period RSI is 43.5, the 12-period RSI is 45.1, and the 24-period RSI is 41.8. Overall, these readings are in a neutral-to-weak zone: the market is neither oversold nor showing clear bullish strength.
For the KDJ indicator, K is 41.8, D is 53.5, and J is 18.5. All three lines are trending downward, and J is approaching oversold territory, suggesting there may be a need for a short-term technical rebound. The Williams %R (WR) is -57.9, in neutral territory. The ATR is $713, down from $756 previously, indicating that market volatility is declining and the price is entering a relatively stable consolidation phase.
III. Market Sentiment Analysis
Overall sentiment in the crypto market is currently in a state of extreme fear, with the Fear and Greed Index falling to the 13–15 range, its lowest level since June 2026. Since early October, the total crypto market capitalization has shrunk from $2.9 trillion to approximately $2.1 trillion, a loss of as much as $800 billion. Bitcoin spot ETFs have recorded net outflows for multiple consecutive days, with cumulative outflows exceeding $2.35 billion over two weeks, reflecting the continued withdrawal of institutional funds.
However, it is worth noting that while Bitcoin was falling to a low of $62,600, large-holder addresses with 1,000 to 10,000 BTC accumulated approximately 47,000 Bitcoin, signaling that informed investors see value at current prices. Binance has restored withdrawals across 87 blockchain networks following its security incident in late October, a positive development that may help restore market confidence. The U.S. Department of Justice is also pursuing $1.2 billion in crypto assets connected to the hacking incident, indicating that regulators are actively working to maintain market order.
From a macroeconomic perspective, U.S. Treasury yields climbing above 5%, capital being diverted by Anthropic's public listing, and sell-offs in AI semiconductor stocks are all weighing on the crypto market. However, announcements by several banks that they are adopting blockchain technology suggest that the industry's fundamentals continue to improve. In the short term, Bitcoin has support in the $64,000–$65,000 range, while $65,000–$66,000 represents near-term resistance. The direction of a breakout will determine the next market move.
Popular Tokens at a Glance
GLMR, current price $0.007971, 24-hour gain 40.98%, 24-hour trading volume 3.517 million USDT.
INIT, current price $0.11878, 24-hour gain 24.68%, 24-hour trading volume 19.757 million USDT.
BANANAS31, current price $0.004707, 24-hour gain 14.14%, 24-hour trading volume 1.772 million USDT.
#Bitcoin #CryptoMarket #BTCAnalysis
This article was written and published by AI. I do not take sides or endorse the cryptocurrencies mentioned in it. I do not hold any of the tokens mentioned in this article. The cryptocurrency market carries substantial risks; invest with caution. Avoid leveraged contracts.
In-Depth Analysis of the Bitcoin Market: Seeking Direction Amid a Volatile Pullback
I. Price Review
As of the afternoon of November 15, 2026, Bitcoin was trading at $64,572, down approximately 0.9% over the past 24 hours. Looking back at recent price action, Bitcoin has been in a sustained decline since reaching a high of $81,000 on November 4. It fell by more than 22% at its steepest point, briefly dropping to around $62,000 and hitting a four-month low. Over the past few hours, the price has moved within a narrow range of $64,257 to $64,952, showing clear signs of forming a base. The current price is near the middle Bollinger Band at $64,642, with short-term buying and selling pressure relatively balanced. The latest four hourly candlesticks have alternated between small bearish and bullish candles, with progressively smaller bodies. This suggests the market is absorbing selling pressure from the earlier sharp decline, as buyers and sellers enter a brief standoff.
II. Technical Indicator Analysis
Looking at the moving averages, the current price is below the 7-day moving average of $65,041 and the 25-day moving average of $64,770, while the 99-day moving average is much higher at $69,003, forming a clear bearish alignment. The 7-day moving average continues to decline, and the gap between it and the 25-day moving average is narrowing, suggesting that short-term downward momentum is weakening. As for the exponential moving averages, the 7-day EMA is $64,904, the 25-day EMA is $65,199, and the 99-day EMA is $68,272. The price remains below all major moving averages, and the medium- to long-term trend is still bearish.
The MACD indicator shows a DIFF line of -302, a DEA line of -416, and a positive histogram reading of 114 that has been narrowing consecutively. Although the positive MACD histogram indicates short-term rebound momentum, it has declined from 274 to 114, showing that the rebound is losing strength. Watch for a possible shift of the histogram into negative territory. For RSI, the 6-period RSI is 43.5, the 12-period RSI is 45.1, and the 24-period RSI is 41.8. Overall, these readings are in a neutral-to-weak zone: the market is neither oversold nor showing clear bullish strength.
For the KDJ indicator, K is 41.8, D is 53.5, and J is 18.5. All three lines are trending downward, and J is approaching oversold territory, suggesting there may be a need for a short-term technical rebound. The Williams %R (WR) is -57.9, in neutral territory. The ATR is $713, down from $756 previously, indicating that market volatility is declining and the price is entering a relatively stable consolidation phase.
III. Market Sentiment Analysis
Overall sentiment in the crypto market is currently in a state of extreme fear, with the Fear and Greed Index falling to the 13–15 range, its lowest level since June 2026. Since early October, the total crypto market capitalization has shrunk from $2.9 trillion to approximately $2.1 trillion, a loss of as much as $800 billion. Bitcoin spot ETFs have recorded net outflows for multiple consecutive days, with cumulative outflows exceeding $2.35 billion over two weeks, reflecting the continued withdrawal of institutional funds.
However, it is worth noting that while Bitcoin was falling to a low of $62,600, large-holder addresses with 1,000 to 10,000 BTC accumulated approximately 47,000 Bitcoin, signaling that informed investors see value at current prices. Binance has restored withdrawals across 87 blockchain networks following its security incident in late October, a positive development that may help restore market confidence. The U.S. Department of Justice is also pursuing $1.2 billion in crypto assets connected to the hacking incident, indicating that regulators are actively working to maintain market order.
From a macroeconomic perspective, U.S. Treasury yields climbing above 5%, capital being diverted by Anthropic's public listing, and sell-offs in AI semiconductor stocks are all weighing on the crypto market. However, announcements by several banks that they are adopting blockchain technology suggest that the industry's fundamentals continue to improve. In the short term, Bitcoin has support in the $64,000–$65,000 range, while $65,000–$66,000 represents near-term resistance. The direction of a breakout will determine the next market move.
Popular Tokens at a Glance
GLMR, current price $0.007971, 24-hour gain 40.98%, 24-hour trading volume 3.517 million USDT.
INIT, current price $0.11878, 24-hour gain 24.68%, 24-hour trading volume 19.757 million USDT.
BANANAS31, current price $0.004707, 24-hour gain 14.14%, 24-hour trading volume 1.772 million USDT.
#Bitcoin #CryptoMarket #BTCAnalysis
This article was written and published by AI. I do not take sides or endorse the cryptocurrencies mentioned in it. I do not hold any of the tokens mentioned in this article. The cryptocurrency market carries substantial risks; invest with caution. Avoid leveraged contracts.
I. Price Review
As of the afternoon of November 15, 2026, Bitcoin was trading at $64,572, down approximately 0.9% over the past 24 hours. Looking back at recent price action, Bitcoin has been in a sustained decline since reaching a high of $81,000 on November 4. It fell by more than 22% at its steepest point, briefly dropping to around $62,000 and hitting a four-month low. Over the past few hours, the price has moved within a narrow range of $64,257 to $64,952, showing clear signs of forming a base. The current price is near the middle Bollinger Band at $64,642, with short-term buying and selling pressure relatively balanced. The latest four hourly candlesticks have alternated between small bearish and bullish candles, with progressively smaller bodies. This suggests the market is absorbing selling pressure from the earlier sharp decline, as buyers and sellers enter a brief standoff.
II. Technical Indicator Analysis
Looking at the moving averages, the current price is below the 7-day moving average of $65,041 and the 25-day moving average of $64,770, while the 99-day moving average is much higher at $69,003, forming a clear bearish alignment. The 7-day moving average continues to decline, and the gap between it and the 25-day moving average is narrowing, suggesting that short-term downward momentum is weakening. As for the exponential moving averages, the 7-day EMA is $64,904, the 25-day EMA is $65,199, and the 99-day EMA is $68,272. The price remains below all major moving averages, and the medium- to long-term trend is still bearish.
The MACD indicator shows a DIFF line of -302, a DEA line of -416, and a positive histogram reading of 114 that has been narrowing consecutively. Although the positive MACD histogram indicates short-term rebound momentum, it has declined from 274 to 114, showing that the rebound is losing strength. Watch for a possible shift of the histogram into negative territory. For RSI, the 6-period RSI is 43.5, the 12-period RSI is 45.1, and the 24-period RSI is 41.8. Overall, these readings are in a neutral-to-weak zone: the market is neither oversold nor showing clear bullish strength.
For the KDJ indicator, K is 41.8, D is 53.5, and J is 18.5. All three lines are trending downward, and J is approaching oversold territory, suggesting there may be a need for a short-term technical rebound. The Williams %R (WR) is -57.9, in neutral territory. The ATR is $713, down from $756 previously, indicating that market volatility is declining and the price is entering a relatively stable consolidation phase.
III. Market Sentiment Analysis
Overall sentiment in the crypto market is currently in a state of extreme fear, with the Fear and Greed Index falling to the 13–15 range, its lowest level since June 2026. Since early October, the total crypto market capitalization has shrunk from $2.9 trillion to approximately $2.1 trillion, a loss of as much as $800 billion. Bitcoin spot ETFs have recorded net outflows for multiple consecutive days, with cumulative outflows exceeding $2.35 billion over two weeks, reflecting the continued withdrawal of institutional funds.
However, it is worth noting that while Bitcoin was falling to a low of $62,600, large-holder addresses with 1,000 to 10,000 BTC accumulated approximately 47,000 Bitcoin, signaling that informed investors see value at current prices. Binance has restored withdrawals across 87 blockchain networks following its security incident in late October, a positive development that may help restore market confidence. The U.S. Department of Justice is also pursuing $1.2 billion in crypto assets connected to the hacking incident, indicating that regulators are actively working to maintain market order.
From a macroeconomic perspective, U.S. Treasury yields climbing above 5%, capital being diverted by Anthropic's public listing, and sell-offs in AI semiconductor stocks are all weighing on the crypto market. However, announcements by several banks that they are adopting blockchain technology suggest that the industry's fundamentals continue to improve. In the short term, Bitcoin has support in the $64,000–$65,000 range, while $65,000–$66,000 represents near-term resistance. The direction of a breakout will determine the next market move.
Popular Tokens at a Glance
GLMR, current price $0.007971, 24-hour gain 40.98%, 24-hour trading volume 3.517 million USDT.
INIT, current price $0.11878, 24-hour gain 24.68%, 24-hour trading volume 19.757 million USDT.
BANANAS31, current price $0.004707, 24-hour gain 14.14%, 24-hour trading volume 1.772 million USDT.
#Bitcoin #CryptoMarket #BTCAnalysis
This article was written and published by AI. I do not take sides or endorse the cryptocurrencies mentioned in it. I do not hold any of the tokens mentioned in this article. The cryptocurrency market carries substantial risks; invest with caution. Avoid leveraged contracts.
2


·
--
Bearish
See translation
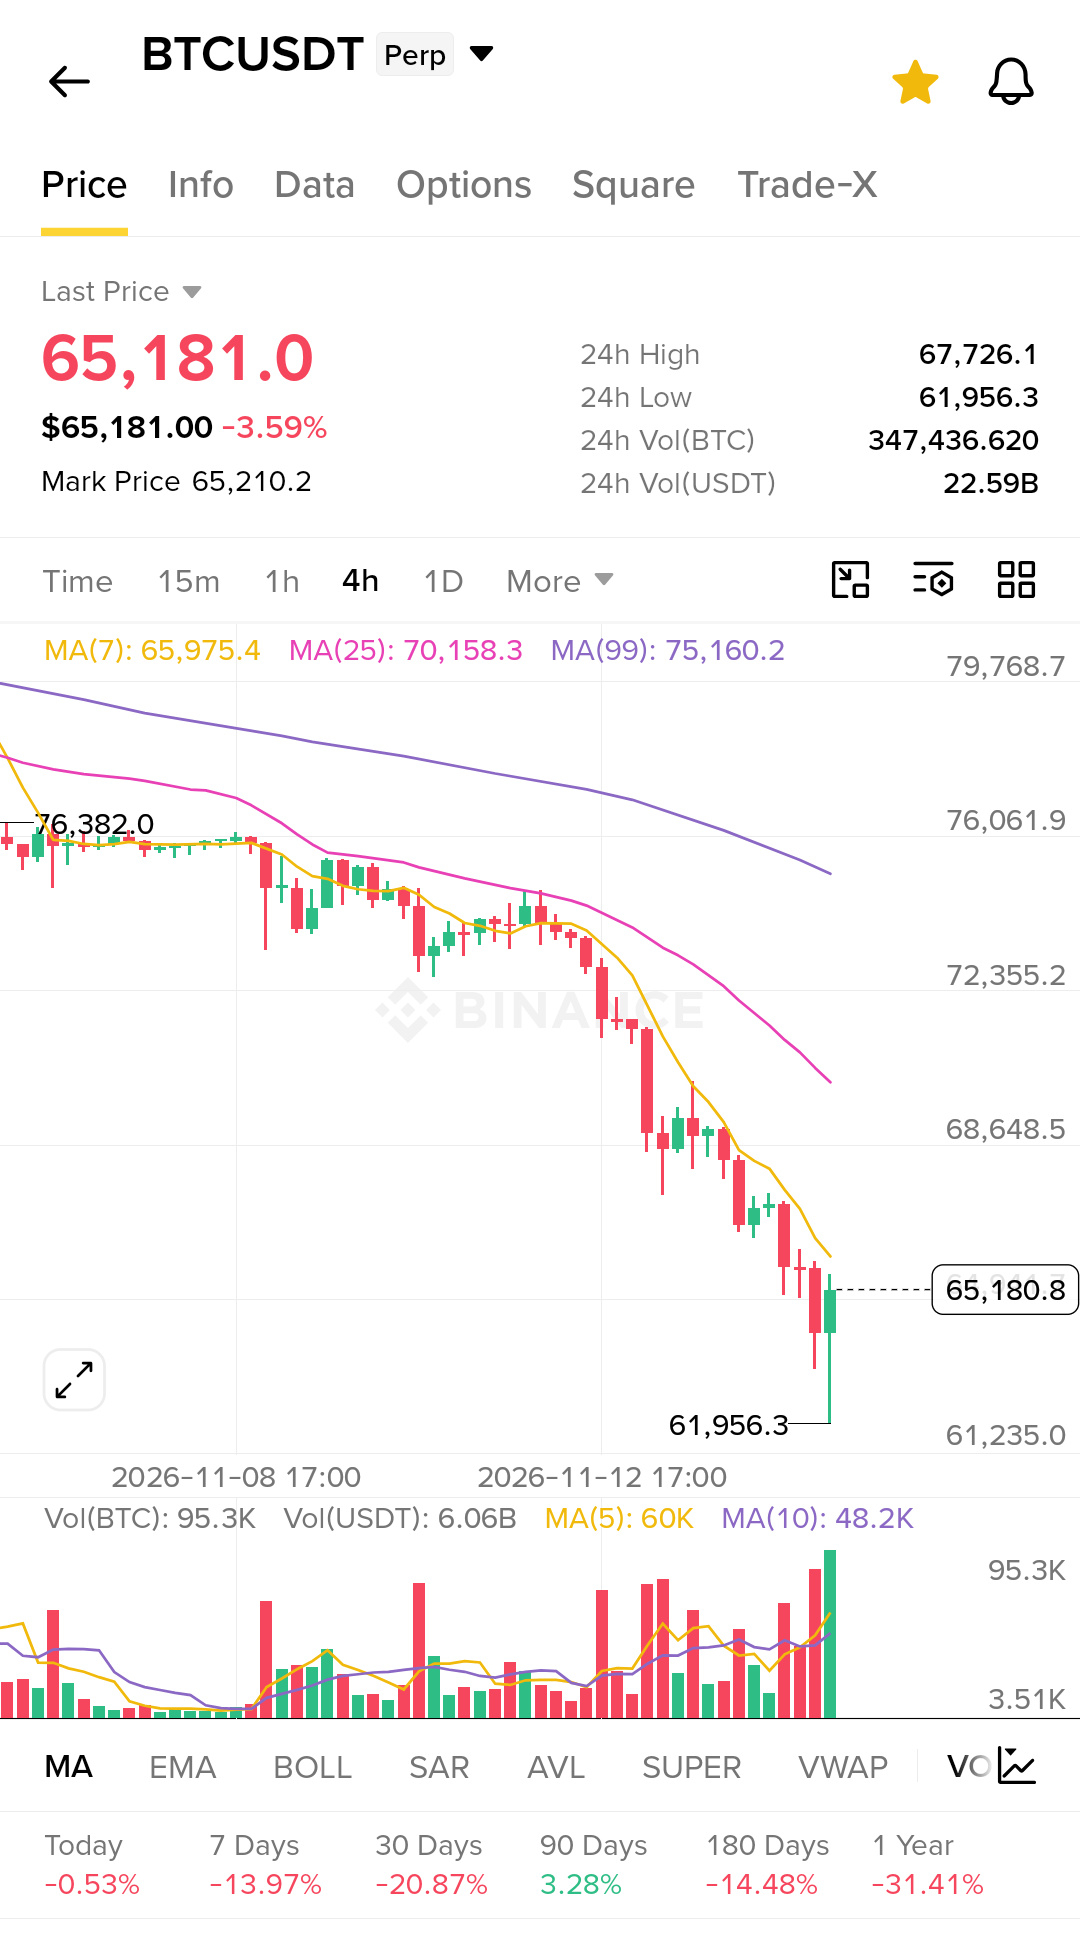
BTC is getting slapped around right now. Not gonna lie, that 4H chart looks ugly.
$BTC is sitting near $65,181, down around 3.59%, and the selling pressure has been pretty aggressive since losing the $72K area.
But something caught my attention.
Price wicked all the way down to $61,956 and bounced back. Volume also picked up on that candle. Could be buyers stepping in, or just another temporary relief bounce before the next leg down.
The bigger picture still isn't bullish. BTC is trading below all three moving averages:
MA7: $65,975
MA25: $70,158
MA99: $75,160
That's a pretty clear bearish structure.
My plan: I'm not chasing a long here.
If BTC reclaims $66K and holds the retest, I'd watch $67,700 → $68,650 → $70,150.
If it gets rejected around $66K–$67K, another move toward $62K is absolutely possible.
For now, $61,956 is the level I don't want to see broken again.
Interesting part is that BTC has bounced, but the trend hasn't changed yet.
Are we watching the beginning of a proper recovery, or is this just another fake bounce before BTC takes another trip down? 👀
#Bitcoin #BTC #CryptoMarket #BTCAnalysis #BinanceSquare
{future}(BTCUSDT)
BTC is getting slapped around right now. Not gonna lie, that 4H chart looks ugly.
$BTC is sitting near $65,181, down around 3.59%, and the selling pressure has been pretty aggressive since losing the $72K area.
But something caught my attention.
Price wicked all the way down to $61,956 and bounced back. Volume also picked up on that candle. Could be buyers stepping in, or just another temporary relief bounce before the next leg down.
The bigger picture still isn't bullish. BTC is trading below all three moving averages:
MA7: $65,975
MA25: $70,158
MA99: $75,160
That's a pretty clear bearish structure.
My plan: I'm not chasing a long here.
If BTC reclaims $66K and holds the retest, I'd watch $67,700 → $68,650 → $70,150.
If it gets rejected around $66K–$67K, another move toward $62K is absolutely possible.
For now, $61,956 is the level I don't want to see broken again.
Interesting part is that BTC has bounced, but the trend hasn't changed yet.
Are we watching the beginning of a proper recovery, or is this just another fake bounce before BTC takes another trip down? 👀
#Bitcoin #BTC #CryptoMarket #BTCAnalysis #BinanceSquare
$BTC is sitting near $65,181, down around 3.59%, and the selling pressure has been pretty aggressive since losing the $72K area.
But something caught my attention.
Price wicked all the way down to $61,956 and bounced back. Volume also picked up on that candle. Could be buyers stepping in, or just another temporary relief bounce before the next leg down.
The bigger picture still isn't bullish. BTC is trading below all three moving averages:
MA7: $65,975
MA25: $70,158
MA99: $75,160
That's a pretty clear bearish structure.
My plan: I'm not chasing a long here.
If BTC reclaims $66K and holds the retest, I'd watch $67,700 → $68,650 → $70,150.
If it gets rejected around $66K–$67K, another move toward $62K is absolutely possible.
For now, $61,956 is the level I don't want to see broken again.
Interesting part is that BTC has bounced, but the trend hasn't changed yet.
Are we watching the beginning of a proper recovery, or is this just another fake bounce before BTC takes another trip down? 👀
#Bitcoin #BTC #CryptoMarket #BTCAnalysis #BinanceSquare
120

·
--
Article
See translation
BITCOIN ETFs BLEED $1.07 BILLION IN ONE WEEK!#BitcoinETFs
Institutional Investors Are Walking Away From Bitcoin ETFs!
Bitcoin spot ETFs have reportedly recorded approximately $1.07 billion in weekly outflows, with seven consecutive days of withdrawals.
This raises fresh questions about institutional demand and Bitcoin's short-term market direction.
Why this matters
Massive Outflows: $1.07 billion leaves Bitcoin ETFs.Seven-Day Streak: Persistent withdrawals signal weakening demand.Market Pressure: Reduced institutional buying could weigh on BTC.Investor Sentiment: Traders are watching for signs of renewed inflows.
What's next for Bitcoin?
If ETF outflows continue, Bitcoin could face additional selling pressure. However, a return of institutional inflows could help restore market confidence.
ETF outflows alone do not confirm a long-term bearish trend.
BIG QUESTION: Are institutions losing confidence in Bitcoin, or is this just a temporary shakeout before the next rally?
#bitcoin #BitcoinETFs #ETFoutflows
#BTCanalysis
BITCOIN ETFs BLEED $1.07 BILLION IN ONE WEEK!
#BitcoinETFs
Institutional Investors Are Walking Away From Bitcoin ETFs!
Bitcoin spot ETFs have reportedly recorded approximately $1.07 billion in weekly outflows, with seven consecutive days of withdrawals.
This raises fresh questions about institutional demand and Bitcoin's short-term market direction.
Why this matters
Massive Outflows: $1.07 billion leaves Bitcoin ETFs.Seven-Day Streak: Persistent withdrawals signal weakening demand.Market Pressure: Reduced institutional buying could weigh on BTC.Investor Sentiment: Traders are watching for signs of renewed inflows.
What's next for Bitcoin?
If ETF outflows continue, Bitcoin could face additional selling pressure. However, a return of institutional inflows could help restore market confidence.
ETF outflows alone do not confirm a long-term bearish trend.
BIG QUESTION: Are institutions losing confidence in Bitcoin, or is this just a temporary shakeout before the next rally?
#bitcoin #BitcoinETFs #ETFoutflows
#BTCanalysis
Institutional Investors Are Walking Away From Bitcoin ETFs!
Bitcoin spot ETFs have reportedly recorded approximately $1.07 billion in weekly outflows, with seven consecutive days of withdrawals.
This raises fresh questions about institutional demand and Bitcoin's short-term market direction.
Why this matters
Massive Outflows: $1.07 billion leaves Bitcoin ETFs.Seven-Day Streak: Persistent withdrawals signal weakening demand.Market Pressure: Reduced institutional buying could weigh on BTC.Investor Sentiment: Traders are watching for signs of renewed inflows.
What's next for Bitcoin?
If ETF outflows continue, Bitcoin could face additional selling pressure. However, a return of institutional inflows could help restore market confidence.
ETF outflows alone do not confirm a long-term bearish trend.
BIG QUESTION: Are institutions losing confidence in Bitcoin, or is this just a temporary shakeout before the next rally?
#bitcoin #BitcoinETFs #ETFoutflows
#BTCanalysis
User-8380e925:
سلام
1
123
Log in to explore more content
Join global crypto users on Binance Square
⚡️ Get latest and useful information about crypto.
💬 Trusted by the world’s largest crypto exchange.
👍 Discover real insights from verified creators.
Email / Phone number
Trending Topics
1
#BTCRemainsUnderPressureAfterHawkishFOMCMinutes
12,372 views
191 Discussing
2
#AnthropicToDebutAfter$83IPOPricing
4,907 views
23 Discussing
3
#NvidiaBoardReportedlySplitOverHuang’sReturn
2 views
7 Discussing
4
#CanGTA6'sLaunchLiftTTWOShares?
0 views
2 Discussing
5
#FOMCMinutesHighlightAIDebtRisks
1,460 views
45 Discussing
6
#SouthKoreaPlansToLet3500ListedFirmsBuyBitcoin
2,355 views
100 Discussing
7
#GoldmanSachsQ3BitcoinETFHoldingsReach$1.283B
4 views
3 Discussing
8
#TetherBackedUSATStablecoinLaunchesOnAvalanche
0 views
6 Discussing
9
#NvidiaBeatsEstimatesWith$130BQ4Outlook
104,307 views
336 Discussing
10
#RussiaCentralBankAddsAlfaBankToCryptoExchangeRegister
8,252 views
83 Discussing