
Ghost Writer
7.5k Posts

Ghost Writer
Report
Block User
Research & summarize the latest Crypto market news | BNB Holder | Web 3 Airdrop | X: @GhostxWriterx
Open Trade
High-Frequency Trader
5.6 Years
756 Following
14.4K+ Followers
23.6K+ Liked
Posts
Portfolio
All
Quotes
Videos
Live
PINNED
·
--
Bullish
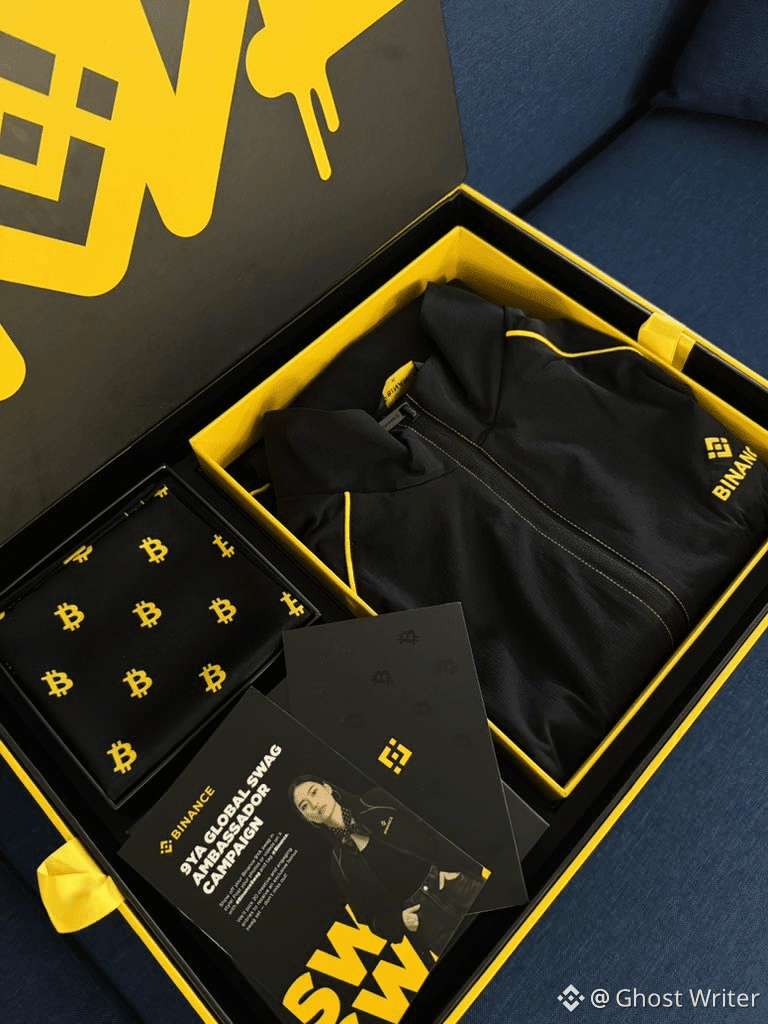
Thanks @Binance_Vietnam , @Binance_Square_Official for the beautiful 9YA swag box 🎁
Keep building on Square then you can get many guys
#GiftBoxes #crypto
Thanks @Binance Vietnam , @Binance Square Official for the beautiful 9YA swag box 🎁
Keep building on Square then you can get many guys
#GiftBoxes #crypto
Keep building on Square then you can get many guys
#GiftBoxes #crypto

33
2
89
31.1k
·
--
Bullish
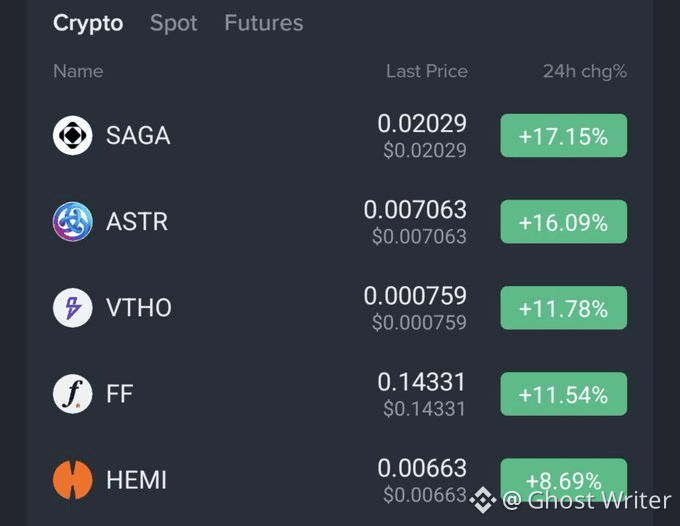
Play-to-Earn and Content Creation tokens are leading today's market momentum!
While DePIN and AI Memes cool off, gaming & creator narratives are pulling ahead:
🟢 Play to Earn: +15.67%
🟢 Content Creation: +8.34%
Top gainers showing strong strength:
🚀 $SAGA (+17.15%)
🚀 $ASTR (+16.09%)
🚀 $VTHO (+11.78%)
Is GameFi back on the menu or just a temporary pulse? What are you holding?
{future}(SAGAUSDT)
{future}(ASTRUSDT)
{future}(VTHOUSDT)
#GameFi #TrendingTopic
Play-to-Earn and Content Creation tokens are leading today's market momentum!
While DePIN and AI Memes cool off, gaming & creator narratives are pulling ahead:
🟢 Play to Earn: +15.67%
🟢 Content Creation: +8.34%
Top gainers showing strong strength:
🚀 $SAGA (+17.15%)
🚀 $ASTR (+16.09%)
🚀 $VTHO (+11.78%)
Is GameFi back on the menu or just a temporary pulse? What are you holding?
#GameFi #TrendingTopic
While DePIN and AI Memes cool off, gaming & creator narratives are pulling ahead:
🟢 Play to Earn: +15.67%
🟢 Content Creation: +8.34%
Top gainers showing strong strength:
🚀 $SAGA (+17.15%)
🚀 $ASTR (+16.09%)
🚀 $VTHO (+11.78%)
Is GameFi back on the menu or just a temporary pulse? What are you holding?
#GameFi #TrendingTopic
328
·
--
Bullish
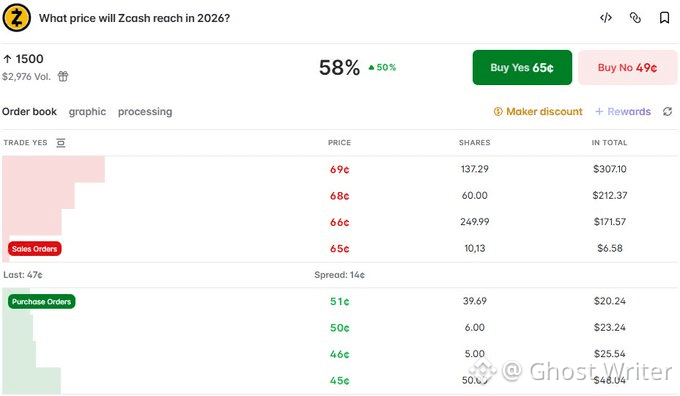
💥BREAKING NEWS: On @polymarket the odds that #ZCash reaches a higher price than $1,500 increased to a whopping 58% by a 50% upward surge recently.
⚡️There is a high chance that when $ZEC ETF volumes keep accelerating to the upside, these prices per ZEC will be seen before the end of 2026.
Especially, when the ZEC price trends into new highs again we could see the odds of reaching above $1,500 increase more in the next times.🚀
#zec #etf
💥BREAKING NEWS: On @polymarket the odds that #ZCash reaches a higher price than $1,500 increased to a whopping 58% by a 50% upward surge recently.
⚡️There is a high chance that when $ZEC ETF volumes keep accelerating to the upside, these prices per ZEC will be seen before the end of 2026.
Especially, when the ZEC price trends into new highs again we could see the odds of reaching above $1,500 increase more in the next times.🚀
#zec #etf
⚡️There is a high chance that when $ZEC ETF volumes keep accelerating to the upside, these prices per ZEC will be seen before the end of 2026.
Especially, when the ZEC price trends into new highs again we could see the odds of reaching above $1,500 increase more in the next times.🚀
#zec #etf
343
·
--
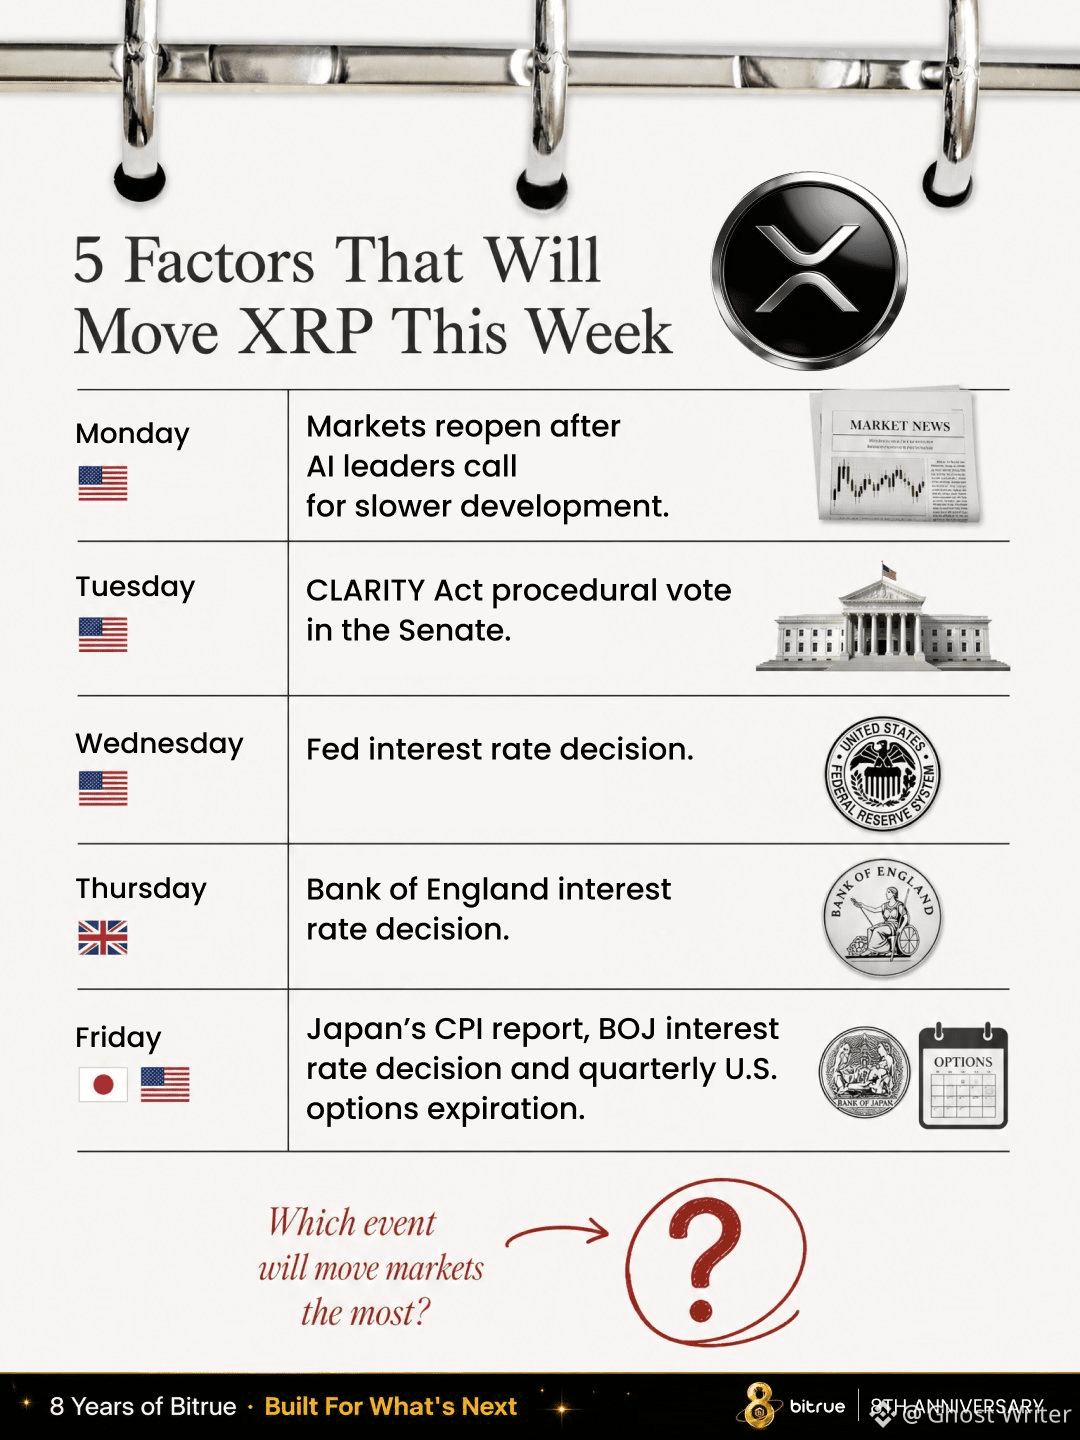
🚀For those of you wondering, here are 5 factors that will move $XRP this week
Monday 🇺🇸
Markets reopen after AI leaders call for slower development.
Tuesday 🇺🇸
CLARITY Act procedural vote in the Senate.
Wednesday 🇺🇸
Fed interest rate decision.
Thursday 🇬🇧
Bank of England interest rate decision.
Friday 🇯🇵🇺🇸
Japan’s CPI report, BOJ interest rate decision and quarterly U.S. options expiration.
Which event will move #xrp Price the most?
#FedRateWatch
🚀For those of you wondering, here are 5 factors that will move $XRP this week
Monday 🇺🇸
Markets reopen after AI leaders call for slower development.
Tuesday 🇺🇸
CLARITY Act procedural vote in the Senate.
Wednesday 🇺🇸
Fed interest rate decision.
Thursday 🇬🇧
Bank of England interest rate decision.
Friday 🇯🇵🇺🇸
Japan’s CPI report, BOJ interest rate decision and quarterly U.S. options expiration.
Which event will move #xrp Price the most?
#FedRateWatch
Monday 🇺🇸
Markets reopen after AI leaders call for slower development.
Tuesday 🇺🇸
CLARITY Act procedural vote in the Senate.
Wednesday 🇺🇸
Fed interest rate decision.
Thursday 🇬🇧
Bank of England interest rate decision.
Friday 🇯🇵🇺🇸
Japan’s CPI report, BOJ interest rate decision and quarterly U.S. options expiration.
Which event will move #xrp Price the most?
#FedRateWatch
1
151
·
--
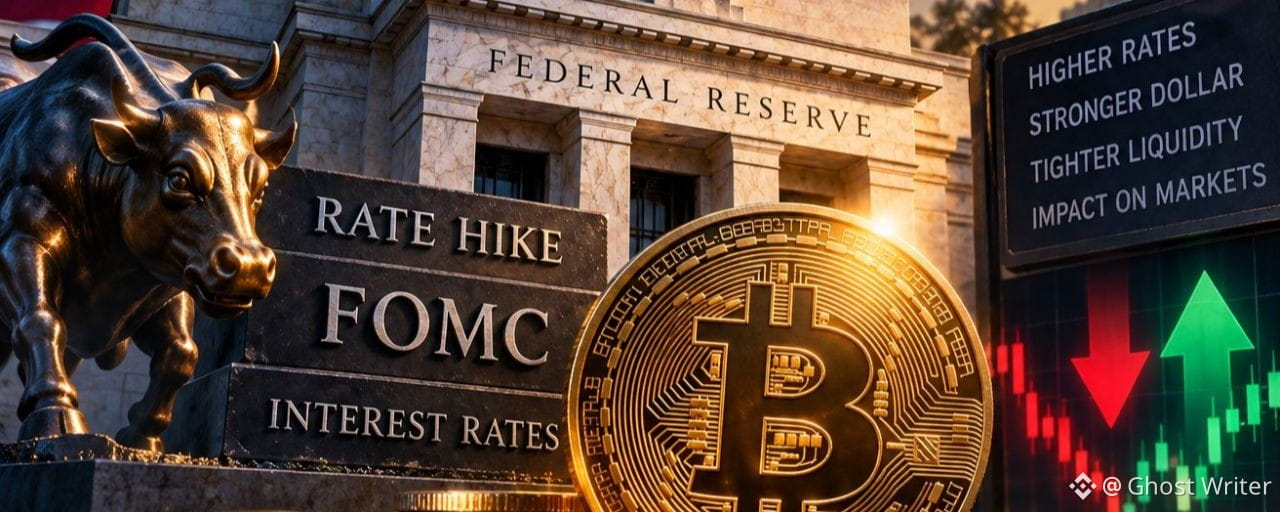
Article
The Fed Is About to Hike a Number the Market Already Paid For. The Real Risk Is DecemberAlmost nobody is arguing about 25 basis points anymore 🤔
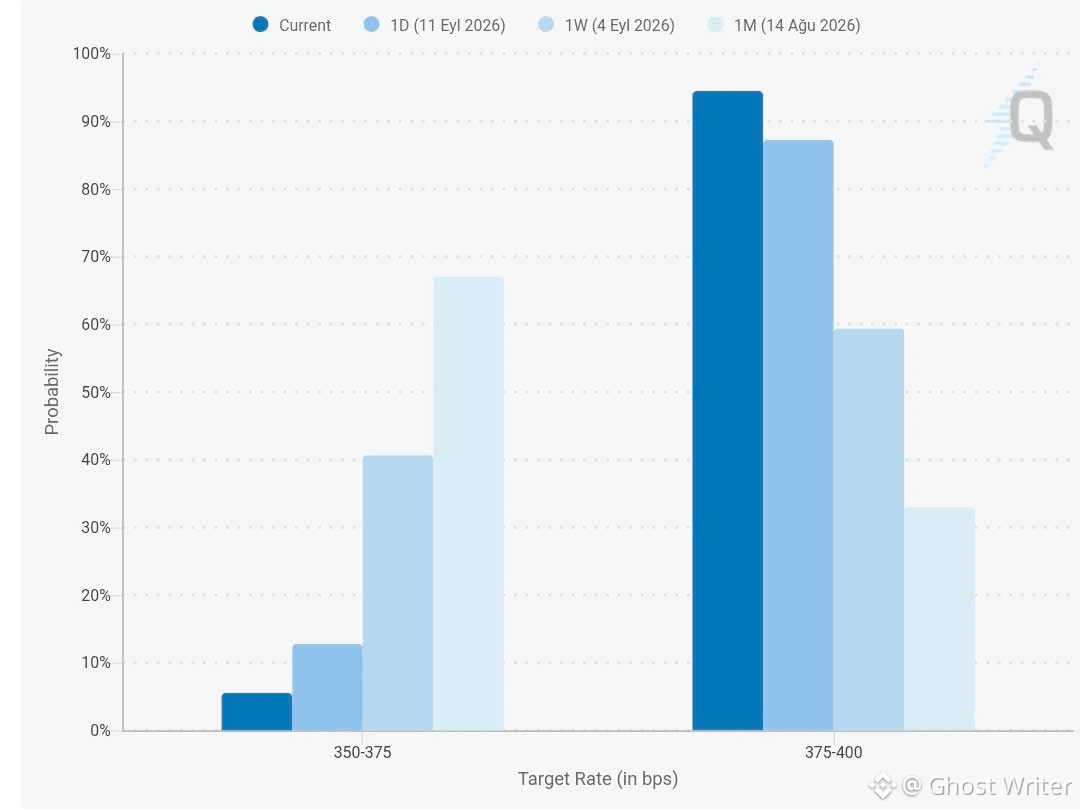
Look at the probability chart. A month ago, holding at 3.50–3.75% was the popular bet. A week ago it was a fight. Now the 3.75–4.00% bucket is a wall, close to 94%. That means Wednesday’s decision is not the event. The event is whether the statement treats August inflation as a messy month, or as the first brick of a new tightening cycle.
That distinction is where most posts go flat. They ask “hike or hold?” The market already answered. The tradeable question is: one insurance hike, or the start of a bill that keeps arriving?
The print that looks soft and hard at the same time
August #CPI did something awkward.
Headline rose 0.4% on the month and 3.4% over the year. Core CPI includes food and energy stripped out, rose 0.3% month-over-month versus a 0.2% consensus. The annual core rate still eased to 2.4%, the slowest since 2021.
So you can write two honest headlines from the same release:
“Underlying inflation is the coolest in five years.”“The monthly core run-rate just accelerated.”
The Fed lives in the second sentence. Year-over-year core is a rear-view mirror still digesting older, hotter prints. Officials vote on whether the latest month looks like progress or like a pause that failed. Energy did the loud part: +2.1% on the month, +16.3% over the year. That is not the same animal as 2022 demand-overheating. It is a supply bruise sitting on a labor market that still printed firm payrolls.
A 25bp hike can be rational as insurance. It is a much weaker case as the opening of a multi-meeting campaign — unless the press conference pretends energy is “just inflation” and ignores the source.
Why a fully priced hike still moves risk
If 90% is already in the price, why would Bitcoin, Nasdaq, or gold $XAU care?
Because assets do not reprice the 25bp. They reprice the path.
Tech is duration. A hike that sounds like “we are done after this” is a shrug. A hike that keeps December alive is a valuation haircut. Long-duration names feel language before they feel the funds rate.Gold splits in two. If the story is sticky inflation and messy geopolitics, gold keeps a bid. If the story is higher real rates and a stronger dollar, gold pays the rate tax like everything else.Bitcoin is the awkward guest. Some weeks it still tags along with Nasdaq beta. Other stretches this year it has spent more time walking next to gold. Into a priced hike, the first hour is usually a liquidity squeeze. The second hour is a referendum on whether the Fed sounded finished.
That is why “BTC dumps on hikes” is a lazy rule. BTC dumped in 2022 because the path was many hikes from zero. A single, widely advertised 25bp from 3.50–3.75% is a different machine. The damage lives in the adjective: “ongoing,” “further,” “restrictive for longer.”
One-off versus cycle: A simple test
A cycle needs the Fed to believe demand is the problem.
Watch three things Wednesday, not the vote itself:
Do they call energy a temporary shock or a reason to keep tightening?Does the statement keep “further firming” on the table, or does it go back to data-dependence without a threat?Do the dots show one move, or a staircase?
If it is one-and-done language, the 90% odds were the whole show. Risk can even bid the fact that uncertainty just collapsed. If the dots lean hawkish, the market has to price a second invoice it has only half-written.
What I am doing with Bitcoin
I am not using FOMC as an entry trigger.
I hold $BTC as a multi-year position. The plan is boring on purpose. If the statement is hotter than a fully priced hike and spot gives a cleaner level than the coins I already own, I add on a fixed DCA size. Same rules as any other dip I did not cause. No leverage into the announcement. No “I knew they’d hike” after the fact.
{spot}(BTCUSDT)
The edge this week is not prediction. It is refusing to confuse a 25bp that everyone sees with a cycle that nobody has proven.
Most feeds will celebrate or panic at 2:00 p.m. Eastern. The useful work starts in the paragraph after the decision, the one that tells you whether September was an insurance premium, or the first line of a longer tab.
#FedRateWatch #TrendingTopic
Educational only. Not financial advice. Size for both paths.
The Fed Is About to Hike a Number the Market Already Paid For. The Real Risk Is December
Almost nobody is arguing about 25 basis points anymore 🤔
Look at the probability chart. A month ago, holding at 3.50–3.75% was the popular bet. A week ago it was a fight. Now the 3.75–4.00% bucket is a wall, close to 94%. That means Wednesday’s decision is not the event. The event is whether the statement treats August inflation as a messy month, or as the first brick of a new tightening cycle.
That distinction is where most posts go flat. They ask “hike or hold?” The market already answered. The tradeable question is: one insurance hike, or the start of a bill that keeps arriving?
The print that looks soft and hard at the same time
August #CPI did something awkward.
Headline rose 0.4% on the month and 3.4% over the year. Core CPI includes food and energy stripped out, rose 0.3% month-over-month versus a 0.2% consensus. The annual core rate still eased to 2.4%, the slowest since 2021.
So you can write two honest headlines from the same release:
“Underlying inflation is the coolest in five years.”“The monthly core run-rate just accelerated.”
The Fed lives in the second sentence. Year-over-year core is a rear-view mirror still digesting older, hotter prints. Officials vote on whether the latest month looks like progress or like a pause that failed. Energy did the loud part: +2.1% on the month, +16.3% over the year. That is not the same animal as 2022 demand-overheating. It is a supply bruise sitting on a labor market that still printed firm payrolls.
A 25bp hike can be rational as insurance. It is a much weaker case as the opening of a multi-meeting campaign — unless the press conference pretends energy is “just inflation” and ignores the source.
Why a fully priced hike still moves risk
If 90% is already in the price, why would Bitcoin, Nasdaq, or gold $XAU care?
Because assets do not reprice the 25bp. They reprice the path.
Tech is duration. A hike that sounds like “we are done after this” is a shrug. A hike that keeps December alive is a valuation haircut. Long-duration names feel language before they feel the funds rate.Gold splits in two. If the story is sticky inflation and messy geopolitics, gold keeps a bid. If the story is higher real rates and a stronger dollar, gold pays the rate tax like everything else.Bitcoin is the awkward guest. Some weeks it still tags along with Nasdaq beta. Other stretches this year it has spent more time walking next to gold. Into a priced hike, the first hour is usually a liquidity squeeze. The second hour is a referendum on whether the Fed sounded finished.
That is why “BTC dumps on hikes” is a lazy rule. BTC dumped in 2022 because the path was many hikes from zero. A single, widely advertised 25bp from 3.50–3.75% is a different machine. The damage lives in the adjective: “ongoing,” “further,” “restrictive for longer.”
One-off versus cycle: A simple test
A cycle needs the Fed to believe demand is the problem.
Watch three things Wednesday, not the vote itself:
Do they call energy a temporary shock or a reason to keep tightening?Does the statement keep “further firming” on the table, or does it go back to data-dependence without a threat?Do the dots show one move, or a staircase?
If it is one-and-done language, the 90% odds were the whole show. Risk can even bid the fact that uncertainty just collapsed. If the dots lean hawkish, the market has to price a second invoice it has only half-written.
What I am doing with Bitcoin
I am not using FOMC as an entry trigger.
I hold $BTC as a multi-year position. The plan is boring on purpose. If the statement is hotter than a fully priced hike and spot gives a cleaner level than the coins I already own, I add on a fixed DCA size. Same rules as any other dip I did not cause. No leverage into the announcement. No “I knew they’d hike” after the fact.
The edge this week is not prediction. It is refusing to confuse a 25bp that everyone sees with a cycle that nobody has proven.
Most feeds will celebrate or panic at 2:00 p.m. Eastern. The useful work starts in the paragraph after the decision, the one that tells you whether September was an insurance premium, or the first line of a longer tab.
#FedRateWatch #TrendingTopic
Educational only. Not financial advice. Size for both paths.
Look at the probability chart. A month ago, holding at 3.50–3.75% was the popular bet. A week ago it was a fight. Now the 3.75–4.00% bucket is a wall, close to 94%. That means Wednesday’s decision is not the event. The event is whether the statement treats August inflation as a messy month, or as the first brick of a new tightening cycle.
That distinction is where most posts go flat. They ask “hike or hold?” The market already answered. The tradeable question is: one insurance hike, or the start of a bill that keeps arriving?
The print that looks soft and hard at the same time
August #CPI did something awkward.
Headline rose 0.4% on the month and 3.4% over the year. Core CPI includes food and energy stripped out, rose 0.3% month-over-month versus a 0.2% consensus. The annual core rate still eased to 2.4%, the slowest since 2021.
So you can write two honest headlines from the same release:
“Underlying inflation is the coolest in five years.”“The monthly core run-rate just accelerated.”
The Fed lives in the second sentence. Year-over-year core is a rear-view mirror still digesting older, hotter prints. Officials vote on whether the latest month looks like progress or like a pause that failed. Energy did the loud part: +2.1% on the month, +16.3% over the year. That is not the same animal as 2022 demand-overheating. It is a supply bruise sitting on a labor market that still printed firm payrolls.
A 25bp hike can be rational as insurance. It is a much weaker case as the opening of a multi-meeting campaign — unless the press conference pretends energy is “just inflation” and ignores the source.
Why a fully priced hike still moves risk
If 90% is already in the price, why would Bitcoin, Nasdaq, or gold $XAU care?
Because assets do not reprice the 25bp. They reprice the path.
Tech is duration. A hike that sounds like “we are done after this” is a shrug. A hike that keeps December alive is a valuation haircut. Long-duration names feel language before they feel the funds rate.Gold splits in two. If the story is sticky inflation and messy geopolitics, gold keeps a bid. If the story is higher real rates and a stronger dollar, gold pays the rate tax like everything else.Bitcoin is the awkward guest. Some weeks it still tags along with Nasdaq beta. Other stretches this year it has spent more time walking next to gold. Into a priced hike, the first hour is usually a liquidity squeeze. The second hour is a referendum on whether the Fed sounded finished.
That is why “BTC dumps on hikes” is a lazy rule. BTC dumped in 2022 because the path was many hikes from zero. A single, widely advertised 25bp from 3.50–3.75% is a different machine. The damage lives in the adjective: “ongoing,” “further,” “restrictive for longer.”
One-off versus cycle: A simple test
A cycle needs the Fed to believe demand is the problem.
Watch three things Wednesday, not the vote itself:
Do they call energy a temporary shock or a reason to keep tightening?Does the statement keep “further firming” on the table, or does it go back to data-dependence without a threat?Do the dots show one move, or a staircase?
If it is one-and-done language, the 90% odds were the whole show. Risk can even bid the fact that uncertainty just collapsed. If the dots lean hawkish, the market has to price a second invoice it has only half-written.
What I am doing with Bitcoin
I am not using FOMC as an entry trigger.
I hold $BTC as a multi-year position. The plan is boring on purpose. If the statement is hotter than a fully priced hike and spot gives a cleaner level than the coins I already own, I add on a fixed DCA size. Same rules as any other dip I did not cause. No leverage into the announcement. No “I knew they’d hike” after the fact.
The edge this week is not prediction. It is refusing to confuse a 25bp that everyone sees with a cycle that nobody has proven.
Most feeds will celebrate or panic at 2:00 p.m. Eastern. The useful work starts in the paragraph after the decision, the one that tells you whether September was an insurance premium, or the first line of a longer tab.
#FedRateWatch #TrendingTopic
Educational only. Not financial advice. Size for both paths.
2
93
·
--
Bullish
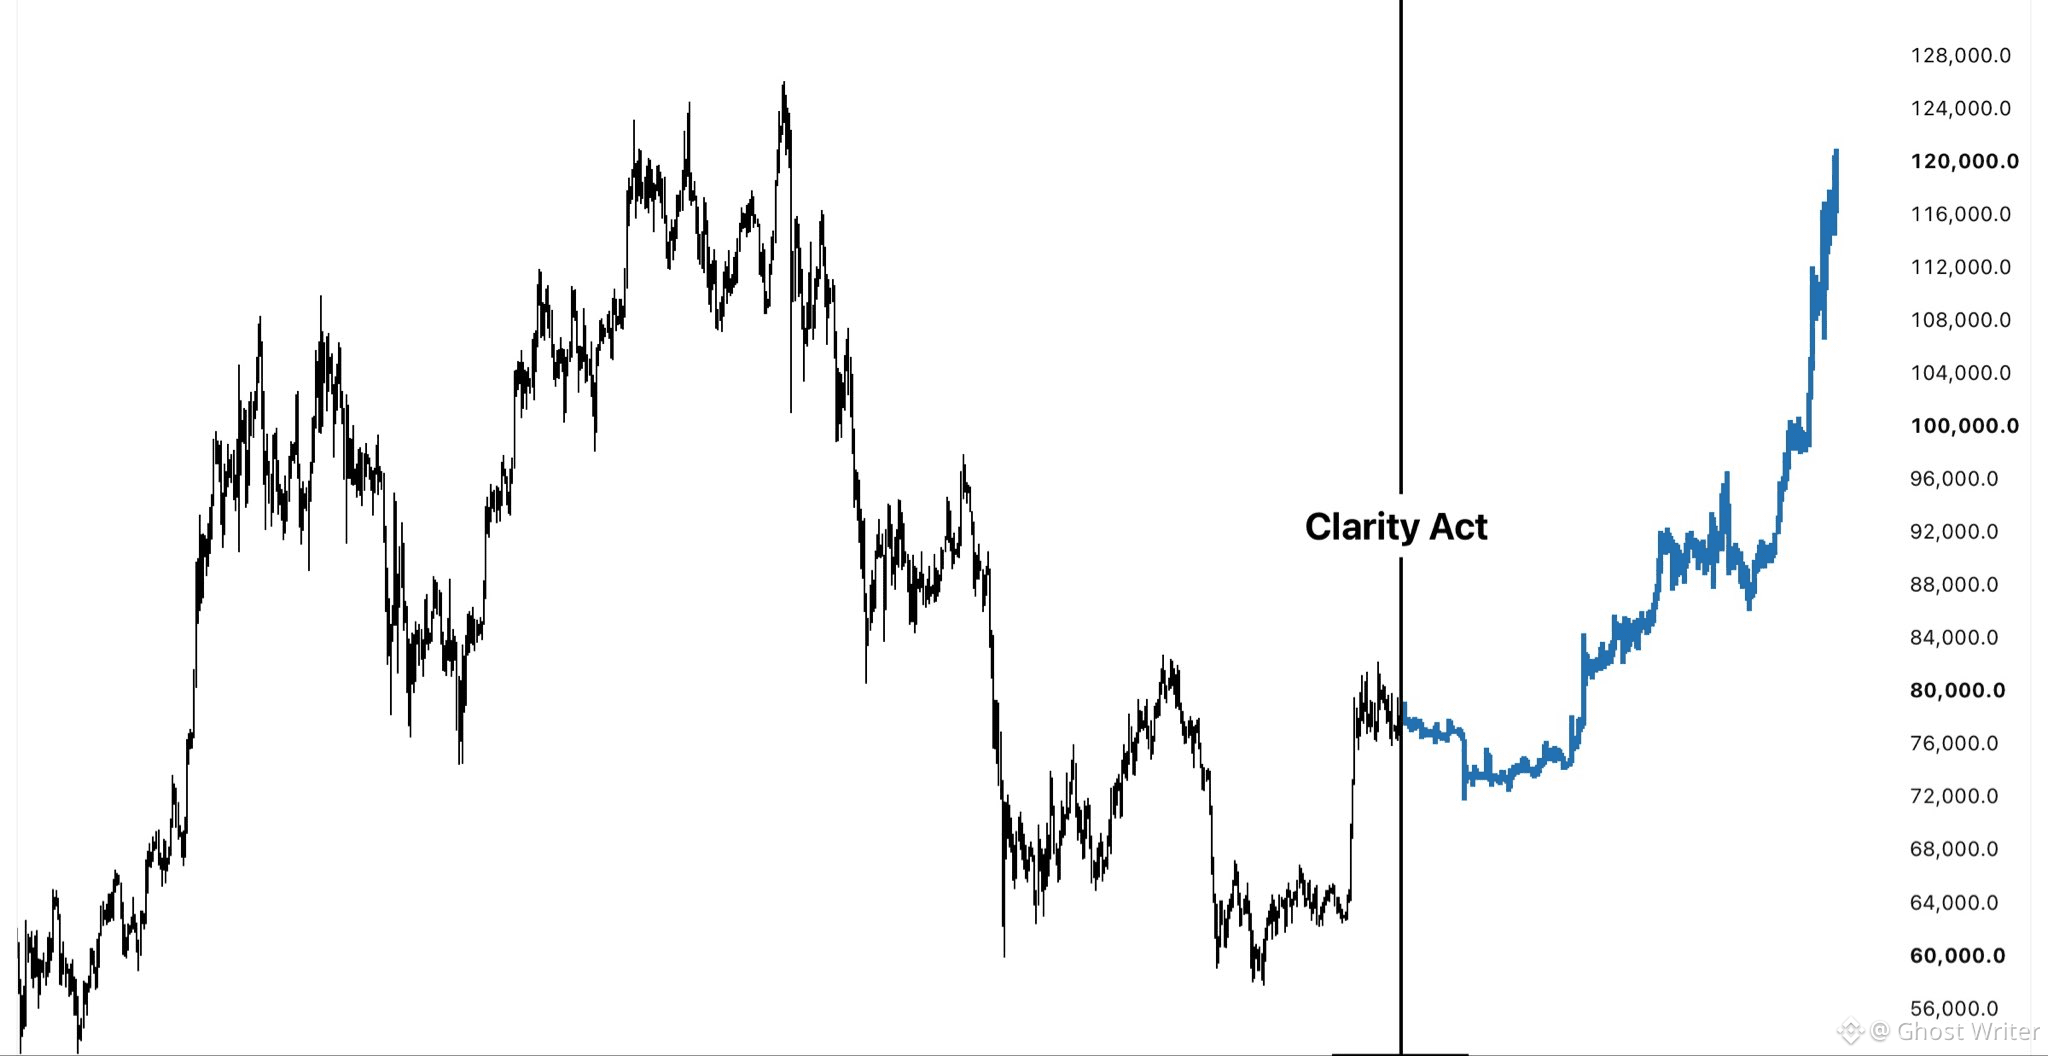
$BTC Every transition from a bear market to a bull market has a fundamental catalyst.
In 2023, it was institutional adoption, especially BlackRock’s spot ETF.
This time, I believe it will be the CLARITY Act.
The US Senate will hold a crucial procedural vote on the bill today, deciding whether to advance the crypto regulatory framework.
Many are expecting a pump if the vote goes through.
Personally, I don’t expect much immediate movement.
I think we’re more likely to stay range bound, or even see another pullback, before the real expansion begins once the bill makes it through all stages.
If the bill doesn’t go through today, however, I’m expecting a dump toward the previous ATH.
{spot}(BTCUSDT)
{future}(BTCUSDT)
#FedRateWatch
#BitcoinReboundsTo$79K
#BitcoinSpotETFsNetInflow$160M
#BessentEndorsesFinalClarityActDraft
$BTC Every transition from a bear market to a bull market has a fundamental catalyst.
In 2023, it was institutional adoption, especially BlackRock’s spot ETF.
This time, I believe it will be the CLARITY Act.
The US Senate will hold a crucial procedural vote on the bill today, deciding whether to advance the crypto regulatory framework.
Many are expecting a pump if the vote goes through.
Personally, I don’t expect much immediate movement.
I think we’re more likely to stay range bound, or even see another pullback, before the real expansion begins once the bill makes it through all stages.
If the bill doesn’t go through today, however, I’m expecting a dump toward the previous ATH.
#FedRateWatch
#BitcoinReboundsTo$79K
#BitcoinSpotETFsNetInflow$160M
#BessentEndorsesFinalClarityActDraft
In 2023, it was institutional adoption, especially BlackRock’s spot ETF.
This time, I believe it will be the CLARITY Act.
The US Senate will hold a crucial procedural vote on the bill today, deciding whether to advance the crypto regulatory framework.
Many are expecting a pump if the vote goes through.
Personally, I don’t expect much immediate movement.
I think we’re more likely to stay range bound, or even see another pullback, before the real expansion begins once the bill makes it through all stages.
If the bill doesn’t go through today, however, I’m expecting a dump toward the previous ATH.
#FedRateWatch
#BitcoinReboundsTo$79K
#BitcoinSpotETFsNetInflow$160M
#BessentEndorsesFinalClarityActDraft
1
446
·
--
Bearish
Verified
A month ago, the market still thought the Fed would sit still 👀
In mid-August, the 3.50–3.75% bucket was the majority bet. By 4 September it was a coin flip. After the 11 September CPI print, the 3.75–4.00% bucket is almost the whole chart, roughly 90%+ priced for a 25bp hike this week. That is not a slow drift; it is a full rewrite of September.
That split is the whole meeting. Year-over-year core looks like progress. Month-over-month core looks like the disinflation pause ended. Officials who said they needed “reassurance” from August inflation no longer have an easy hold speech.
A cycle needs demand that is overheating on its own. What the tape has been pricing is messier: oil and a supply shock sitting on top of a labor market that still printed firm payrolls. A 25bp insurance hike is the base case. A full 2022-style path is not, unless Wednesday’s statement treats 0.3% core as a trend rather than a sticky month plus energy. Markets will trade the dots and the language harder than the 25bp itself.
A hike that is fully priced can still hurt if the press conference leans hawkish on December. Tech duration feels that first. Gold splits: bullish if the story is “inflation is back,” softer if the story is “real rates are going higher and the dollar is the trade.” Bitcoin sits in between. Some weeks it trades like Nasdaq beta. Other weeks it trades like a liquidity sponge next to gold.
I hold BTC as a multi-year position, not a FOMC lottery ticket. If the statement is hotter than 90% odds and spot offers a cleaner level than the one I already own, I add on a schedule, same size, same rules, no hero trade into the announcement. If they hike and sound done, the dip is a gift, not a thesis change.
The interesting question this week is not “hike or hold.” The chart already answered that. The question is whether 25bp is the last insurance premium of 2026, or the first invoice of a longer bill.
#FedRateWatch @Binance_Square_Official
A month ago, the market still thought the Fed would sit still 👀
In mid-August, the 3.50–3.75% bucket was the majority bet. By 4 September it was a coin flip. After the 11 September CPI print, the 3.75–4.00% bucket is almost the whole chart, roughly 90%+ priced for a 25bp hike this week. That is not a slow drift; it is a full rewrite of September.
That split is the whole meeting. Year-over-year core looks like progress. Month-over-month core looks like the disinflation pause ended. Officials who said they needed “reassurance” from August inflation no longer have an easy hold speech.
A cycle needs demand that is overheating on its own. What the tape has been pricing is messier: oil and a supply shock sitting on top of a labor market that still printed firm payrolls. A 25bp insurance hike is the base case. A full 2022-style path is not, unless Wednesday’s statement treats 0.3% core as a trend rather than a sticky month plus energy. Markets will trade the dots and the language harder than the 25bp itself.
A hike that is fully priced can still hurt if the press conference leans hawkish on December. Tech duration feels that first. Gold splits: bullish if the story is “inflation is back,” softer if the story is “real rates are going higher and the dollar is the trade.” Bitcoin sits in between. Some weeks it trades like Nasdaq beta. Other weeks it trades like a liquidity sponge next to gold.
I hold BTC as a multi-year position, not a FOMC lottery ticket. If the statement is hotter than 90% odds and spot offers a cleaner level than the one I already own, I add on a schedule, same size, same rules, no hero trade into the announcement. If they hike and sound done, the dip is a gift, not a thesis change.
The interesting question this week is not “hike or hold.” The chart already answered that. The question is whether 25bp is the last insurance premium of 2026, or the first invoice of a longer bill.
#FedRateWatch @Binance Square Official
In mid-August, the 3.50–3.75% bucket was the majority bet. By 4 September it was a coin flip. After the 11 September CPI print, the 3.75–4.00% bucket is almost the whole chart, roughly 90%+ priced for a 25bp hike this week. That is not a slow drift; it is a full rewrite of September.
That split is the whole meeting. Year-over-year core looks like progress. Month-over-month core looks like the disinflation pause ended. Officials who said they needed “reassurance” from August inflation no longer have an easy hold speech.
A cycle needs demand that is overheating on its own. What the tape has been pricing is messier: oil and a supply shock sitting on top of a labor market that still printed firm payrolls. A 25bp insurance hike is the base case. A full 2022-style path is not, unless Wednesday’s statement treats 0.3% core as a trend rather than a sticky month plus energy. Markets will trade the dots and the language harder than the 25bp itself.
A hike that is fully priced can still hurt if the press conference leans hawkish on December. Tech duration feels that first. Gold splits: bullish if the story is “inflation is back,” softer if the story is “real rates are going higher and the dollar is the trade.” Bitcoin sits in between. Some weeks it trades like Nasdaq beta. Other weeks it trades like a liquidity sponge next to gold.
I hold BTC as a multi-year position, not a FOMC lottery ticket. If the statement is hotter than 90% odds and spot offers a cleaner level than the one I already own, I add on a schedule, same size, same rules, no hero trade into the announcement. If they hike and sound done, the dip is a gift, not a thesis change.
The interesting question this week is not “hike or hold.” The chart already answered that. The question is whether 25bp is the last insurance premium of 2026, or the first invoice of a longer bill.
#FedRateWatch @Binance Square Official
2
1
685
·
--
Bullish
Just finish day 1 of Binance Summer Camp
Join here: [https://www.binance.com/en/ti/cryptolingo](https://www.binance.com/en/ti/cryptolingo)
#BinanceSummerCamp
Just finish day 1 of Binance Summer Camp
Join here: https://www.binance.com/en/ti/cryptolingo
#BinanceSummerCamp
Join here: https://www.binance.com/en/ti/cryptolingo
#BinanceSummerCamp

270
·
--
Bullish
TOMORROW COULD BE THE MOST IMPORTANT DAY IN CRYPTO
HISTORY $BTC $XRP
The US Senate votes on the CLARITY Act tomorrow, after more than a year of negotiations.
Here’s why this vote matters:
1. CLARITY would finally create federal rules for crypto markets, bringing exchanges and digital asset businesses under clearer SEC and CFTC oversight.
2. It would introduce safeguards similar to traditional financial markets, including customer asset segregation, custody rules, disclosures and restrictions on insider selling.
3. These are the kind of protections that saves customers from FTX type collapse.
4. Tomorrow is not the final vote. The Senate first needs 60 votes just to move the bill forward for debate and amendments.
5. Republicans control 53 seats, and they need at least 7 votes from Democrats to proceed.
6. To win that support, Republicans have made 126 substantive changes requested by Democrats.
7. One of the biggest hurdles was ethics. President Trump has now agreed to most of them, requiring covered government officials with significant crypto interests to sell them or move them into a qualified blind trust.
8. Another major fight was stablecoin rewards. The latest bill gives the Treasury power to step in and pause if stablecoins cause major deposit outflows from community banks.
9. The House already passed its version of CLARITY by a massive 294-134 bipartisan vote in July 2025.
10. But even if it succeeds tomorrow, both chambers need to agree on an identical legislation and send it to President Trump for final approval.
Time is ticking. With the November midterms approaching, Congress has only a narrow window left to get it done.
#BitcoinReboundsTo$79K
#GrayscalePutsXRPAt26.11%InAdvisorPortfolio
#SECChairUrgesCongressToAdvanceClarityAct
#CLARITYAct
#etf
TOMORROW COULD BE THE MOST IMPORTANT DAY IN CRYPTO
HISTORY $BTC $XRP
The US Senate votes on the CLARITY Act tomorrow, after more than a year of negotiations.
Here’s why this vote matters:
1. CLARITY would finally create federal rules for crypto markets, bringing exchanges and digital asset businesses under clearer SEC and CFTC oversight.
2. It would introduce safeguards similar to traditional financial markets, including customer asset segregation, custody rules, disclosures and restrictions on insider selling.
3. These are the kind of protections that saves customers from FTX type collapse.
4. Tomorrow is not the final vote. The Senate first needs 60 votes just to move the bill forward for debate and amendments.
5. Republicans control 53 seats, and they need at least 7 votes from Democrats to proceed.
6. To win that support, Republicans have made 126 substantive changes requested by Democrats.
7. One of the biggest hurdles was ethics. President Trump has now agreed to most of them, requiring covered government officials with significant crypto interests to sell them or move them into a qualified blind trust.
8. Another major fight was stablecoin rewards. The latest bill gives the Treasury power to step in and pause if stablecoins cause major deposit outflows from community banks.
9. The House already passed its version of CLARITY by a massive 294-134 bipartisan vote in July 2025.
10. But even if it succeeds tomorrow, both chambers need to agree on an identical legislation and send it to President Trump for final approval.
Time is ticking. With the November midterms approaching, Congress has only a narrow window left to get it done.
#BitcoinReboundsTo$79K
#GrayscalePutsXRPAt26.11%InAdvisorPortfolio
#SECChairUrgesCongressToAdvanceClarityAct
#CLARITYAct
#etf
HISTORY $BTC $XRP
The US Senate votes on the CLARITY Act tomorrow, after more than a year of negotiations.
Here’s why this vote matters:
1. CLARITY would finally create federal rules for crypto markets, bringing exchanges and digital asset businesses under clearer SEC and CFTC oversight.
2. It would introduce safeguards similar to traditional financial markets, including customer asset segregation, custody rules, disclosures and restrictions on insider selling.
3. These are the kind of protections that saves customers from FTX type collapse.
4. Tomorrow is not the final vote. The Senate first needs 60 votes just to move the bill forward for debate and amendments.
5. Republicans control 53 seats, and they need at least 7 votes from Democrats to proceed.
6. To win that support, Republicans have made 126 substantive changes requested by Democrats.
7. One of the biggest hurdles was ethics. President Trump has now agreed to most of them, requiring covered government officials with significant crypto interests to sell them or move them into a qualified blind trust.
8. Another major fight was stablecoin rewards. The latest bill gives the Treasury power to step in and pause if stablecoins cause major deposit outflows from community banks.
9. The House already passed its version of CLARITY by a massive 294-134 bipartisan vote in July 2025.
10. But even if it succeeds tomorrow, both chambers need to agree on an identical legislation and send it to President Trump for final approval.
Time is ticking. With the November midterms approaching, Congress has only a narrow window left to get it done.
#BitcoinReboundsTo$79K
#GrayscalePutsXRPAt26.11%InAdvisorPortfolio
#SECChairUrgesCongressToAdvanceClarityAct
#CLARITYAct
#etf

4
1
8
5k
·
--
Bullish
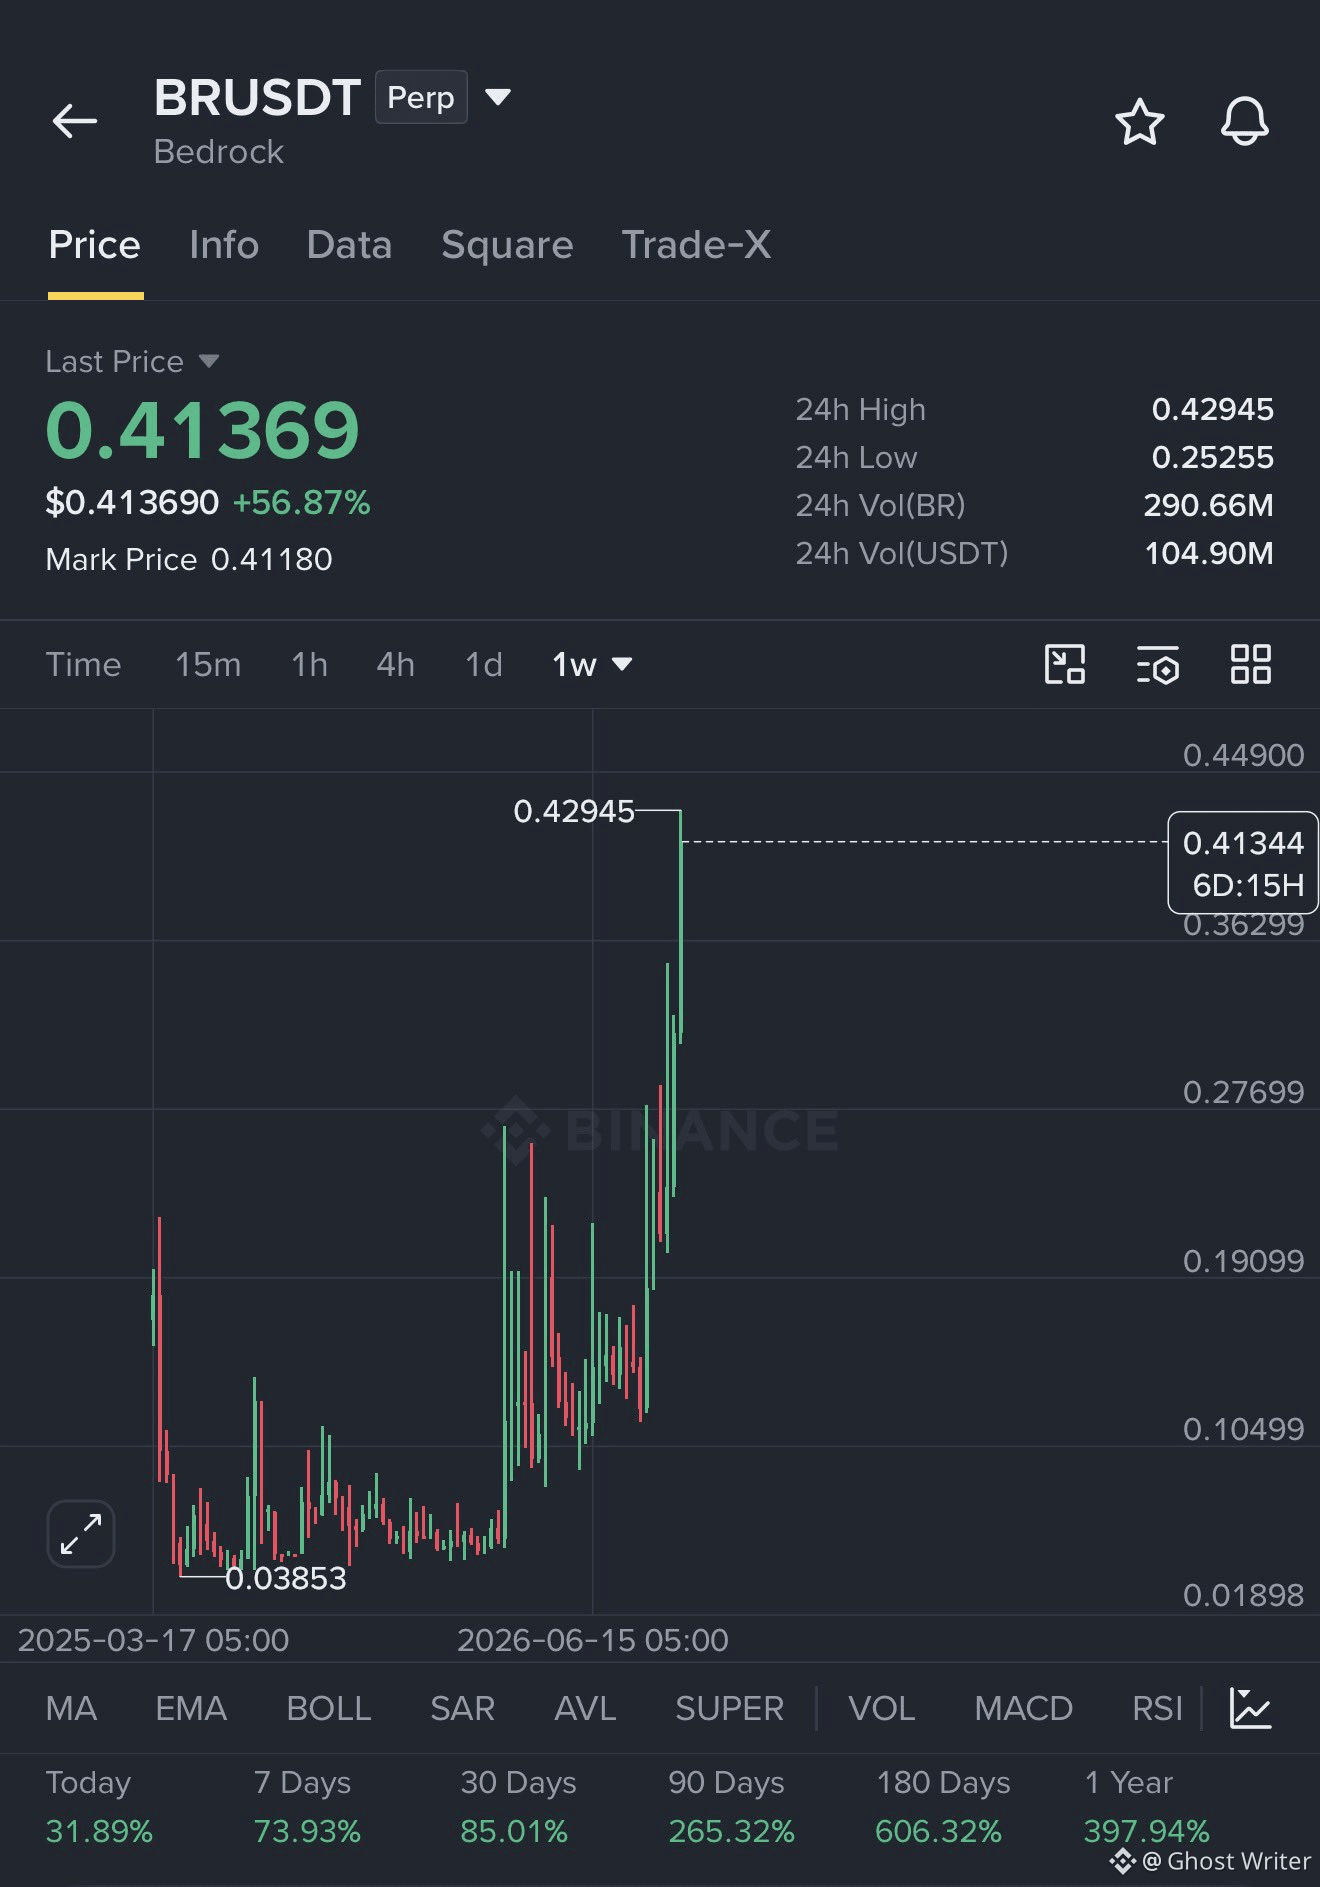
🚨DO NOT SHORT $BR HERE UNLESS YOU'RE CRAZY
I am seeing a lot of people opening short positions on @Bedrock
because it has been pumped 70% and is the top gainer on Binance from yesterday.
But lemme tell you something.
I am seeing $LSK and $CVC like pump in BR. There is no resistance above. Volume is also strong and there isn’t a single candle spike like 20% or 30% and instead the pump is gradual and steady.
Also if you see 7D and 30D gain they are also very low to open short.
That’s why I will suggest not to open short and wait for it to reach around $1.
{future}(LSKUSDT)
{future}(BRUSDT)
{future}(CVCUSDT)
#bedrock #BR
🚨DO NOT SHORT $BR HERE UNLESS YOU'RE CRAZY
I am seeing a lot of people opening short positions on @Bedrock
because it has been pumped 70% and is the top gainer on Binance from yesterday.
But lemme tell you something.
I am seeing $LSK and $CVC like pump in BR. There is no resistance above. Volume is also strong and there isn’t a single candle spike like 20% or 30% and instead the pump is gradual and steady.
Also if you see 7D and 30D gain they are also very low to open short.
That’s why I will suggest not to open short and wait for it to reach around $1.
#bedrock #BR
I am seeing a lot of people opening short positions on @Bedrock
because it has been pumped 70% and is the top gainer on Binance from yesterday.
But lemme tell you something.
I am seeing $LSK and $CVC like pump in BR. There is no resistance above. Volume is also strong and there isn’t a single candle spike like 20% or 30% and instead the pump is gradual and steady.
Also if you see 7D and 30D gain they are also very low to open short.
That’s why I will suggest not to open short and wait for it to reach around $1.
#bedrock #BR
1
1
130
·
--
Bullish
Verified
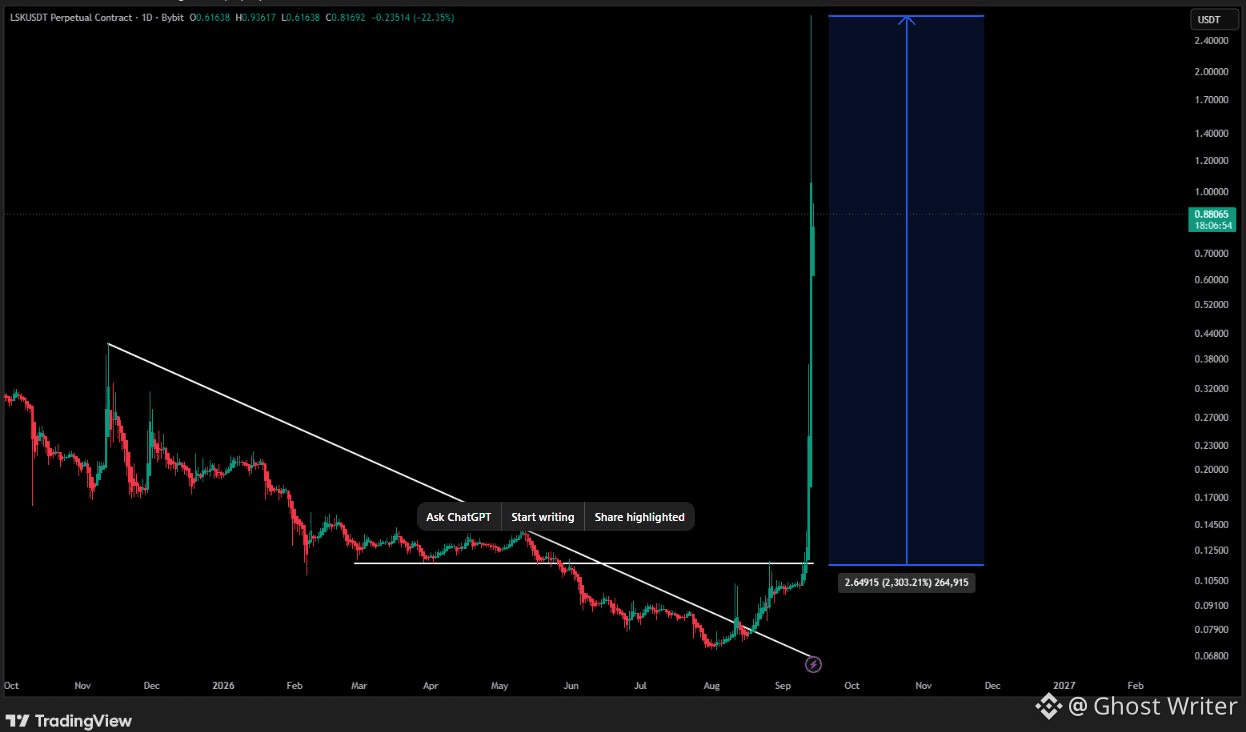
Do you guys even understand what's going on with Lisk $LSK right now? 🤯
3 days ago, Lisk announced that anyone holding funds on the Lisk chain should bridge to Ethereum before closure.
They set a deadline of October 31st since withdrawal takes about 8 days
They also said LSK stakers can now unlock their staked LSK.
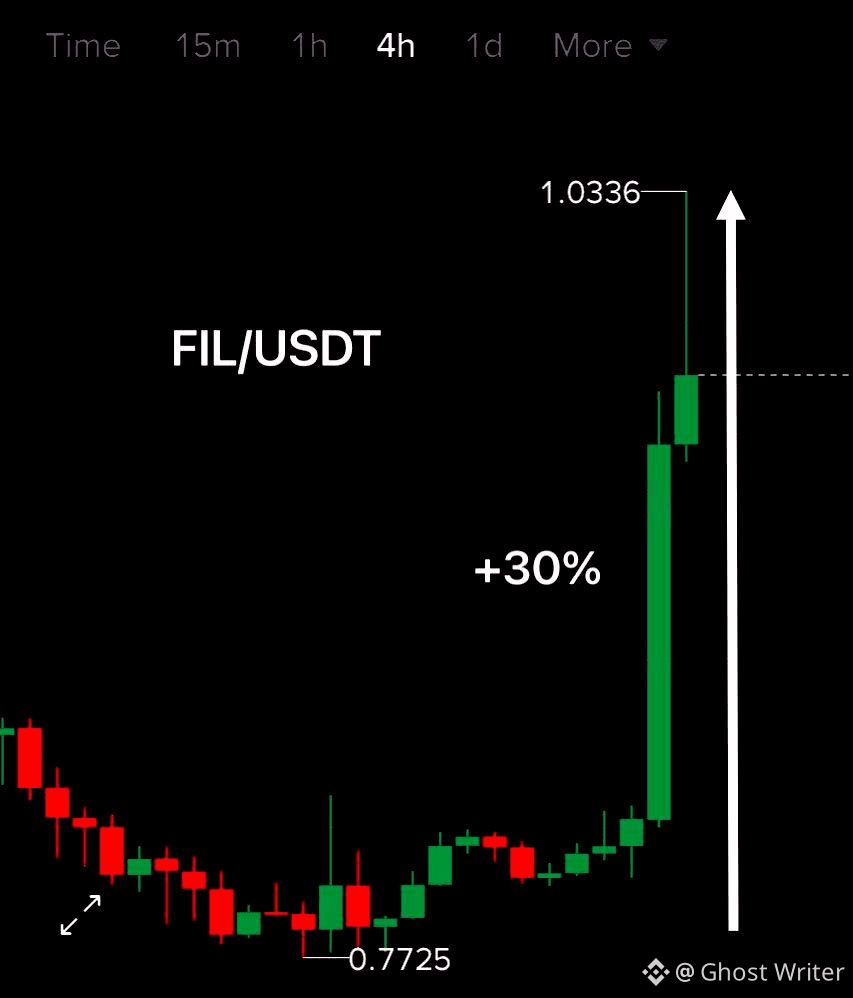
Since that announcement was made, LSK is up more than 450%
It went from $0.2 to over 1 dollar in just 2 days.
Exit liquidity or what? $FIL $CVC
{future}(FILUSDT)
{future}(CVCUSDT)
{future}(LSKUSDT)
#LSKSurgesOver515%In24Hours #LSK
Do you guys even understand what's going on with Lisk $LSK right now? 🤯
3 days ago, Lisk announced that anyone holding funds on the Lisk chain should bridge to Ethereum before closure.
They set a deadline of October 31st since withdrawal takes about 8 days
They also said LSK stakers can now unlock their staked LSK.
Since that announcement was made, LSK is up more than 450%
It went from $0.2 to over 1 dollar in just 2 days.
Exit liquidity or what? $FIL $CVC
#LSKSurgesOver515%In24Hours #LSK
3 days ago, Lisk announced that anyone holding funds on the Lisk chain should bridge to Ethereum before closure.
They set a deadline of October 31st since withdrawal takes about 8 days
They also said LSK stakers can now unlock their staked LSK.
Since that announcement was made, LSK is up more than 450%
It went from $0.2 to over 1 dollar in just 2 days.
Exit liquidity or what? $FIL $CVC
#LSKSurgesOver515%In24Hours #LSK
2
1.8k

·
--
Bullish
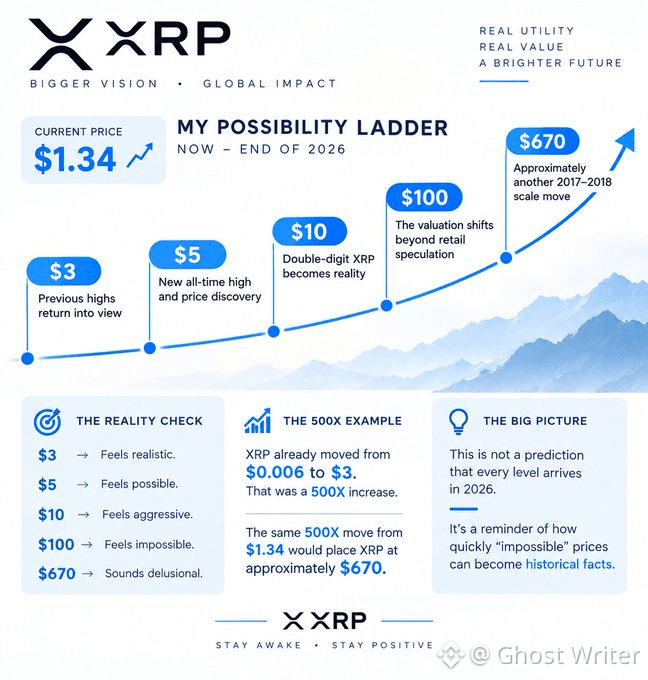
$XRP is currently $1.34 👀
My possibility ladder between now and the end of 2026:
$3 - previous highs return into view
$5 - new all-time high and price discovery
$10 - double-digit $XRP becomes reality
$100 - the valuation shifts beyond retail speculation
$670 - approximately another 2017–2018 scale move
The first target feels realistic.
The second feels possible.
The third feels aggressive.
The fourth feels impossible.
The fifth sounds delusional.
But #xrp already moved from $0.006 to $3.
That was a 500X increase.
The same 500X move from $1.34 would place XRP at approximately $670.
This is not a prediction that every level arrives in 2026.
It is a reminder of how quickly “impossible” prices can become historical facts.
#WhiteHouseRejectsAISlowdownCalls
$XRP is currently $1.34 👀
My possibility ladder between now and the end of 2026:
$3 - previous highs return into view
$5 - new all-time high and price discovery
$10 - double-digit $XRP becomes reality
$100 - the valuation shifts beyond retail speculation
$670 - approximately another 2017–2018 scale move
The first target feels realistic.
The second feels possible.
The third feels aggressive.
The fourth feels impossible.
The fifth sounds delusional.
But #xrp already moved from $0.006 to $3.
That was a 500X increase.
The same 500X move from $1.34 would place XRP at approximately $670.
This is not a prediction that every level arrives in 2026.
It is a reminder of how quickly “impossible” prices can become historical facts.
#WhiteHouseRejectsAISlowdownCalls
My possibility ladder between now and the end of 2026:
$3 - previous highs return into view
$5 - new all-time high and price discovery
$10 - double-digit $XRP becomes reality
$100 - the valuation shifts beyond retail speculation
$670 - approximately another 2017–2018 scale move
The first target feels realistic.
The second feels possible.
The third feels aggressive.
The fourth feels impossible.
The fifth sounds delusional.
But #xrp already moved from $0.006 to $3.
That was a 500X increase.
The same 500X move from $1.34 would place XRP at approximately $670.
This is not a prediction that every level arrives in 2026.
It is a reminder of how quickly “impossible” prices can become historical facts.
#WhiteHouseRejectsAISlowdownCalls
8
5
12.1k
·
--
Bullish
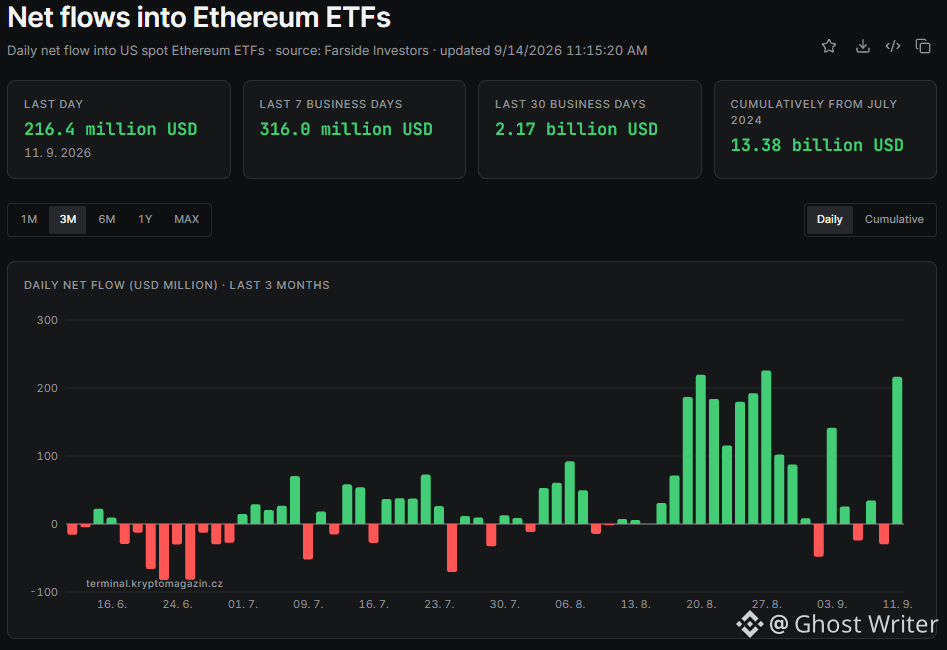
💥BREAKING NEWS: #Ethereum Spot ETFs track 30-day record net inflows of $2.17 billion.
With +$216.4 million in inflows only on September 11, the BlackRock ETF $ETHA.ETF was the largest contributor, with +$148.8 million of the total inflows.
August is the strongest month of 2026, cumulating to a total of $1.84 billion in $ETH ETF inflows.🚀
#ETH #EthereumFallsBelow$2500
💥BREAKING NEWS: #Ethereum Spot ETFs track 30-day record net inflows of $2.17 billion.
With +$216.4 million in inflows only on September 11, the BlackRock ETF $ETHA.ETF was the largest contributor, with +$148.8 million of the total inflows.
August is the strongest month of 2026, cumulating to a total of $1.84 billion in $ETH ETF inflows.🚀
#ETH #EthereumFallsBelow$2500
With +$216.4 million in inflows only on September 11, the BlackRock ETF $ETHA.ETF was the largest contributor, with +$148.8 million of the total inflows.
August is the strongest month of 2026, cumulating to a total of $1.84 billion in $ETH ETF inflows.🚀
#ETH #EthereumFallsBelow$2500

2
1.7k
·
--
Bullish
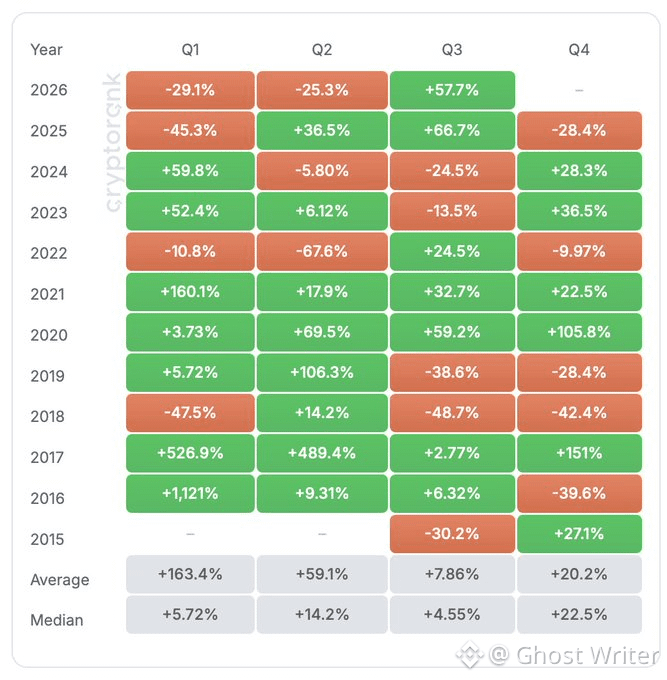
INSIGHTS: $ETH Gains 60% in Q3 2026: Is a New Bullish Trend Emerging?
Ethereum has recorded a strong 60.62% gain in Q3, recovering from significant losses in Q1 and Q2.
After reaching $2,665, ETH is trading near $2,500 and recently outperformed Bitcoin.
#EthereumFallsBelow$2500
#ETH
#ETHETFsApproved
INSIGHTS: $ETH Gains 60% in Q3 2026: Is a New Bullish Trend Emerging?
Ethereum has recorded a strong 60.62% gain in Q3, recovering from significant losses in Q1 and Q2.
After reaching $2,665, ETH is trading near $2,500 and recently outperformed Bitcoin.
#EthereumFallsBelow$2500
#ETH
#ETHETFsApproved
Ethereum has recorded a strong 60.62% gain in Q3, recovering from significant losses in Q1 and Q2.
After reaching $2,665, ETH is trading near $2,500 and recently outperformed Bitcoin.
#EthereumFallsBelow$2500
#ETH
#ETHETFsApproved
1
203
·
--
Bullish
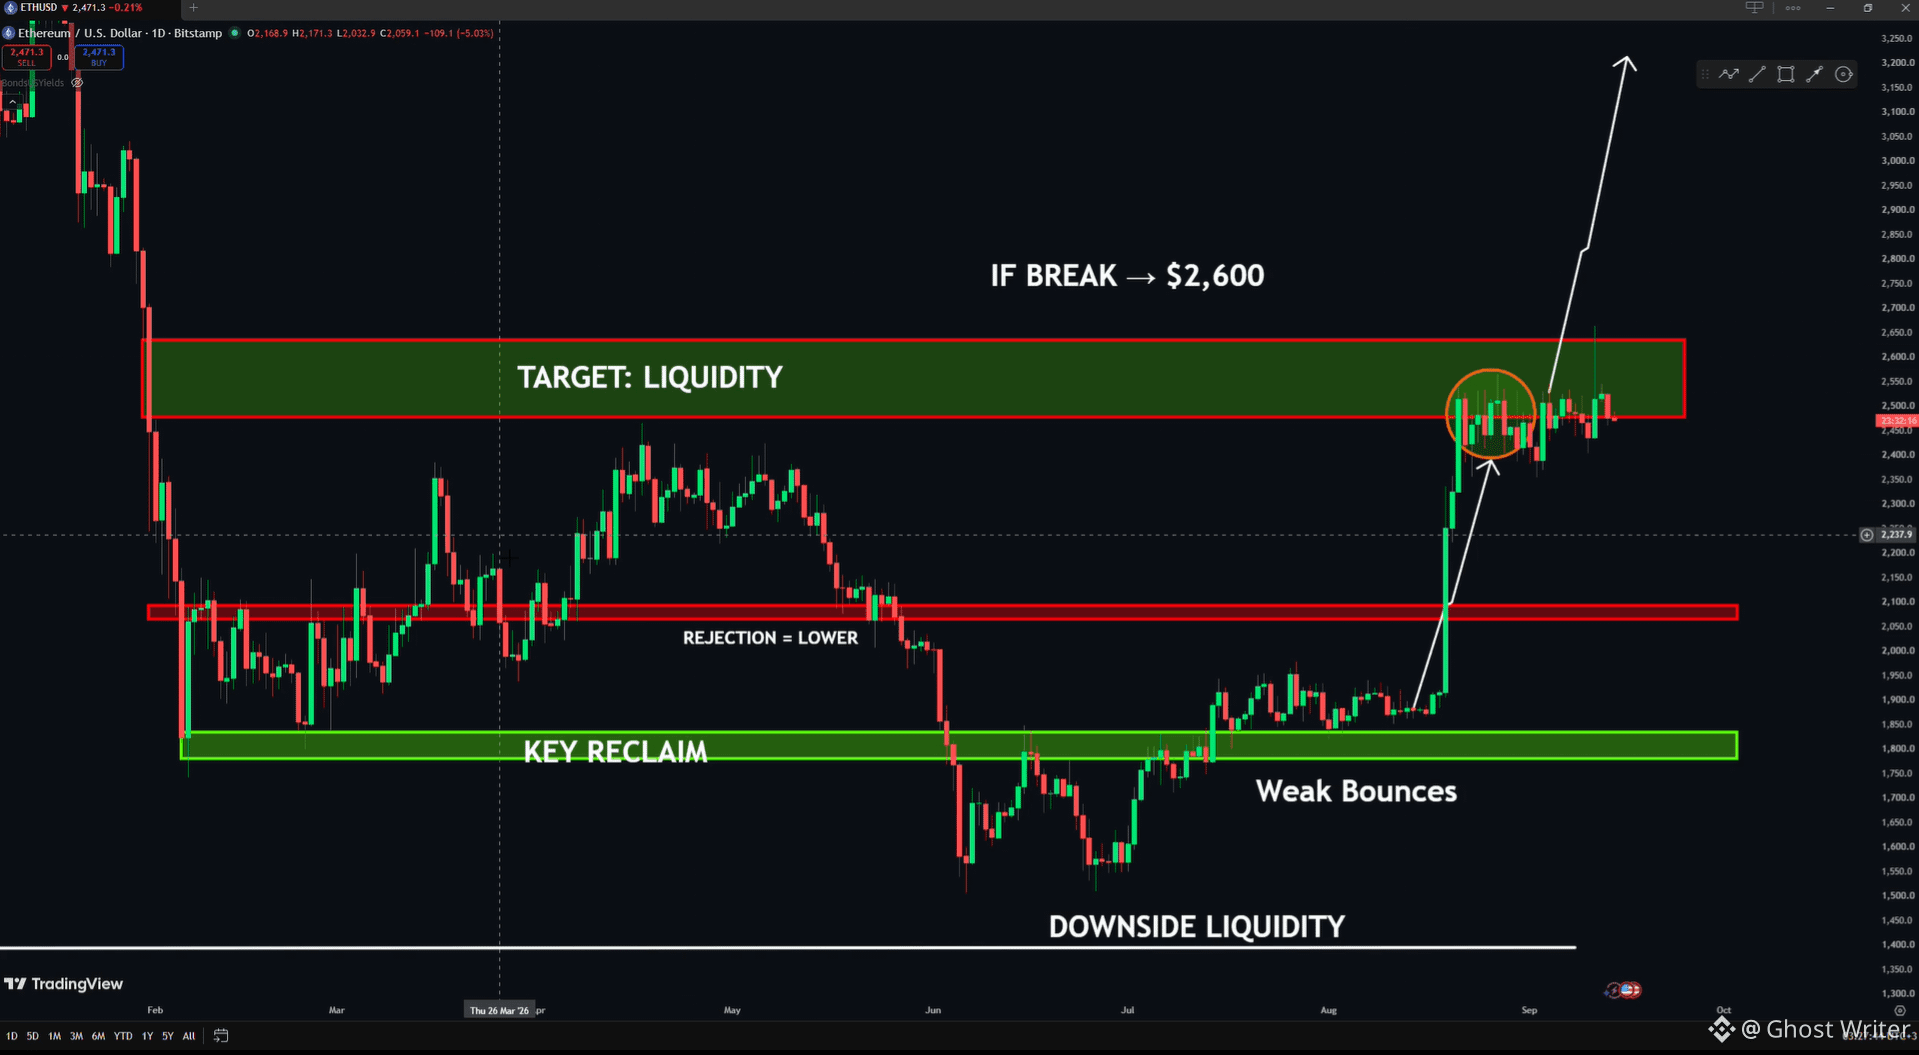
$ETH IS STILL FOLLOWING THE SAME ROADMAP 👀
ETH has broken out of the macro downtrend and is now holding above the breakout area.
The next major target remains the $2,600 liquidity zone.
So far:
> Strong support bounce ✅
> Macro downtrend breakout ✅
> Major expansion ✅
> Breakout holding ✅
> $2.6K liquidity in sight 🎯
ETH is currently consolidating just below the target zone.
A clean break through $2,600 could open the door toward $2.8K → $3K+.
The breakout happened. Now we’re waiting for the liquidity above to be taken. 🚀
#EthereumFallsBelow$2500
#ETH
#BitcoinSpotETFsRecord$463MNetOutflowLastWeek
$ETH IS STILL FOLLOWING THE SAME ROADMAP 👀
ETH has broken out of the macro downtrend and is now holding above the breakout area.
The next major target remains the $2,600 liquidity zone.
So far:
> Strong support bounce ✅
> Macro downtrend breakout ✅
> Major expansion ✅
> Breakout holding ✅
> $2.6K liquidity in sight 🎯
ETH is currently consolidating just below the target zone.
A clean break through $2,600 could open the door toward $2.8K → $3K+.
The breakout happened. Now we’re waiting for the liquidity above to be taken. 🚀
#EthereumFallsBelow$2500
#ETH
#BitcoinSpotETFsRecord$463MNetOutflowLastWeek
ETH has broken out of the macro downtrend and is now holding above the breakout area.
The next major target remains the $2,600 liquidity zone.
So far:
> Strong support bounce ✅
> Macro downtrend breakout ✅
> Major expansion ✅
> Breakout holding ✅
> $2.6K liquidity in sight 🎯
ETH is currently consolidating just below the target zone.
A clean break through $2,600 could open the door toward $2.8K → $3K+.
The breakout happened. Now we’re waiting for the liquidity above to be taken. 🚀
#EthereumFallsBelow$2500
#ETH
#BitcoinSpotETFsRecord$463MNetOutflowLastWeek
3
2.6k
·
--
Choose C.
The August CPI year-on-year growth of 3.4% actually didn’t beat expectations. The change was in the core month-on-month figure of 0.3% (forecast: 0.2%). Waller previously set 0.3% as the rate-hike threshold; now that threshold has been crossed. As a result, September’s rate hike has shifted from a “maybe” to the baseline.
But don’t just focus on the two words “rate hike.” The bad news was released on Friday: BTC first dumped and then rebounded, suggesting that most of this has already been priced in.
The real variable this week is the 16th’s FOMC meeting. A 25bp hike isn’t a surprise; what worries people is whether the dot plot also revises up projections for 2027. One rate hike is an event—what matters for liquidity is something higher for longer.
I won’t make pre-meeting guesses on my side. I’ll wait until the statement comes out and then see whether the dollar and real yields continue to rise.
#安友周一观察团 @binancezh
{spot}(BTCUSDT)
Choose C.
The August CPI year-on-year growth of 3.4% actually didn’t beat expectations. The change was in the core month-on-month figure of 0.3% (forecast: 0.2%). Waller previously set 0.3% as the rate-hike threshold; now that threshold has been crossed. As a result, September’s rate hike has shifted from a “maybe” to the baseline.
But don’t just focus on the two words “rate hike.” The bad news was released on Friday: BTC first dumped and then rebounded, suggesting that most of this has already been priced in.
The real variable this week is the 16th’s FOMC meeting. A 25bp hike isn’t a surprise; what worries people is whether the dot plot also revises up projections for 2027. One rate hike is an event—what matters for liquidity is something higher for longer.
I won’t make pre-meeting guesses on my side. I’ll wait until the statement comes out and then see whether the dollar and real yields continue to rise.
#安友周一观察团 @币安Binance华语
The August CPI year-on-year growth of 3.4% actually didn’t beat expectations. The change was in the core month-on-month figure of 0.3% (forecast: 0.2%). Waller previously set 0.3% as the rate-hike threshold; now that threshold has been crossed. As a result, September’s rate hike has shifted from a “maybe” to the baseline.
But don’t just focus on the two words “rate hike.” The bad news was released on Friday: BTC first dumped and then rebounded, suggesting that most of this has already been priced in.
The real variable this week is the 16th’s FOMC meeting. A 25bp hike isn’t a surprise; what worries people is whether the dot plot also revises up projections for 2027. One rate hike is an event—what matters for liquidity is something higher for longer.
I won’t make pre-meeting guesses on my side. I’ll wait until the statement comes out and then see whether the dollar and real yields continue to rise.
#安友周一观察团 @币安Binance华语



币安Binance华语
·
--
One-Week Hot Topics First Look, Binance Quick News!#安友周一观察团 🔥
This week, which market highlight are you most interested in?📊
🙋 Vote and leave your reasons in the comments. Retweet or share other hot topics to be entered into a draw for 5 people to win 30U—topic discussion reward!
A. Financial-version ChatGPT released, targeting investment banks and stock research
B. Anthropic CEO calls for slowing down AI development, plans for a Nasdaq IPO
C. US inflation remains high, rate expectations heat up again
D. August PPI up 5.4% YoY, CPI up 3.4% YoY
This week, which market highlight are you most interested in?📊
🙋 Vote and leave your reasons in the comments. Retweet or share other hot topics to be entered into a draw for 5 people to win 30U—topic discussion reward!
A. Financial-version ChatGPT released, targeting investment banks and stock research
B. Anthropic CEO calls for slowing down AI development, plans for a Nasdaq IPO
C. US inflation remains high, rate expectations heat up again
D. August PPI up 5.4% YoY, CPI up 3.4% YoY
153
·
--
Bearish
Verified
Spot BNB ETFs have not seen a single day of inflows in over three months 🥶
VanEck's spot @BNB_Chain ETF has not seen the start that many were hoping for.
The products have not seen any net inflow days since as far back as June 11, when they absorbed just +$235K.
In fact, they have not seen a single day of activity in the past three months aside from August 21, when they lost -$262K, per SoSo data.
ETF will make $BNB pump like $ZEC if the public can access it
#bnb #etf
Spot BNB ETFs have not seen a single day of inflows in over three months 🥶
VanEck's spot @BNB_Chain ETF has not seen the start that many were hoping for.
The products have not seen any net inflow days since as far back as June 11, when they absorbed just +$235K.
In fact, they have not seen a single day of activity in the past three months aside from August 21, when they lost -$262K, per SoSo data.
ETF will make $BNB pump like $ZEC if the public can access it
#bnb #etf
VanEck's spot @BNB_Chain ETF has not seen the start that many were hoping for.
The products have not seen any net inflow days since as far back as June 11, when they absorbed just +$235K.
In fact, they have not seen a single day of activity in the past three months aside from August 21, when they lost -$262K, per SoSo data.
ETF will make $BNB pump like $ZEC if the public can access it
#bnb #etf

2
686
·
--
Bullish
Partly True
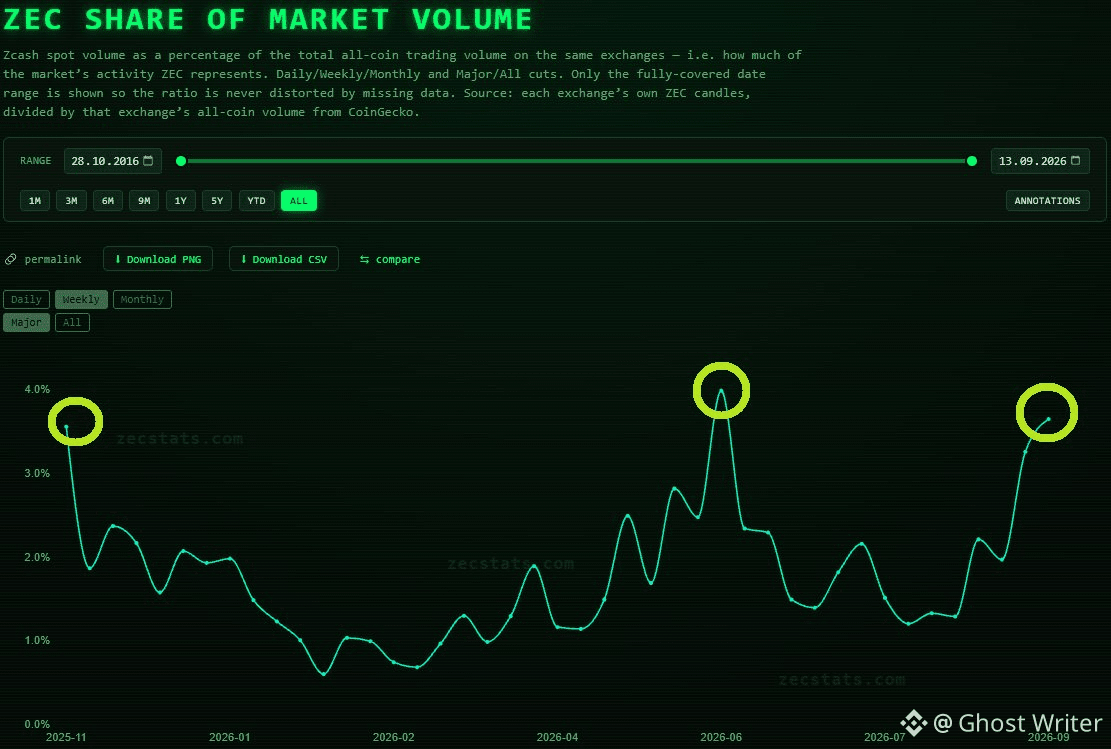
💥BREAKING NEWS: The #ZCash shares as a percentage of the TOTAL cryptocurrency market volume increased massively
⚡️The $ZEC share of total crypto market volume is near its all-time high at 4% of total market volume.
⚡️Since the new major Grayscale ZEC Spot ETF launch, the market volume share increased by +80%.
⚡️Increased exchange trading volume of $1.19B, up +619% from $165.7M three months earlier, contributed to this major increase.
If this dynamic continues, we will see a new all-time high in ZEC's percentage share of crypto market volume.
The price per ZEC is also likely to rise to new heights under these conditions.🚀
#zec
#ZcashNU7VoteEndsSeptember14
#ClarityActFacesProceduralVoteSept15
💥BREAKING NEWS: The #ZCash shares as a percentage of the TOTAL cryptocurrency market volume increased massively
⚡️The $ZEC share of total crypto market volume is near its all-time high at 4% of total market volume.
⚡️Since the new major Grayscale ZEC Spot ETF launch, the market volume share increased by +80%.
⚡️Increased exchange trading volume of $1.19B, up +619% from $165.7M three months earlier, contributed to this major increase.
If this dynamic continues, we will see a new all-time high in ZEC's percentage share of crypto market volume.
The price per ZEC is also likely to rise to new heights under these conditions.🚀
#zec
#ZcashNU7VoteEndsSeptember14
#ClarityActFacesProceduralVoteSept15
⚡️The $ZEC share of total crypto market volume is near its all-time high at 4% of total market volume.
⚡️Since the new major Grayscale ZEC Spot ETF launch, the market volume share increased by +80%.
⚡️Increased exchange trading volume of $1.19B, up +619% from $165.7M three months earlier, contributed to this major increase.
If this dynamic continues, we will see a new all-time high in ZEC's percentage share of crypto market volume.
The price per ZEC is also likely to rise to new heights under these conditions.🚀
#zec
#ZcashNU7VoteEndsSeptember14
#ClarityActFacesProceduralVoteSept15
3
1
7
9.3k
Log in to explore more content
Join global crypto users on Binance Square
⚡️ Get latest and useful information about crypto.
💬 Trusted by the world’s largest crypto exchange.
👍 Discover real insights from verified creators.
Email / Phone number
Trending Topics
FedRateWatch
235,928 views
1,539 Discussing
Share & Win Traffic Reward in our Trending Hashtag Campaign
✨Topic: FOMC September, What's The Fed's Next Move?
👉How to Join:
Publish a short post or article with hashtag #FedRateWatch
Create content based on the below angles:
- August core CPI rose 0.3% month-over-month, and the odds of a 25bp hike this week are now close to 90%. Do you anticipate a rate hike this week? Is it a one-off, or the start of a longer hiking cycle?
- If the hike lands, how does it play out for BTC, tech stocks, and gold? Bullish or bearish?
- How are you planning to trade next? Share your BTC, stocks or gold trade/holdings with our trade sharing widget.
⏰Campaign Period:
- 2026-09-15 11:00 - 2026-09-17 3:00 UTC
🎁Reward:
- Qualified posts that comply with the above guidelines and contain more than 100 words will be reviewed and may receive a random traffic boost of 500 to 3,000 views. You will receive a notification from your feed secretary if your post is selected.
- Get a chance to have your article featured on Binance Square Official
Need ideas for your post? Visit the topic page #FedRateWatch or the Square Guide on How to Post for Better Reach.
Binance Square Official
·279 Likes
·481.8k views
BitcoinSlidesTo$76000
1,761 views
45 Discussing
BitcoinReboundsTo$79K
47,128 views
348 Discussing