
加密交易叫兽
654 Posts

加密交易叫兽
信任不是买来的,
是长出来的。
推特同名
你信我,不是因为我给了你什么方法,
是因为我懂你。
我懂你为什么扛单,
懂你为什么拿不住,
懂你为什么总是在同一个地方摔。
你信我,
是因为我在你身上,看见了我自己
Youtube:@加密交易叫兽
X:@cryptomallqy
29 Following
372 Followers
613 Liked
Posts
All
Quotes
Videos
Live
Bitcoin began adjusting on schedule; this is far from over! I took a huge loss of 36,000 yuan last night—review and summary!
Sure enough, small sweet potato per capita has a Ferrari
Someone says Sun Ge is bad
But no one has ever said Sun Ge is poor #波场主网激活TVM布拉格大阪兼容
Someone says Sun Ge is bad
But no one has ever said Sun Ge is poor #波场主网激活TVM布拉格大阪兼容

Brother Sun told others to delete all contact information from before the 90s
In the end, he secretly went to touch the girl from the 1988 generation
In the end, he secretly went to touch the girl from the 1988 generation
Bitcoin, have you been liking bidirectional trading lately?! Liquidation is waiting for you
$BTC
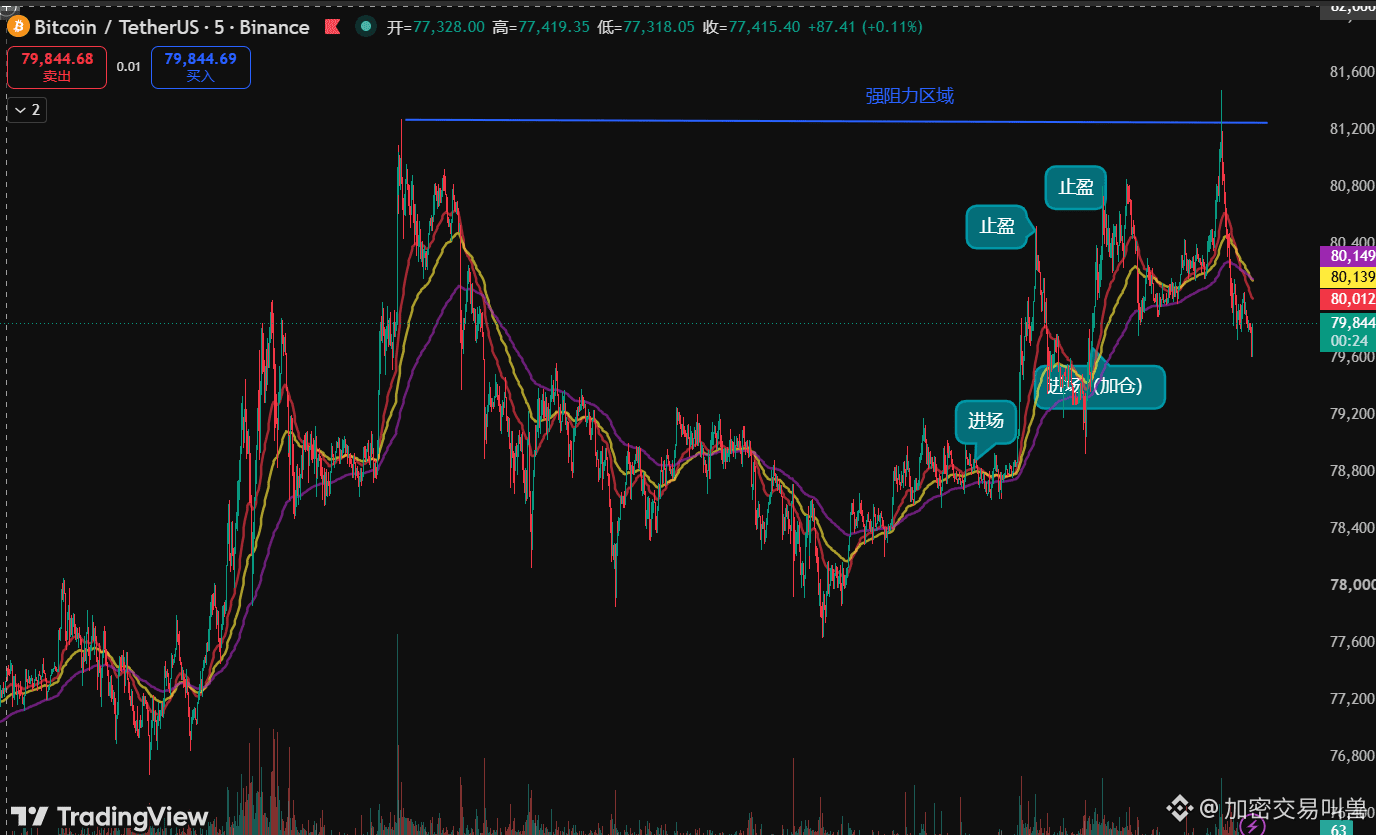
Late yesterday evening, two consecutive pullbacks to the 5-minute EMA30 were taken long, and both produced relatively large profits. However, it is clearly visible that when the second push reached a high point, price quickly dropped afterward. The same pattern also occurred around midnight. This resulted in an increased-volume long upper shadow candle on the 1-hour chart. The market is gradually shifting from strong bullish momentum to a weaker-bullish stance, and on smaller timeframes it is starting to gradually turn bearish. On the 1-hour timeframe, the bullish alignment trend is still intact and price has not broken below the EMA30. But today during the day, if it cannot reclaim 80600 and then again falls below the previous day’s 79000 pullback low, a double top will likely be confirmed successfully, and the trend may return below 78000.
Regarding execution, it is recommended to reduce position size to about half of the usual amount to avoid the risk of a “stop-hit” spike followed by a quick pullback. Only consider left-side entries, and wait to enter after price stands above 80600. Stay on the sidelines for shorts.
$ETH
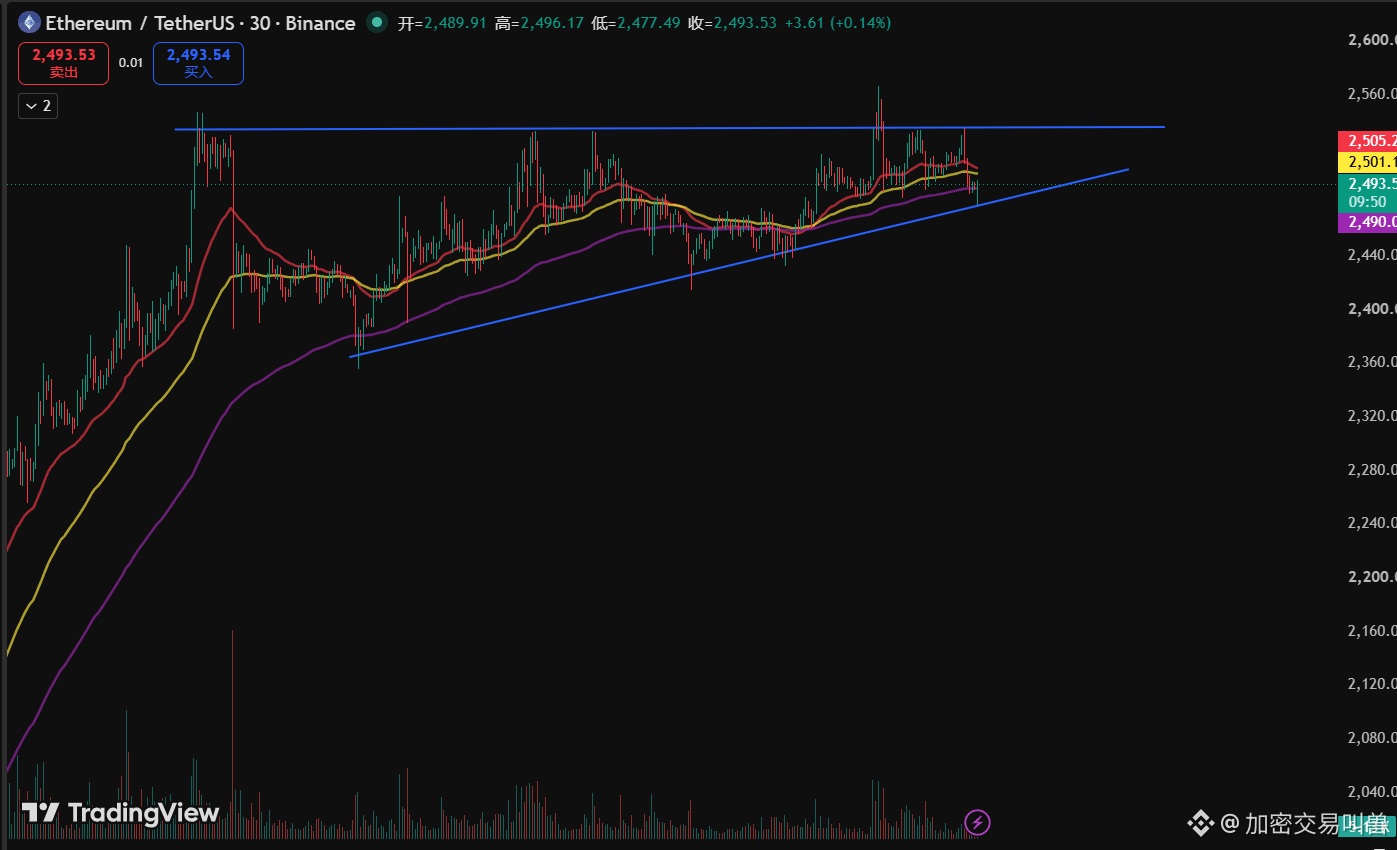
At midnight, BTC did not follow through to break the recent highs near 2560. Price has now returned to the level from yesterday’s upward move. Currently, the 1-hour chart shows a triangular convergence, waiting for a directional breakout. Be patient and wait for a long setup only after the level at 2540 breaks and an effective retest occurs.
$SNDK
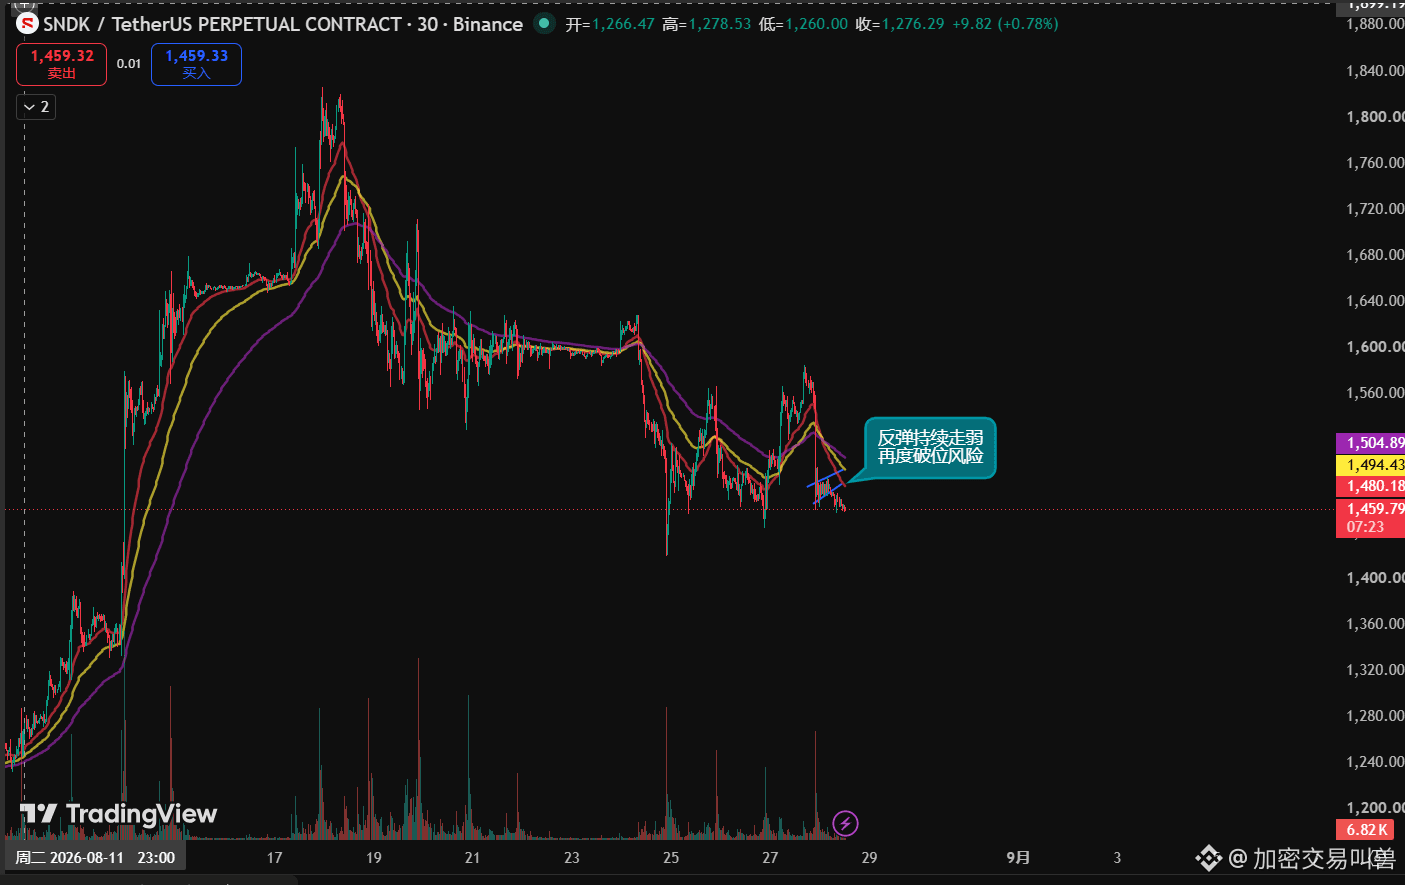
For three consecutive days, there has been a pattern of topping followed by pullbacks, and the pullback volume has continued to increase. After 1456 was tested continuously, the rebound volume has become smaller and smaller—so the break is almost a sure thing. For the short term, prioritize short positions, with a target around 1329.
XAU
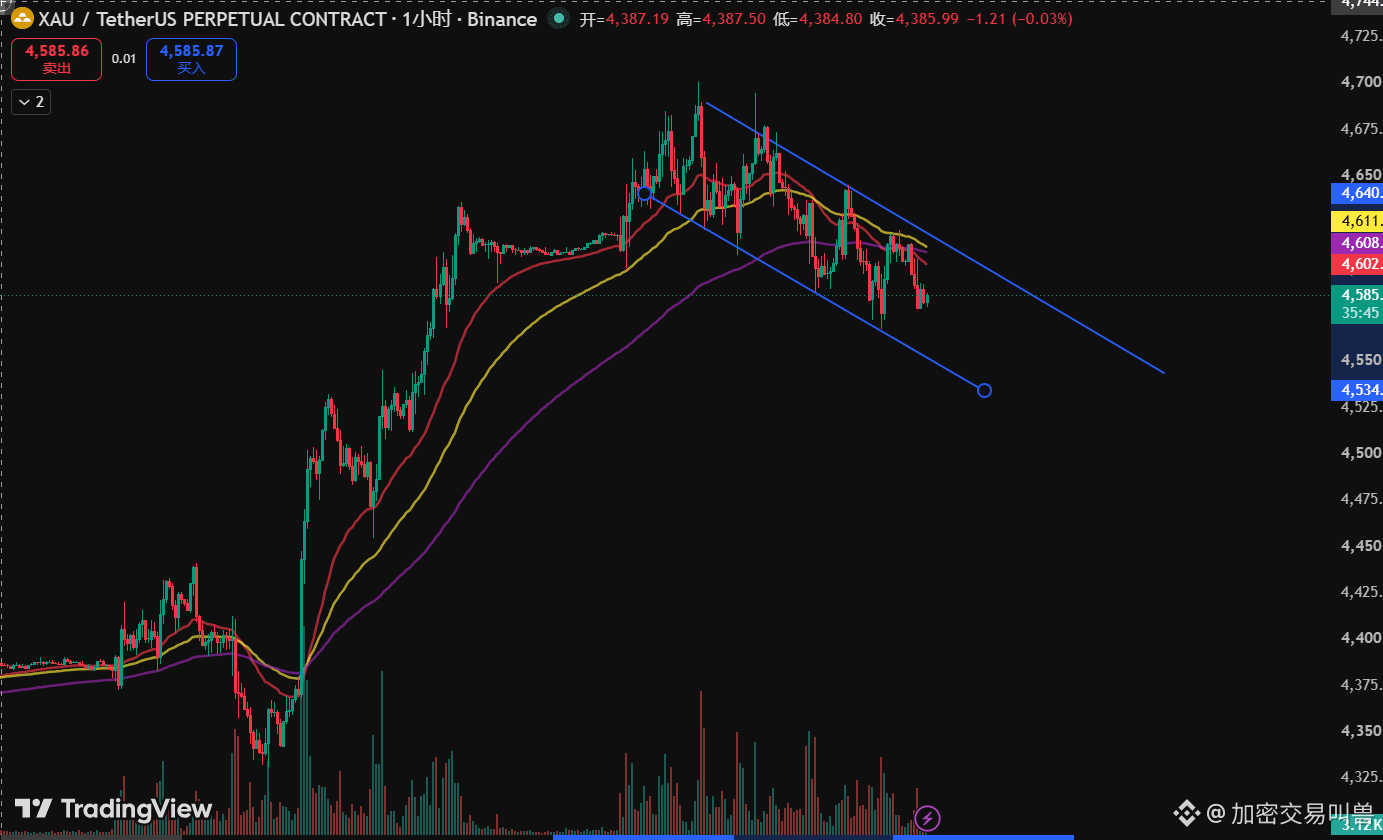
A bull flag formed at the highs, but it has still failed to break through the key resistance at 4622. This also aligns with the earlier judgment that XAU may see a short-term top around 4650. However, the market is currently divided, with many doji candles, making it easy to form “sting” wicks that shake out positions. It is recommended to take a short-term wait-and-see approach for this instrument. Only consider trend trades after a break above 4620 or after a drop below 4561. Currently, the amplitude is relatively small, so there is little trading value.
Late yesterday evening, two consecutive pullbacks to the 5-minute EMA30 were taken long, and both produced relatively large profits. However, it is clearly visible that when the second push reached a high point, price quickly dropped afterward. The same pattern also occurred around midnight. This resulted in an increased-volume long upper shadow candle on the 1-hour chart. The market is gradually shifting from strong bullish momentum to a weaker-bullish stance, and on smaller timeframes it is starting to gradually turn bearish. On the 1-hour timeframe, the bullish alignment trend is still intact and price has not broken below the EMA30. But today during the day, if it cannot reclaim 80600 and then again falls below the previous day’s 79000 pullback low, a double top will likely be confirmed successfully, and the trend may return below 78000.
Regarding execution, it is recommended to reduce position size to about half of the usual amount to avoid the risk of a “stop-hit” spike followed by a quick pullback. Only consider left-side entries, and wait to enter after price stands above 80600. Stay on the sidelines for shorts.
$ETH
At midnight, BTC did not follow through to break the recent highs near 2560. Price has now returned to the level from yesterday’s upward move. Currently, the 1-hour chart shows a triangular convergence, waiting for a directional breakout. Be patient and wait for a long setup only after the level at 2540 breaks and an effective retest occurs.
$SNDK
For three consecutive days, there has been a pattern of topping followed by pullbacks, and the pullback volume has continued to increase. After 1456 was tested continuously, the rebound volume has become smaller and smaller—so the break is almost a sure thing. For the short term, prioritize short positions, with a target around 1329.
XAU
A bull flag formed at the highs, but it has still failed to break through the key resistance at 4622. This also aligns with the earlier judgment that XAU may see a short-term top around 4650. However, the market is currently divided, with many doji candles, making it easy to form “sting” wicks that shake out positions. It is recommended to take a short-term wait-and-see approach for this instrument. Only consider trend trades after a break above 4620 or after a drop below 4561. Currently, the amplitude is relatively small, so there is little trading value.
Jing Tian still doesn’t understand Brother Sun, huh
You can fool Brother Sun about feelings
But you can’t fool Brother Sun about money
You can fool Brother Sun about feelings
But you can’t fool Brother Sun about money
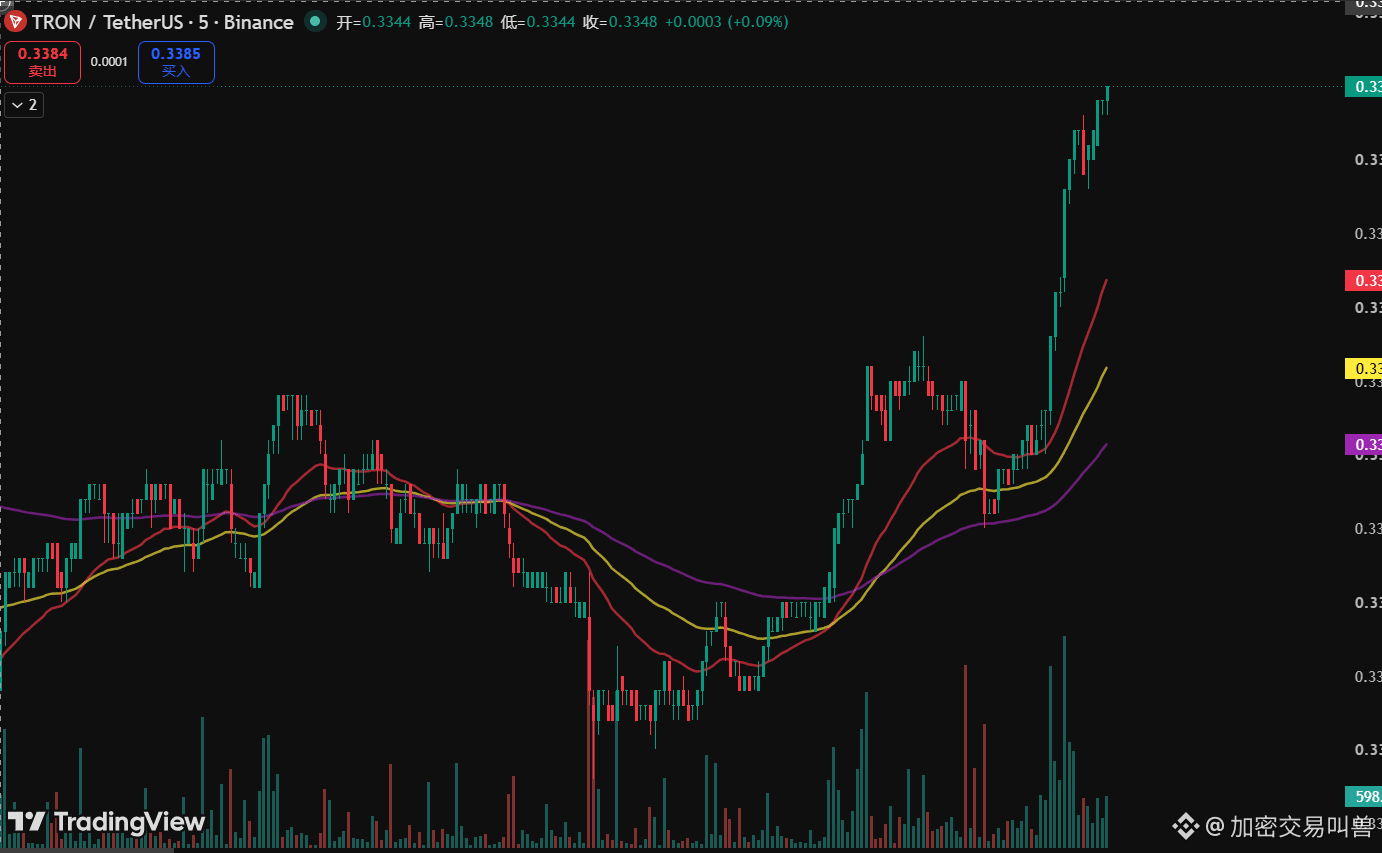
Learn it, brothers...

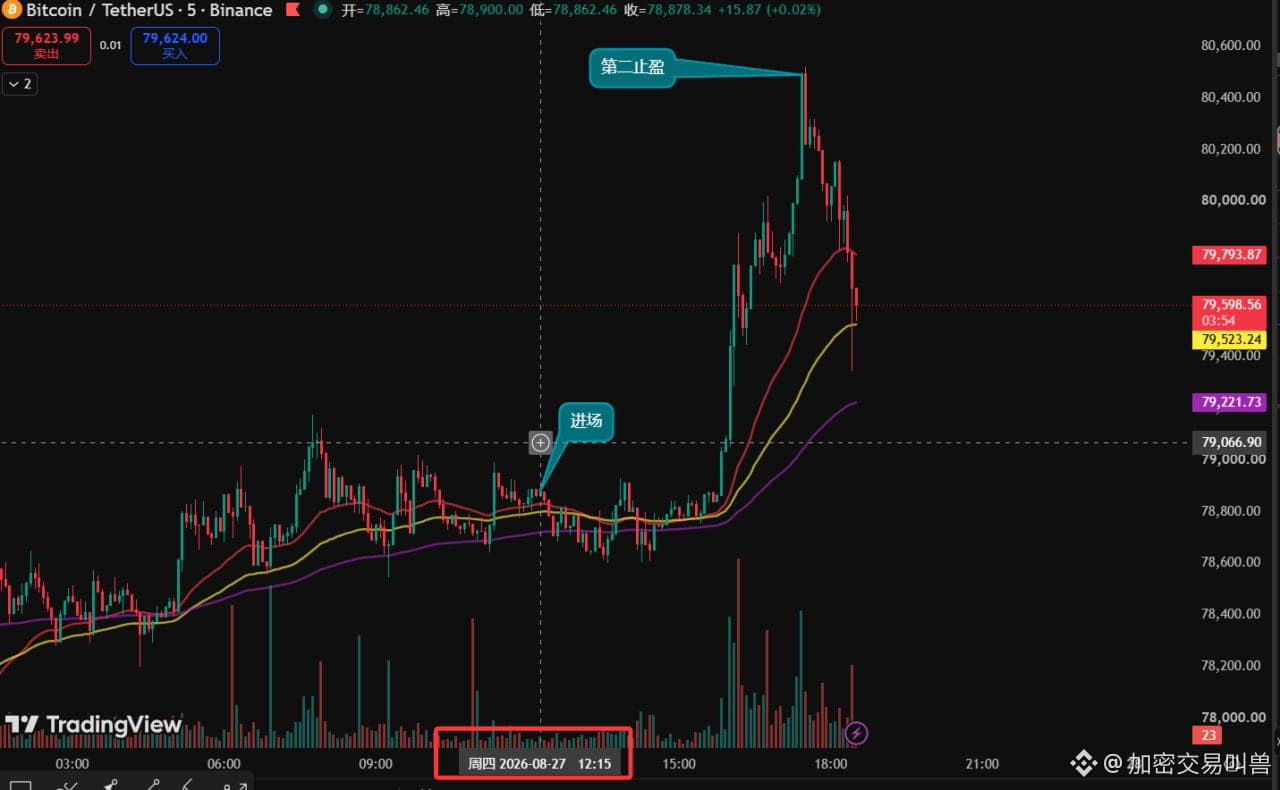
After experiencing a 2-lot short-stop loss yesterday, at 12:17 pm today the members’ group provided a Bitcoin long position. It successfully reached the second take-profit, and now it seems we’re exactly near the lowest point before the move began. This is also within the comfort zone of the Jiaoshu trading system. Including the previous 20x position, it was entered in the same structure, going directly from 64,000 to 80,500! Currently, this long position is still being held to target an additional $BTC

Stand straight and take a beating! Yesterday, on short-term trades, three singles stopped out and two did—are you making a profit or taking a loss?
When you get ambiguous signals, do you choose to act or not? This video will tell you the answer
Bitcoin’s correction isn’t over! The daily chart is very likely to return to 75,000. When price spikes upward, watch out for a bull trap.
#比特币受阻于81000美元50周均线 #Solana现货ETF累计净流入创纪录12.2亿美元
These crypto-market teachers have a superpower:
When it’s going up, they go all-in.
When it’s going down, they go to cash.
When they get liquidated, they disappear.
When BTC breaks $80,000:
You’ll see $100,000—at least $120,000 this time. Don’t cry if you miss the chance.
When BTC pulls back:
I reminded you about the risks long ago. $80,000 was always a resistance level. Luckily I didn’t chase.
So what I find hardest to understand now isn’t the candlestick chart—it’s the teachers’ positions.
Because every time I review and replay the trades, it looks like they always bought at the right time.
But after staring at it for a long while, I still can’t figure out exactly when they bought.
These crypto-market teachers have a superpower:
When it’s going up, they go all-in.
When it’s going down, they go to cash.
When they get liquidated, they disappear.
When BTC breaks $80,000:
You’ll see $100,000—at least $120,000 this time. Don’t cry if you miss the chance.
When BTC pulls back:
I reminded you about the risks long ago. $80,000 was always a resistance level. Luckily I didn’t chase.
So what I find hardest to understand now isn’t the candlestick chart—it’s the teachers’ positions.
Because every time I review and replay the trades, it looks like they always bought at the right time.
But after staring at it for a long while, I still can’t figure out exactly when they bought.
#btc触及80000美元
$BTC
Around 81,000 is a strong resistance area on the daily chart. Yesterday’s high-and-fail move is a normal occurrence. The daily candle closed with a long upper wick and a shrinking-volume bearish candle, indicating that short-term consolidation is becoming more obvious. Pay attention to the support at 77,200 below. Meanwhile, a 30-minute short-term head-and-shoulders top has formed; the neckline is at 78,350. If price breaks below it intraday, it will enter a minute-level bearish structure—be careful.
$ETH
Before this, Bitcoin retraced to the 30-period EMA on the 4-hour timeframe and formed a triangle convergence structure—wait for a directional breakout. On the 30-minute timeframe, the EMAs have started to converge, and price has broken down below the uptrend line from 8/23. Today, watch for a rebound to test this trendline’s pressure (2,490). If it reaches that level and then continues with larger bearish candles on smaller timeframes, you can enter a short position with a small size.
$SNDK
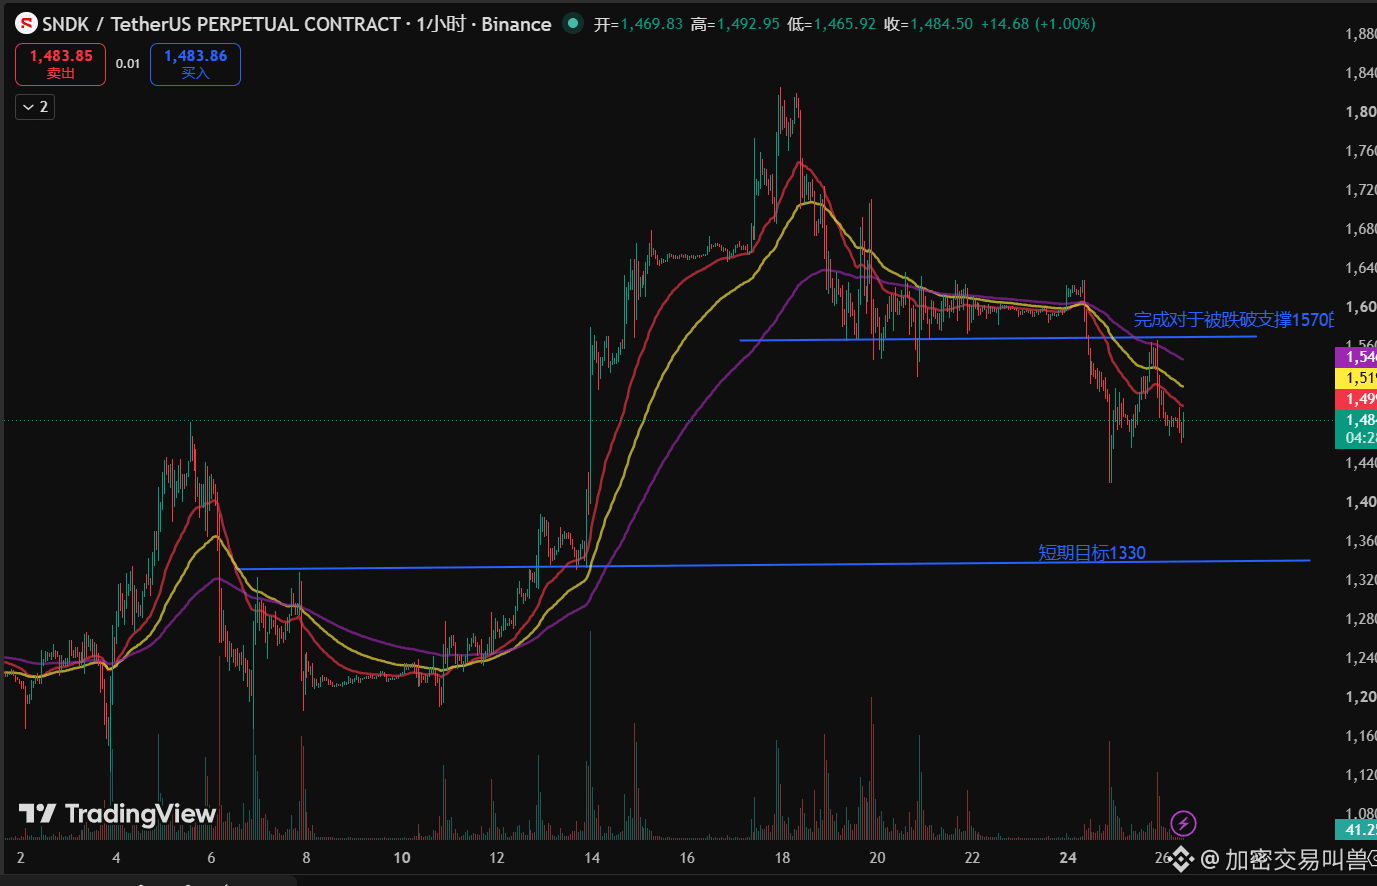
After the accelerated bearish candle on the evening of 8/24, a stage bottom was not formed. During yesterday’s rebound, volume and momentum continued to shrink, and price once again surged and failed around 1,570—thereby completing confirmation of the earlier support/resistance role reversal. The 3 EMAs have begun to turn downward again. The overall idea remains the same: only short, not too much. The key flip point between long/short is 1,532. If that level is broken, you need to adjust direction in time.
XAU
There is divergence at the high level, but it has not broken below the 30-period EMA on the 1-hour timeframe. The short-term target is still expected to be above 4,800. The long/short boundary point is 4,622; after breaking below, you need to shift direction.
$BTC
Around 81,000 is a strong resistance area on the daily chart. Yesterday’s high-and-fail move is a normal occurrence. The daily candle closed with a long upper wick and a shrinking-volume bearish candle, indicating that short-term consolidation is becoming more obvious. Pay attention to the support at 77,200 below. Meanwhile, a 30-minute short-term head-and-shoulders top has formed; the neckline is at 78,350. If price breaks below it intraday, it will enter a minute-level bearish structure—be careful.
$ETH
Before this, Bitcoin retraced to the 30-period EMA on the 4-hour timeframe and formed a triangle convergence structure—wait for a directional breakout. On the 30-minute timeframe, the EMAs have started to converge, and price has broken down below the uptrend line from 8/23. Today, watch for a rebound to test this trendline’s pressure (2,490). If it reaches that level and then continues with larger bearish candles on smaller timeframes, you can enter a short position with a small size.
$SNDK
After the accelerated bearish candle on the evening of 8/24, a stage bottom was not formed. During yesterday’s rebound, volume and momentum continued to shrink, and price once again surged and failed around 1,570—thereby completing confirmation of the earlier support/resistance role reversal. The 3 EMAs have begun to turn downward again. The overall idea remains the same: only short, not too much. The key flip point between long/short is 1,532. If that level is broken, you need to adjust direction in time.
XAU
There is divergence at the high level, but it has not broken below the 30-period EMA on the 1-hour timeframe. The short-term target is still expected to be above 4,800. The long/short boundary point is 4,622; after breaking below, you need to shift direction.
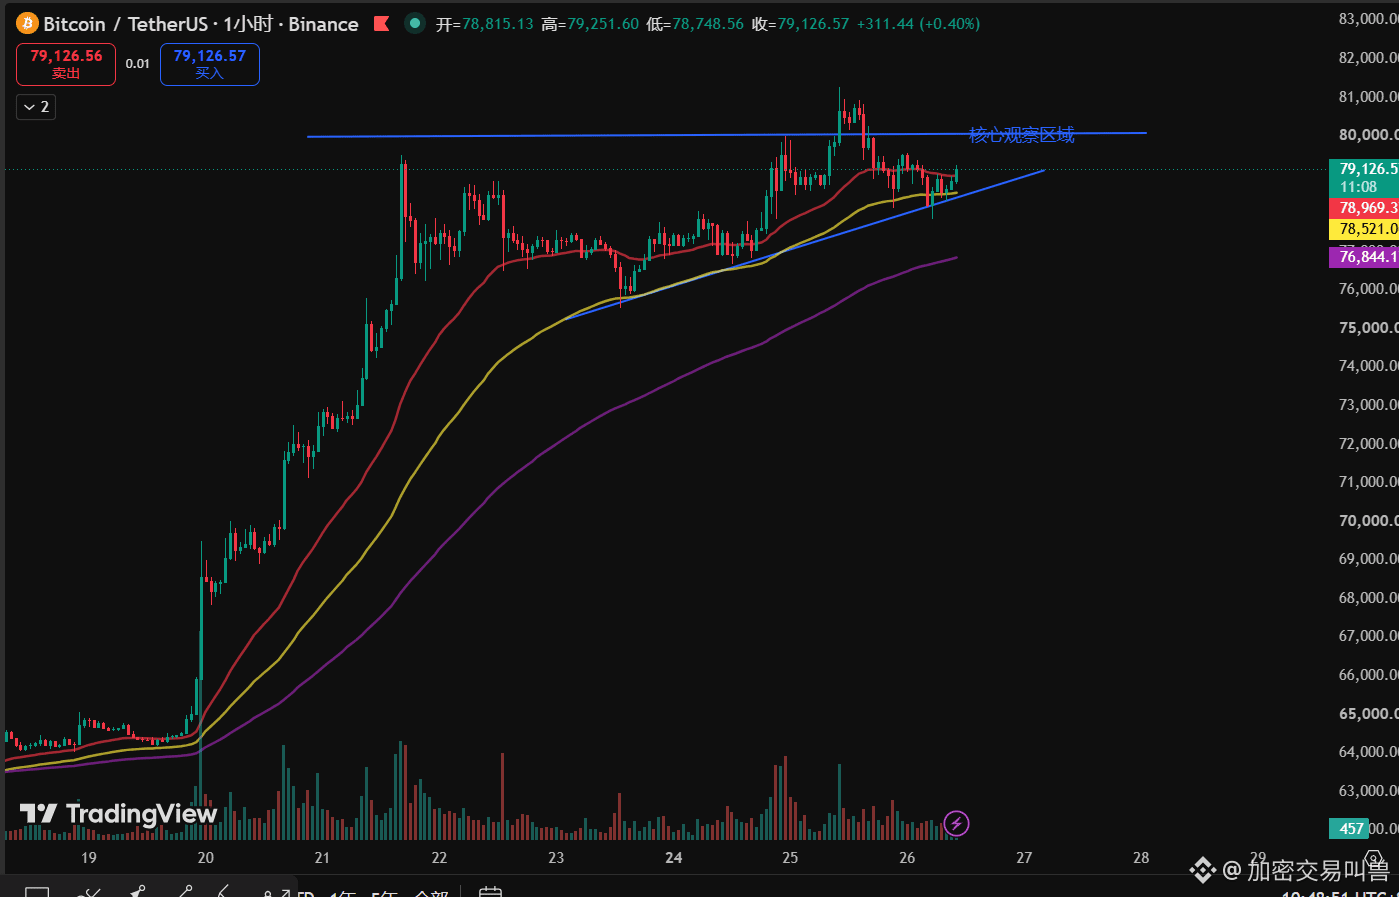
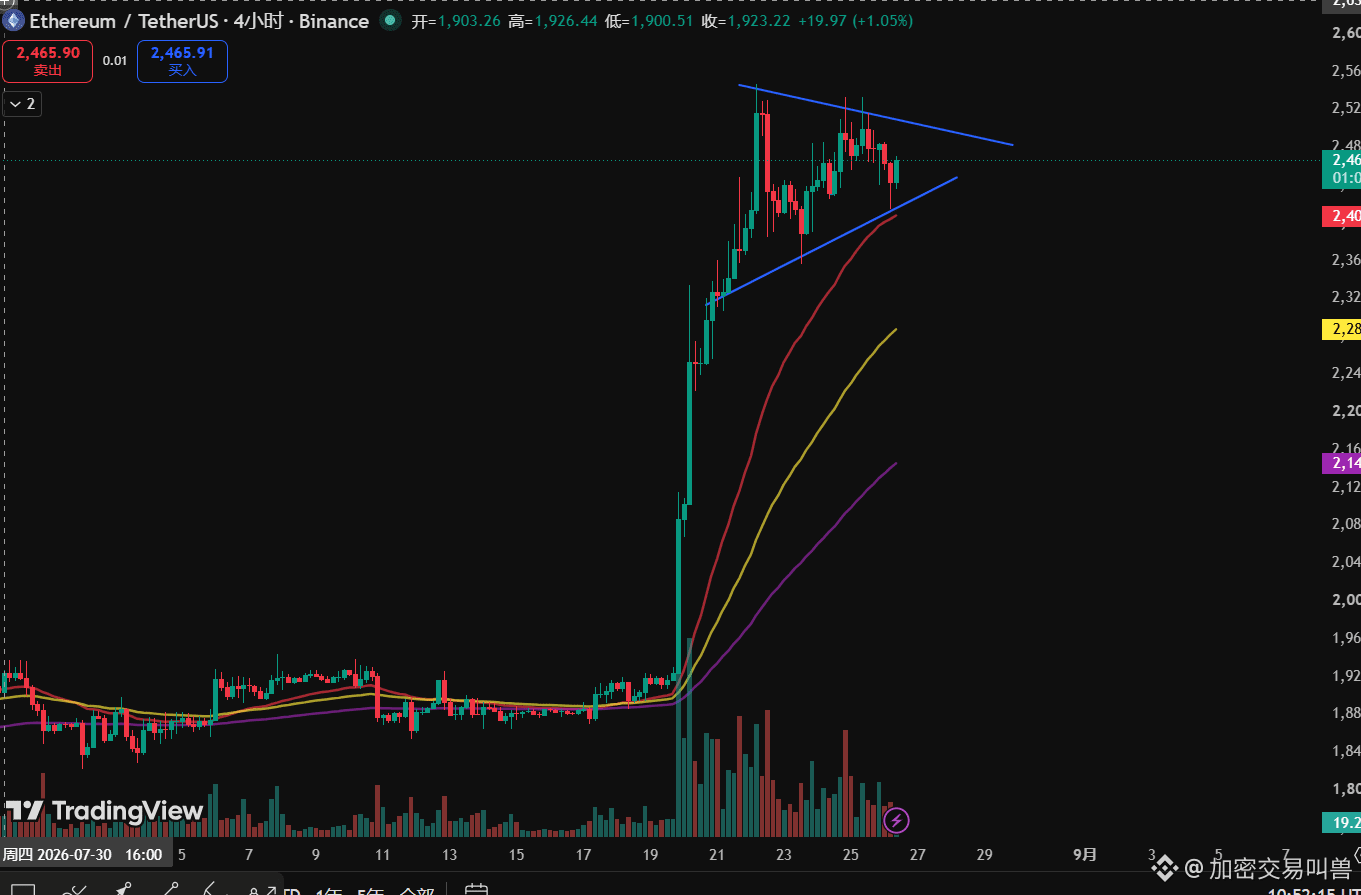
When the profit-loss ratio is too poor, you can use this method to enter the market, but you must also assume the risks involved!
After the sharp rally in recent days, the sound of “bulls returning” grows louder. Many people ask whether a bull market is here and whether the bear market has ended. My view is that you don’t need to focus on bull versus bear. Many people, based on how BTC has performed in the long-term during previous bull market cycles, believe that as long as they buy the bottom during a bear market, they can hold all the way to the end of the bull market and achieve the maximum returns—so they always want to buy the bottom in a bear market. If you have that kind of thinking, then you’re simply not capable of holding for years until the bull market ends. Those who truly can hold never have the thought or behavior of “buying the bottom” all at once, because they started buying in stages long ago. The cognition behind people’s actions is consistent: if you have the idea of buying the bottom, then you’re destined to have the idea of taking profit at the top. If you want to take profit at the top, then you definitely won’t be able to hold to the very end. So don’t let a beautiful imagination blind you. As long as you focus on the bull-bear transition, you can’t capture the entire bull market.#比特币周涨23.6% $BTC
Bitcoin has perfectly controlled the rhythm of falling then rising, but today a dangerous signal has appeared! We need to adjust our thinking
#btc触及80000美元
$BTC
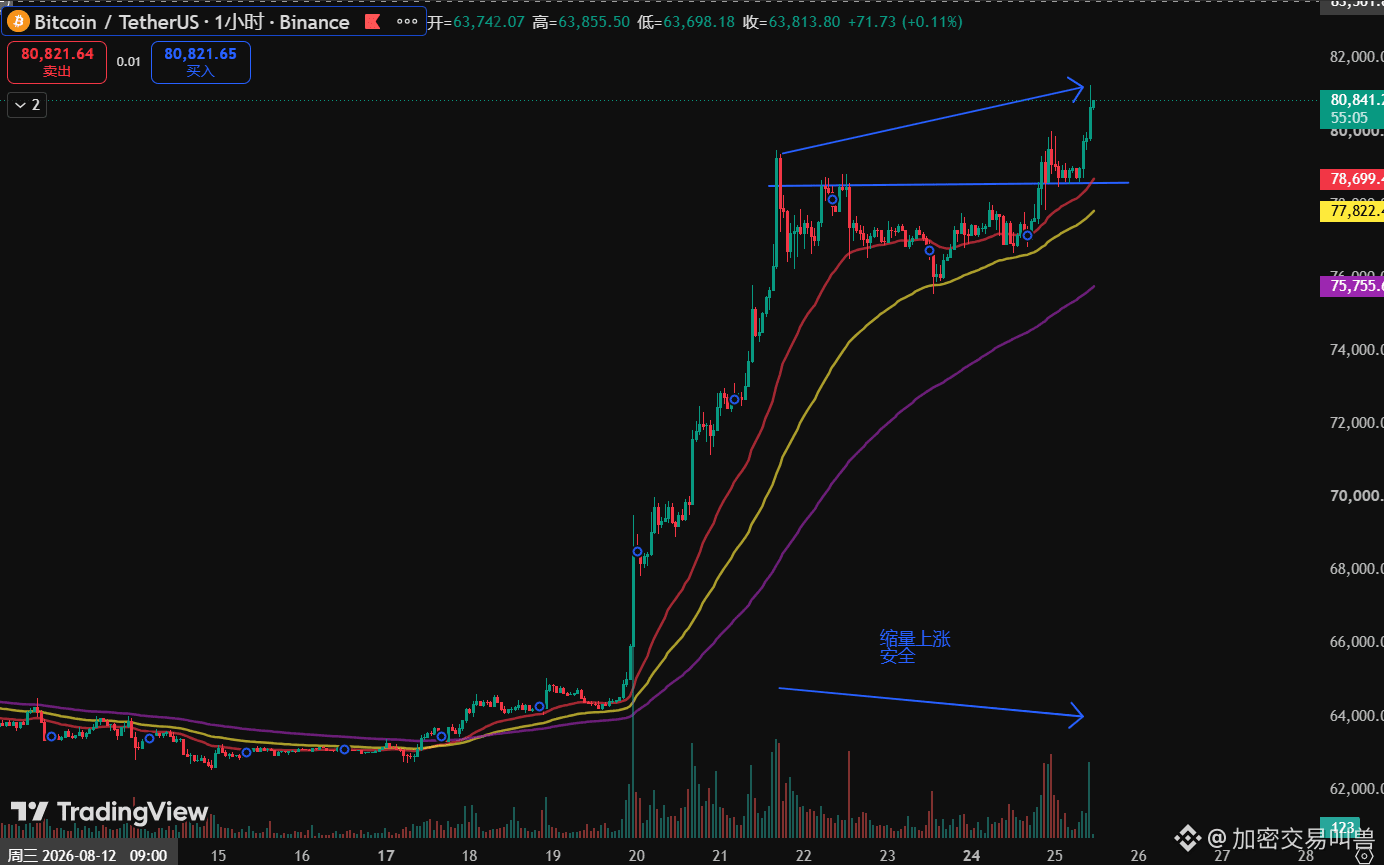
The morning analysis clearly stated that the current market is not complicated. Focus on the opportunities after the breakout above 78569. The situation has now been verified. After the breakout last night, during the early hours it continued to consolidate near this level with shrinking volume, and then it successfully broke above 80,000 in the morning. As shown in the chart, this is another rally on reduced volume. Market supply has not increased, the short-term top has not formed yet, and it should continue to rise, with the target still around 82,000.
Many people always fantasize that since this level is so high, will there be a needle-like spike. Guessing is the most taboo thing in trading. Whether a spike happens is the market’s choice. You only need to plan your trade, trade your plan, and set your stop-loss.
$ETH
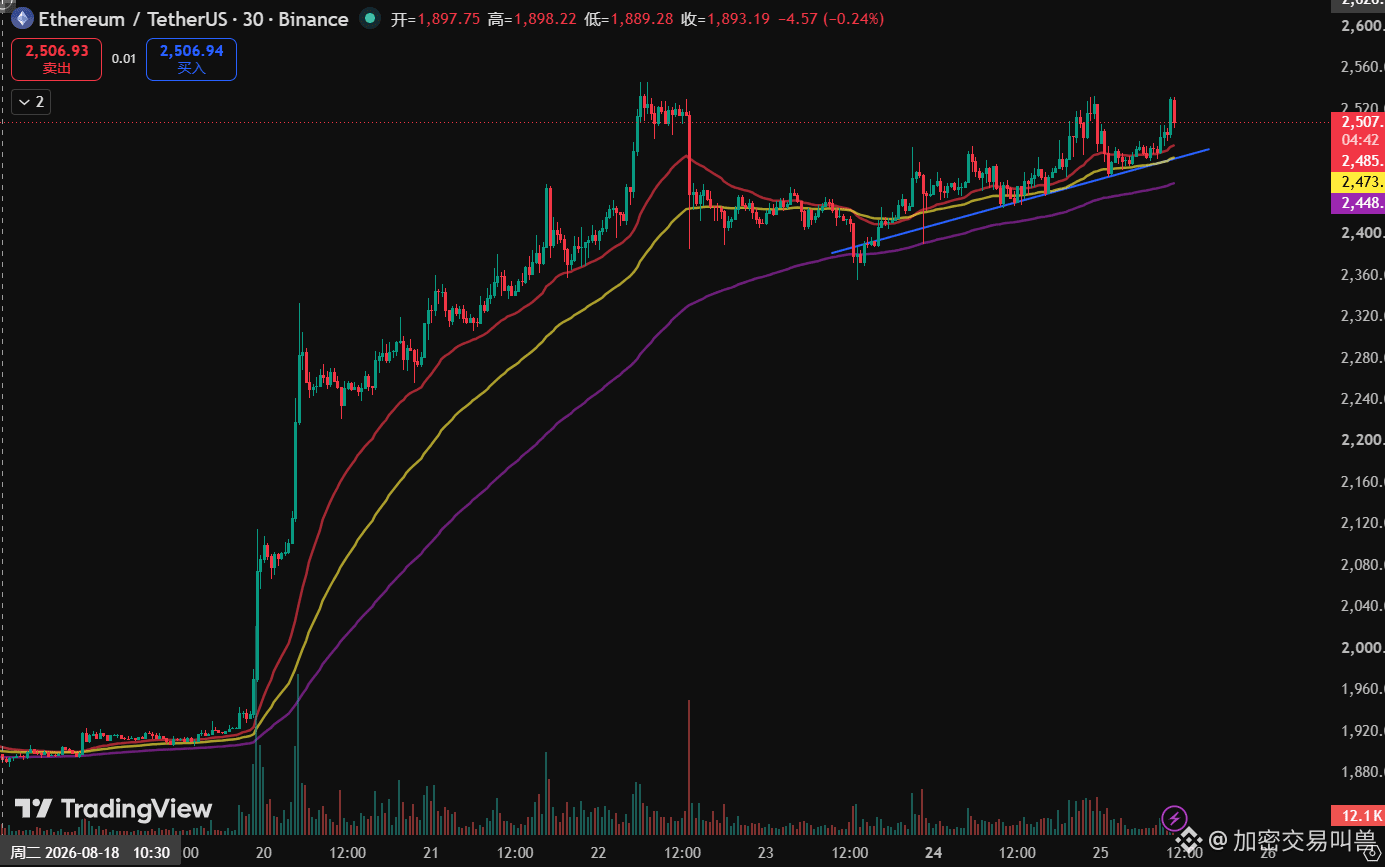
Compared to BTC, the trend has started to weaken. Since yesterday morning’s new high, the magnitude of the increase has been smaller. However, the sell volume during the decline has not expanded and remains in a safe zone. The current important support is at 2465, and the three EMAs are still trending upward, so the bias remains bullish. Therefore, be careful: after a rapid breakdown of support, there may be a rebound.
If price breaks support during the day, you can quickly switch to a 5-minute chart to monitor, then use a 1-minute timeframe to check whether there is a strong bullish long (a strong bullish candle) appearing—then you may consider chasing a long entry. In addition, during the day, do not short under any circumstances. Do not chase any large bullish candles on the 15-minute timeframe or higher, to avoid getting trapped by a fake breakout.
$SNDK
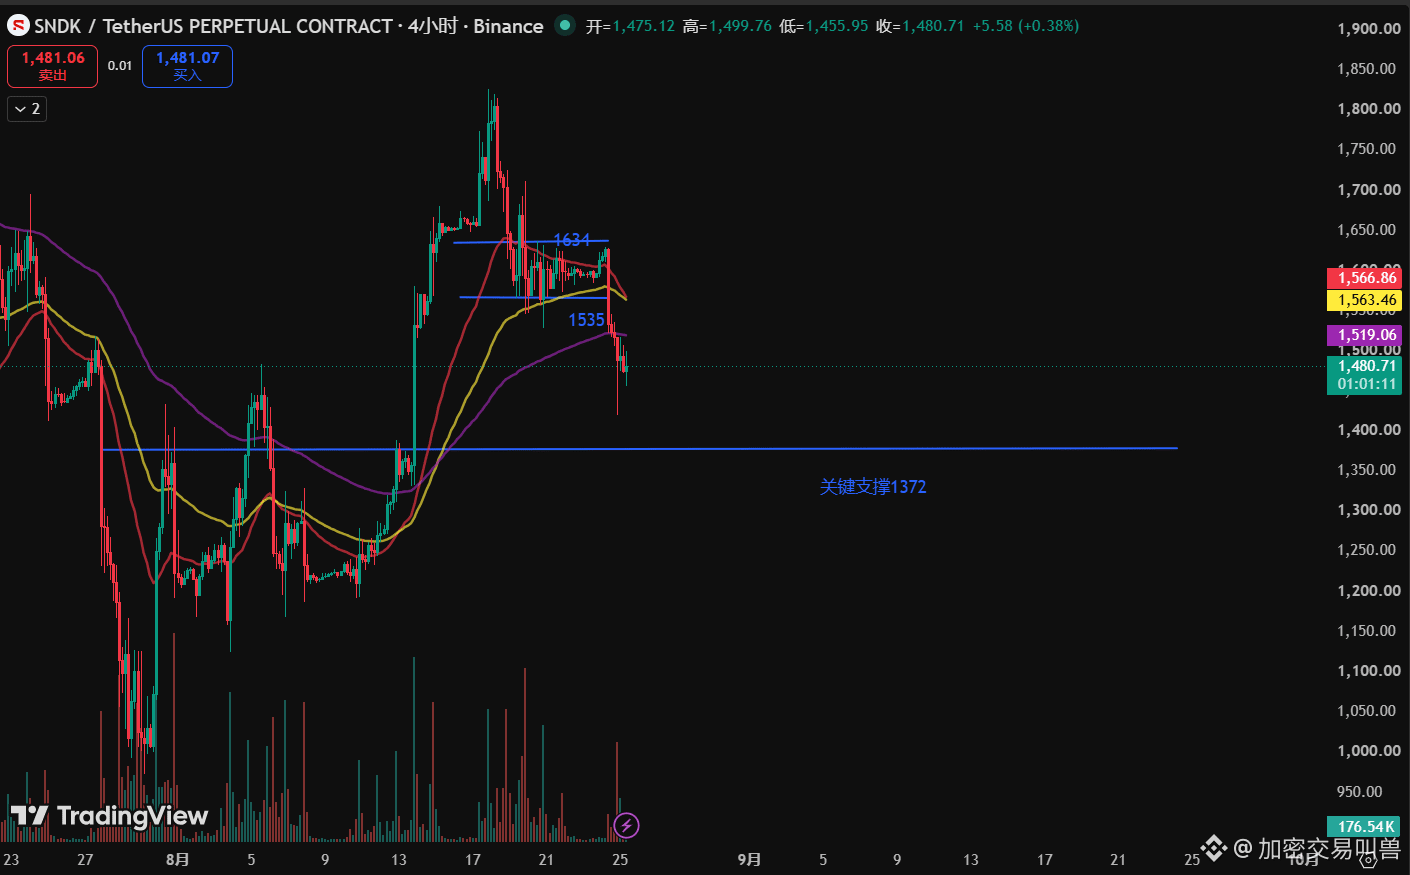
It broke down from the 1535–1634 ranging area. Then in the evening it formed an accelerating bearish candle, but the volume did not spike to a huge level. After that, the rebound has been relatively weak, with continuous consolidation and many doji candles, meaning the market has not stabilized yet and there is still downside room.
Notably, on the 4-hour timeframe, the three EMAs have started to turn downward. Since the rebound began on 8/14, there is an expectation that the rebound trend may be ending. Pay attention to risks in the short term, with support around 1389.
XAU
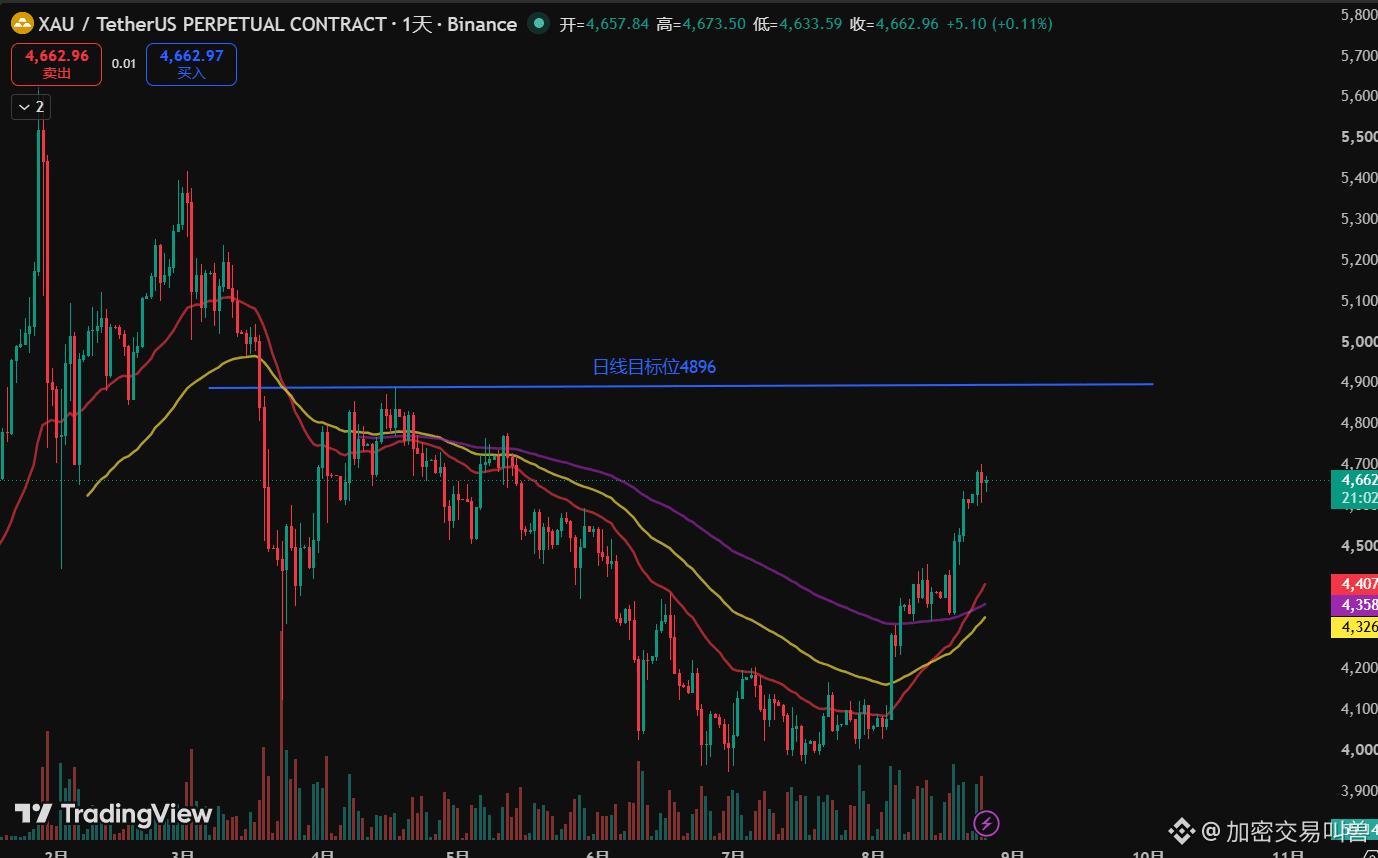
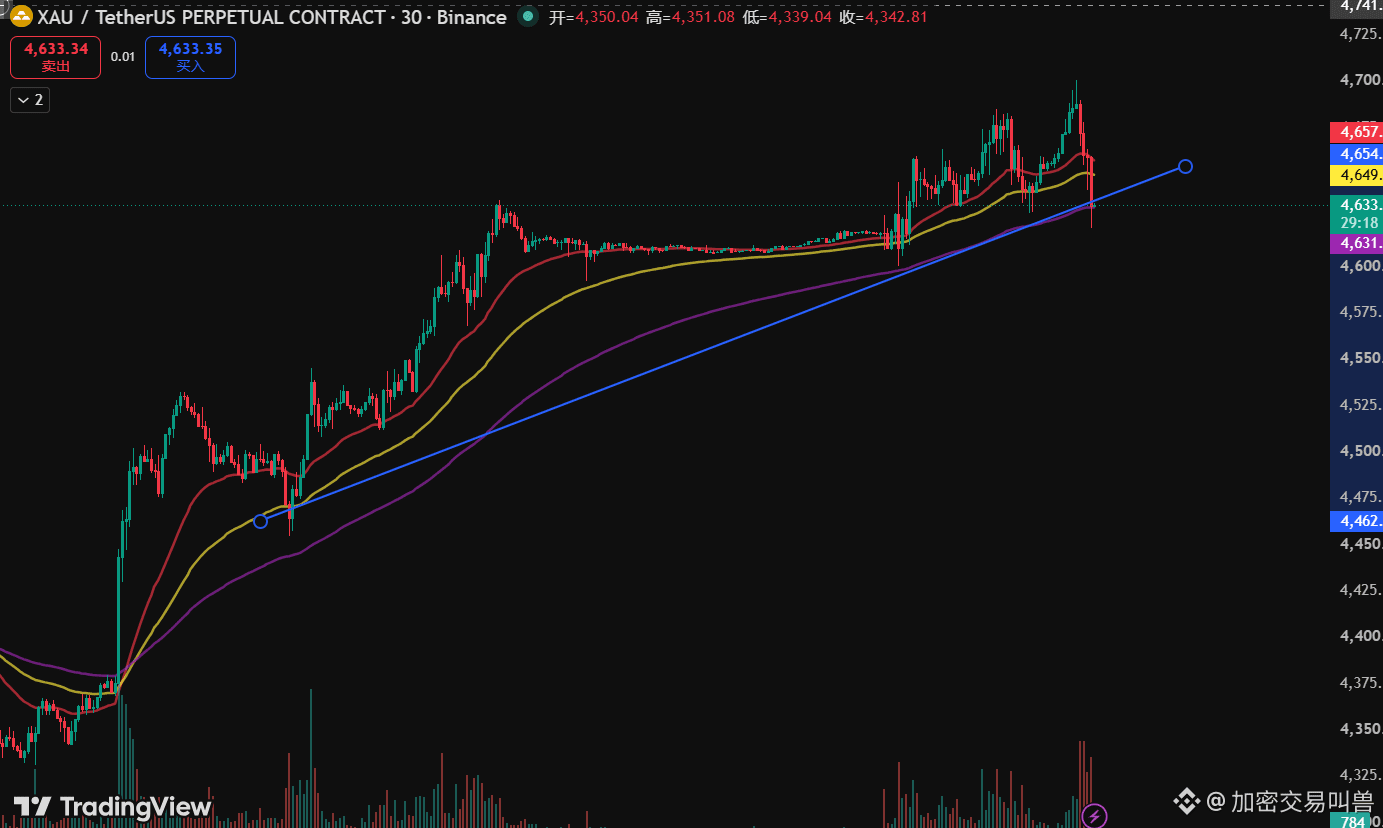
After a needle-like sweep in the early morning yesterday, price traded in a choppy upward range all day. You can see that the volume has clearly started to expand, while the amplitude of the high points has been decreasing. There is already divergence in the high-level market. If today’s close ends with a bearish engulfing pattern (a daily bearish candle that engulfs the bullish candle), there is short-term risk of a pullback!
Initial estimate is around 4536. Also, the target level given yesterday at 4711 is just one step away (today’s intraday high was 4700—unfortunately). Remember to protect your profits.
$BTC
The morning analysis clearly stated that the current market is not complicated. Focus on the opportunities after the breakout above 78569. The situation has now been verified. After the breakout last night, during the early hours it continued to consolidate near this level with shrinking volume, and then it successfully broke above 80,000 in the morning. As shown in the chart, this is another rally on reduced volume. Market supply has not increased, the short-term top has not formed yet, and it should continue to rise, with the target still around 82,000.
Many people always fantasize that since this level is so high, will there be a needle-like spike. Guessing is the most taboo thing in trading. Whether a spike happens is the market’s choice. You only need to plan your trade, trade your plan, and set your stop-loss.
$ETH
Compared to BTC, the trend has started to weaken. Since yesterday morning’s new high, the magnitude of the increase has been smaller. However, the sell volume during the decline has not expanded and remains in a safe zone. The current important support is at 2465, and the three EMAs are still trending upward, so the bias remains bullish. Therefore, be careful: after a rapid breakdown of support, there may be a rebound.
If price breaks support during the day, you can quickly switch to a 5-minute chart to monitor, then use a 1-minute timeframe to check whether there is a strong bullish long (a strong bullish candle) appearing—then you may consider chasing a long entry. In addition, during the day, do not short under any circumstances. Do not chase any large bullish candles on the 15-minute timeframe or higher, to avoid getting trapped by a fake breakout.
$SNDK
It broke down from the 1535–1634 ranging area. Then in the evening it formed an accelerating bearish candle, but the volume did not spike to a huge level. After that, the rebound has been relatively weak, with continuous consolidation and many doji candles, meaning the market has not stabilized yet and there is still downside room.
Notably, on the 4-hour timeframe, the three EMAs have started to turn downward. Since the rebound began on 8/14, there is an expectation that the rebound trend may be ending. Pay attention to risks in the short term, with support around 1389.
XAU
After a needle-like sweep in the early morning yesterday, price traded in a choppy upward range all day. You can see that the volume has clearly started to expand, while the amplitude of the high points has been decreasing. There is already divergence in the high-level market. If today’s close ends with a bearish engulfing pattern (a daily bearish candle that engulfs the bullish candle), there is short-term risk of a pullback!
Initial estimate is around 4536. Also, the target level given yesterday at 4711 is just one step away (today’s intraday high was 4700—unfortunately). Remember to protect your profits.
DAY3 recap
$BTC
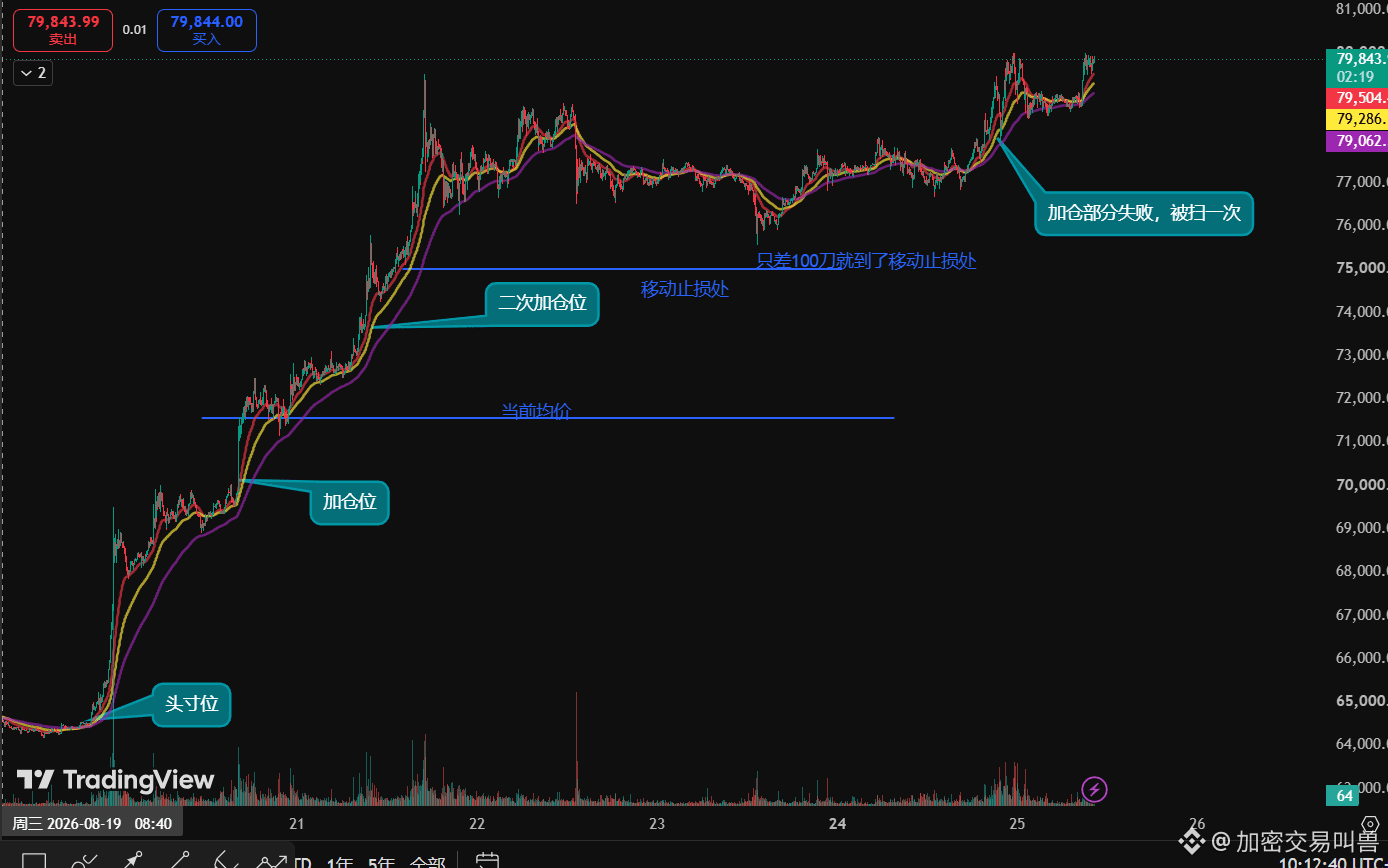
In the past two days, there has been high-level consolidation + overlapping parts of the candlesticks, and more doji stars, indicating that we are now entering the distribution/“shakeout” phase.
To prevent a needle-like spike from triggering a stop loss, I moved the stop loss to the 5-minute timeframe, near the bullish-defense area around 75000.
Originally, I planned to add once after a breakout above 78000, and set a separate stop loss for that position.
But I didn’t expect that during the spike around midnight, price surged up and then dropped back, and it just happened to tap the stop loss for that added position.
Although I didn’t lose money, it caused my average entry price to rise again by another 1000.
That means the average price moved from the initial 64230 to now 748000, and I’ve taken profit of about 50%.
In the long run, the target toward 82000 remains unchanged.
This time, the add-on was made too hastily. At this stage, don’t chase just because price is breaking the recent high.
You should wait for a pullback, and only enter after confirming that the support holds.
That said, at least most of the profits since the 8.19 launch have been captured, and it’s beyond my expectations.
Next, let’s see how far the market can go. Over the next couple of days, you can take some partial profits and also look at the US stock market.
Don’t take profit voluntarily—only move the stop loss.
$BTC
In the past two days, there has been high-level consolidation + overlapping parts of the candlesticks, and more doji stars, indicating that we are now entering the distribution/“shakeout” phase.
To prevent a needle-like spike from triggering a stop loss, I moved the stop loss to the 5-minute timeframe, near the bullish-defense area around 75000.
Originally, I planned to add once after a breakout above 78000, and set a separate stop loss for that position.
But I didn’t expect that during the spike around midnight, price surged up and then dropped back, and it just happened to tap the stop loss for that added position.
Although I didn’t lose money, it caused my average entry price to rise again by another 1000.
That means the average price moved from the initial 64230 to now 748000, and I’ve taken profit of about 50%.
In the long run, the target toward 82000 remains unchanged.
This time, the add-on was made too hastily. At this stage, don’t chase just because price is breaking the recent high.
You should wait for a pullback, and only enter after confirming that the support holds.
That said, at least most of the profits since the 8.19 launch have been captured, and it’s beyond my expectations.
Next, let’s see how far the market can go. Over the next couple of days, you can take some partial profits and also look at the US stock market.
Don’t take profit voluntarily—only move the stop loss.
So-called left-side and right-side trading is essentially just doing math problems.
Left-side trading is doing proof questions. Prove that your understanding is correct.
Right-side trading is doing judgment questions. Judge that your trend is correct.
Left-side trading is doing proof questions. Prove that your understanding is correct.
Right-side trading is doing judgment questions. Judge that your trend is correct.
Log in to explore more content