$BTC
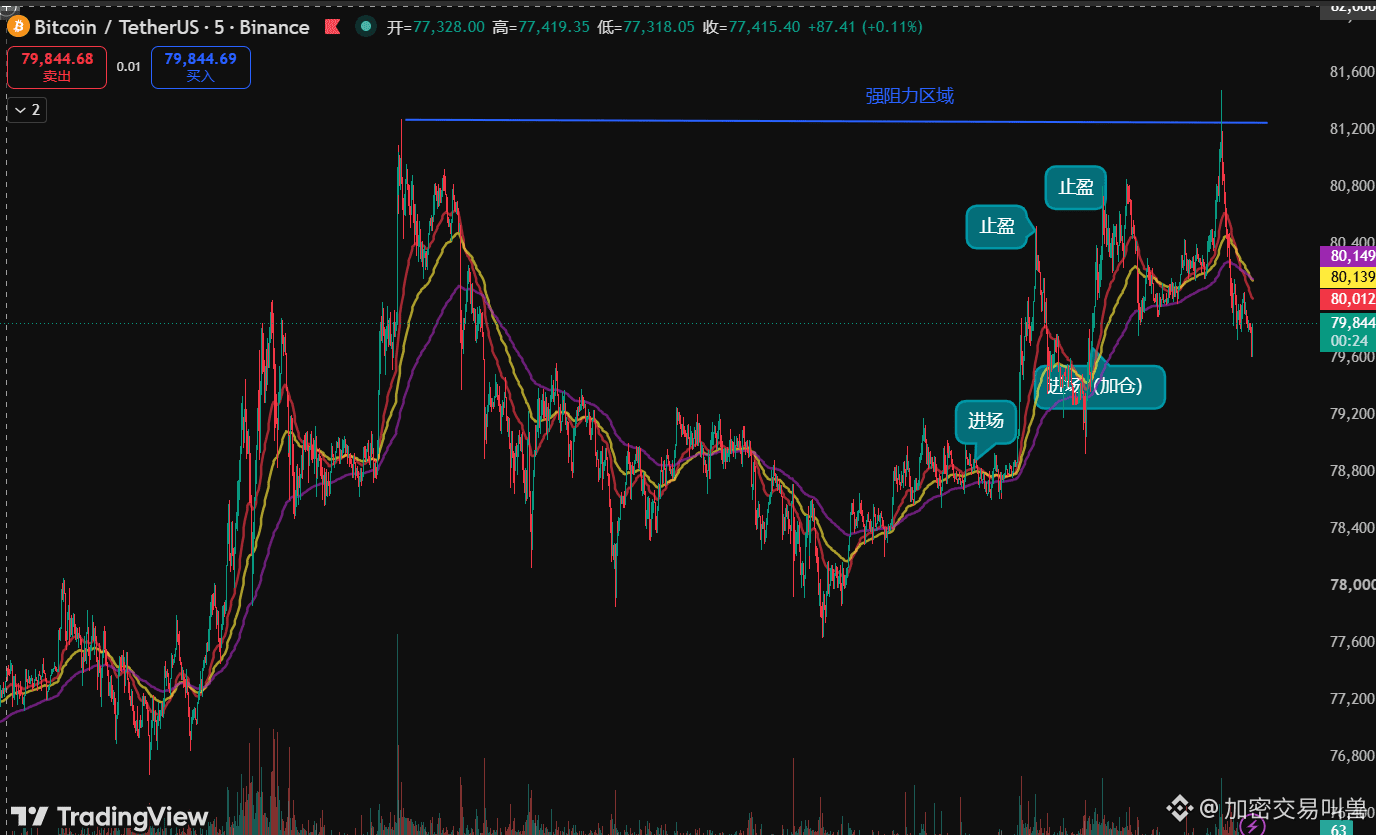
Late yesterday evening, two consecutive pullbacks to the 5-minute EMA30 were taken long, and both produced relatively large profits. However, it is clearly visible that when the second push reached a high point, price quickly dropped afterward. The same pattern also occurred around midnight. This resulted in an increased-volume long upper shadow candle on the 1-hour chart. The market is gradually shifting from strong bullish momentum to a weaker-bullish stance, and on smaller timeframes it is starting to gradually turn bearish. On the 1-hour timeframe, the bullish alignment trend is still intact and price has not broken below the EMA30. But today during the day, if it cannot reclaim 80600 and then again falls below the previous day’s 79000 pullback low, a double top will likely be confirmed successfully, and the trend may return below 78000.
Regarding execution, it is recommended to reduce position size to about half of the usual amount to avoid the risk of a “stop-hit” spike followed by a quick pullback. Only consider left-side entries, and wait to enter after price stands above 80600. Stay on the sidelines for shorts.
$ETH
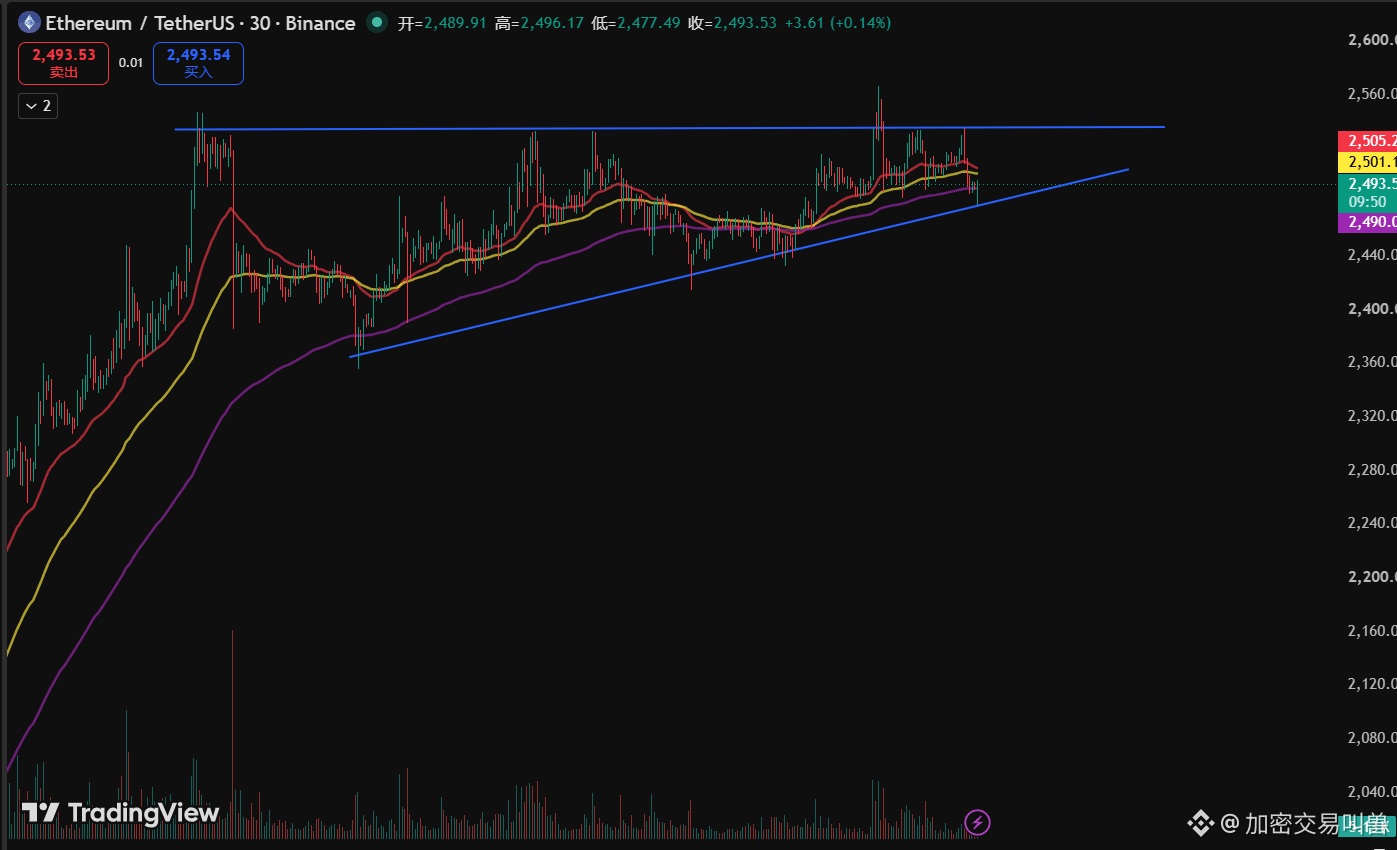
At midnight, BTC did not follow through to break the recent highs near 2560. Price has now returned to the level from yesterday’s upward move. Currently, the 1-hour chart shows a triangular convergence, waiting for a directional breakout. Be patient and wait for a long setup only after the level at 2540 breaks and an effective retest occurs.
$SNDK
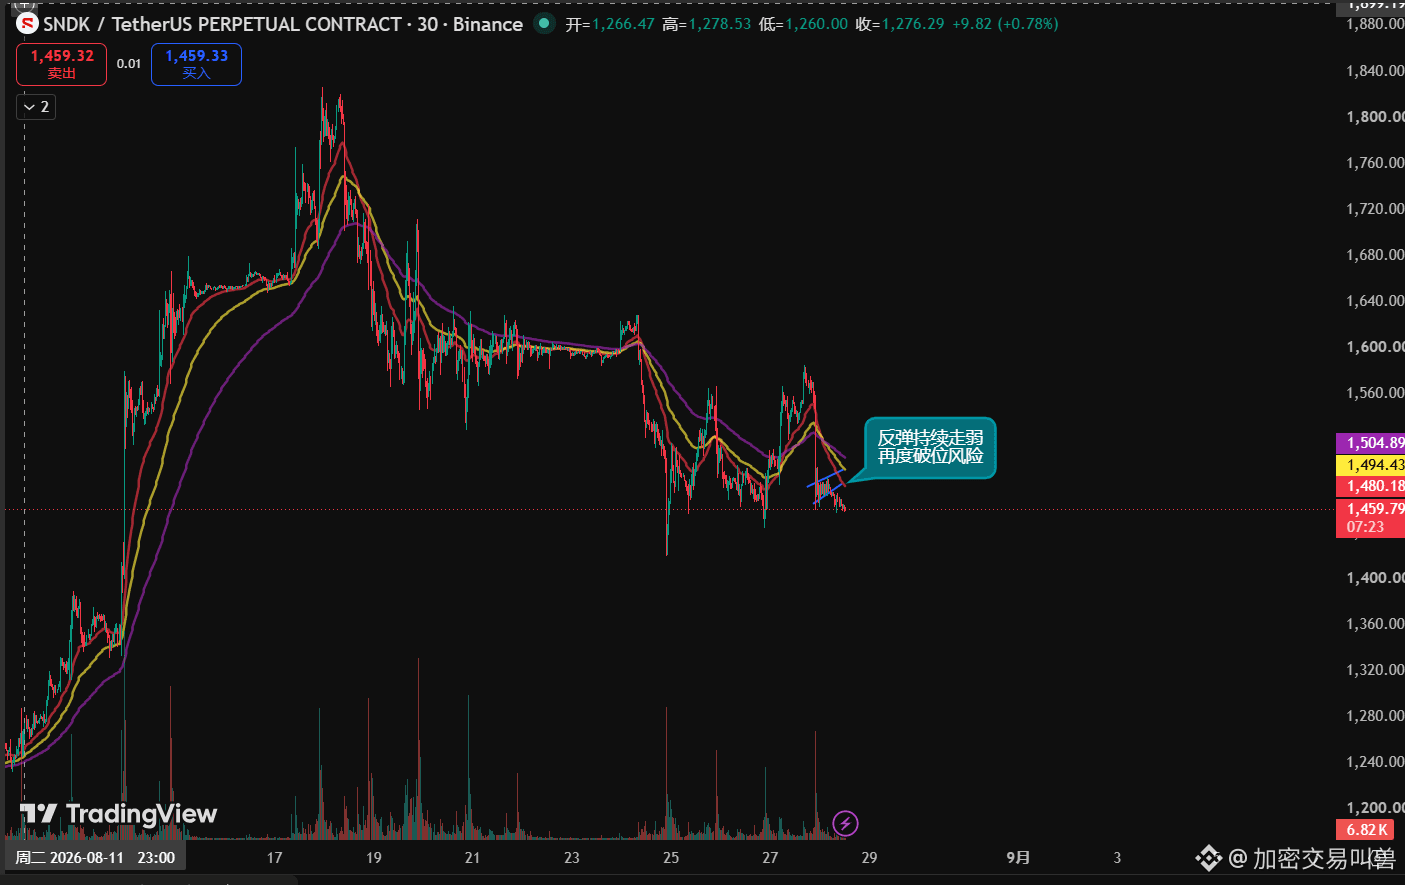
For three consecutive days, there has been a pattern of topping followed by pullbacks, and the pullback volume has continued to increase. After 1456 was tested continuously, the rebound volume has become smaller and smaller—so the break is almost a sure thing. For the short term, prioritize short positions, with a target around 1329.
XAU
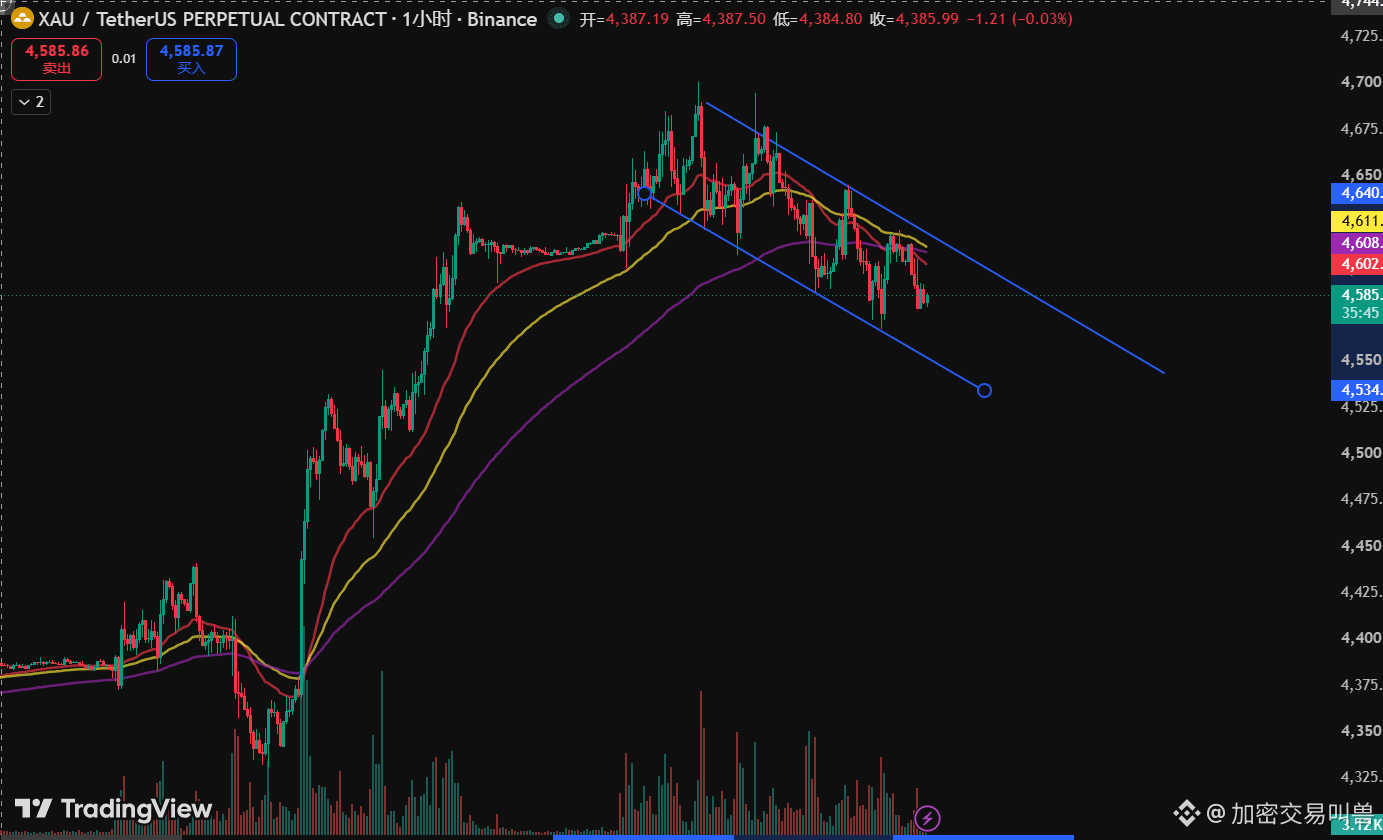
A bull flag formed at the highs, but it has still failed to break through the key resistance at 4622. This also aligns with the earlier judgment that XAU may see a short-term top around 4650. However, the market is currently divided, with many doji candles, making it easy to form “sting” wicks that shake out positions. It is recommended to take a short-term wait-and-see approach for this instrument. Only consider trend trades after a break above 4620 or after a drop below 4561. Currently, the amplitude is relatively small, so there is little trading value.
Late yesterday evening, two consecutive pullbacks to the 5-minute EMA30 were taken long, and both produced relatively large profits. However, it is clearly visible that when the second push reached a high point, price quickly dropped afterward. The same pattern also occurred around midnight. This resulted in an increased-volume long upper shadow candle on the 1-hour chart. The market is gradually shifting from strong bullish momentum to a weaker-bullish stance, and on smaller timeframes it is starting to gradually turn bearish. On the 1-hour timeframe, the bullish alignment trend is still intact and price has not broken below the EMA30. But today during the day, if it cannot reclaim 80600 and then again falls below the previous day’s 79000 pullback low, a double top will likely be confirmed successfully, and the trend may return below 78000.
Regarding execution, it is recommended to reduce position size to about half of the usual amount to avoid the risk of a “stop-hit” spike followed by a quick pullback. Only consider left-side entries, and wait to enter after price stands above 80600. Stay on the sidelines for shorts.
$ETH
At midnight, BTC did not follow through to break the recent highs near 2560. Price has now returned to the level from yesterday’s upward move. Currently, the 1-hour chart shows a triangular convergence, waiting for a directional breakout. Be patient and wait for a long setup only after the level at 2540 breaks and an effective retest occurs.
$SNDK
For three consecutive days, there has been a pattern of topping followed by pullbacks, and the pullback volume has continued to increase. After 1456 was tested continuously, the rebound volume has become smaller and smaller—so the break is almost a sure thing. For the short term, prioritize short positions, with a target around 1329.
XAU
A bull flag formed at the highs, but it has still failed to break through the key resistance at 4622. This also aligns with the earlier judgment that XAU may see a short-term top around 4650. However, the market is currently divided, with many doji candles, making it easy to form “sting” wicks that shake out positions. It is recommended to take a short-term wait-and-see approach for this instrument. Only consider trend trades after a break above 4620 or after a drop below 4561. Currently, the amplitude is relatively small, so there is little trading value.