
CryptoZeno
5.7k Posts

CryptoZeno
Verified Creator on #BinanceSquare #CoinMarketCap and #CryptoQuant | On Chain Research and Market Insights with Smart Trading Signals

NES Holder
High-Frequency Trader
5.4 Years
31 Following
8.4K+ Followers
33.7K+ Liked
Posts
All
Quotes
Videos
PINNED
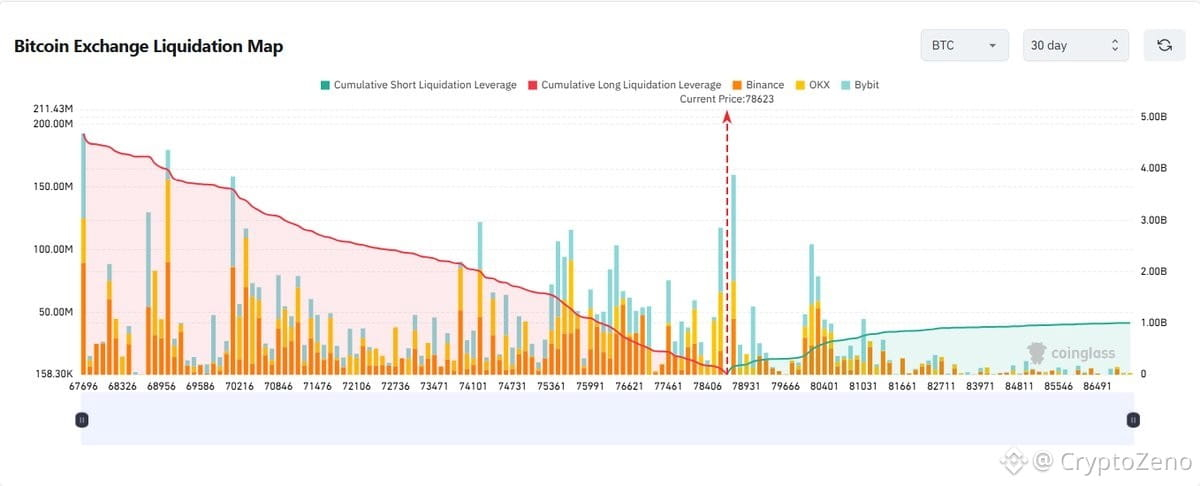
$BTC reached $80,000 in a massive short liquidation event.
Billions of reasons why price could retrace to $69,000.
Daily chart currently remains ultra bullish, weekly is bullish, but pullbacks are healthy.
Billions of reasons why price could retrace to $69,000.
Daily chart currently remains ultra bullish, weekly is bullish, but pullbacks are healthy.
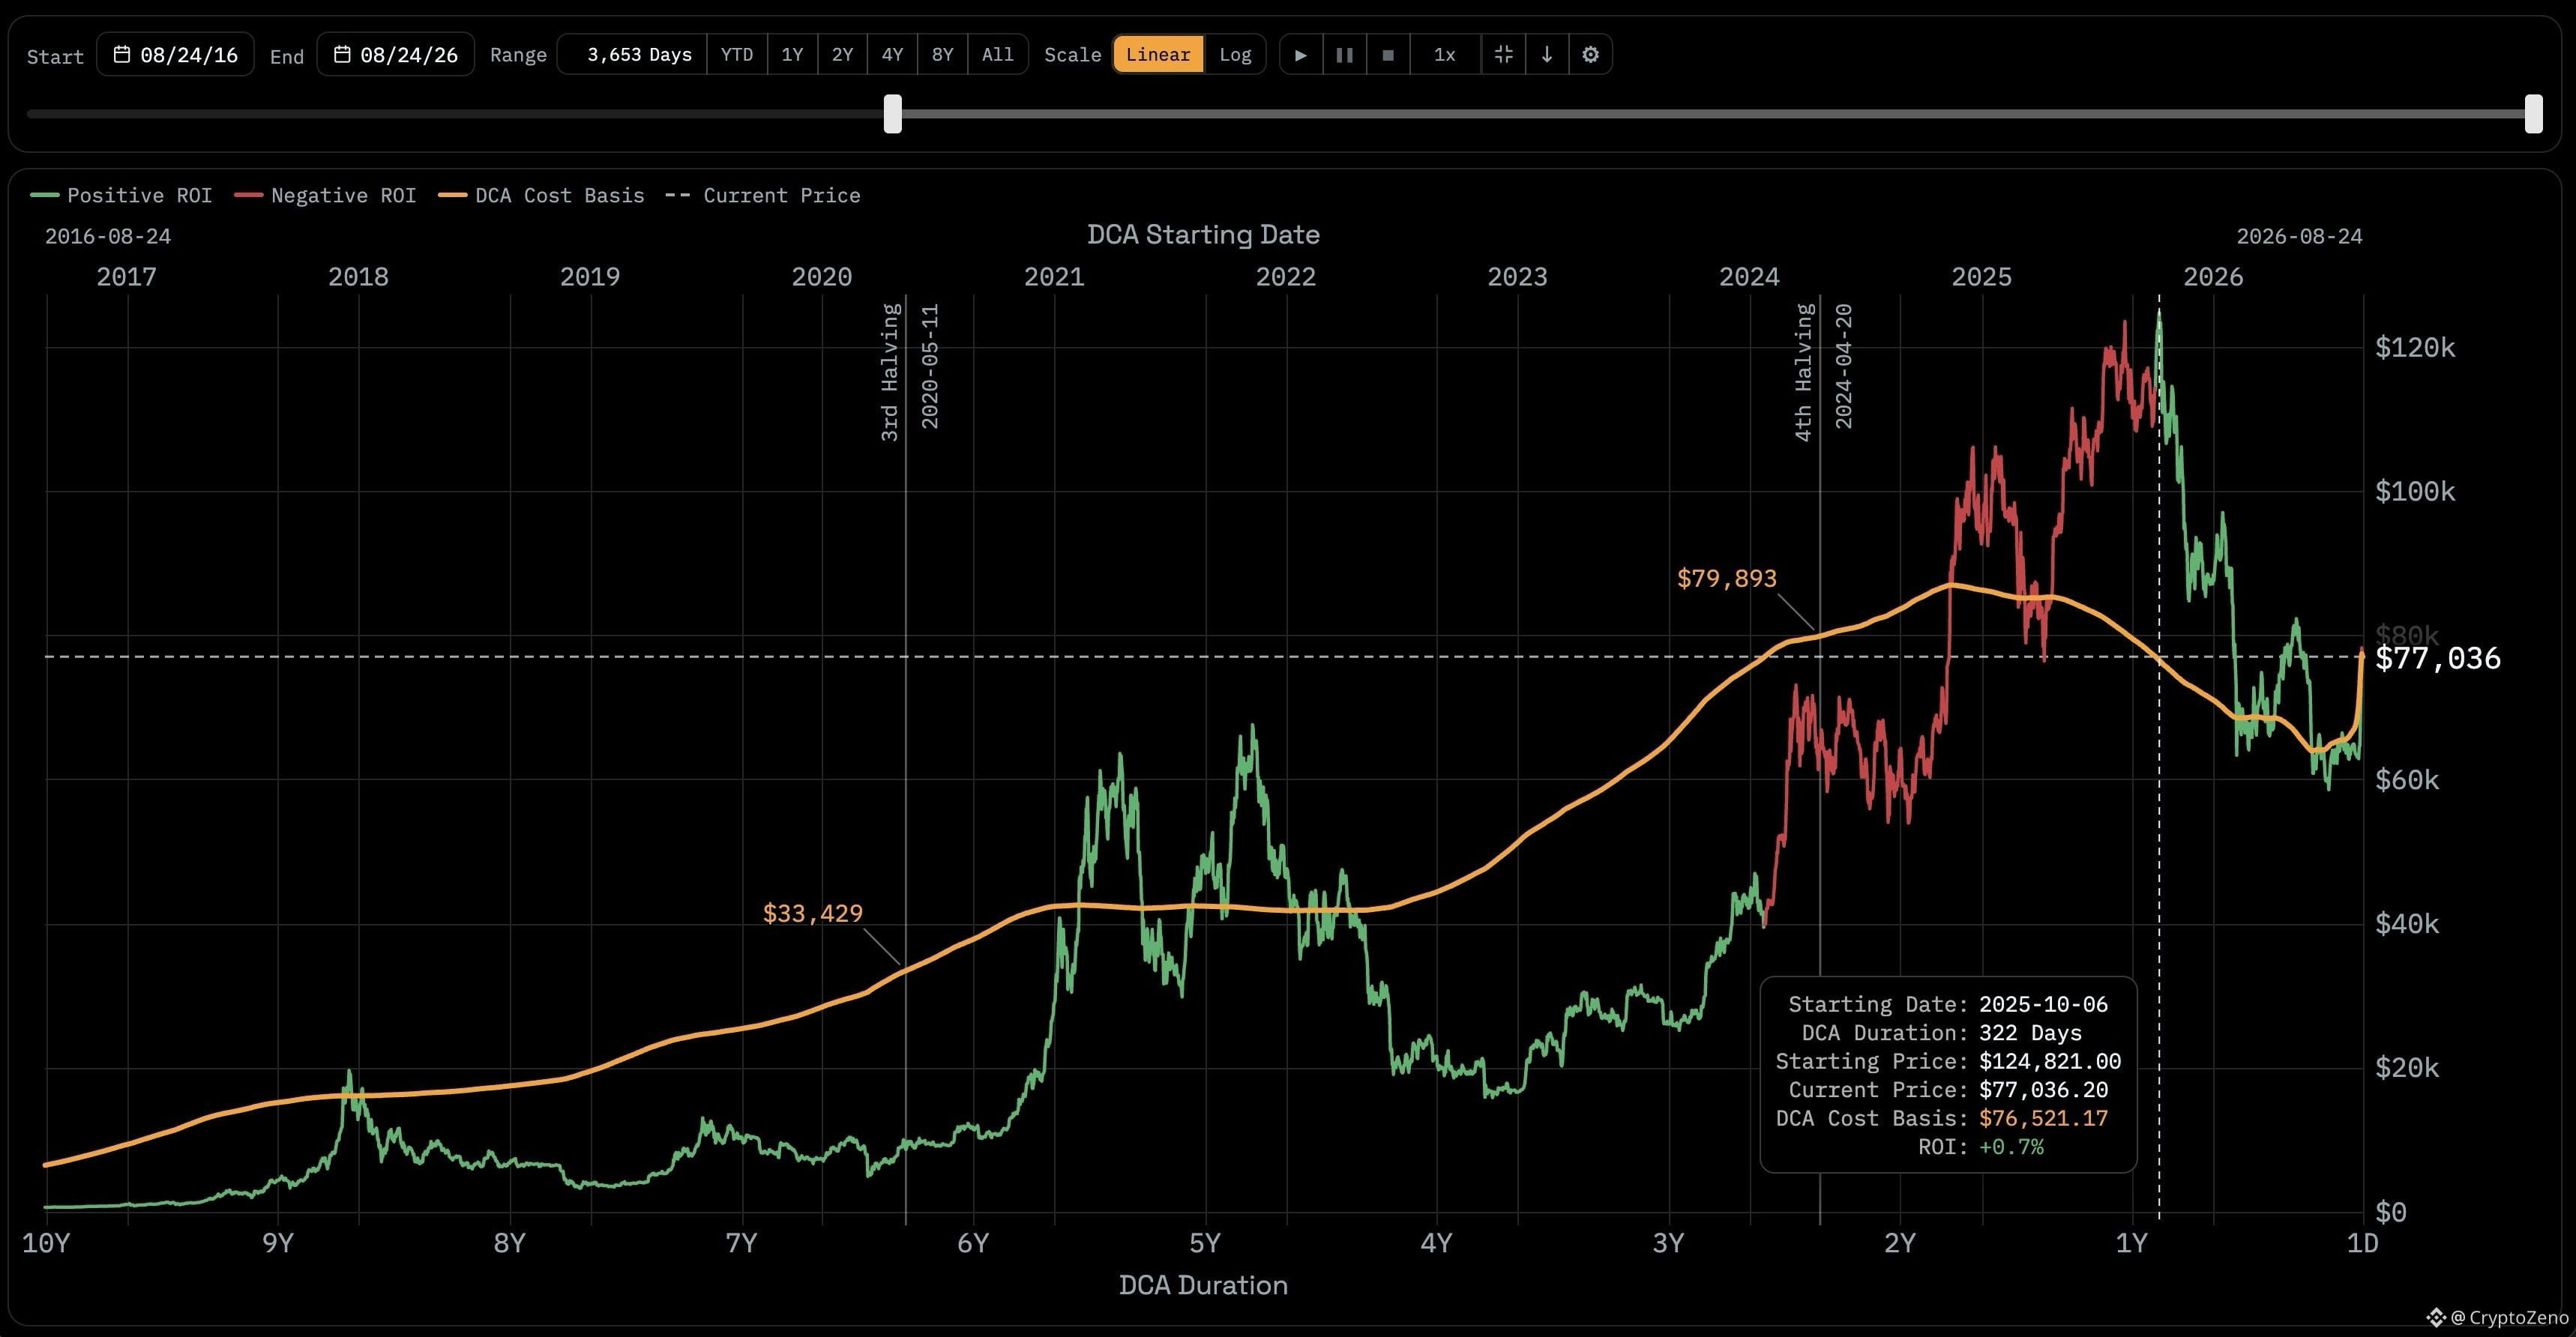
Those who started DCA'ing at the all time high are now in profit.
The power of dollar cost averaging.
The power of dollar cost averaging.
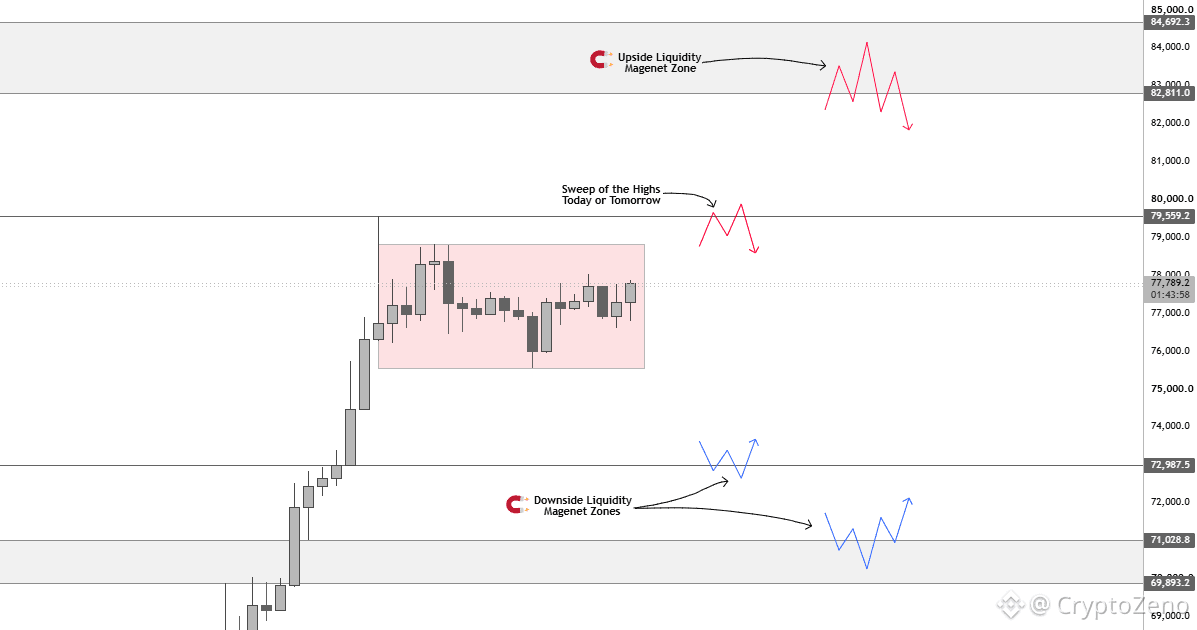
$BTC The new weekly candle just opened after we had a strong 26% impulsive pump last week. Usually, what follows these kinds of impulses is a slow, boring market as liquidity rebalances.
That's exactly what we're seeing inside this Red Box. PA is extremely slow at the moment, but we have liquidity building up on both sides.
Towards the upside, we have the weekend liquidity above the current high around the 79.5k region. A sweep of this high today or tomorrow would likely confirm the local top if it's not already in.
However, if we continue pushing through that weekend liquidity, the next POI is going to be the 82.6k-82.8k region, where we currently have the HTF Liquidity Magnet Zone.
If we do get a move into these upper levels, I will look to trigger into a Short position targeting the 72.9k region, where we have an untapped Daily imbalance zone.
In case we push through that Daily imbalance zone, the next POI for a bounce will be the 71k-69k region. However, a pullback into this zone is somewhat unlikely, as we mostly see flat/shallow retracements after a strong impulsive move.
These are pretty much the areas I'm currently interested in. I don't see many worthy setups forming on the LTF as of now.
For now, It's best to let the market tap into the HTF Key Zones first before triggering into any new positions.
That's exactly what we're seeing inside this Red Box. PA is extremely slow at the moment, but we have liquidity building up on both sides.
Towards the upside, we have the weekend liquidity above the current high around the 79.5k region. A sweep of this high today or tomorrow would likely confirm the local top if it's not already in.
However, if we continue pushing through that weekend liquidity, the next POI is going to be the 82.6k-82.8k region, where we currently have the HTF Liquidity Magnet Zone.
If we do get a move into these upper levels, I will look to trigger into a Short position targeting the 72.9k region, where we have an untapped Daily imbalance zone.
In case we push through that Daily imbalance zone, the next POI for a bounce will be the 71k-69k region. However, a pullback into this zone is somewhat unlikely, as we mostly see flat/shallow retracements after a strong impulsive move.
These are pretty much the areas I'm currently interested in. I don't see many worthy setups forming on the LTF as of now.
For now, It's best to let the market tap into the HTF Key Zones first before triggering into any new positions.
Bitcoin is going to $100k+ in 3 months?
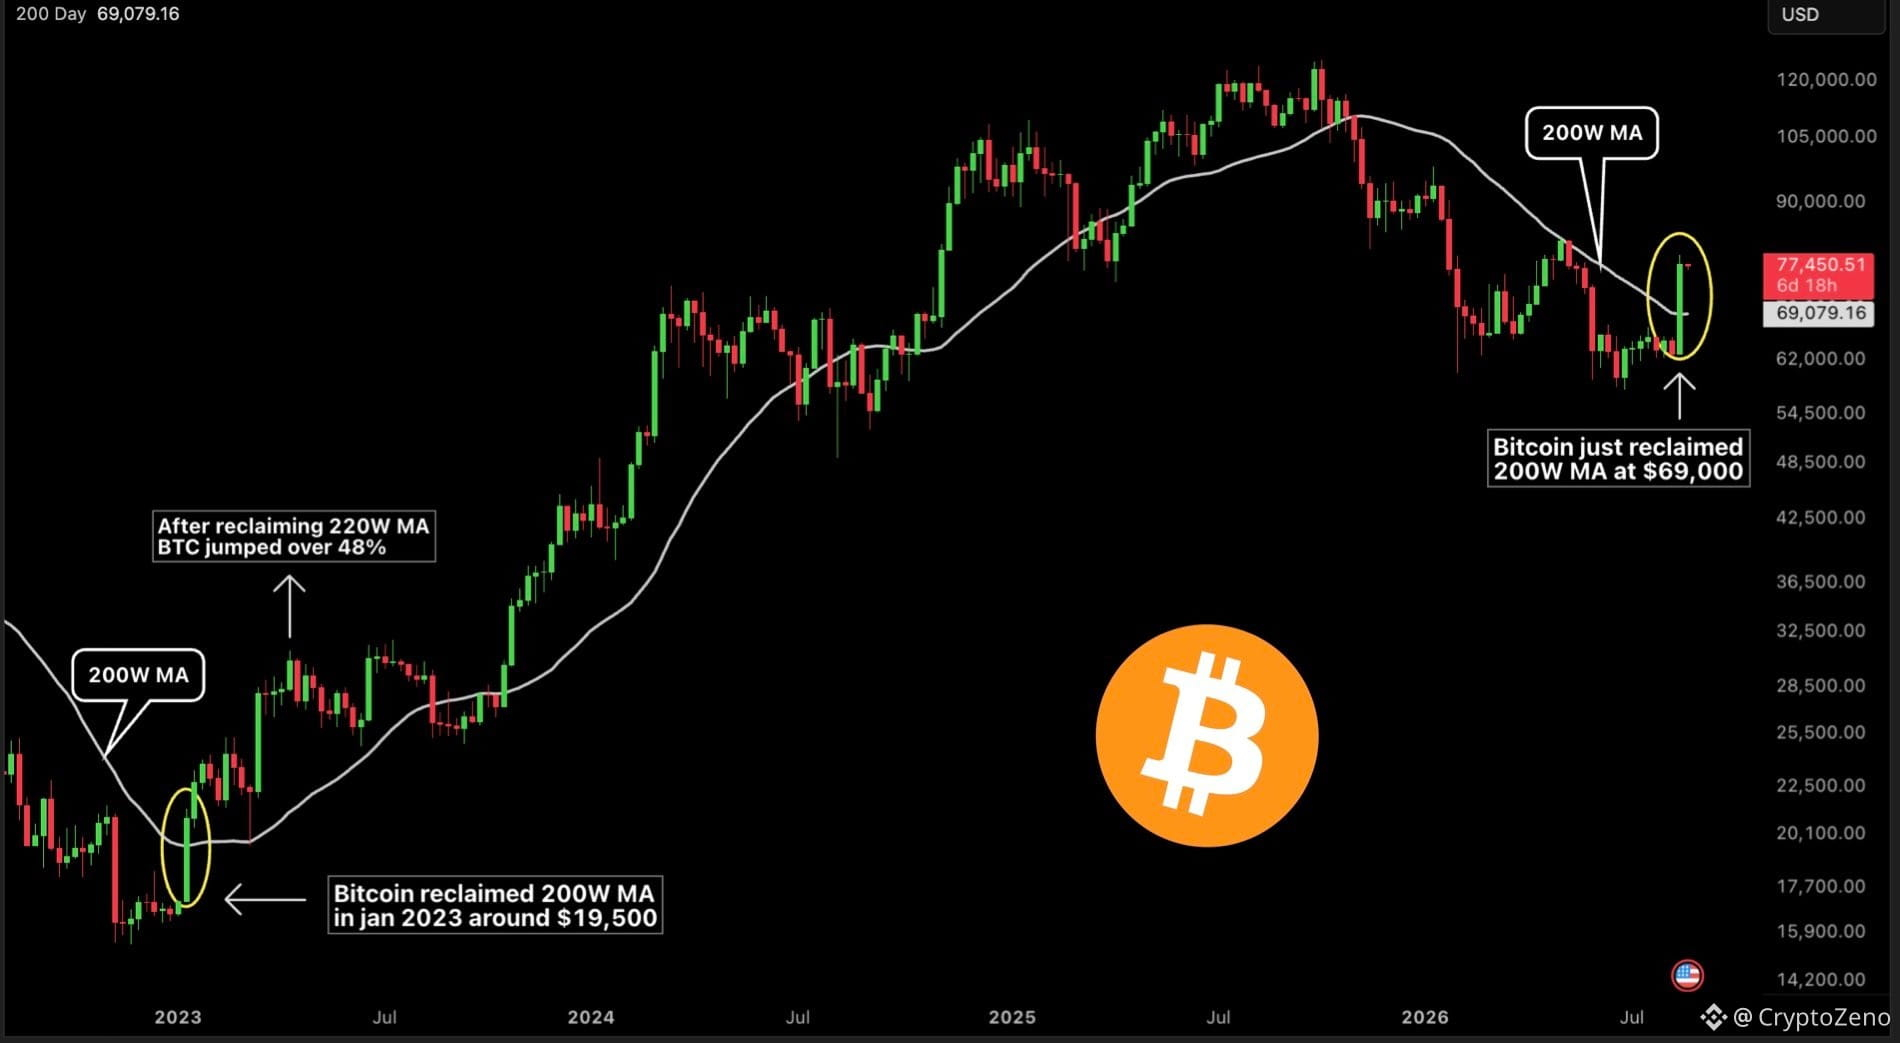
BTC just reclaimed the 200W MA this week, the most important level for a trend reversal.
When BTC reclaimed 200W MA last bear market, it pumped +48% in the next 90 days and started a new bull run.
If history repeats, the bottom is in and the biggest bull run starts now.
BTC just reclaimed the 200W MA this week, the most important level for a trend reversal.
When BTC reclaimed 200W MA last bear market, it pumped +48% in the next 90 days and started a new bull run.
If history repeats, the bottom is in and the biggest bull run starts now.
CZ posted about Giggle Academy donations again today, does it move $GIGGLE
Giggle Fund's own treasury wallet sits first on the donation list with 11,326 BNB (roughly $7.9M). The address CZ mentioned sits second with 1,435 BNB (roughly $1M), raised over two weeks.
On the derivatives side there's a strong split. L/S at 0.71, the crowd is short. Top trader position ratio at 3.31, big accounts are clearly long. One of the widest splits we've looked at.
But taker buy/sell is 0.82, the aggressive side is net selling. Even with price up, whoever's hitting the market is selling into it.
Futures at 10.8x spot, spot volume is just $8.75M, not even a quarter of market cap. Leverage is carrying most of this move.
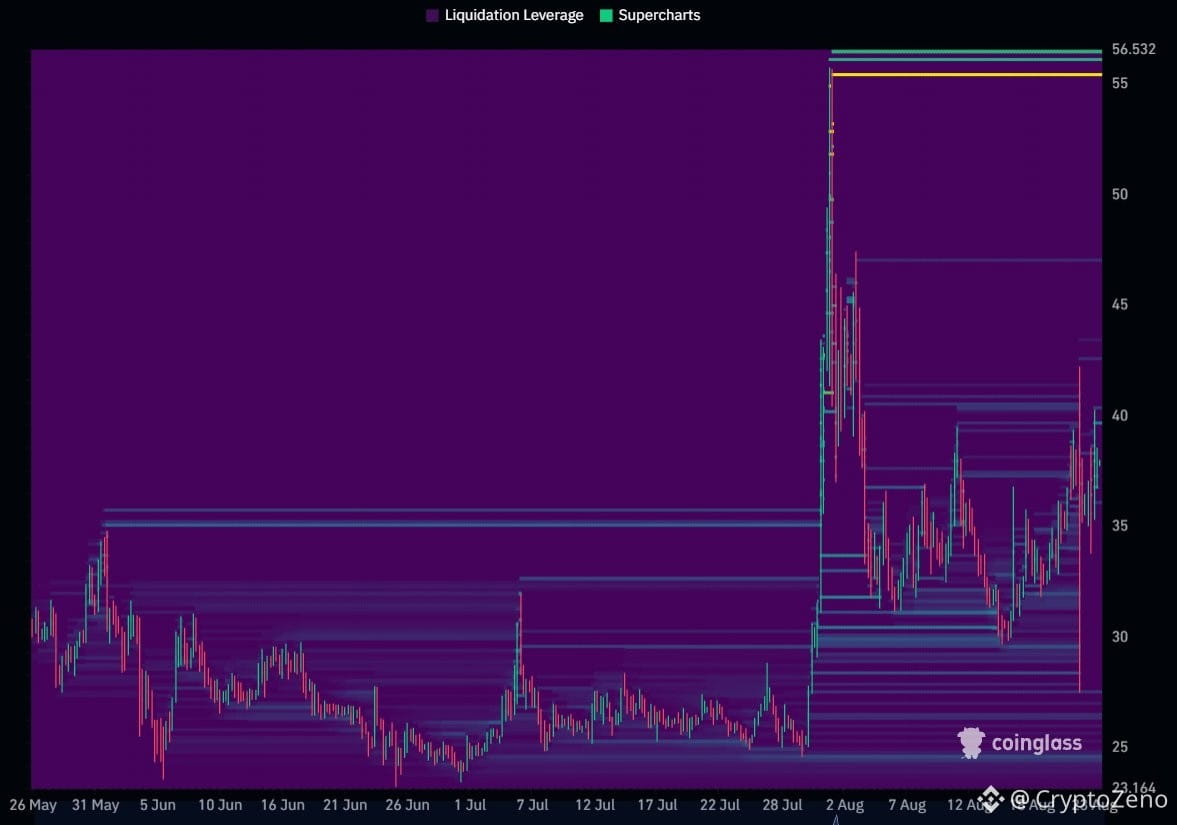
The liquidation map shows two clear levels
There was a near-vertical spike from 25 to 56 on August 2. Above, a strong cluster still sits at the 55-56 range. Below, a base has formed around 35, current price (37.9) sits right above that band.
CZ bringing it back into the spotlight keeps community attention alive, and the split is strong. But spot support is still thin, this isn't yet a structure that can carry itself to the 55-56 range on its own.
Giggle Fund's own treasury wallet sits first on the donation list with 11,326 BNB (roughly $7.9M). The address CZ mentioned sits second with 1,435 BNB (roughly $1M), raised over two weeks.
On the derivatives side there's a strong split. L/S at 0.71, the crowd is short. Top trader position ratio at 3.31, big accounts are clearly long. One of the widest splits we've looked at.
But taker buy/sell is 0.82, the aggressive side is net selling. Even with price up, whoever's hitting the market is selling into it.
Futures at 10.8x spot, spot volume is just $8.75M, not even a quarter of market cap. Leverage is carrying most of this move.
The liquidation map shows two clear levels
There was a near-vertical spike from 25 to 56 on August 2. Above, a strong cluster still sits at the 55-56 range. Below, a base has formed around 35, current price (37.9) sits right above that band.
CZ bringing it back into the spotlight keeps community attention alive, and the split is strong. But spot support is still thin, this isn't yet a structure that can carry itself to the 55-56 range on its own.
Verified
A detail in Dusk that I keep finding more interesting is the two different paths developers can take.
A team building directly on the native layer can use Rust, WASM, DuskVM and native ZK functionality. Another team can come through DuskEVM with Solidity, Foundry, Hardhat, viem or ethers, while still using DUSK for gas and DuskDS for settlement and data availability.
That separation makes sense to me because regulated finance probably does not need every application built in exactly the same way. Some teams may want maximum control over privacy and execution, while others would rather keep the tooling they already know. Dusk seems to be trying to accommodate both instead of forcing developers into one route.
The interesting part is that DuskEVM is still on testnet while the native Dusk layer is already live. I actually like seeing that distinction clearly because it makes the roadmap easier to judge. The EVM compatibility story is still something that has to prove itself through real applications, not just documentation.
I am curious what the developer ecosystem will look like once both paths mature. Will builders mostly choose the familiar EVM route, or will the native Dusk stack become the more interesting option for applications where privacy and regulated assets really matter?
$DUSK @Dusk #dusk
A team building directly on the native layer can use Rust, WASM, DuskVM and native ZK functionality. Another team can come through DuskEVM with Solidity, Foundry, Hardhat, viem or ethers, while still using DUSK for gas and DuskDS for settlement and data availability.
That separation makes sense to me because regulated finance probably does not need every application built in exactly the same way. Some teams may want maximum control over privacy and execution, while others would rather keep the tooling they already know. Dusk seems to be trying to accommodate both instead of forcing developers into one route.
The interesting part is that DuskEVM is still on testnet while the native Dusk layer is already live. I actually like seeing that distinction clearly because it makes the roadmap easier to judge. The EVM compatibility story is still something that has to prove itself through real applications, not just documentation.
I am curious what the developer ecosystem will look like once both paths mature. Will builders mostly choose the familiar EVM route, or will the native Dusk stack become the more interesting option for applications where privacy and regulated assets really matter?
$DUSK @Dusk #dusk
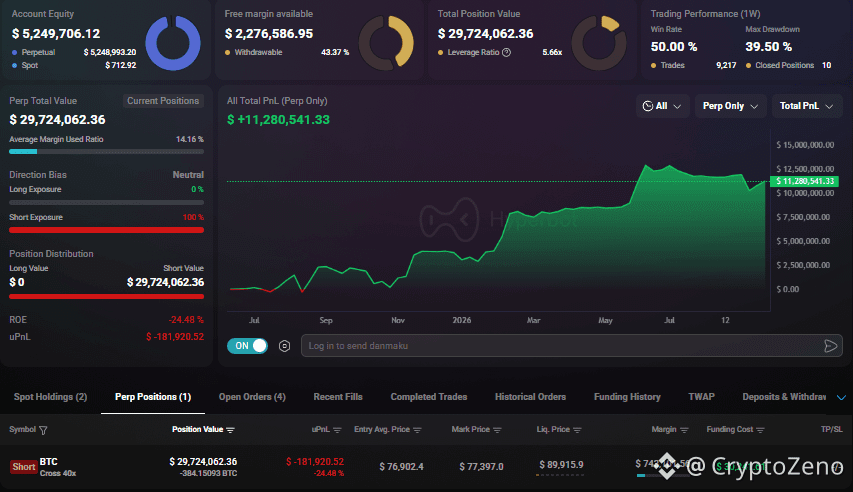
This trader opened a 40x $BTC short worth $30 million.
His total PNL over the past year: +$11.3 million.
Does he know something?
His total PNL over the past year: +$11.3 million.
Does he know something?
$TUT the wreckage of the August spike, and the liquidation map points down.
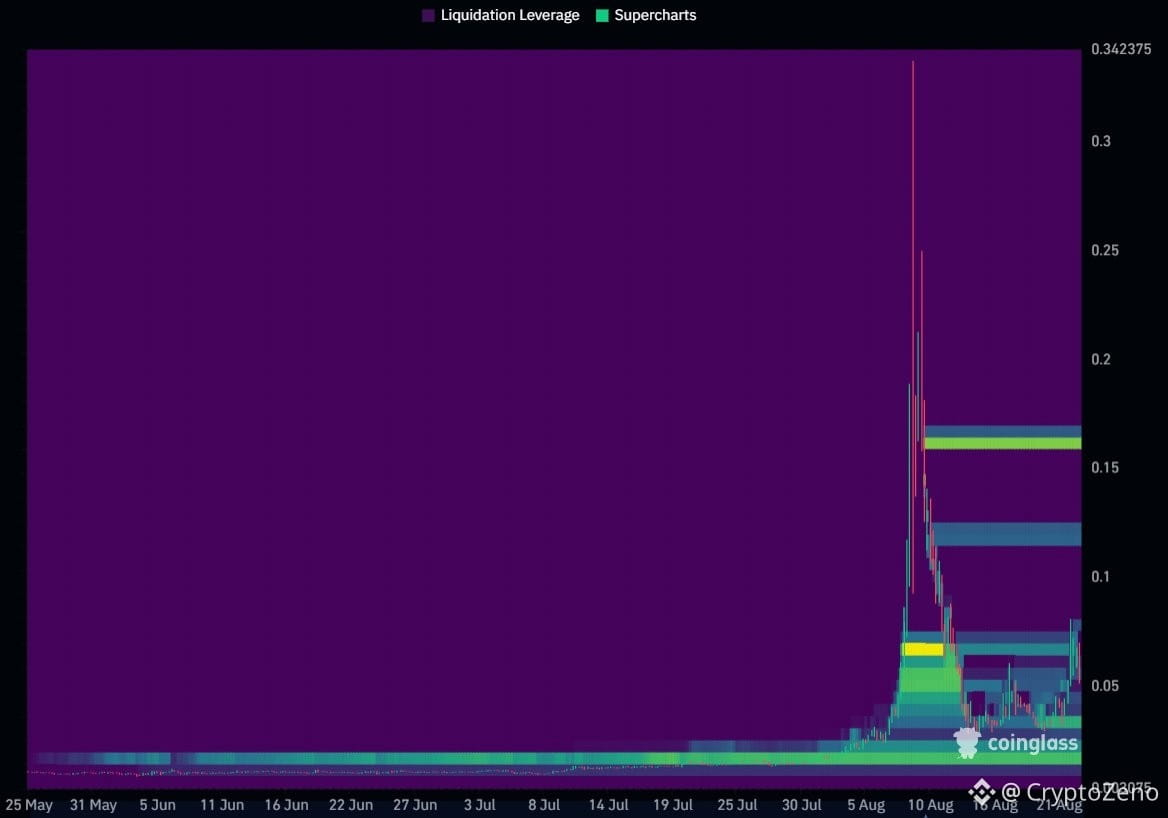
Price made a near-vertical spike around August 1, from 0.003 to 0.34. Then it collapsed just as fast. It's sitting at 0.0587 now, a small fraction of that peak.
Structure is still stretched
OI at 42.4% of mcap, high. Futures at 8.6x spot. Spot volume is solid ($114.89M), but futures has grown even faster. Taker at 0.97, the aggressive side leans slightly seller, even with price up 26%.
There's a split: L/S at 0.88, the crowd leans slightly short. Top trader positions at 1.59, big accounts are clearly long.
The liquidation map shows three levels
$1M sitting at 0.16. Just below the August peak, roughly 2.7x above current price. Too far out to be a near-term target.
$723K at 0.03. Below current price, the first point of contact on the way down, roughly 49% away.
$875K at 0.014. Lines up with the long flat base that held for months across June and July, a thick, well-established zone, roughly 76% below current price.
How I read it
The cluster above isn't an attractive target, it would take a 170% move to get there, not a realistic near-term scenario. The side that matters is below: 0.03 first, and if that breaks, the thick base at 0.014 comes into play.
Combined with the stretched derivatives picture (high OI, seller-leaning taker), those are the more relevant reference points in the near term.
What I'm watching
How price reacts on any approach to 0.03.
Whether it holds the 0.05-0.06 range, if it does, a new base is forming on top of this wreckage.
You can follow this data in real time in the private group. Pinned post for details.
Price made a near-vertical spike around August 1, from 0.003 to 0.34. Then it collapsed just as fast. It's sitting at 0.0587 now, a small fraction of that peak.
Structure is still stretched
OI at 42.4% of mcap, high. Futures at 8.6x spot. Spot volume is solid ($114.89M), but futures has grown even faster. Taker at 0.97, the aggressive side leans slightly seller, even with price up 26%.
There's a split: L/S at 0.88, the crowd leans slightly short. Top trader positions at 1.59, big accounts are clearly long.
The liquidation map shows three levels
$1M sitting at 0.16. Just below the August peak, roughly 2.7x above current price. Too far out to be a near-term target.
$723K at 0.03. Below current price, the first point of contact on the way down, roughly 49% away.
$875K at 0.014. Lines up with the long flat base that held for months across June and July, a thick, well-established zone, roughly 76% below current price.
How I read it
The cluster above isn't an attractive target, it would take a 170% move to get there, not a realistic near-term scenario. The side that matters is below: 0.03 first, and if that breaks, the thick base at 0.014 comes into play.
Combined with the stretched derivatives picture (high OI, seller-leaning taker), those are the more relevant reference points in the near term.
What I'm watching
How price reacts on any approach to 0.03.
Whether it holds the 0.05-0.06 range, if it does, a new base is forming on top of this wreckage.
You can follow this data in real time in the private group. Pinned post for details.
They’re already calling us “Lucky.”
I guess we’re going to be extremely lucky over the next 6 months, with $BTC trading just shy of $100k
I guess we’re going to be extremely lucky over the next 6 months, with $BTC trading just shy of $100k
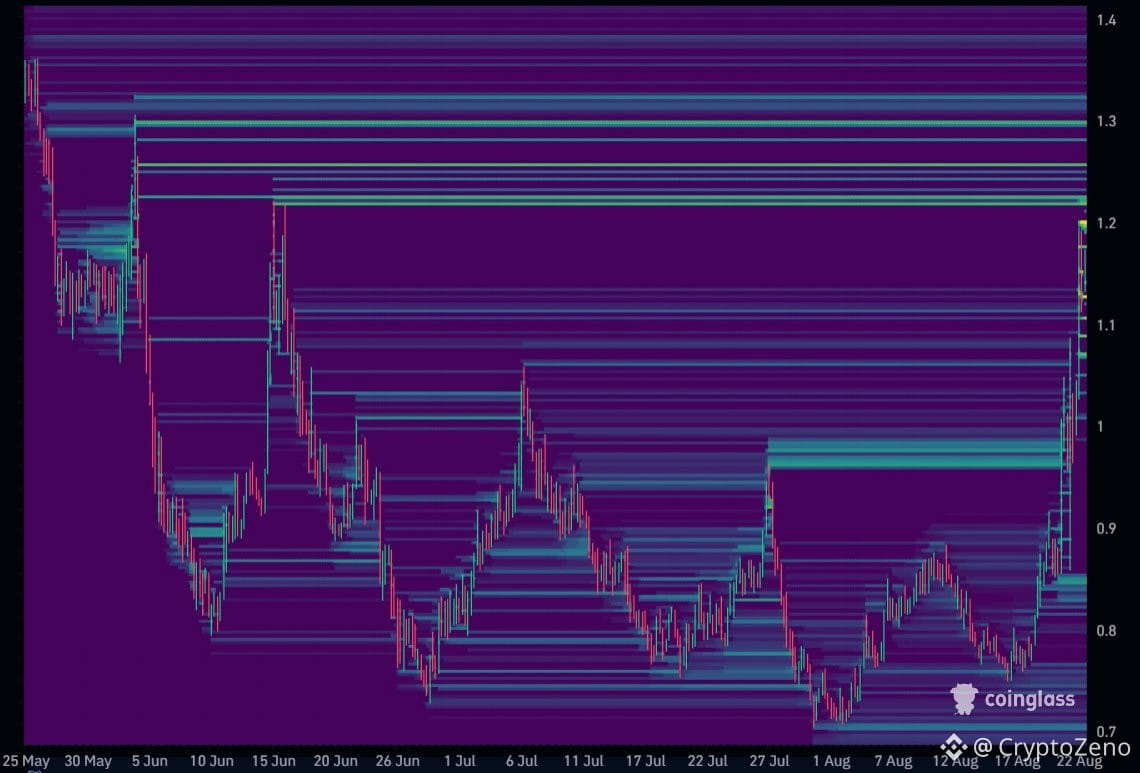
$ZRO update: touched the 1.2-1.3 cluster.
The first post said:
"Just above price, there is a band between 0.96 and 1.0. Above that, a much stronger cluster sits between 1.2 and 1.3."
Price reached 1.20 today, touching the lower edge of the thickest cluster on the map. It's trading at 1.1789 right now.
The split is still strong
Top trader positions at 3.16 against the crowd's 1.05. The gap is wide, big accounts are long by more than three times the crowd.
Structure is still clean
OI at 5.8% of mcap, futures at 6.7x spot. Three posts running at this level, this hasn't been a leverage-inflated move.
Taker at 1.08, buyers are still the aggressive side.
How I read it
Price made its first touch of 1.20, the lower edge of the thickest zone on the map. Structure hasn't broken (OI/mcap and futures/spot are unchanged), so what got it here wasn't leverage-driven.
The real test hasn't happened yet. The 1.2-1.3 band is wide, too early to call it broken or rejected off one touch.
What I'm watching
Whether there's a sustained close above 1.20.
How OI behaves at this level, if it keeps climbing, new positioning is coming in.
You can follow this data in real time in the private group. Pinned post for details.
The first post said:
"Just above price, there is a band between 0.96 and 1.0. Above that, a much stronger cluster sits between 1.2 and 1.3."
Price reached 1.20 today, touching the lower edge of the thickest cluster on the map. It's trading at 1.1789 right now.
The split is still strong
Top trader positions at 3.16 against the crowd's 1.05. The gap is wide, big accounts are long by more than three times the crowd.
Structure is still clean
OI at 5.8% of mcap, futures at 6.7x spot. Three posts running at this level, this hasn't been a leverage-inflated move.
Taker at 1.08, buyers are still the aggressive side.
How I read it
Price made its first touch of 1.20, the lower edge of the thickest zone on the map. Structure hasn't broken (OI/mcap and futures/spot are unchanged), so what got it here wasn't leverage-driven.
The real test hasn't happened yet. The 1.2-1.3 band is wide, too early to call it broken or rejected off one touch.
What I'm watching
Whether there's a sustained close above 1.20.
How OI behaves at this level, if it keeps climbing, new positioning is coming in.
You can follow this data in real time in the private group. Pinned post for details.
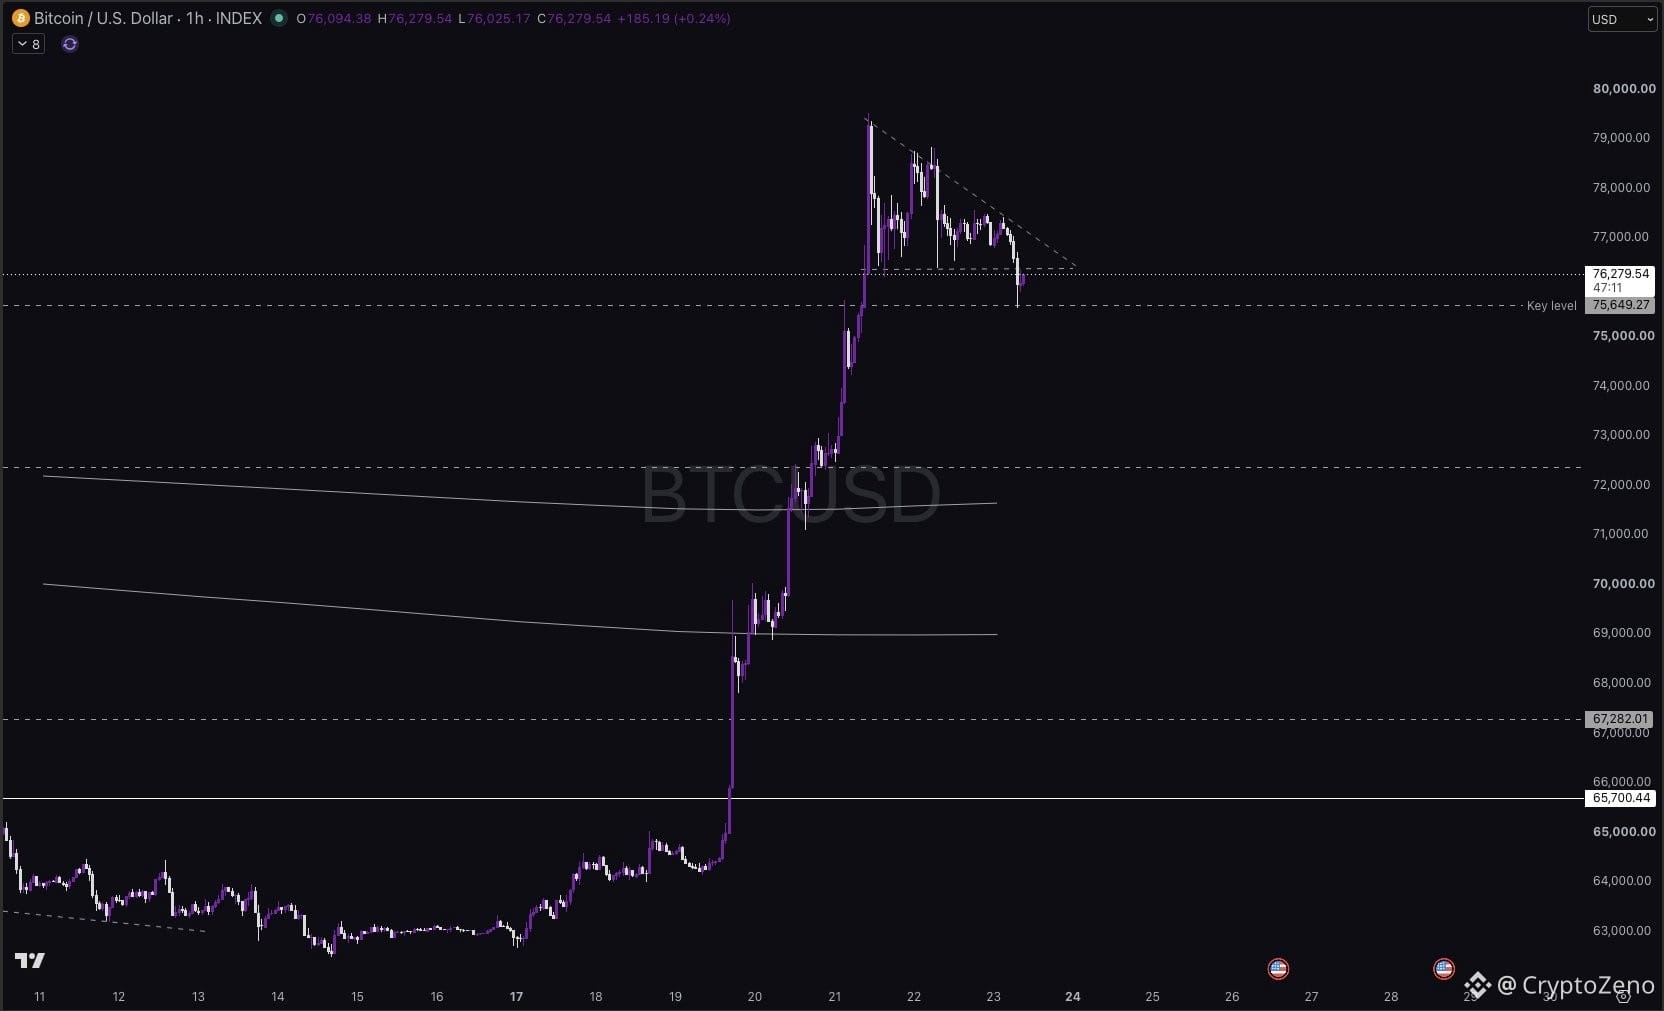
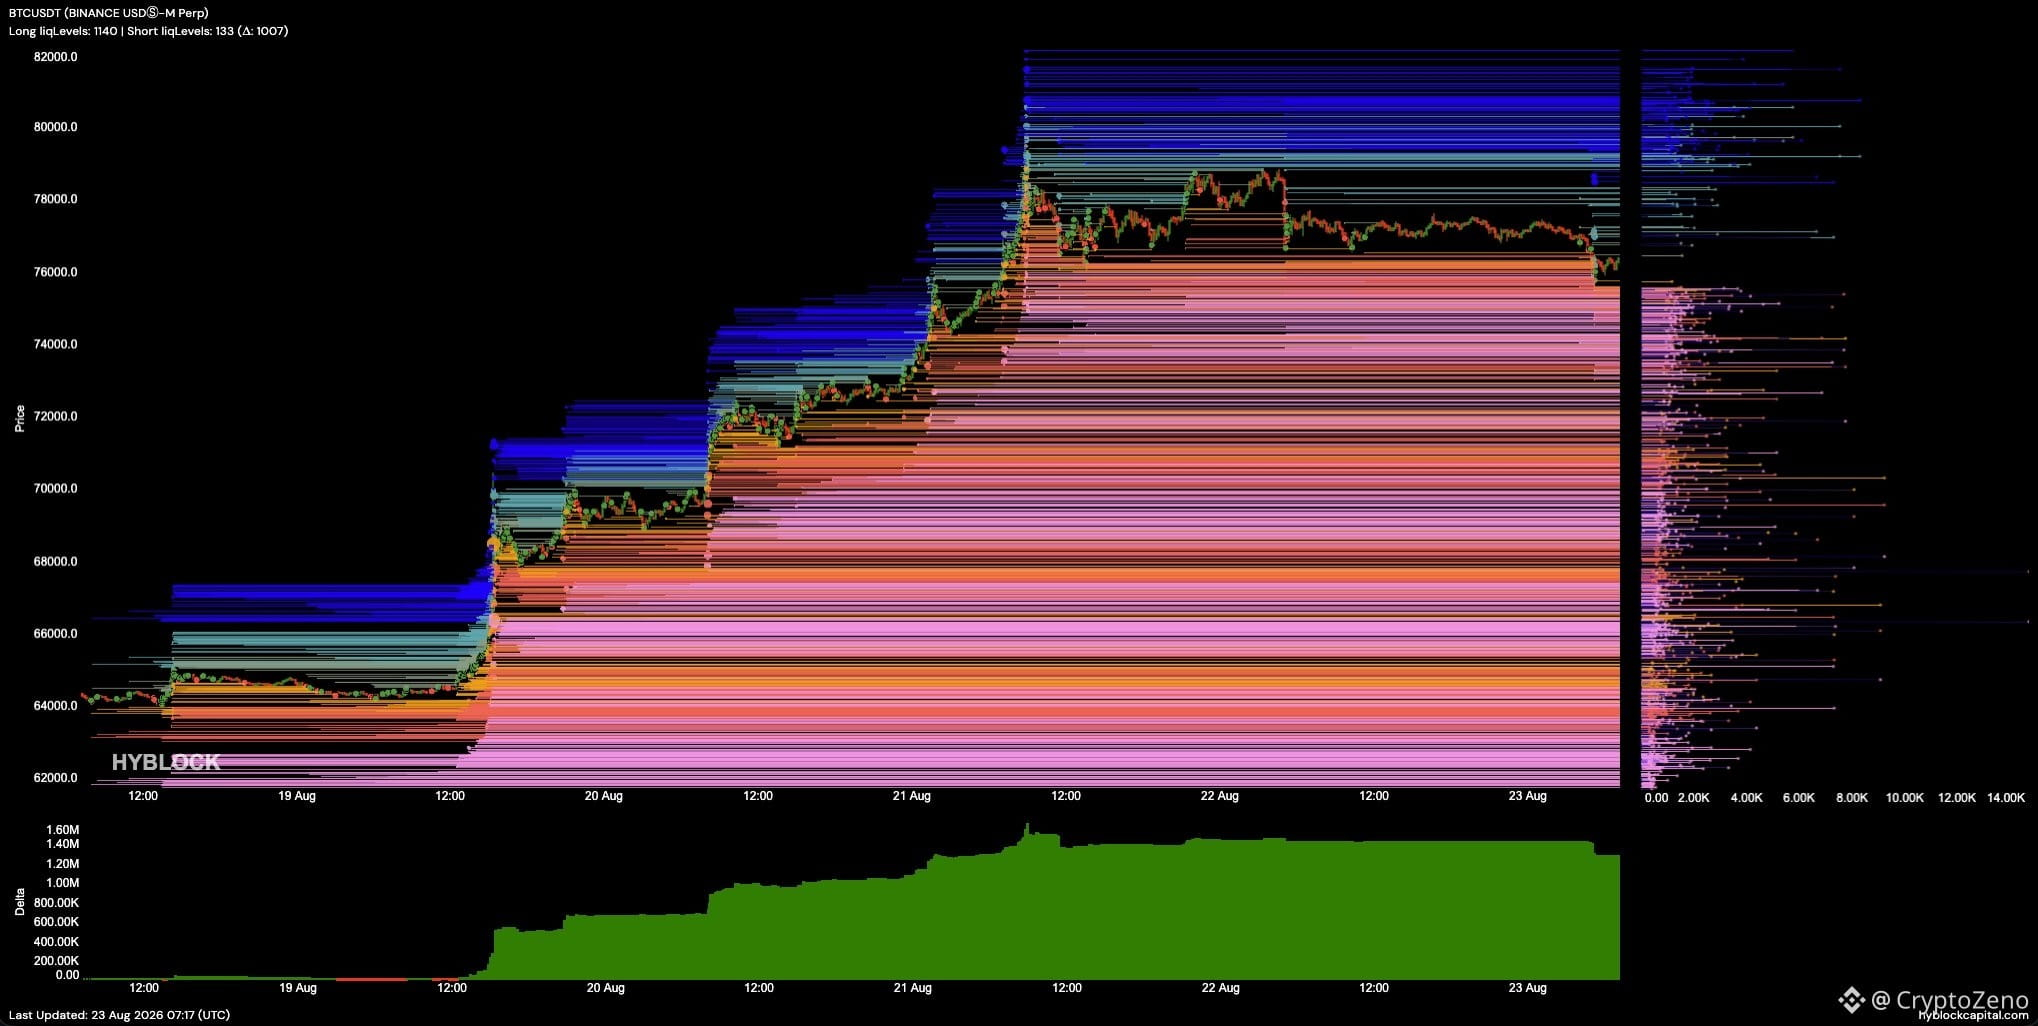
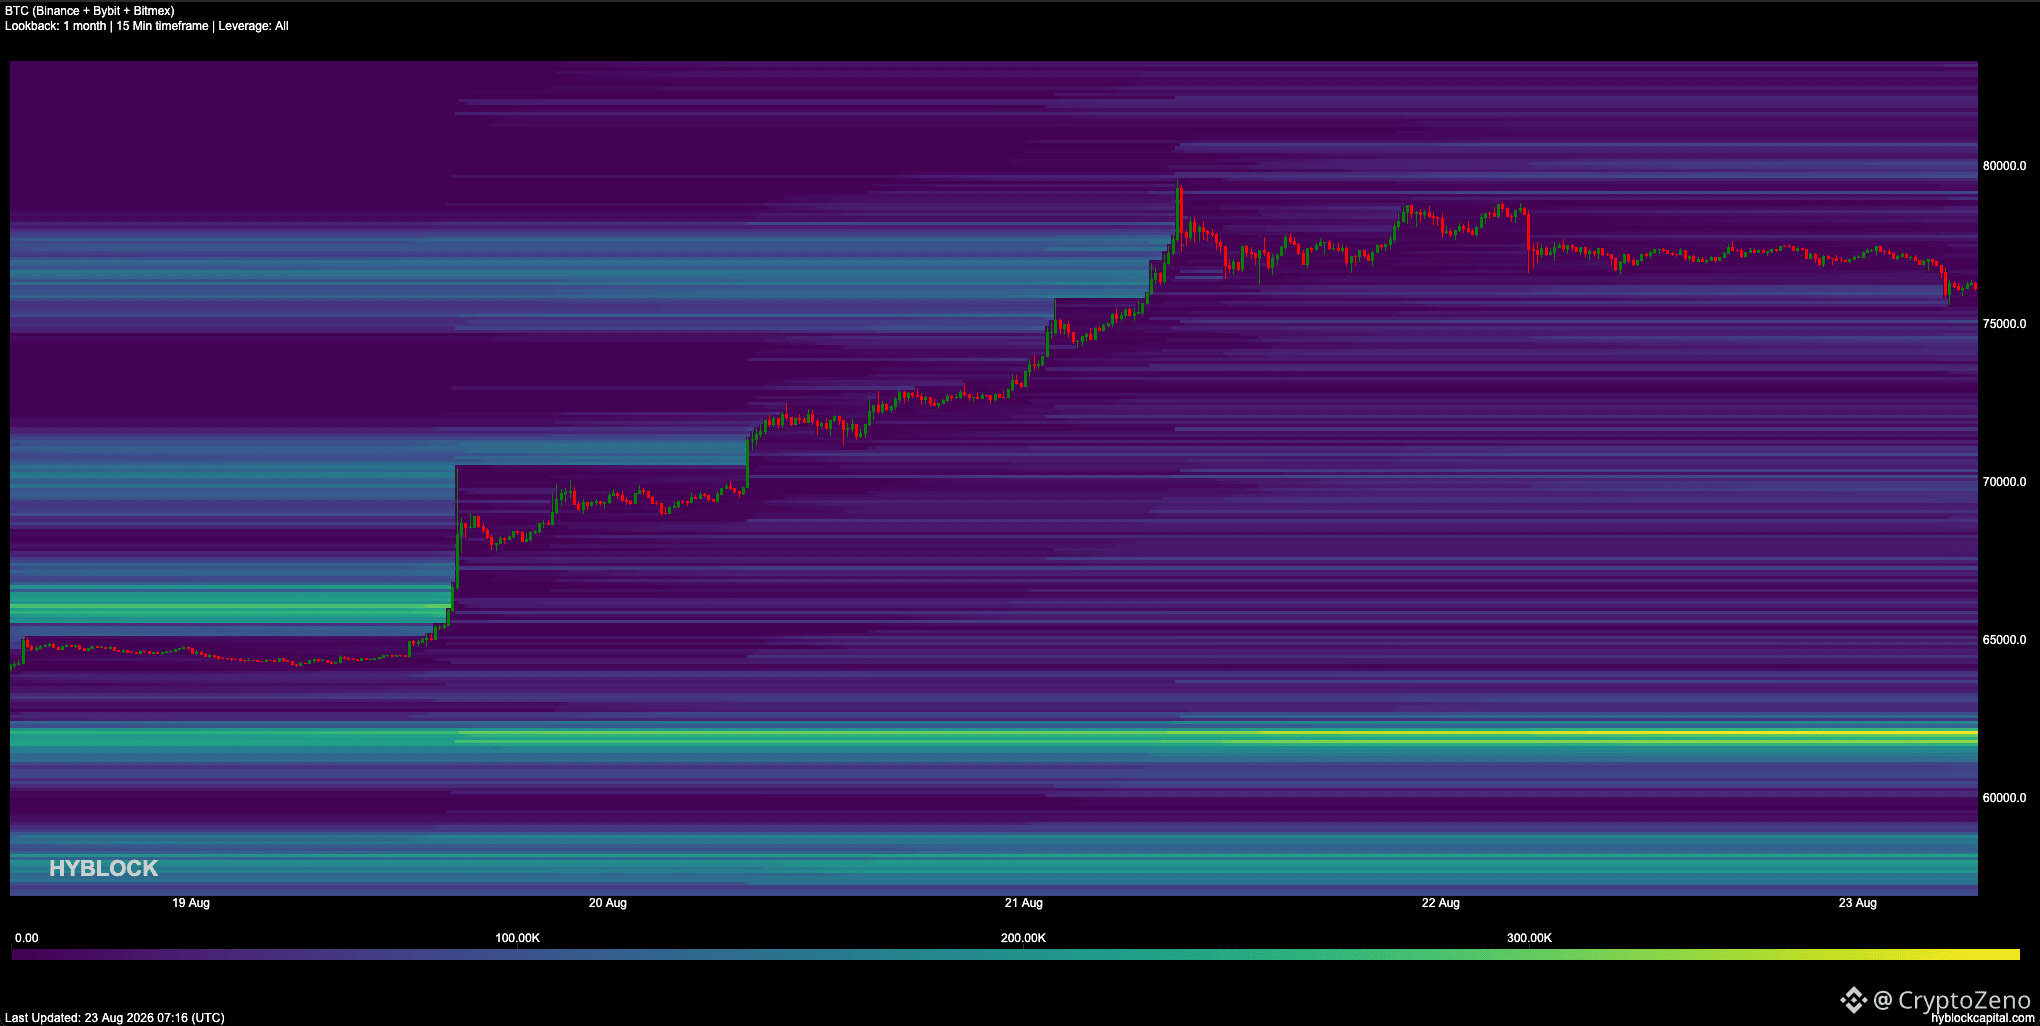
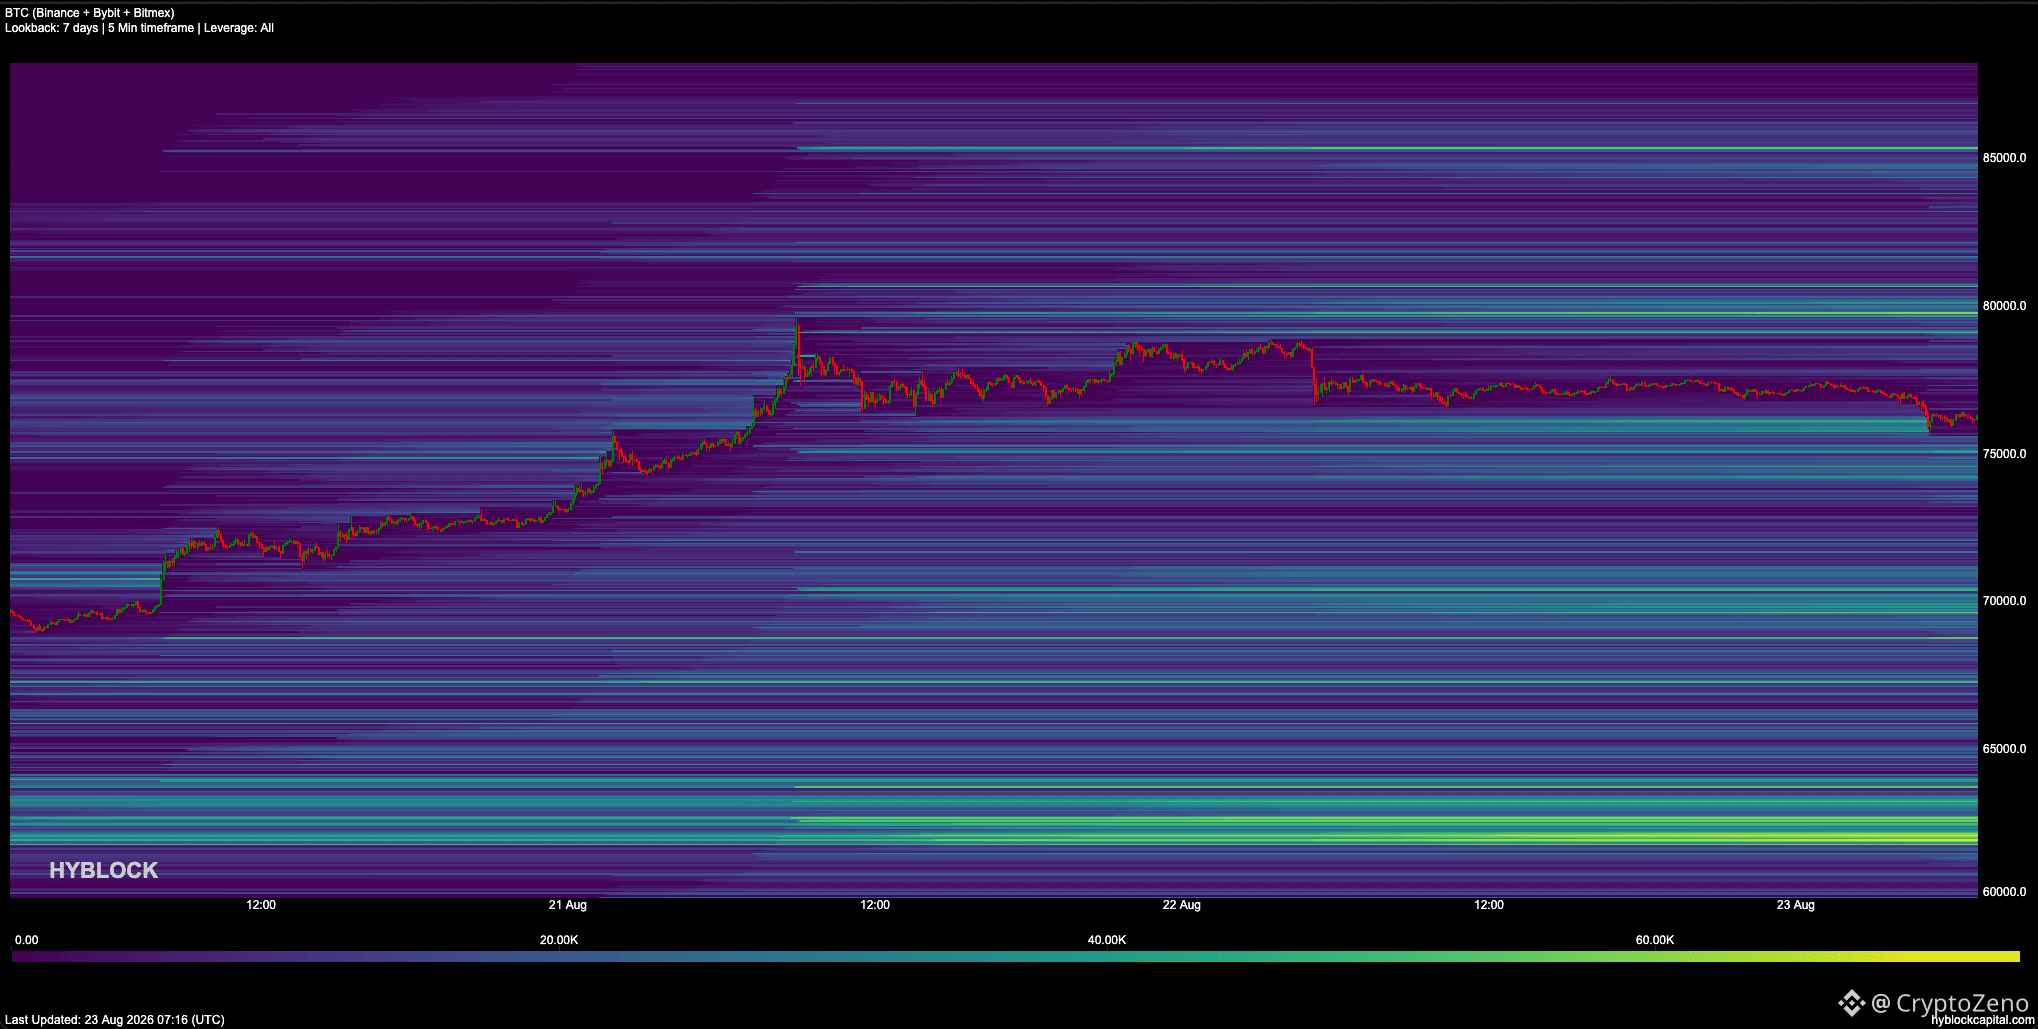
$BTC Update & Hyblock Heatmaps
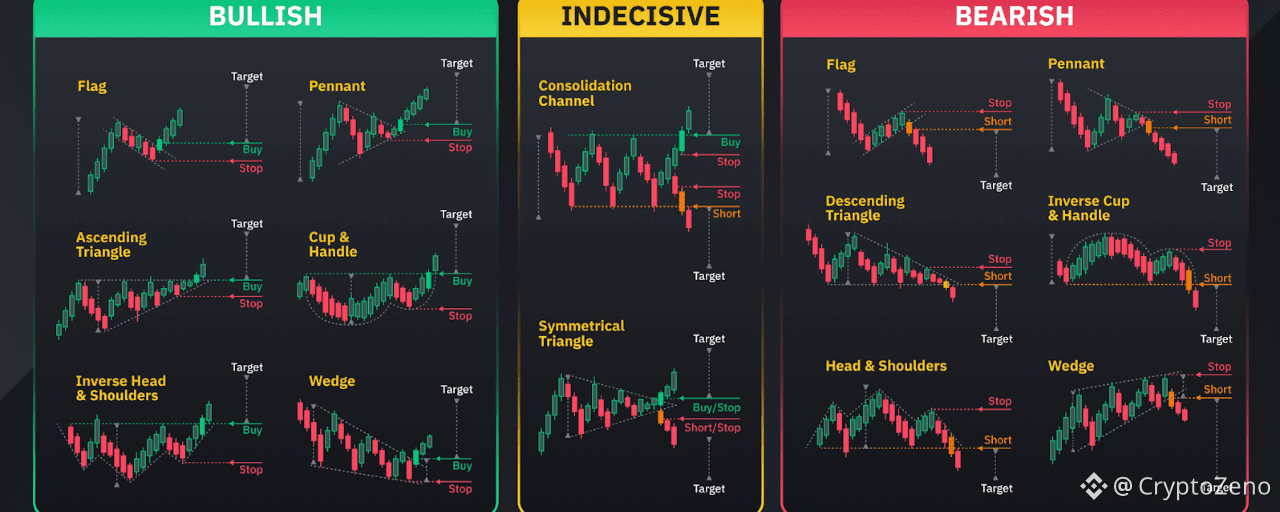
Bitcoin taking a small breather during weekend, would interpret this as pennant or bull flag in the making so far.
Usually, continuation is simple and next target is 82k area, but after a move like this, be careful and expect a nasty wick down to low 70s anytime. We should get a retest of the moving averages at some point.
All eyes on the weekly close today, need to close above the MAs and ideally above the 75.6k key level.
Enjoy your Sunday and see you soon!
Bitcoin taking a small breather during weekend, would interpret this as pennant or bull flag in the making so far.
Usually, continuation is simple and next target is 82k area, but after a move like this, be careful and expect a nasty wick down to low 70s anytime. We should get a retest of the moving averages at some point.
All eyes on the weekly close today, need to close above the MAs and ideally above the 75.6k key level.
Enjoy your Sunday and see you soon!
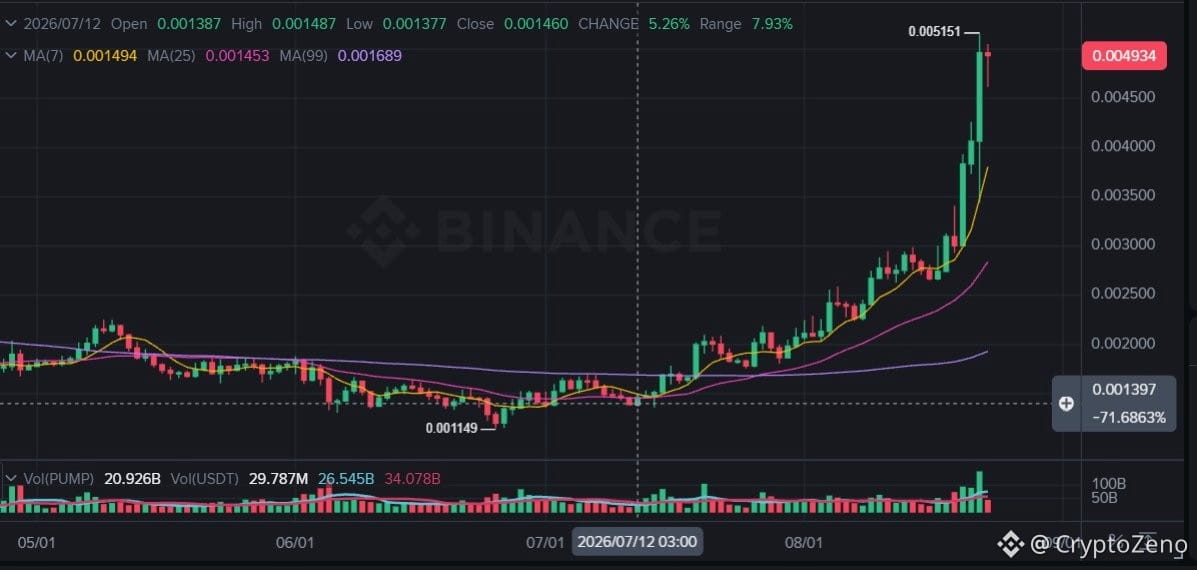
$PUMP from 0.0013 to 0.0051. July 12 wasn't a collapse, it was a reset.
My read from the start was this: the team wanted ICO buyers to be forced into selling at a heavy loss once the unlock hit. Price was kept under 0.002 for months, right up until the ICO tokens unlocked. Once that unlock passed, price started climbing.
In my view, they achieved exactly that. Most ICO buyers ended up selling below their entry price, and once that pressure cleared, price recovered close to 3x.
Now the question is: is an airdrop coming?
With price rising, that question is back. I'm skeptical, and I'd put a low probability on it, around 1%.
There's a track record of disappointment here. The platform is already generating revenue, and I don't think they strategically need an airdrop.
They could theoretically push price much higher first and then announce "the biggest airdrop in history," but I give that low odds too, because the team has consistently put its own interest ahead of everything else so far.
My read from the start was this: the team wanted ICO buyers to be forced into selling at a heavy loss once the unlock hit. Price was kept under 0.002 for months, right up until the ICO tokens unlocked. Once that unlock passed, price started climbing.
In my view, they achieved exactly that. Most ICO buyers ended up selling below their entry price, and once that pressure cleared, price recovered close to 3x.
Now the question is: is an airdrop coming?
With price rising, that question is back. I'm skeptical, and I'd put a low probability on it, around 1%.
There's a track record of disappointment here. The platform is already generating revenue, and I don't think they strategically need an airdrop.
They could theoretically push price much higher first and then announce "the biggest airdrop in history," but I give that low odds too, because the team has consistently put its own interest ahead of everything else so far.
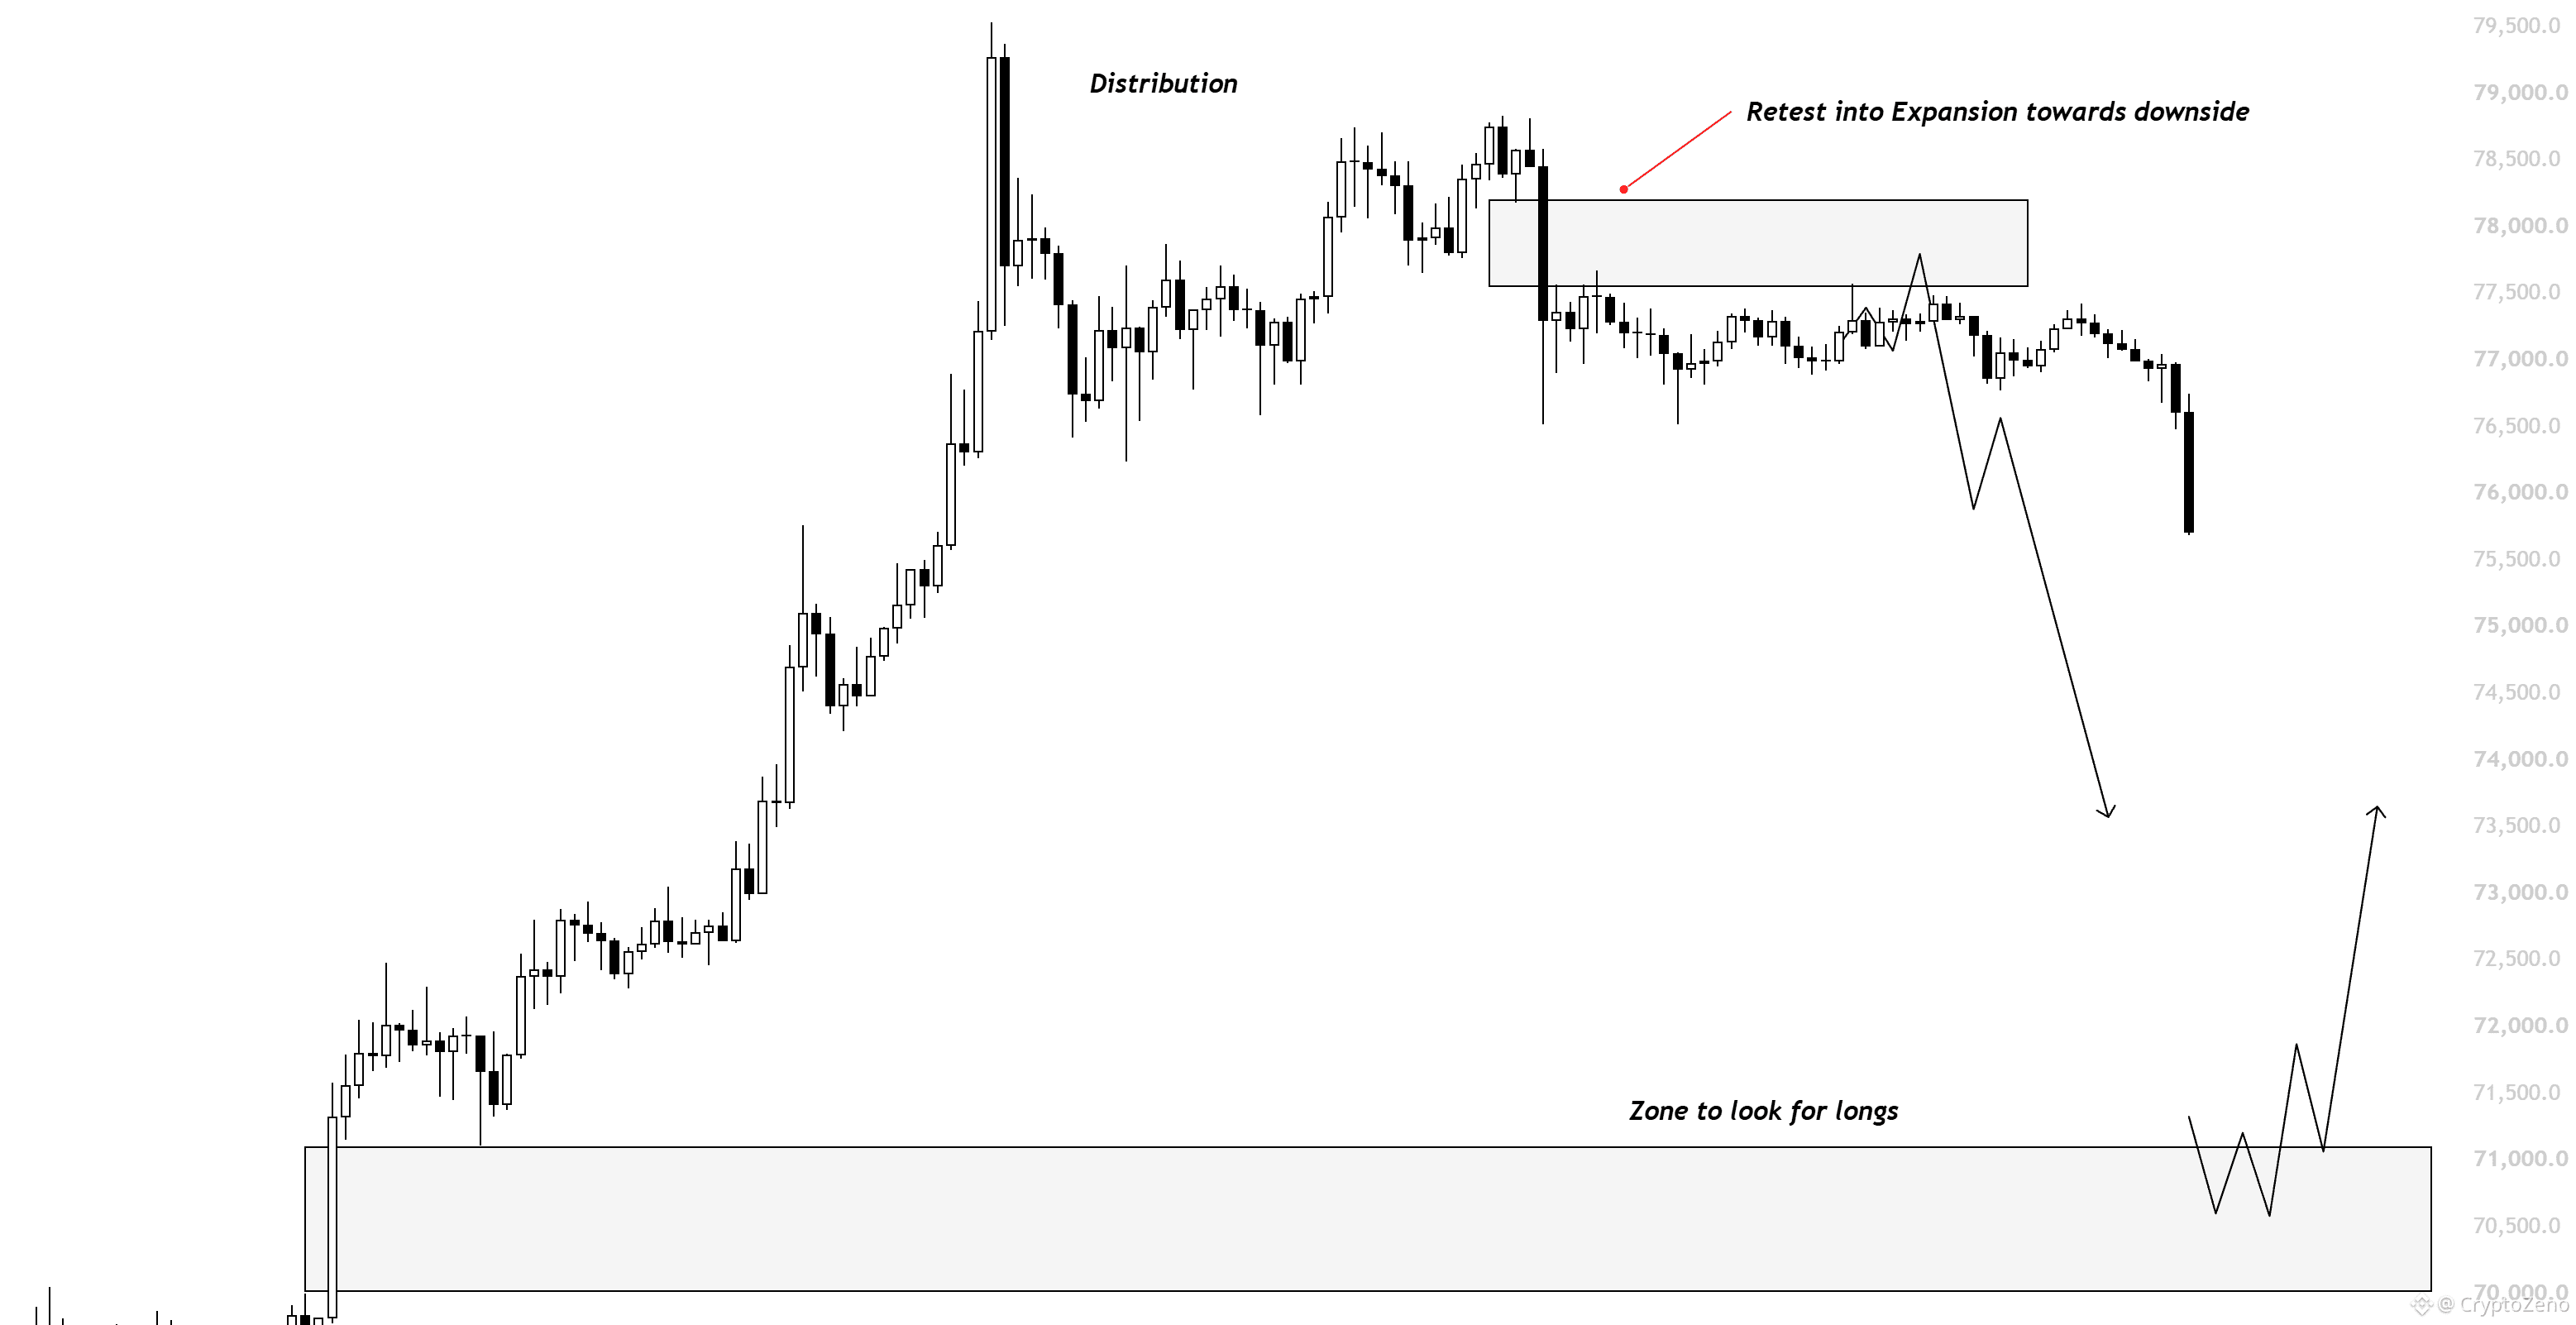
$BTC Price is finally breaking down, now we need to see the candle close below 76.2k for the confirmation.
Cuz if it retraces back up, then we are probably gonna break above the current highs and go to 80k.
Cuz if it retraces back up, then we are probably gonna break above the current highs and go to 80k.
Verified
A small detail in Dusk’s latest direction caught my attention: fractionalization is not being treated as the main selling point. The recent SME research actually argues that making an asset smaller does not magically create liquidity, investor demand or legal certainty. That feels refreshingly practical in a sector where “fractionalized RWAs” gets repeated very easily.
The more interesting part is what has to sit around the asset. Dusk points to eligible buyers, accountable operators, reliable payment and an authorized venue as necessary pieces. That tells me the real challenge is not putting a security onchain, but making the surrounding market infrastructure work without creating another fragmented process.
There is one direction I would like to see @Dusk push further from here: measuring actual market activity after an asset becomes available. How many eligible investors interact with it, how often assets change hands, how much settlement actually happens onchain. Those numbers would tell a much clearer story than simply counting how many assets have been tokenized.
That is probably the metric I would care about most. If Dusk can eventually show that smaller private-market assets are not only issued onchain but actually being used and traded, would that be a stronger proof of the RWA thesis than another big issuance announcement?
$DUSK #dusk @Dusk
The more interesting part is what has to sit around the asset. Dusk points to eligible buyers, accountable operators, reliable payment and an authorized venue as necessary pieces. That tells me the real challenge is not putting a security onchain, but making the surrounding market infrastructure work without creating another fragmented process.
There is one direction I would like to see @Dusk push further from here: measuring actual market activity after an asset becomes available. How many eligible investors interact with it, how often assets change hands, how much settlement actually happens onchain. Those numbers would tell a much clearer story than simply counting how many assets have been tokenized.
That is probably the metric I would care about most. If Dusk can eventually show that smaller private-market assets are not only issued onchain but actually being used and traded, would that be a stronger proof of the RWA thesis than another big issuance announcement?
$DUSK #dusk @Dusk
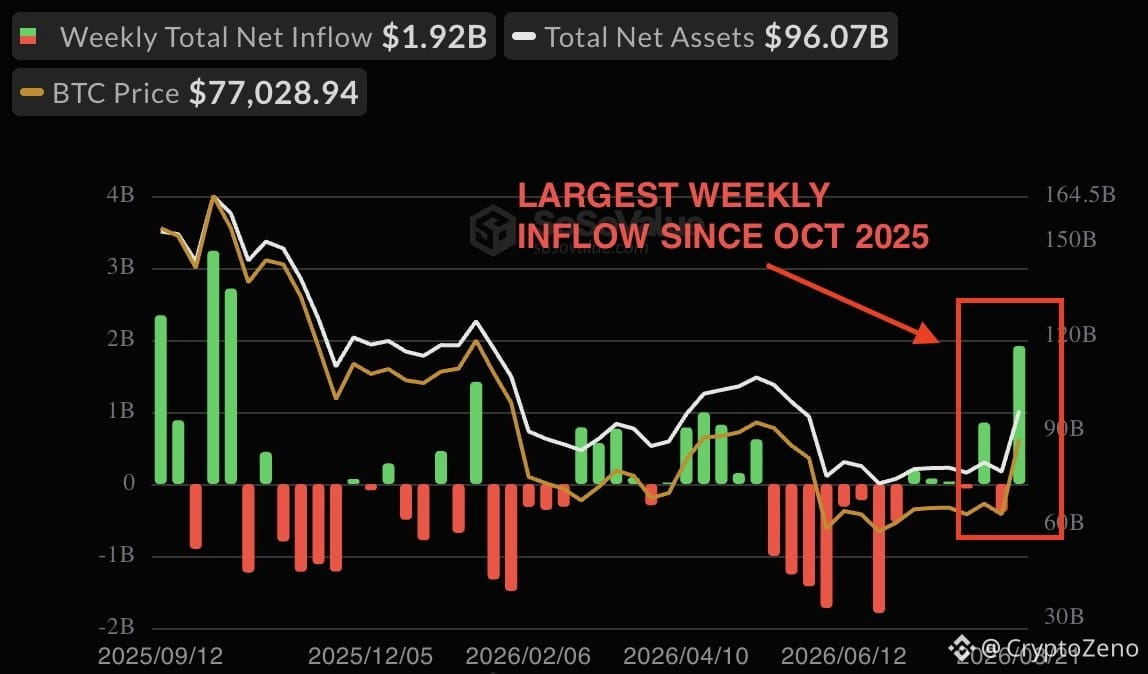
🚨 Bitcoin ETFs just had their strongest weekly inflow since October 2025, attracting nearly $2 billion in inflows.
BlackRock’s $IBIT.ETF dominated the demand, accounting for nearly 70% of the total.
Even Ethereum ETFs attracted almost $700 million during the week.
This came after the US Treasury announced larger buybacks of long term bonds.
The move initially pushed yields lower and weakened the dollar, increasing demand for assets like Bitcoin and Gold.
BlackRock’s $IBIT.ETF dominated the demand, accounting for nearly 70% of the total.
Even Ethereum ETFs attracted almost $700 million during the week.
This came after the US Treasury announced larger buybacks of long term bonds.
The move initially pushed yields lower and weakened the dollar, increasing demand for assets like Bitcoin and Gold.
BTC+1.61%
IBITETF-0.02%
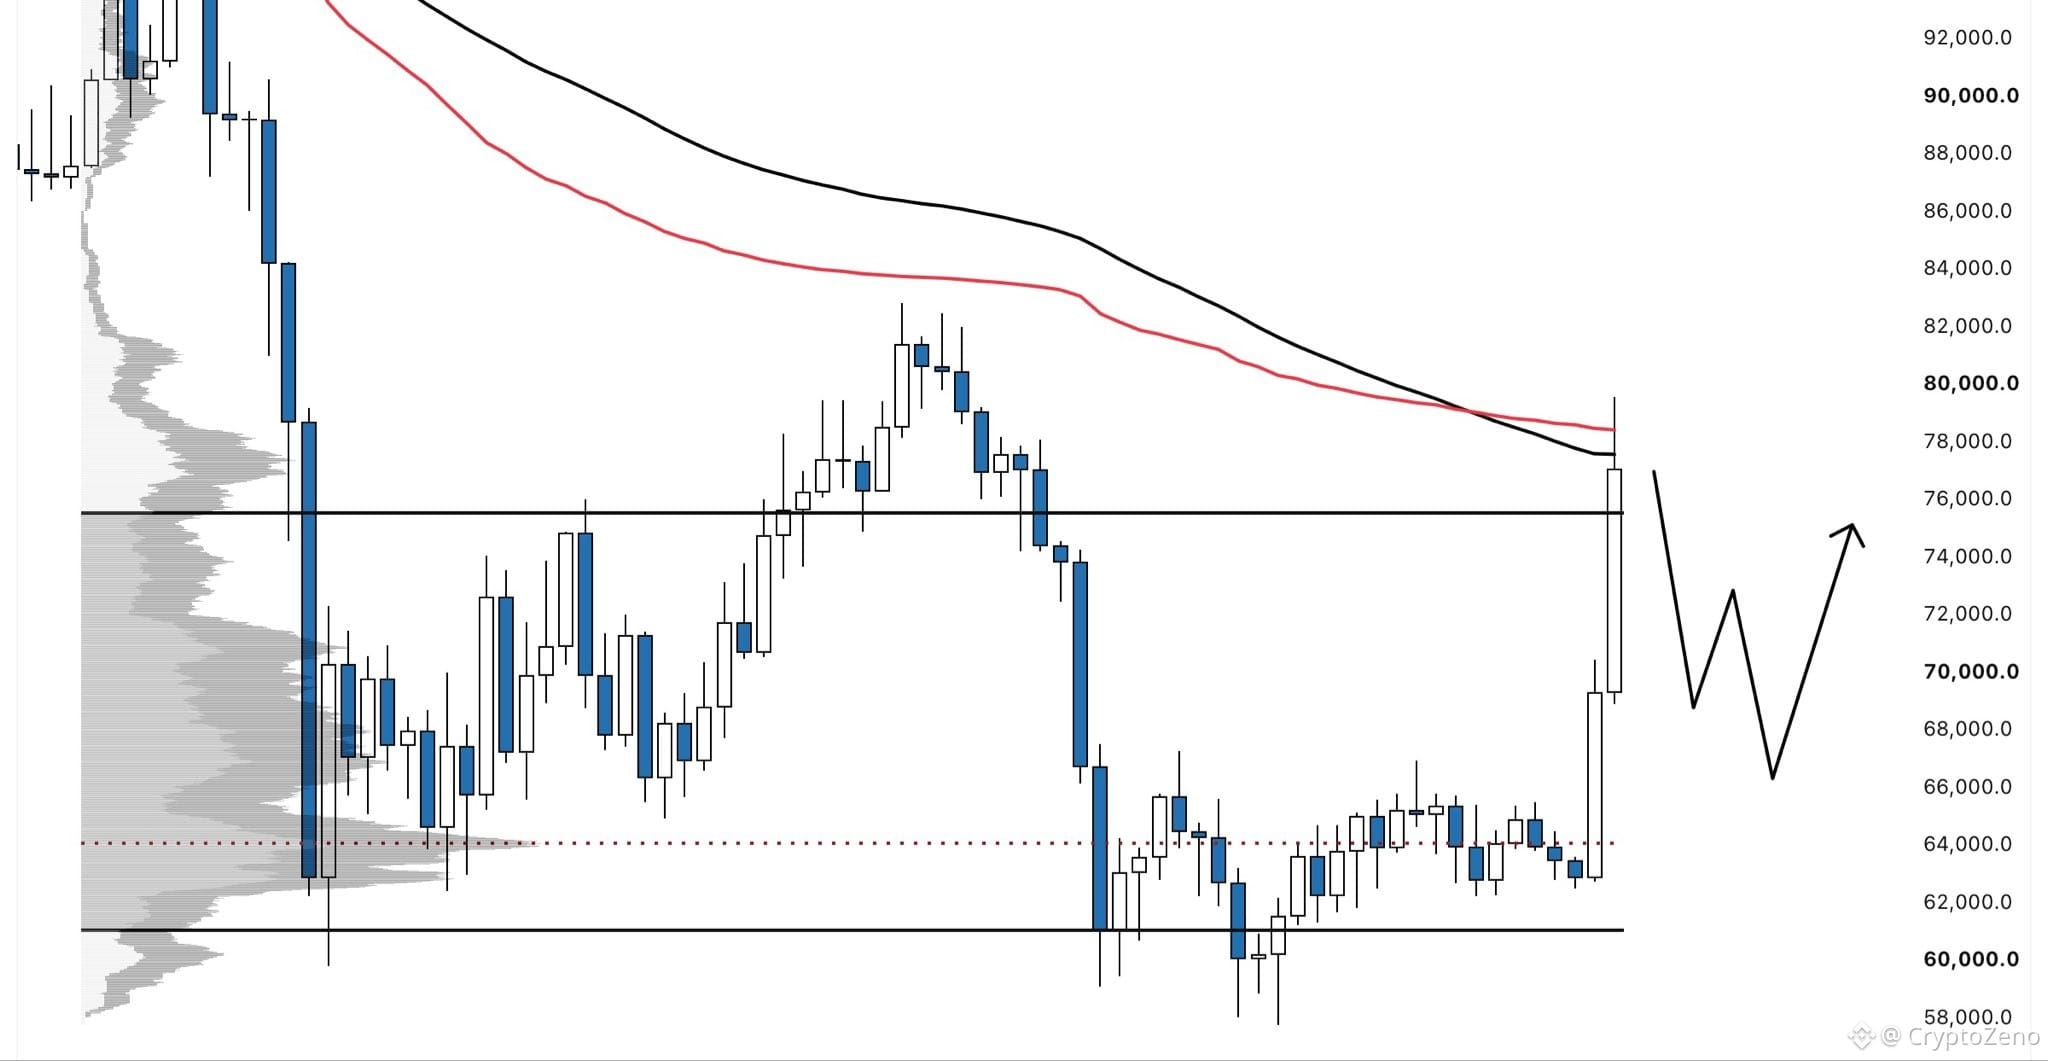
$BTC Price is currently getting rejected from the 365-day EMA and the aVWAP from the cycle top.
Both are extremely important dynamic levels to reclaim to determine whether we can officially call the end of this bear market.
This rejection is also happening outside the yearly value area, which makes it highly likely that we see a retracement back inside below 75K.
The maximum I expect for this potential pullback is around 67K.
Both are extremely important dynamic levels to reclaim to determine whether we can officially call the end of this bear market.
This rejection is also happening outside the yearly value area, which makes it highly likely that we see a retracement back inside below 75K.
The maximum I expect for this potential pullback is around 67K.
$BTC Whale Orders🐋
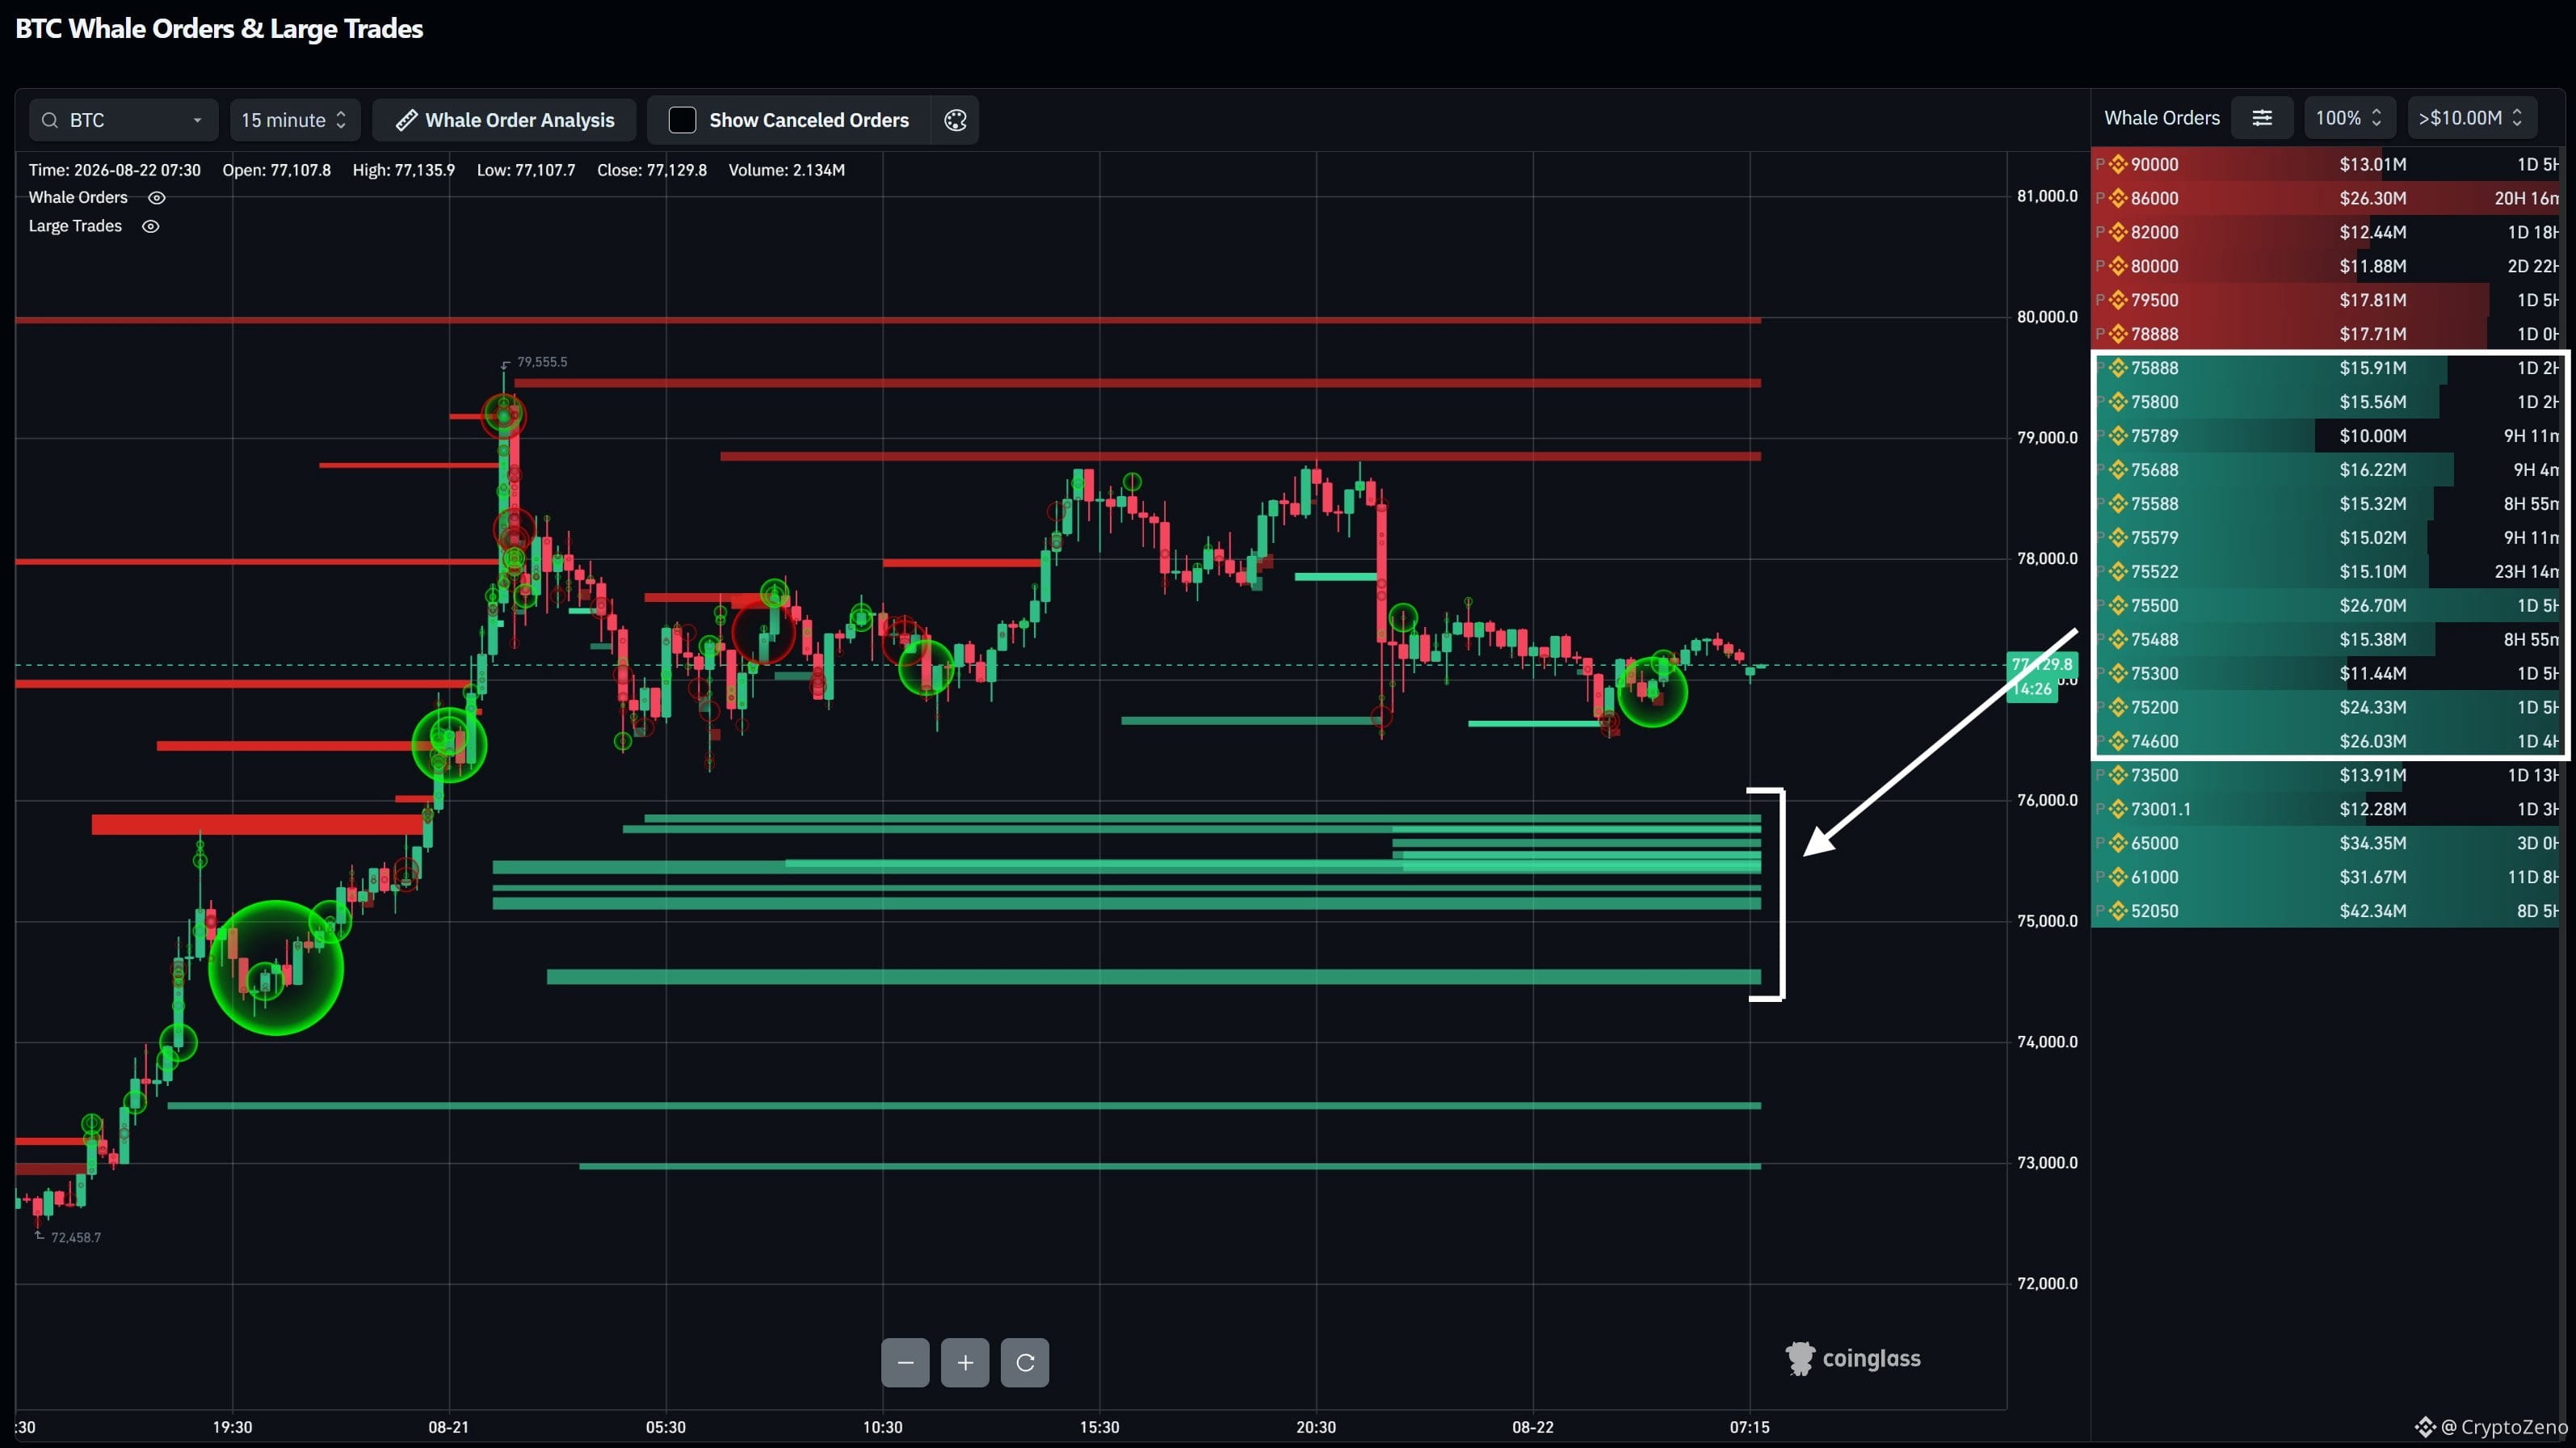
THIS IS MASSIVE!!!
There is now over $192m in limit long orders waiting to be filled in the 75-76k range.🧲
Market is crazy right now, wouldn't be surprised if we see another huge wick down.
Who's long or short RN?
THIS IS MASSIVE!!!
There is now over $192m in limit long orders waiting to be filled in the 75-76k range.🧲
Market is crazy right now, wouldn't be surprised if we see another huge wick down.
Who's long or short RN?
This Market is insane right now. Woke up to see a massive dump on ALTS last night.
Glad we took a back seat and used proper risk management.
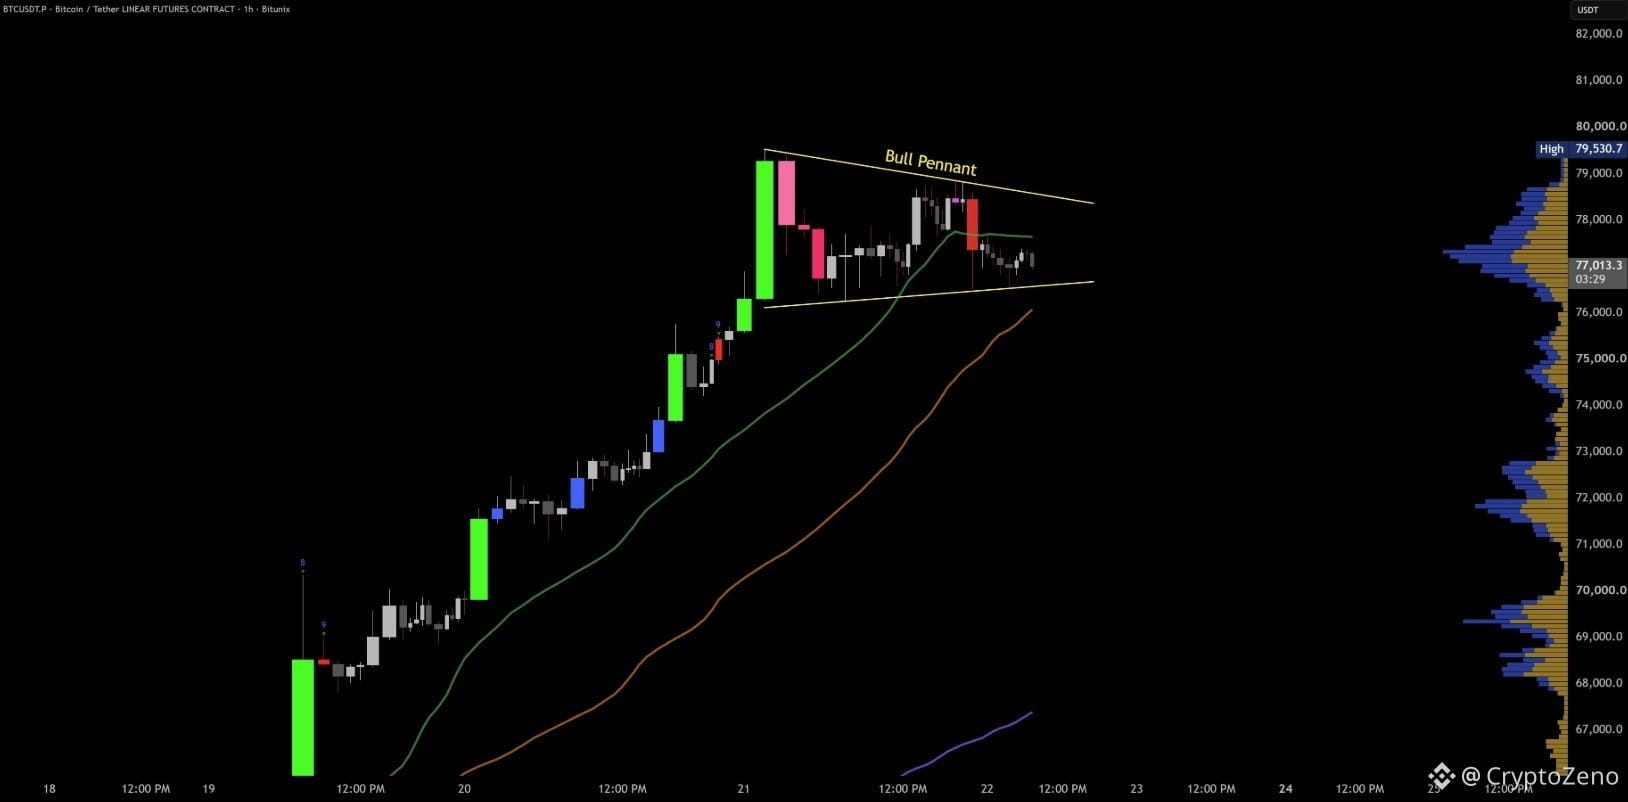
$BTC is super conflicting right now...
There's a Bull Pennant Pattern forming, yet it's massively overextended + weekend / low volume.
These are suboptimal trading conditions.
However, I do feel like a correction to the 75k range is more likely before next leg up (liquidation / local high).
I'll dive into the charts here soon to see if there are any good opportunities for today.
Glad we took a back seat and used proper risk management.
$BTC is super conflicting right now...
There's a Bull Pennant Pattern forming, yet it's massively overextended + weekend / low volume.
These are suboptimal trading conditions.
However, I do feel like a correction to the 75k range is more likely before next leg up (liquidation / local high).
I'll dive into the charts here soon to see if there are any good opportunities for today.
Partly True
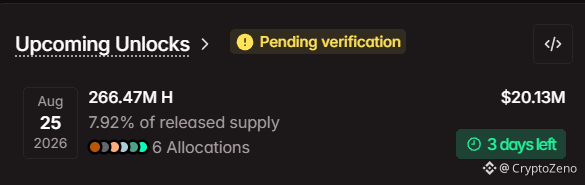
$H circulating supply gets a 7.92% unlock in 3 days. But something interesting is happening onchain.
266.47M tokens unlock, 7.92% of circulating supply. The largest slice comes from Early Contributors, 79.17M tokens ($5.98M), then Investors at 55.56M ($4.20M). Combined across six allocations, that's roughly $20M in supply.
But there's a counter-move happening in the last few days
Bulk withdrawals from exchanges into fresh wallets. Six major ones, plus smaller amounts:
$5.62M, $4.28M, $4.11M, $2.34M, $1.97M, $1.31M
Roughly $20M total, and these wallets are holding. Not sending back to exchanges, not selling.
That's the opposite of what you'd expect heading into an unlock. In a window where selling pressure is usually the concern, someone's pulling supply off exchanges and sitting on it instead. That points to accumulation, or at least an intent to hold rather than sell.
Structure backs it up
OI at 12% of mcap, futures at 8.0x spot, both in the healthy range. L/S at 1.11, close to balanced. Top trader positions at 2.48, far more weighted long than the crowd. The split is real and leans up.
Taker at 0.93, slightly seller-heavy, but price is only down 2.85% in 24h, a modest pullback so far.
266.47M tokens unlock, 7.92% of circulating supply. The largest slice comes from Early Contributors, 79.17M tokens ($5.98M), then Investors at 55.56M ($4.20M). Combined across six allocations, that's roughly $20M in supply.
But there's a counter-move happening in the last few days
Bulk withdrawals from exchanges into fresh wallets. Six major ones, plus smaller amounts:
$5.62M, $4.28M, $4.11M, $2.34M, $1.97M, $1.31M
Roughly $20M total, and these wallets are holding. Not sending back to exchanges, not selling.
That's the opposite of what you'd expect heading into an unlock. In a window where selling pressure is usually the concern, someone's pulling supply off exchanges and sitting on it instead. That points to accumulation, or at least an intent to hold rather than sell.
Structure backs it up
OI at 12% of mcap, futures at 8.0x spot, both in the healthy range. L/S at 1.11, close to balanced. Top trader positions at 2.48, far more weighted long than the crowd. The split is real and leans up.
Taker at 0.93, slightly seller-heavy, but price is only down 2.85% in 24h, a modest pullback so far.
Log in to explore more content