
交易员知阳
1.1k Posts

交易员知阳
 Square Verified+
推特@CJ_eth666🔸直播时间:早上7:00 晚上:8:00🔸不管什么市场,K线是唯一的通用语言🔸认证金融分析师/技术分析博主/擅长裸K技术/感谢你的关注和支持🔸爱你们
Open Trade
High-Frequency Trader
2.2 Years
83 Following
31.5K+ Followers
49.1K+ Liked
Posts
Portfolio
All
Quotes
Videos
Live
PINNED
Baby ones: I’m changing to a new profile picture $BTC
Because: Many fans baby loves the practical volume-price / naked K / technical analysis / levels / strategies / live-streaming content I share
📣 Next: I’ll try to hold fixed-time live streams
(From Monday to Friday: two sessions each day—morning and evening)
Morning session: 『7:30~9:30』 two hours live
Evening session: 『20:30~22:30』 two hours live
“Content from posts during the same period and market analysis sessions will be released after the live stream. Every day I’ll share large-market wave/segment trading analysis, and for certain popular altcoins I’ll also provide occasional analysis and explanations.”
📖 For the baby who loves learning: I’ll explain everything without reservation—teaching you techniques, analyzing the market. Welcome to follow me, and thank you for your support!
(Teach someone to fish; don’t just give them fish)
(If you have questions, scan to add me as a friend and message me privately—I’ll help you solve it)
#SHIB上涨36%
Because: Many fans baby loves the practical volume-price / naked K / technical analysis / levels / strategies / live-streaming content I share
📣 Next: I’ll try to hold fixed-time live streams
(From Monday to Friday: two sessions each day—morning and evening)
Morning session: 『7:30~9:30』 two hours live
Evening session: 『20:30~22:30』 two hours live
“Content from posts during the same period and market analysis sessions will be released after the live stream. Every day I’ll share large-market wave/segment trading analysis, and for certain popular altcoins I’ll also provide occasional analysis and explanations.”
📖 For the baby who loves learning: I’ll explain everything without reservation—teaching you techniques, analyzing the market. Welcome to follow me, and thank you for your support!
(Teach someone to fish; don’t just give them fish)
(If you have questions, scan to add me as a friend and message me privately—I’ll help you solve it)
#SHIB上涨36%

PINNED

This weekend’s altcoin market
Gives me the feeling that tens of thousands of coins are taking off 🛫? The altcoin bull market is here, watch your speed, guys $BULLA
Gives me the feeling that tens of thousands of coins are taking off 🛫? The altcoin bull market is here, watch your speed, guys $BULLA
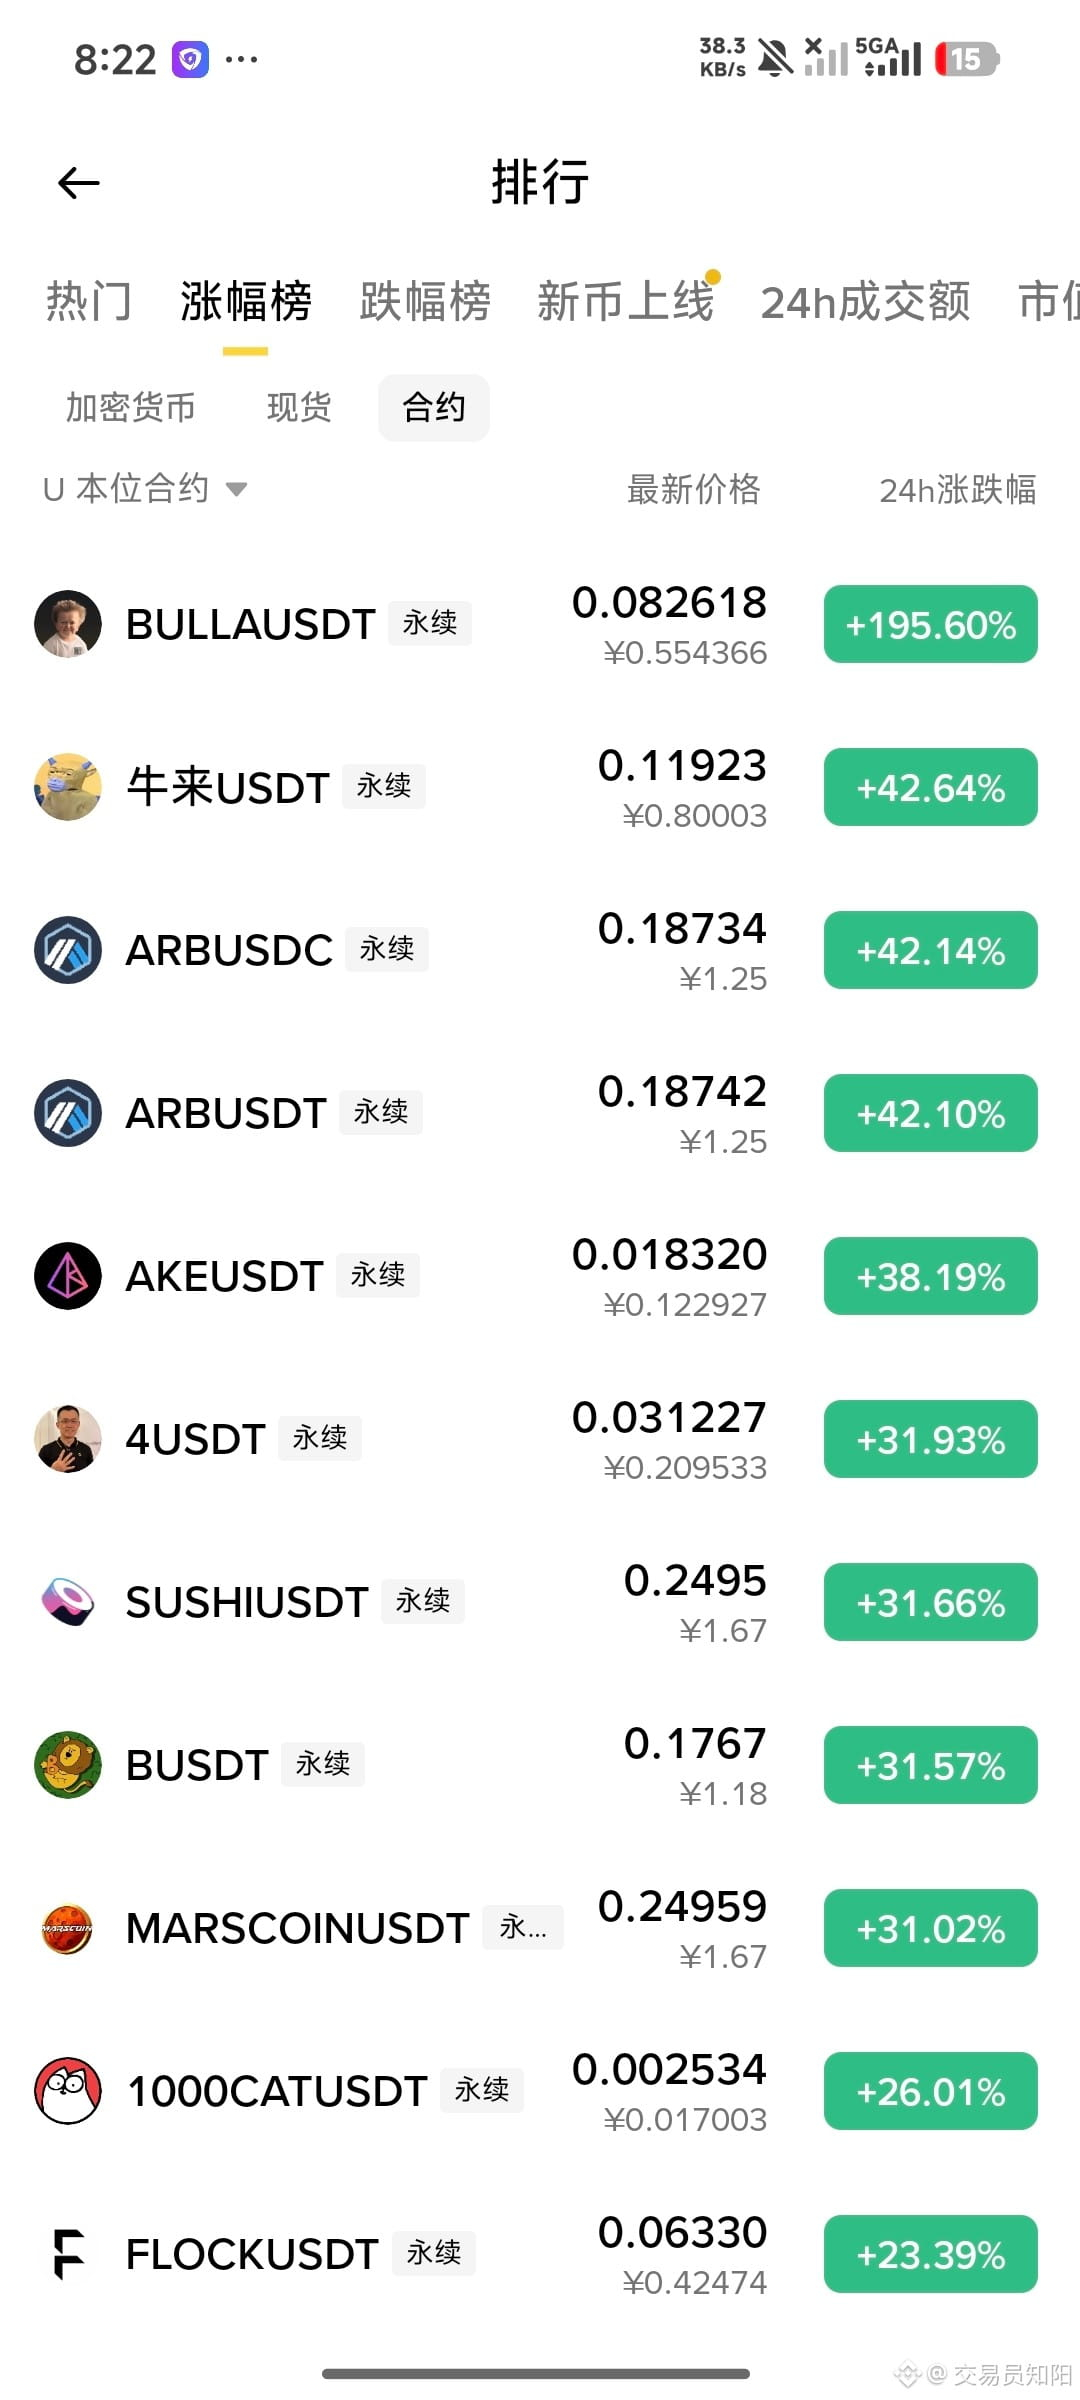
Oh my goodness!!!
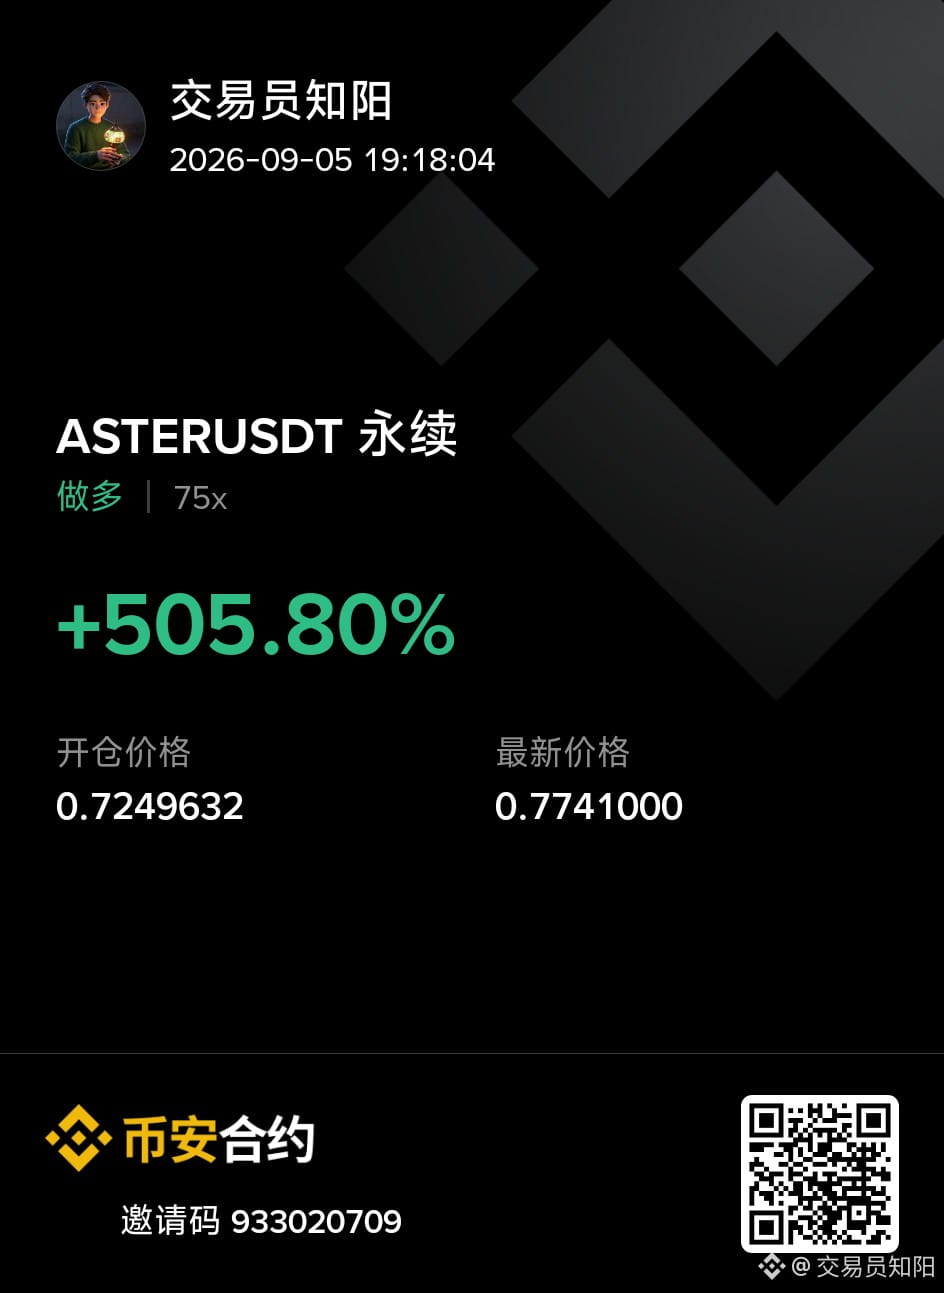
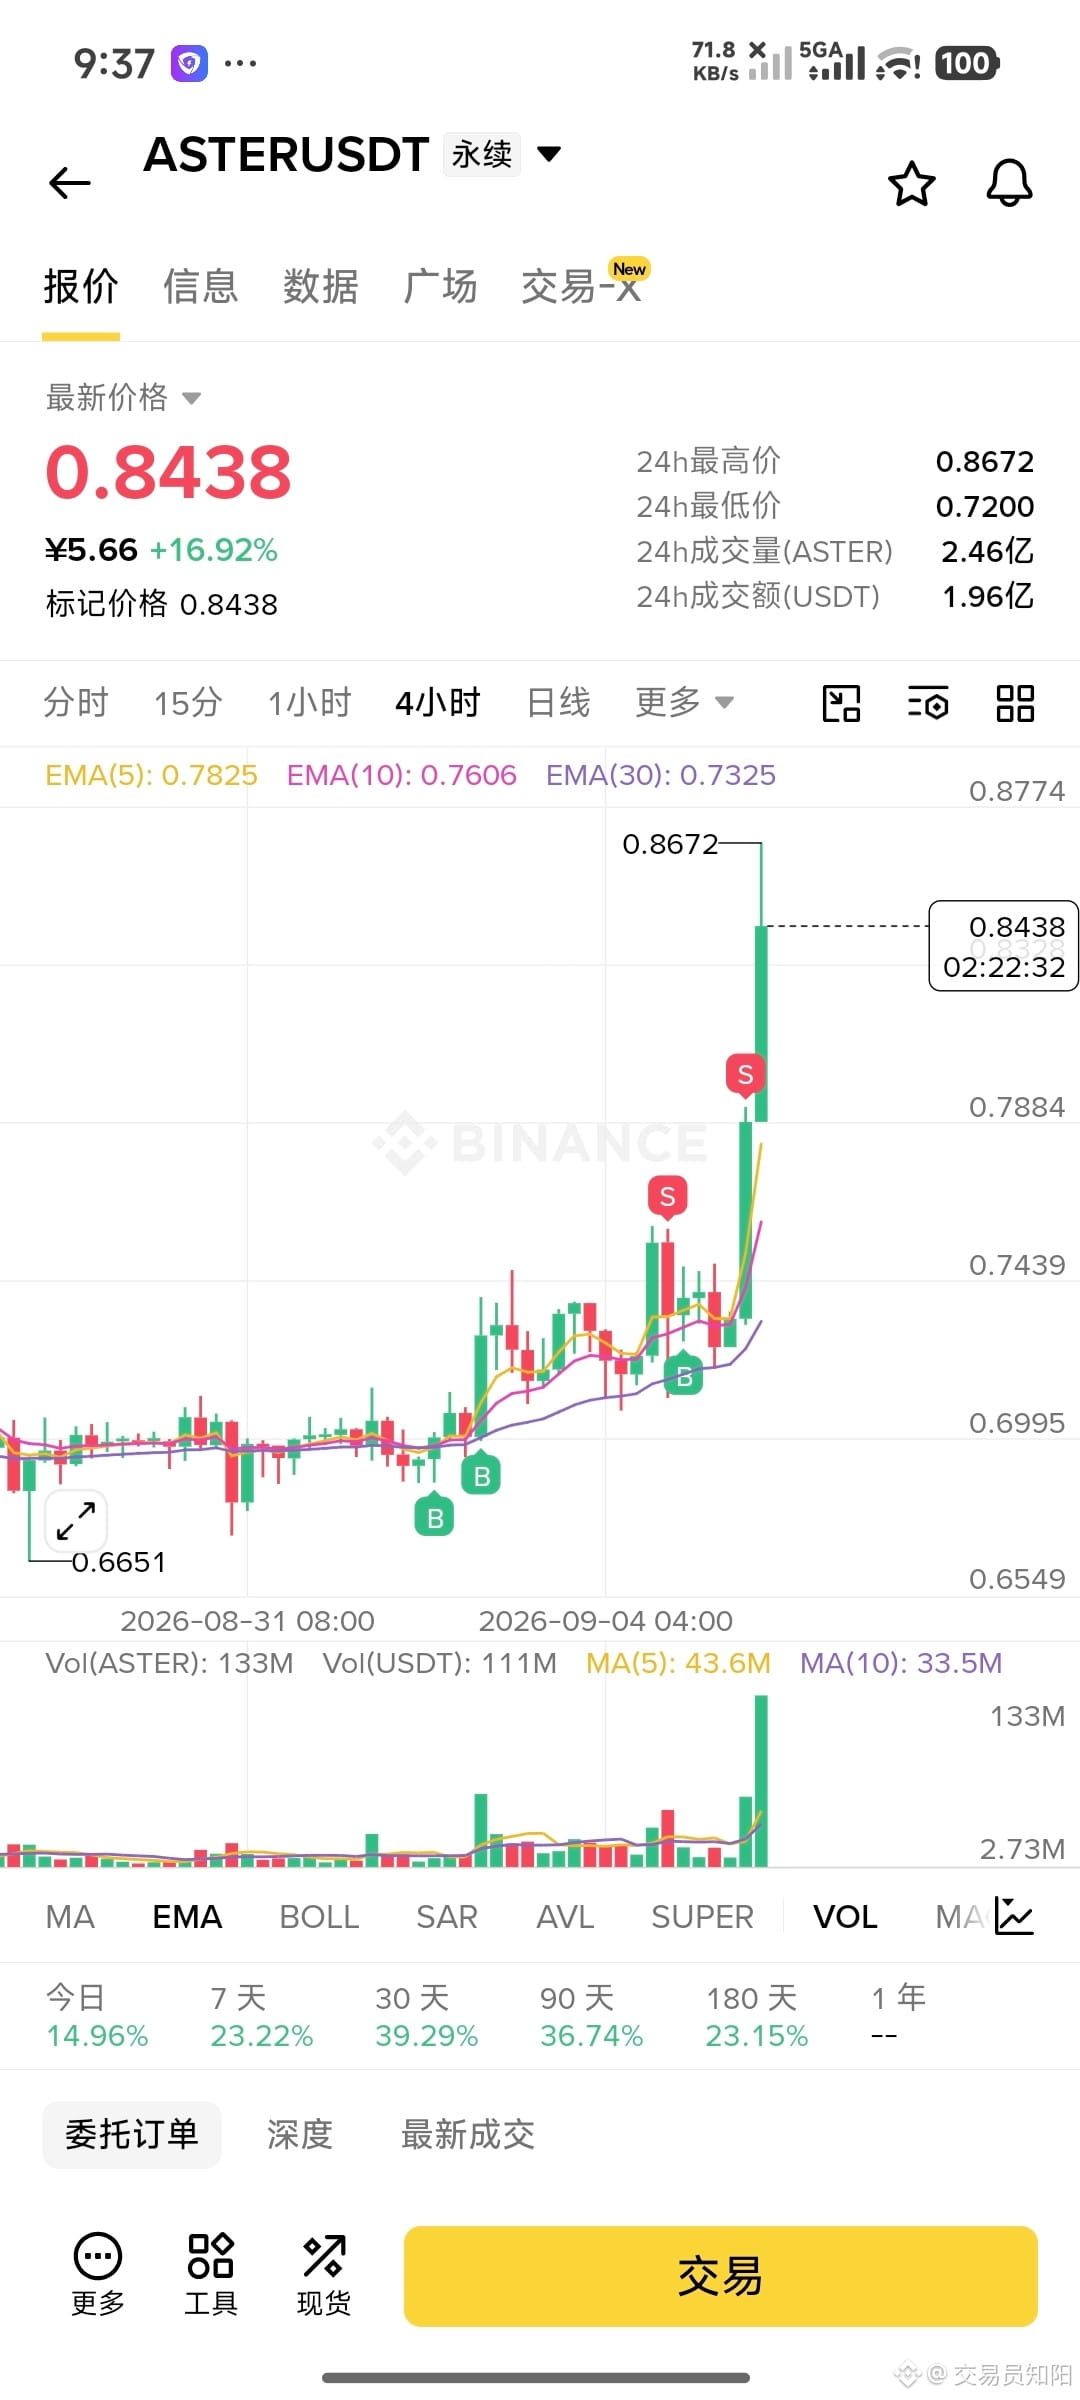
It flew 🛫
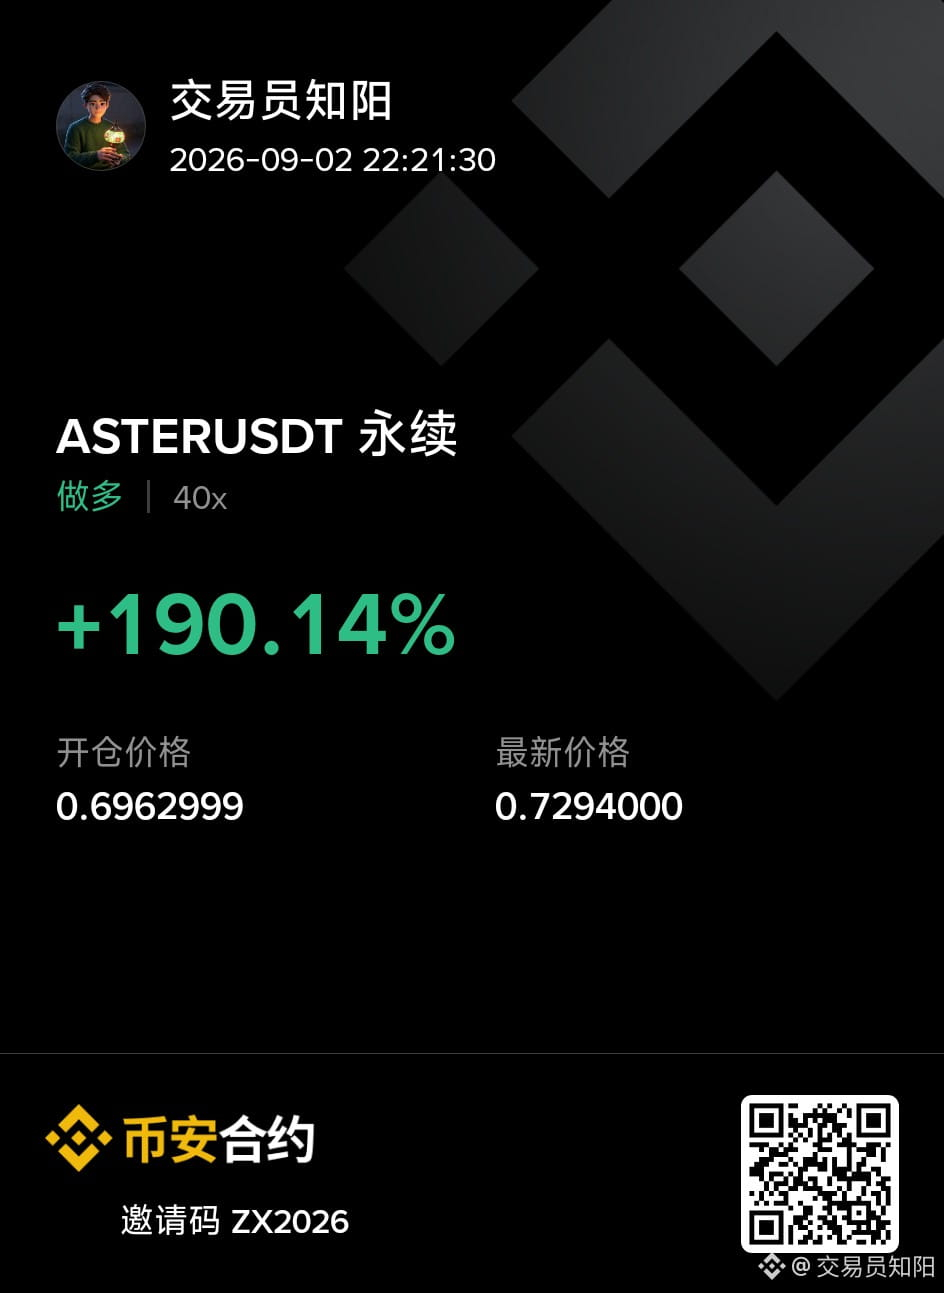
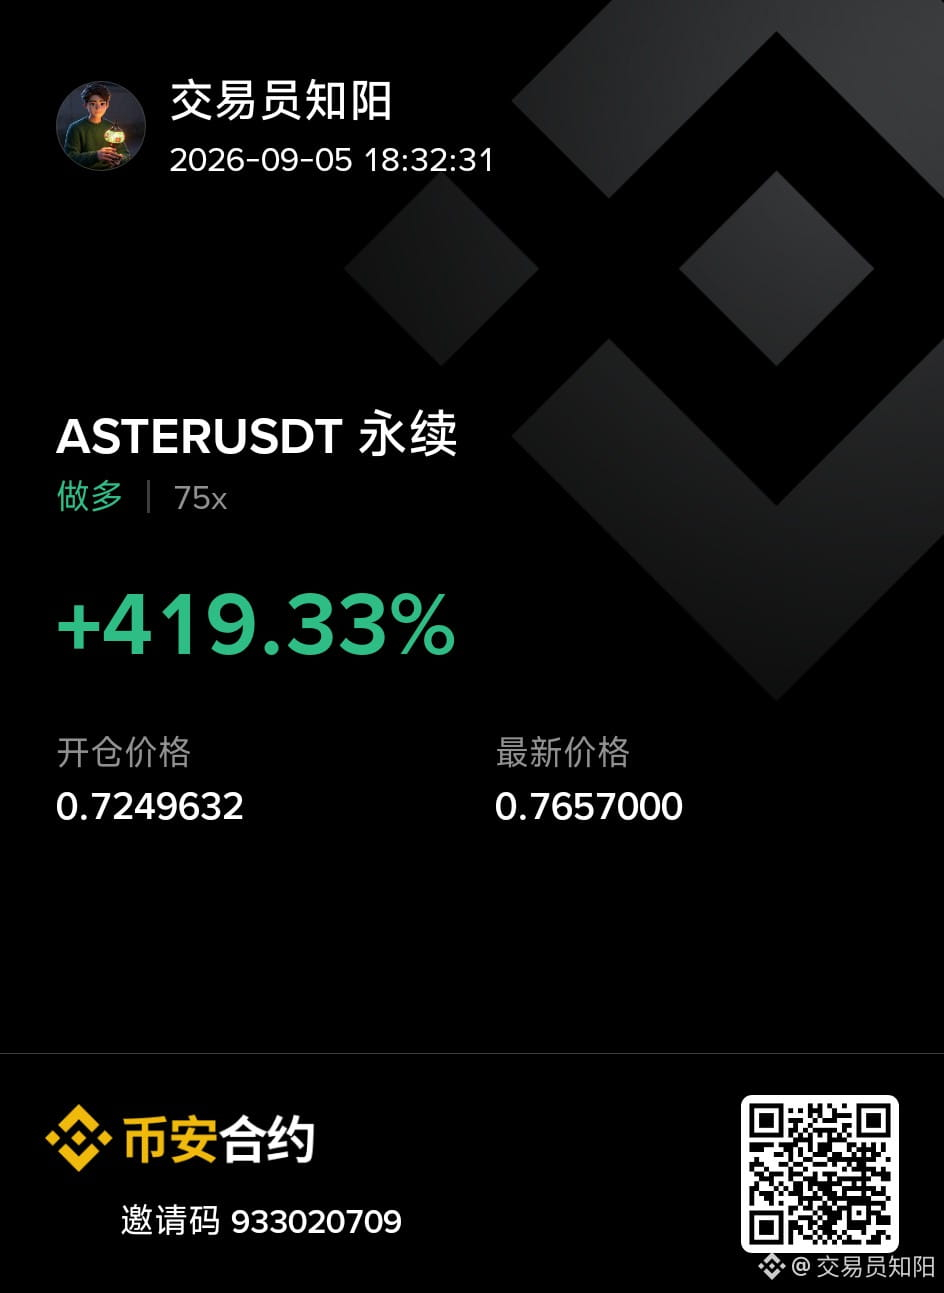
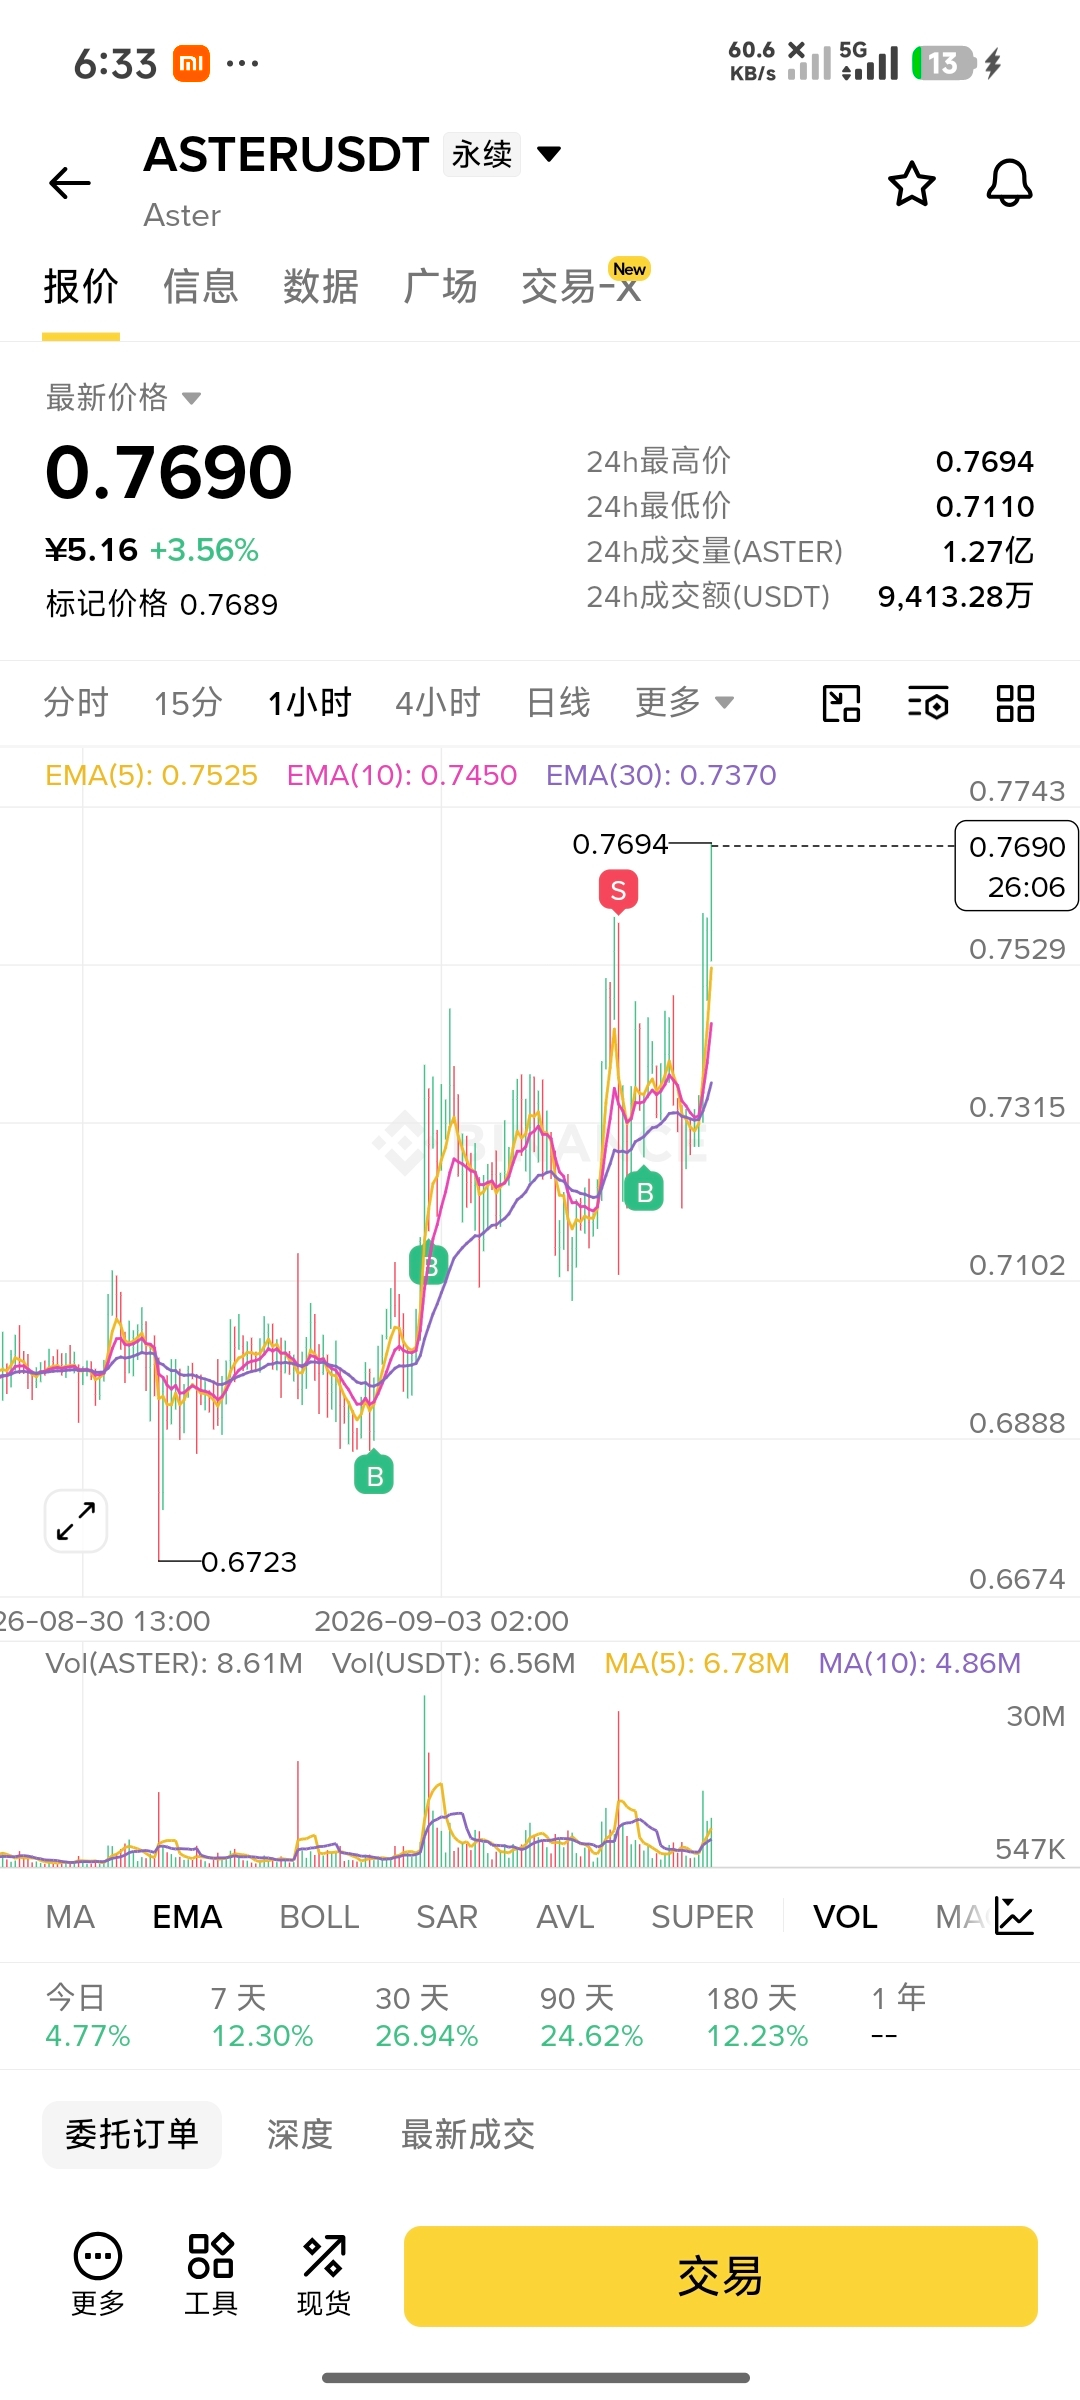
While we were live streaming, everyone in our stream watched it fly. $ASTER
It flew 🛫
While we were live streaming, everyone in our stream watched it fly. $ASTER
·
--
🎙️ What the $ASTER skyrocketed, naked candlesticks + volume-price live trading

End
01 h 28 m 43 s
264
0
·
--
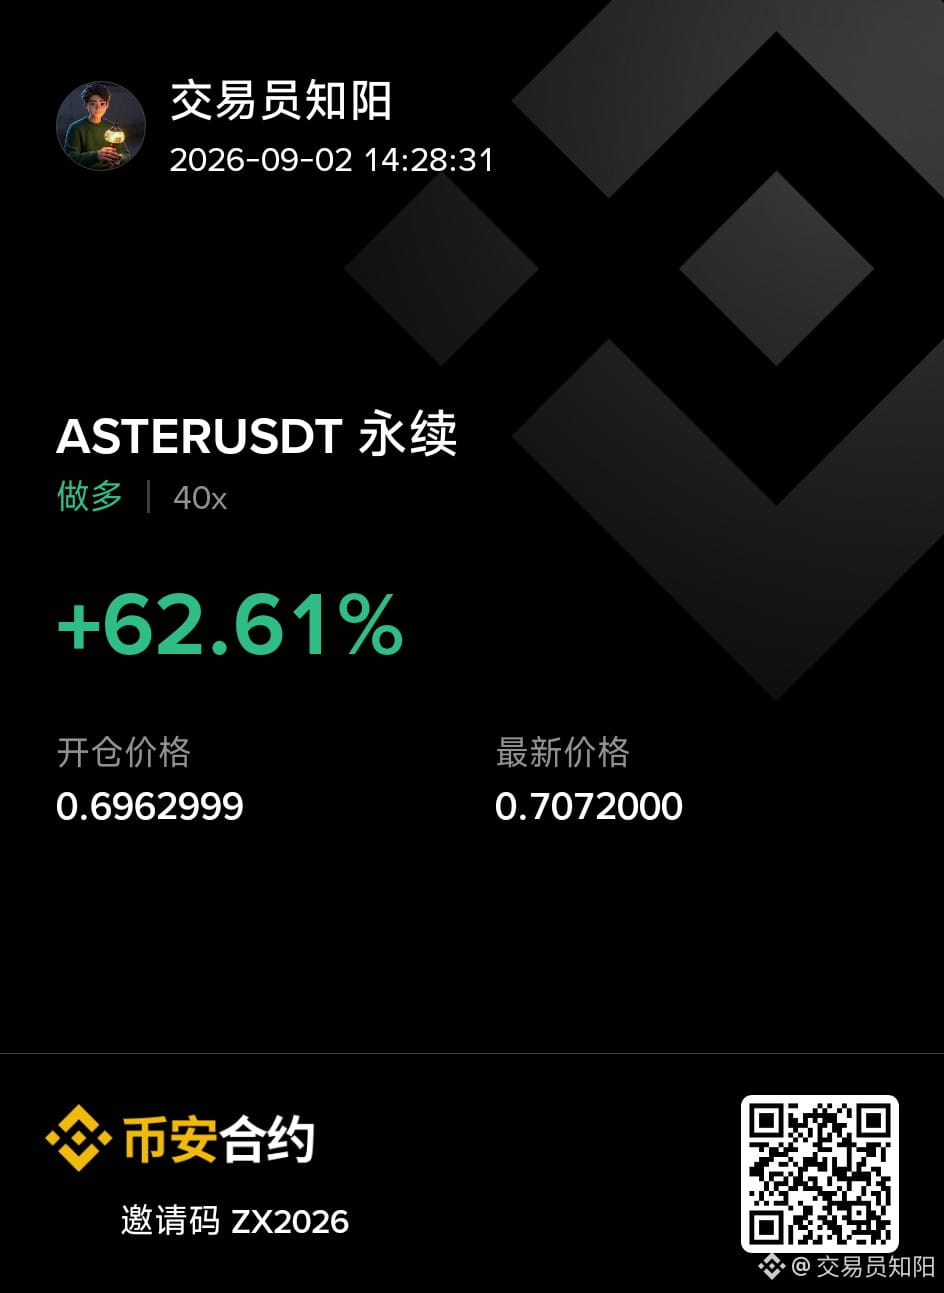
🎙️ Is Bitcoin unable to break 80,000 anymore: Naked K + Volume-Price Technical Analysis for Live Trading

End
02 h 06 m 12 s
308
0
·
--
🎙️ What the heck! From head to toe. Naked K + volume-price

End
01 h 01 m 41 s
88
0

Tomorrow at 7:30 AM pre-market live broadcast
Brothers, see you then
Tonight rest, no live stream tonight, broadcast tomorrow at 7:30 AM
$ASTER
Brothers, see you then
Tonight rest, no live stream tonight, broadcast tomorrow at 7:30 AM
$ASTER
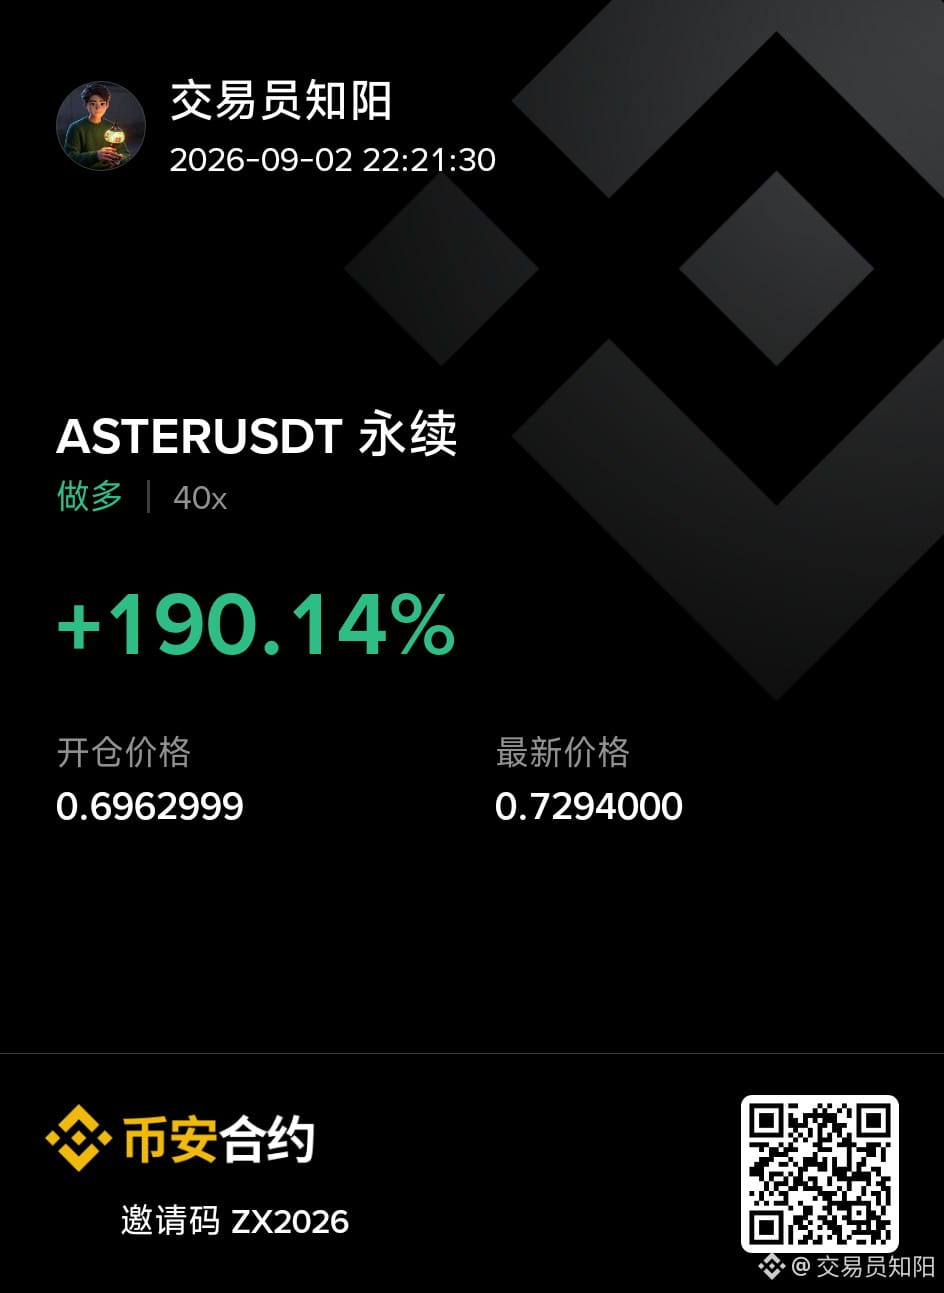
Babe(s): Today’s big pancake day—intraday short-term profit achieved
In the morning, analyzing the intraday levels is the best time
Bare K plus volume-price technical analysis to read the market
$BTC
In the morning, analyzing the intraday levels is the best time
Bare K plus volume-price technical analysis to read the market
$BTC

·
--
🎙️ Big Bing Bullish: More Uptrend Nodes Are Coming—Bare Candlestick + Volume/Price Technical Analysis

End
01 h 28 m 58 s
82
0
“Big pancake” oscillates all the way to the bottom region
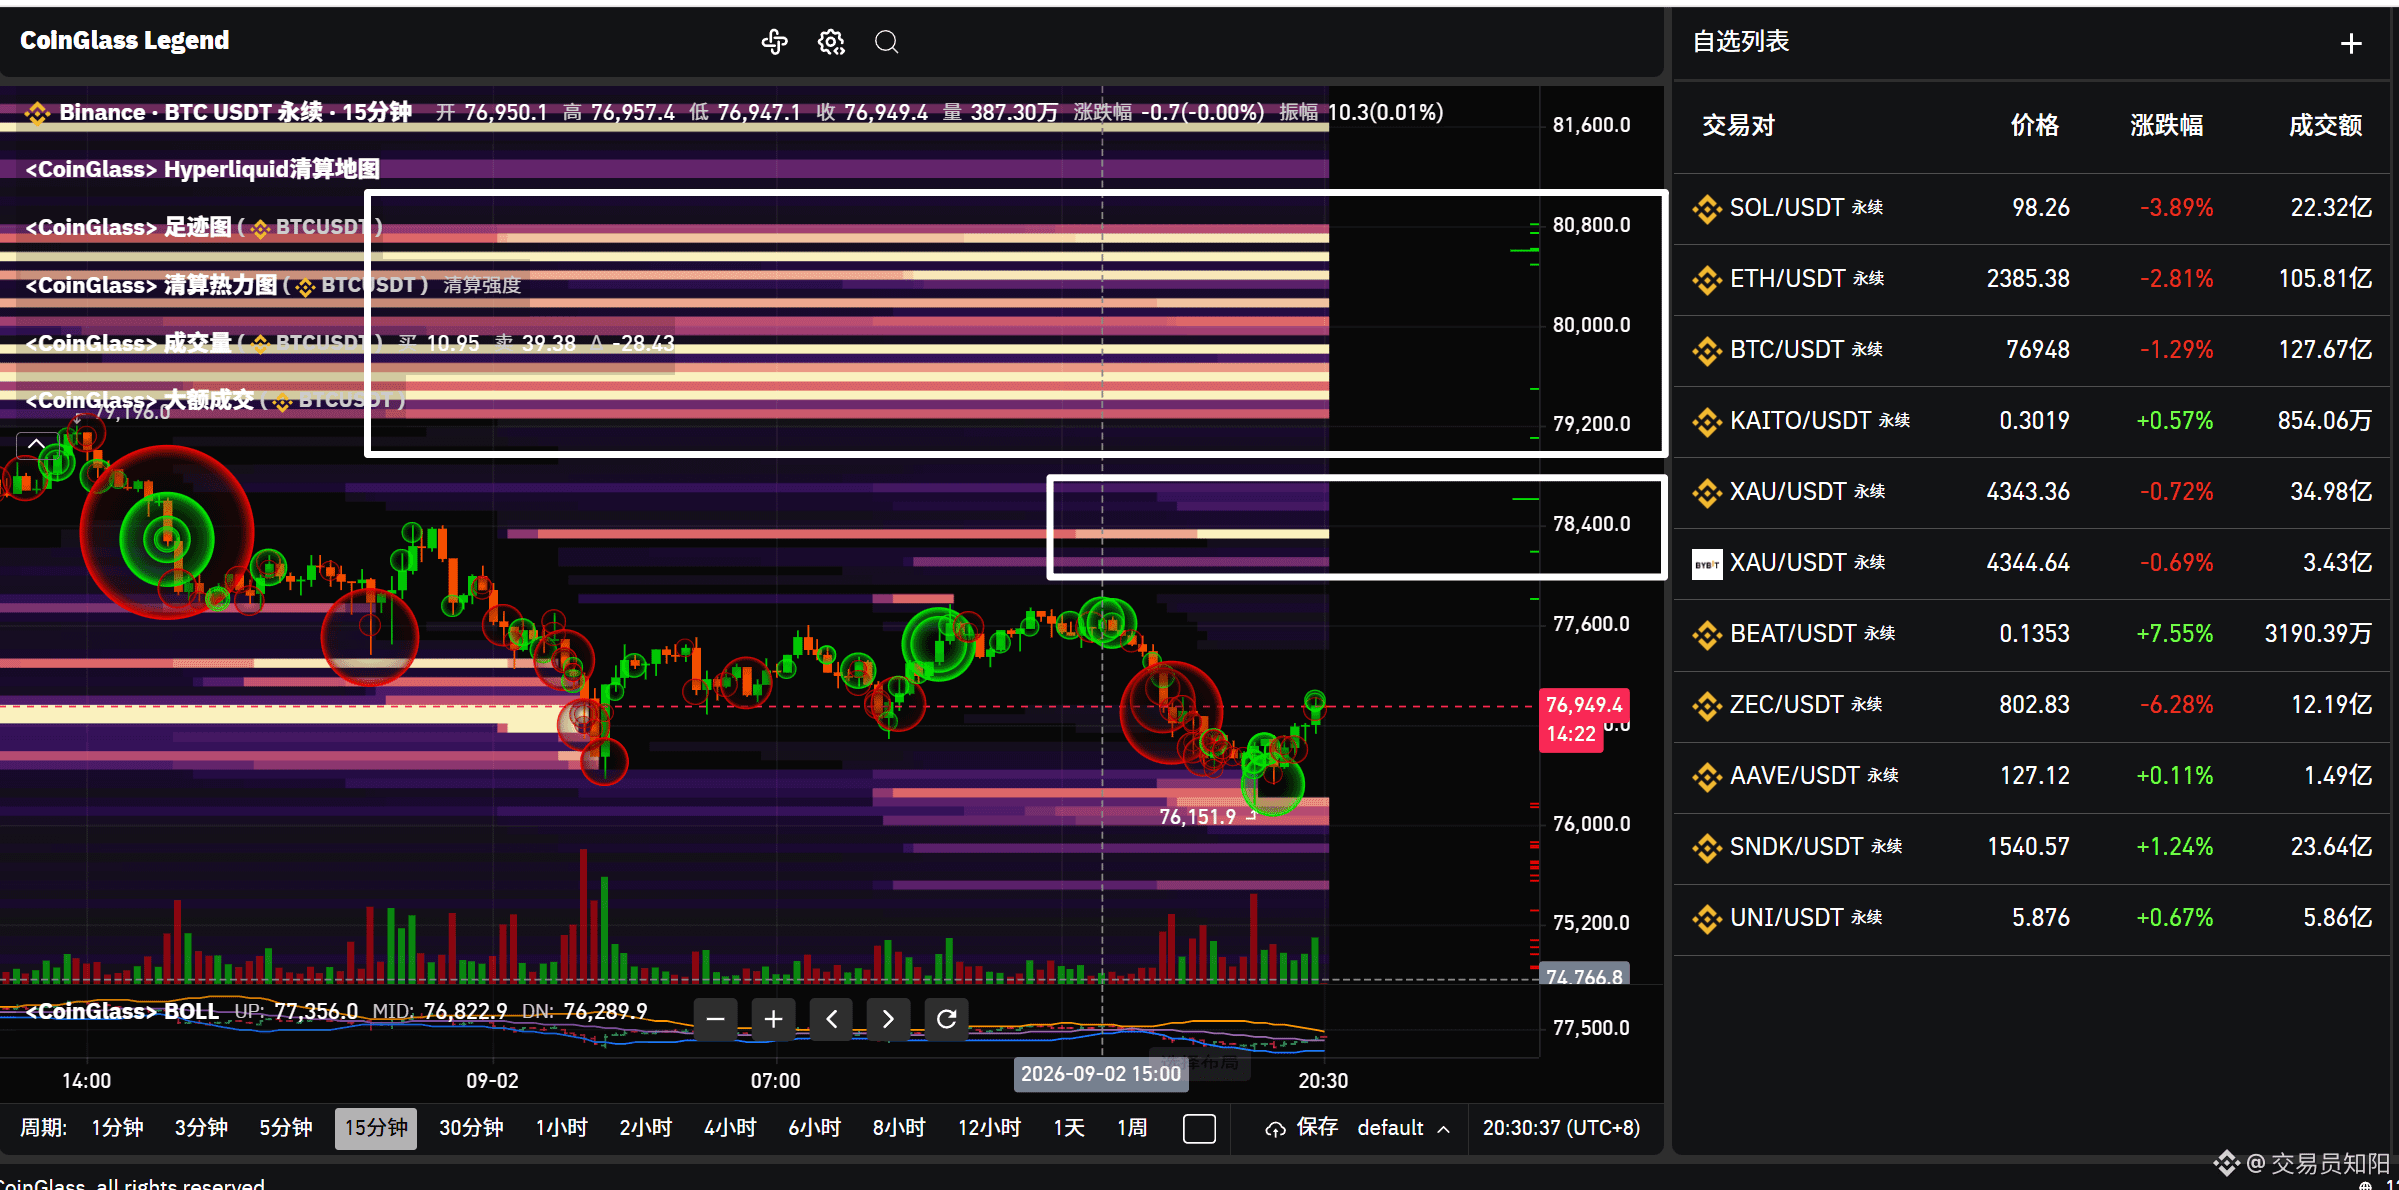
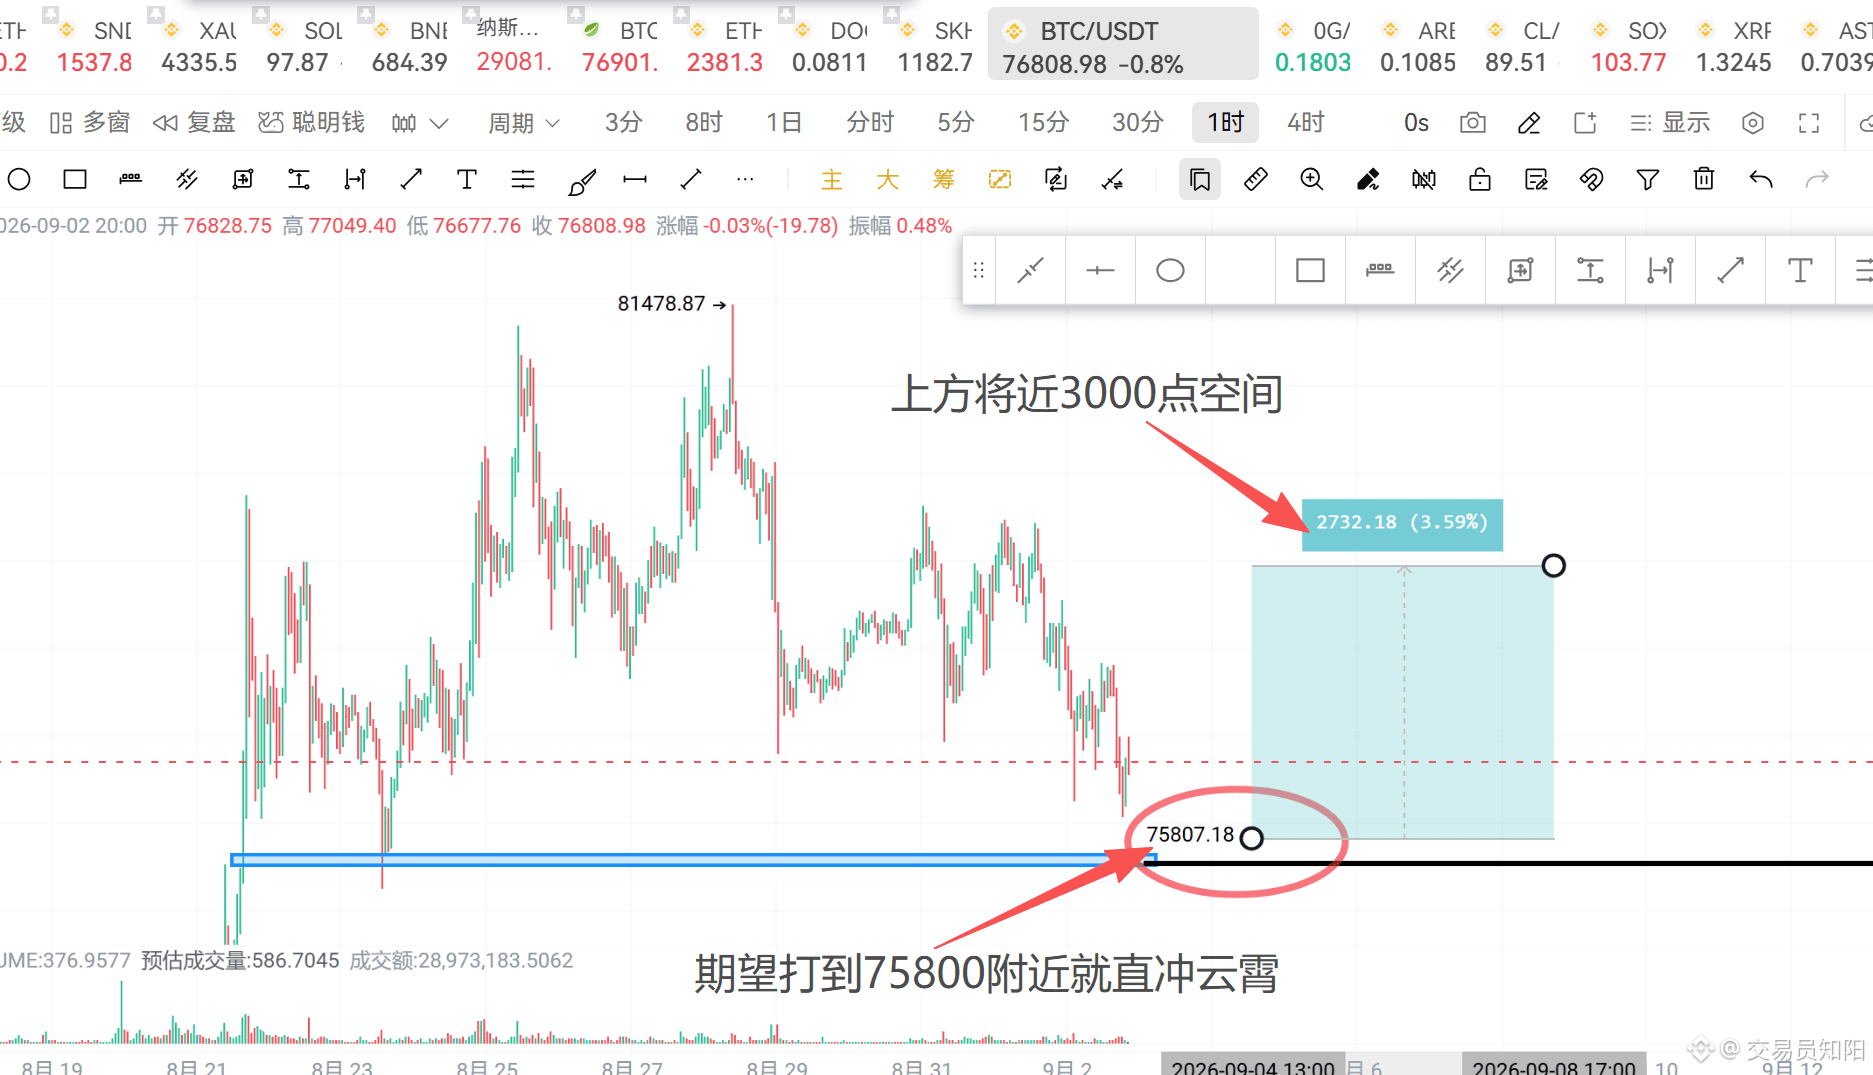
What??? If you go long now and the short side starts to get emotional, that’s when there will definitely be a bunch of retail traders chasing shorts. This is the perfect time to go and “eat” those bloody chips. From the long side all the way through, there has been steady absorption. Next, going long on pullbacks is your choice. If “big pancake” breaks down a bit further and takes out 76,000, that would be the most perfect.
As for recent order-book/market data: the long-side liquidations are basically nearly done. Over the next two days, when prices pull back, it’s time to enter long positions. Pay attention and scale in—don’t put your entire position in at once. This is not the timing for an immediate pump.
For these two days, watch the 76,000 level. If price keeps coming down with volume and wick/sharp needle dips, it should move up in the following days. Ideally, the dip wicks slightly lower to grab some liquidity—then the momentum for the rise, the “fuel,” will be more than enough: $BTC
What??? If you go long now and the short side starts to get emotional, that’s when there will definitely be a bunch of retail traders chasing shorts. This is the perfect time to go and “eat” those bloody chips. From the long side all the way through, there has been steady absorption. Next, going long on pullbacks is your choice. If “big pancake” breaks down a bit further and takes out 76,000, that would be the most perfect.
As for recent order-book/market data: the long-side liquidations are basically nearly done. Over the next two days, when prices pull back, it’s time to enter long positions. Pay attention and scale in—don’t put your entire position in at once. This is not the timing for an immediate pump.
For these two days, watch the 76,000 level. If price keeps coming down with volume and wick/sharp needle dips, it should move up in the following days. Ideally, the dip wicks slightly lower to grab some liquidity—then the momentum for the rise, the “fuel,” will be more than enough: $BTC
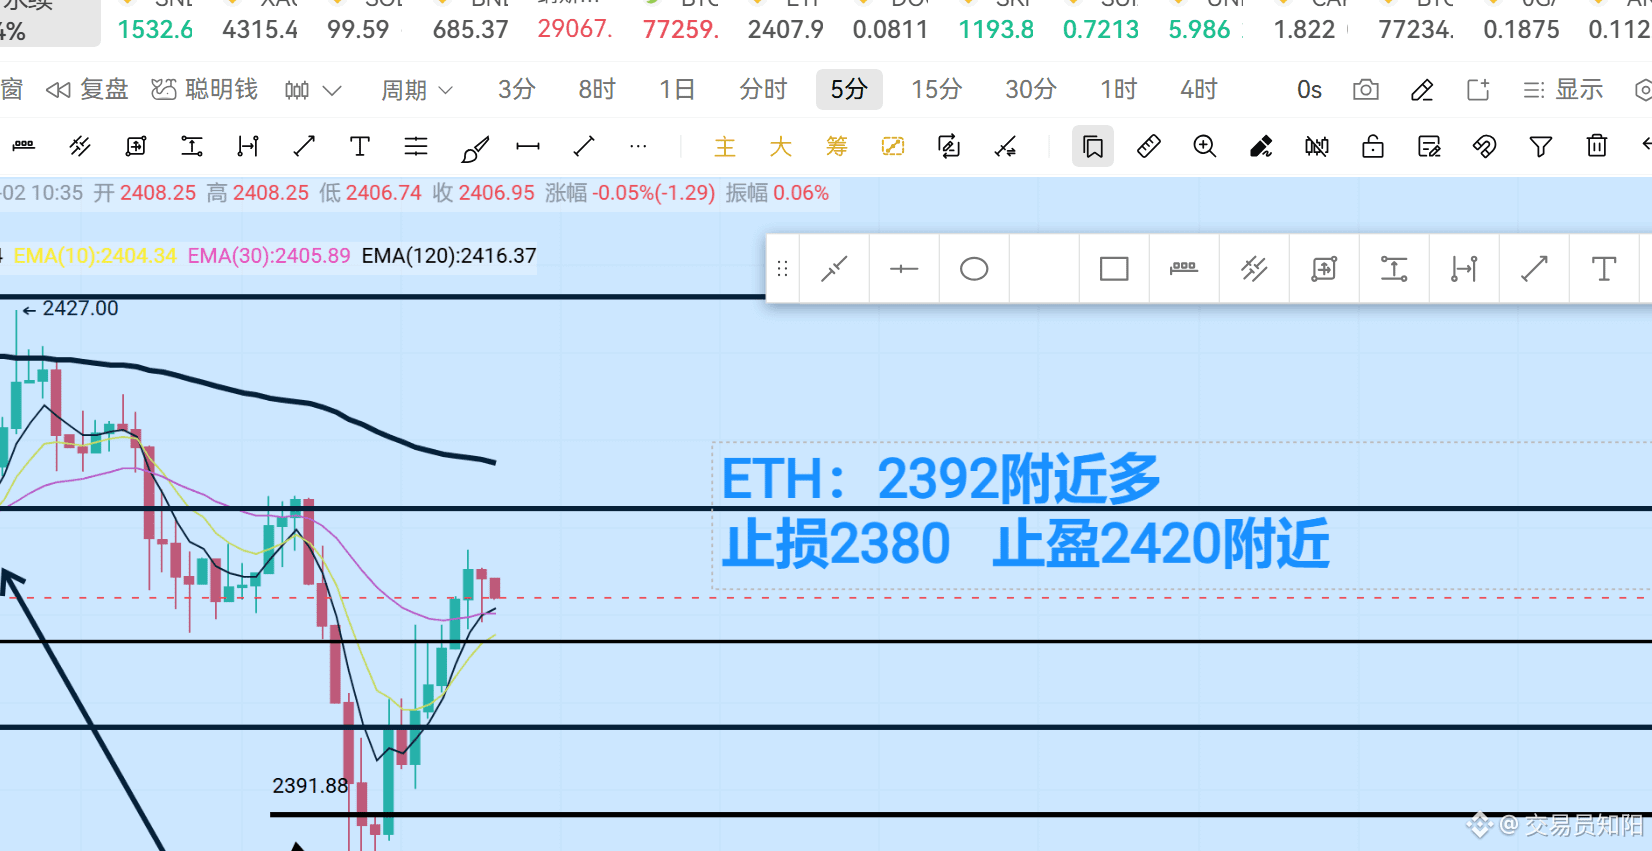
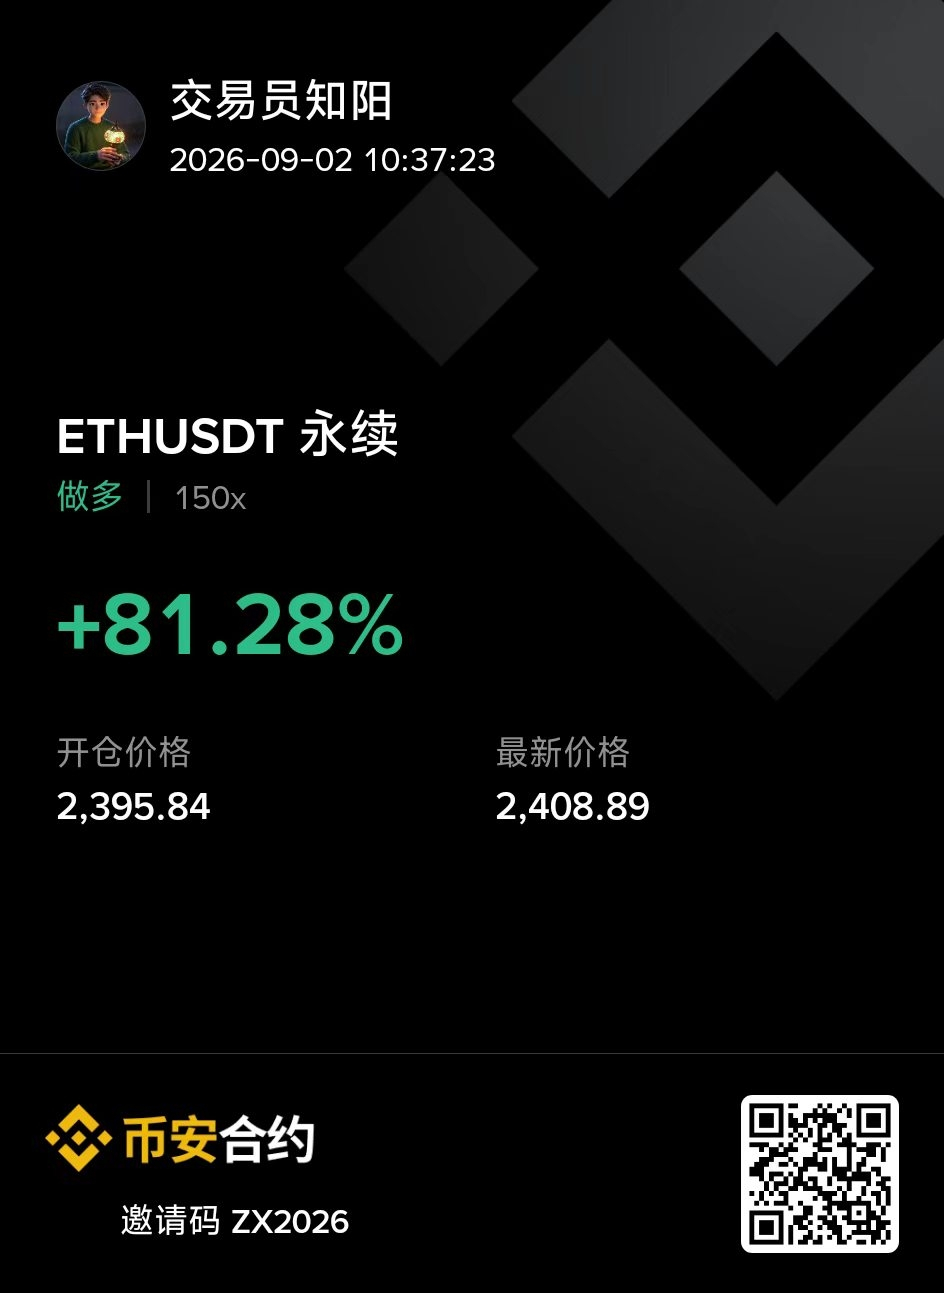
Morning Pre-Market: In the live room, we took one quick trade with the fans.
The pork knuckle rice has been banked.
Our ultra-short-term risk control is on point. Besides placing trades, it’s more about experiencing how to pick levels, build strategies, and manage risk.
The essence of trading is risk control. Every day at 7:30 AM sharp, we go live with naked K + price/volume + moving averages to conduct real-time market analysis.
$ETH
The pork knuckle rice has been banked.
Our ultra-short-term risk control is on point. Besides placing trades, it’s more about experiencing how to pick levels, build strategies, and manage risk.
The essence of trading is risk control. Every day at 7:30 AM sharp, we go live with naked K + price/volume + moving averages to conduct real-time market analysis.
$ETH
·
--
🎙️ Price and Volume (K-Line) + Volume-Price Analysis Techniques to Read Market Trends

End
02 h 59 m 53 s
307
0
What, you can’t do short-term trading?
Then you need to learn basic short-term market analysis (price action, volume and price, naked K charts, and trend lines).
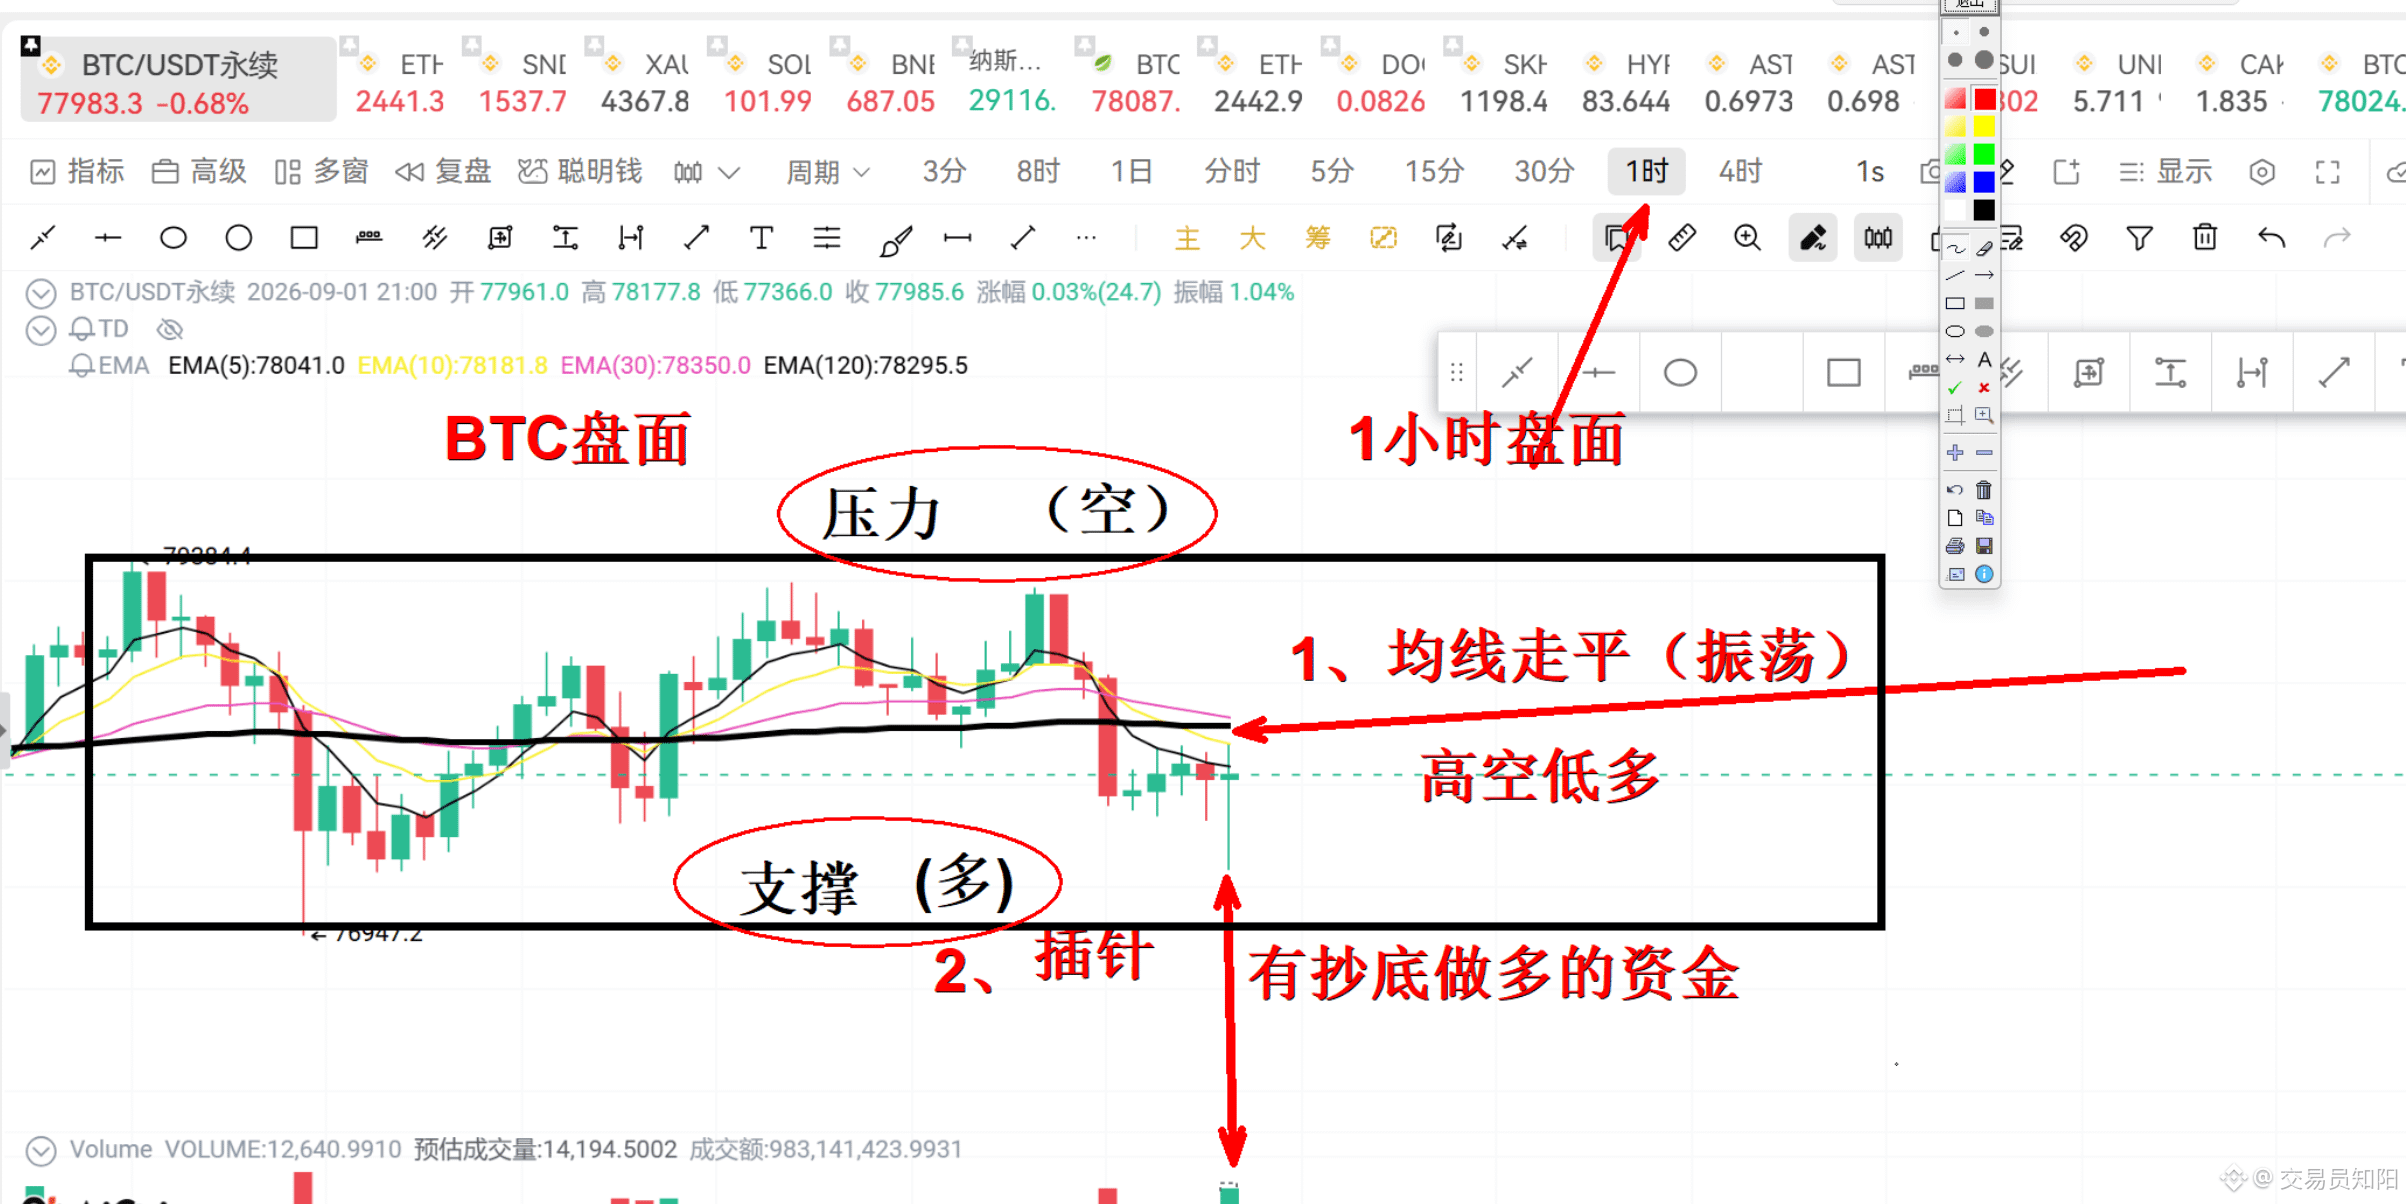
For BTC, I analyze from the 1-hour timeframe. By combining moving averages with price action, you can clearly understand the current market.
Moving averages show the trend. With the MA 120 line and the bull-bear line: when they are flat, it means the market right now is in a ranging/sideways (oscillating) phase. In that case, short at the highs and go long at the lows—on the short term, you can draw a range.
On the 1-hour timeframe, you can identify key levels by looking at the swing highs and lows—draw support and resistance lines to reference. Of course, you can’t judge long/short positions by looking at just one line; you must understand the market’s long/short dynamics by reading the order flow with volume and price.
For example, what I showed on my screen to explain: the candlesticks inside the black boxes are the range/oscillation—moving up and down. The top is resistance, and the bottom is support. When the price hits the lower area and forms a wick/pin bar there, it proves that bullish absorption is starting. If you still go short then, that’s wrong—you should look for an opportunity to go long. This is essential basic technical knowledge for executing trades from the short-term perspective.
Wishing everyone makes more USDT$BTC
Then you need to learn basic short-term market analysis (price action, volume and price, naked K charts, and trend lines).
For BTC, I analyze from the 1-hour timeframe. By combining moving averages with price action, you can clearly understand the current market.
Moving averages show the trend. With the MA 120 line and the bull-bear line: when they are flat, it means the market right now is in a ranging/sideways (oscillating) phase. In that case, short at the highs and go long at the lows—on the short term, you can draw a range.
On the 1-hour timeframe, you can identify key levels by looking at the swing highs and lows—draw support and resistance lines to reference. Of course, you can’t judge long/short positions by looking at just one line; you must understand the market’s long/short dynamics by reading the order flow with volume and price.
For example, what I showed on my screen to explain: the candlesticks inside the black boxes are the range/oscillation—moving up and down. The top is resistance, and the bottom is support. When the price hits the lower area and forms a wick/pin bar there, it proves that bullish absorption is starting. If you still go short then, that’s wrong—you should look for an opportunity to go long. This is essential basic technical knowledge for executing trades from the short-term perspective.
Wishing everyone makes more USDT$BTC
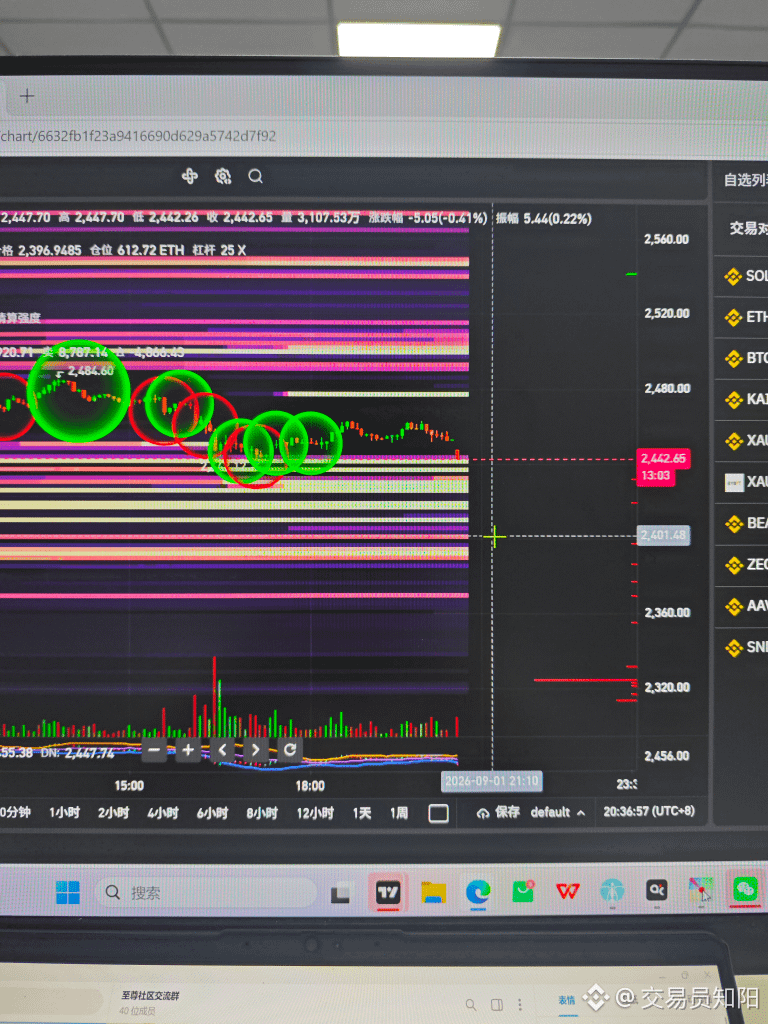
Ladies, check the chart quickly—short Ethereum; it’s going below 2400
$ETH
Open to see the Ethereum chart👇🏻 and go short
$ETH
Open to see the Ethereum chart👇🏻 and go short
Come watch, come watch, come watch!!!
Freshly cooked meat-eating strategy is here—BTC/ETH/SOL
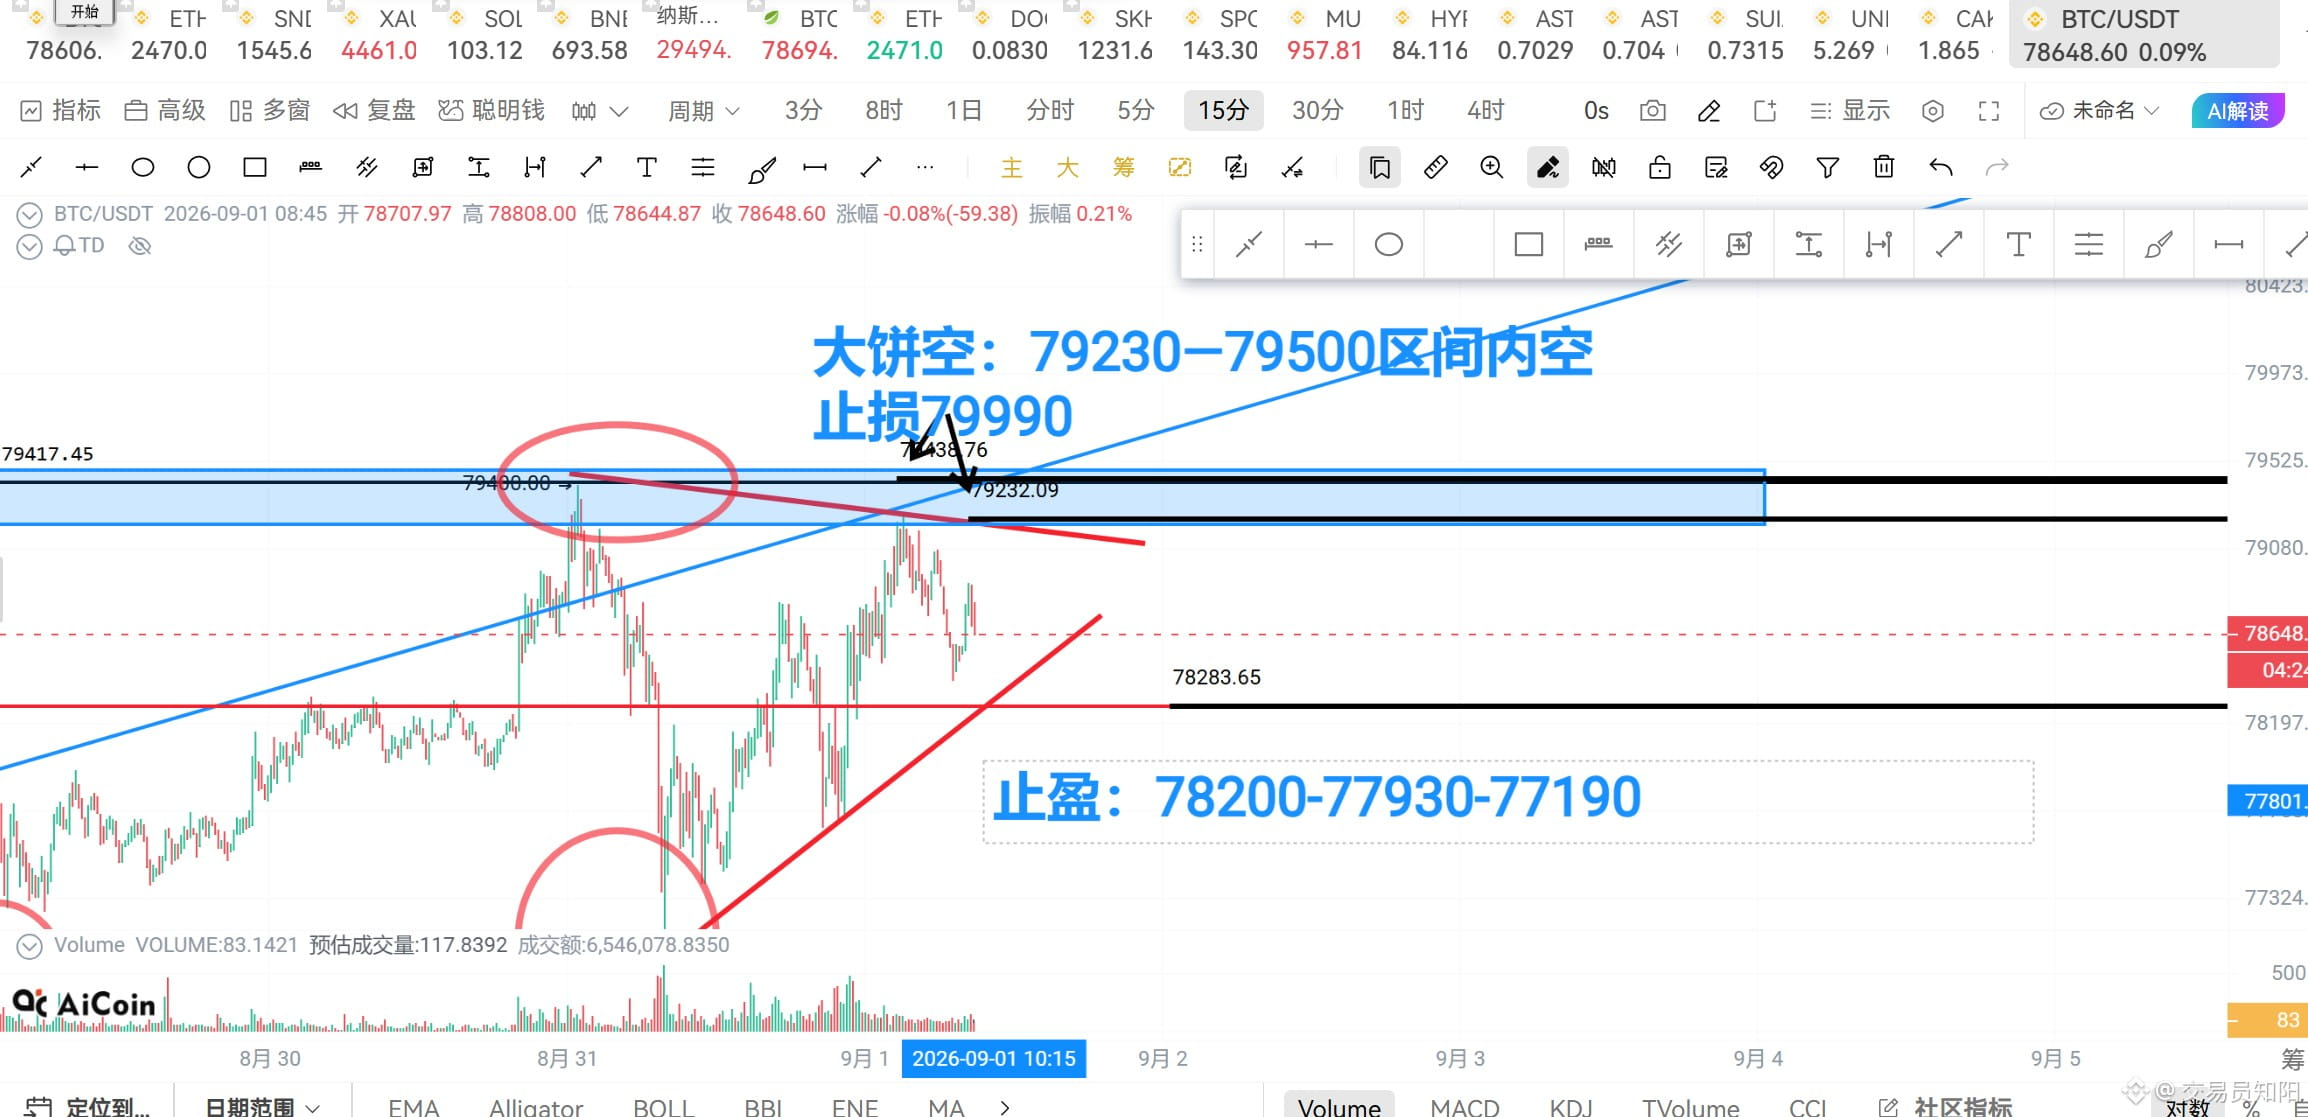
If it pumps in the morning, short it right away, babes—make sure your stop loss is set. Trade short-term and for swings. There are signs that the upward momentum is weakening. When else would you short the whole market if not now!
$BTC BTC short: short the 792~795 range (stop loss: 79990). Take profit: watch 78200-77930-77190-767 (final target points; you can move your stop to lock in profit).
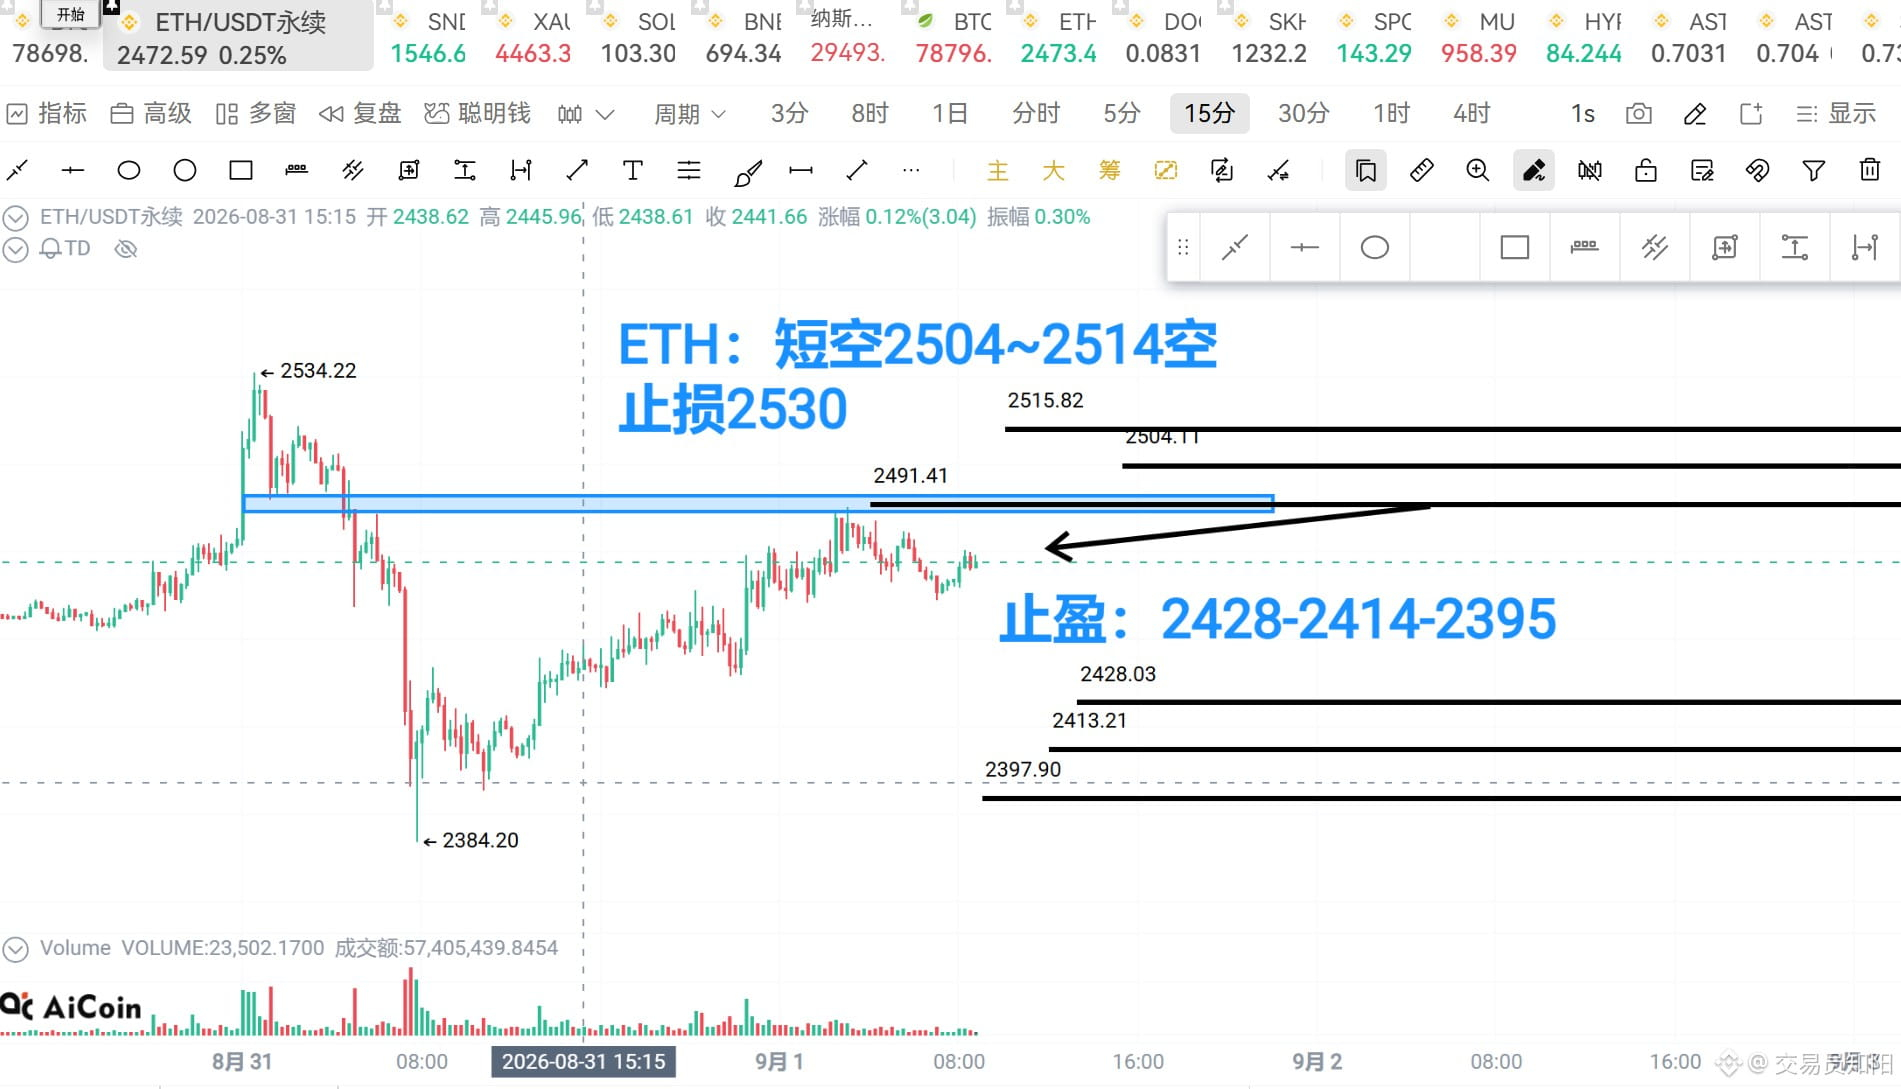
$ETH You can place staggered orders to short around 2495. You can start with the first position there; short around 2504-2514 (stop loss: 2530). Take profit: 2428-2414-2395.
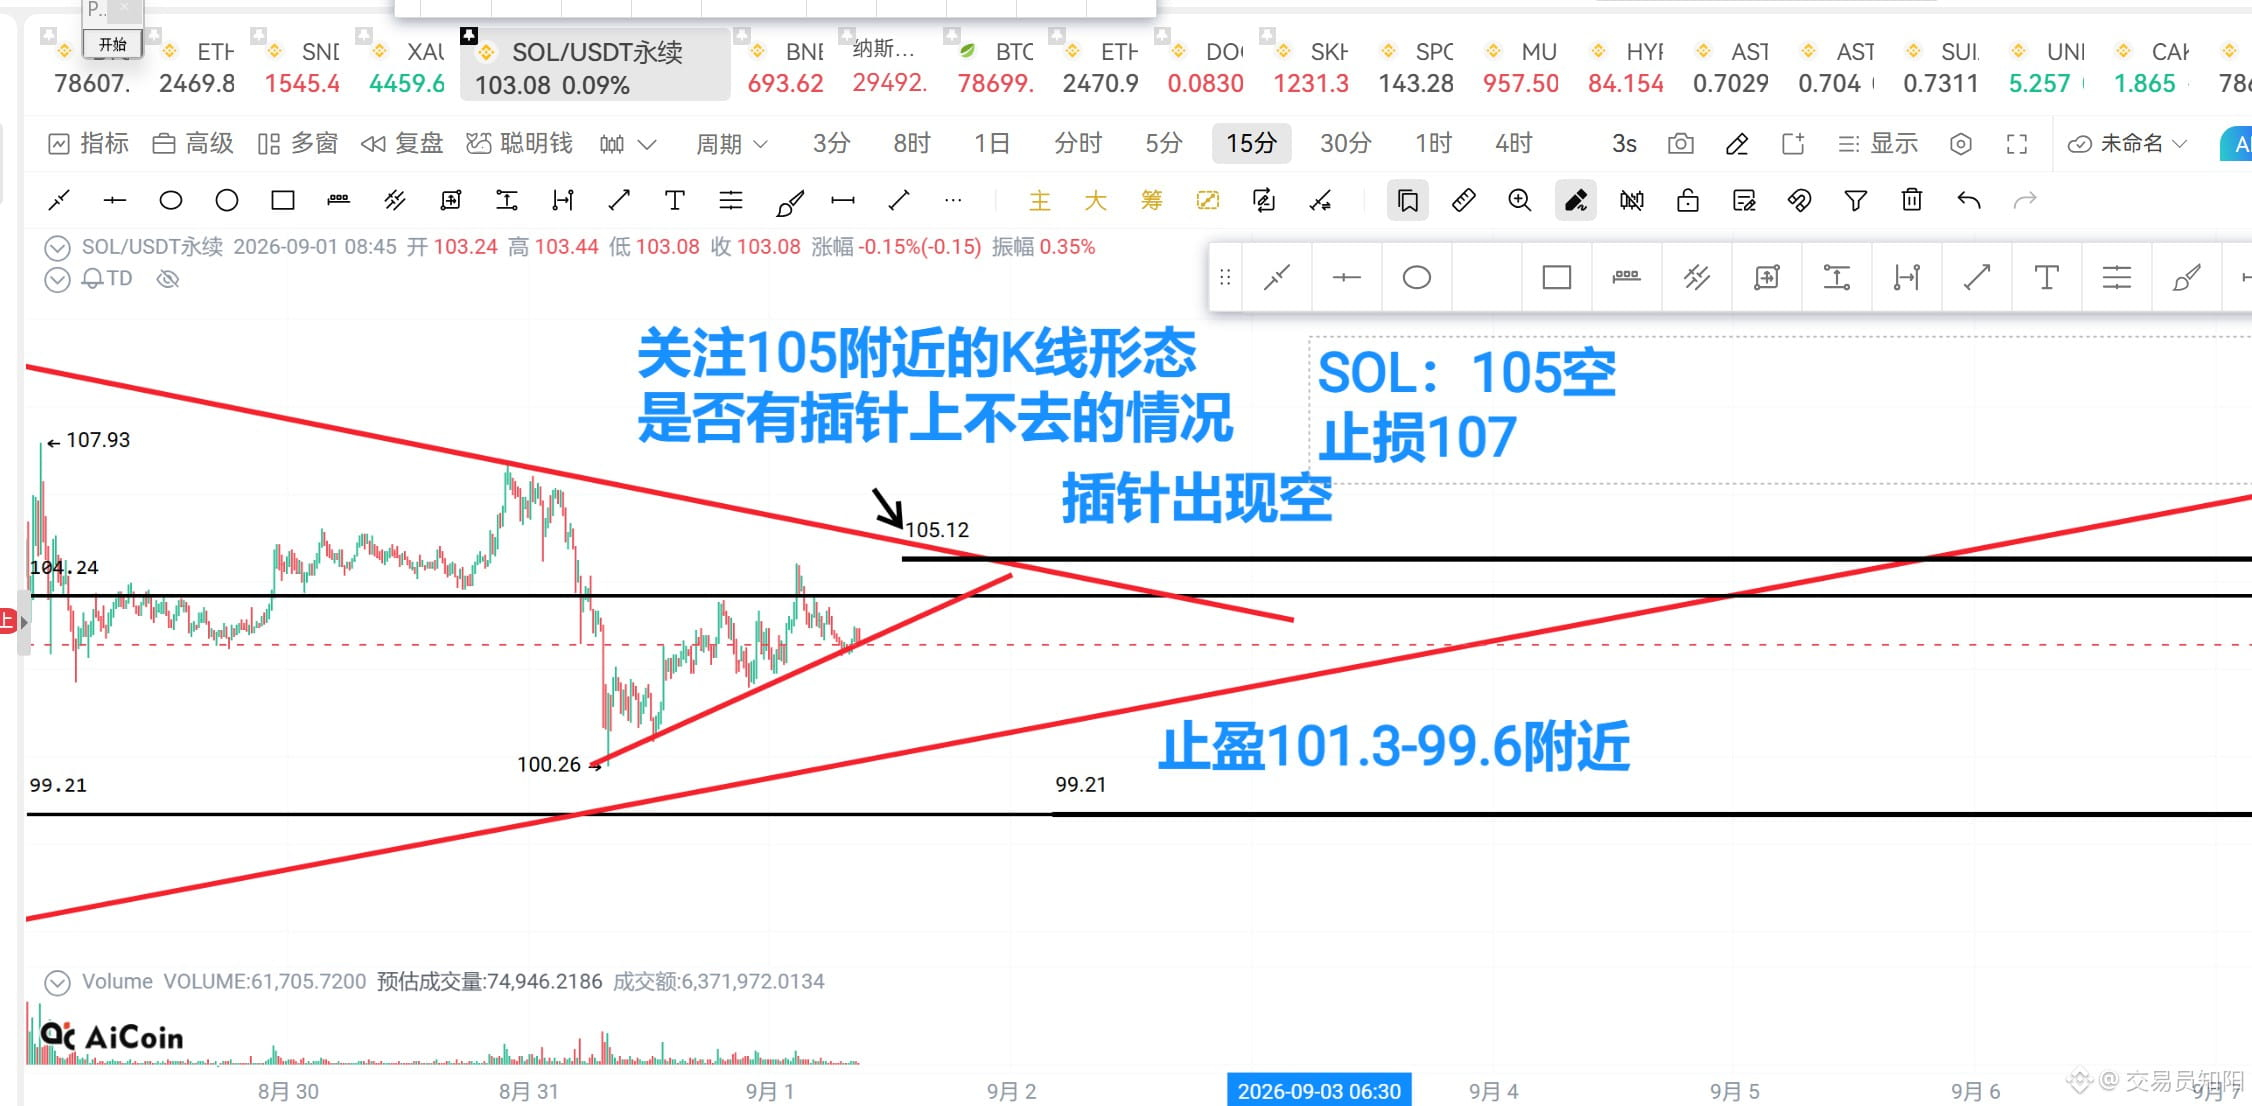
$SOL 105 Short around 105 and you can eat the 101-99.5 range. Short position (stop loss: 107).
Freshly cooked meat-eating strategy is here—BTC/ETH/SOL
If it pumps in the morning, short it right away, babes—make sure your stop loss is set. Trade short-term and for swings. There are signs that the upward momentum is weakening. When else would you short the whole market if not now!
$BTC BTC short: short the 792~795 range (stop loss: 79990). Take profit: watch 78200-77930-77190-767 (final target points; you can move your stop to lock in profit).
$ETH You can place staggered orders to short around 2495. You can start with the first position there; short around 2504-2514 (stop loss: 2530). Take profit: 2428-2414-2395.
$SOL 105 Short around 105 and you can eat the 101-99.5 range. Short position (stop loss: 107).

Log in to explore more content