
What, you can’t do short-term trading?
Then you need to learn basic short-term market analysis (price action, volume and price, naked K charts, and trend lines).
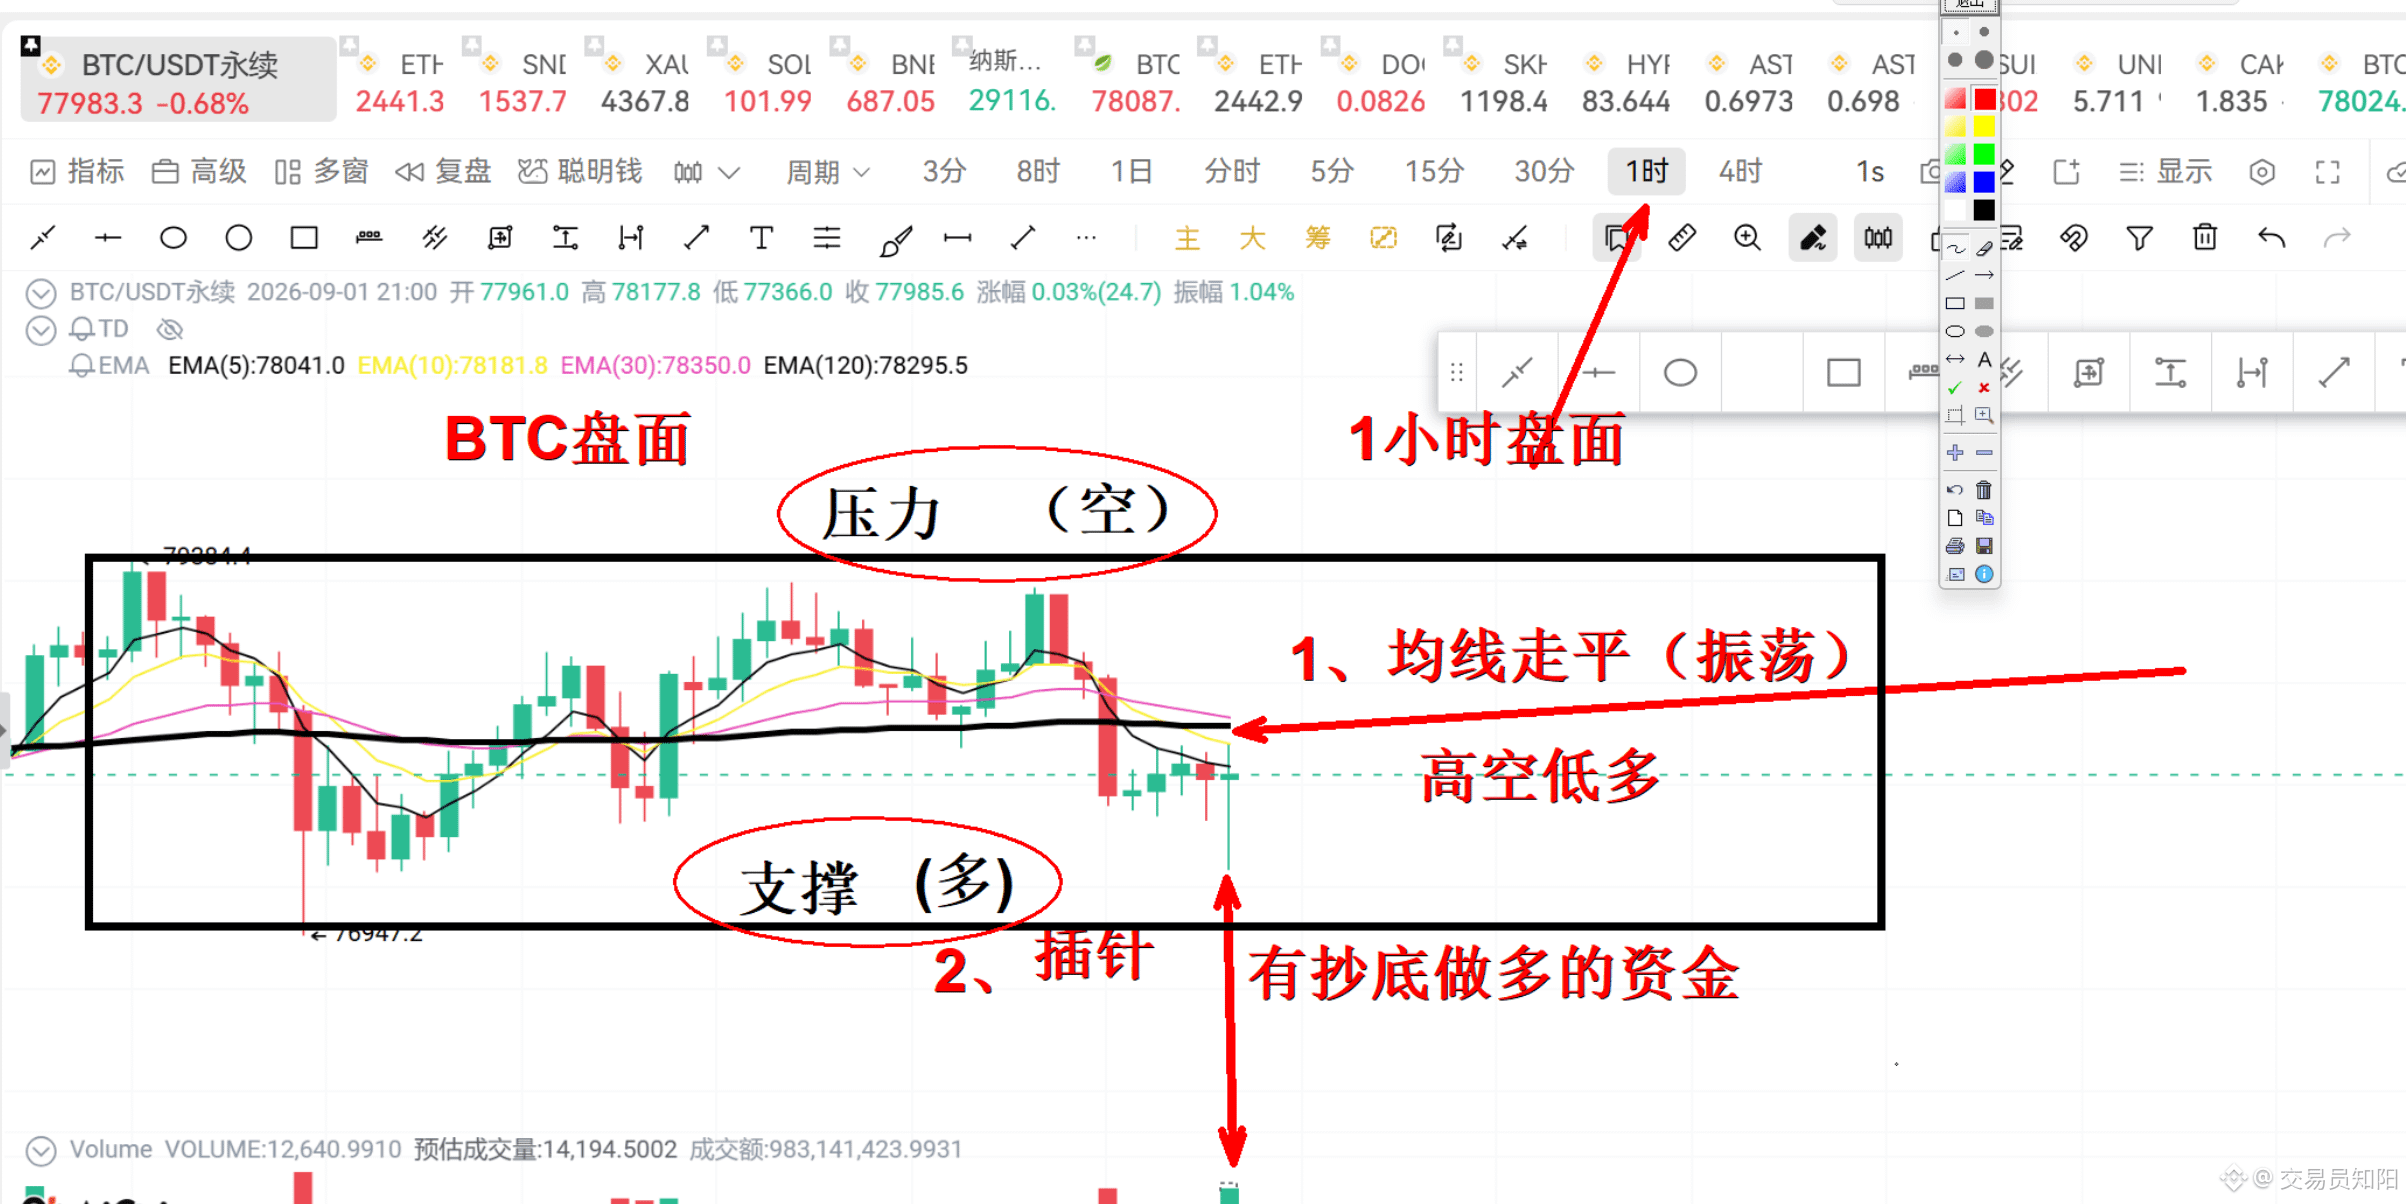
For BTC, I analyze from the 1-hour timeframe. By combining moving averages with price action, you can clearly understand the current market.
Moving averages show the trend. With the MA 120 line and the bull-bear line: when they are flat, it means the market right now is in a ranging/sideways (oscillating) phase. In that case, short at the highs and go long at the lows—on the short term, you can draw a range.
On the 1-hour timeframe, you can identify key levels by looking at the swing highs and lows—draw support and resistance lines to reference. Of course, you can’t judge long/short positions by looking at just one line; you must understand the market’s long/short dynamics by reading the order flow with volume and price.
For example, what I showed on my screen to explain: the candlesticks inside the black boxes are the range/oscillation—moving up and down. The top is resistance, and the bottom is support. When the price hits the lower area and forms a wick/pin bar there, it proves that bullish absorption is starting. If you still go short then, that’s wrong—you should look for an opportunity to go long. This is essential basic technical knowledge for executing trades from the short-term perspective.
Wishing everyone makes more USDT$BTC
Then you need to learn basic short-term market analysis (price action, volume and price, naked K charts, and trend lines).
For BTC, I analyze from the 1-hour timeframe. By combining moving averages with price action, you can clearly understand the current market.
Moving averages show the trend. With the MA 120 line and the bull-bear line: when they are flat, it means the market right now is in a ranging/sideways (oscillating) phase. In that case, short at the highs and go long at the lows—on the short term, you can draw a range.
On the 1-hour timeframe, you can identify key levels by looking at the swing highs and lows—draw support and resistance lines to reference. Of course, you can’t judge long/short positions by looking at just one line; you must understand the market’s long/short dynamics by reading the order flow with volume and price.
For example, what I showed on my screen to explain: the candlesticks inside the black boxes are the range/oscillation—moving up and down. The top is resistance, and the bottom is support. When the price hits the lower area and forms a wick/pin bar there, it proves that bullish absorption is starting. If you still go short then, that’s wrong—you should look for an opportunity to go long. This is essential basic technical knowledge for executing trades from the short-term perspective.
Wishing everyone makes more USDT$BTC