
Bluechip
8.6k Posts

Bluechip
 Square Verified+
Report
Block User
Frequent Trader
5.6 Years
24 Following
67.1K+ Followers
93.5K+ Liked
Posts
All
Quotes
Videos
Live
PINNED
·
--
Bullish
🚨 THE ALPHA BOARD – FOUNDERS ACCESS 🚨
After multiple requests from some followers, I’ve decided to open something private.
What I share publicly is only a fraction of the full picture.
The market is a game of liquidity, timing, and understanding.
Most people always arrive… too late.
Today, I’m officially opening The Alpha Board, a private group built for those who want to see the move before it happens, not after.
Inside, you’ll get:
• Advanced market analysis ($BTC , Stocks, macro)
• Key liquidity zones & forward scenarios
• Smart money flow breakdowns
• Clear market structure insights
• Direct access + a serious community
This is NOT a signals group.
This is where you build a real edge.
If you’re tired of:
- following the crowd
- entering too late
- not understanding why the market moves
Then this is exactly for you.
Founder one-time access: $39
Limited spots available
Scan the QR code or click on the link to join instantly
This post will be auto-deleted in 15 days
The market doesn’t reward the fastest.
It rewards the most prepared.
[The Alpha Board link](https://app.binance.com/uni-qr/group-chat-landing?channelToken=uxZ207Vrh6cPhZPhAovsaQ&type=1&entrySource=sharing_link)
#BTC #crypto #trading #smartmoney #BinanceSquare
🚨 THE ALPHA BOARD – FOUNDERS ACCESS 🚨
After multiple requests from some followers, I’ve decided to open something private.
What I share publicly is only a fraction of the full picture.
The market is a game of liquidity, timing, and understanding.
Most people always arrive… too late.
Today, I’m officially opening The Alpha Board, a private group built for those who want to see the move before it happens, not after.
Inside, you’ll get:
• Advanced market analysis ($BTC , Stocks, macro)
• Key liquidity zones & forward scenarios
• Smart money flow breakdowns
• Clear market structure insights
• Direct access + a serious community
This is NOT a signals group.
This is where you build a real edge.
If you’re tired of:
- following the crowd
- entering too late
- not understanding why the market moves
Then this is exactly for you.
Founder one-time access: $39
Limited spots available
Scan the QR code or click on the link to join instantly
This post will be auto-deleted in 15 days
The market doesn’t reward the fastest.
It rewards the most prepared.
The Alpha Board link
#BTC #crypto #trading #smartmoney #BinanceSquare
After multiple requests from some followers, I’ve decided to open something private.
What I share publicly is only a fraction of the full picture.
The market is a game of liquidity, timing, and understanding.
Most people always arrive… too late.
Today, I’m officially opening The Alpha Board, a private group built for those who want to see the move before it happens, not after.
Inside, you’ll get:
• Advanced market analysis ($BTC , Stocks, macro)
• Key liquidity zones & forward scenarios
• Smart money flow breakdowns
• Clear market structure insights
• Direct access + a serious community
This is NOT a signals group.
This is where you build a real edge.
If you’re tired of:
- following the crowd
- entering too late
- not understanding why the market moves
Then this is exactly for you.
Founder one-time access: $39
Limited spots available
Scan the QR code or click on the link to join instantly
This post will be auto-deleted in 15 days
The market doesn’t reward the fastest.
It rewards the most prepared.
The Alpha Board link
#BTC #crypto #trading #smartmoney #BinanceSquare

64
27
2.8k
PINNED
·
--
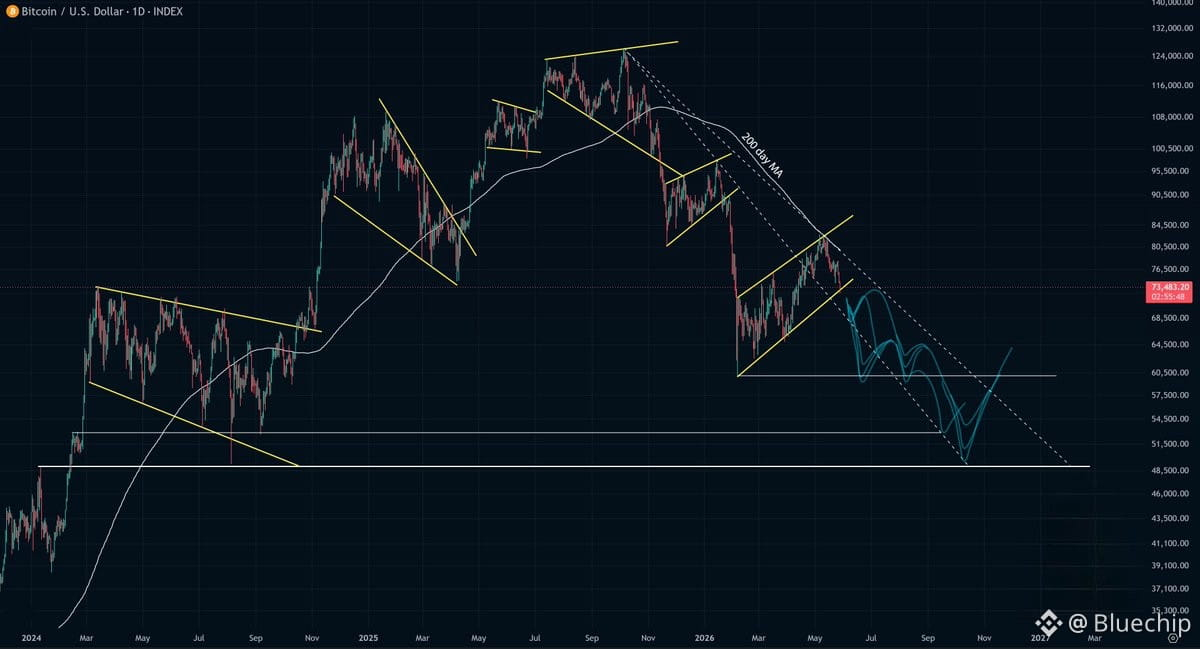
$BTC squiggles
Here's a rough visualization of how I see the most likely scenarios playing out. If you average them, you'll get a feel for the broad concept I have. I can absolutely be wrong, but it's my take on things currently.
Note that I give the diagonal (dotted) trend lines some importance in controlling the price movements as well as the horizontal support levels.
This falls in alignment with my other post on the odds I give these Bitcoin scenarios.
{future}(BTCUSDT)
$BTC squiggles
Here's a rough visualization of how I see the most likely scenarios playing out. If you average them, you'll get a feel for the broad concept I have. I can absolutely be wrong, but it's my take on things currently.
Note that I give the diagonal (dotted) trend lines some importance in controlling the price movements as well as the horizontal support levels.
This falls in alignment with my other post on the odds I give these Bitcoin scenarios.
Here's a rough visualization of how I see the most likely scenarios playing out. If you average them, you'll get a feel for the broad concept I have. I can absolutely be wrong, but it's my take on things currently.
Note that I give the diagonal (dotted) trend lines some importance in controlling the price movements as well as the horizontal support levels.
This falls in alignment with my other post on the odds I give these Bitcoin scenarios.
23
7
92
99.6k
·
--
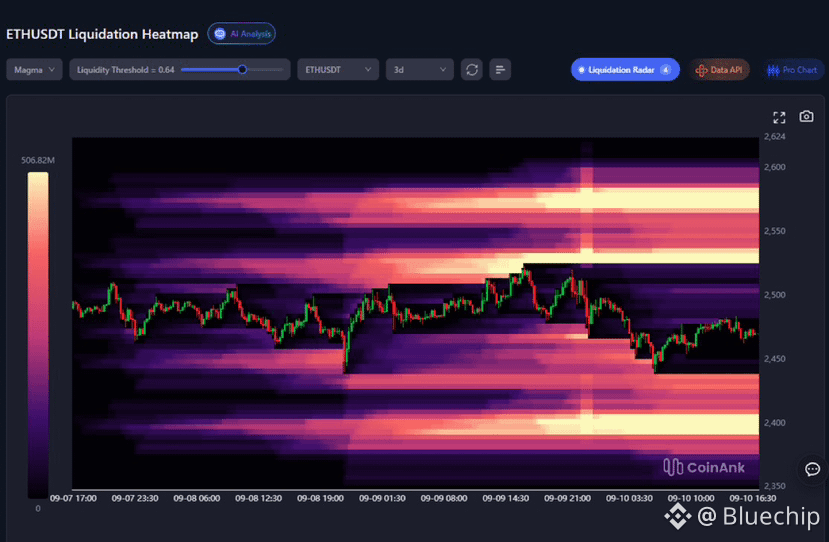
$ETH Liquidation Heatmap
ETH is boxed between two high-intensity liquidity bands.
The 3-day heatmap shows:
Overhead: a bright short-liquidation cluster around $2,530 – $2,540, with more leverage stacked toward $2,580 – $2,600
Below: a dense long-liquidation pocket near $2,410 – $2,420
Price dipped into the lower zone, bounced, and is now holding mid-range. The $2,530 band has not been cleared.
{future}(ETHUSDT)
$ETH Liquidation Heatmap
ETH is boxed between two high-intensity liquidity bands.
The 3-day heatmap shows:
Overhead: a bright short-liquidation cluster around $2,530 – $2,540, with more leverage stacked toward $2,580 – $2,600
Below: a dense long-liquidation pocket near $2,410 – $2,420
Price dipped into the lower zone, bounced, and is now holding mid-range. The $2,530 band has not been cleared.
ETH is boxed between two high-intensity liquidity bands.
The 3-day heatmap shows:
Overhead: a bright short-liquidation cluster around $2,530 – $2,540, with more leverage stacked toward $2,580 – $2,600
Below: a dense long-liquidation pocket near $2,410 – $2,420
Price dipped into the lower zone, bounced, and is now holding mid-range. The $2,530 band has not been cleared.
1
674
·
--
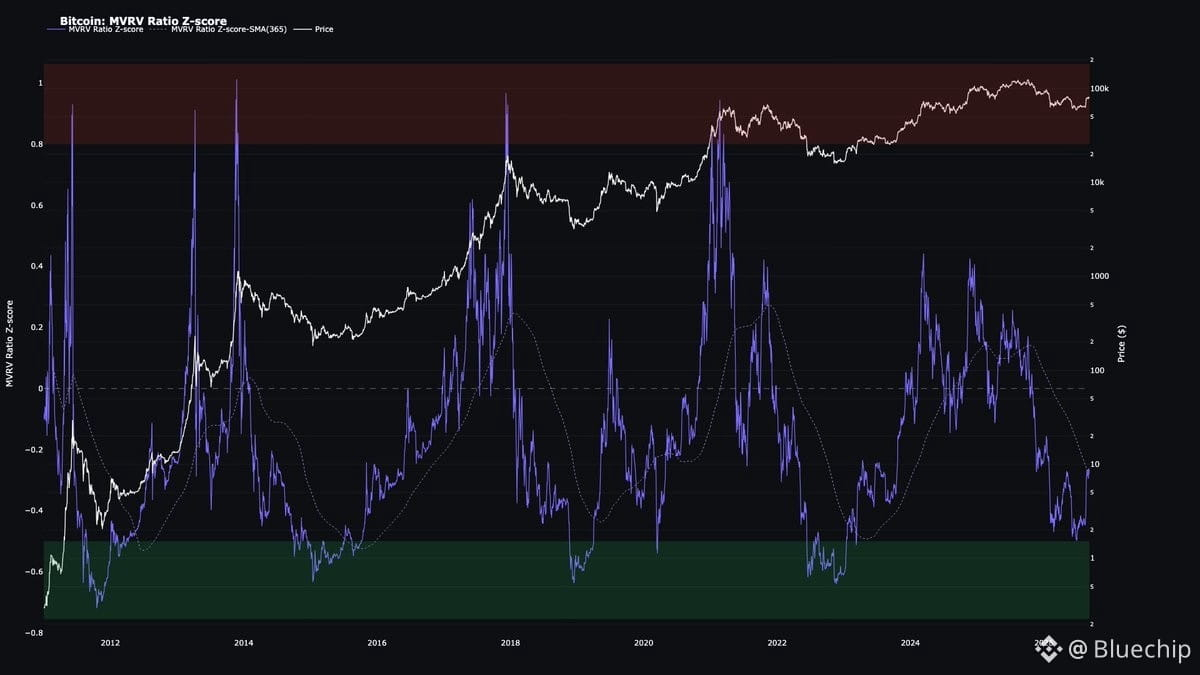
$BTC is at a key inflection point
The MVRV Z-Score is testing its 365-day moving average.
In 2015, 2019, and 2023, reclaiming this level marked the transition from a bear market into a new bull market.
A close above could be a major signal.
{future}(BTCUSDT)
$BTC is at a key inflection point
The MVRV Z-Score is testing its 365-day moving average.
In 2015, 2019, and 2023, reclaiming this level marked the transition from a bear market into a new bull market.
A close above could be a major signal.
The MVRV Z-Score is testing its 365-day moving average.
In 2015, 2019, and 2023, reclaiming this level marked the transition from a bear market into a new bull market.
A close above could be a major signal.
3
647
·
--
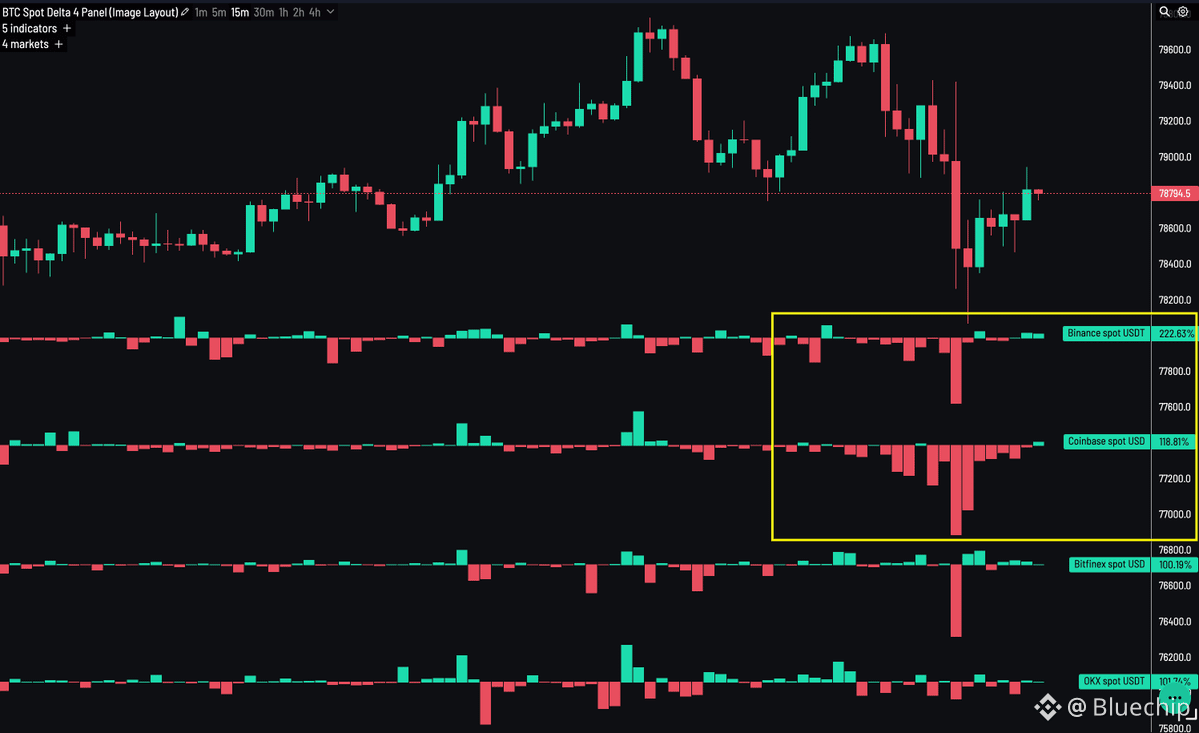
$BTC Spot selling pressure remains strong.
Negative Spot Delta is especially noticeable on Coinbase and Binance. Until we see fresh and sustained spot inflows, I don’t expect any lasting strength in the market.
The market may remain weak until spot demand returns.
{future}(BTCUSDT)
$BTC Spot selling pressure remains strong.
Negative Spot Delta is especially noticeable on Coinbase and Binance. Until we see fresh and sustained spot inflows, I don’t expect any lasting strength in the market.
The market may remain weak until spot demand returns.
Negative Spot Delta is especially noticeable on Coinbase and Binance. Until we see fresh and sustained spot inflows, I don’t expect any lasting strength in the market.
The market may remain weak until spot demand returns.
4
733
·
--
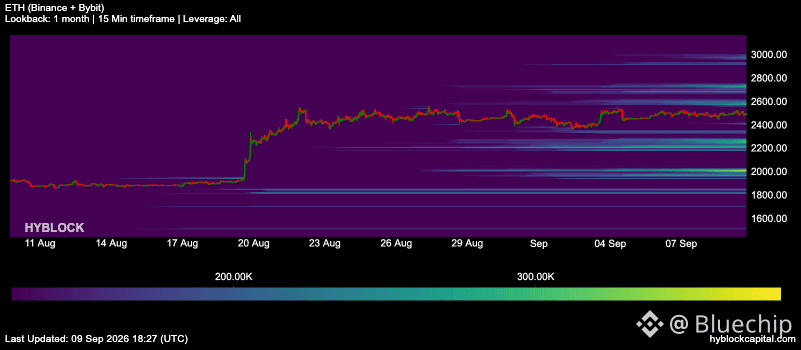
20 Days of Ranging 👀
$ETH has been moving sideways around $2,500, while liquidity keeps building on both sides.
* Above price: $2,700, $2,800, $3,000
* Below price: $2,300, $2,200, $2,000
Hectic price action soon!
{future}(ETHUSDT)
20 Days of Ranging 👀
$ETH has been moving sideways around $2,500, while liquidity keeps building on both sides.
* Above price: $2,700, $2,800, $3,000
* Below price: $2,300, $2,200, $2,000
Hectic price action soon!
$ETH has been moving sideways around $2,500, while liquidity keeps building on both sides.
* Above price: $2,700, $2,800, $3,000
* Below price: $2,300, $2,200, $2,000
Hectic price action soon!
1
8
2k
·
--
$BTC
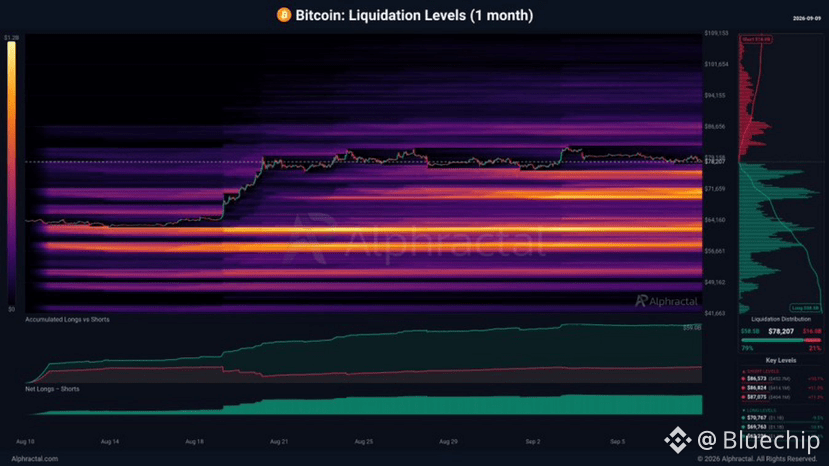
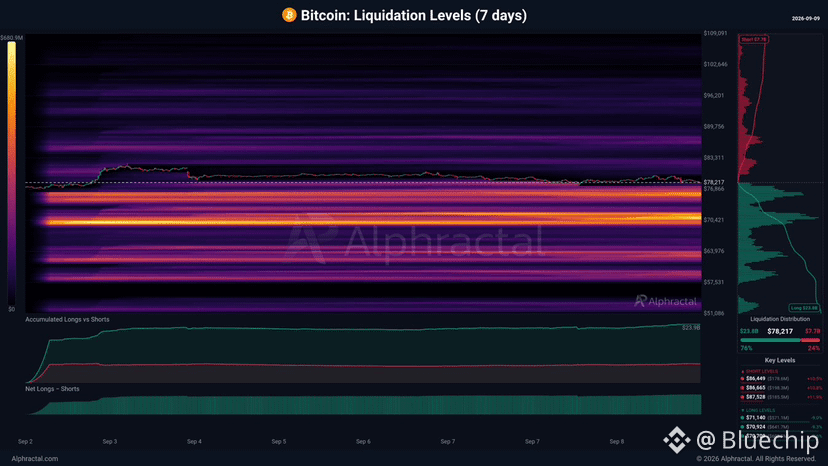
Good chances that bulls will come under pressure. That’s what the exchange data is showing.
{future}(BTCUSDT)
$BTC
Good chances that bulls will come under pressure. That’s what the exchange data is showing.
Good chances that bulls will come under pressure. That’s what the exchange data is showing.
7
1.7k
·
--
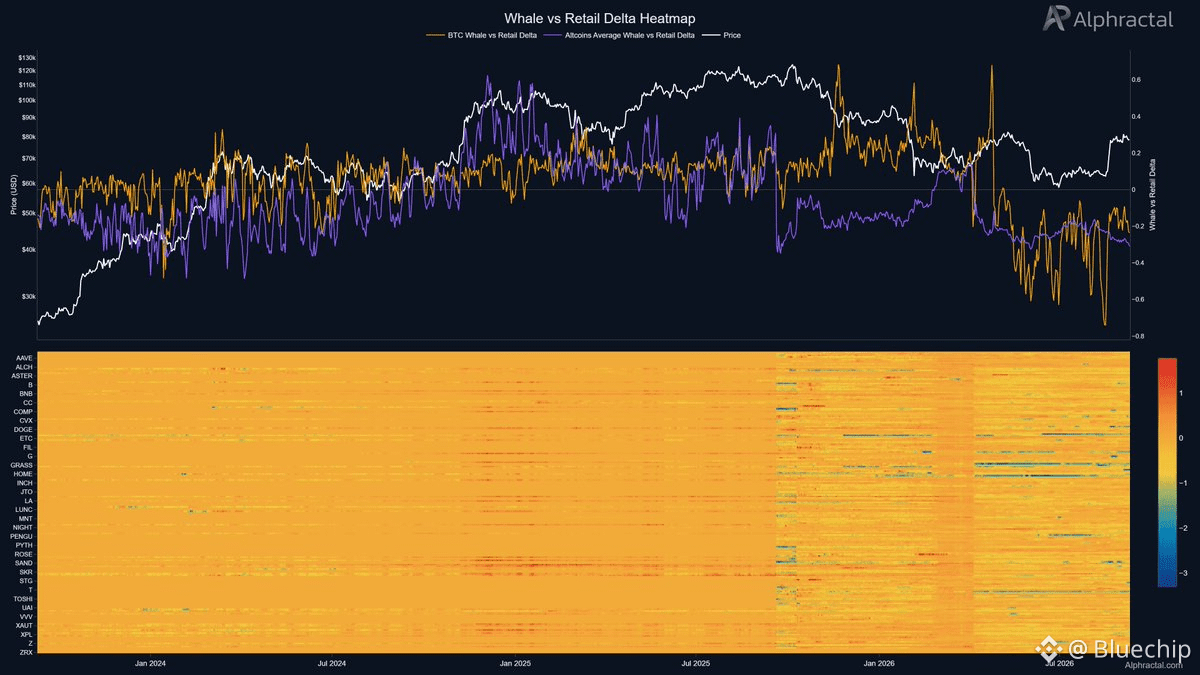
$BTC retail is more bullish than the whales right now. That's usually a warning, not confirmation. ⚠️
Whale vs Retail Ratio: 0.82
Benchmark is 1.0, not zero. Below 1.0 means retail is positioned more aggressively long than whales.
This doesn't mean whales are short - just that they're less bullish than the crowd right now.
Retail is out front. Whales haven't shown up to confirm it.
Neutral, leaning cautious. Whale hesitation + retail leverage is a shaky combo if broader participation doesn't show up.
What's your read on this gap?
{future}(BTCUSDT)
$BTC retail is more bullish than the whales right now. That's usually a warning, not confirmation. ⚠️
Whale vs Retail Ratio: 0.82
Benchmark is 1.0, not zero. Below 1.0 means retail is positioned more aggressively long than whales.
This doesn't mean whales are short - just that they're less bullish than the crowd right now.
Retail is out front. Whales haven't shown up to confirm it.
Neutral, leaning cautious. Whale hesitation + retail leverage is a shaky combo if broader participation doesn't show up.
What's your read on this gap?
Whale vs Retail Ratio: 0.82
Benchmark is 1.0, not zero. Below 1.0 means retail is positioned more aggressively long than whales.
This doesn't mean whales are short - just that they're less bullish than the crowd right now.
Retail is out front. Whales haven't shown up to confirm it.
Neutral, leaning cautious. Whale hesitation + retail leverage is a shaky combo if broader participation doesn't show up.
What's your read on this gap?
2
1
11
2.1k
·
--
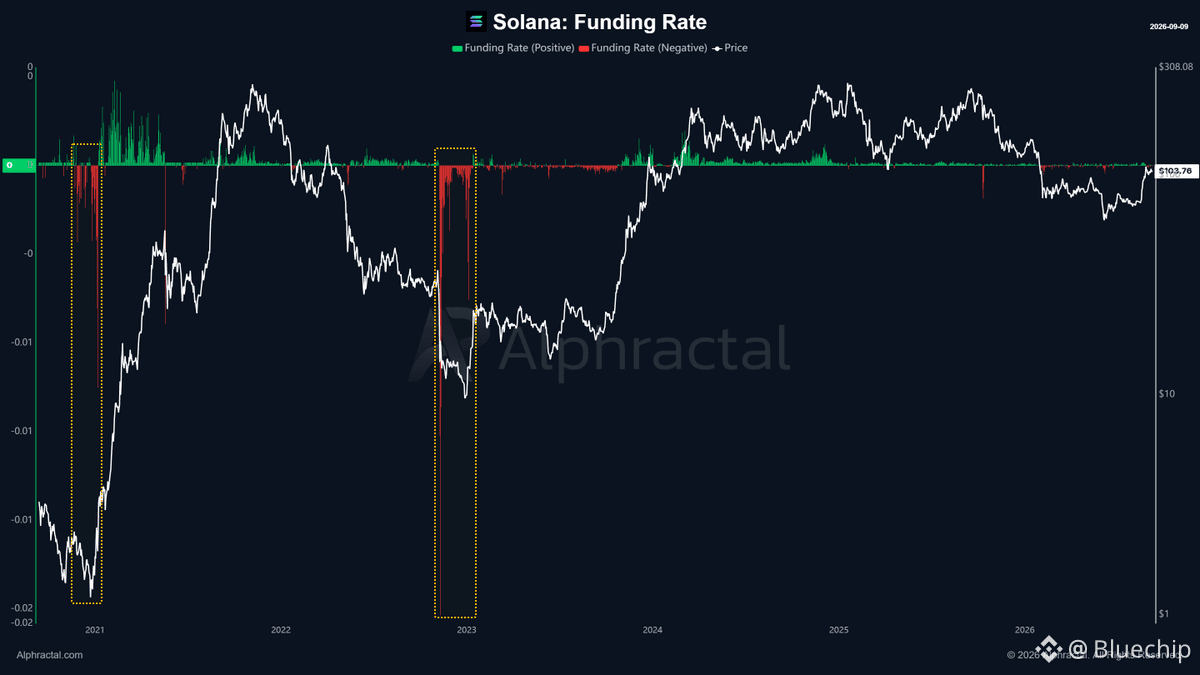
In the past, Solana only bottomed when Funding Rates across several exchanges were deeply negative.
Is this time different?
{future}(SOLUSDT)
In the past, Solana only bottomed when Funding Rates across several exchanges were deeply negative.
Is this time different?
Is this time different?
8
2k
·
--
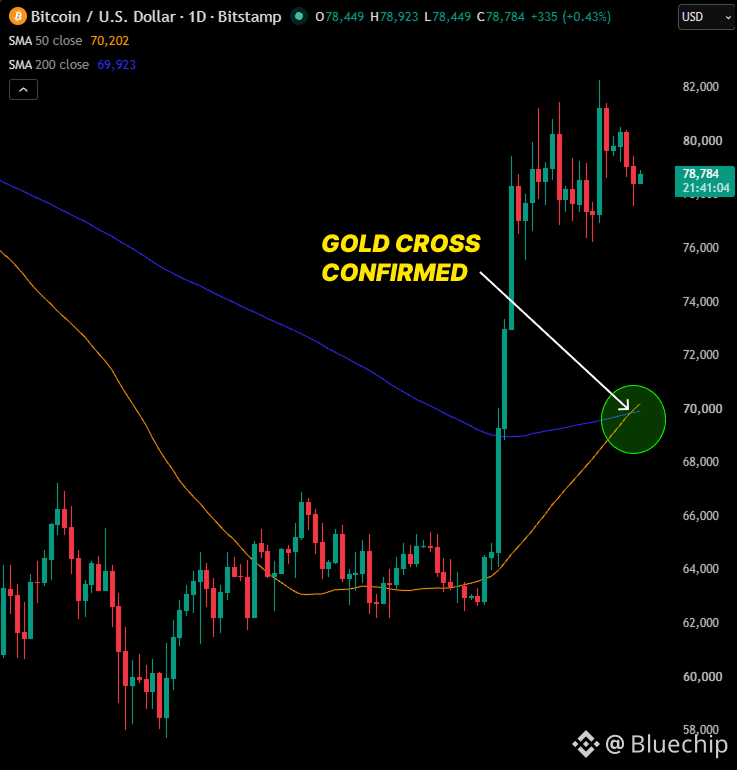
🚨$BTC 's golden cross has officially confirmed for the first time since November 2025.
Its 50-day average has crossed above the 200-day after spending nearly 280 days below this signal.
The last three completed golden crosses sent Bitcoin up 50%, 45% and 60%.
This time it's backed by $3.8 BILLION in ETF inflows over the last three weeks, the strongest stretch of 2026.
{future}(BTCUSDT)
🚨$BTC 's golden cross has officially confirmed for the first time since November 2025.
Its 50-day average has crossed above the 200-day after spending nearly 280 days below this signal.
The last three completed golden crosses sent Bitcoin up 50%, 45% and 60%.
This time it's backed by $3.8 BILLION in ETF inflows over the last three weeks, the strongest stretch of 2026.
Its 50-day average has crossed above the 200-day after spending nearly 280 days below this signal.
The last three completed golden crosses sent Bitcoin up 50%, 45% and 60%.
This time it's backed by $3.8 BILLION in ETF inflows over the last three weeks, the strongest stretch of 2026.
1
12
2.7k
·
--
Article
Crypto Market WeeklyInfrastructure Up, $BTC Flat
Hey everyone, and welcome to the Weekly Market.
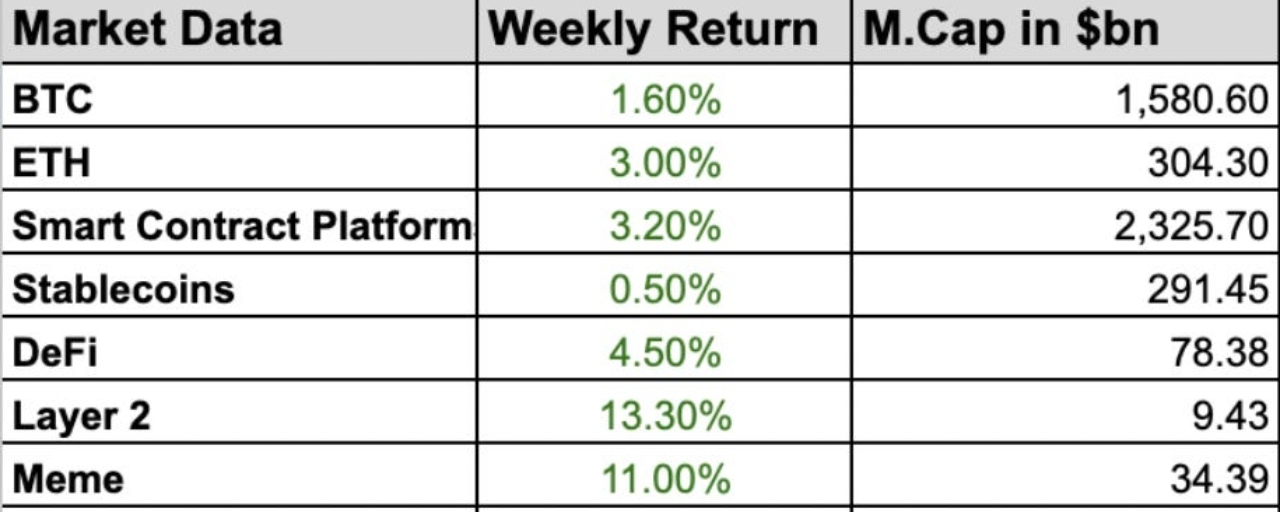
Last week Bitcoin was pushed around by three sentences and one jobs number, and ended almost exactly where it started. It fell below $77,000 on Wednesday, bounced above $81,000 on Thursday after Governor Waller opened the door to a September hold, then slipped below $80,000 within minutes of Friday’s payrolls print. It closed around $79,785, up roughly 2% for the week, and remains around the same level Wednesday morning as the first enlarged Treasury buyback operation gets underway. Ether followed the same path and sits near $2,494.
Bitcoin is still roughly 37% below its October 2025 peak of $126,198, with $81,000 rejected twice now.
But two things underneath the price matter more than the weekly candle.
First, flows looked much healthier than the chart. August was the best month for US spot Bitcoin ETFs since September 2025, Thursday saw the largest single-day ETF inflow since January, and on-chain data shows large wallets accumulating while smaller holders sold.
Second and this is the part that could still matter in 2027 : crypto spent the week exporting its market structure rather than selling another coin. South Korea laid out a plan to move its securities market onto blockchain rails, while Coinbase, Kalshi, Binance, Bybit and Polymarket pushed perpetuals into oil, single stocks and gold.
Bitcoin barely reacted to any of it.
In this issue, I’ll break down what actually drove the movement, how macro catalysts are compressing into a high-impact window, what on-chain flows are revealing about holder behaviour, and where structural momentum may emerge next.
Let’s get into it.
1. Sector Performance & Key Developments
South Korea’s Financial Services Commission published a three-stage plan to tokenise all types of securities, with the enabling law taking effect on 4 February 2027. Reports indicate the FSC and the Korea Securities Depository intend to build on Avalanche.Coinbase filed a Form 1-N and a Form BD-N with the SEC to offer single-stock perpetual futures to US traders. Shares rose about 10% on the news. Separately, it appointed Anthony Armstrong, formerly CFO across xAI and X Corp, to its board, and disclosed that 88% of net revenue now comes from sources other than Bitcoin spot trading.Kalshi is preparing a CFTC filing for a never-expiring WTI crude perpetual, which would be the first of its kind. Its Bitcoin perpetual, approved in May, has traded roughly $16.1 billion notional since.The CFTC moved to dismiss CME’s lawsuit against Kalshi’s Bitcoin perpetuals, calling it “much ado about nothing” and arguing that CME’s injury is “entirely self-inflicted” because it is free to list perpetuals itself. CME’s opposition is due 2 October.Binance added physically settled options on more than 1,000 US stocks and ETFs. Its traditional-finance perpetual volume hit about $433.4 billion in August, roughly 15 times January’s $29.5 billion, with equity-linked perps making up 79% of that.Bybit launches 24/7 options on stock perpetuals on 17 September, starting with SpaceX and Nvidia. Polymarket launched Perps with up to 20x leverage across crypto, equities, commodities and indices.The OCC granted Revolut preliminary conditional approval to establish Revolut Bank US in Stamford, Connecticut, with crypto custody limited to a non-fiduciary capacity through its UK affiliate. Revolut targets a 2027 opening.SoFi and Payward (Kraken’s parent) agreed to link SoFi’s real-time settlement network to Kraken’s trading infrastructure, with SoFiUSD listing on Kraken and 24/7 dollar settlement for institutional clients. Hyperliquid is reportedly in talks with Payward about entering the US.Strategy bought 4,603 BTC for about $369.7 million at an average of $80,318, taking holdings to 845,050 BTC. CEO Phong Le confirmed the company sold roughly 7,000 BTC at $60,000 to $65,000 during its ten-week pause to fund preferred dividends.BitMine bought another 51,000 ETH for about $126 million from FalconX and BitGo.Bitfinex listed tokenised notes tracking Strategy and Metaplanet. Crypto-treasury equities, wrapped as tokens, on a crypto exchange.Nvidia confirmed it will acquire Hugging Face for $12.93 billion.Norway’s sovereign wealth fund, the largest in the world, proposed cutting its US Treasury holdings by roughly $80 billion.The House cancelled the weeks of 21 and 28 September, leaving just four voting days after Labor Day and two after the Senate’s 15 September CLARITY cloture vote. Polymarket odds of enactment in 2026 sit around 18%.The National Sheriffs’ Association moved from opposition to neutral on CLARITY in a 3 September letter to Senate leaders.G20 finance ministers, meeting in Asheville, committed to “clear pathways” for digital-asset innovation and asked member countries to extend the operating hours of large-value payment systems.Bloomberg’s James Seyffart noted the largest Q2 holders of XRP ETFs were Goldman Sachs, Jane Street and Millennium Management.
2. Crypto’s Real Export Is the Financial Infrastructure
The biggest shift last week wasn’t another token launch. It was traditional finance increasingly adopting crypto-native market structure.
Perpetual futures are the clearest example. Unlike traditional futures, they never expire. A funding rate keeps the contract anchored to spot: when longs become too crowded, they pay shorts, and vice versa. Crypto built this structure offshore to enable leveraged trading without expiry or traditional market hours. It now dominates crypto trading and is starting to move into traditional markets.
The export list is getting serious:
K alshi is preparing a CFTC filing for a 24/7 WTI crude perpetual. Interestingly, the CFTC had blocked CME’s attempt at 24-hour crude trading in July, while Kalshi designed its contract around the objections raised in that review.C oin base filed to offer single-stock perpetuals in the US, using the Commodity Exchange Modernization Act’s framework for “security futures” and bringing both SEC and CFTC oversight into the structure.In the ongoing CME fight, the CFTC argued CME can simply list perpetuals itself and said treating them as swaps wouldn’t stop competitors from offering them. It also invoked the CEA’s goal of “responsible innovation and fair competition.”Binance shows where demand has already gone: equity-linked perpetual volume jumped from $410.9M in January to $342.9B in August.B y bit, Polymarket and Bitfinex are pushing the format further, with stock perp options, 20x gold exposure and tokenised Strategy shares.
This is bigger than any one product. Crypto created a financial primitive that traditional exchanges largely didn’t build and now they’re importing it.
The catch is leverage. At 20x, a 5% move against you wipes out the position. Crypto has already shown how perpetuals can amplify liquidation cascades. Putting the same mechanics around Nvidia, crude or gold for retail investors turns this into a serious consumer-protection question. Last week, regulators were largely arguing over who gets to regulate it.
Korea Is Building the Other Side of the Stack
At the same time, Korea is taking crypto’s other big idea : on-chain settlement and applying it to traditional securities.
Today, a stock trade moves through custodians, brokers and settlement infrastructure before ownership finally changes. Tokenisation puts the asset on a shared ledger, allowing ownership to move essentially at the transaction itself.
Korea’s FSC has laid out a three-stage plan:
February 2027: institutional money-market funds and private corporate bonds, with unlisted equities held in trust.Stage two: publicly offered securities.Stage three: tokenised securities settling through stablecoins.
That final step is the important one. A G20 economy is publicly planning for part of its securities market to settle using privately issued digital tokens.
The rollout is deliberately conservative: existing brokerages can handle tokenised securities without a new licence, retail purchases face a 100M won (~$74K) annual net-purchase cap per venue, while non-bank issuers need 4B won in equity plus dedicated compliance and IT teams. The FSC specifically referenced BlackRock’s BUIDL and Hong Kong’s tokenised green bonds.
One caveat: the three-stage policy and 2027 timeline are confirmed by the FSC. The Avalanche component is based on narrower reporting, so the technology layer could still change.
And the irony is important: Korea is adopting the rails without adopting crypto itself.It still has no spot Bitcoin ETF. The state wants the infrastructure, not necessarily the asset.
The Lines Between Banks, Exchanges and Fintechs Are Blurring
The same convergence is happening at the company level.
Revolut received preliminary conditional approval for a US bank charter — not a finished charter. It still needs FDIC insurance, Fed approval and final OCC approval. Four major businesses, including FX and merchant acquiring, also require additional approval. Digital assets are expected to remain below 2% of bank revenue over three years.But the endgame is interesting: one regulated app can potentially hold your salary, payments, FX, credit, investments and crypto. The difference between a bank account and a crypto account becomes little more than a tab.Kraken and SoFi are moving the other way, bringing traditional financial services deeper into crypto. Kraken’s Wyoming bank received a Fed master account in March, while Payward applied for a national trust charter in May.Coinbase now generates 88% of net revenue from businesses other than Bitcoin spot trading. America’s biggest crypto exchange increasingly looks like a broader financial platform.And the G20 is pushing payment systems to operate for longer as private financial infrastructure increasingly runs 24/7.
The bigger trend is convergence, not replacement. Crypto is exporting perpetuals and blockchain settlement into traditional finance, while banks, brokers and fintechs are pulling crypto into their own products.
3. Macro Backdrop
1. Last Week Was Decided by Three Sentences and a Jobs Number
Bitcoin’s price last week wasn’t driven by anything happening on-chain. It was driven by two Fed officials and one employment number.
Wednesday 2 September. New York Fed President John Williams told CNBC he was unsure whether further rate increases were needed: “I think we have to wait and see.” Bitcoin was below $77,000.Thursday 3 September. Governor Christopher Waller noted two consecutive months of improving inflation data and said that if August showed more of the same, “I would be inclined to support” holding rates steady, while keeping the door open to a hike if the improvement proved “fleeting”. That was the sentence. September hike odds, which had favoured a hike on Wednesday, fell to roughly a coin flip. Bitcoin climbed back above $81,000, Strategy rose 17.6% to $144.80, Coinbase gained 10% to $192.70, Circle closed up 16.5% at $103.23, and spot Bitcoin ETFs took in $730.9 million in a single session.Friday 4 September, 8.30am New York. Payrolls came in at 162,000 against a consensus near 56,000. Unemployment held at 4.1%. Prior months were revised up by a combined 55,000. The consensus was not beaten. It was tripled.
Bitcoin fell about 2% and broke below $80,000 within minutes. The 2-year yield rose 7 to 7.6bp to around 4.40%, the 10-year climbed to 4.80%, the dollar index gained 0.3% to 99.3, and gold fell between 1.7% and 2.2%. ETF buying did not stop, but it shrank to $174.6 million, a 76% collapse from Thursday.
Why good news about jobs is bad news for Bitcoin
A central bank raises rates to slow an economy and cool inflation. A strong jobs report says the economy is not slowing, so it makes a hike more likely. Higher rates hurt Bitcoin through two channels.
The first is competition: if a Treasury pays 4.8% for doing nothing, holding an asset that pays no income has a cost, and the higher that yield goes the more expensive it becomes to own something that just sits there. The second is the dollar: higher US rates pull money into dollars, the dollar strengthens, and everything priced in dollars gets more expensive for everyone holding another currency. That is the whole mechanism. It has nothing to do with blockchains.
Where the hike odds now sit depends on who you ask and when. Reuters put post-payroll odds at 59%, up from 52. CoinDesk had them at 70% by Friday afternoon. Other pricing over the weekend put them at 58%. Treat any single reading as a snapshot, not a fact. Governor Barr added during the week that he would support a hike if inflation appears not to be moderating sufficiently, echoing Warsh’s Jackson Hole framing. Challenger data showed planned job cuts over the first eight months of 2026 at a four-year low and hiring plans at their strongest since 2023, which materially undercuts the argument that AI is displacing labour at pace.
2. More Money Doesn’t Mean More Risk Appetite
M2 hit a record $23.22T in July. US equities are near records. Bitcoin is still 37% below its high. So why hasn’t crypto followed?
The answer is the difference between a level and a flow. A record amount of money tells you how much exists, not where the next dollar is going. Markets trade the flow.
M2 is a level. Its 5.4% annual growth is normal, not the kind of liquidity surge that drove 2020–21.Benjamin Cowen’s global net liquidity measure : Fed, BoJ, PBoC, BoE and ECB balance sheets, minus the TGA and Fed reverse repo sits around $25T vs. ~$30T at the 2021–22 peak.money supply was rising, equities were hitting records, but Bitcoin stalled until the 2020 shock triggered aggressive monetary expansion.
The measure has flaws currency effects, methodology and the fact that 2019 isn’t 2026. But the core point holds: record money doesn’t mean record risk appetite.
Capital today has plenty of places to go. Treasuries offer attractive yields, money-market funds finally pay real returns, and AI infrastructure is absorbing capital at enormous scale. Bitcoin is competing with assets that simply didn’t offer much competition in 2021.
The clearest example: Nvidia agreed to buy Hugging Face for $12.93B, directing nearly $13B toward AI rather than crypto. Meanwhile, Norway’s sovereign wealth fund proposed cutting US Treasury holdings by roughly $80B — a signal that even the safest part of the capital hierarchy is being reassessed.
There is also a potential reversal. AI is currently keeping growth strong and giving the Fed less reason to ease. But the boom is heavily debt-financed, while fiscal deficits remain large. If that eventually strains credit markets and forces policymakers to respond, the same cycle starving Bitcoin of capital could create the liquidity Bitcoin needs.
Willy Woo reaches a similar conclusion from another angle: Bitcoin may be moving from its traditional four-year halving cycle toward a 6–8 year credit cycle. Around 1.2M BTC are now held by 100 public companies and 1.5M+ by global ETPs — more than 2.7M BTC, versus only ~164,250 BTC of annual miner issuance.
Galaxy Research still sees the four-year cycle, while 21Shares calls it evolving rather than broken. With only three completed cycles, neither side can know yet.
Cowen and Woo are ultimately pointing to the same thing: Bitcoin is no longer operating in isolation from the global capital cycle. It has become big enough to be part of it.
3. Bonds, ISM and the Buyback
The 10-year hit ~4.798% Wednesday, its highest since January 2025, while the 2-year made a fresh 52-week high after payrolls, with the front end leading. Markets are now pricing a Fed that has both inflation cover and labour-market cover to tighten a combination largely missing this yearManufacturing PMI fell to 54.6 from July’s near four-year high as new orders cooled sharply, while production stayed strong. Services PMI climbed to 55.4, its best since spring. The question is whether services strength offsets manufacturing weakness or manufacturing is the early warning
3. Washington Ran Out of Days
CLARITY is running out of runway as SEC Chair Paul Atkins expects the Senate to advance the bill on September 15, while Senator Lummis says it would effectively take Wyoming’s framework nationwide.
One important correction: Paul Atkins chairs the SEC; Michael Selig chairs the CFTC. Several posts this week incorrectly attributed Selig’s comments to “SEC Chair Mike Selig.” The distinction matters given how much of the current crypto fight sits between the two agencies.The House cancelled the weeks of September 21 and 28. Representatives leave on September 17 and return only after the November 3 midterms, leaving just two voting days after the Senate’s cloture vote. Polymarket puts the odds of 2026 enactment at roughly 18%, while Solana Policy Institute’s Miller Whitehouse-Levine had estimated 10% pre-midterms.One obstacle did disappear: the National Sheriffs’ Association moved from opposition to neutral, removing the law-enforcement objection.Brian Armstrong says the remaining resistance comes from banks that “don’t want competition from crypto companies.” He obviously has an interest in that argument, but the Revolut, SoFi and Kraken developments make the competitive pressure hard to ignore.
The bigger issue is the gap between regulatory momentum and legislative certainty.Crypto has made significant progress through SEC, CFTC and OCC discretion this year. But agency interpretations can be reversed by a future administration. An Act of Congress is much harder to unwind.
4. ETF Insights
Bitcoin ETFs stayed firmly positive for a third straight week, pulling in roughly $987M, taking the three-week run close to $3.8B. Thursday accounted for $731M, the biggest single-day inflow since January, before Friday slowed sharply to $174.6M, a 76% drop from Thursday. BlackRock’s IBIT led with $117.4M, followed by Fidelity’s FBTC at $57.2MAugust was the strongest month for US spot BTC ETFs since September 2025, with $3.5B of net inflows. Ether ETFs also had their best month since August 2025, bringing in $1.85B, while ETH gained 32.5% during the month.Over the past 30 days, spot ETF flows reached roughly $4.25B, including a $730.9M single-day inflow on September 3. The week also saw a $237M outflow Tuesday, showing that flows remain strong but aren’t one-way.The broader ETF trade is narrowing back toward BTC. ETH ETF inflows fell to $215M from $816M the prior week, including a midweek outflow day. For now, BTC ETF demand is doing the heavy lifting and providing solid support around current levels
5. The Week Ahead
US inflation data will dominate, but the sequence is what matters: CPI on Friday feeds directly into the FOMC and the CLARITY vote in the same 36 hours the following week, with hike odds near 60%.
6. Conclusion
This was one of crypto’s most important weeks in years for infrastructure, but barely mattered for price. Korea moved toward putting its securities market on-chain, Revolut cleared a major US regulatory hurdle, and Coinbase pushed single-stock perpetuals forward. Bitcoin gained ~2%, driven almost entirely by Fed comments and payrolls.
The reason is simple: infrastructure adoption and Bitcoin demand are different things. Bitcoin trades on liquidity, real rates and the dollar. Blockchain infrastructure moves on legislation and integration. The industry is increasingly exporting its rails without necessarily creating demand for its assets.
The cycle remains unresolved. ETF and institutional flows are strong, large holders are accumulating, and BTC is absorbing macro shocks better than before. But $81K has been rejected twice, liquidity remains weak, and CPI could quickly change the Fed outlook.
Crypto Market Weekly
Infrastructure Up, $BTC Flat
Hey everyone, and welcome to the Weekly Market.
Last week Bitcoin was pushed around by three sentences and one jobs number, and ended almost exactly where it started. It fell below $77,000 on Wednesday, bounced above $81,000 on Thursday after Governor Waller opened the door to a September hold, then slipped below $80,000 within minutes of Friday’s payrolls print. It closed around $79,785, up roughly 2% for the week, and remains around the same level Wednesday morning as the first enlarged Treasury buyback operation gets underway. Ether followed the same path and sits near $2,494.
Bitcoin is still roughly 37% below its October 2025 peak of $126,198, with $81,000 rejected twice now.
But two things underneath the price matter more than the weekly candle.
First, flows looked much healthier than the chart. August was the best month for US spot Bitcoin ETFs since September 2025, Thursday saw the largest single-day ETF inflow since January, and on-chain data shows large wallets accumulating while smaller holders sold.
Second and this is the part that could still matter in 2027 : crypto spent the week exporting its market structure rather than selling another coin. South Korea laid out a plan to move its securities market onto blockchain rails, while Coinbase, Kalshi, Binance, Bybit and Polymarket pushed perpetuals into oil, single stocks and gold.
Bitcoin barely reacted to any of it.
In this issue, I’ll break down what actually drove the movement, how macro catalysts are compressing into a high-impact window, what on-chain flows are revealing about holder behaviour, and where structural momentum may emerge next.
Let’s get into it.
1. Sector Performance & Key Developments
South Korea’s Financial Services Commission published a three-stage plan to tokenise all types of securities, with the enabling law taking effect on 4 February 2027. Reports indicate the FSC and the Korea Securities Depository intend to build on Avalanche.Coinbase filed a Form 1-N and a Form BD-N with the SEC to offer single-stock perpetual futures to US traders. Shares rose about 10% on the news. Separately, it appointed Anthony Armstrong, formerly CFO across xAI and X Corp, to its board, and disclosed that 88% of net revenue now comes from sources other than Bitcoin spot trading.Kalshi is preparing a CFTC filing for a never-expiring WTI crude perpetual, which would be the first of its kind. Its Bitcoin perpetual, approved in May, has traded roughly $16.1 billion notional since.The CFTC moved to dismiss CME’s lawsuit against Kalshi’s Bitcoin perpetuals, calling it “much ado about nothing” and arguing that CME’s injury is “entirely self-inflicted” because it is free to list perpetuals itself. CME’s opposition is due 2 October.Binance added physically settled options on more than 1,000 US stocks and ETFs. Its traditional-finance perpetual volume hit about $433.4 billion in August, roughly 15 times January’s $29.5 billion, with equity-linked perps making up 79% of that.Bybit launches 24/7 options on stock perpetuals on 17 September, starting with SpaceX and Nvidia. Polymarket launched Perps with up to 20x leverage across crypto, equities, commodities and indices.The OCC granted Revolut preliminary conditional approval to establish Revolut Bank US in Stamford, Connecticut, with crypto custody limited to a non-fiduciary capacity through its UK affiliate. Revolut targets a 2027 opening.SoFi and Payward (Kraken’s parent) agreed to link SoFi’s real-time settlement network to Kraken’s trading infrastructure, with SoFiUSD listing on Kraken and 24/7 dollar settlement for institutional clients. Hyperliquid is reportedly in talks with Payward about entering the US.Strategy bought 4,603 BTC for about $369.7 million at an average of $80,318, taking holdings to 845,050 BTC. CEO Phong Le confirmed the company sold roughly 7,000 BTC at $60,000 to $65,000 during its ten-week pause to fund preferred dividends.BitMine bought another 51,000 ETH for about $126 million from FalconX and BitGo.Bitfinex listed tokenised notes tracking Strategy and Metaplanet. Crypto-treasury equities, wrapped as tokens, on a crypto exchange.Nvidia confirmed it will acquire Hugging Face for $12.93 billion.Norway’s sovereign wealth fund, the largest in the world, proposed cutting its US Treasury holdings by roughly $80 billion.The House cancelled the weeks of 21 and 28 September, leaving just four voting days after Labor Day and two after the Senate’s 15 September CLARITY cloture vote. Polymarket odds of enactment in 2026 sit around 18%.The National Sheriffs’ Association moved from opposition to neutral on CLARITY in a 3 September letter to Senate leaders.G20 finance ministers, meeting in Asheville, committed to “clear pathways” for digital-asset innovation and asked member countries to extend the operating hours of large-value payment systems.Bloomberg’s James Seyffart noted the largest Q2 holders of XRP ETFs were Goldman Sachs, Jane Street and Millennium Management.
2. Crypto’s Real Export Is the Financial Infrastructure
The biggest shift last week wasn’t another token launch. It was traditional finance increasingly adopting crypto-native market structure.
Perpetual futures are the clearest example. Unlike traditional futures, they never expire. A funding rate keeps the contract anchored to spot: when longs become too crowded, they pay shorts, and vice versa. Crypto built this structure offshore to enable leveraged trading without expiry or traditional market hours. It now dominates crypto trading and is starting to move into traditional markets.
The export list is getting serious:
K alshi is preparing a CFTC filing for a 24/7 WTI crude perpetual. Interestingly, the CFTC had blocked CME’s attempt at 24-hour crude trading in July, while Kalshi designed its contract around the objections raised in that review.C oin base filed to offer single-stock perpetuals in the US, using the Commodity Exchange Modernization Act’s framework for “security futures” and bringing both SEC and CFTC oversight into the structure.In the ongoing CME fight, the CFTC argued CME can simply list perpetuals itself and said treating them as swaps wouldn’t stop competitors from offering them. It also invoked the CEA’s goal of “responsible innovation and fair competition.”Binance shows where demand has already gone: equity-linked perpetual volume jumped from $410.9M in January to $342.9B in August.B y bit, Polymarket and Bitfinex are pushing the format further, with stock perp options, 20x gold exposure and tokenised Strategy shares.
This is bigger than any one product. Crypto created a financial primitive that traditional exchanges largely didn’t build and now they’re importing it.
The catch is leverage. At 20x, a 5% move against you wipes out the position. Crypto has already shown how perpetuals can amplify liquidation cascades. Putting the same mechanics around Nvidia, crude or gold for retail investors turns this into a serious consumer-protection question. Last week, regulators were largely arguing over who gets to regulate it.
Korea Is Building the Other Side of the Stack
At the same time, Korea is taking crypto’s other big idea : on-chain settlement and applying it to traditional securities.
Today, a stock trade moves through custodians, brokers and settlement infrastructure before ownership finally changes. Tokenisation puts the asset on a shared ledger, allowing ownership to move essentially at the transaction itself.
Korea’s FSC has laid out a three-stage plan:
February 2027: institutional money-market funds and private corporate bonds, with unlisted equities held in trust.Stage two: publicly offered securities.Stage three: tokenised securities settling through stablecoins.
That final step is the important one. A G20 economy is publicly planning for part of its securities market to settle using privately issued digital tokens.
The rollout is deliberately conservative: existing brokerages can handle tokenised securities without a new licence, retail purchases face a 100M won (~$74K) annual net-purchase cap per venue, while non-bank issuers need 4B won in equity plus dedicated compliance and IT teams. The FSC specifically referenced BlackRock’s BUIDL and Hong Kong’s tokenised green bonds.
One caveat: the three-stage policy and 2027 timeline are confirmed by the FSC. The Avalanche component is based on narrower reporting, so the technology layer could still change.
And the irony is important: Korea is adopting the rails without adopting crypto itself.It still has no spot Bitcoin ETF. The state wants the infrastructure, not necessarily the asset.
The Lines Between Banks, Exchanges and Fintechs Are Blurring
The same convergence is happening at the company level.
Revolut received preliminary conditional approval for a US bank charter — not a finished charter. It still needs FDIC insurance, Fed approval and final OCC approval. Four major businesses, including FX and merchant acquiring, also require additional approval. Digital assets are expected to remain below 2% of bank revenue over three years.But the endgame is interesting: one regulated app can potentially hold your salary, payments, FX, credit, investments and crypto. The difference between a bank account and a crypto account becomes little more than a tab.Kraken and SoFi are moving the other way, bringing traditional financial services deeper into crypto. Kraken’s Wyoming bank received a Fed master account in March, while Payward applied for a national trust charter in May.Coinbase now generates 88% of net revenue from businesses other than Bitcoin spot trading. America’s biggest crypto exchange increasingly looks like a broader financial platform.And the G20 is pushing payment systems to operate for longer as private financial infrastructure increasingly runs 24/7.
The bigger trend is convergence, not replacement. Crypto is exporting perpetuals and blockchain settlement into traditional finance, while banks, brokers and fintechs are pulling crypto into their own products.
3. Macro Backdrop
1. Last Week Was Decided by Three Sentences and a Jobs Number
Bitcoin’s price last week wasn’t driven by anything happening on-chain. It was driven by two Fed officials and one employment number.
Wednesday 2 September. New York Fed President John Williams told CNBC he was unsure whether further rate increases were needed: “I think we have to wait and see.” Bitcoin was below $77,000.Thursday 3 September. Governor Christopher Waller noted two consecutive months of improving inflation data and said that if August showed more of the same, “I would be inclined to support” holding rates steady, while keeping the door open to a hike if the improvement proved “fleeting”. That was the sentence. September hike odds, which had favoured a hike on Wednesday, fell to roughly a coin flip. Bitcoin climbed back above $81,000, Strategy rose 17.6% to $144.80, Coinbase gained 10% to $192.70, Circle closed up 16.5% at $103.23, and spot Bitcoin ETFs took in $730.9 million in a single session.Friday 4 September, 8.30am New York. Payrolls came in at 162,000 against a consensus near 56,000. Unemployment held at 4.1%. Prior months were revised up by a combined 55,000. The consensus was not beaten. It was tripled.
Bitcoin fell about 2% and broke below $80,000 within minutes. The 2-year yield rose 7 to 7.6bp to around 4.40%, the 10-year climbed to 4.80%, the dollar index gained 0.3% to 99.3, and gold fell between 1.7% and 2.2%. ETF buying did not stop, but it shrank to $174.6 million, a 76% collapse from Thursday.
Why good news about jobs is bad news for Bitcoin
A central bank raises rates to slow an economy and cool inflation. A strong jobs report says the economy is not slowing, so it makes a hike more likely. Higher rates hurt Bitcoin through two channels.
The first is competition: if a Treasury pays 4.8% for doing nothing, holding an asset that pays no income has a cost, and the higher that yield goes the more expensive it becomes to own something that just sits there. The second is the dollar: higher US rates pull money into dollars, the dollar strengthens, and everything priced in dollars gets more expensive for everyone holding another currency. That is the whole mechanism. It has nothing to do with blockchains.
Where the hike odds now sit depends on who you ask and when. Reuters put post-payroll odds at 59%, up from 52. CoinDesk had them at 70% by Friday afternoon. Other pricing over the weekend put them at 58%. Treat any single reading as a snapshot, not a fact. Governor Barr added during the week that he would support a hike if inflation appears not to be moderating sufficiently, echoing Warsh’s Jackson Hole framing. Challenger data showed planned job cuts over the first eight months of 2026 at a four-year low and hiring plans at their strongest since 2023, which materially undercuts the argument that AI is displacing labour at pace.
2. More Money Doesn’t Mean More Risk Appetite
M2 hit a record $23.22T in July. US equities are near records. Bitcoin is still 37% below its high. So why hasn’t crypto followed?
The answer is the difference between a level and a flow. A record amount of money tells you how much exists, not where the next dollar is going. Markets trade the flow.
M2 is a level. Its 5.4% annual growth is normal, not the kind of liquidity surge that drove 2020–21.Benjamin Cowen’s global net liquidity measure : Fed, BoJ, PBoC, BoE and ECB balance sheets, minus the TGA and Fed reverse repo sits around $25T vs. ~$30T at the 2021–22 peak.money supply was rising, equities were hitting records, but Bitcoin stalled until the 2020 shock triggered aggressive monetary expansion.
The measure has flaws currency effects, methodology and the fact that 2019 isn’t 2026. But the core point holds: record money doesn’t mean record risk appetite.
Capital today has plenty of places to go. Treasuries offer attractive yields, money-market funds finally pay real returns, and AI infrastructure is absorbing capital at enormous scale. Bitcoin is competing with assets that simply didn’t offer much competition in 2021.
The clearest example: Nvidia agreed to buy Hugging Face for $12.93B, directing nearly $13B toward AI rather than crypto. Meanwhile, Norway’s sovereign wealth fund proposed cutting US Treasury holdings by roughly $80B — a signal that even the safest part of the capital hierarchy is being reassessed.
There is also a potential reversal. AI is currently keeping growth strong and giving the Fed less reason to ease. But the boom is heavily debt-financed, while fiscal deficits remain large. If that eventually strains credit markets and forces policymakers to respond, the same cycle starving Bitcoin of capital could create the liquidity Bitcoin needs.
Willy Woo reaches a similar conclusion from another angle: Bitcoin may be moving from its traditional four-year halving cycle toward a 6–8 year credit cycle. Around 1.2M BTC are now held by 100 public companies and 1.5M+ by global ETPs — more than 2.7M BTC, versus only ~164,250 BTC of annual miner issuance.
Galaxy Research still sees the four-year cycle, while 21Shares calls it evolving rather than broken. With only three completed cycles, neither side can know yet.
Cowen and Woo are ultimately pointing to the same thing: Bitcoin is no longer operating in isolation from the global capital cycle. It has become big enough to be part of it.
3. Bonds, ISM and the Buyback
The 10-year hit ~4.798% Wednesday, its highest since January 2025, while the 2-year made a fresh 52-week high after payrolls, with the front end leading. Markets are now pricing a Fed that has both inflation cover and labour-market cover to tighten a combination largely missing this yearManufacturing PMI fell to 54.6 from July’s near four-year high as new orders cooled sharply, while production stayed strong. Services PMI climbed to 55.4, its best since spring. The question is whether services strength offsets manufacturing weakness or manufacturing is the early warning
3. Washington Ran Out of Days
CLARITY is running out of runway as SEC Chair Paul Atkins expects the Senate to advance the bill on September 15, while Senator Lummis says it would effectively take Wyoming’s framework nationwide.
One important correction: Paul Atkins chairs the SEC; Michael Selig chairs the CFTC. Several posts this week incorrectly attributed Selig’s comments to “SEC Chair Mike Selig.” The distinction matters given how much of the current crypto fight sits between the two agencies.The House cancelled the weeks of September 21 and 28. Representatives leave on September 17 and return only after the November 3 midterms, leaving just two voting days after the Senate’s cloture vote. Polymarket puts the odds of 2026 enactment at roughly 18%, while Solana Policy Institute’s Miller Whitehouse-Levine had estimated 10% pre-midterms.One obstacle did disappear: the National Sheriffs’ Association moved from opposition to neutral, removing the law-enforcement objection.Brian Armstrong says the remaining resistance comes from banks that “don’t want competition from crypto companies.” He obviously has an interest in that argument, but the Revolut, SoFi and Kraken developments make the competitive pressure hard to ignore.
The bigger issue is the gap between regulatory momentum and legislative certainty.Crypto has made significant progress through SEC, CFTC and OCC discretion this year. But agency interpretations can be reversed by a future administration. An Act of Congress is much harder to unwind.
4. ETF Insights
Bitcoin ETFs stayed firmly positive for a third straight week, pulling in roughly $987M, taking the three-week run close to $3.8B. Thursday accounted for $731M, the biggest single-day inflow since January, before Friday slowed sharply to $174.6M, a 76% drop from Thursday. BlackRock’s IBIT led with $117.4M, followed by Fidelity’s FBTC at $57.2MAugust was the strongest month for US spot BTC ETFs since September 2025, with $3.5B of net inflows. Ether ETFs also had their best month since August 2025, bringing in $1.85B, while ETH gained 32.5% during the month.Over the past 30 days, spot ETF flows reached roughly $4.25B, including a $730.9M single-day inflow on September 3. The week also saw a $237M outflow Tuesday, showing that flows remain strong but aren’t one-way.The broader ETF trade is narrowing back toward BTC. ETH ETF inflows fell to $215M from $816M the prior week, including a midweek outflow day. For now, BTC ETF demand is doing the heavy lifting and providing solid support around current levels
5. The Week Ahead
US inflation data will dominate, but the sequence is what matters: CPI on Friday feeds directly into the FOMC and the CLARITY vote in the same 36 hours the following week, with hike odds near 60%.
6. Conclusion
This was one of crypto’s most important weeks in years for infrastructure, but barely mattered for price. Korea moved toward putting its securities market on-chain, Revolut cleared a major US regulatory hurdle, and Coinbase pushed single-stock perpetuals forward. Bitcoin gained ~2%, driven almost entirely by Fed comments and payrolls.
The reason is simple: infrastructure adoption and Bitcoin demand are different things. Bitcoin trades on liquidity, real rates and the dollar. Blockchain infrastructure moves on legislation and integration. The industry is increasingly exporting its rails without necessarily creating demand for its assets.
The cycle remains unresolved. ETF and institutional flows are strong, large holders are accumulating, and BTC is absorbing macro shocks better than before. But $81K has been rejected twice, liquidity remains weak, and CPI could quickly change the Fed outlook.
Hey everyone, and welcome to the Weekly Market.
Last week Bitcoin was pushed around by three sentences and one jobs number, and ended almost exactly where it started. It fell below $77,000 on Wednesday, bounced above $81,000 on Thursday after Governor Waller opened the door to a September hold, then slipped below $80,000 within minutes of Friday’s payrolls print. It closed around $79,785, up roughly 2% for the week, and remains around the same level Wednesday morning as the first enlarged Treasury buyback operation gets underway. Ether followed the same path and sits near $2,494.
Bitcoin is still roughly 37% below its October 2025 peak of $126,198, with $81,000 rejected twice now.
But two things underneath the price matter more than the weekly candle.
First, flows looked much healthier than the chart. August was the best month for US spot Bitcoin ETFs since September 2025, Thursday saw the largest single-day ETF inflow since January, and on-chain data shows large wallets accumulating while smaller holders sold.
Second and this is the part that could still matter in 2027 : crypto spent the week exporting its market structure rather than selling another coin. South Korea laid out a plan to move its securities market onto blockchain rails, while Coinbase, Kalshi, Binance, Bybit and Polymarket pushed perpetuals into oil, single stocks and gold.
Bitcoin barely reacted to any of it.
In this issue, I’ll break down what actually drove the movement, how macro catalysts are compressing into a high-impact window, what on-chain flows are revealing about holder behaviour, and where structural momentum may emerge next.
Let’s get into it.
1. Sector Performance & Key Developments
South Korea’s Financial Services Commission published a three-stage plan to tokenise all types of securities, with the enabling law taking effect on 4 February 2027. Reports indicate the FSC and the Korea Securities Depository intend to build on Avalanche.Coinbase filed a Form 1-N and a Form BD-N with the SEC to offer single-stock perpetual futures to US traders. Shares rose about 10% on the news. Separately, it appointed Anthony Armstrong, formerly CFO across xAI and X Corp, to its board, and disclosed that 88% of net revenue now comes from sources other than Bitcoin spot trading.Kalshi is preparing a CFTC filing for a never-expiring WTI crude perpetual, which would be the first of its kind. Its Bitcoin perpetual, approved in May, has traded roughly $16.1 billion notional since.The CFTC moved to dismiss CME’s lawsuit against Kalshi’s Bitcoin perpetuals, calling it “much ado about nothing” and arguing that CME’s injury is “entirely self-inflicted” because it is free to list perpetuals itself. CME’s opposition is due 2 October.Binance added physically settled options on more than 1,000 US stocks and ETFs. Its traditional-finance perpetual volume hit about $433.4 billion in August, roughly 15 times January’s $29.5 billion, with equity-linked perps making up 79% of that.Bybit launches 24/7 options on stock perpetuals on 17 September, starting with SpaceX and Nvidia. Polymarket launched Perps with up to 20x leverage across crypto, equities, commodities and indices.The OCC granted Revolut preliminary conditional approval to establish Revolut Bank US in Stamford, Connecticut, with crypto custody limited to a non-fiduciary capacity through its UK affiliate. Revolut targets a 2027 opening.SoFi and Payward (Kraken’s parent) agreed to link SoFi’s real-time settlement network to Kraken’s trading infrastructure, with SoFiUSD listing on Kraken and 24/7 dollar settlement for institutional clients. Hyperliquid is reportedly in talks with Payward about entering the US.Strategy bought 4,603 BTC for about $369.7 million at an average of $80,318, taking holdings to 845,050 BTC. CEO Phong Le confirmed the company sold roughly 7,000 BTC at $60,000 to $65,000 during its ten-week pause to fund preferred dividends.BitMine bought another 51,000 ETH for about $126 million from FalconX and BitGo.Bitfinex listed tokenised notes tracking Strategy and Metaplanet. Crypto-treasury equities, wrapped as tokens, on a crypto exchange.Nvidia confirmed it will acquire Hugging Face for $12.93 billion.Norway’s sovereign wealth fund, the largest in the world, proposed cutting its US Treasury holdings by roughly $80 billion.The House cancelled the weeks of 21 and 28 September, leaving just four voting days after Labor Day and two after the Senate’s 15 September CLARITY cloture vote. Polymarket odds of enactment in 2026 sit around 18%.The National Sheriffs’ Association moved from opposition to neutral on CLARITY in a 3 September letter to Senate leaders.G20 finance ministers, meeting in Asheville, committed to “clear pathways” for digital-asset innovation and asked member countries to extend the operating hours of large-value payment systems.Bloomberg’s James Seyffart noted the largest Q2 holders of XRP ETFs were Goldman Sachs, Jane Street and Millennium Management.
2. Crypto’s Real Export Is the Financial Infrastructure
The biggest shift last week wasn’t another token launch. It was traditional finance increasingly adopting crypto-native market structure.
Perpetual futures are the clearest example. Unlike traditional futures, they never expire. A funding rate keeps the contract anchored to spot: when longs become too crowded, they pay shorts, and vice versa. Crypto built this structure offshore to enable leveraged trading without expiry or traditional market hours. It now dominates crypto trading and is starting to move into traditional markets.
The export list is getting serious:
K alshi is preparing a CFTC filing for a 24/7 WTI crude perpetual. Interestingly, the CFTC had blocked CME’s attempt at 24-hour crude trading in July, while Kalshi designed its contract around the objections raised in that review.C oin base filed to offer single-stock perpetuals in the US, using the Commodity Exchange Modernization Act’s framework for “security futures” and bringing both SEC and CFTC oversight into the structure.In the ongoing CME fight, the CFTC argued CME can simply list perpetuals itself and said treating them as swaps wouldn’t stop competitors from offering them. It also invoked the CEA’s goal of “responsible innovation and fair competition.”Binance shows where demand has already gone: equity-linked perpetual volume jumped from $410.9M in January to $342.9B in August.B y bit, Polymarket and Bitfinex are pushing the format further, with stock perp options, 20x gold exposure and tokenised Strategy shares.
This is bigger than any one product. Crypto created a financial primitive that traditional exchanges largely didn’t build and now they’re importing it.
The catch is leverage. At 20x, a 5% move against you wipes out the position. Crypto has already shown how perpetuals can amplify liquidation cascades. Putting the same mechanics around Nvidia, crude or gold for retail investors turns this into a serious consumer-protection question. Last week, regulators were largely arguing over who gets to regulate it.
Korea Is Building the Other Side of the Stack
At the same time, Korea is taking crypto’s other big idea : on-chain settlement and applying it to traditional securities.
Today, a stock trade moves through custodians, brokers and settlement infrastructure before ownership finally changes. Tokenisation puts the asset on a shared ledger, allowing ownership to move essentially at the transaction itself.
Korea’s FSC has laid out a three-stage plan:
February 2027: institutional money-market funds and private corporate bonds, with unlisted equities held in trust.Stage two: publicly offered securities.Stage three: tokenised securities settling through stablecoins.
That final step is the important one. A G20 economy is publicly planning for part of its securities market to settle using privately issued digital tokens.
The rollout is deliberately conservative: existing brokerages can handle tokenised securities without a new licence, retail purchases face a 100M won (~$74K) annual net-purchase cap per venue, while non-bank issuers need 4B won in equity plus dedicated compliance and IT teams. The FSC specifically referenced BlackRock’s BUIDL and Hong Kong’s tokenised green bonds.
One caveat: the three-stage policy and 2027 timeline are confirmed by the FSC. The Avalanche component is based on narrower reporting, so the technology layer could still change.
And the irony is important: Korea is adopting the rails without adopting crypto itself.It still has no spot Bitcoin ETF. The state wants the infrastructure, not necessarily the asset.
The Lines Between Banks, Exchanges and Fintechs Are Blurring
The same convergence is happening at the company level.
Revolut received preliminary conditional approval for a US bank charter — not a finished charter. It still needs FDIC insurance, Fed approval and final OCC approval. Four major businesses, including FX and merchant acquiring, also require additional approval. Digital assets are expected to remain below 2% of bank revenue over three years.But the endgame is interesting: one regulated app can potentially hold your salary, payments, FX, credit, investments and crypto. The difference between a bank account and a crypto account becomes little more than a tab.Kraken and SoFi are moving the other way, bringing traditional financial services deeper into crypto. Kraken’s Wyoming bank received a Fed master account in March, while Payward applied for a national trust charter in May.Coinbase now generates 88% of net revenue from businesses other than Bitcoin spot trading. America’s biggest crypto exchange increasingly looks like a broader financial platform.And the G20 is pushing payment systems to operate for longer as private financial infrastructure increasingly runs 24/7.
The bigger trend is convergence, not replacement. Crypto is exporting perpetuals and blockchain settlement into traditional finance, while banks, brokers and fintechs are pulling crypto into their own products.
3. Macro Backdrop
1. Last Week Was Decided by Three Sentences and a Jobs Number
Bitcoin’s price last week wasn’t driven by anything happening on-chain. It was driven by two Fed officials and one employment number.
Wednesday 2 September. New York Fed President John Williams told CNBC he was unsure whether further rate increases were needed: “I think we have to wait and see.” Bitcoin was below $77,000.Thursday 3 September. Governor Christopher Waller noted two consecutive months of improving inflation data and said that if August showed more of the same, “I would be inclined to support” holding rates steady, while keeping the door open to a hike if the improvement proved “fleeting”. That was the sentence. September hike odds, which had favoured a hike on Wednesday, fell to roughly a coin flip. Bitcoin climbed back above $81,000, Strategy rose 17.6% to $144.80, Coinbase gained 10% to $192.70, Circle closed up 16.5% at $103.23, and spot Bitcoin ETFs took in $730.9 million in a single session.Friday 4 September, 8.30am New York. Payrolls came in at 162,000 against a consensus near 56,000. Unemployment held at 4.1%. Prior months were revised up by a combined 55,000. The consensus was not beaten. It was tripled.
Bitcoin fell about 2% and broke below $80,000 within minutes. The 2-year yield rose 7 to 7.6bp to around 4.40%, the 10-year climbed to 4.80%, the dollar index gained 0.3% to 99.3, and gold fell between 1.7% and 2.2%. ETF buying did not stop, but it shrank to $174.6 million, a 76% collapse from Thursday.
Why good news about jobs is bad news for Bitcoin
A central bank raises rates to slow an economy and cool inflation. A strong jobs report says the economy is not slowing, so it makes a hike more likely. Higher rates hurt Bitcoin through two channels.
The first is competition: if a Treasury pays 4.8% for doing nothing, holding an asset that pays no income has a cost, and the higher that yield goes the more expensive it becomes to own something that just sits there. The second is the dollar: higher US rates pull money into dollars, the dollar strengthens, and everything priced in dollars gets more expensive for everyone holding another currency. That is the whole mechanism. It has nothing to do with blockchains.
Where the hike odds now sit depends on who you ask and when. Reuters put post-payroll odds at 59%, up from 52. CoinDesk had them at 70% by Friday afternoon. Other pricing over the weekend put them at 58%. Treat any single reading as a snapshot, not a fact. Governor Barr added during the week that he would support a hike if inflation appears not to be moderating sufficiently, echoing Warsh’s Jackson Hole framing. Challenger data showed planned job cuts over the first eight months of 2026 at a four-year low and hiring plans at their strongest since 2023, which materially undercuts the argument that AI is displacing labour at pace.
2. More Money Doesn’t Mean More Risk Appetite
M2 hit a record $23.22T in July. US equities are near records. Bitcoin is still 37% below its high. So why hasn’t crypto followed?
The answer is the difference between a level and a flow. A record amount of money tells you how much exists, not where the next dollar is going. Markets trade the flow.
M2 is a level. Its 5.4% annual growth is normal, not the kind of liquidity surge that drove 2020–21.Benjamin Cowen’s global net liquidity measure : Fed, BoJ, PBoC, BoE and ECB balance sheets, minus the TGA and Fed reverse repo sits around $25T vs. ~$30T at the 2021–22 peak.money supply was rising, equities were hitting records, but Bitcoin stalled until the 2020 shock triggered aggressive monetary expansion.
The measure has flaws currency effects, methodology and the fact that 2019 isn’t 2026. But the core point holds: record money doesn’t mean record risk appetite.
Capital today has plenty of places to go. Treasuries offer attractive yields, money-market funds finally pay real returns, and AI infrastructure is absorbing capital at enormous scale. Bitcoin is competing with assets that simply didn’t offer much competition in 2021.
The clearest example: Nvidia agreed to buy Hugging Face for $12.93B, directing nearly $13B toward AI rather than crypto. Meanwhile, Norway’s sovereign wealth fund proposed cutting US Treasury holdings by roughly $80B — a signal that even the safest part of the capital hierarchy is being reassessed.
There is also a potential reversal. AI is currently keeping growth strong and giving the Fed less reason to ease. But the boom is heavily debt-financed, while fiscal deficits remain large. If that eventually strains credit markets and forces policymakers to respond, the same cycle starving Bitcoin of capital could create the liquidity Bitcoin needs.
Willy Woo reaches a similar conclusion from another angle: Bitcoin may be moving from its traditional four-year halving cycle toward a 6–8 year credit cycle. Around 1.2M BTC are now held by 100 public companies and 1.5M+ by global ETPs — more than 2.7M BTC, versus only ~164,250 BTC of annual miner issuance.
Galaxy Research still sees the four-year cycle, while 21Shares calls it evolving rather than broken. With only three completed cycles, neither side can know yet.
Cowen and Woo are ultimately pointing to the same thing: Bitcoin is no longer operating in isolation from the global capital cycle. It has become big enough to be part of it.
3. Bonds, ISM and the Buyback
The 10-year hit ~4.798% Wednesday, its highest since January 2025, while the 2-year made a fresh 52-week high after payrolls, with the front end leading. Markets are now pricing a Fed that has both inflation cover and labour-market cover to tighten a combination largely missing this yearManufacturing PMI fell to 54.6 from July’s near four-year high as new orders cooled sharply, while production stayed strong. Services PMI climbed to 55.4, its best since spring. The question is whether services strength offsets manufacturing weakness or manufacturing is the early warning
3. Washington Ran Out of Days
CLARITY is running out of runway as SEC Chair Paul Atkins expects the Senate to advance the bill on September 15, while Senator Lummis says it would effectively take Wyoming’s framework nationwide.
One important correction: Paul Atkins chairs the SEC; Michael Selig chairs the CFTC. Several posts this week incorrectly attributed Selig’s comments to “SEC Chair Mike Selig.” The distinction matters given how much of the current crypto fight sits between the two agencies.The House cancelled the weeks of September 21 and 28. Representatives leave on September 17 and return only after the November 3 midterms, leaving just two voting days after the Senate’s cloture vote. Polymarket puts the odds of 2026 enactment at roughly 18%, while Solana Policy Institute’s Miller Whitehouse-Levine had estimated 10% pre-midterms.One obstacle did disappear: the National Sheriffs’ Association moved from opposition to neutral, removing the law-enforcement objection.Brian Armstrong says the remaining resistance comes from banks that “don’t want competition from crypto companies.” He obviously has an interest in that argument, but the Revolut, SoFi and Kraken developments make the competitive pressure hard to ignore.
The bigger issue is the gap between regulatory momentum and legislative certainty.Crypto has made significant progress through SEC, CFTC and OCC discretion this year. But agency interpretations can be reversed by a future administration. An Act of Congress is much harder to unwind.
4. ETF Insights
Bitcoin ETFs stayed firmly positive for a third straight week, pulling in roughly $987M, taking the three-week run close to $3.8B. Thursday accounted for $731M, the biggest single-day inflow since January, before Friday slowed sharply to $174.6M, a 76% drop from Thursday. BlackRock’s IBIT led with $117.4M, followed by Fidelity’s FBTC at $57.2MAugust was the strongest month for US spot BTC ETFs since September 2025, with $3.5B of net inflows. Ether ETFs also had their best month since August 2025, bringing in $1.85B, while ETH gained 32.5% during the month.Over the past 30 days, spot ETF flows reached roughly $4.25B, including a $730.9M single-day inflow on September 3. The week also saw a $237M outflow Tuesday, showing that flows remain strong but aren’t one-way.The broader ETF trade is narrowing back toward BTC. ETH ETF inflows fell to $215M from $816M the prior week, including a midweek outflow day. For now, BTC ETF demand is doing the heavy lifting and providing solid support around current levels
5. The Week Ahead
US inflation data will dominate, but the sequence is what matters: CPI on Friday feeds directly into the FOMC and the CLARITY vote in the same 36 hours the following week, with hike odds near 60%.
6. Conclusion
This was one of crypto’s most important weeks in years for infrastructure, but barely mattered for price. Korea moved toward putting its securities market on-chain, Revolut cleared a major US regulatory hurdle, and Coinbase pushed single-stock perpetuals forward. Bitcoin gained ~2%, driven almost entirely by Fed comments and payrolls.
The reason is simple: infrastructure adoption and Bitcoin demand are different things. Bitcoin trades on liquidity, real rates and the dollar. Blockchain infrastructure moves on legislation and integration. The industry is increasingly exporting its rails without necessarily creating demand for its assets.
The cycle remains unresolved. ETF and institutional flows are strong, large holders are accumulating, and BTC is absorbing macro shocks better than before. But $81K has been rejected twice, liquidity remains weak, and CPI could quickly change the Fed outlook.
1
7
266
·
--
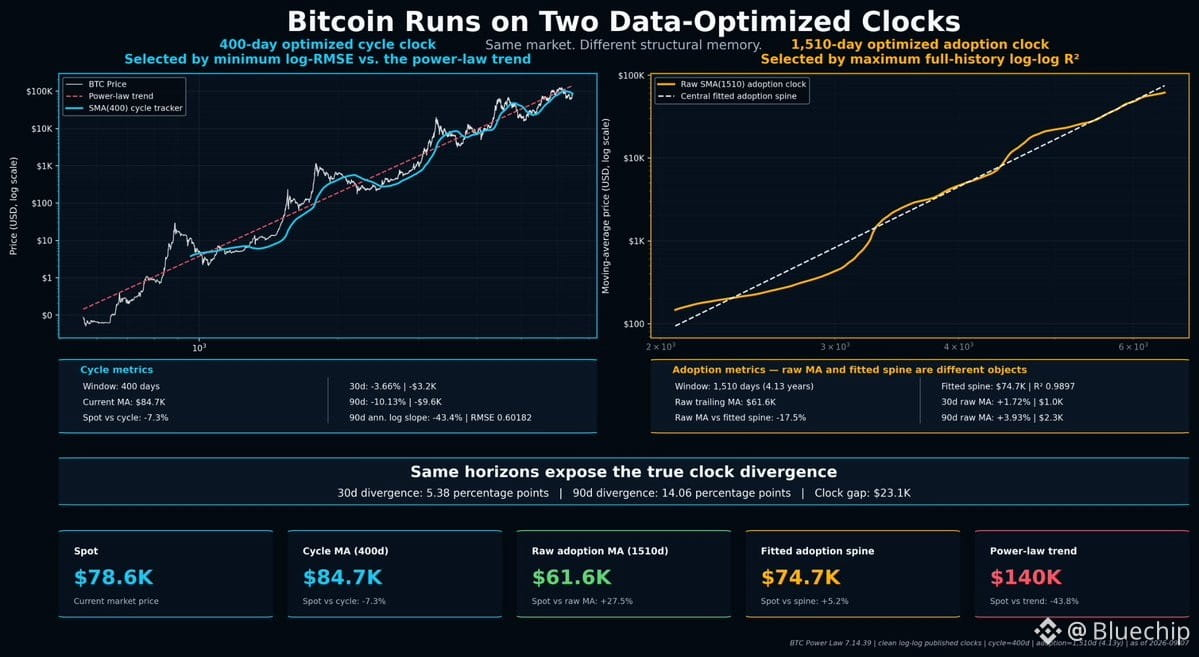
$BTC : THE PRICE CAN FALL. THE ADOPTION CLOCK KEEPS RISING.
Spot: $78.6K
Bitcoin is running on two clocks:
400-day cycle clock
30d: −3.7%
90d: −10.1%
1,510-day adoption clock
30d: +1.7%
90d: +3.9%
Same Bitcoin. Opposite signals.
Current structure:
Cycle MA: $84.7K
Adoption MA: $61.6K
Fitted adoption spine: $74.7K
Power-law trend: $140K
First principles:
Price is the noisy variable.
Adoption is the underlying variable that matters most for long-term price.
So BTC can sell off while the underlying monetary network continues compounding.
That is exactly what the data shows today:
Cycle down. Structure up.
Price can fall for a while, the foundation is getting stronger.
{future}(BTCUSDT)
$BTC : THE PRICE CAN FALL. THE ADOPTION CLOCK KEEPS RISING.
Spot: $78.6K
Bitcoin is running on two clocks:
400-day cycle clock
30d: −3.7%
90d: −10.1%
1,510-day adoption clock
30d: +1.7%
90d: +3.9%
Same Bitcoin. Opposite signals.
Current structure:
Cycle MA: $84.7K
Adoption MA: $61.6K
Fitted adoption spine: $74.7K
Power-law trend: $140K
First principles:
Price is the noisy variable.
Adoption is the underlying variable that matters most for long-term price.
So BTC can sell off while the underlying monetary network continues compounding.
That is exactly what the data shows today:
Cycle down. Structure up.
Price can fall for a while, the foundation is getting stronger.
Spot: $78.6K
Bitcoin is running on two clocks:
400-day cycle clock
30d: −3.7%
90d: −10.1%
1,510-day adoption clock
30d: +1.7%
90d: +3.9%
Same Bitcoin. Opposite signals.
Current structure:
Cycle MA: $84.7K
Adoption MA: $61.6K
Fitted adoption spine: $74.7K
Power-law trend: $140K
First principles:
Price is the noisy variable.
Adoption is the underlying variable that matters most for long-term price.
So BTC can sell off while the underlying monetary network continues compounding.
That is exactly what the data shows today:
Cycle down. Structure up.
Price can fall for a while, the foundation is getting stronger.
12
1.5k
·
--
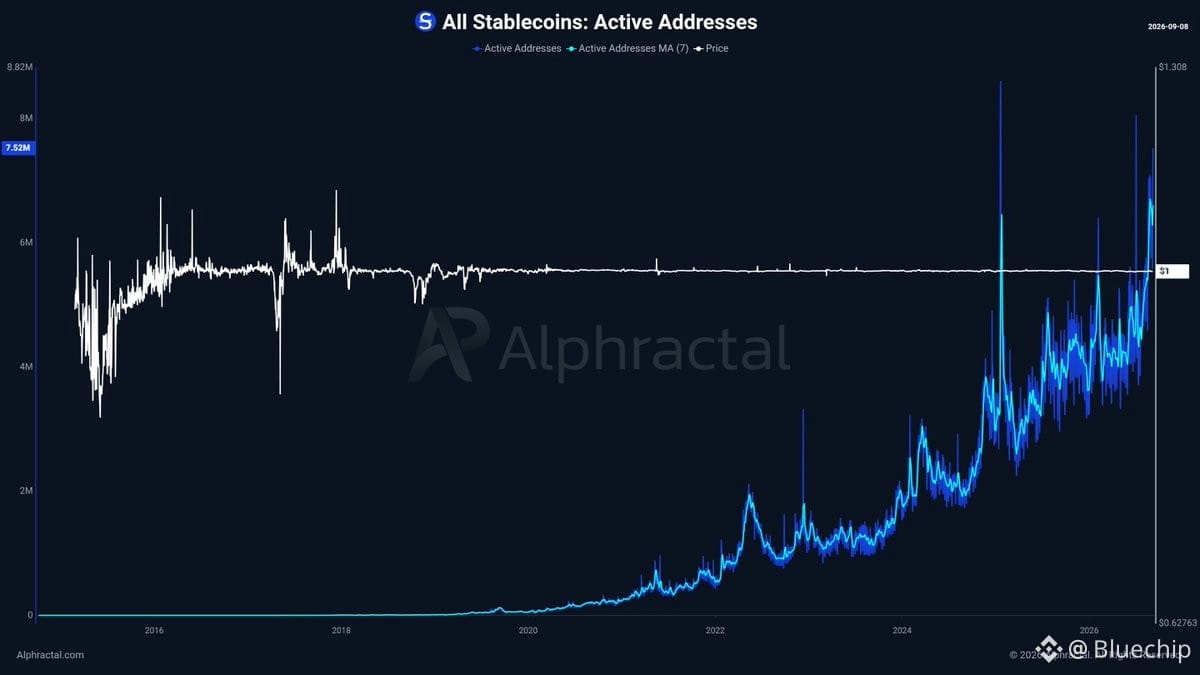
The number of active Stablecoin addresses simply keeps growing.
This trend reinforces a clear shift: Stablecoin usage is gaining strong global traction, with adoption continuing to expand across the crypto ecosystem.
Stablecoins are moving beyond being just a trading tool and are increasingly becoming an important part of the global digital financial infrastructure.
The number of active Stablecoin addresses simply keeps growing.
This trend reinforces a clear shift: Stablecoin usage is gaining strong global traction, with adoption continuing to expand across the crypto ecosystem.
Stablecoins are moving beyond being just a trading tool and are increasingly becoming an important part of the global digital financial infrastructure.
This trend reinforces a clear shift: Stablecoin usage is gaining strong global traction, with adoption continuing to expand across the crypto ecosystem.
Stablecoins are moving beyond being just a trading tool and are increasingly becoming an important part of the global digital financial infrastructure.
6
834
·
--
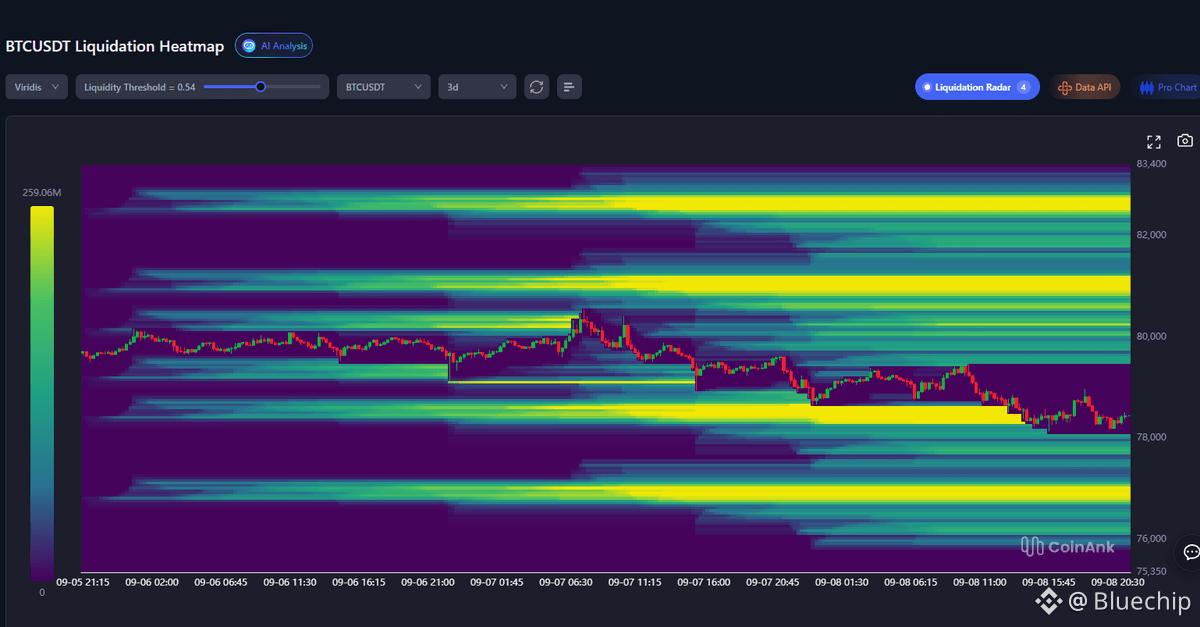
$BTC Liquidation Heatmap
BTC is sliding into the mid-range liquidity band.
The 3-day heatmap shows three clear intensity pockets:
Overhead: a bright short-liquidation cluster around $81,000 – $81,500
Mid: a dense band near $78,400 – $78,800 - price is already interacting with this zone
Below: another high-intensity pocket around $76,800 – $77,200
The $81k leverage has not been cleared. The latest selloff is testing the mid-band first. If this level fails, the next magnet is the bright cluster below $77k.
{future}(BTCUSDT)
$BTC Liquidation Heatmap
BTC is sliding into the mid-range liquidity band.
The 3-day heatmap shows three clear intensity pockets:
Overhead: a bright short-liquidation cluster around $81,000 – $81,500
Mid: a dense band near $78,400 – $78,800 - price is already interacting with this zone
Below: another high-intensity pocket around $76,800 – $77,200
The $81k leverage has not been cleared. The latest selloff is testing the mid-band first. If this level fails, the next magnet is the bright cluster below $77k.
BTC is sliding into the mid-range liquidity band.
The 3-day heatmap shows three clear intensity pockets:
Overhead: a bright short-liquidation cluster around $81,000 – $81,500
Mid: a dense band near $78,400 – $78,800 - price is already interacting with this zone
Below: another high-intensity pocket around $76,800 – $77,200
The $81k leverage has not been cleared. The latest selloff is testing the mid-band first. If this level fails, the next magnet is the bright cluster below $77k.
1
1
14
2.8k
·
--
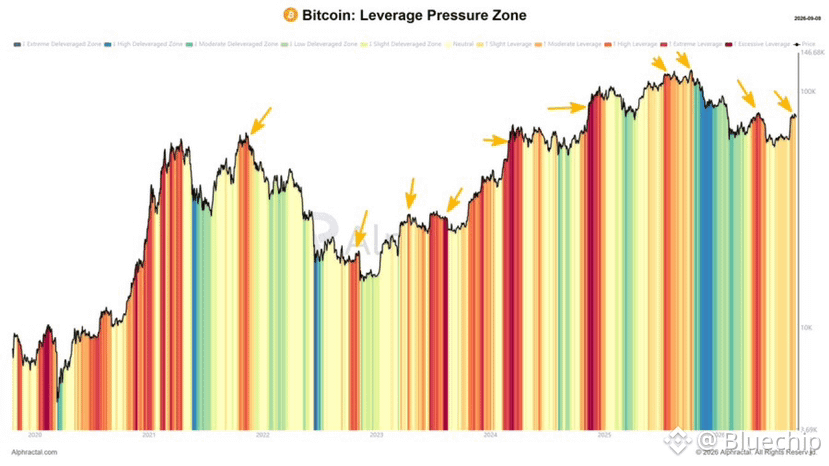
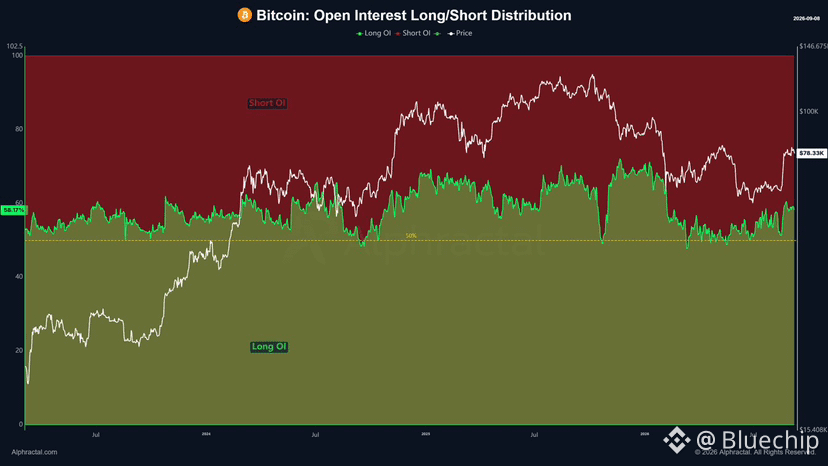
⚠️ $BTC has become highly leveraged again!
Not as aggressively as we’ve seen at some points in the past, but enough to suggest that another wave of liquidations could happen soon.
Most of the current positions are Longs!
{future}(BTCUSDT)
⚠️ $BTC has become highly leveraged again!
Not as aggressively as we’ve seen at some points in the past, but enough to suggest that another wave of liquidations could happen soon.
Most of the current positions are Longs!
Not as aggressively as we’ve seen at some points in the past, but enough to suggest that another wave of liquidations could happen soon.
Most of the current positions are Longs!
3
19
10.1k
·
--
The fundamental security of the Bitcoin network has never been broken.
Throughout its history, what we have mainly seen hacked are infrastructures built around Bitcoin: exchanges, custodians, wallet software, third-party services, as well as phishing attacks and private key theft.
That is very different from someone actually breaking Bitcoin’s cryptography or taking control of the blockchain itself.
Obviously, no system should ever be considered completely invulnerable. Bitcoin itself has had important bugs that were identified and fixed throughout its history.
But after more than 17 years, the network’s resilience against attacks remains, in my opinion, one of Bitcoin’s most impressive characteristics.
And if the fundamental security of the Bitcoin blockchain is ever truly broken, I would probably be one of the first to leave the crypto market.
{future}(BTCUSDT)
The fundamental security of the Bitcoin network has never been broken.
Throughout its history, what we have mainly seen hacked are infrastructures built around Bitcoin: exchanges, custodians, wallet software, third-party services, as well as phishing attacks and private key theft.
That is very different from someone actually breaking Bitcoin’s cryptography or taking control of the blockchain itself.
Obviously, no system should ever be considered completely invulnerable. Bitcoin itself has had important bugs that were identified and fixed throughout its history.
But after more than 17 years, the network’s resilience against attacks remains, in my opinion, one of Bitcoin’s most impressive characteristics.
And if the fundamental security of the Bitcoin blockchain is ever truly broken, I would probably be one of the first to leave the crypto market.
Throughout its history, what we have mainly seen hacked are infrastructures built around Bitcoin: exchanges, custodians, wallet software, third-party services, as well as phishing attacks and private key theft.
That is very different from someone actually breaking Bitcoin’s cryptography or taking control of the blockchain itself.
Obviously, no system should ever be considered completely invulnerable. Bitcoin itself has had important bugs that were identified and fixed throughout its history.
But after more than 17 years, the network’s resilience against attacks remains, in my opinion, one of Bitcoin’s most impressive characteristics.
And if the fundamental security of the Bitcoin blockchain is ever truly broken, I would probably be one of the first to leave the crypto market.
1
11
663
·
--
$BTC
“Very Bullish” sentiment is now dominating social media.
Investor conviction is much stronger than it was after the price bottom in late 2022 and early 2023.
This time, many investors seem highly confident that the bottom is already in, which is very different from the uncertainty we saw in 2023.
Will it really be that easy?
Or could the current “Very Bullish” sentiment itself become an imminent risk, setting the stage for another wave of forced liquidations among bulls?
{future}(BTCUSDT)
$BTC
“Very Bullish” sentiment is now dominating social media.
Investor conviction is much stronger than it was after the price bottom in late 2022 and early 2023.
This time, many investors seem highly confident that the bottom is already in, which is very different from the uncertainty we saw in 2023.
Will it really be that easy?
Or could the current “Very Bullish” sentiment itself become an imminent risk, setting the stage for another wave of forced liquidations among bulls?
“Very Bullish” sentiment is now dominating social media.
Investor conviction is much stronger than it was after the price bottom in late 2022 and early 2023.
This time, many investors seem highly confident that the bottom is already in, which is very different from the uncertainty we saw in 2023.
Will it really be that easy?
Or could the current “Very Bullish” sentiment itself become an imminent risk, setting the stage for another wave of forced liquidations among bulls?
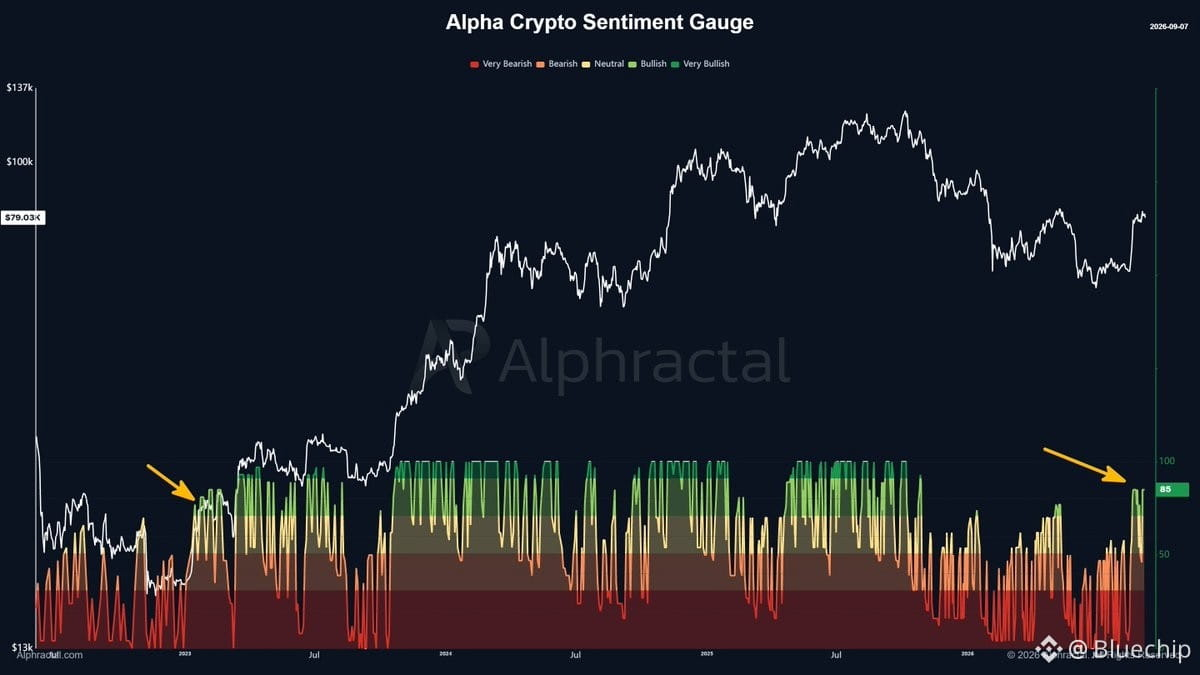
1
9
1.3k
·
--
Will we never see $BTC below $40K again?
This is not a prediction. It is simply an interesting observation based on the Balanced Price, a metric that has historically been extremely effective at identifying deep Bitcoin cycle bottoms.
The cumulative time between the main price interactions with this zone has been increasing:
732 days → 1.12K → 1.20K → 1.42K days
The current cycle has already accumulated approximately 1.40K days since the last interaction with the Balanced Price.
There is another interesting detail: the amount of time Bitcoin spends below this metric has also been decreasing. In the early cycles, it stayed below for several weeks, then around 20 days, later even less, and in 2022 the price remained below this zone for practically 1 day.
Today, the Balanced Price is near $38.4K.
Balanced Price adjusts the market’s aggregate cost basis by the long-term spending footprint of older coins, creating a valuation zone that has historically appeared during extreme capitulation periods.
This does not mean Bitcoin needs to return to $38K. The historical evolution itself raises a more interesting question:
What if, at some point, Bitcoin simply stops revisiting the Balanced Price?
On the other hand, if this historical behavior repeats once again, then yes, we would have an on-chain justification for considering the $40K region as a possible capitulation target.
{future}(BTCUSDT)
Will we never see $BTC below $40K again?
This is not a prediction. It is simply an interesting observation based on the Balanced Price, a metric that has historically been extremely effective at identifying deep Bitcoin cycle bottoms.
The cumulative time between the main price interactions with this zone has been increasing:
732 days → 1.12K → 1.20K → 1.42K days
The current cycle has already accumulated approximately 1.40K days since the last interaction with the Balanced Price.
There is another interesting detail: the amount of time Bitcoin spends below this metric has also been decreasing. In the early cycles, it stayed below for several weeks, then around 20 days, later even less, and in 2022 the price remained below this zone for practically 1 day.
Today, the Balanced Price is near $38.4K.
Balanced Price adjusts the market’s aggregate cost basis by the long-term spending footprint of older coins, creating a valuation zone that has historically appeared during extreme capitulation periods.
This does not mean Bitcoin needs to return to $38K. The historical evolution itself raises a more interesting question:
What if, at some point, Bitcoin simply stops revisiting the Balanced Price?
On the other hand, if this historical behavior repeats once again, then yes, we would have an on-chain justification for considering the $40K region as a possible capitulation target.
This is not a prediction. It is simply an interesting observation based on the Balanced Price, a metric that has historically been extremely effective at identifying deep Bitcoin cycle bottoms.
The cumulative time between the main price interactions with this zone has been increasing:
732 days → 1.12K → 1.20K → 1.42K days
The current cycle has already accumulated approximately 1.40K days since the last interaction with the Balanced Price.
There is another interesting detail: the amount of time Bitcoin spends below this metric has also been decreasing. In the early cycles, it stayed below for several weeks, then around 20 days, later even less, and in 2022 the price remained below this zone for practically 1 day.
Today, the Balanced Price is near $38.4K.
Balanced Price adjusts the market’s aggregate cost basis by the long-term spending footprint of older coins, creating a valuation zone that has historically appeared during extreme capitulation periods.
This does not mean Bitcoin needs to return to $38K. The historical evolution itself raises a more interesting question:
What if, at some point, Bitcoin simply stops revisiting the Balanced Price?
On the other hand, if this historical behavior repeats once again, then yes, we would have an on-chain justification for considering the $40K region as a possible capitulation target.
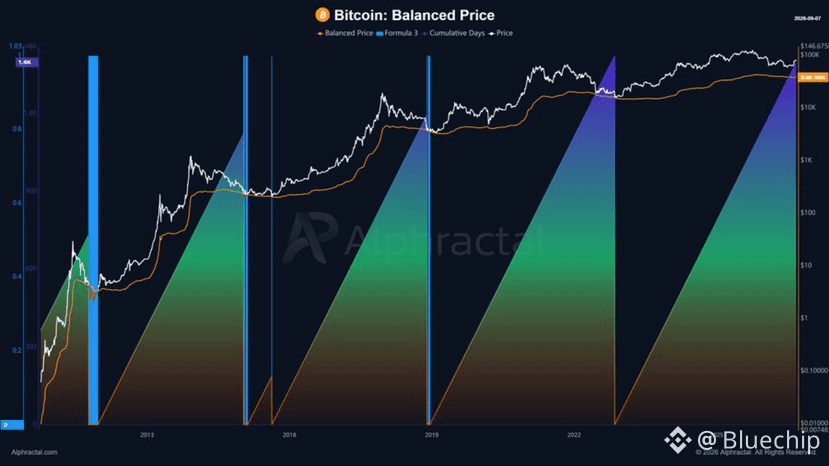
10
1.2k
·
--
$9.07B in unrealized profit just printed for $BTC STH whales - the largest on-chain record ever.
They're also the first cohort to dump when price shifts.
Are they about to cash out, or does the floor hold?
{future}(BTCUSDT)
$9.07B in unrealized profit just printed for $BTC STH whales - the largest on-chain record ever.
They're also the first cohort to dump when price shifts.
Are they about to cash out, or does the floor hold?
They're also the first cohort to dump when price shifts.
Are they about to cash out, or does the floor hold?
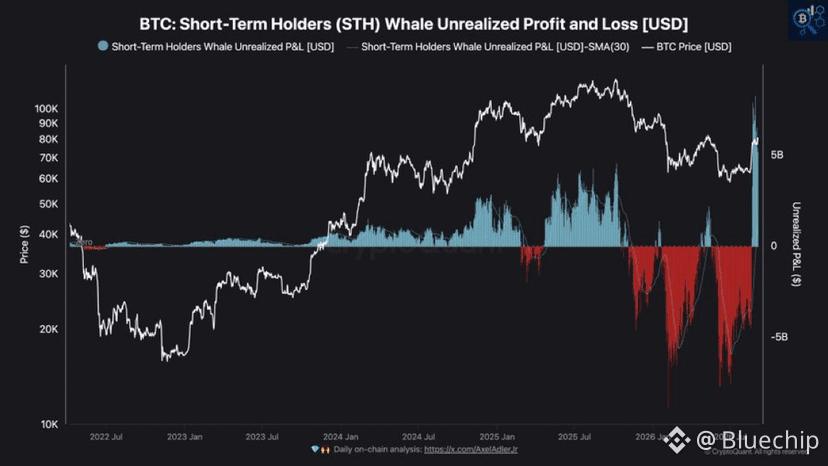
7
1k
·
--
$BTC Chart Analysis
BTC is currently trading around $79,434.
The 1H structure is a post-impulse digestion. Price ran to $82,268, failed to hold the high, and has been chopping under the $80,400–$80,800 supply zone. The latest dip is testing the lower edge of the mid-range.
Key levels:
Swing high: $82,268
Nearby resistance: $80,000 - $80,800
Range support: $79,200 - $79,400
Lower FVG: $78,000 - $78,400
Major low: $76,234
This is still a consolidation after the expansion not a confirmed breakdown. Lose $79,200 and the next magnet is the FVG below.
{future}(BTCUSDT)
$BTC Chart Analysis
BTC is currently trading around $79,434.
The 1H structure is a post-impulse digestion. Price ran to $82,268, failed to hold the high, and has been chopping under the $80,400–$80,800 supply zone. The latest dip is testing the lower edge of the mid-range.
Key levels:
Swing high: $82,268
Nearby resistance: $80,000 - $80,800
Range support: $79,200 - $79,400
Lower FVG: $78,000 - $78,400
Major low: $76,234
This is still a consolidation after the expansion not a confirmed breakdown. Lose $79,200 and the next magnet is the FVG below.
BTC is currently trading around $79,434.
The 1H structure is a post-impulse digestion. Price ran to $82,268, failed to hold the high, and has been chopping under the $80,400–$80,800 supply zone. The latest dip is testing the lower edge of the mid-range.
Key levels:
Swing high: $82,268
Nearby resistance: $80,000 - $80,800
Range support: $79,200 - $79,400
Lower FVG: $78,000 - $78,400
Major low: $76,234
This is still a consolidation after the expansion not a confirmed breakdown. Lose $79,200 and the next magnet is the FVG below.
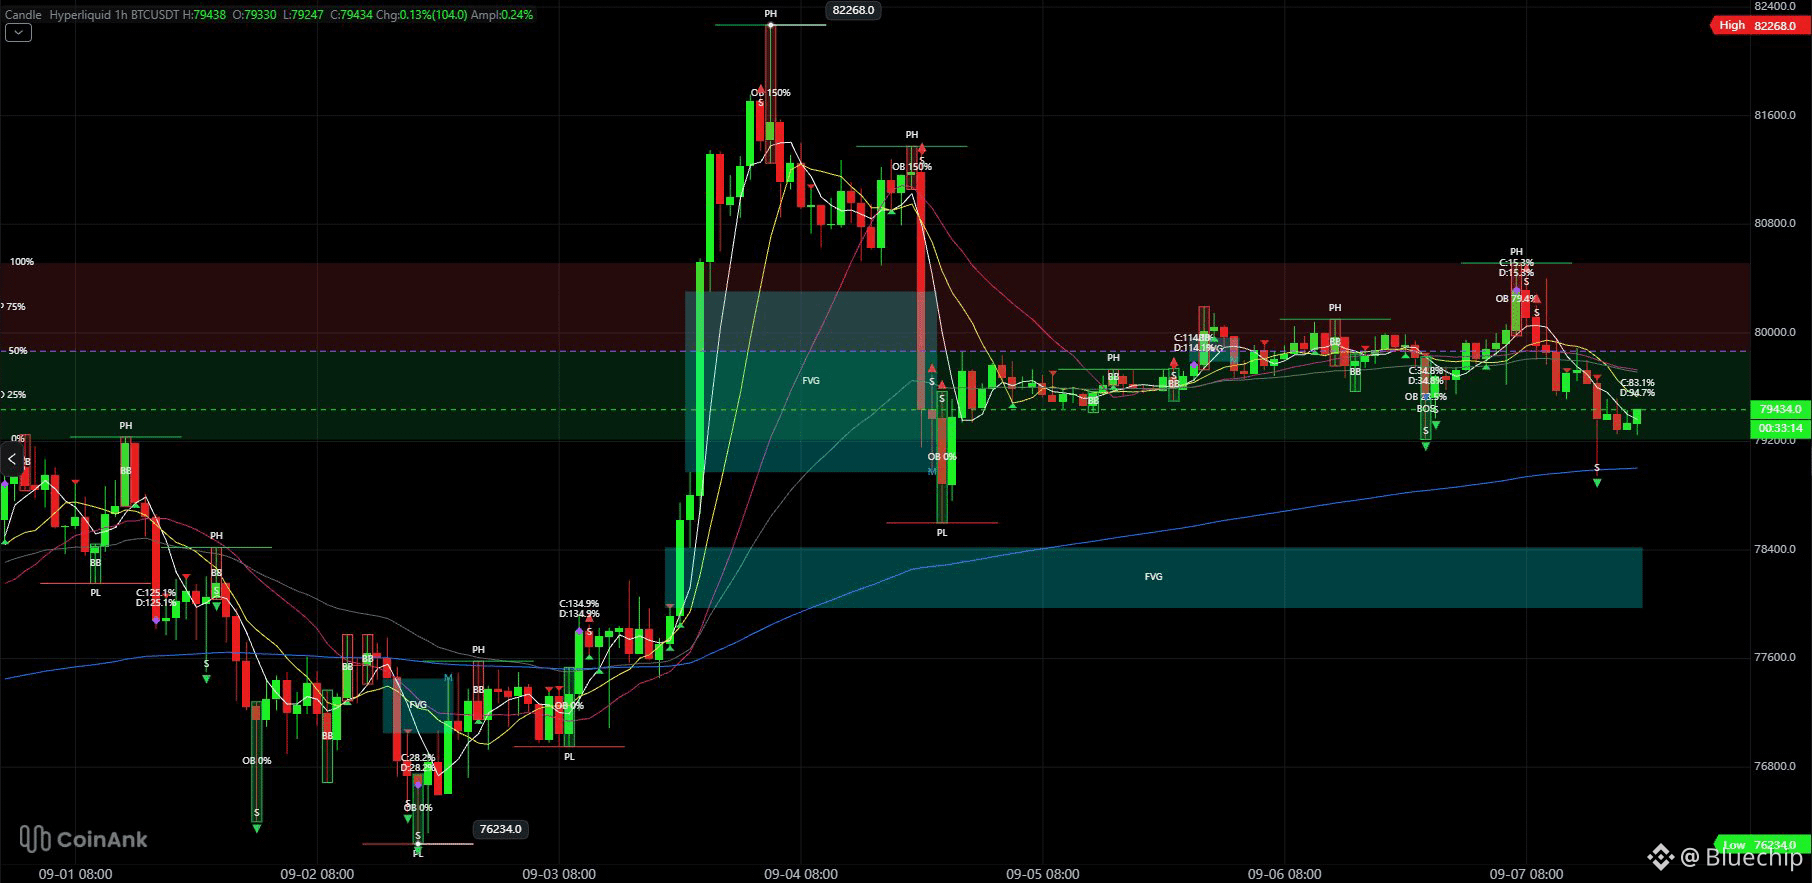
11
1.6k
Log in to explore more content
Join global crypto users on Binance Square
⚡️ Get latest and useful information about crypto.
💬 Trusted by the world’s largest crypto exchange.
👍 Discover real insights from verified creators.
Email / Phone number
Trending Topics
AppleDebutsFoldablePhone
33,033 views
703 Discussing
Apple just dropped the foldable iPhone — and the market is paying attention. This isn't just another product cycle; it's a new product category, a new CEO on stage, and a $1,999 price tag that pushes $AAPL further into ultra-premium territory. Foldables are the narrative, and Apple is now the headline.
#appledebutsfoldablephone #EUExtendsCentralContactPointToCASPs #US10YTreasuryYieldHitsHighestSinceNov2023 #BrentCrudeTops$100 #USTreasuryToBuyBackUpTo$6BLongDatedDebt
KimHotbae
·2 Likes
·2.8k views
TSMCAugustRevenueUp53.3%YoY
4,521 views
173 Discussing
IranSaysReadyToEscalateWarWithUS
8,061 views
204 Discussing