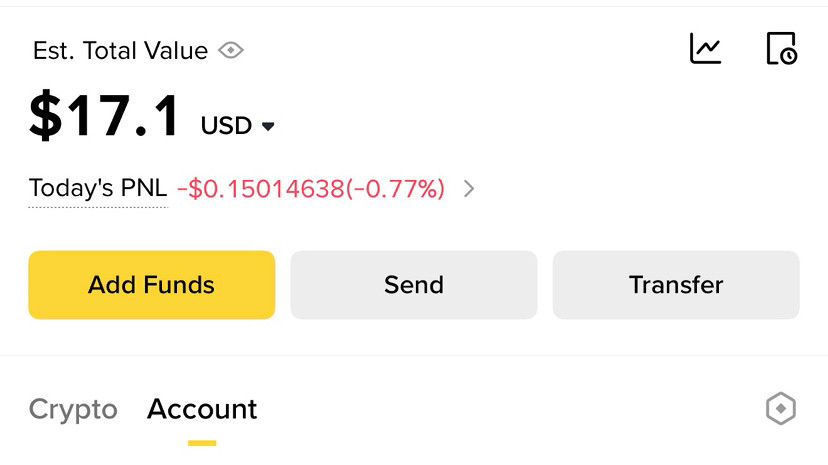
Many people think you need a big account to make real money in trading. That’s not true. The truth is simple it’s not about how much you start with, it’s about how you manage what you have. Yes, it is absolutely possible to turn $17 into $100. But not by luck, not by gambling, and definitely not by chasing every pump you see. It requires discipline, patience, and a clear plan. First, you need to understand one thing: small capital requires smart execution. You can’t afford big mistakes. One bad trade with high risk can wipe out your account. That’s why risk management becomes your strongest weapon. Set a daily target. It doesn’t need to be huge. Even 3%–5% per day is enough. It may sound small, but consistency compounds faster than you think. If you stay disciplined, those small wins start building into something big. Second, patience is everything. You don’t need to trade every day or every setup. Wait for clear opportunities strong support and resistance, clean breakouts, or obvious rejection zones. The market always gives chances, but only patient traders take the right ones. Third, control your emotions. With a small account, people often overtrade because they want fast results. That’s where most fail. They increase leverage, take random entries, and ignore their plan. You have to do the opposite stay calm, follow your setup, and accept slow growth. Another important point is consistency over hype. You don’t need one big win. You need many small correct decisions. That’s what builds your account. Even if you grow your account from $17 to $20, then $25, then $35 you are already winning. Also, protect your capital at all costs. If you lose your account, the journey ends. If you protect it, you always have another chance. In simple terms: You don’t grow a small account by rushing You grow it by repeating a disciplined process again and again So yes, turning $17 into $100 is possible. But only for those who are willing to stay patient, follow a plan, and trade with control instead of emotion. The market rewards consistency, not desperation Start small Stay focused And let your discipline do the work Trade Only coins Like $ETH , $BNB & $SOL #cryptotradingpro #RiskManagementMastery
It took me 4 years in the crypto market to realize these things & you only need 2 minutes to read: 🤏
1. No matter the market condition, one thing stays the same: 8% of people will own 21 million Bitcoin. 2. Financial, capital, and risk management skills are 100 times more important than technical analysis or crypto research. 3. Earning while you sleep: There are many ways to make money in the crypto market without actively trading.
On average, #Bitcoin has increased more than 100% per year over the past 15 years. Yet, why do so few people make money? Because getting rich quickly is a common mentality. If you can't dedicate at least 4 hours a day to crypto, stick to Bitcoin and ETH—70% in BTC and 30% in ETH.
Trust no one: Trust leads to hope, disappointment, and errors. Learn independently and take responsibility for your actions. This is how to gain automatic minting experience!
The ultimate goal of investing: Make life more meaningful. If crypto investing can achieve that, do it. If not, reconsider.
Crypto is now a financial market: Originally born from technology, it's now influenced by macroeconomics and connected to mainstream financial markets.
People may discourage you from buying Bitcoin, but remember, once something is widely accepted, the opportunity might be gone. Seize your chance now!
Invest wisely, make meaningful choices, and let crypto pave the way to a better future.
Hy my dear community dont miss this pump now…!! $ZEC Will pump again on this poin if you want to make good profit entry now on this And enjoy tha profit..!!
$牛来 — Bulls Are Still In Control, But Watch This Zone The chart shows a strong bullish move with higher highs and higher lows, but price is now pulling back from the 0.1500 area. If 0.1330–0.1360 holds as support, it can push back toward 0.1450 and 0.1500, while a clean break below 0.1330 could weaken the setup.
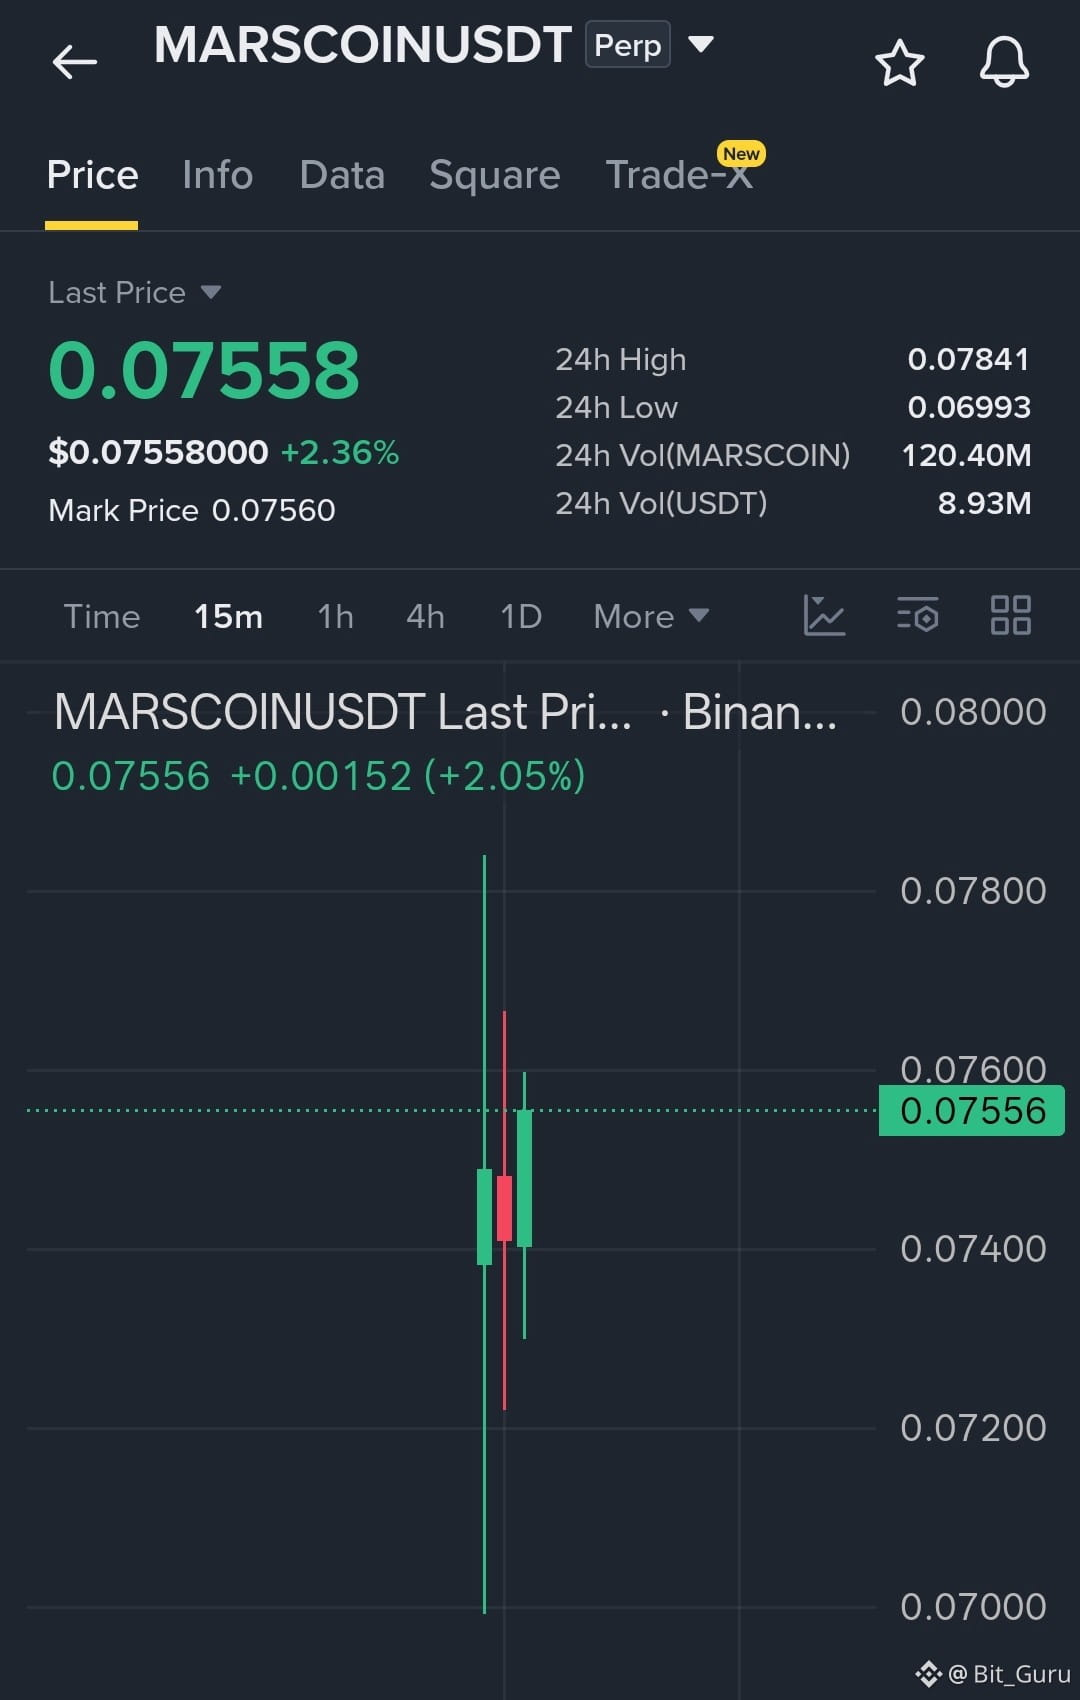
MARSCOINUSDT: Strong Momentum Meets an Unproven Stock-Linked Narrative
𝗧𝗵𝗲 𝗺𝗼𝘃𝗲 𝘁𝗵𝗮𝘁 𝗽𝘂𝘁 𝗠𝗔𝗥𝗦𝗖𝗢𝗜𝗡 𝗼𝗻 𝘁𝗵𝗲 𝗿𝗮𝗱𝗮𝗿 MARSCOINUSDT is appearing on the scanner after a sharp rise in price, heavy recent trading activity, and strong short-term momentum. The RR Trader scanner selected the pair with a LONG direction, 88.9 confidence, a selection score of 174.64, and a TOP_GAINER rank of 3. At the time of the scanner snapshot, the pair was quoted near $0.12723, up 3.42% over 15 minutes. Its reported volume ratio was 1.0387. The broader market data shows an equally active session. The Binance ticker recorded a last price of $0.12762, a 24-hour open of $0.10492, a high of $0.13300, and a low of $0.09723. That represented a 21.636% increase across the reported 24-hour period, with approximately $190.14 million in quote volume and more than 1.6 billion MARSCOIN traded. CoinGecko reported a nearby price of $0.127854, a 24-hour gain of 21.82%, and approximately $103.52 million in total volume. These figures come from different data sources and coverage sets, so they are not identical. Still, they point to the same conclusion: MARSCOIN has become an unusually active and volatile token during the reported period. 𝗪𝗵𝗮𝘁 𝗠𝗔𝗥𝗦𝗖𝗢𝗜𝗡 𝗶𝘀 𝘀𝘂𝗽𝗽𝗼𝘀𝗲𝗱 𝘁𝗼 𝗯𝗲 The available project description identifies MARSCOIN as a token launched on BNB Chain. Its stated concept is unusual: the project describes a crypto asset paired directly with a stock and designed to trade against SPCXB on Flap. The intended idea is to connect a traditional financial reference with decentralized finance through an on-chain token and blockchain-based transactions. That description presents MARSCOIN as an attempt to bring a stock-linked concept into a decentralized market environment. However, the available research does not verify that MARSCOIN represents equity ownership, gives holders legal rights to SPCXB, tracks the stock through a formal oracle, or provides redemption into a traditional asset. The stock-pairing language is therefore a project description, not proof that the token is legally backed by or economically interchangeable with a stock. The background information supplied for the project is limited. MARSCOIN is associated with BNB Chain, the Flap ecosystem, and the MarsCoin name. The research does not provide a whitepaper, official forum, public repository, developer activity, founding team, launch history, funding record, audited contract information, or detailed roadmap. That absence does not by itself establish that the project is invalid. It does mean that the token’s market narrative is currently more clearly documented than its long-term fundamentals. 𝗨𝘁𝗶𝗹𝗶𝘁𝘆 𝗮𝗻𝗱 𝗲𝗰𝗼𝘀𝘆𝘀𝘁𝗲𝗺 MARSCOIN’s stated utility is centered on its stock-linked trading concept and its position within the Flap ecosystem. The supplied market data places the token in the BNB Chain Ecosystem, Meme, Binance Alpha Spotlight, and Flap Ecosystem categories. The same data identifies a BNB Chain contract and repeats the project’s description that it was designed to trade against SPCXB on Flap. Beyond that description, the research does not provide evidence of a broader application layer. There is no verified information about staking, lending, governance, fee sharing, payments, gaming, non-fungible tokens, or a functioning decentralized application. Total value locked is unavailable, and developer data is empty. The most defensible description is therefore that MARSCOIN currently trades primarily as a market token with a stock-linked decentralized-finance narrative, rather than as a project with a fully documented suite of products. This is where the token’s appeal and weakness overlap. A simple concept can attract attention quickly, particularly when it is connected to a meme category and a fast-moving ecosystem. At the same time, the available data does not show how much demand comes from actual utility compared with speculation, short-term momentum, liquidity rotation, or market attention. 𝗦𝘂𝗽𝗽𝗹𝘆, 𝘃𝗮𝗹𝘂𝗮𝘁𝗶𝗼𝗻, 𝗮𝗻𝗱 𝗺𝗮𝗿𝗸𝗲𝘁 𝘀𝗶𝘇𝗲 The reported total supply, maximum supply, and circulating supply are each 1 billion MARSCOIN. The supplied data therefore shows no apparent difference between the reported circulating supply and maximum supply. CoinGecko reported a market capitalization of approximately $128.58 million and ranked the token at 235. Fully diluted valuation was also reported at approximately $128.58 million, producing a market-cap-to-FDV ratio of 1. The dataset does not provide a separate outstanding token value, and reported total value locked is unavailable. At a price near $0.1278, MARSCOIN is not among the smallest assets by reported market capitalization, although it remains capable of large percentage movements when trading activity becomes concentrated. CoinGecko reported that the market capitalization rose by about 22.5% during the 24-hour period, an increase of approximately $23.63 million. Reported volume of about $103.52 million against a market capitalization near $128.58 million indicates a high level of turnover relative to the stated valuation. That can reflect strong interest, but it can also be consistent with rapid entries and exits in a highly speculative market. MARSCOIN’s reported all-time high is $0.263444, reached on September 5, 2026. At the supplied price, the token remained approximately 51.5% below that peak. Its reported all-time low was $0.02333067 on August 21, 2026, placing the current price several times above that level. Together, those figures show that the token has experienced substantial volatility over a short period. The current advance is occurring after a major repricing rather than within a long, stable trading history. 𝗥𝗲𝗮𝗱𝗶𝗻𝗴 𝘁𝗵𝗲 𝗿𝗲𝗰𝗲𝗻𝘁 𝗺𝗮𝗿𝗸𝗲𝘁 𝘀𝘁𝗿𝘂𝗰𝘁𝘂𝗿𝗲 The hourly candles show a strong move from the $0.09723 low toward the $0.13300 high. Early in the sequence, MARSCOIN advanced from roughly $0.1025 toward $0.1173, then continued through approximately $0.1232 and $0.1283. Several candles recorded wide ranges and high turnover, including an hourly volume reading above 125.9 million tokens and later periods above 100 million tokens. This is not a low-energy, narrowly contained advance. Buyers and sellers have both been active, and the market has moved rapidly through several price areas. The short-term structure remains constructive because price recovered from below $0.10, established higher highs during the move, and remained close to $0.127 when the latest data was captured. The four-hour data also shows a recovery sequence after a decline toward $0.09802. However, the candles also contain long wicks and sharp reversals. The market reached $0.12950 during one four-hour period but closed much lower. Another four-hour period traded between approximately $0.11268 and $0.12837. These movements show that rejection near the upper range is a meaningful possibility. The reported 14-day return of 229.63% and 30-day return of 119.02% make the trend notable, but they also make the structure fragile. Momentum can remain strong while attention and trading activity persist. A fast advance can also unwind quickly if buyers stop pursuing higher prices. 𝗪𝗵𝘆 𝘁𝗵𝗲 𝘀𝗰𝗮𝗻𝗻𝗲𝗿 𝗳𝗹𝗮𝗴𝗴𝗲𝗱 𝗮 𝗹𝗼𝗻𝗴 𝘀𝗲𝘁𝘂𝗽 The scanner’s setup is based on price holding near the current area rather than immediately reversing after the intraday advance. It marked support at $0.12654 and resistance at $0.12832. Its stated entry zone was approximately $0.127039 to $0.127166, with a stop-loss reference at $0.126160. The projected upside levels were $0.128998, $0.129915, and $0.130831. The reported risk-reward value was 1.8212. The logic is straightforward. MARSCOIN was trading near the scanner’s support area, short-term momentum was positive, and the token had already moved through several nearby levels. A hold around $0.12654 followed by a move above $0.12832 would be consistent with the scanner’s continuation interpretation. The first projected level near $0.12900 would return price toward the recent upper range, while the later levels would test whether the move could extend beyond that range. The scanner output is a model reading, not a certainty. Its confidence score does not establish that the projected path will occur, and the volume ratio of 1.0387 is only modestly above its comparison baseline. The broader 24-hour volume is large, but the immediate scanner reading does not show an overwhelming increase relative to recent activity. Price behavior and participation therefore remain important to the setup. A move above resistance without sustained activity could become a temporary wick rather than a durable breakout. 𝗕𝗶𝘁𝗰𝗼𝗶𝗻 𝗮𝗻𝗱 𝘁𝗵𝗲 𝗯𝗿𝗼𝗮𝗱𝗲𝗿 𝗺𝗮𝗿𝗸𝗲𝘁 Bitcoin was trading near $77,129.10 in the supplied market snapshot, down 1.116% over 24 hours. Its reported range was $76,402.90 to $78,028.80, with approximately $10.24 billion in quote volume. MARSCOIN therefore recorded a strong gain while Bitcoin was slightly negative, indicating relative strength during this specific period. That relative strength is constructive for MARSCOIN’s immediate momentum, but it also highlights a risk. Smaller altcoins can outperform while Bitcoin is stable or weak, yet they can remain sensitive to a sudden change in broader market sentiment. If Bitcoin moves sharply lower or risk appetite fades, MARSCOIN’s recent volatility could amplify the downside. If Bitcoin stabilizes and capital continues moving into BNB Chain, Flap, meme, or other high-momentum assets, MARSCOIN may continue to receive short-term attention. The data does not show that Bitcoin must rise for MARSCOIN to rise. The recent session demonstrates that MARSCOIN can move independently for periods. It does show, however, that the token’s advance is taking place without a strong upward move from the main benchmark, leaving the token’s own momentum and trading activity as the primary visible drivers in the supplied data. 𝗡𝗲𝘄𝘀, 𝗼𝗽𝗲𝗻 𝗶𝗻𝘁𝗲𝗿𝗲𝘀𝘁, 𝗮𝗻𝗱 𝗽𝗼𝘀𝘀𝗶𝗯𝗹𝗲 𝗰𝗮𝘁𝗮𝗹𝘆𝘀𝘁𝘀 The supplied news feed contains several recent references to MarsCoin. A CryptoSlate result covered the token’s price, market capitalization, and volume. KuCoin published an explainer titled “What is Marscoin (MARS) in crypto?” Binance Academy also published an article titled “What Is MarsCoin (MARSCOIN)?” These entries establish that the asset has received recent media and educational coverage, but the research does not show that any of those publications caused the rally or introduced new protocol functionality. The feed also includes a SunCrypto headline reporting three futures listings, including MARSCOIN. That headline could represent a potential liquidity or derivatives-related development, but the supplied research does not independently verify the announcement, its contract terms, or whether the listing materially changed open interest. It is therefore best treated as a reported news item rather than confirmed evidence of a fundamental upgrade. Open interest for MARSCOINUSDT was reported at 210,488,797 in the market snapshot. This indicates an active derivatives market, although the data does not show whether open interest is increasing alongside price, whether longs or shorts dominate, or how much of the move may be associated with liquidations. Potentially meaningful future developments would include clearer project documentation, confirmed ecosystem integration, sustained trading activity, or credible evidence that the stock-linked mechanism functions as described. None of those developments is verified in the supplied research. 𝗟𝗲𝘃𝗲𝗹𝘀, 𝗿𝗶𝘀𝗸𝘀, 𝗮𝗻𝗱 𝘄𝗵𝗮𝘁 𝗰𝗼𝘂𝗹𝗱 𝗵𝗮𝗽𝗽𝗲𝗻 𝗻𝗲𝘅𝘁 For the immediate chart, the scanner’s $0.12654 support is the first reference area, with $0.12616 acting as its stated invalidation level. A sustained move below those levels would weaken the specific continuation setup because it would show that buyers were unable to defend the nearby base. On the upside, $0.12832 is the scanner’s resistance, followed by $0.128998, $0.129915, and $0.130831. The broader recent high at $0.13300 is another important reference, although the data does not establish that price will revisit it. The risks are substantial. MARSCOIN is categorized as a meme asset and has risen more than 200% over the reported two-week period, making profit-taking and sharp reversals realistic possibilities. The project also has no verified whitepaper in the supplied data, no developer metrics, no stated TVL, and no documented roadmap. Its stock-linked concept raises unanswered questions involving legal status, oracle design, liquidity, and redemption. The research does not verify equity ownership, regulatory status, collateral, or a mechanism that requires the token to track SPCXB. There is also a potential name-confusion issue. The market data identifies this asset as CoinGecko’s MarsCoin on BNB Chain with the MARSCOIN symbol, while other crypto projects may use similar names or symbols. Contract identity and venue details remain important when interpreting announcements or price feeds. Finally, elevated open interest can magnify both continuation and liquidation moves. Useful signals include whether price holds the $0.12654 area, whether activity expands during a move above $0.12832, whether the market can approach $0.13300 without a sharp rejection, and whether Bitcoin remains orderly within its reported range. 𝗕𝗮𝗹𝗮𝗻𝗰𝗲𝗱 𝗰𝗼𝗻𝗰𝗹𝘂𝘀𝗶𝗼𝗻 MARSCOINUSDT is drawing attention because three forces are meeting at once: a distinctive stock-linked narrative, a powerful short-term price trend, and a scanner setup with support and resistance close to the current market. The token has a reported circulating supply of 1 billion units, an estimated market capitalization near $128.6 million, substantial recent volume, and strong relative performance while Bitcoin was down. The documented foundation remains limited. The available research does not verify a whitepaper, founding team, audited mechanism, stock backing, redemption process, or meaningful application beyond the stated BNB Chain and Flap connection. The rally may extend if momentum, activity, and attention remain strong, but the same structure could reverse quickly after a failed breakout or a loss of nearby support. The clearest interpretation is that MARSCOIN is a high-volatility momentum asset built around a promising but insufficiently documented narrative. The scanner is highlighting a possible continuation zone, not establishing a certain outcome. The next phase will depend on whether the token can hold its recent base, move through the $0.12832 resistance area, and provide stronger evidence that its ecosystem story extends beyond a fast-moving market theme.
My focus on $NOT is the location, not the size of the last candle. The 15m structure gives a clear decision area and the setup still has about 2.50 risk/reward. If the structure holds, 0.000421605 comes first and 0.000419551 next. The reaction at this level matters more than the headline.
Here is what matters on $RAYSOL : sellers need to keep the recent structure intact. Activity is not explosive yet, and I’m watching 1.5846 first and 1.5774 next. Let’s see whether buyers or sellers win this level.
My focus on $MUBARAK is the location, not the size of the last candle. The 15m structure gives a clear decision area and the setup still has about 1.92 risk/reward. If the structure holds, 0.029555 comes first and 0.029765 next. Would you take the first confirmation or wait for a retest?
My focus on $4 is the location, not the size of the last candle. The 15m structure gives a clear decision area and the setup still has about 1.98 risk/reward. If the structure holds, 0.019471 comes first and 0.019355 next. Would you wait for confirmation or the retest?
Here is what matters on $BEAT : sellers need to keep the recent structure intact. Activity is not explosive yet, and I’m watching 0.074031 first and 0.073527 next. Would you take the first confirmation or wait for a retest?
The interesting part of this $PIEVERSE setup is the structure. Price is sitting near the decision area while the 15m candles are leaning balanced. Volume is supporting the move, so the next candle matters. I’m watching 1.2013 and 1.1961. Let’s see whether buyers or sellers win this level.
$VELVET is holding an important area and buyers are starting to show interest. The 15m structure is still developing, so I would rather watch confirmation than chase a candle. 0.051983 is the first level I’m watching, followed by 0.052238. The reaction at this level matters more than the headline.
REZUSDT: Weakness at Support Keeps the Short Setup in Focus
𝗧𝗵𝗲 𝗳𝗶𝗿𝘀𝘁 𝘀𝗶𝗴𝗻𝗮𝗹 𝗶𝘀 𝘄𝗲𝗮𝗸𝗻𝗲𝘀𝘀, 𝗻𝗼𝘁 𝗲𝘅𝗰𝗶𝘁𝗲𝗺𝗲𝗻𝘁 REZUSDT has appeared on the live RR Trader scanner as a high-confidence short setup, but the more useful story is broader than a single directional label. Renzo’s token has fallen quickly from the upper 0.003s into a narrow support area, while trading activity remains substantial enough to keep the market active. That combination creates room for short-term volatility, but it also leaves open the possibility of a sharp rebound if sellers fail to break the floor. The scanner selected REZUSDT as a top loser, ranking it ninth in that category. Its recorded confidence was 97.97%, with a selection score of 162.62. Those figures describe the scanner’s reading of current market conditions; they do not prove that the next move must be lower. Price still has to confirm the setup through its behaviour around support, resistance, volume, and open interest. 𝗪𝗵𝗮𝘁 𝗥𝗲𝗻𝘇𝗼 𝗶𝘀 𝗯𝘂𝗶𝗹𝗱𝗶𝗻𝗴 Project information describes Renzo Finance as a blockchain technology company focused on making professional-grade yield strategies more accessible onchain. The problem it addresses is complexity. Strategies that traditionally required professional trading desks, active management, and specialised infrastructure can be difficult for users to access or operate. Renzo’s stated approach is to package and automate those strategies inside accounts that users already control. The project’s debut product is called Renzo Basis, a delta-neutral strategy operating on Hyperliquid. It buys spot exposure and shorts an equal-sized perpetual contract on the same asset. In theory, gains and losses from the asset’s price movement offset between the two positions, leaving the strategy focused on the funding rate paid by leveraged longs to shorts. The supplied project description says funding is settled hourly and identifies BTC and HYPE as the first markets, with more markets expected over time. That design matters because Renzo presents itself as infrastructure for accessing a complex yield strategy, rather than only as a speculative token project. The supplied description says users retain control of their assets and positions and that Renzo does not pool or take custody of their funds. Those statements describe the project’s model, but they do not remove smart-contract, exchange, execution, funding-rate, or market-structure risks. 𝗪𝗵𝗲𝗿𝗲 𝗥𝗘𝗭 𝗳𝗶𝘁𝘀, 𝗮𝗻𝗱 𝘄𝗵𝗮𝘁 𝗿𝗲𝗺𝗮𝗶𝗻𝘀 𝘂𝗻𝗰𝗹𝗲𝗮𝗿 REZ is the token associated with the Renzo ecosystem. The supplied classifications place Renzo in decentralised finance, restaking, the Ethereum and Base ecosystems, Binance Launchpool, and portfolios associated with YZi Labs and OKX Ventures. These classifications provide context, but they do not fully explain the token’s current utility. The research does not specify a detailed list of REZ functions such as governance rights, fee distribution, staking mechanics, or required usage inside Renzo Basis. It is therefore not possible to verify from this dataset exactly how REZ captures value from the project’s products. That distinction matters. A functioning product can exist while its associated token has limited direct demand, and platform growth should not automatically be treated as proof of token value capture. The research also does not provide a verified origin story with named founders, a launch date, or a full development timeline. What can be stated is that Renzo Finance is presented as an onchain yield-infrastructure builder, with portfolio connections to YZi Labs and OKX Ventures shown in the project’s classification data. More specific claims about founding history or early financing are not supported by the supplied material. 𝗦𝘂𝗽𝗽𝗹𝘆, 𝘃𝗮𝗹𝘂𝗮𝘁𝗶𝗼𝗻, 𝗮𝗻𝗱 𝘁𝗵𝗲 𝘀𝗺𝗮𝗹𝗹-𝗰𝗮𝗽 𝗿𝗲𝗮𝗹𝗶𝘁𝘆 REZ has a maximum supply of 10 billion tokens. The reported total supply is approximately 9.815 billion, while circulating supply is approximately 8.876 billion. The reported outstanding supply is approximately 8.017 billion. These figures are not identical, so circulating, outstanding, total, and maximum supply should be treated as separate measures. At the supplied snapshot, CoinGecko showed a price near $0.00302477, a market capitalisation of approximately $26.85 million, a fully diluted valuation of approximately $29.69 million, and a market-cap-to-FDV ratio of 0.90. The reported market-cap rank was 701. A valuation of that size helps explain why REZ can move sharply when trading activity changes, while also making liquidity and price stability important considerations. The project’s reported total value locked was approximately $378.77 million. That produced a market-cap-to-TVL ratio of 0.07 and an FDV-to-TVL ratio of 0.08. Those ratios should not be read as proof that REZ is undervalued. TVL measures capital associated with protocols or strategies, while a token’s market value also depends on supply, demand, utility, unlocks, liquidity, confidence, and broader market conditions. The dataset does not provide a full unlock schedule, allocation breakdown, or vesting calendar. Future supply pressure therefore cannot be assessed in detail from this information alone. 𝗧𝗵𝗲 𝗰𝘂𝗿𝗿𝗲𝗻𝘁 𝗺𝗮𝗿𝗸𝗲𝘁 𝘀𝘁𝗿𝘂𝗰𝘁𝘂𝗿𝗲 𝗶𝘀 𝗮 𝗵𝗮𝗿𝗱 𝗿𝗲𝗷𝗲𝗰𝘁𝗶𝗼𝗻 𝗳𝗿𝗼𝗺 𝗵𝗶𝗴𝗵𝗲𝗿 𝗹𝗲𝘃𝗲𝗹𝘀 Binance market data recorded REZUSDT at $0.003015 in the latest ticker snapshot, down 13.012% over the quoted 24-hour period. The 24-hour high was $0.003708 and the low was $0.003003. Quote volume was approximately 39.95 million USDT, with about 11.81 billion REZ traded. CoinGecko’s separate snapshot showed a price near $0.00302477, a 24-hour decline of 13.90%, a 24-hour high of $0.00376243, a low of $0.00301422, and total reported volume of approximately $24.45 million. Differences between providers and timestamps are normal, so the exact last price depends on the moment and venue being observed. The hourly candles show the key sequence. REZ first pushed from the low 0.003s toward 0.0037, then lost momentum and began printing lower closes. The market later moved through 0.0032 and 0.0031, reaching the 0.003003 area. The four-hour data shows an even larger burst: one four-hour candle traded from 0.003109 to a high of 0.003922 before closing at 0.003533, followed by several declining candles. The sequence resembles a sharp expansion followed by distribution and retracement rather than a clean continuation rally. The longer-term picture is mixed. REZ was up 10.63% over 30 days and 21.35% over 60 days according to the supplied data, but it was down 42.60% over 200 days and 74.80% over one year. The token remains approximately 98.91% below its recorded all-time high of $0.278213 from April 30, 2024. Short-term strength therefore sits inside a much larger damaged trend. 𝗪𝗵𝘆 𝘁𝗵𝗲 𝘀𝗰𝗮𝗻𝗻𝗲𝗿 𝗶𝘀 𝘄𝗮𝘁𝗰𝗵𝗶𝗻𝗴 𝗥𝗘𝗭𝗨𝗦𝗗𝗧 𝗻𝗼𝘄 The scanner’s short setup places the current trading area between an entry-low reference of 0.00303652 and an entry-high reference of 0.00303955. Its listed support is 0.00300562 and its resistance is 0.00303977. The scanner’s stop-loss reference is 0.00304889, while its projected targets are 0.00301627, 0.00300614, and 0.00299602. The reported risk-reward figure is 2.1677. In plain language, the setup is built around a failed or fragile rebound beneath nearby resistance. Price is hovering just above the 0.0030 area, and the scanner is looking for that support to give way rather than expecting a large immediate trend move. The three projected downside levels are tightly clustered because the market is compressed near the floor. That makes execution quality important: a small spread, wick, or sudden bounce can materially change the result. The 15-minute move was negative by 1.04%, while the scanner’s volume ratio was 0.9977, essentially around its comparison baseline. This is not a case of volume exploding at the precise moment of selection. The bearish reading comes more from price structure and relative weakness than from a dramatic new volume shock. Open interest was reported at approximately 1.087 billion REZ, confirming active derivatives positioning, but open interest alone cannot show whether new positions are predominantly long or short. 𝗕𝗶𝘁𝗰𝗼𝗶𝗻 𝗶𝘀 𝘄𝗲𝗮𝗸, 𝗯𝘂𝘁 𝗻𝗼𝘁 𝗰𝗼𝗹𝗹𝗮𝗽𝘀𝗶𝗻𝗴 𝗶𝗻 𝘁𝗵𝗲 𝘀𝗮𝗺𝗲 𝘄𝗮𝘆 BTC provides an important market backdrop. The supplied Bitcoin ticker showed a last price of $77,141, down 1.189% over the quoted 24-hour period. Its session range was $76,402.90 to $78,195.70, with approximately $10.09 billion in quote volume. Bitcoin’s decline matters because smaller DeFi and infrastructure tokens can react more sharply when broad risk appetite weakens. REZ’s 24-hour fall of roughly 13% was far larger than BTC’s 1.19% decline. That relative underperformance suggests the move is not explained by Bitcoin alone. It may reflect token-specific selling, thinner liquidity, derivatives positioning, or profit-taking after REZ’s earlier 30-day and 60-day gains. This is an interpretation rather than a verified cause; the supplied dataset does not identify a confirmed seller, liquidation event, or project announcement behind the drop. BTC stability would not automatically rescue REZ. Continued weakness in Bitcoin could add pressure, while a Bitcoin recovery would not necessarily reverse REZ’s own breakdown from the 0.0037 region. Broader market strength would be one condition for recovery, not evidence that recovery must follow. 𝗡𝗲𝘄𝘀 𝗮𝗻𝗱 𝗰𝗮𝘁𝗮𝗹𝘆𝘀𝘁𝘀: 𝘁𝗵𝗲 𝗶𝗺𝗽𝗼𝗿𝘁𝗮𝗻𝘁 𝘂𝗽𝗱𝗮𝘁𝗲 𝗶𝘀 𝘄𝗵𝗮𝘁 𝗶𝘀 𝗺𝗶𝘀𝘀𝗶𝗻𝗴 The supplied news feed contains two reports about a phishing email incident involving Trezor, BitBox, CoinTracking, and a shared newsletter provider. Those reports are security-related but do not concern Renzo, REZ, or the Renzo Basis product. They should not be presented as a REZ catalyst. No verified REZ-specific news, product launch, partnership, listing announcement, governance decision, token unlock notice, or protocol incident was included in the research. The price move therefore cannot responsibly be tied to a new Renzo announcement based on the available information. Expansion of Renzo Basis into additional markets, stronger usage of its yield strategies, changes in funding rates, integrations with major ecosystems, or clearer REZ token utility could influence sentiment if officially verified. Conversely, weak strategy performance, falling funding income, technical problems, reduced TVL, or supply-related events could weigh on the token. These are scenarios to monitor rather than current facts. 𝗟𝗲𝘃𝗲𝗹𝘀 𝘁𝗵𝗮𝘁 𝗱𝗲𝗳𝗶𝗻𝗲 𝘁𝗵𝗲 𝗻𝗲𝘅𝘁 𝘁𝗲𝘀𝘁 The immediate battleground is the 0.00300562 scanner support, with recent market lows around 0.003003 and CoinGecko’s reported low near 0.00301422. A sustained move below that area would support the scanner’s bearish interpretation and put attention on 0.00299602, the third listed target. The scanner’s intermediate references are 0.00301627 and 0.00300614. On the upside, 0.00303977 is the key nearby resistance, with the scanner entry range extending from 0.00303652 to 0.00303955. The invalidation reference is 0.00304889. A move above that level would weaken the specific short setup, particularly if accompanied by stronger volume and acceptance above the area rather than a brief wick. The broader chart contains additional resistance zones around 0.00310, 0.00315, 0.00320, and then the 0.00330 to 0.00350 region, based on recent hourly and four-hour trading. These are market-structure observations, not guaranteed barriers. On the downside, losing 0.0030 would expose the market to levels below the recent consolidation, but the supplied data does not provide a reliable lower support level beyond the scanner’s targets. 𝗥𝗶𝘀𝗸𝘀, 𝘄𝗲𝗮𝗸𝗻𝗲𝘀𝘀𝗲𝘀, 𝗮𝗻𝗱 𝘄𝗵𝗮𝘁 𝘁𝗼 𝘄𝗮𝘁𝗰𝗵 𝗻𝗲𝘅𝘁 The central risk is that REZ is already close to support after a large daily decline. When price reaches a well-watched floor, short-term sellers can lose control quickly if buyers defend the area. The scanner’s volume ratio near 1.00 also shows that the bearish reading is not being confirmed by an exceptional volume surge at selection time. A rebound through 0.00303977 and especially above 0.00304889 would challenge the immediate short thesis. Derivatives add another layer of uncertainty. Open interest is high in absolute token terms, but the dataset does not reveal the positioning split, liquidation levels, or funding rate. A crowded directional trade can unwind rapidly in either direction. The narrow distance between the scanner’s entry references, invalidation level, and targets also means that execution and timing may matter more than the headline risk-reward ratio. From a project perspective, the research confirms Renzo’s stated focus on accessible onchain yield strategies and provides TVL and supply figures, but it does not verify a detailed value-accrual mechanism for REZ. That unresolved link between product activity and token demand is an important limitation when assessing the asset beyond its chart. For now, the cleanest reading is conditional. Holding above the 0.0030 region would preserve the possibility of a rebound, while a sustained break below support would keep the scanner’s downside structure active. Resistance near 0.00304 to 0.00305 is the first area that would weaken the setup. Until price establishes itself on one side of those levels, REZUSDT remains a high-volatility market defined by fragile support, recent underperformance, and limited confirmation from volume.
Watch the 15m structure on $USELESS . Price is close to a level that has already mattered, and the setup is still early enough to avoid chasing. If sellers keep control, 0.21601 and 0.21443 are next. Let’s see whether buyers or sellers win this level.
My focus on $1000RATS is the location, not the size of the last candle. The 15m structure gives a clear decision area and the setup still has about 1.85 risk/reward. If the structure holds, 0.040891 comes first and 0.041181 next. Would you wait for confirmation or the retest?
$IOST is approaching a decision point on the 15m chart. The current structure sits between 0.000926813 and 0.000935393. A clean reaction can open the next move, while a failed reaction would weaken the setup. The reaction at this level matters more than the headline.
The interesting part of this $GIGGLE setup is the structure. Price is sitting near the decision area while the 15m candles are leaning sellers. Volume is supporting the move, so the next candle matters. I’m watching 34 and 33.8265. Would you wait for confirmation or the retest?
$REZ is holding under an important area and sellers are starting to show pressure. The 15m structure is still developing, so I would rather watch confirmation than chase a candle. 0.00301480 is the first level I’m watching, followed by 0.00300445. The reaction at this level matters more than the headline.
My focus on $RVN is the location, not the size of the last candle. The 15m structure gives a clear decision area and the setup still has about 1.92 risk/reward. If the structure holds, 0.00232690 comes first and 0.00234342 next. The reaction at this level matters more than the headline.