
#halvingcycle
halvingcycle
57,305 views
114 Discussing
Hot
Latest

Every Bitcoin halving cycle, the "diminishing returns" debate resurfaces. And every cycle, it misses the point.
Yes, the percentage gains from each cycle have compressed — 10,000% becomes 1,000% becomes 300%. But that narrative ignores what is actually changing: the nature of the buyers.
In 2017, retail speculation drove the rally. In 2020–2021, corporates and family offices entered. In 2024–2026, sovereign wealth funds, pension allocators, and ETF-wrapped mandates are the marginal buyers. These actors do not chase 100x — they deploy at scale, with multi-year horizons, absorbing supply silently.
This is not a sign of a dying market. It is a sign of a maturing one.
The implication for $BTC : lower volatility ceilings, but also higher floor prices with each successive cycle. The amplitude shrinks; the baseline rises.
For $ETH and $SOL , the same dynamic applies but is still earlier-stage — institutional conviction is building, not arrived. The asymmetric window for size is narrower here but still open.
Diminishing returns on percentage is not the same as diminishing opportunity. Know what cycle you are actually trading.
#Bitcoin #CryptoMarkets #HalvingCycle #CryptoInvesting #BinanceSquare
Yes, the percentage gains from each cycle have compressed — 10,000% becomes 1,000% becomes 300%. But that narrative ignores what is actually changing: the nature of the buyers.
In 2017, retail speculation drove the rally. In 2020–2021, corporates and family offices entered. In 2024–2026, sovereign wealth funds, pension allocators, and ETF-wrapped mandates are the marginal buyers. These actors do not chase 100x — they deploy at scale, with multi-year horizons, absorbing supply silently.
This is not a sign of a dying market. It is a sign of a maturing one.
The implication for $BTC : lower volatility ceilings, but also higher floor prices with each successive cycle. The amplitude shrinks; the baseline rises.
For $ETH and $SOL , the same dynamic applies but is still earlier-stage — institutional conviction is building, not arrived. The asymmetric window for size is narrower here but still open.
Diminishing returns on percentage is not the same as diminishing opportunity. Know what cycle you are actually trading.
#Bitcoin #CryptoMarkets #HalvingCycle #CryptoInvesting #BinanceSquare
The Halving Supply Shock Is Still Playing Out
Most market participants treat the Bitcoin halving as a single event. It is not — it is a slow-motion supply compression that takes 12–18 months to fully ripple through price discovery.
Here is the math that rarely gets discussed: miners produce roughly 450 $BTC per day post-halving (down from 900). At any given price, the daily sell-side pressure from miner revenue drops by half overnight. But demand does not. Institutional allocators, ETF inflows, and retail accumulation continue on their own timelines. The imbalance quietly widens.
The mechanism that amplifies this: miner reserves. Miners who survive a halving typically hold larger reserves than their smaller competitors who capitulated. When price rallies, survivors sell less aggressively — they have the balance sheet to wait. This suppresses available float exactly when new demand is accelerating.
$ETH follows a parallel dynamic via EIP-1559 burn during high-activity periods. $SOL benefits indirectly as capital chases asymmetric upside once $BTC price discovery matures.
The practical implication: halving cycles reward patience over timing. The supply shock does not resolve in weeks — it compounds across quarters. Investors who understand this structural rhythm hold conviction through consolidation phases that shake out short-term traders.
Supply math does not lie. Position accordingly.
#Bitcoin #CryptoMarkets #HalvingCycle #BullMarket #CryptoInvesting
Most market participants treat the Bitcoin halving as a single event. It is not — it is a slow-motion supply compression that takes 12–18 months to fully ripple through price discovery.
Here is the math that rarely gets discussed: miners produce roughly 450 $BTC per day post-halving (down from 900). At any given price, the daily sell-side pressure from miner revenue drops by half overnight. But demand does not. Institutional allocators, ETF inflows, and retail accumulation continue on their own timelines. The imbalance quietly widens.
The mechanism that amplifies this: miner reserves. Miners who survive a halving typically hold larger reserves than their smaller competitors who capitulated. When price rallies, survivors sell less aggressively — they have the balance sheet to wait. This suppresses available float exactly when new demand is accelerating.
$ETH follows a parallel dynamic via EIP-1559 burn during high-activity periods. $SOL benefits indirectly as capital chases asymmetric upside once $BTC price discovery matures.
The practical implication: halving cycles reward patience over timing. The supply shock does not resolve in weeks — it compounds across quarters. Investors who understand this structural rhythm hold conviction through consolidation phases that shake out short-term traders.
Supply math does not lie. Position accordingly.
#Bitcoin #CryptoMarkets #HalvingCycle #BullMarket #CryptoInvesting
The Halving Supply Shock Is Not Priced In — It Never Is
Every Bitcoin halving cuts miner block rewards in half, yet markets consistently underestimate the compounding effect. Here's why: miners are forced sellers. They receive $BTC daily and sell a portion to cover operational costs — electricity, hardware, payroll. When rewards halve, forced selling drops sharply. Less daily sell pressure against steady or growing demand is a structural price catalyst.
But the signal most traders miss is miner capitulation *before* the halving. Hash rate compression and miner outflows spike as less efficient operations shut down. This capitulation phase is historically one of the best accumulation windows in a cycle — pain for miners, opportunity for long-term holders.
Post-halving, surviving miners are the most efficient in history. They become holders, not sellers. The liquid float of new BTC hitting exchanges shrinks. Meanwhile, $ETH burn via EIP-1559 and $BNB quarterly burns create parallel supply reduction narratives across the ecosystem.
Watch high-beta L1s during this window. Once the supply shock narrative matures in BTC, rotation capital flows outward. The halving is not a rumor to sell — it's an economic restructuring of supply dynamics that takes 12–18 months to fully manifest. Patience is the strategy.
#Bitcoin #HalvingCycle #CryptoMarkets #SupplyShock #BullMarket
Every Bitcoin halving cuts miner block rewards in half, yet markets consistently underestimate the compounding effect. Here's why: miners are forced sellers. They receive $BTC daily and sell a portion to cover operational costs — electricity, hardware, payroll. When rewards halve, forced selling drops sharply. Less daily sell pressure against steady or growing demand is a structural price catalyst.
But the signal most traders miss is miner capitulation *before* the halving. Hash rate compression and miner outflows spike as less efficient operations shut down. This capitulation phase is historically one of the best accumulation windows in a cycle — pain for miners, opportunity for long-term holders.
Post-halving, surviving miners are the most efficient in history. They become holders, not sellers. The liquid float of new BTC hitting exchanges shrinks. Meanwhile, $ETH burn via EIP-1559 and $BNB quarterly burns create parallel supply reduction narratives across the ecosystem.
Watch high-beta L1s during this window. Once the supply shock narrative matures in BTC, rotation capital flows outward. The halving is not a rumor to sell — it's an economic restructuring of supply dynamics that takes 12–18 months to fully manifest. Patience is the strategy.
#Bitcoin #HalvingCycle #CryptoMarkets #SupplyShock #BullMarket
The Halving Supply Shock: Where Are We Now?
Bitcoin's April 2024 halving cut block rewards from 6.25 to 3.125 BTC. Historically, the supply shock thesis plays out over 12–18 months post-halving — and we're deep inside that window.
What makes this cycle different:
→ Spot ETF demand has permanently altered the supply/demand equation. Institutional buyers are absorbing newly minted BTC before it ever hits open markets. The float available to retail is shrinking structurally, not just cyclically.
→ Miner sell pressure has dropped. With higher BTC prices and compressed issuance, miners are HODLing longer. Exchange outflows from miner wallets are at multi-year lows.
→ Post-halving price discovery doesn't spike on Day 1 — it builds. The 2016 and 2020 halvings both saw the largest gains arrive 9–15 months after the event. Patience is the edge most traders abandon too early.
The signal to watch: BTC exchange reserves trending down while stablecoin reserves trend up is the cleanest on-chain setup for continuation. That ratio matters more than any price level.
Don't mistake consolidation for failure. Supply shocks are slow-motion catalysts.
$BTC $ETH $BNB
#Bitcoin #HalvingCycle #CryptoMarkets #BTC #OnChainAnalysis
Bitcoin's April 2024 halving cut block rewards from 6.25 to 3.125 BTC. Historically, the supply shock thesis plays out over 12–18 months post-halving — and we're deep inside that window.
What makes this cycle different:
→ Spot ETF demand has permanently altered the supply/demand equation. Institutional buyers are absorbing newly minted BTC before it ever hits open markets. The float available to retail is shrinking structurally, not just cyclically.
→ Miner sell pressure has dropped. With higher BTC prices and compressed issuance, miners are HODLing longer. Exchange outflows from miner wallets are at multi-year lows.
→ Post-halving price discovery doesn't spike on Day 1 — it builds. The 2016 and 2020 halvings both saw the largest gains arrive 9–15 months after the event. Patience is the edge most traders abandon too early.
The signal to watch: BTC exchange reserves trending down while stablecoin reserves trend up is the cleanest on-chain setup for continuation. That ratio matters more than any price level.
Don't mistake consolidation for failure. Supply shocks are slow-motion catalysts.
$BTC $ETH $BNB
#Bitcoin #HalvingCycle #CryptoMarkets #BTC #OnChainAnalysis

Every halving cycle follows a similar shape. Spot where we are NOW. 👇
Bull runs typically begin 6-12 months after halvings and peak 500-550 days later. The current cycle following the April 2024 halving could peak between October 2025 and early 2026.
If that pattern held — the PEAK already happened.
Bitcoin has already posted a historic cycle peak in 2025. The market is undergoing a cooling and consolidation phase rather than a definitive end.
"Cooling and consolidation" — not "the end."
Does this match what the CHARTS are showing you right now?
#SpotTheDifference #HalvingCycle
$RIVER $SIREN $ESPORTS
Bull runs typically begin 6-12 months after halvings and peak 500-550 days later. The current cycle following the April 2024 halving could peak between October 2025 and early 2026.
If that pattern held — the PEAK already happened.
Bitcoin has already posted a historic cycle peak in 2025. The market is undergoing a cooling and consolidation phase rather than a definitive end.
"Cooling and consolidation" — not "the end."
Does this match what the CHARTS are showing you right now?
#SpotTheDifference #HalvingCycle
$RIVER $SIREN $ESPORTS
The Bitcoin halving is often called the most predictable event in crypto — yet most investors still mistime its effects.
Here's the pattern: the halving cuts new supply in half, but price discovery doesn't happen at the event itself. It unfolds 12–18 months later, as the supply shock compounds against steady or growing demand. Miners sell less. Exchange reserves thin. Eventually, price catches up to fundamentals.
What's often missed is the lagging cascade. $BTC leads the first leg. Then $ETH reprices as DeFi and staking narratives heat up. Then $SOL captures the next rotation as retail seeks higher beta.
The trap? Most people buy at the end of the cascade — when euphoria is loudest — not at the beginning, when signal is clearest.
On-chain data gives you an edge here. Watch stablecoin supply growth, exchange reserve drawdowns, and long-term holder accumulation ratios. These metrics don't lie — they show you whether smart money is positioning or distributing.
Patience is the rarest alpha in crypto. The halving cycle doesn't reward urgency. It rewards preparation.
Know the cycle. Respect the lag. Position early.
$BTC $ETH $SOL
#Bitcoin #CryptoMarkets #HalvingCycle #CryptoInvesting #BinanceSquare
Here's the pattern: the halving cuts new supply in half, but price discovery doesn't happen at the event itself. It unfolds 12–18 months later, as the supply shock compounds against steady or growing demand. Miners sell less. Exchange reserves thin. Eventually, price catches up to fundamentals.
What's often missed is the lagging cascade. $BTC leads the first leg. Then $ETH reprices as DeFi and staking narratives heat up. Then $SOL captures the next rotation as retail seeks higher beta.
The trap? Most people buy at the end of the cascade — when euphoria is loudest — not at the beginning, when signal is clearest.
On-chain data gives you an edge here. Watch stablecoin supply growth, exchange reserve drawdowns, and long-term holder accumulation ratios. These metrics don't lie — they show you whether smart money is positioning or distributing.
Patience is the rarest alpha in crypto. The halving cycle doesn't reward urgency. It rewards preparation.
Know the cycle. Respect the lag. Position early.
$BTC $ETH $SOL
#Bitcoin #CryptoMarkets #HalvingCycle #CryptoInvesting #BinanceSquare
The Halving Cycle Is Decoupling From Its Historical Playbook
Every previous Bitcoin halving played out against a backdrop of suppressed macro liquidity and limited institutional presence. The cycle was self-contained: miner supply shock, accumulation, retail FOMO, blow-off top. Predictable. Almost mechanical.
That framework is breaking down.
Institutional ETF flows now introduce a demand-side variable that has no historical precedent. When spot ETFs absorb daily BTC supply multiples above miner issuance, the supply shock narrative accelerates but it also becomes less cyclically bounded. Demand is no longer purely retail-driven and sentiment-gated.
The implication: we may be entering a regime where price discovery is more continuous and less punctuated by 4-year peaks. Not because cycles end, but because the marginal buyer has changed.
$BTC still anchors the cycle. But $ETH staking lockups and $BNB burn mechanics are each running parallel supply compression stories. The question is no longer just where are we in the BTC cycle but which cycle are you in?
Multi-asset crypto portfolios may benefit from tracking each asset supply float independently rather than assuming BTC cycle sync. Divergence is the new default.
Understand the cycle you are actually in before sizing in.
#Bitcoin #CryptoMarkets #HalvingCycle #MarketCycles #CryptoInsights
Every previous Bitcoin halving played out against a backdrop of suppressed macro liquidity and limited institutional presence. The cycle was self-contained: miner supply shock, accumulation, retail FOMO, blow-off top. Predictable. Almost mechanical.
That framework is breaking down.
Institutional ETF flows now introduce a demand-side variable that has no historical precedent. When spot ETFs absorb daily BTC supply multiples above miner issuance, the supply shock narrative accelerates but it also becomes less cyclically bounded. Demand is no longer purely retail-driven and sentiment-gated.
The implication: we may be entering a regime where price discovery is more continuous and less punctuated by 4-year peaks. Not because cycles end, but because the marginal buyer has changed.
$BTC still anchors the cycle. But $ETH staking lockups and $BNB burn mechanics are each running parallel supply compression stories. The question is no longer just where are we in the BTC cycle but which cycle are you in?
Multi-asset crypto portfolios may benefit from tracking each asset supply float independently rather than assuming BTC cycle sync. Divergence is the new default.
Understand the cycle you are actually in before sizing in.
#Bitcoin #CryptoMarkets #HalvingCycle #MarketCycles #CryptoInsights
The 4-Year Halving Cycle Is Being Disrupted — Here's What That Means
For a decade, Bitcoin's market cycle followed a predictable rhythm: halving → liquidity expansion → parabolic peak → brutal drawdown → repeat. But cycle 4 is different, and ignoring that could cost you.
Three structural shifts are compressing and reshaping the classic pattern:
1. Institutional bid floors. Spot ETFs created a persistent demand baseline that didn't exist in prior cycles. Dip buyers in 2022-style drawdowns are now competing with systematic allocators rebalancing into weakness — not just retail HODLers.
2. Macro correlation is tighter. $BTC no longer trades in isolation. Rate cut cycles, dollar strength, and credit spreads now exert real influence. The halving is a supply event; macro is the demand lever. You need both to align.
3. Altcoin dynamics have matured. $ETH and $BNB have distinct fundamental drivers now — not just BTC beta. Capital rotation is more selective, not a blanket rising tide.
What this means practically: the old "buy 6 months post-halving, sell 18 months later" playbook still has signal, but wider error bars. Cycle length may compress or extend depending on macro conditions.
Adapt your framework. The halving is a catalyst, not a guarantee.
#Bitcoin #CryptoMarkets #HalvingCycle #MarketAnalysis #Crypto2026
For a decade, Bitcoin's market cycle followed a predictable rhythm: halving → liquidity expansion → parabolic peak → brutal drawdown → repeat. But cycle 4 is different, and ignoring that could cost you.
Three structural shifts are compressing and reshaping the classic pattern:
1. Institutional bid floors. Spot ETFs created a persistent demand baseline that didn't exist in prior cycles. Dip buyers in 2022-style drawdowns are now competing with systematic allocators rebalancing into weakness — not just retail HODLers.
2. Macro correlation is tighter. $BTC no longer trades in isolation. Rate cut cycles, dollar strength, and credit spreads now exert real influence. The halving is a supply event; macro is the demand lever. You need both to align.
3. Altcoin dynamics have matured. $ETH and $BNB have distinct fundamental drivers now — not just BTC beta. Capital rotation is more selective, not a blanket rising tide.
What this means practically: the old "buy 6 months post-halving, sell 18 months later" playbook still has signal, but wider error bars. Cycle length may compress or extend depending on macro conditions.
Adapt your framework. The halving is a catalyst, not a guarantee.
#Bitcoin #CryptoMarkets #HalvingCycle #MarketAnalysis #Crypto2026
The Halving Diminishing-Returns Debate Misses the Point
Every cycle, the same argument resurfaces: Bitcoin halvings are "priced in" now, and the diminishing-returns pattern means each successive rally will be smaller in percentage terms. Both claims have some truth — but they obscure what actually matters.
Halvings don't work through surprise. They work through supply compression over time. Miners who receive 50% fewer $BTC must either sell at higher prices to cover costs or reduce sell pressure on the market. That mechanic is structural, not speculative. It doesn't need to be a secret to function.
As for diminishing percentage returns: of course a $1T asset can't 100x. But the absolute dollar value at stake grows. A 3x move on $BTC at $100K is a $200K outcome — larger in real wealth terms than a 10x from $1K was for most participants.
The more interesting signal is miner hash rate versus price divergence. When hash rate continues climbing while price consolidates, miners are expressing long-term conviction with capital. That's an on-chain vote of confidence the order books don't capture.
$ETH faces its own supply dynamic post-merge. $BNB operates a fee-burn mechanic. Each has a unique supply story — but $BTC 's four-year rhythm remains the clearest macro anchor in crypto.
Don't debate the halving. Watch what miners do after it.
#Bitcoin #HalvingCycle #CryptoMarkets #SupplyShock #OnChainSignals
Every cycle, the same argument resurfaces: Bitcoin halvings are "priced in" now, and the diminishing-returns pattern means each successive rally will be smaller in percentage terms. Both claims have some truth — but they obscure what actually matters.
Halvings don't work through surprise. They work through supply compression over time. Miners who receive 50% fewer $BTC must either sell at higher prices to cover costs or reduce sell pressure on the market. That mechanic is structural, not speculative. It doesn't need to be a secret to function.
As for diminishing percentage returns: of course a $1T asset can't 100x. But the absolute dollar value at stake grows. A 3x move on $BTC at $100K is a $200K outcome — larger in real wealth terms than a 10x from $1K was for most participants.
The more interesting signal is miner hash rate versus price divergence. When hash rate continues climbing while price consolidates, miners are expressing long-term conviction with capital. That's an on-chain vote of confidence the order books don't capture.
$ETH faces its own supply dynamic post-merge. $BNB operates a fee-burn mechanic. Each has a unique supply story — but $BTC 's four-year rhythm remains the clearest macro anchor in crypto.
Don't debate the halving. Watch what miners do after it.
#Bitcoin #HalvingCycle #CryptoMarkets #SupplyShock #OnChainSignals

🧪 THOUGHT EXPERIMENT: The Déjà Vu Test
Pull up any major cycle in $BTC 's history. The euphoria at the top always sounds the same: "This time it's different. The old models don't apply anymore. We've entered a new paradigm."$BTC
Then pull up the bottom of the last bear market. The despair sounds identical too: "It's over. This was the mistake of a lifetime. Nobody will trust this again."
Now here's the experiment $ETC — if you removed the dates and just read the sentiment, could you tell which cycle you were looking at?
Most people can't. Because the market doesn't actually change as much as the participants convince themselves it does. Technology evolves. Adoption grows. But human psychology at extremes — greed at the top, despair at the bottom — repeats with almost eerie consistency.$BNB
The traders who do well aren't the ones who found some secret new pattern. They're the ones who recognized the old pattern early enough to act on it.
If you couldn't see the date, would you know which part of the cycle we're in right now?
#HalvingCycle #BTC #MarketCycle #CryptoPsychology
Pull up any major cycle in $BTC 's history. The euphoria at the top always sounds the same: "This time it's different. The old models don't apply anymore. We've entered a new paradigm."$BTC
Then pull up the bottom of the last bear market. The despair sounds identical too: "It's over. This was the mistake of a lifetime. Nobody will trust this again."
Now here's the experiment $ETC — if you removed the dates and just read the sentiment, could you tell which cycle you were looking at?
Most people can't. Because the market doesn't actually change as much as the participants convince themselves it does. Technology evolves. Adoption grows. But human psychology at extremes — greed at the top, despair at the bottom — repeats with almost eerie consistency.$BNB
The traders who do well aren't the ones who found some secret new pattern. They're the ones who recognized the old pattern early enough to act on it.
If you couldn't see the date, would you know which part of the cycle we're in right now?
#HalvingCycle #BTC #MarketCycle #CryptoPsychology

$BTC DIVERGENCE FROM STOCKS IS A HISTORICAL ANOMALY — HERE'S WHY 🔥
Hashdex and Charles Schwab both say the disconnect between Bitcoin and soaring equity markets won't last. Stablecoin trading volume in H1 has already exceeded last year's full-year total, tokenized RWA assets grew over 60% YTD, and on-chain activity is at an all-time high.
Jim Ferraioli notes Bitcoin's current behaviour fits the typical post-halving cycle — it often takes over a year to reclaim the miner cost near $95K, with selling pressure from holders near the $80K average cost. Fundamentals are strengthening while price lags.
Are you using this divergence as a buying opportunity or staying on the sidelines?
Not financial advice. Always manage your risk.
#BTC #Bitcoin #HalvingCycle #OnChainAnalysis
💎
Hashdex and Charles Schwab both say the disconnect between Bitcoin and soaring equity markets won't last. Stablecoin trading volume in H1 has already exceeded last year's full-year total, tokenized RWA assets grew over 60% YTD, and on-chain activity is at an all-time high.
Jim Ferraioli notes Bitcoin's current behaviour fits the typical post-halving cycle — it often takes over a year to reclaim the miner cost near $95K, with selling pressure from holders near the $80K average cost. Fundamentals are strengthening while price lags.
Are you using this divergence as a buying opportunity or staying on the sidelines?
Not financial advice. Always manage your risk.
#BTC #Bitcoin #HalvingCycle #OnChainAnalysis
💎
Each Bitcoin halving cycle is frequently described as a four-year clock. But the data tells a more nuanced story: cycles are compressing in return magnitude while expanding in structural depth.
The 2013 cycle delivered four-digit percentage gains. The 2017 cycle delivered three-digit gains. The 2021 cycle delivered roughly 20x from cycle lows. The implication is not that Bitcoin is losing relevance — it is that the asset class is maturing. Larger pools of capital require longer accumulation windows, smaller percentage moves, and more sophisticated entry frameworks.
This matters for how you position. Chasing $BTC for 10x in the current cycle using 2017 playbooks is misaligned with market structure. The smart money is not looking for parabolic blowoffs — it is looking for duration and asymmetry: moderate leverage, long time horizons, and strategic rebalancing into $ETH and quality $BNB exposure during consolidation phases.
Meanwhile, altcoin performance relative to Bitcoin on a rolling 30-day basis is a useful late-cycle signal. When quality L1s outperform on a sustained basis, risk appetite is likely rotating down the cap spectrum.
Read cycles not as countdowns to a top, but as compression signals for how capital is repricing risk. Adjust your sizing accordingly.
#Bitcoin #CryptoMarkets #MarketCycles #HalvingCycle #CryptoStrategy
The 2013 cycle delivered four-digit percentage gains. The 2017 cycle delivered three-digit gains. The 2021 cycle delivered roughly 20x from cycle lows. The implication is not that Bitcoin is losing relevance — it is that the asset class is maturing. Larger pools of capital require longer accumulation windows, smaller percentage moves, and more sophisticated entry frameworks.
This matters for how you position. Chasing $BTC for 10x in the current cycle using 2017 playbooks is misaligned with market structure. The smart money is not looking for parabolic blowoffs — it is looking for duration and asymmetry: moderate leverage, long time horizons, and strategic rebalancing into $ETH and quality $BNB exposure during consolidation phases.
Meanwhile, altcoin performance relative to Bitcoin on a rolling 30-day basis is a useful late-cycle signal. When quality L1s outperform on a sustained basis, risk appetite is likely rotating down the cap spectrum.
Read cycles not as countdowns to a top, but as compression signals for how capital is repricing risk. Adjust your sizing accordingly.
#Bitcoin #CryptoMarkets #MarketCycles #HalvingCycle #CryptoStrategy
The halving cycle and the macro liquidity cycle are diverging — and most traders haven't noticed.
For years, Bitcoin's four-year halving cycle correlated closely with global liquidity expansions. Bull runs coincided with Fed easing. Bear markets aligned with rate hikes. The cycles reinforced each other, making the playbook feel obvious in hindsight.
But something shifted. $BTC is increasingly behaving like a macro asset — sensitive to real yields, dollar strength, and central bank balance sheet dynamics — rather than purely a supply-shock story. The next halving-driven narrative may not play out on schedule if macro liquidity tightens precisely when the supply shock lands.
This creates a more nuanced setup for $ETH and $SOL . Both are driven less by fixed supply schedules and more by network demand: fee burn, staking yields, and developer activity. If macro headwinds compress the BTC cycle, fee-generating chains could still find tailwinds from organic adoption — independent of miner dynamics.
The takeaway: stop trading one cycle. Understand which asset is driven by which clock — and size accordingly. Conflating all crypto with the halving narrative is how most people get the timing wrong.
Do the work. Separate the signals.
$BTC $ETH $SOL
#Bitcoin #CryptoMarkets #MacroAnalysis #HalvingCycle #CryptoStrategy
For years, Bitcoin's four-year halving cycle correlated closely with global liquidity expansions. Bull runs coincided with Fed easing. Bear markets aligned with rate hikes. The cycles reinforced each other, making the playbook feel obvious in hindsight.
But something shifted. $BTC is increasingly behaving like a macro asset — sensitive to real yields, dollar strength, and central bank balance sheet dynamics — rather than purely a supply-shock story. The next halving-driven narrative may not play out on schedule if macro liquidity tightens precisely when the supply shock lands.
This creates a more nuanced setup for $ETH and $SOL . Both are driven less by fixed supply schedules and more by network demand: fee burn, staking yields, and developer activity. If macro headwinds compress the BTC cycle, fee-generating chains could still find tailwinds from organic adoption — independent of miner dynamics.
The takeaway: stop trading one cycle. Understand which asset is driven by which clock — and size accordingly. Conflating all crypto with the halving narrative is how most people get the timing wrong.
Do the work. Separate the signals.
$BTC $ETH $SOL
#Bitcoin #CryptoMarkets #MacroAnalysis #HalvingCycle #CryptoStrategy

📈 $BTC HOLDS $62K WITH THE HALVING SCRIPT COMPLETING ITS THIRD ACT ⚡
Entry: 62,659 ⚡
Target: 78,000 🚀
🦈 Institutional footprints are multiplying at the exact support zone that history says matters most. The 2016 halving produced a 30x, the 2020 halving produced an 8x, and 2024's has already stacked BlackRock's ETF infrastructure alongside an August 14 SEC regulatory review. 📊 This is the same convergence pattern that preceded every major liquidity expansion in Bitcoin's existence.
🔍 The shrinking-multiple math is undeniable — at $1.27 trillion market cap, BTC's ceiling sits near a 1.7x return. That's why smart money rotation patterns keep pointing toward earlier-cycle entries. The quarterly targets of $75K-80K remain intact if the regulatory catalyst lands favorably. 💡 The strongest setups every cycle weren't in the majors — they were in the pre-liquidity entries built before the crowd arrives.
💬 Are you positioning for the ceiling or fishing for the 12-18 month repricing window that follows every halving peak? 👇
⚠️ Not financial advice. Always manage your risk. 🛡️
🏷️ #BTC #Bitcoin #HalvingCycle #Crypto #Trading
⚡ 📈
Entry: 62,659 ⚡
Target: 78,000 🚀
🦈 Institutional footprints are multiplying at the exact support zone that history says matters most. The 2016 halving produced a 30x, the 2020 halving produced an 8x, and 2024's has already stacked BlackRock's ETF infrastructure alongside an August 14 SEC regulatory review. 📊 This is the same convergence pattern that preceded every major liquidity expansion in Bitcoin's existence.
🔍 The shrinking-multiple math is undeniable — at $1.27 trillion market cap, BTC's ceiling sits near a 1.7x return. That's why smart money rotation patterns keep pointing toward earlier-cycle entries. The quarterly targets of $75K-80K remain intact if the regulatory catalyst lands favorably. 💡 The strongest setups every cycle weren't in the majors — they were in the pre-liquidity entries built before the crowd arrives.
💬 Are you positioning for the ceiling or fishing for the 12-18 month repricing window that follows every halving peak? 👇
⚠️ Not financial advice. Always manage your risk. 🛡️
🏷️ #BTC #Bitcoin #HalvingCycle #Crypto #Trading
⚡ 📈
The Halving Cycle Meets the Macro Cycle — What Happens Next?
Bitcoin's four-year halving cycle has historically been the dominant price driver. But 2024-2026 is the first full cycle playing out inside a mature macro environment: quantitative tightening, a rate-cut pivot, and genuine institutional custody infrastructure all running simultaneously.
Here's what that combination suggests:
1. The supply shock is real but slower. With $BTC ETFs absorbing new issuance faster than miners can sell, post-halving price discovery now lags the halving by 6-9 months instead of the historical 12-18. Demand is pulling forward.
2. The macro overlay compresses drawdowns. When the Fed is in a cutting cycle and global M2 is expanding, the typical 70-80% bear market floor gets raised. Institutional buyers treat those dips as entry windows, not exits.
3. $ETH and $SOL benefit asymmetrically in the mid-cycle. Once BTC dominance peaks and rotates, productive-yield chains with real fee revenue attract capital that was previously waiting on the sidelines.
4. Network activity on ecosystem chains tends to spike when overall chain usage accelerates, making on-chain throughput a useful leading indicator for the altcoin expansion phase.
The convergence of a halving supply shock and a macro liquidity tailwind is historically rare. Position sizing accordingly, and watch stablecoin inflows as the trigger signal.
#Bitcoin #CryptoMarketCycle #HalvingCycle #MacroCrypto #Altseason
Bitcoin's four-year halving cycle has historically been the dominant price driver. But 2024-2026 is the first full cycle playing out inside a mature macro environment: quantitative tightening, a rate-cut pivot, and genuine institutional custody infrastructure all running simultaneously.
Here's what that combination suggests:
1. The supply shock is real but slower. With $BTC ETFs absorbing new issuance faster than miners can sell, post-halving price discovery now lags the halving by 6-9 months instead of the historical 12-18. Demand is pulling forward.
2. The macro overlay compresses drawdowns. When the Fed is in a cutting cycle and global M2 is expanding, the typical 70-80% bear market floor gets raised. Institutional buyers treat those dips as entry windows, not exits.
3. $ETH and $SOL benefit asymmetrically in the mid-cycle. Once BTC dominance peaks and rotates, productive-yield chains with real fee revenue attract capital that was previously waiting on the sidelines.
4. Network activity on ecosystem chains tends to spike when overall chain usage accelerates, making on-chain throughput a useful leading indicator for the altcoin expansion phase.
The convergence of a halving supply shock and a macro liquidity tailwind is historically rare. Position sizing accordingly, and watch stablecoin inflows as the trigger signal.
#Bitcoin #CryptoMarketCycle #HalvingCycle #MacroCrypto #Altseason

🚨 $BTC SHORT SQUEEZE IN PLAY — BULLS HOLD THE ONLY EXIT DOOR 💥
Entry: 63,424.23 ⚡
Target: 66,468.47 – 69,633.63 🎯
Stop Loss: 61,404.20 ⚠️
Institutional footprints are all over this displacement. Price has cleared the local high, and each pullback is being absorbed into a fresh order block — classic accumulation before the next mark-up leg. 📊 The halving supply shock only adds fuel to this structural imbalance.
Shorts who leaned into the rejection are now trapped above a reclaimed demand zone, and the path of least resistance points toward the 66.4k–69.6k liquidity pool. 🔍 With momentum this clean, the current entry leaves room for a tight stop beneath 61.4k. 💡
Are you chasing the breakout or mapping the first retest for continuation? 💬
⚠️ Not financial advice. Always manage your risk. 🛡️
🏷️ #BTC #LongSetup #Bitcoin #HalvingCycle #Crypto
🎯 🦈
Entry: 63,424.23 ⚡
Target: 66,468.47 – 69,633.63 🎯
Stop Loss: 61,404.20 ⚠️
Institutional footprints are all over this displacement. Price has cleared the local high, and each pullback is being absorbed into a fresh order block — classic accumulation before the next mark-up leg. 📊 The halving supply shock only adds fuel to this structural imbalance.
Shorts who leaned into the rejection are now trapped above a reclaimed demand zone, and the path of least resistance points toward the 66.4k–69.6k liquidity pool. 🔍 With momentum this clean, the current entry leaves room for a tight stop beneath 61.4k. 💡
Are you chasing the breakout or mapping the first retest for continuation? 💬
⚠️ Not financial advice. Always manage your risk. 🛡️
🏷️ #BTC #LongSetup #Bitcoin #HalvingCycle #Crypto
🎯 🦈


$BTC SIDEWAYS COMPRESSION IS THE LAST LOADING ZONE BEFORE THE HALVING CYCLE BREAKOUT 🔥
Entry: 63,354.50 ⚡
Target: 66,285.42 - 69,441.87 🚀
Stop Loss: 61,235.10 ⚠️
This range isn't indecision — it's accumulation under the surface. 🦈 While retail chases noise, institutional desks are quietly building bids around 63.3K, using the 21M supply narrative and halving scarcity as their backdrop. The longer this compression holds, the more explosive the eventual resolve.
Big capital has already positioned below price as a safety net, turning dips into liquidity events rather than reversals. 📊 The structure reads like a coiled spring: one break above 69.4K confirms the cycle leg, while invalidation sits clean at 61.2K. 💡 The question is whether you respect the setup enough to act before the squeeze.
Are you loading this dip or waiting for a break of range highs to confirm? 👇
⚠️ Not financial advice. Always manage your risk. 🛡️
🏷️ #BTC #HalvingCycle #LongSetup #Accumulation #Crypto
🦈 🔥
Entry: 63,354.50 ⚡
Target: 66,285.42 - 69,441.87 🚀
Stop Loss: 61,235.10 ⚠️
This range isn't indecision — it's accumulation under the surface. 🦈 While retail chases noise, institutional desks are quietly building bids around 63.3K, using the 21M supply narrative and halving scarcity as their backdrop. The longer this compression holds, the more explosive the eventual resolve.
Big capital has already positioned below price as a safety net, turning dips into liquidity events rather than reversals. 📊 The structure reads like a coiled spring: one break above 69.4K confirms the cycle leg, while invalidation sits clean at 61.2K. 💡 The question is whether you respect the setup enough to act before the squeeze.
Are you loading this dip or waiting for a break of range highs to confirm? 👇
⚠️ Not financial advice. Always manage your risk. 🛡️
🏷️ #BTC #HalvingCycle #LongSetup #Accumulation #Crypto
🦈 🔥

$BTC TO $200,000 ON REGULATORY CLARITY? 🔥
Target: 200,000 🚀
The $200,000 target implies a 3.3x from current levels, matching the average multiple seen in past halving cycles when liquidity floods in. Regulatory clarity from a potential Clarity Act could unlock trillions of institutional capital, creating the kind of supply shock that historically precedes parabolic moves.
Volume is compressing on the weekly, and the last time this setup formed, BTC rallied 180% in 18 months. Are you positioning for this leg or waiting for confirmation?
Not financial advice. Always manage your risk.
#BTC #RegulatoryClarity #Bullish #Crypto #HalvingCycle
🔥
Target: 200,000 🚀
The $200,000 target implies a 3.3x from current levels, matching the average multiple seen in past halving cycles when liquidity floods in. Regulatory clarity from a potential Clarity Act could unlock trillions of institutional capital, creating the kind of supply shock that historically precedes parabolic moves.
Volume is compressing on the weekly, and the last time this setup formed, BTC rallied 180% in 18 months. Are you positioning for this leg or waiting for confirmation?
Not financial advice. Always manage your risk.
#BTC #RegulatoryClarity #Bullish #Crypto #HalvingCycle
🔥


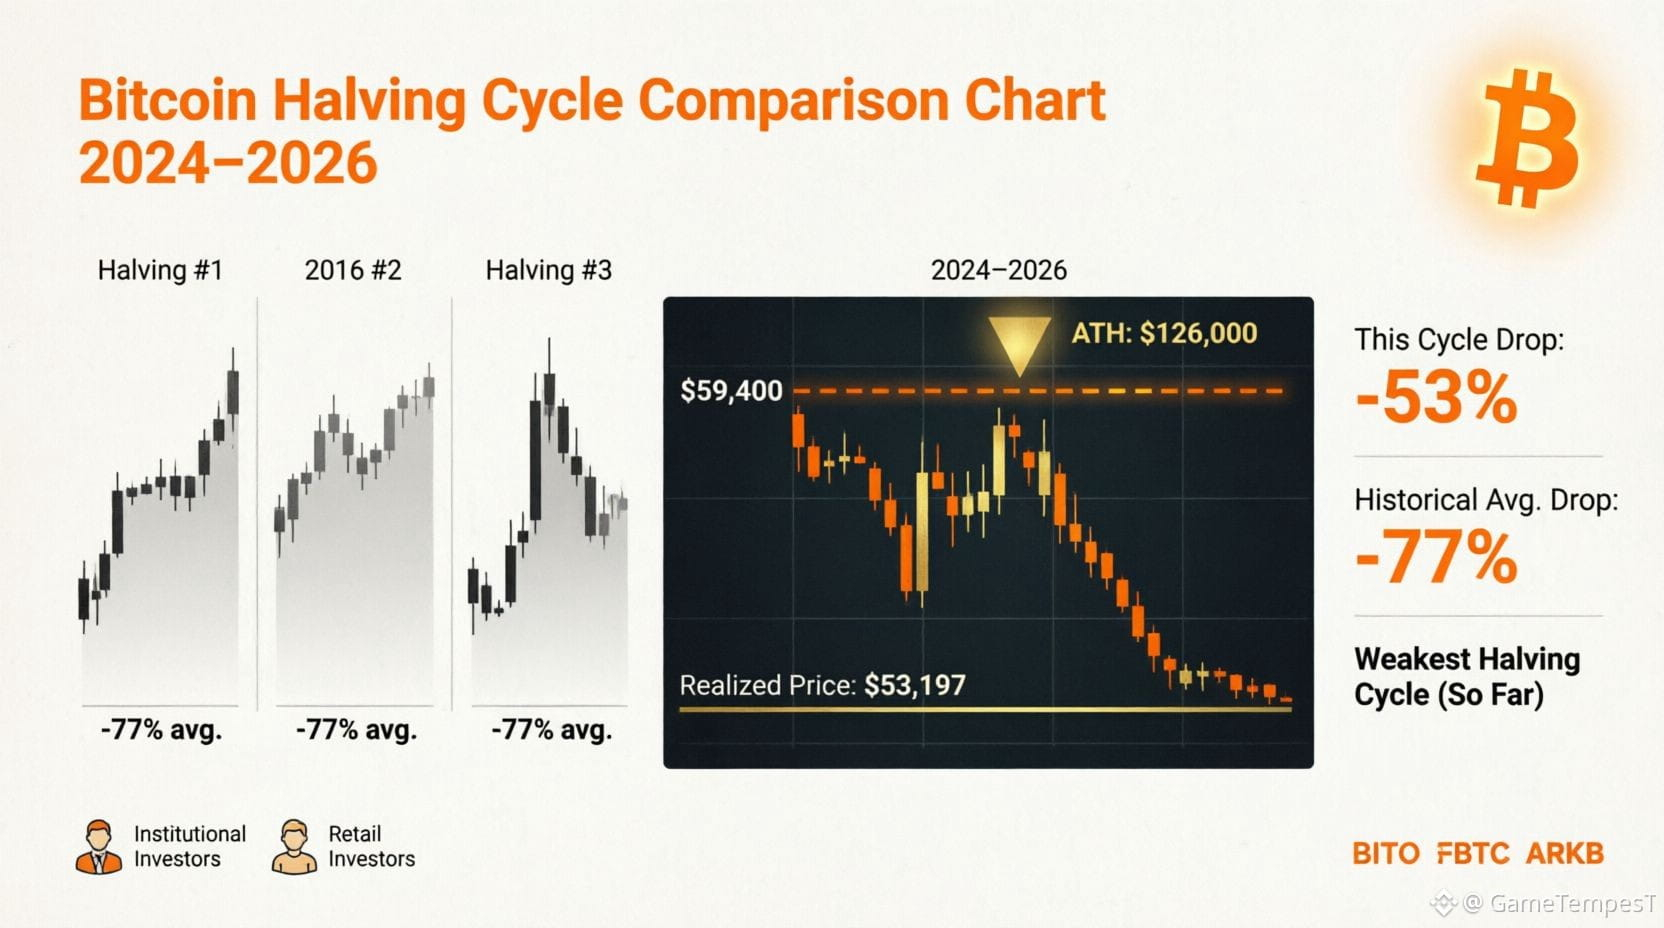
📊 BITCOIN HALVING CYCLE: WORST EVER OR MISUNDERSTOOD?
800+ days post-halving and BTC halving-day buyers are STILL underwater for the FIRST TIME in history. 😱
Current Price: $59,400
Halving Day (April 19, 2024): ~$64,000
ATH (Oct 6, 2025): $126,000
Current Drawdown: -53%
🔥 WHY THIS CYCLE IS DIFFERENT:
✅ First ATH Before Halving: Bitcoin hit $73,800 on March 12, 2024 - over a month BEFORE the halving. NEVER happened before!
✅ ETF Revolution: U.S. spot Bitcoin ETFs launched Jan 2024, pulling in $12.3 BILLION before halving even occurred.
✅ Institutional > Retail: This cycle driven by steady ETF inflows, not retail FOMO.
📉 THE REALIZED PRICE STORY:
Realized Price: $53,197
Spot Price: $59,400
Premium: Only 10%
Historically, major bottoms form when spot trades this close to realized price (2015, 2018-19, 2022).
⚠️ BEARISH REALITY:
Even adjusting for ETF distortion, this is the WEAKEST halving cycle on record:
Previous cycles (2013, 2017, 2021): Spot price went MULTIPLE TIMES above realized priceThis cycle: Gap NEVER expanded significantly, even at ATH
💡 TRADING IMPLICATIONS:
🎯 Altcoins: Watch for institutional favorites - BTC ETFs changed the game
🎯 Entry Zones: $53K realized price = key support level
🎯 Risk Management: -53% drawdown is PAINFUL but better than historical -77% crashes
🎯 Cycle Timing: Peak came 17.6 months post-halving - right on historical schedule
🎪 THE BOTTOM LINE:
This isn't necessarily the "worst" cycle - it's just DIFFERENT. The rules changed when Wall Street entered via ETFs. Lower volatility, institutional accumulation, and compressed cycles are the new normal.
Are we at the bottom or falling further? Watch the $53K realized price level. A break below could signal deeper pain. Hold above it? Accumulation zone confirmed.
Not financial advice. Do your own research. 📚
What's your take? Bull trap or accumulation opportunity? 👇
#bitcoin #BTC #crypto #HalvingCycle #trading
800+ days post-halving and BTC halving-day buyers are STILL underwater for the FIRST TIME in history. 😱
Current Price: $59,400
Halving Day (April 19, 2024): ~$64,000
ATH (Oct 6, 2025): $126,000
Current Drawdown: -53%
🔥 WHY THIS CYCLE IS DIFFERENT:
✅ First ATH Before Halving: Bitcoin hit $73,800 on March 12, 2024 - over a month BEFORE the halving. NEVER happened before!
✅ ETF Revolution: U.S. spot Bitcoin ETFs launched Jan 2024, pulling in $12.3 BILLION before halving even occurred.
✅ Institutional > Retail: This cycle driven by steady ETF inflows, not retail FOMO.
📉 THE REALIZED PRICE STORY:
Realized Price: $53,197
Spot Price: $59,400
Premium: Only 10%
Historically, major bottoms form when spot trades this close to realized price (2015, 2018-19, 2022).
⚠️ BEARISH REALITY:
Even adjusting for ETF distortion, this is the WEAKEST halving cycle on record:
Previous cycles (2013, 2017, 2021): Spot price went MULTIPLE TIMES above realized priceThis cycle: Gap NEVER expanded significantly, even at ATH
💡 TRADING IMPLICATIONS:
🎯 Altcoins: Watch for institutional favorites - BTC ETFs changed the game
🎯 Entry Zones: $53K realized price = key support level
🎯 Risk Management: -53% drawdown is PAINFUL but better than historical -77% crashes
🎯 Cycle Timing: Peak came 17.6 months post-halving - right on historical schedule
🎪 THE BOTTOM LINE:
This isn't necessarily the "worst" cycle - it's just DIFFERENT. The rules changed when Wall Street entered via ETFs. Lower volatility, institutional accumulation, and compressed cycles are the new normal.
Are we at the bottom or falling further? Watch the $53K realized price level. A break below could signal deeper pain. Hold above it? Accumulation zone confirmed.
Not financial advice. Do your own research. 📚
What's your take? Bull trap or accumulation opportunity? 👇
#bitcoin #BTC #crypto #HalvingCycle #trading

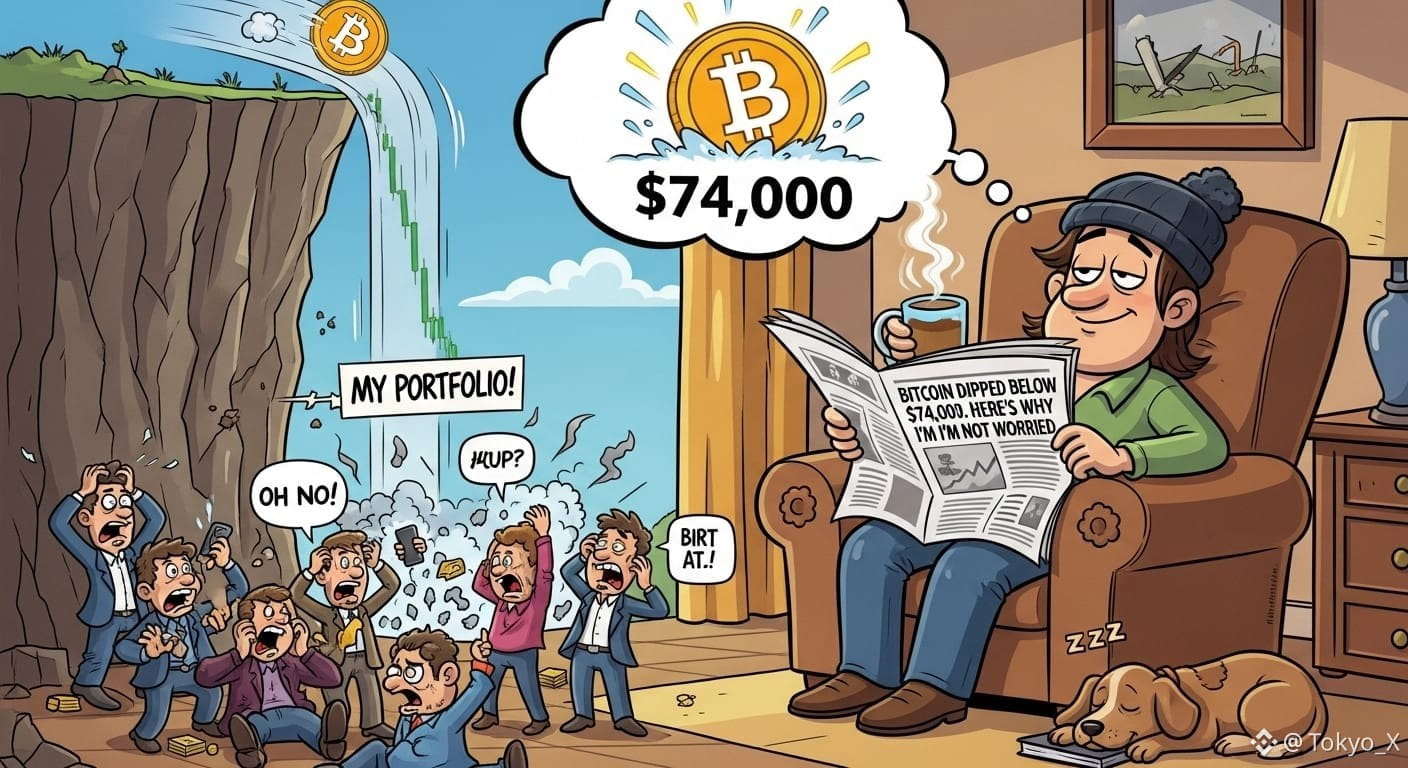
Bitcoin Dipped Below $74, Today. Here's Why I'm Not Worried.🧘♂️📉
Bad News hit this morning.
US-Iran peace talks collapsed. Iran rejected a second round of negotiations. Tensions flared up.
Result? Bitcoin dropped $2,000 in hours. Briefly fell below $74,000.
Sounds scary, right?
But here's what most headlines won't tell you.
📍 THE BIGGER PICTURE
This exact same scenario has played out multiple times in 2026. Middle East tensions flare → Bitcoin dips → panic spreads → prices recover.
It's not new.
Bitcoin isn't dying. It's just reacting. Like it always does.
📍 THE REAL STORY
This current halving cycle is the weakest in Bitcoin's history. Only 97% gains since April 2024 halving.
10-day realized volatility hit an all-time low of 1.75%.
Translation: Bitcoin is becoming BORING.
And boring is beautiful.
📍 WHAT THIS MEANS FOR US
Less volatility = less panic = fewer people getting wrecked.
More stability = slower but stronger growth.
📍 MY TAKE
I'm not selling because of Iran news.
I'm not panic closing positions.
The market is growing up. Are you?
How are YOU handling today's dip?
#Bitcoin #HalvingCycle #Tokyo_X
$GUN $BLUR $SPK
Bad News hit this morning.
US-Iran peace talks collapsed. Iran rejected a second round of negotiations. Tensions flared up.
Result? Bitcoin dropped $2,000 in hours. Briefly fell below $74,000.
Sounds scary, right?
But here's what most headlines won't tell you.
📍 THE BIGGER PICTURE
This exact same scenario has played out multiple times in 2026. Middle East tensions flare → Bitcoin dips → panic spreads → prices recover.
It's not new.
Bitcoin isn't dying. It's just reacting. Like it always does.
📍 THE REAL STORY
This current halving cycle is the weakest in Bitcoin's history. Only 97% gains since April 2024 halving.
10-day realized volatility hit an all-time low of 1.75%.
Translation: Bitcoin is becoming BORING.
And boring is beautiful.
📍 WHAT THIS MEANS FOR US
Less volatility = less panic = fewer people getting wrecked.
More stability = slower but stronger growth.
📍 MY TAKE
I'm not selling because of Iran news.
I'm not panic closing positions.
The market is growing up. Are you?
How are YOU handling today's dip?
#Bitcoin #HalvingCycle #Tokyo_X
$GUN $BLUR $SPK
Log in to explore more content