Binance Square
#bitcoinanalysis

bitcoinanalysis

936,694 views
3,445 Discussing
PulseON
·
--
Bullish
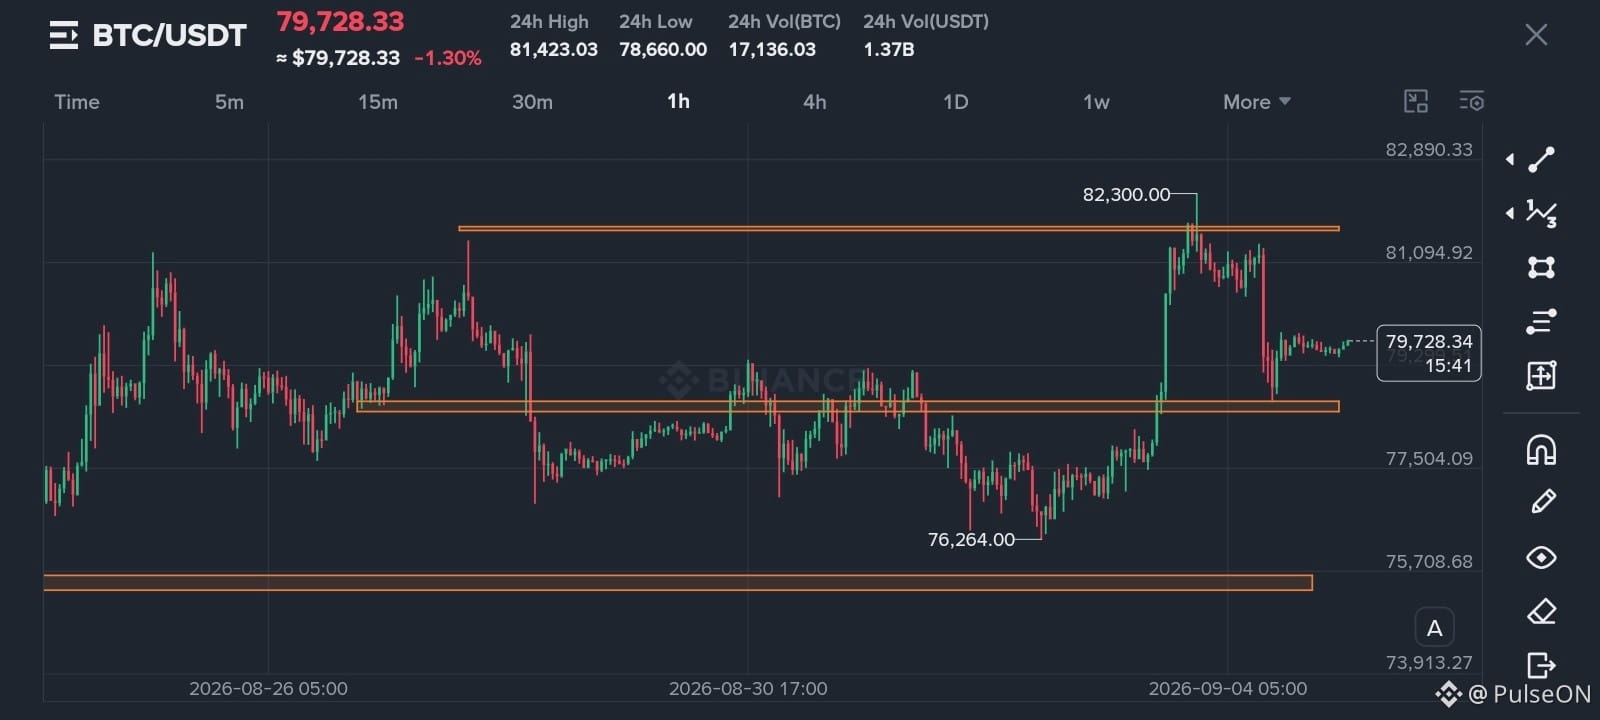
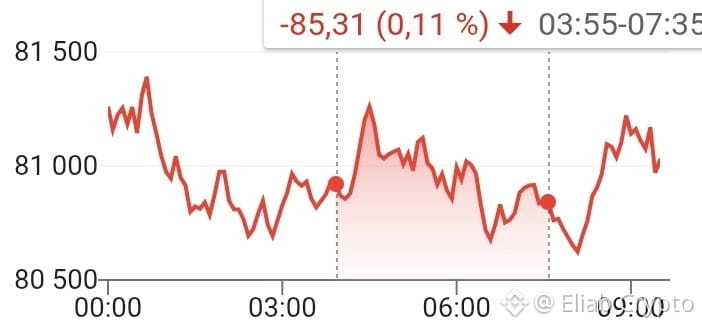
$BTC UPDATE 🟠🔥 BTC got rejected from the $81K zone. For now, I’m watching for some sideways consolidation before the next bigger move. Price needs to cool off a bit after that rejection. No need to force anything here. Let BTC show the direction first. 👀📊 Patience > chasing. NFA. #BTCUSDT #BinanceSquare #CryptoTrading #BitcoinAnalysis
$BTC UPDATE 🟠🔥

BTC got rejected from the $81K zone.

For now, I’m watching for some sideways consolidation before the next bigger move. Price needs to cool off a bit after that rejection.

No need to force anything here. Let BTC show the direction first. 👀📊

Patience > chasing.

NFA.

#BTCUSDT #BinanceSquare #CryptoTrading #BitcoinAnalysis
$BTC is holding around the $79.6K zone after a volatile move. BTC recently pushed above $81K but pulled back after stronger-than-expected U.S. jobs data increased expectations of tighter Fed policy. � Barron's +1 📌 Key levels to watch: 🎯 Resistance: $82K–$82.8K 🟢 Break & hold above $82.8K → $90K becomes a potential next zone 🔴 Lose $75.7K → bearish pressure could increase BTC still has bullish potential, but this is not the time to chase candles. Wait for confirmation and manage risk carefully. 💬 Are you BULLISH or BEARISH on BTC? 👇 #Bitcoin #BTC #Crypto #BinanceSquare #BTCUSDT #CryptoTrading #BitcoinAnalysis {spot}(BTCUSDT)
$BTC is holding around the $79.6K zone after a volatile move. BTC recently pushed above $81K but pulled back after stronger-than-expected U.S. jobs data increased expectations of tighter Fed policy. �
Barron's +1
📌 Key levels to watch: 🎯 Resistance: $82K–$82.8K
🟢 Break & hold above $82.8K → $90K becomes a potential next zone
🔴 Lose $75.7K → bearish pressure could increase
BTC still has bullish potential, but this is not the time to chase candles. Wait for confirmation and manage risk carefully.
💬 Are you BULLISH or BEARISH on BTC? 👇
#Bitcoin #BTC #Crypto #BinanceSquare #BTCUSDT #CryptoTrading #BitcoinAnalysis
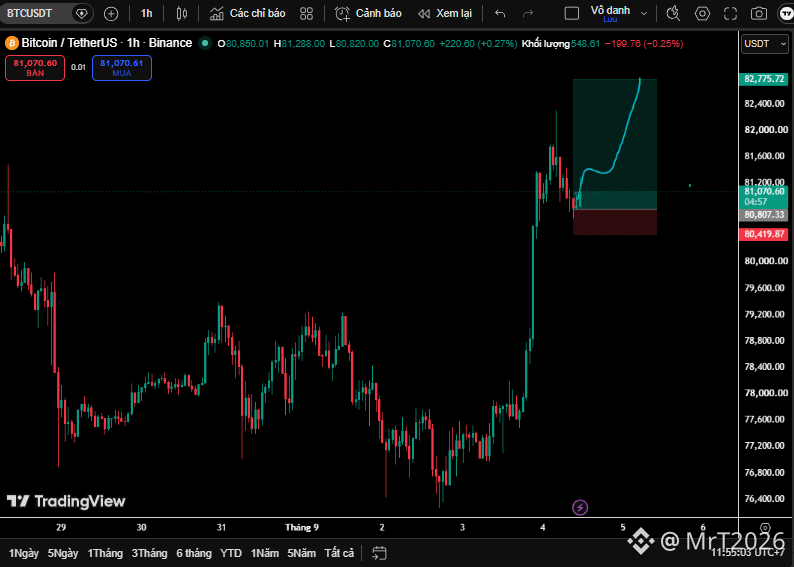
Btc Is Holding $81K — Is BTC Preparing for Another Move Higher?$BTC has made a strong recovery, but the real question now is whether $BTC can turn this recovery into another breakout. On the 1-hour $BTC USDT chart,Btc {future}(BTCUSDT) is trading around $81,000, after reaching an intraday high near $82,283. The price is currently consolidating below the recent high instead of immediately reversing, which makes the next few candles important. 📊 What the Chart Is Showing The short-term structure for BTC still looks relatively strong. BTC is currently trading above: MA(7): $80,924.8MA(25): $80,093.7MA(99): $78,383.9 This is an encouraging sign because BTC remains above all three moving averages on the 1-hour chart. However, momentum has cooled after the sharp move upward. Trading volume was noticeably higher during the initial BTC rally and has started declining during the consolidation. That means buyers are still defending the higher levels, but BTC may need another strong volume increase to push through the recent high. 🔑 Key BTC Levels to Watch The first important resistance for BTC is around $81,240. Above that, the key level is the recent high around $82,283. A convincing BTC breakout above this area, especially with increasing volume, could signal that buyers are attempting to continue the upward move. On the downside, $80,000 is an important psychological area for BTC. Below that, the next levels to watch are around $79,900 and then the $78,400 area, where the MA(99) is currently sitting. 🐂 BTC Bullish / Long Scenario If BTC continues holding above $80K and buyers manage to reclaim $81,240, BTC could retest $82,283. A clean BTC breakout above the recent high with strong volume would make the bullish setup more convincing. 🐻 BTC Bearish / Short Scenario The situation would become weaker if BTC loses the $80K area and starts closing below the short-term moving averages. A deeper pullback in BTC toward $79,900–$78,400 would then become possible. For now, however, the chart does not show a confirmed bearish reversal. BTC appears to be taking a pause after a strong upward move. 🎯 My BTC Trading View For a Long setup, I would look for BTC to hold above $80,000 and preferably reclaim $81,240 with increasing volume. For a Short setup, I would wait for BTC to clearly lose $80,000 and confirm weakness below that level. The key invalidation for the bullish idea would be a sustained move below the $78,400 area. The most interesting part of this BTC chart isn't simply that BTC reached $82K. It's what happens after reaching it. BTC has pulled back from the high but is still holding near $81K and above its major short-term moving averages. That keeps the bullish structure alive, but stronger volume would make the next BTC breakout more convincing. BTC is at a decision point: either buyers return and challenge $82.3K again, or the $80K support starts to weaken. This analysis is based on the provided chart and is not a guarantee of future price movement. Always manage risk carefully. #BitcoinAnalysis #BTC #CryptoMarkets #CryptoNewss

Btc Is Holding $81K — Is BTC Preparing for Another Move Higher?

$BTC has made a strong recovery, but the real question now is whether $BTC can turn this
recovery into another breakout.
On the 1-hour $BTC USDT chart,Btc
is trading around $81,000, after reaching an intraday high near $82,283. The price is currently consolidating below the recent high instead of immediately reversing, which makes the next few candles important.
📊 What the Chart Is Showing
The short-term structure for BTC still looks relatively strong.
BTC is currently trading above:
MA(7): $80,924.8MA(25): $80,093.7MA(99): $78,383.9
This is an encouraging sign because BTC remains above all three moving averages on the 1-hour chart.
However, momentum has cooled after the sharp move upward. Trading volume was noticeably higher during the initial BTC rally and has started declining during the consolidation.
That means buyers are still defending the higher levels, but BTC may need another strong volume increase to push through the recent high.
🔑 Key BTC Levels to Watch
The first important resistance for BTC is around $81,240.
Above that, the key level is the recent high around $82,283. A convincing BTC breakout above this area, especially with increasing volume, could signal that buyers are attempting to continue the upward move.
On the downside, $80,000 is an important psychological area for BTC. Below that, the next levels to watch are around $79,900 and then the $78,400 area, where the MA(99) is currently sitting.
🐂 BTC Bullish / Long Scenario
If BTC continues holding above $80K and buyers manage to reclaim $81,240, BTC could retest $82,283.
A clean BTC breakout above the recent high with strong volume would make the bullish setup more convincing.
🐻 BTC Bearish / Short Scenario
The situation would become weaker if BTC loses the $80K area and starts closing below the short-term moving averages.
A deeper pullback in BTC toward $79,900–$78,400 would then become possible.
For now, however, the chart does not show a confirmed bearish reversal. BTC appears to be taking a pause after a strong upward move.
🎯 My BTC Trading View
For a Long setup, I would look for BTC to hold above $80,000 and preferably reclaim $81,240 with increasing volume.
For a Short setup, I would wait for BTC to clearly lose $80,000 and confirm weakness below that level.
The key invalidation for the bullish idea would be a sustained move below the $78,400 area.
The most interesting part of this BTC chart isn't simply that BTC reached $82K.
It's what happens after reaching it.
BTC has pulled back from the high but is still holding near $81K and above its major short-term moving averages. That keeps the bullish structure alive, but stronger volume would make the next BTC breakout more convincing.
BTC is at a decision point: either buyers return and challenge $82.3K again, or the $80K support starts to weaken.
This analysis is based on the provided chart and is not a guarantee of future price movement. Always manage risk carefully.
#BitcoinAnalysis #BTC #CryptoMarkets #CryptoNewss
$BTC 🚨 BITCOIN UPDATE Bitcoin is holding strong around the $80K zone, keeping the short-term trend bullish. 📈 The key level to watch is $82K–$83K. A clean breakout above this area could open the door toward $85K+. But if BTC loses $78K, buyers may start losing control. 👀 Are we heading to $85K next, or will BTC pull back first? Drop your thoughts below 👇 #Bitcoin #bitcoinanalysis
$BTC 🚨 BITCOIN UPDATE
Bitcoin is holding strong around the $80K zone, keeping the short-term trend bullish. 📈
The key level to watch is $82K–$83K. A clean breakout above this area could open the door toward $85K+.
But if BTC loses $78K, buyers may start losing control.
👀 Are we heading to $85K next, or will BTC pull back first?
Drop your thoughts below 👇
#Bitcoin #bitcoinanalysis
🚀 Is Bitcoin Ready to Move Higher? ₿📈 Bitcoin is showing strong momentum, and if the bullish trend continues and BTC breaks through key resistance levels, we could see further upside ahead. 🔥 However, the crypto market is highly volatile, so a sudden correction is always possible. Always do your own research and manage your risk before making any investment decisions. ⚠️ What do you think? Where is BTC heading next? 👇 #Bitcoin #BTC #Crypto #Bitcoinprice #CryptoMarket #Bullish #BTCUSDTAnalysis #BitcoinAnalysis
🚀 Is Bitcoin Ready to Move Higher? ₿📈

Bitcoin is showing strong momentum, and if the bullish trend continues and BTC breaks through key resistance levels, we could see further upside ahead. 🔥

However, the crypto market is highly volatile, so a sudden correction is always possible. Always do your own research and manage your risk before making any investment decisions. ⚠️

What do you think? Where is BTC heading next? 👇

#Bitcoin #BTC #Crypto #Bitcoinprice #CryptoMarket #Bullish #BTCUSDTAnalysis #BitcoinAnalysis
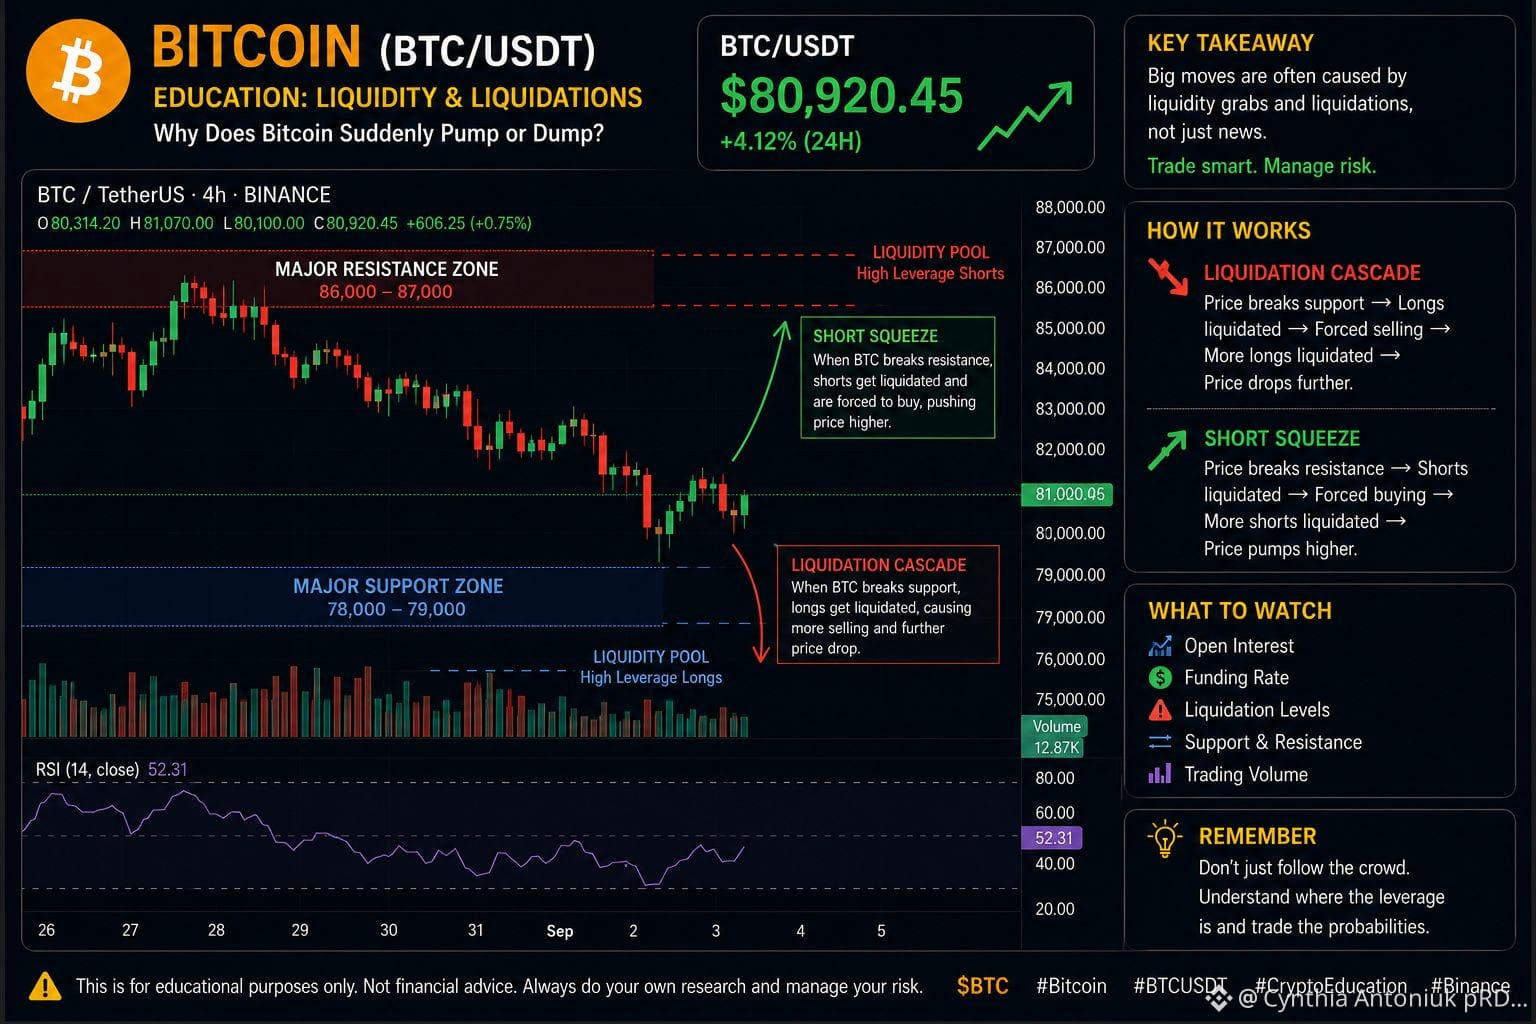
$BTC WHY DOES BITCOIN SUDDENLY PUMP OR DUMP? Have you ever wondered why Bitcoin can move $1,000–$2,000 in minutes? It’s not always because of “good news” or “bad news.” One major reason is liquidity and liquidations. 👇 Imagine BTC is trading at $80K. Thousands of traders are using leverage. Some are betting BTC will go up — these are longs. Others are betting BTC will go down — these are shorts. Now imagine BTC suddenly drops below an important support level. Some leveraged long positions get liquidated. Those liquidations force positions to close, creating additional selling pressure. More selling → BTC drops further → more longs get liquidated. This can create a liquidation cascade. 📉 The same thing can happen in the opposite direction. If BTC suddenly breaks a major resistance level, short positions can get liquidated. Shorts are forced to buy BTC to close their positions. More buying → higher price → more shorts liquidated. This is called a short squeeze. 🚀 So when analyzing BTC, don't only look at the price. Watch: 🔹 Open Interest 🔹 Funding Rate 🔹 Liquidation levels 🔹 Trading volume 🔹 Major support & resistance Sometimes the chart looks bullish… …but excessive leverage can make the move extremely risky. The real question isn't only “Where will BTC go?” It's: 👉 “Where is the leverage sitting?” $BTC #Bitcoin #CryptoEducation #BTC #CryptoTrading #Binance #BitcoinAnalysis
$BTC WHY DOES BITCOIN SUDDENLY PUMP OR DUMP?

Have you ever wondered why Bitcoin can move $1,000–$2,000 in minutes?

It’s not always because of “good news” or “bad news.”

One major reason is liquidity and liquidations. 👇

Imagine BTC is trading at $80K.

Thousands of traders are using leverage.

Some are betting BTC will go up — these are longs.

Others are betting BTC will go down — these are shorts.

Now imagine BTC suddenly drops below an important support level.

Some leveraged long positions get liquidated.

Those liquidations force positions to close, creating additional selling pressure.

More selling → BTC drops further → more longs get liquidated.

This can create a liquidation cascade. 📉

The same thing can happen in the opposite direction.

If BTC suddenly breaks a major resistance level, short positions can get liquidated.

Shorts are forced to buy BTC to close their positions.

More buying → higher price → more shorts liquidated.

This is called a short squeeze. 🚀

So when analyzing BTC, don't only look at the price.

Watch:

🔹 Open Interest
🔹 Funding Rate
🔹 Liquidation levels
🔹 Trading volume
🔹 Major support & resistance

Sometimes the chart looks bullish…

…but excessive leverage can make the move extremely risky.

The real question isn't only “Where will BTC go?”

It's:

👉 “Where is the leverage sitting?”

$BTC #Bitcoin #CryptoEducation #BTC #CryptoTrading #Binance #BitcoinAnalysis
·
--
Bullish
#Bitcoin has regained strong momentum this week, with price pushing above $81,000 after breaking its 50-week moving average. The broader crypto market is following this move, with total market cap up nearly 5% over 24 hours This morning, the key signal is that bullish momentum remains intact. #ETF flows have turned strongly positive again, with around $731 million in net inflows for the day, showing a clear return of institutional demand #Bitcoin #BitcoinAnalysis #MarketUpdate
#Bitcoin has regained strong momentum this week, with price pushing above $81,000 after breaking its 50-week moving average. The broader crypto market is following this move, with total market cap up nearly 5% over 24 hours

This morning, the key signal is that bullish momentum remains intact. #ETF flows have turned strongly positive again, with around $731 million in net inflows for the day, showing a clear return of institutional demand

#Bitcoin #BitcoinAnalysis #MarketUpdate
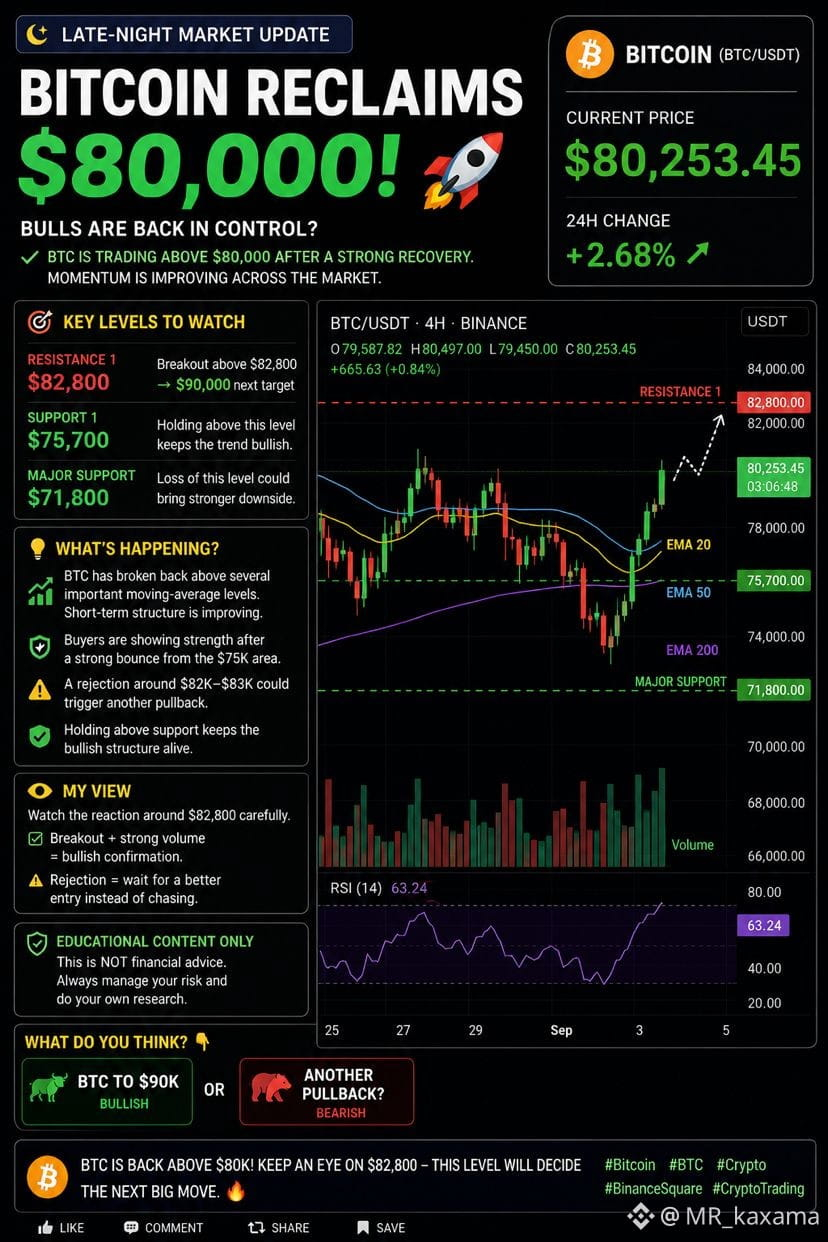
$BTC (Bitcoin is back above the $80,000 level, showing strong momentum after its recent pullback. 📊 KEY LEVELS TO WATCH: 🔹 Resistance: $82,800 🔹 Breakout above $82,800 → $90,000 becomes the next major area to watch 🔹 Support: $75,700 🔹 Major support: $71,800 🔥 WHAT’S HAPPENING? BTC has broken back above several important moving-average levels, improving the short-term structure. But don’t get too confident yet. A rejection around $82K–$83K could trigger another pullback, while holding above support would keep the bullish structure alive. 🎯 MY VIEW: Watch the reaction around $82,800 carefully. Breakout + strong volume = bullish confirmation. Rejection = wait for a better entry instead of chasing. ⚠️ Educational content only — NOT financial advice. Always manage your risk and do your own research. What do you think? 👇 🚀 BTC to $90K or 🔻 Another pullback first? #Bitcoin #BitcoinAnalysis #Trading #CryptoTrading #BinanceSquareTalks
$BTC (Bitcoin is back above the $80,000 level, showing strong momentum after its recent pullback.

📊 KEY LEVELS TO WATCH:

🔹 Resistance: $82,800
🔹 Breakout above $82,800 → $90,000 becomes the next major area to watch
🔹 Support: $75,700
🔹 Major support: $71,800

🔥 WHAT’S HAPPENING?

BTC has broken back above several important moving-average levels, improving the short-term structure.

But don’t get too confident yet.

A rejection around $82K–$83K could trigger another pullback, while holding above support would keep the bullish structure alive.

🎯 MY VIEW:
Watch the reaction around $82,800 carefully.

Breakout + strong volume = bullish confirmation.
Rejection = wait for a better entry instead of chasing.

⚠️ Educational content only — NOT financial advice. Always manage your risk and do your own research.

What do you think? 👇
🚀 BTC to $90K
or
🔻 Another pullback first?

#Bitcoin #BitcoinAnalysis #Trading #CryptoTrading #BinanceSquareTalks
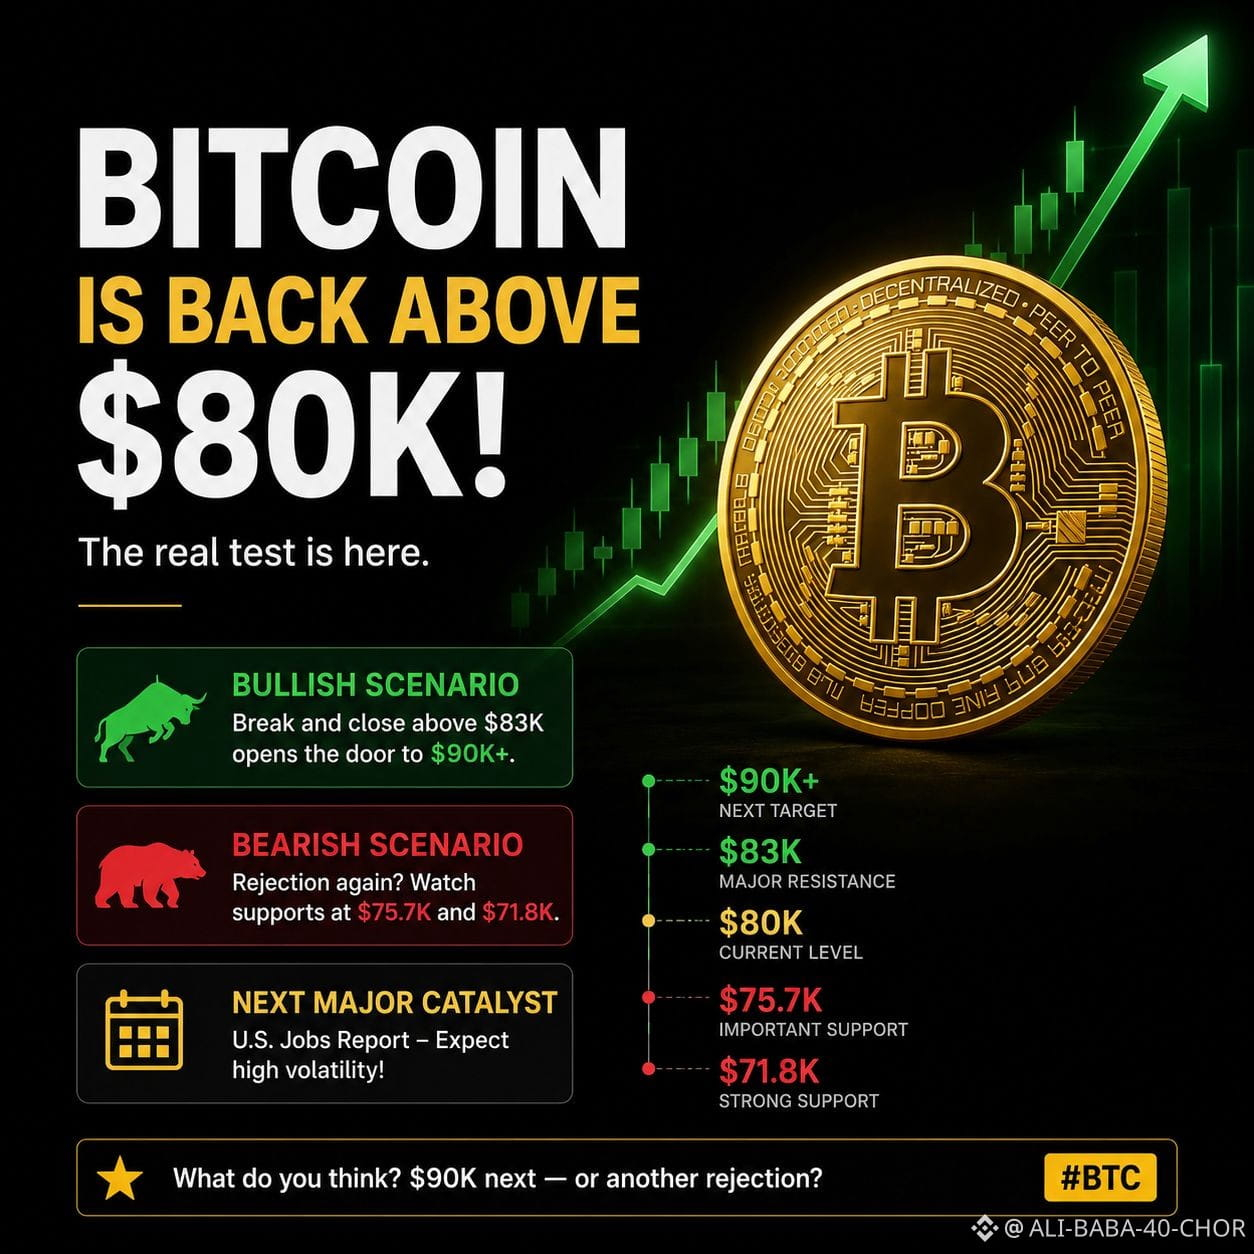
🚨 BITCOIN IS BACK ABOVE $80K — BUT THE REAL TEST IS HERE! 🟠🔥 Bitcoin has made a strong recovery and pushed back above the $80,000 level. But bulls are now facing a major resistance zone around $82,000–$83,000. This area could decide $BTC {future}(BTCUSDT) next big move.$PEPE {spot}(PEPEUSDT) 📈 Bullish scenario: A strong daily breakout and close above $83K could open the door toward $90K+. ⚠️ Bearish scenario: If BTC gets rejected again, the first important supports are around $75.7K and $71.8K. The next major catalyst is the U.S. Jobs Report, which could bring serious volatility to Bitcoin and the wider crypto market. My view: BTC momentum is improving, but I want to see a confirmed breakout above $83K before calling the next leg fully bullish. 👇 What do you think? $90K next — or another rejection? #Bitcoin #BTC #Crypto #BinanceSquare #BTCUSDT #CryptoTrading #BitcoinAnalysis
🚨 BITCOIN IS BACK ABOVE $80K — BUT THE REAL TEST IS HERE! 🟠🔥

Bitcoin has made a strong recovery and pushed back above the $80,000 level.

But bulls are now facing a major resistance zone around $82,000–$83,000. This area could decide $BTC
next big move.$PEPE

📈 Bullish scenario:
A strong daily breakout and close above $83K could open the door toward $90K+.

⚠️ Bearish scenario:
If BTC gets rejected again, the first important supports are around $75.7K and $71.8K.

The next major catalyst is the U.S. Jobs Report, which could bring serious volatility to Bitcoin and the wider crypto market.

My view: BTC momentum is improving, but I want to see a confirmed breakout above $83K before calling the next leg fully bullish.

👇 What do you think?
$90K next — or another rejection?

#Bitcoin #BTC #Crypto #BinanceSquare #BTCUSDT #CryptoTrading #BitcoinAnalysis
·
--
Bullish
📊 $BTC IS STUCK BETWEEN TWO BIG ZONES Bitcoin is still trading inside a pretty clear range, and Glassnode is pointing to $83K–$86K as the major resistance zone. $BTC pushed above $80K during the August rally but failed to break through that supply area and pulled back toward the $76K region. That rejection is keeping the market in a range for now. On the downside, $62K–$65K remains the key accumulation/support zone. So basically, BTC is sitting between a major ceiling above and a strong floor below. Until that $83K–$86K supply gets absorbed, I’d expect more chop and volatility rather than blindly chasing every move. 👀 These are the levels I’m watching closely. #Bitcoin #Crypto #BitcoinAnalysis #Trading
📊 $BTC IS STUCK BETWEEN TWO BIG ZONES

Bitcoin is still trading inside a pretty clear range, and Glassnode is pointing to $83K–$86K as the major resistance zone.

$BTC pushed above $80K during the August rally but failed to break through that supply area and pulled back toward the $76K region. That rejection is keeping the market in a range for now.

On the downside, $62K–$65K remains the key accumulation/support zone. So basically, BTC is sitting between a major ceiling above and a strong floor below.

Until that $83K–$86K supply gets absorbed, I’d expect more chop and volatility rather than blindly chasing every move. 👀

These are the levels I’m watching closely.

#Bitcoin #Crypto #BitcoinAnalysis #Trading
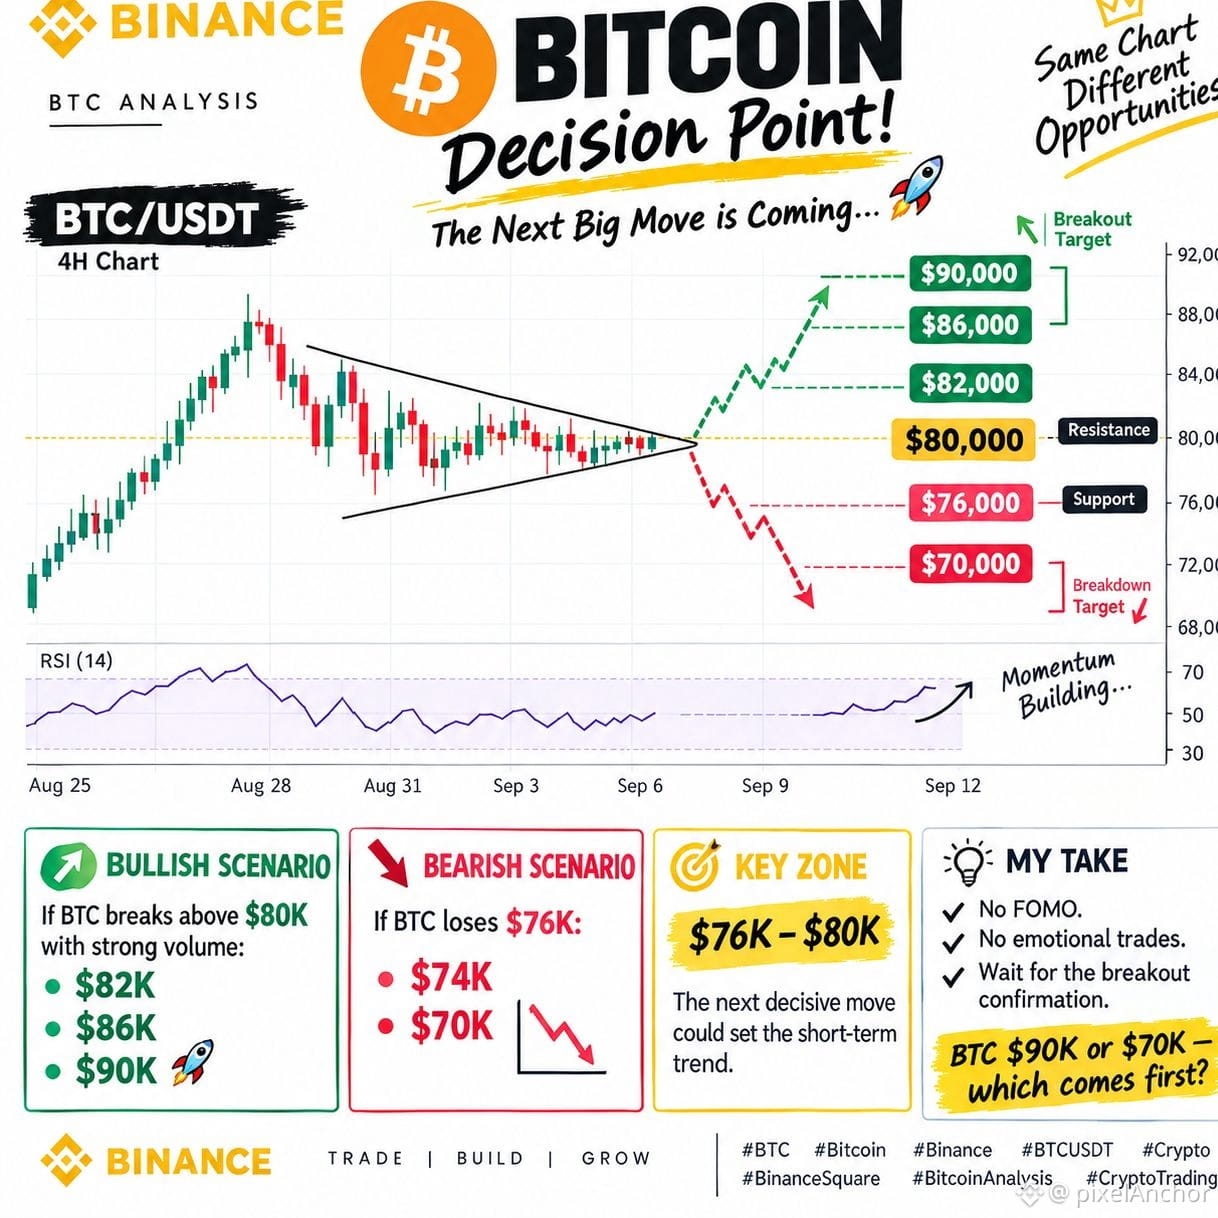
The chart is getting tighter… and $BTC may be preparing for a BIG MOVE. ⚡📊 🔥 BREAKOUT WATCH If BTC clears $80K with strong confirmation: ➡️ $82k ➡️ $86K ➡️ $90K 🚀 ⚠️ BREAKDOWN WATCH Lose $76K: ➡️ $74K ➡️ $70K 📉 🎯 THE BATTLE ZONE: $76K ↔ $80K {future}(BTCUSDT) The chart is getting tighter… and BTC may be preparing for a BIG MOVE. ⚡📊 🔥 BREAKOUT WATCH If BTC clears $80K with strong confirmation: ➡️ $82K ➡️ $86K ➡️ $90K 🚀 ⚠️ BREAKDOWN WATCH Lose $76K: ➡️ $74K ➡️ $70K 📉 🎯 THE BATTLE ZONE: $76K ↔ $80K No FOMO. No emotional trades. Wait for the breakout confirmation. 🧠 No FOMO. No emotional trades. Wait for the breakout confirmation. 🧠 👀 BTC $90K or $70K — which comes first? #BTC #Bitcoin #Binance #BTCUSDT #Crypto #BinanceSquare #BitcoinAnalysis #CryptoTrading #BTCUpdate
The chart is getting tighter… and $BTC
may be preparing for a BIG MOVE. ⚡📊
🔥 BREAKOUT WATCH If BTC clears $80K with strong confirmation: ➡️ $82k
➡️ $86K
➡️ $90K 🚀
⚠️ BREAKDOWN WATCH Lose $76K: ➡️ $74K
➡️ $70K 📉
🎯 THE BATTLE ZONE:
$76K ↔ $80K

The chart is getting tighter… and BTC may be preparing for a BIG MOVE. ⚡📊
🔥 BREAKOUT WATCH If BTC clears $80K with strong confirmation: ➡️ $82K
➡️ $86K
➡️ $90K 🚀
⚠️ BREAKDOWN WATCH Lose $76K: ➡️ $74K
➡️ $70K 📉
🎯 THE BATTLE ZONE:
$76K ↔ $80K
No FOMO. No emotional trades.
Wait for the breakout confirmation. 🧠
No FOMO. No emotional trades.
Wait for the breakout confirmation. 🧠
👀 BTC $90K or $70K — which comes first?
#BTC #Bitcoin #Binance #BTCUSDT #Crypto #BinanceSquare #BitcoinAnalysis #CryptoTrading #BTCUpdate
🚨 BTC UPDATE — $80K ZONE IN FOCUS 👀 Bitcoin is trading around the important psychological level of $80K. 📊 BTC has shown strong volatility in recent sessions, so for now it’s important to carefully watch for either a breakout or a rejection. 📈 A strong move above $80K + volume = could signal bullish momentum. 📉 Rejection from $80K = chance of a short-term pullback. My focus right now is on price action + volume. No blind entry — waiting for confirmation is better. 🧠 What do you think? {spot}(BTCUSDT) 🔥 Will BTC break out or face rejection? #BTC #Bitcoin #BTCUSDT #Crypto #Binance #CryptoTrading #BitcoinAnalysis
🚨 BTC UPDATE — $80K ZONE IN FOCUS 👀

Bitcoin is trading around the important psychological level of $80K. 📊

BTC has shown strong volatility in recent sessions, so for now it’s important to carefully watch for either a breakout or a rejection.

📈 A strong move above $80K + volume = could signal bullish momentum.

📉 Rejection from $80K = chance of a short-term pullback.

My focus right now is on price action + volume. No blind entry — waiting for confirmation is better. 🧠

What do you think?

🔥 Will BTC break out or face rejection?

#BTC #Bitcoin #BTCUSDT #Crypto #Binance #CryptoTrading #BitcoinAnalysis
·
--
Bearish
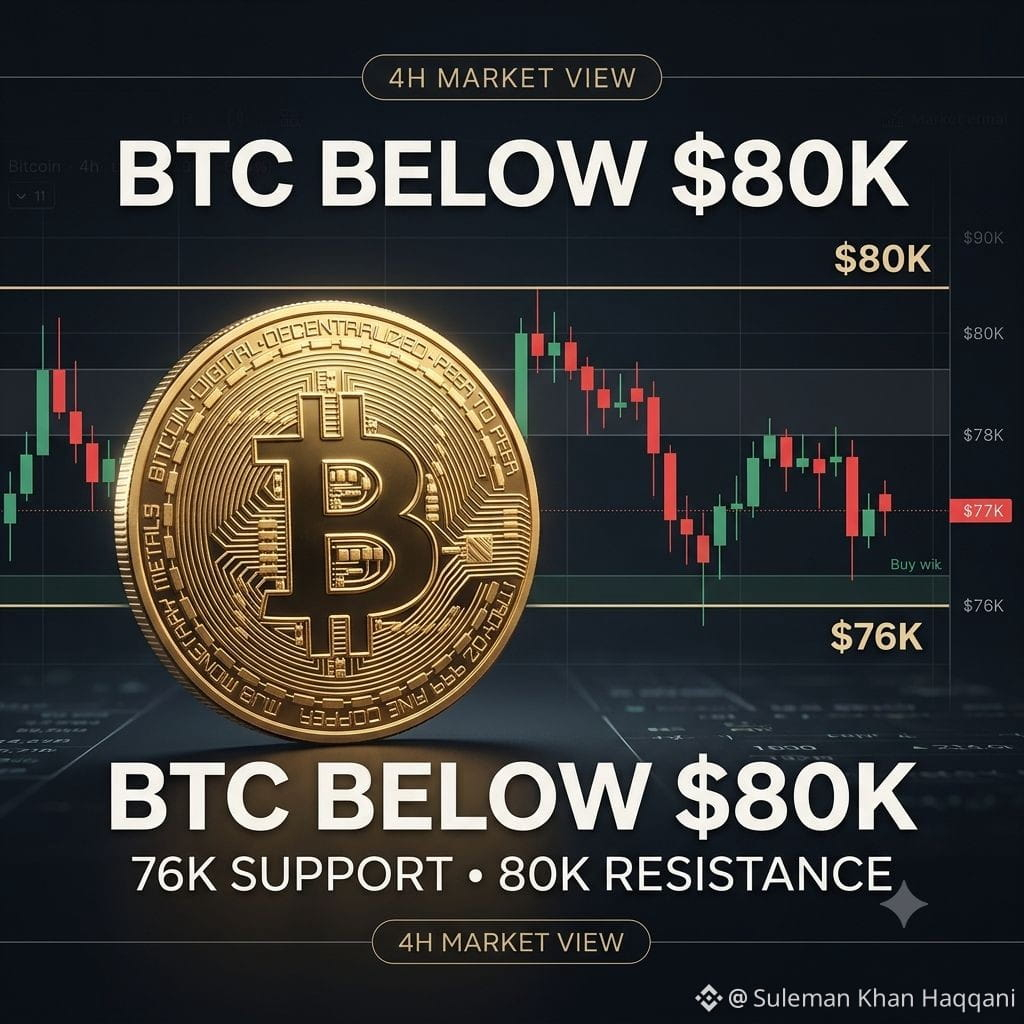
BTC Is Still Below $80K — I’m Not Chasing the Move Bitcoin is currently trading around the $77K area, still below the $80K level that has been important for the recent price action. Personally, I’m staying cautious here. The market has several things to digest right now, including higher yields, geopolitical uncertainty and changing expectations around US interest rates. For me, the important levels are simple: 🔴 $80K — resistance / bullish confirmation zone 🟢 $76K — support I’m watching If BTC can reclaim $80K and hold above it, the short-term picture could improve. But if $76K breaks with real selling pressure, I would become more cautious about further downside. So my current short-term bias is: 🔴 Slightly Bearish No guaranteed targets. No “100% breakout” calls. Just watching the price action and waiting for confirmation. What are you watching right now? 🟢 $80K breakout 🔴 $76K breakdown ⚪ Range continues $BTC {spot}(BTCUSDT) #Bitcoin❗ #BTC #Crypto_Jobs🎯 #BinanceSquareFamily #BitcoinAnalysis
BTC Is Still Below $80K — I’m Not Chasing the Move

Bitcoin is currently trading around the $77K area, still below the $80K level that has been important for the recent price action.

Personally, I’m staying cautious here.

The market has several things to digest right now, including higher yields, geopolitical uncertainty and changing expectations around US interest rates.

For me, the important levels are simple:

🔴 $80K — resistance / bullish confirmation zone
🟢 $76K — support I’m watching

If BTC can reclaim $80K and hold above it, the short-term picture could improve.

But if $76K breaks with real selling pressure, I would become more cautious about further downside.

So my current short-term bias is:

🔴 Slightly Bearish

No guaranteed targets. No “100% breakout” calls. Just watching the price action and waiting for confirmation.

What are you watching right now?

🟢 $80K breakout
🔴 $76K breakdown
⚪ Range continues

$BTC

#Bitcoin❗ #BTC #Crypto_Jobs🎯 #BinanceSquareFamily #BitcoinAnalysis
Bitcoin Up or Down on September 3?

Bitcoin Up or Down on September 3?

99%Up1%Down
Volume $143,592.58
·
--
🚨 BITCOIN UPDATE $SEPTEMBER 2, 2026 Bitcoin is currently trading around the $77K area after recently moving above $80K. The interesting part isn't simply the pullback it's what happens next. 📉 BTC is currently facing short-term selling pressure. 📊 The $77K area is being closely watched by the market. A sustained move below it could increase downside pressure, while a recovery back toward $80K would show that buyers are regaining strength. 🌍 Macro conditions are also important right now, with markets watching U.S. interest-rate expectations and upcoming economic data. For me, the key question isn't “Will BTC pump or dump?” It's: Will buyers defend the current support, or will sellers take control? 👀 What are you watching most closely right now BTC price action, volume, or macro news? #bitcoin #BTC #Binance #BitcoinAnalysis #CryptoMarket
🚨 BITCOIN UPDATE $SEPTEMBER 2, 2026

Bitcoin is currently trading around the $77K area after recently moving above $80K.

The interesting part isn't simply the pullback it's what happens next.

📉 BTC is currently facing short-term selling pressure.

📊 The $77K area is being closely watched by the market. A sustained move below it could increase downside pressure, while a recovery back toward $80K would show that buyers are regaining strength.

🌍 Macro conditions are also important right now, with markets watching U.S. interest-rate expectations and upcoming economic data.

For me, the key question isn't “Will BTC pump or dump?”

It's:

Will buyers defend the current support, or will sellers take control? 👀

What are you watching most closely right now BTC price action, volume, or macro news?
#bitcoin #BTC #Binance #BitcoinAnalysis #CryptoMarket
📌 Bitcoin Analysis | 4H Bitcoin has reached the green support zone exactly as outlined in the previous analysis. 🎯 A solid rebound could happen from here, but the bigger picture remains cautious. ⚠️ If support fails, $BTC could continue moving lower. 👀 Bounce or Breakdown? Drop your view below 👇 #BTC #bitcoin #BTCUSDT #cryptotrading #BitcoinAnalysis
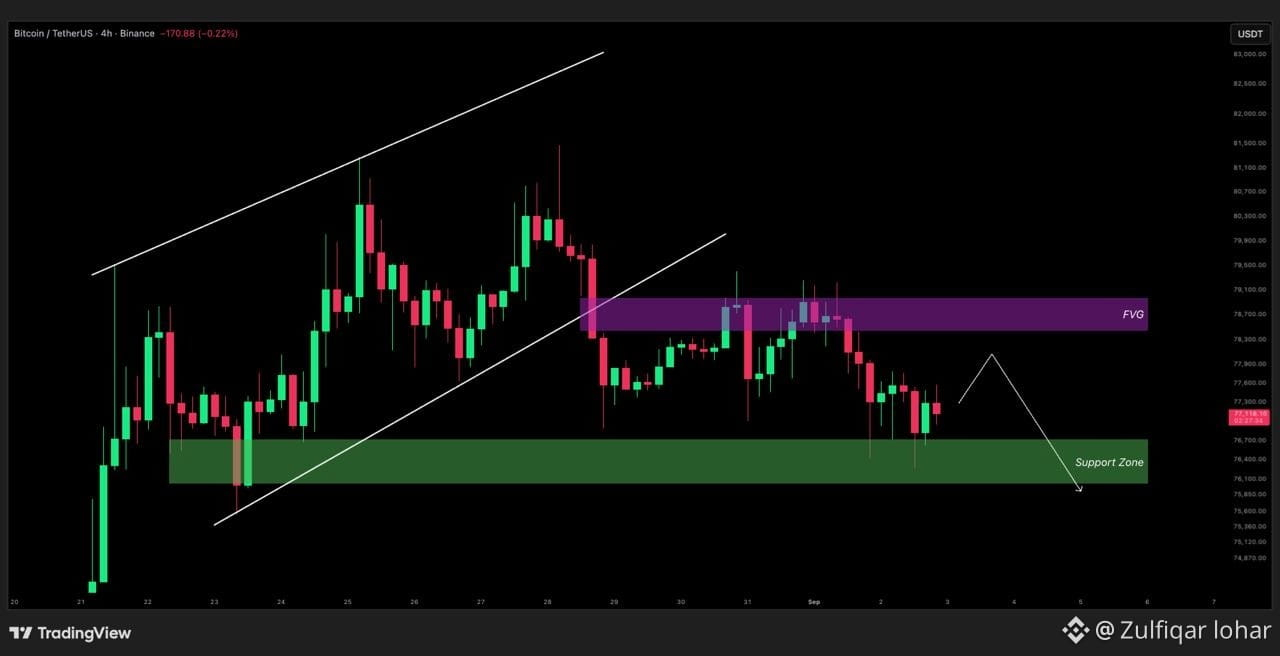
📌 Bitcoin Analysis | 4H

Bitcoin has reached the green support zone exactly as outlined in the previous analysis. 🎯

A solid rebound could happen from here, but the bigger picture remains cautious. ⚠️

If support fails, $BTC could continue moving lower.

👀 Bounce or Breakdown?
Drop your view below 👇

#BTC #bitcoin #BTCUSDT #cryptotrading #BitcoinAnalysis
omrymn:
BTC
📊 BTC/USDT — 4H Chart Analysis {spot}(BTCUSDT) Bitcoin is currently trading around $79,420, and a short-term pullback is visible on the 4H chart. 🔹 EMA 7: $80,215 — immediate resistance 🔹 EMA 25: $79,130 — important short-term support 🔹 EMA 99: $76,289 — major support zone 🔹 Recent High: $82,300 📉 Scenario: If BTC holds above $79,130 and reclaims $80,215, then a retest of $82,300 may be possible. ⚠️ If $79,130 breaks decisively, the price may pull back toward the EMA 99 zone near $76,300. 🎯 Key Levels: Resistance: $80,215 → $82,300 Support: $79,130 → $76,289 💡 Bottom line: The trend is still in an overall bullish structure, but short-term momentum has weakened. Without confirmation, it is better to avoid a FOMO entry. Not financial advice. Trade with proper risk management. $BTC #BTCUSDT #Crypto #CryptoAnalysis #Binance #BitcoinAnalysis
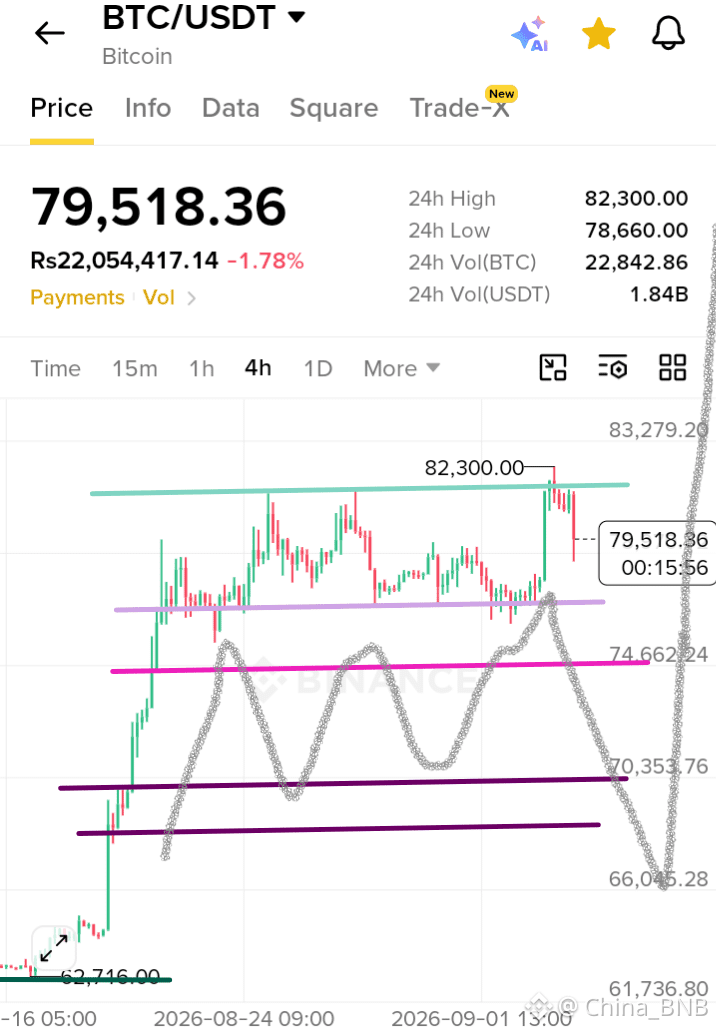
📊 BTC/USDT — 4H Chart Analysis
Bitcoin is currently trading around $79,420, and a short-term pullback is visible on the 4H chart.

🔹 EMA 7: $80,215 — immediate resistance
🔹 EMA 25: $79,130 — important short-term support
🔹 EMA 99: $76,289 — major support zone
🔹 Recent High: $82,300

📉 Scenario:
If BTC holds above $79,130 and reclaims $80,215, then a retest of $82,300 may be possible.

⚠️ If $79,130 breaks decisively, the price may pull back toward the EMA 99 zone near $76,300.

🎯 Key Levels:
Resistance: $80,215 → $82,300
Support: $79,130 → $76,289

💡 Bottom line: The trend is still in an overall bullish structure, but short-term momentum has weakened. Without confirmation, it is better to avoid a FOMO entry.

Not financial advice. Trade with proper risk management.
$BTC
#BTCUSDT #Crypto #CryptoAnalysis #Binance #BitcoinAnalysis
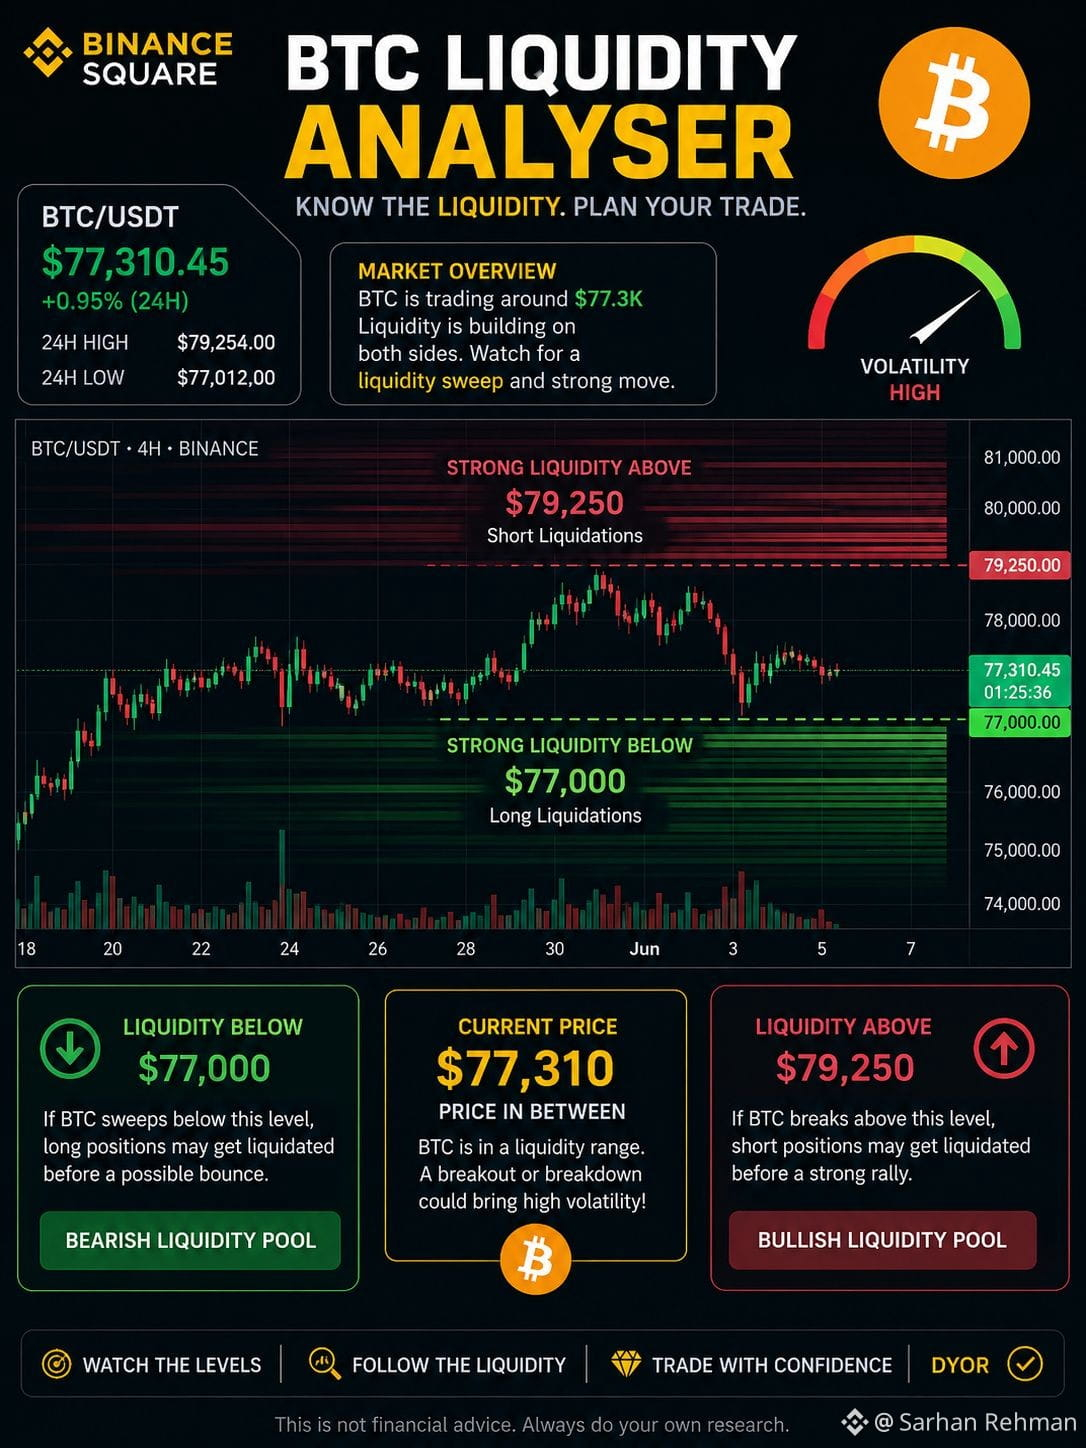
🚨 $BTC LIQUIDITY CHECK — WATCH THESE LEVELS 👀 Bitcoin is trading around $77.3K right now. The key liquidity zones are getting interesting. 📊 🟢 Liquidity Below: ~$77,000 A sweep below the recent low could trigger long liquidations before a possible recovery. 🔴 Liquidity Above: ~$79,250 A move back toward this area could squeeze short positions and create a fast upside move. ⚠️ The setup: BTC is sitting between nearby liquidity pools. A sharp move through either side could bring volatility quickly. 🔥 My watch: $77K = downside liquidity $79.25K = upside liquidity Which side gets swept first — LONGS 🐂 or SHORTS 🐻? {future}(BTCUSDT) #BTC #Bitcoin #Liquidity #BTCUSDT #BinanceSquare #CryptoTrading #BitcoinAnalysis (This is market commentary, not a guaranteed price prediction or trading recommendation)
🚨 $BTC LIQUIDITY CHECK — WATCH THESE LEVELS 👀

Bitcoin is trading around $77.3K right now. The key liquidity zones are getting interesting. 📊

🟢 Liquidity Below: ~$77,000
A sweep below the recent low could trigger long liquidations before a possible recovery.

🔴 Liquidity Above: ~$79,250
A move back toward this area could squeeze short positions and create a fast upside move.

⚠️ The setup:
BTC is sitting between nearby liquidity pools. A sharp move through either side could bring volatility quickly.

🔥 My watch:
$77K = downside liquidity
$79.25K = upside liquidity

Which side gets swept first — LONGS 🐂 or SHORTS 🐻?


#BTC #Bitcoin #Liquidity #BTCUSDT #BinanceSquare #CryptoTrading #BitcoinAnalysis

(This is market commentary, not a guaranteed price prediction or trading recommendation)
₿ BTC-USD UPDATE | 09/04/2026 BTC just had a strong upswing, but it’s not time to FOMO yet. 📊 Multi-timeframe picture • D1: TRANSITION • H4: BUY • H1: TRANSITION D1 has expanded upward significantly, and H4 still maintains a bullish structure. However, H1 is currently in a pullback and has not reclaimed the most recent lower-high. 📍 Coinbase price at the time of check: ~80,832 USD 🧱 Key zones • Support: 80,346 – 80,611 • Resistance: 81,768 – 82,283 Price is currently sitting between two decision zones → this is not a good spot to chase. 🔥 What does the uptrend scenario need? To confirm bullish continuation, H1 needs: Close above 81,438 → then have follow-through or a retest that holds the zone If this happens, the Pullback Continuation setup becomes notably more interesting. ⚠️ Invalidation If H1 closes below 80,346, the current bullish watch is invalidated. 🗓️ Big risk today U.S. Employment Situation — 19:30 ICT U.S. labor data may cause strong volatility, so waiting for confirmation is even more important. 🎯 Current status: WATCH No Confirmed signal yet. There’s no reason to place a hypothetical Entry / SL / TP. Priority: wait for price to come to the zone + wait for H1 confirmation—no FOMO within the range. #Bitcoin #BTC #BTCUSD #Crypto #PriceAction #Trading #BitcoinAnalysis
₿ BTC-USD UPDATE | 09/04/2026
BTC just had a strong upswing, but it’s not time to FOMO yet.
📊 Multi-timeframe picture
• D1: TRANSITION
• H4: BUY
• H1: TRANSITION
D1 has expanded upward significantly, and H4 still maintains a bullish structure. However, H1 is currently in a pullback and has not reclaimed the most recent lower-high.
📍 Coinbase price at the time of check: ~80,832 USD
🧱 Key zones
• Support: 80,346 – 80,611
• Resistance: 81,768 – 82,283
Price is currently sitting between two decision zones → this is not a good spot to chase.
🔥 What does the uptrend scenario need?
To confirm bullish continuation, H1 needs:
Close above 81,438
→ then have follow-through or a retest that holds the zone
If this happens, the Pullback Continuation setup becomes notably more interesting.
⚠️ Invalidation
If H1 closes below 80,346, the current bullish watch is invalidated.
🗓️ Big risk today
U.S. Employment Situation — 19:30 ICT
U.S. labor data may cause strong volatility, so waiting for confirmation is even more important.
🎯 Current status: WATCH
No Confirmed signal yet.
There’s no reason to place a hypothetical Entry / SL / TP.
Priority: wait for price to come to the zone + wait for H1 confirmation—no FOMO within the range.
#Bitcoin #BTC #BTCUSD #Crypto #PriceAction #Trading #BitcoinAnalysis
Log in to explore more content
Join global crypto users on Binance Square
⚡️ Get latest and useful information about crypto.
💬 Trusted by the world’s largest crypto exchange.
👍 Discover real insights from verified creators.
Email / Phone number