🚨 BTC Liquidity Map — Key Levels to Watch
Looking at the current BTC liquidity heatmap, a few important zones stand out clearly.
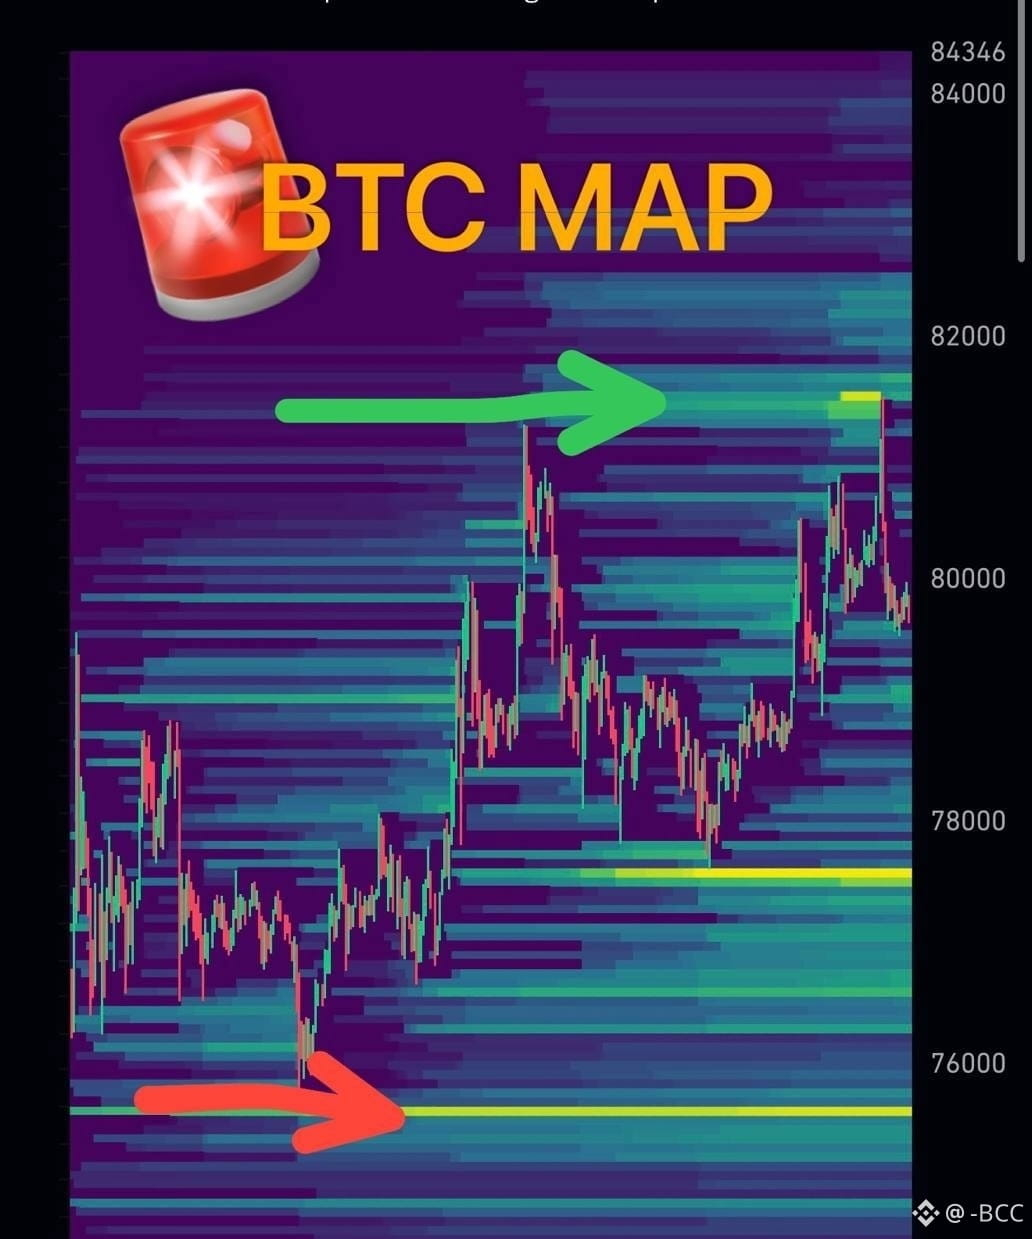
🟢 $81,000–$81,500 → Major liquidity/resistance zone. If BTC reclaims this area with strong momentum, the bullish move could continue.
🟡 $77,300–$77,600 → Key nearby support/liquidity zone. Holding this area could bring buyers back into the market.
🟡 $75,300–$75,600 → Another significant liquidity zone below. If $77K breaks, this could become the next area to watch.
📌 My observation:
BTC appears to be moving within a $77K–$81.5K liquidity range. Instead of reacting to every small move, I’d watch how price reacts around these major liquidity zones.
Above $81.5K → bullish confirmation 🚀
Below $77K → $75.5K becomes the key zone ⚠️
Not financial advice. Always manage your risk, especially when using leverage.
Where do you think BTC will hunt liquidity next—UP or DOWN? 👀
#BTC #Bitcoin #Crypto #BTCUSDT #Liquidity #BitcoinAnalysis #cryptotrading
Looking at the current BTC liquidity heatmap, a few important zones stand out clearly.
🟢 $81,000–$81,500 → Major liquidity/resistance zone. If BTC reclaims this area with strong momentum, the bullish move could continue.
🟡 $77,300–$77,600 → Key nearby support/liquidity zone. Holding this area could bring buyers back into the market.
🟡 $75,300–$75,600 → Another significant liquidity zone below. If $77K breaks, this could become the next area to watch.
📌 My observation:
BTC appears to be moving within a $77K–$81.5K liquidity range. Instead of reacting to every small move, I’d watch how price reacts around these major liquidity zones.
Above $81.5K → bullish confirmation 🚀
Below $77K → $75.5K becomes the key zone ⚠️
Not financial advice. Always manage your risk, especially when using leverage.
Where do you think BTC will hunt liquidity next—UP or DOWN? 👀
#BTC #Bitcoin #Crypto #BTCUSDT #Liquidity #BitcoinAnalysis #cryptotrading