

交易员刺客
148 Posts

交易员刺客
Report
Block User
刺客社区创始人,绿洲大学联合创始人,香港web3协会会员,新加坡区块链中文大使,推特华语区块链头部KOL,bilibili的up主“飞哥定投策略”老师,2024年币安交易嘉年华第一名,2016年开始布道区块链。推特:@TraderCIKE

BNB Holder
Frequent Trader
5.5 Years
5 Following
837 Followers
489 Liked
Posts
All
Videos
Live
PINNED
·
--
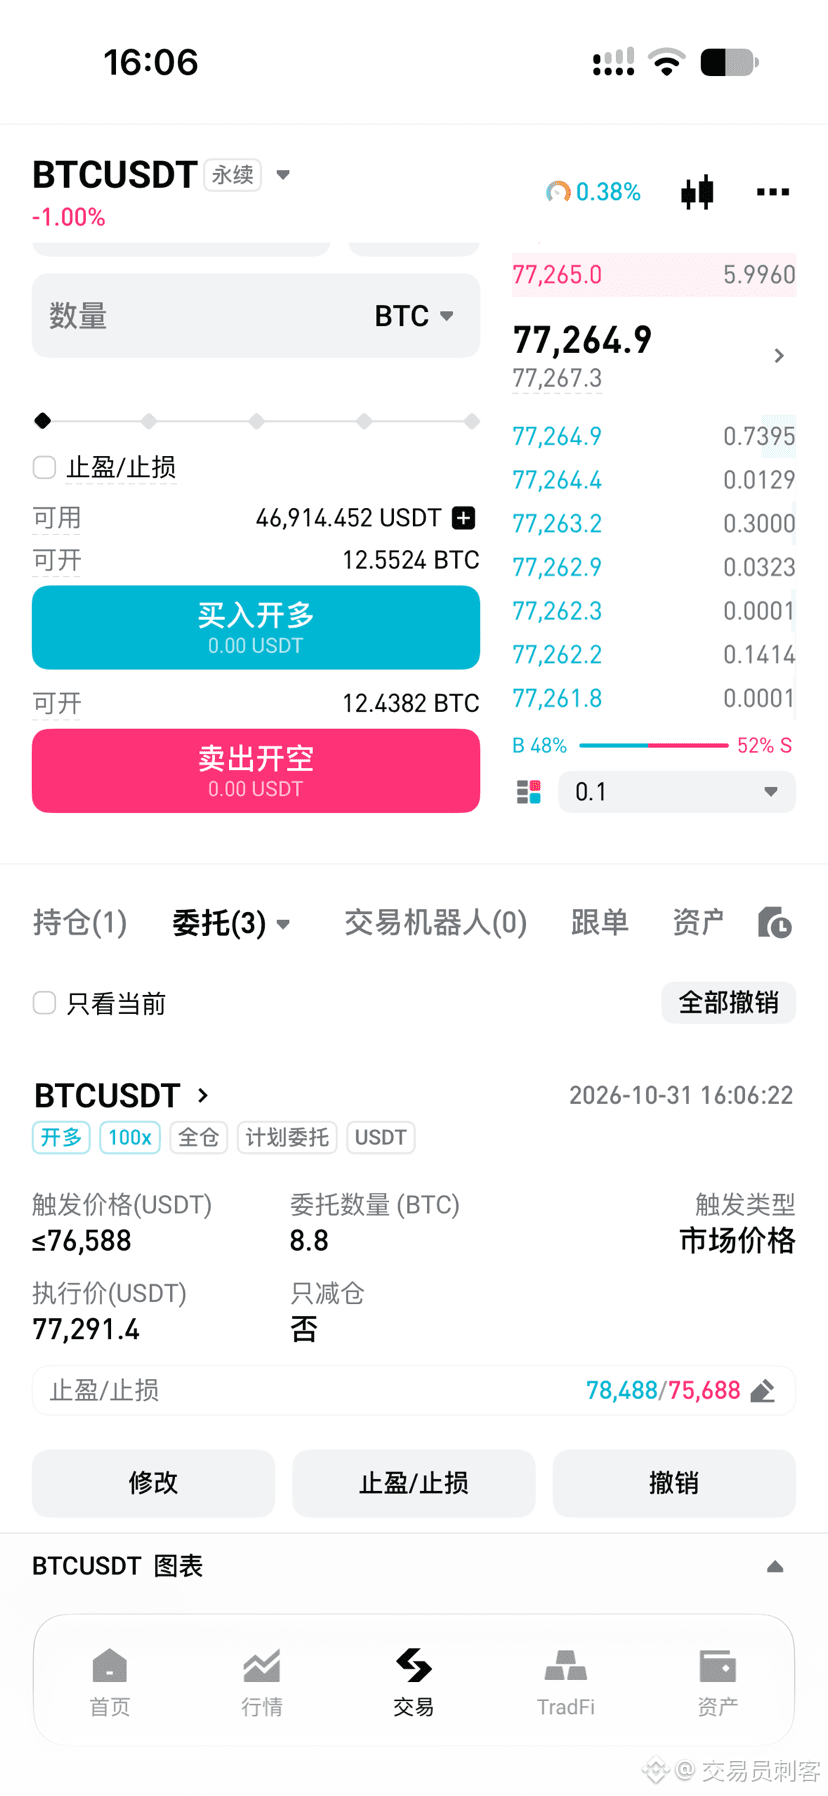
$BTC
Shorting BTC at 77,600 makes perfect sense. This is a classic trend-following trade, aiming to catch the retest after a breakdown.
First, the technical picture. Bitcoin has just gone through options expiry and plunged straight through the key 80,000 level. At 77,600, we’re now seeing a weak bounce after the breakdown. Look above: the 78,800–80,000 range is not only packed with previous buyers stuck in losing positions, but is also firmly capped by the moving averages. For the bulls to reverse the trend, they’d need a massive surge in volume to break through—but the current market simply doesn’t have that kind of buying power. Shorting from here leaves very little room for risk and offers a highly favorable risk-reward ratio.
Next, the market’s funding and macro backdrop. The Fed is still holding firm on inflation, and the probability of a rate hike in December remains above 70%. Rising long-term Treasury yields are weighing on markets, and liquidity is extremely tight. Intel plunged 30% last night, while the Nasdaq fell 2.9%—tech stocks are undergoing a brutal deleveraging. To meet margin calls, institutions will sell highly liquid assets indiscriminately. The average cost basis of Bitcoin ETFs is around 81,500. The current price is far below that level, with resistance overhead from trapped buyers and no fresh capital coming in to bail them out.
Looking lower, 76,100–76,800 is the most crowded liquidation zone for longs. If price breaks through it on heavy volume, the cascade of liquidations could be brutal.
Here’s the fixed trade plan: enter short directly around 77,600, with a firm stop-loss just above 78,800. If price holds above 78,800 on strong volume, the bearish structure has been invalidated—take the loss and exit. Do not hold and hope. The first target is 76,500, with 76,000 next if that level breaks. At 76,500, close most of the position and lock in your gains. For the remainder, use a trailing stop: for every 200-point drop in price, move the stop down by 100 points.
Limit your position to 10% of total capital, with leverage capped at 3x. In this market, the money is in the continuation of the trend. Stick to the plan and don’t get carried away.
{future}(BTCUSDT)
$BTC
Shorting BTC at 77,600 makes perfect sense. This is a classic trend-following trade, aiming to catch the retest after a breakdown.
First, the technical picture. Bitcoin has just gone through options expiry and plunged straight through the key 80,000 level. At 77,600, we’re now seeing a weak bounce after the breakdown. Look above: the 78,800–80,000 range is not only packed with previous buyers stuck in losing positions, but is also firmly capped by the moving averages. For the bulls to reverse the trend, they’d need a massive surge in volume to break through—but the current market simply doesn’t have that kind of buying power. Shorting from here leaves very little room for risk and offers a highly favorable risk-reward ratio.
Next, the market’s funding and macro backdrop. The Fed is still holding firm on inflation, and the probability of a rate hike in December remains above 70%. Rising long-term Treasury yields are weighing on markets, and liquidity is extremely tight. Intel plunged 30% last night, while the Nasdaq fell 2.9%—tech stocks are undergoing a brutal deleveraging. To meet margin calls, institutions will sell highly liquid assets indiscriminately. The average cost basis of Bitcoin ETFs is around 81,500. The current price is far below that level, with resistance overhead from trapped buyers and no fresh capital coming in to bail them out.
Looking lower, 76,100–76,800 is the most crowded liquidation zone for longs. If price breaks through it on heavy volume, the cascade of liquidations could be brutal.
Here’s the fixed trade plan: enter short directly around 77,600, with a firm stop-loss just above 78,800. If price holds above 78,800 on strong volume, the bearish structure has been invalidated—take the loss and exit. Do not hold and hope. The first target is 76,500, with 76,000 next if that level breaks. At 76,500, close most of the position and lock in your gains. For the remainder, use a trailing stop: for every 200-point drop in price, move the stop down by 100 points.
Limit your position to 10% of total capital, with leverage capped at 3x. In this market, the money is in the continuation of the trend. Stick to the plan and don’t get carried away.

13
8
5k
·
--
I've been flying all over the place these past few days!
Today I can finally get a few hours of proper rest!
Have a great weekend, everyone!
I've been flying all over the place these past few days!
Today I can finally get a few hours of proper rest!
Have a great weekend, everyone!
Today I can finally get a few hours of proper rest!
Have a great weekend, everyone!
1
2
78
·
--
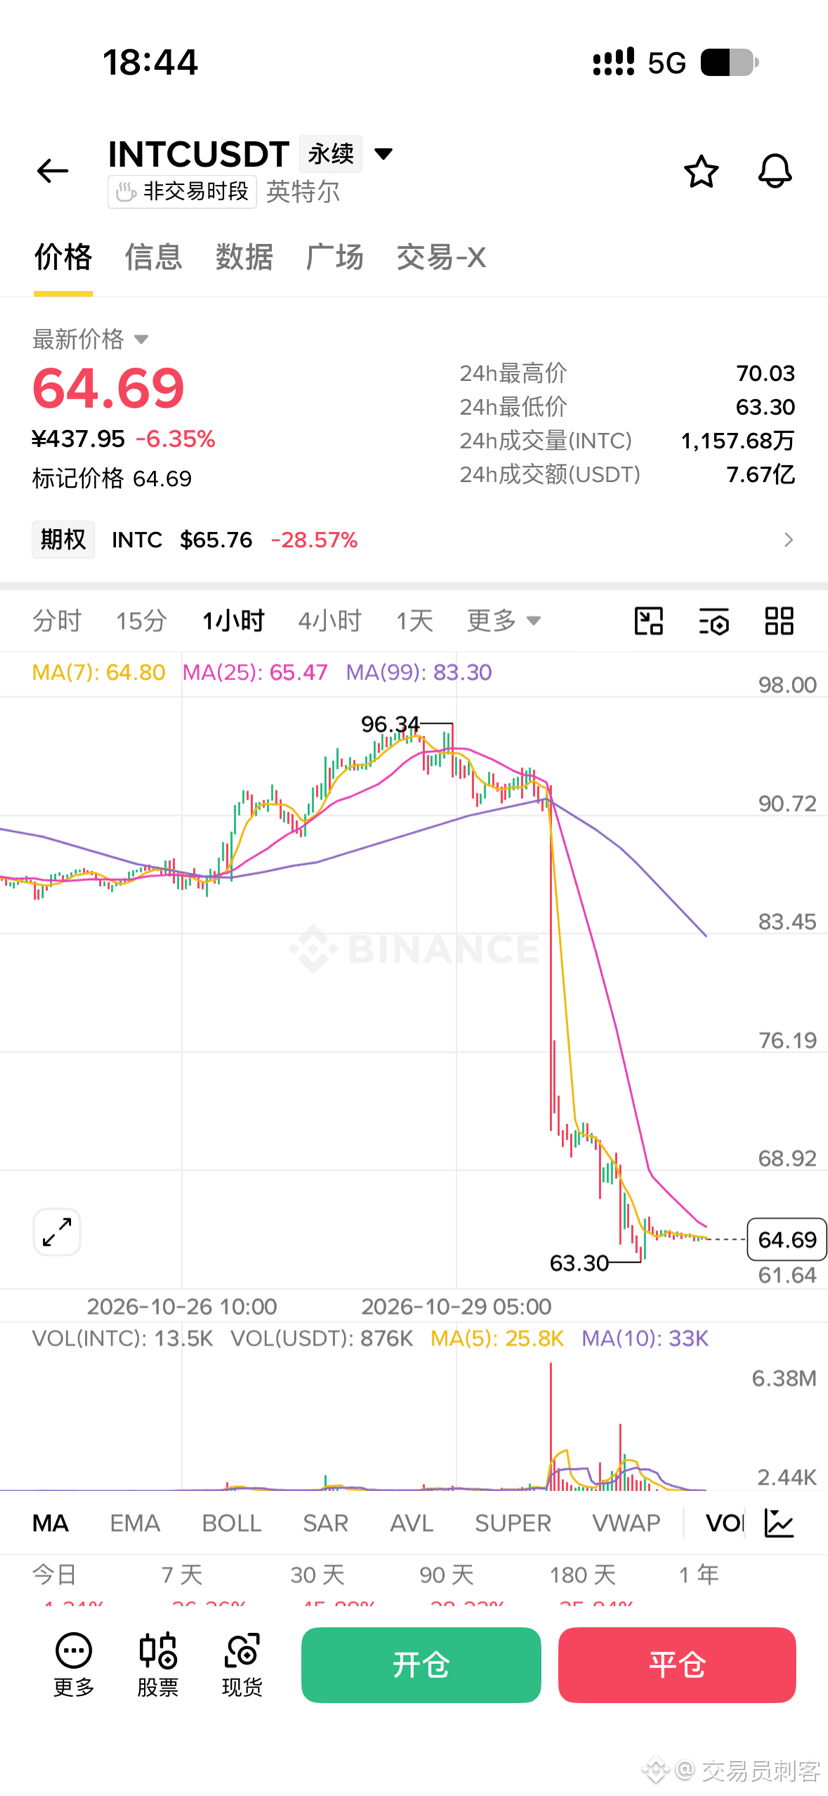
Once it gets near 50, the Assassin community publicly positions itself in Intel!
Why is below 50 the real value zone?
First, the margin of safety in the valuation. At roughly 2 times book value, a target price of $50 is still significantly below TSMC’s price-to-book ratio of more than 10 times. Intel currently has $54 billion in cash, a net cash position of about $3.87 billion, total assets exceeding $211 billion, and shareholders’ equity of about $125 billion. If the stock gets pummeled below 50 by panic over weakness in the PC business and Q4 guidance that falls short of expectations, its price-to-book ratio would drop to 1.5 times or even lower, approaching the extreme lows seen since 2013. At those levels, big money will step in to provide support.
Second, the turning point in the foundry business is being completely ignored by the market. Yields on the 18A process have risen from 65% to 85%, second only to TSMC’s 90% and well above Samsung’s 50% to 60%. More importantly, giants including AMD, Nvidia, Microsoft, Micron, OpenAI, Apple, and Meta have already signed design orders for 18A and 14A. Last year, Nvidia invested $5 billion and planned to use Intel’s 18A/14A processes to produce custom data center CPUs.
Third, its policy and strategic importance are irreplaceable. Intel is the only US-based foundry with advanced process capabilities. The US government wants domestic chip manufacturing to regain strategic importance; even AMD may consider partnering with Intel on some manufacturing for political reasons. This strategic position is not reflected at all in a price below 50.
Fourth, the AI business boom is temporarily being overshadowed. Q3 data center and AI revenue was $7.3 billion, up 78% year over year—the strongest growth in 15 years. The drag from the PC business is cyclical, but demand for AI computing power is structural. CEO Lip-Bu Tan stated clearly that CPU demand remains strong, and the top priority is to free up more supply to meet stronger-than-expected demand for the Xeon line.
But a price below 50 has already priced in all this panic—and then some. These three long-term drivers—the foundry inflection point, the AI boom, and policy support—will gradually be rediscovered by investors once panic selling subsides.#英特尔创1974年以来最差单日表现
Don’t chase shorts at 64.92, and don’t try to buy the dip at 64.92. Wait for it to fall below 50, wait for panic selling to run its course, and wait for volume to dry up. That’s when you can step in and pick up bloodied shares.$INTC
{future}(INTCUSDT)
Once it gets near 50, the Assassin community publicly positions itself in Intel!
Why is below 50 the real value zone?
First, the margin of safety in the valuation. At roughly 2 times book value, a target price of $50 is still significantly below TSMC’s price-to-book ratio of more than 10 times. Intel currently has $54 billion in cash, a net cash position of about $3.87 billion, total assets exceeding $211 billion, and shareholders’ equity of about $125 billion. If the stock gets pummeled below 50 by panic over weakness in the PC business and Q4 guidance that falls short of expectations, its price-to-book ratio would drop to 1.5 times or even lower, approaching the extreme lows seen since 2013. At those levels, big money will step in to provide support.
Second, the turning point in the foundry business is being completely ignored by the market. Yields on the 18A process have risen from 65% to 85%, second only to TSMC’s 90% and well above Samsung’s 50% to 60%. More importantly, giants including AMD, Nvidia, Microsoft, Micron, OpenAI, Apple, and Meta have already signed design orders for 18A and 14A. Last year, Nvidia invested $5 billion and planned to use Intel’s 18A/14A processes to produce custom data center CPUs.
Third, its policy and strategic importance are irreplaceable. Intel is the only US-based foundry with advanced process capabilities. The US government wants domestic chip manufacturing to regain strategic importance; even AMD may consider partnering with Intel on some manufacturing for political reasons. This strategic position is not reflected at all in a price below 50.
Fourth, the AI business boom is temporarily being overshadowed. Q3 data center and AI revenue was $7.3 billion, up 78% year over year—the strongest growth in 15 years. The drag from the PC business is cyclical, but demand for AI computing power is structural. CEO Lip-Bu Tan stated clearly that CPU demand remains strong, and the top priority is to free up more supply to meet stronger-than-expected demand for the Xeon line.
But a price below 50 has already priced in all this panic—and then some. These three long-term drivers—the foundry inflection point, the AI boom, and policy support—will gradually be rediscovered by investors once panic selling subsides.#英特尔创1974年以来最差单日表现
Don’t chase shorts at 64.92, and don’t try to buy the dip at 64.92. Wait for it to fall below 50, wait for panic selling to run its course, and wait for volume to dry up. That’s when you can step in and pick up bloodied shares.$INTC
1
3
328
·
--
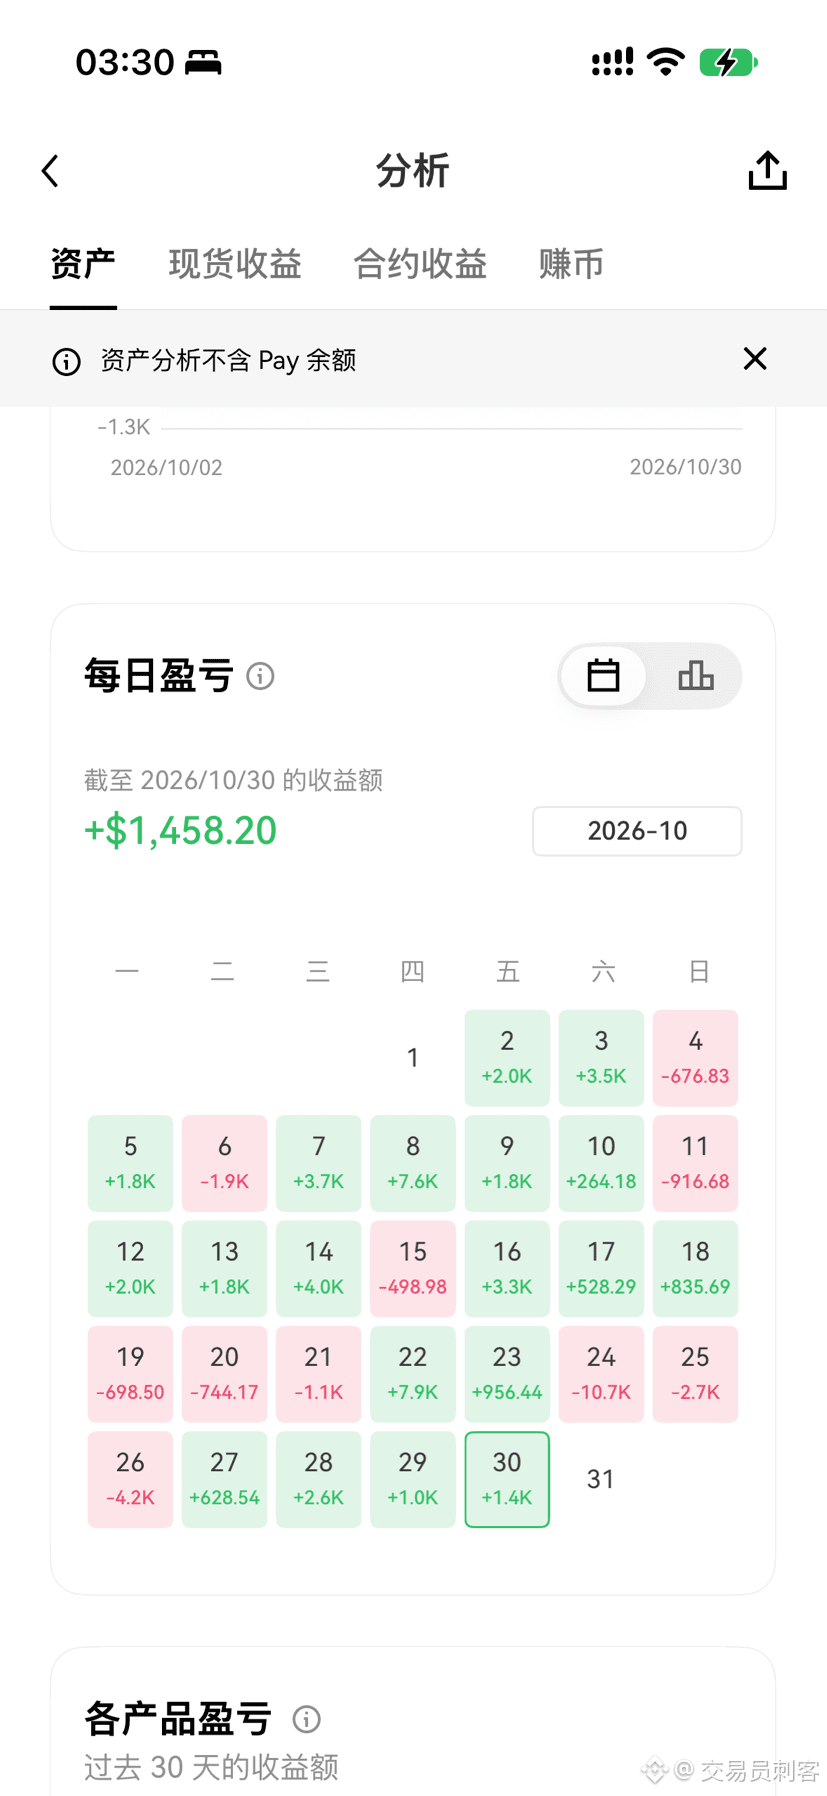
October recap:
October had 31 days in total: 21 profitable days and 10 losing days.
Total gains: 25000u.
The main source of losses was breaking discipline and trading unfamiliar altcoins.
I'll make adjustments going forward and continue strengthening my mindset.
Continue trading $BTC and US stocks.
{future}(BTCUSDT)
October recap:
October had 31 days in total: 21 profitable days and 10 losing days.
Total gains: 25000u.
The main source of losses was breaking discipline and trading unfamiliar altcoins.
I'll make adjustments going forward and continue strengthening my mindset.
Continue trading $BTC and US stocks.
October had 31 days in total: 21 profitable days and 10 losing days.
Total gains: 25000u.
The main source of losses was breaking discipline and trading unfamiliar altcoins.
I'll make adjustments going forward and continue strengthening my mindset.
Continue trading $BTC and US stocks.
1
2
435
·
--
Intel plunged nearly 30% in a single day, wiping out $140 billion in market value. This is an epic crash of the kind you only see once in decades. If you're going to trade Intel, you need to completely rethink the logic behind this market. Don't go on about long-term value—right now, Intel is nothing but an emotional meat grinder.
For your next trades in Intel, follow this playbook:
First, absolutely do not try to catch the falling knife on day one.
After a 28% plunge, the market is littered with leveraged positions getting liquidated and retail investors in despair. There's a good chance panic stop-loss orders will keep pouring in on day one. Trying to buy the dip now is like using your own capital to fill a pit. Keep your hands off and watch.
Second, keep a close eye out for a technical dead-cat bounce.
After a plunge of this magnitude, there will probably be an oversold rebound. But this is absolutely not a reversal—it's a chance for trapped investors to escape, and an opportunity for us to go short. If the share price rebounds to around the intraday moving average, or rallies 5% to 8%, and volume fails to pick up, leaving a long upper shadow, go short immediately. The fundamentals are badly hurt by weak Q4 guidance, and PC demand is sluggish through 2027. These are deep-rooted problems that can't be fixed in a few days.
Third, go short with the trend if it breaks below the previous low.
If the market keeps grinding lower, or even crashes through the low from the day of the plunge on heavy volume, don't hesitate—follow the trend and go short. It means the panic is still spreading, institutions are still dumping shares at any price, and the market is testing even greater depths.
Specific trade management rules:
For short positions, your stop-loss must be set strictly above the rebound high. If the price breaks above intraday resistance on heavy volume, it means buyers are stepping in aggressively to support it—admit you're wrong and get out immediately. Absolutely do not hold on. To the downside, the first target is the low from the plunge. If it breaks below that, close half the position and let the rest run. Keep your position size firmly below 10% of your total capital, and limit leverage to three times at most.
Remember, Intel is now facing a Davis Double Play: both earnings and valuation are collapsing. Don't try to guess the bottom based on conventional wisdom. On the macro front, the Fed is clinging stubbornly to high interest rates, and tech stocks are going through indiscriminate deleveraging. Trade with the downtrend, take your profits from this wave of panic, and get out—don't get attached to the trade.#英特尔创1974年以来最差单日表现 $INTC
{future}(INTCUSDT)
Intel plunged nearly 30% in a single day, wiping out $140 billion in market value. This is an epic crash of the kind you only see once in decades. If you're going to trade Intel, you need to completely rethink the logic behind this market. Don't go on about long-term value—right now, Intel is nothing but an emotional meat grinder.
For your next trades in Intel, follow this playbook:
First, absolutely do not try to catch the falling knife on day one.
After a 28% plunge, the market is littered with leveraged positions getting liquidated and retail investors in despair. There's a good chance panic stop-loss orders will keep pouring in on day one. Trying to buy the dip now is like using your own capital to fill a pit. Keep your hands off and watch.
Second, keep a close eye out for a technical dead-cat bounce.
After a plunge of this magnitude, there will probably be an oversold rebound. But this is absolutely not a reversal—it's a chance for trapped investors to escape, and an opportunity for us to go short. If the share price rebounds to around the intraday moving average, or rallies 5% to 8%, and volume fails to pick up, leaving a long upper shadow, go short immediately. The fundamentals are badly hurt by weak Q4 guidance, and PC demand is sluggish through 2027. These are deep-rooted problems that can't be fixed in a few days.
Third, go short with the trend if it breaks below the previous low.
If the market keeps grinding lower, or even crashes through the low from the day of the plunge on heavy volume, don't hesitate—follow the trend and go short. It means the panic is still spreading, institutions are still dumping shares at any price, and the market is testing even greater depths.
Specific trade management rules:
For short positions, your stop-loss must be set strictly above the rebound high. If the price breaks above intraday resistance on heavy volume, it means buyers are stepping in aggressively to support it—admit you're wrong and get out immediately. Absolutely do not hold on. To the downside, the first target is the low from the plunge. If it breaks below that, close half the position and let the rest run. Keep your position size firmly below 10% of your total capital, and limit leverage to three times at most.
Remember, Intel is now facing a Davis Double Play: both earnings and valuation are collapsing. Don't try to guess the bottom based on conventional wisdom. On the macro front, the Fed is clinging stubbornly to high interest rates, and tech stocks are going through indiscriminate deleveraging. Trade with the downtrend, take your profits from this wave of panic, and get out—don't get attached to the trade.#英特尔创1974年以来最差单日表现 $INTC
4
11
10.4k
·
--
Verified
I'm Brother Ci.
Last night, those Fed officials were out making statements again. St. Louis Fed President Musalem said further tightening would soon be needed to bring inflation down; Dallas Fed President Logan was even more forceful, saying they would need to raise rates at least twice more, by 25 basis points each time.
The officials are talking tough, but look at the most important detail in the chart: market pricing for a December rate hike has actually fallen from 85% to a range of 70% to 80%.
Now that’s interesting: the two sides are at odds. Why is the market unconvinced, even when officials are shouting from the rooftops? The comment at the bottom of the chart gets right to the point: Hawkish comments are doing little to lift rate-hike expectations; the market wants confirmation from the data.
This shows that investors are now immune to the Fed’s “expectations management.” Nobody’s a fool—you can talk as tough as you like, but the real economic data is what matters. Core PCE inflation was still at 3.1% year over year in September, so inflation is indeed sticky, but investors are waiting for the October nonfarm payrolls report next week, on November 6. If employment holds up, rate-hike expectations will surge again; if the jobs data comes in much weaker than expected, even the most hawkish officials’ comments will be meaningless.
Now look at the market: BTC is down a slight 0.40%, clearly waiting for the data to come out. Right now, the market is slowly grinding lower, with neither bulls nor bears having a clear direction. Macro interest rates are a firm ceiling overhead, while long liquidations form a line of defense below.
With divisions widening like this, my trading strategy is crystal clear: absolutely do not take a heavily leveraged position in either direction before the data is released.
First, if the market continues to drift lower on declining volume over the next few days, the 76,000–76,800 zone below is a long-liquidation minefield. If it breaks through on heavy volume, I’ll follow the move and go short to capture some liquidation profits; if it stabilizes on low volume, I won’t chase shorts.
Second, if officials’ comments trigger a rebound toward 79,000 or even around 80,000, I’ll go aggressively short as soon as I see heavy volume but no further gains, and profit from macro pressure.
Third, all positions must be small until the nonfarm payrolls report is out, and leverage should be kept to a minimum.
Divisions within the Fed are growing, and the outlook for macro policy is extremely uncertain. Betting on a one-way move right now is just handing your money to someone else. Keep your cash in hand and watch the key levels closely—don’t act until the opportunity is clear. Sit out this dead period and wait for the nonfarm payrolls report to set the direction before entering. Stay steady. #加息 $BTC
3
5
1.3k
·
--
I'm Brother Ci.
Global markets were hit by an indiscriminate bloodbath last night. The Nasdaq plunged 2.86%, the Philadelphia Semiconductor Index was hammered down 7.2%, and even gold, long seen as the ultimate safe haven, crashed 3.5%. Silver fell through the $50 mark, plunging more than 6%. Bitcoin couldn't hold up either, dropping straight below $77,000.
Looking at the market, a lot of people were baffled. What exactly happened? One comment nailed it: liquidity was being drained from the entire market, and everyone was deleveraging indiscriminately.
Look at the bond market in the chart: the 10-year Treasury yield fell back to 4.93%, while bond prices surged. What does that tell us? At this moment of extreme panic, big money is frantically cashing out and heading for the exits. To meet margin calls, even hard assets like gold are being sold off indiscriminately. In the end, all the available liquidity rushed into risk-free U.S. Treasuries.
In this deleveraging meat grinder, there is no such thing as an independent rally in “safe-haven assets.” When institutions face liquidation and redemption pressures, Bitcoin, gold, and tech stocks can all become ATMs. This is a classic sign of an impending liquidity crisis. Everyone is racing to get out; those who are too slow will pay the price of getting trampled.
Back to our market: BTC has fallen below $77,000 and is now on extremely dangerous ground. Below, 76,100 to 76,800 is the most concentrated liquidation zone for longs, and it's very close. If Bitcoin keeps getting hammered lower on heavy volume and breaks through this zone, triggering a cascade of long liquidations, that will be the real darkest hour. To the upside, there's a short liquidation zone around 79,200, but with sentiment this extremely fearful, a direct V-shaped reversal would be next to impossible.
My strategy is crystal clear: First, absolutely do not try to catch a falling knife. The screen is covered in bloodied positions. It may look cheap, but there could be eighteen more layers of hell below. Until there's a clear signal that the market has stabilized, hold on tight to your cash. Second, follow the trend. If BTC breaks below 76,800 on heavy volume, I'll follow the move with a small short position and capture profits from the cascade of long liquidations. Third, patiently wait for confirmation on the right side of the chart. Real value being wrongly sold off. Staying alive matters more than anything. #疑似朝鲜攻击占加密黑客损失近89% $BTC
{future}(BTCUSDT)
I'm Brother Ci.
Global markets were hit by an indiscriminate bloodbath last night. The Nasdaq plunged 2.86%, the Philadelphia Semiconductor Index was hammered down 7.2%, and even gold, long seen as the ultimate safe haven, crashed 3.5%. Silver fell through the $50 mark, plunging more than 6%. Bitcoin couldn't hold up either, dropping straight below $77,000.
Looking at the market, a lot of people were baffled. What exactly happened? One comment nailed it: liquidity was being drained from the entire market, and everyone was deleveraging indiscriminately.
Look at the bond market in the chart: the 10-year Treasury yield fell back to 4.93%, while bond prices surged. What does that tell us? At this moment of extreme panic, big money is frantically cashing out and heading for the exits. To meet margin calls, even hard assets like gold are being sold off indiscriminately. In the end, all the available liquidity rushed into risk-free U.S. Treasuries.
In this deleveraging meat grinder, there is no such thing as an independent rally in “safe-haven assets.” When institutions face liquidation and redemption pressures, Bitcoin, gold, and tech stocks can all become ATMs. This is a classic sign of an impending liquidity crisis. Everyone is racing to get out; those who are too slow will pay the price of getting trampled.
Back to our market: BTC has fallen below $77,000 and is now on extremely dangerous ground. Below, 76,100 to 76,800 is the most concentrated liquidation zone for longs, and it's very close. If Bitcoin keeps getting hammered lower on heavy volume and breaks through this zone, triggering a cascade of long liquidations, that will be the real darkest hour. To the upside, there's a short liquidation zone around 79,200, but with sentiment this extremely fearful, a direct V-shaped reversal would be next to impossible.
My strategy is crystal clear: First, absolutely do not try to catch a falling knife. The screen is covered in bloodied positions. It may look cheap, but there could be eighteen more layers of hell below. Until there's a clear signal that the market has stabilized, hold on tight to your cash. Second, follow the trend. If BTC breaks below 76,800 on heavy volume, I'll follow the move with a small short position and capture profits from the cascade of long liquidations. Third, patiently wait for confirmation on the right side of the chart. Real value being wrongly sold off. Staying alive matters more than anything. #疑似朝鲜攻击占加密黑客损失近89% $BTC
5
9
3.8k
·
--
Partly True
The PCE data is out: core inflation came in at 3.1%, headline at 3.6%—both exactly as expected. But take a close look at the market reaction: the odds of a December rate hike are stubbornly stuck above 80%. That’s the truly dangerous part.
Inflation is far from dead; it’s just stuck at an elevated level. The Fed’s 10-to-2 vote already showed its hand—the hawks inside are practically itching to hike rates immediately. With the odds of a December hike now above 80%, the biggest macro headwind hasn’t gone away. If anything, it’s ticking like a time bomb. The sword of Damocles hanging over risk assets could fall at any moment.
Take a look at those two community comments in the image—they’re very insightful.
The first says volatility and price reactions have faded since the hawkish statement came out. What does that mean? Everyone already knew the Fed would sound hawkish, and the market had already sold off in anticipation. We’re now in a brief “vacuum after the bad news is out.” The second says that keeping a December rate hike on the table puts pressure on risk assets. In other words, prices may not have much room to fall in the short term, but that doesn’t mean they’ll rise; there simply aren’t enough new buyers to push them higher.
Back to our charts: BTC is down just 0.03%, lying there like a dead fish. There’s no volume—bulls are out of ammo, and bears are waiting for the Fed’s December decision.
At this level, the full set of moving averages is pressing down from above, while a cluster of liquidation zones for bulls lies below. Tonight and over the weekend, we’ll probably see low-volume sideways trading that wears down your nerves.
Our trading strategy has to be absolutely ruthless:
First, do not chase shorts under any circumstances. The price has already fallen a lot, and if you short here, even a small rebound could wipe you out.
Second, keep a close eye on key liquidation zones below, such as the 76,000–76,800 area for BTC. If price crashes through this zone on high volume, that would signal panic selling and a cascade of liquidations. You can follow the move with a small short position and capture some of the resulting liquidation profits.
Third, if price rebounds above 79,000 but can’t hold, and a long upper wick appears, we’ll go short from higher up.
The key right now is to endure. With no new money coming in, it’s all just a battle over existing positions. Keep your hands off the buttons, cut your position size to a minimum, and hold onto your cash. Once this low-volume grind is over and expectations of a December rate hike have been fully priced in, we can get back in and pick up the bloodied chips. Stay alive. #pce $BTC
4
8
2.5k
·
--
Verified
I woke up to Bitcoin crashing straight through the $80,000 mark. It’s now at 77,184, down nearly 5%. This isn’t a simple pullback—it’s a brutal shakeout.
Why the crash? The clues are all in the macro data. U.S. Q3 GDP grew at an annualized rate of 3.4%, beating expectations, while September core PCE rose 3.1% year over year and remains stubbornly high. A red-hot economy plus sticky inflation—what does that mean? It means hopes for Fed rate cuts have been completely dashed, and the high-rate “meat cleaver” will keep swinging. That’s the fundamental reason stocks and crypto both got hammered last night.
Tech stocks fared even worse: the AI story’s cover has been pulled away. Google’s cloud revenue surged 103%, which looks impressive, but free cash flow came in more than $9 billion in the red, and the stock plunged 12.64%. Amazon beat revenue expectations, but its free cash flow saw a net outflow of $42.4 billion over the past year. This sends an extremely dangerous signal: the market is no longer buying AI stories built on reckless spending. Once the Nasdaq collapsed, Bitcoin’s liquidity got drained right along with it.
Looking at the market now, the 76,100–76,800 zone below BTC is the bulls’ last liquidation minefield. If it breaks, cascading liquidations could get very ugly. The bears’ danger zone is 79,200–79,900, which is a long way off. More importantly, at 16:00 today, nearly $11.18 billion in options on Deribit will expire, with BTC’s max pain at 78,000. Around expiration, the big players are highly likely to push the price sharply in both directions, sweeping up both longs and shorts.
My trading strategy is brutally simple:
First, absolutely do not blindly buy the dip here. Catching a falling knife can be fatal. If you’re holding a position, cut it immediately if price breaks below 76,800 on strong volume—no hesitation.
Second, if price can hold around 76,800 on lower volume, or if it briefly breaks below support after expiration and quickly rebounds to 78,000, I’ll try a long with a tiny position—just 10%—to catch the post-expiration bounce.
Third, if price rebounds toward 79,200 and shows weakness, I’ll go short.
Also, keep an eye on the Binance security rumors. Although the official line is that funds are safe, in this kind of panic, any little tremor can be blown out of proportion.
Hold onto your cash and ride out tonight’s major options-expiration shakeout. We can get back in afterward. Don’t get carried away. $BTC #btc #FirstDigital blacklists attacker address holding around 3.4 million FDUSD
6
15
2.7k
·
--
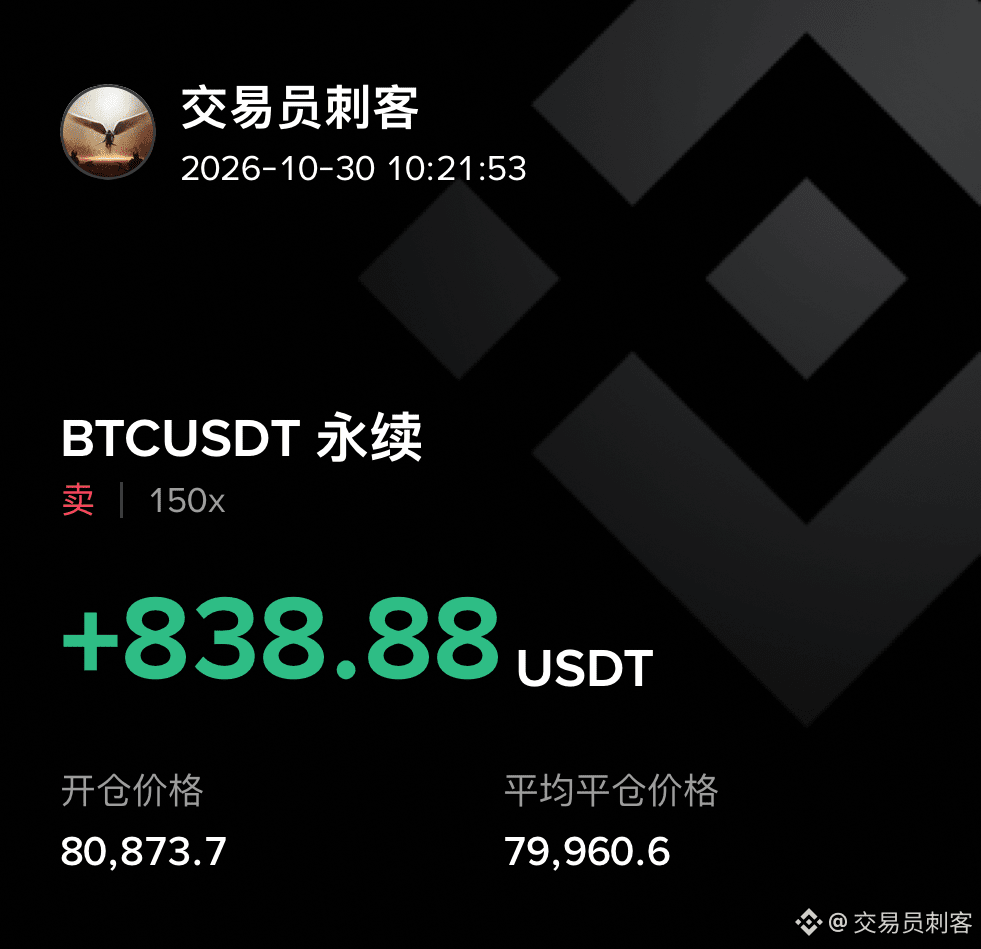
$BTC
Wake up
First, earn a little U and have some fun
$BTC
Wake up
First, earn a little U and have some fun
Wake up
First, earn a little U and have some fun
4
11
1.2k
·
--
Bullish
$BTC The fourth-wave decline arrived as expected!
Wait for the decline to bottom, then look for a sharp wave-five rally!
Fourth-wave decline support: 74000-75000
Resistance: 79000-80000
#BTC $
$BTC The fourth-wave decline arrived as expected!
Wait for the decline to bottom, then look for a sharp wave-five rally!
Fourth-wave decline support: 74000-75000
Resistance: 79000-80000
#BTC $
Wait for the decline to bottom, then look for a sharp wave-five rally!
Fourth-wave decline support: 74000-75000
Resistance: 79000-80000
#BTC $
20
12
6.3k
·
--
Verified
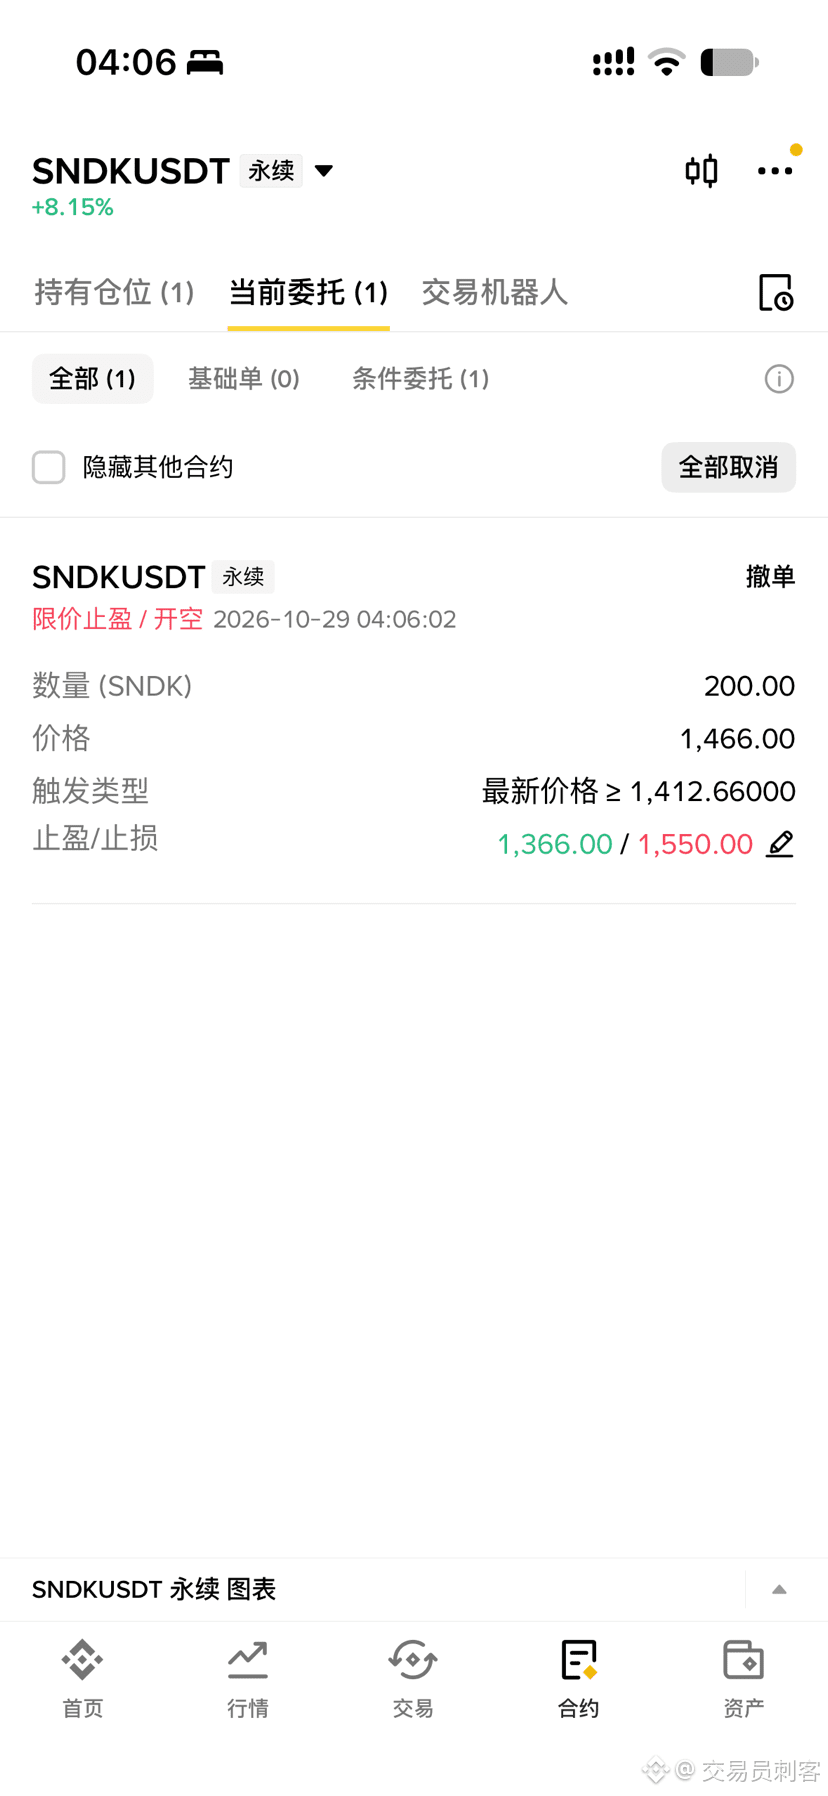
SanDisk is about to announce earnings! A look at possible price moves!
Possible price moves
Scenario 1: Gross margin guidance holds above 83%, and LTA volumes continue to grow. The stock will probably spike after hours, but the key is how it performs the next day. If it opens higher and holds those gains, that suggests the market buys the long-term story, with the previous highs as a target. If it opens higher but then falls, that’s a classic “sell the news” move, and late buyers will be left holding the bag.
Scenario 2: Gross margin guidance comes in below 80%, or the midpoint of next quarter’s revenue guidance is below $10.5 billion. There’s a very high chance the stock will sell off sharply after hours. The market has already priced in concerns that the price-hike cycle is peaking, so if guidance confirms those concerns, selling pressure could be intense.
Scenario 3: Earnings and guidance are both about in line. The stock will probably trade in a wide range, with bulls and bears battling it out after hours. This is the most frustrating scenario, since both long and short traders can easily get stopped out by sharp price swings.
My trading plan
I won’t bet on direction before earnings. The options market has already priced in a nearly 10% move in either direction after the report. With those odds, making a big one-way bet means a win would be luck, while a loss could cut your principal in half.
If the stock spikes after earnings but stalls on heavy volume, I may consider taking a small short position to play a “sell the news” pullback. If it sells off right away, I’ll wait for panic selling to run its course and for the stock to stabilize on lower volume at a key support level before considering a long position. SanDisk’s long-term story (AI storage demand and LTA commitments) is still intact, but short-term valuation compression could be severe.
Keep the position size below 10% and set a hard stop-loss. With an earnings report like this, where anything could happen, staying in the game matters more than anything.#闪迪 $SNDK
5
9
6.2k
·
--
$ETH ETH is at 2335 now, and I plan to place a short order at 2368. This is a very seasoned approach: a classic strategy of waiting for a rebound to confirm resistance before taking a shot.
First, the technical picture. The 2368 level is definitely not arbitrary. It coincides with a dense trapped-buyer zone from the previous consolidation during the decline, and it also sits right at the lower edge of the short-term moving-average resistance band. ETH is moving sideways with a weak bias at 2335, and if it rallies to 2368, it will inevitably face heavy selling pressure. If you short directly at 2335 now, you could easily get shaken out by the market makers’ whipsaw moves. But if you wait for a rebound to 2368, bullish momentum should be exhausted by then. Entering a short at that point gives you a tight risk limit and an excellent risk-to-reward ratio.
Now, the fundamentals. The Fed didn’t raise rates last night, but that was a thoroughly “hawkish pause”: two officials remained adamant about raising rates, and the threat of a December hike is still hanging over the market. Rising long-term Treasury yields are weighing on markets, and liquidity is extremely tight. More importantly, spot Ethereum ETFs have been seeing persistent outflows lately, with funds flocking to BTC instead. As a high-beta asset, ETH is likely to fall faster than anything else if the broader market gets even the slightest shock.
The trade setup is simple. Place a short order directly at 2368, with a firm stop-loss just above 2425. If the price breaks above 2425 on strong volume and holds there, that means the bearish structure has been invalidated—accept the loss and exit; absolutely do not hold on. The first target is 2280, then 2220 if that level breaks. At 2280, close more than half the position and pocket some real profits. Use a trailing stop for the remainder: for every 30-point drop in price, move the stop down by 15 points.
Keep the position size between 10% and 15%, and don’t use more than 3x leverage. If it doesn’t reach 2368, sit tight and watch with your cash on hand. If it gets there, follow the plan—don’t chase the short. #eth
{future}(ETHUSDT)
$ETH ETH is at 2335 now, and I plan to place a short order at 2368. This is a very seasoned approach: a classic strategy of waiting for a rebound to confirm resistance before taking a shot.
First, the technical picture. The 2368 level is definitely not arbitrary. It coincides with a dense trapped-buyer zone from the previous consolidation during the decline, and it also sits right at the lower edge of the short-term moving-average resistance band. ETH is moving sideways with a weak bias at 2335, and if it rallies to 2368, it will inevitably face heavy selling pressure. If you short directly at 2335 now, you could easily get shaken out by the market makers’ whipsaw moves. But if you wait for a rebound to 2368, bullish momentum should be exhausted by then. Entering a short at that point gives you a tight risk limit and an excellent risk-to-reward ratio.
Now, the fundamentals. The Fed didn’t raise rates last night, but that was a thoroughly “hawkish pause”: two officials remained adamant about raising rates, and the threat of a December hike is still hanging over the market. Rising long-term Treasury yields are weighing on markets, and liquidity is extremely tight. More importantly, spot Ethereum ETFs have been seeing persistent outflows lately, with funds flocking to BTC instead. As a high-beta asset, ETH is likely to fall faster than anything else if the broader market gets even the slightest shock.
The trade setup is simple. Place a short order directly at 2368, with a firm stop-loss just above 2425. If the price breaks above 2425 on strong volume and holds there, that means the bearish structure has been invalidated—accept the loss and exit; absolutely do not hold on. The first target is 2280, then 2220 if that level breaks. At 2280, close more than half the position and pocket some real profits. Use a trailing stop for the remainder: for every 30-point drop in price, move the stop down by 15 points.
Keep the position size between 10% and 15%, and don’t use more than 3x leverage. If it doesn’t reach 2368, sit tight and watch with your cash on hand. If it gets there, follow the plan—don’t chase the short. #eth
5
12
2.5k
·
--
#FOMC会议
Last night’s FOMC meeting ended with the Fed holding its benchmark interest rate steady at 3.75% to 4.00%. But don’t see the words “no rate hike” and assume it’s time to go all-in on longs. This wasn’t a liquidity boost—in fact, it was a thoroughly “hawkish pause.” For BTC, the uncertainty has been lifted in the short term, but the medium-term pressure is immense.
The impact of this meeting on BTC needs to be examined from three angles.
First, expectations have been priced in, making a short-term “buy the rumor, sell the news” move highly likely. The market had long treated no rate hike in October as a foregone conclusion, and prices had already moved in anticipation. Once the decision was announced, there was no upside surprise to provide a fresh catalyst, and the market lost momentum. With capital merely changing hands, bulls could easily take profits, sending prices higher before pulling back.
Second, the threat of a December rate hike is still very much on the table. The 10–2 vote saw Cook and Hammack dissent, insisting on a 25-basis-point hike. The policy statement was also crystal clear: the committee will continue to assess conditions to ensure inflation returns to its 2% target. This means the Fed remains deeply concerned about inflation, and the burden of high interest rates is still here to stay. As long as long-term Treasury yields don’t come down, the valuation ceiling for non-yielding assets like BTC will remain firmly in place, making big investors reluctant to enter the market without restraint.
Third, the drain on liquidity is continuing. In a high-interest-rate environment, investors would rather earn steady returns in the bond market. Look at the market now: BTC is barely holding around 80,200, while total market capitalization keeps shrinking. ETF inflows have appeared from time to time, but they haven’t been sustained. The crypto market as a whole lacks fresh liquidity and is relying on existing capital being passed around. What could possibly support a one-way surge in these conditions?
Here’s a clear trading plan based on current market conditions. The 80,800–81,500 range above is both a reference point for ETF cost bases and a major resistance zone where previous buyers are trapped, making a rally into this range an ideal opportunity to open short positions. The 78,700–79,300 range below is a liquidation danger zone for bulls. If BTC breaks below the 80,000 mark on strong volume, a cascade of liquidations will be unavoidable.
2
11
2.9k
·
--
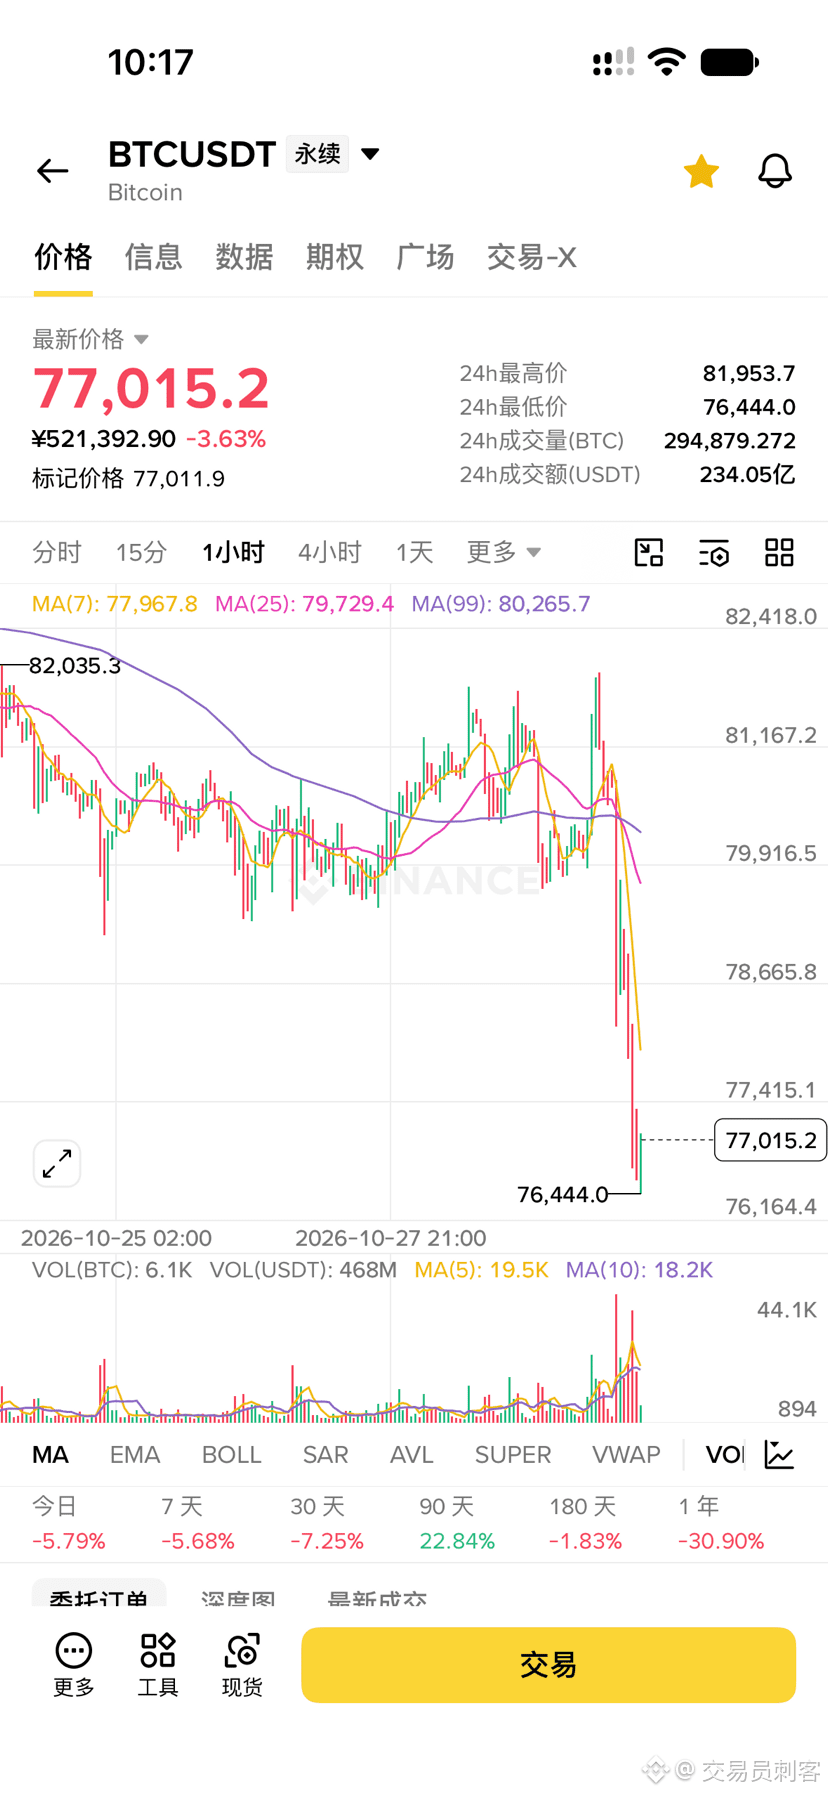
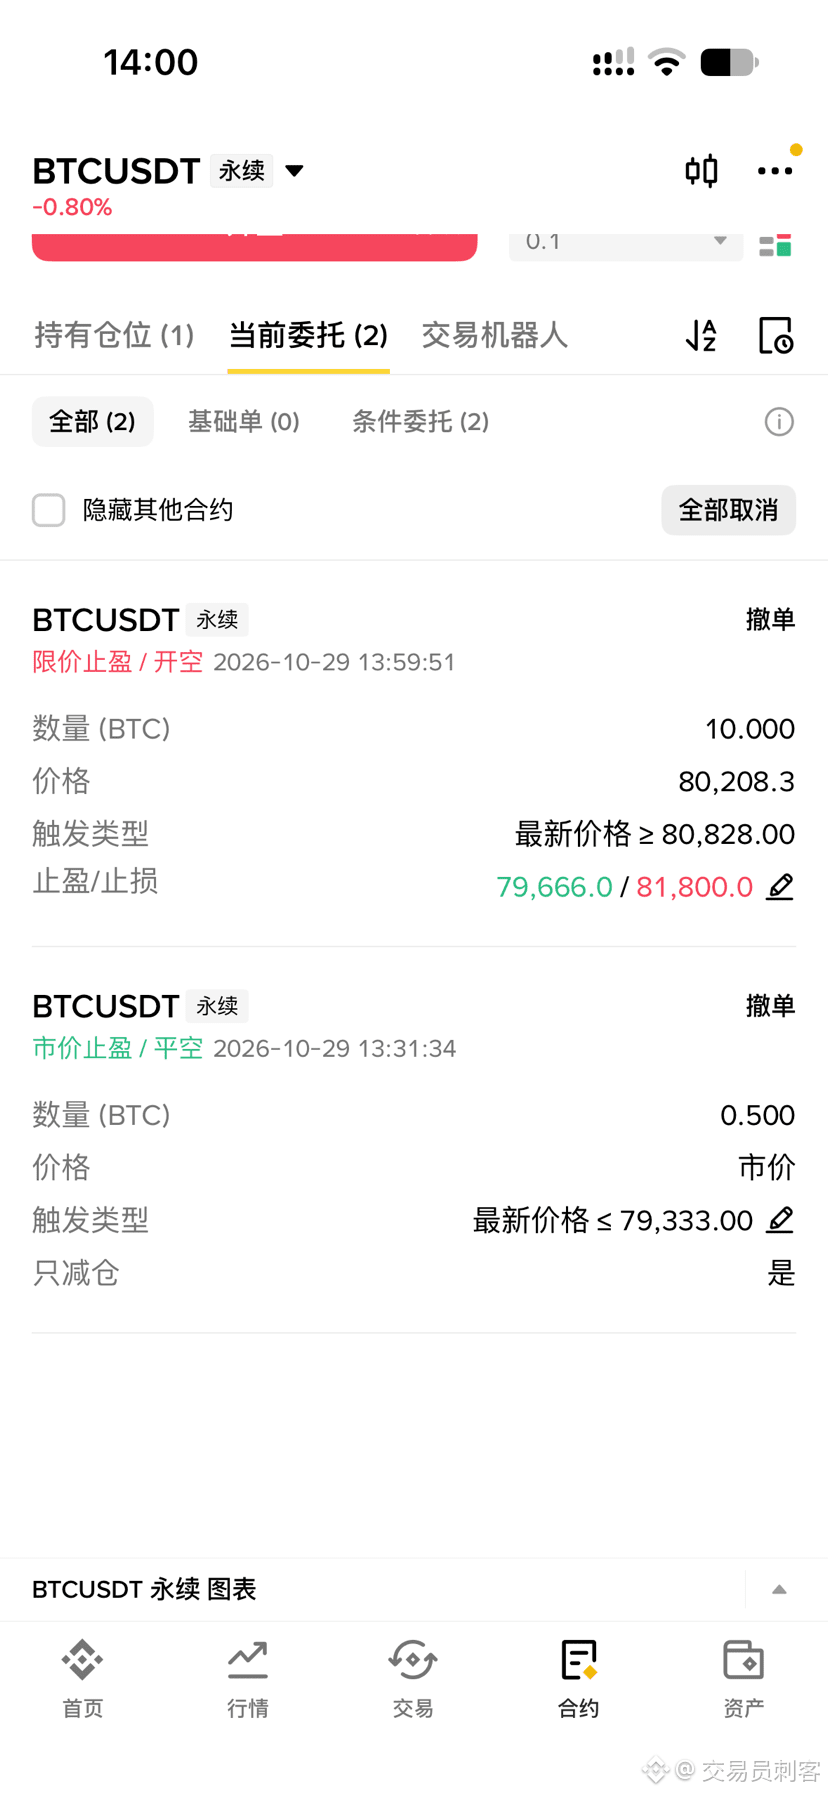
$BTC The rebound is almost over! Publicly opening a BTC short! Let's capture the entire fourth leg down!
First, let's look at the technicals. The 80,828 level sits just above the key 80,000 mark. It's a retest of the former consolidation platform that broke down, and it's also where the short-term moving averages are firmly capping price. BTC is barely holding around 80,200, but overhead selling pressure is extremely heavy. From 80,828, it's less than 400 points to the 81,200–81,700 zone, a major short-liquidation hotspot. Without an enormous amount of capital, the bulls simply won't be able to push through. If the rebound reaches this level on fading volume, or forms a long upper wick, that would be a classic bull trap—and the risk-reward would be very attractive.
Now let's look at the news. The Fed didn't raise rates last night, but the 10–2 vote—with two members insisting on a hike—was undeniably a hawkish pause. The threat of a rate hike in December is still hanging over us. U.S. GDP and PCE data are due tonight as well. If inflation remains stubborn, the high-rate environment will keep applying pressure. The macro backdrop simply doesn't support a sustained bull run in risk assets.
There's no need to say much about flows. Glassnode data shows the ETF aggregate cost basis is at 81,500. The price hasn't even reclaimed that level, leaving overhead packed with underwater holders. Over in tech stocks, Google's earnings have disappointed, and concerns about the cash burn from AI are still spreading. Capital is flowing out, and the market is just existing funds fighting among themselves. Without fresh inflows, what could possibly break through the resistance above?
Here's the trade plan, set in stone. Place a short at 80,828, with a stop-loss above 81,600. If price breaks above 81,600 on strong volume and holds, the bearish thesis is invalidated—take the loss and exit. Do not hold and hope. The first target is 79,500; if that breaks, look toward the 78,700–79,300 long-liquidation zone below. At 79,500, close most of the position and lock in profits, then trail the stop on the remainder downward.
Limit your position to 10–15% of total capital, with leverage capped at 3x. Don't get carried away before tonight's macro data comes out. Wait for price to reach the level, follow the plan, and take the profit from the pullback. Keep your cash in hand and wait until the dust settles. #btc
6
8
4k
·
--
Verified
#微软财报能否兑现ai红利
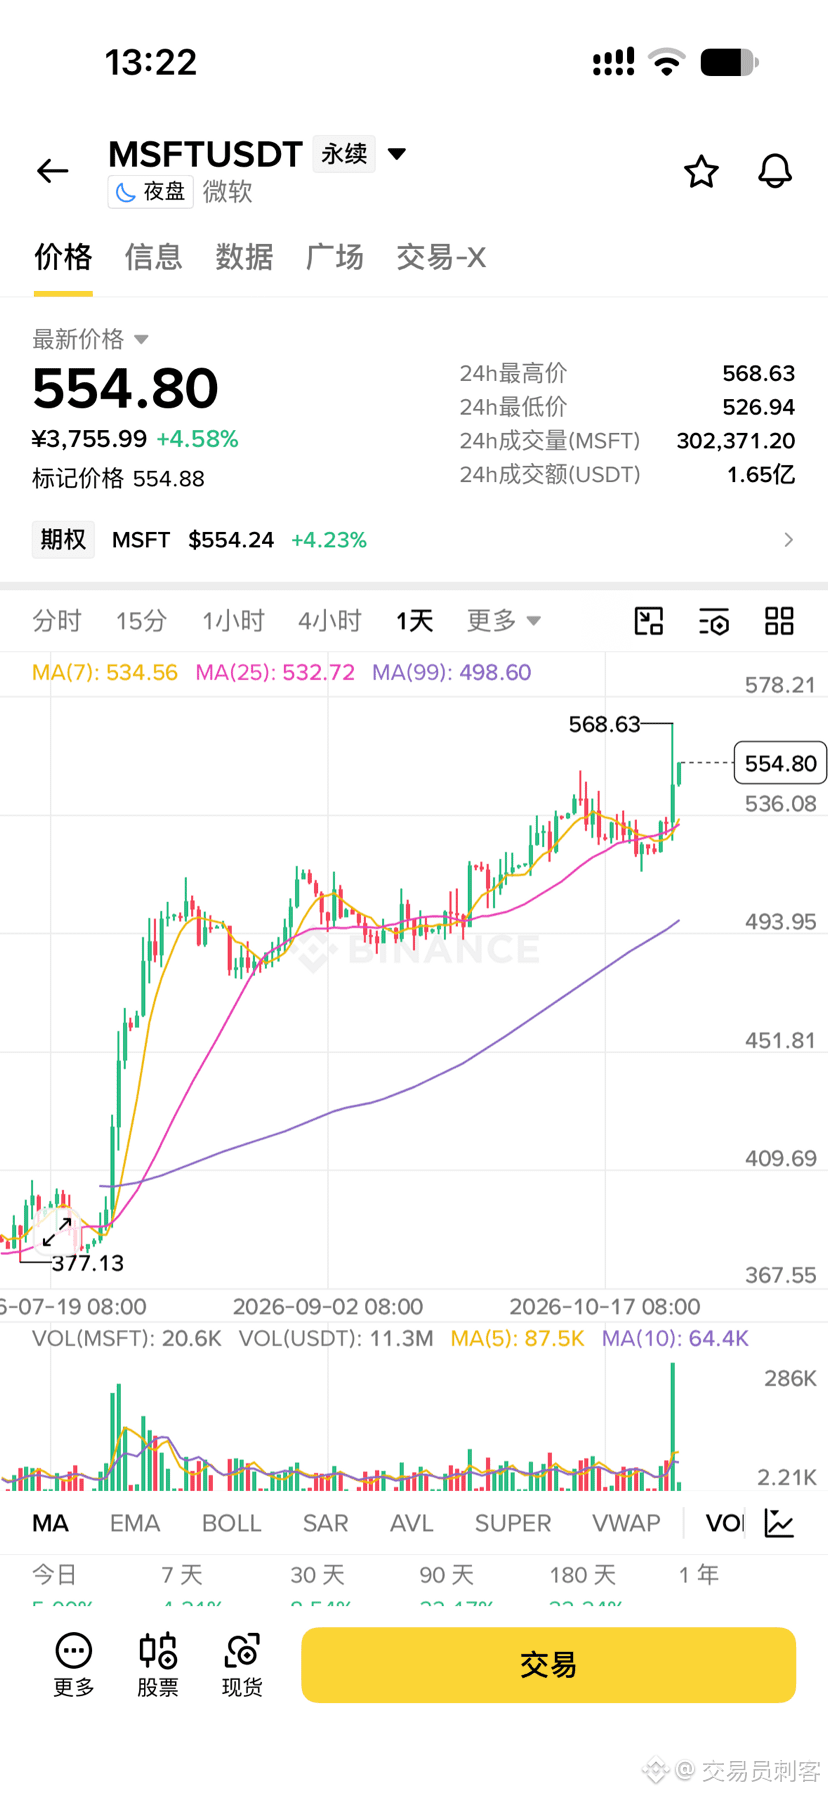
At 554, Microsoft is a classic case of “strong fundamentals, awkward positioning.” Its earnings were undeniably stellar, but the stock has already rallied in the short term. Chasing it higher now risks a pullback, while shorting it risks going against the trend. Here’s a breakdown of the bull and bear strategies for this setup.
Bullish case: Strong earnings, but don’t rush to chase
The standout feature of Microsoft’s latest earnings is its cash flow. Azure grew 48%, and the company generated a whopping $18.6 billion in free cash flow in a single quarter—that’s real cash-generating power. The stock surged at one point after hours, showing that investors are buying into Microsoft’s “spend and earn at the same time” model. As long as Microsoft continues to deliver on the commercialization of AI, it remains the strongest defensive play among the Magnificent Seven tech stocks. However, 554 is no longer where the stock was before earnings were announced, and some of the good news has already been priced in. On top of that, the Fed held rates steady, but two officials called for a hike, while rising long-term Treasury yields are weighing on stocks. Chasing the stock here offers an unattractive risk-reward.
Bearish case: Macro headwinds put short-term pressure on the stock
The bear case is not about fundamentals; it’s about macroeconomic conditions and flows. The Fed remains concerned about inflation, and expectations for a rate hike in December haven’t disappeared. That is capping valuations for tech stocks. As a mega-cap stock, Microsoft won’t be immune if the Nasdaq pulls back on disappointing after-hours earnings from companies like Amazon and Coinbase. Also, the 555–560 range above 554 is a dense area of overhead supply from previous buyers who are underwater. Without sustained high volume, it will be difficult to break through in one move.
Specific strategies
Strategy 1: Buy the pullback (primary strategy)
Don’t chase the price higher; wait for a pullback. If the stock retraces to the 545–548 range and stabilizes on lower volume, consider opening a small long position. Set a stop-loss below 540, with an initial target of 560 and a potential target of 570 if it breaks through. Strong earnings provide a fundamental backstop, making a pullback a buying opportunity.
Strategy 2: Try a small short at resistance (secondary strategy)
If the stock bounces back to 558–560 and shows heavy volume without further gains or forms a long upper wick, consider a small short position. Set a stop-loss above 565, with an initial target of 548 and a second target of 540. This is a short-term trade against trapped buyers and macro pressure, not a bet against the fundamentals.
Strategy 3: Follow a breakout (right-side entry)
If the stock breaks above 560 on strong volume and holds there, it would suggest the market has fully absorbed the earnings news and is positioning for further upside. Consider entering a small long position, with a stop-loss at 555 and a target of 575.
2
13
13.7k
·
--
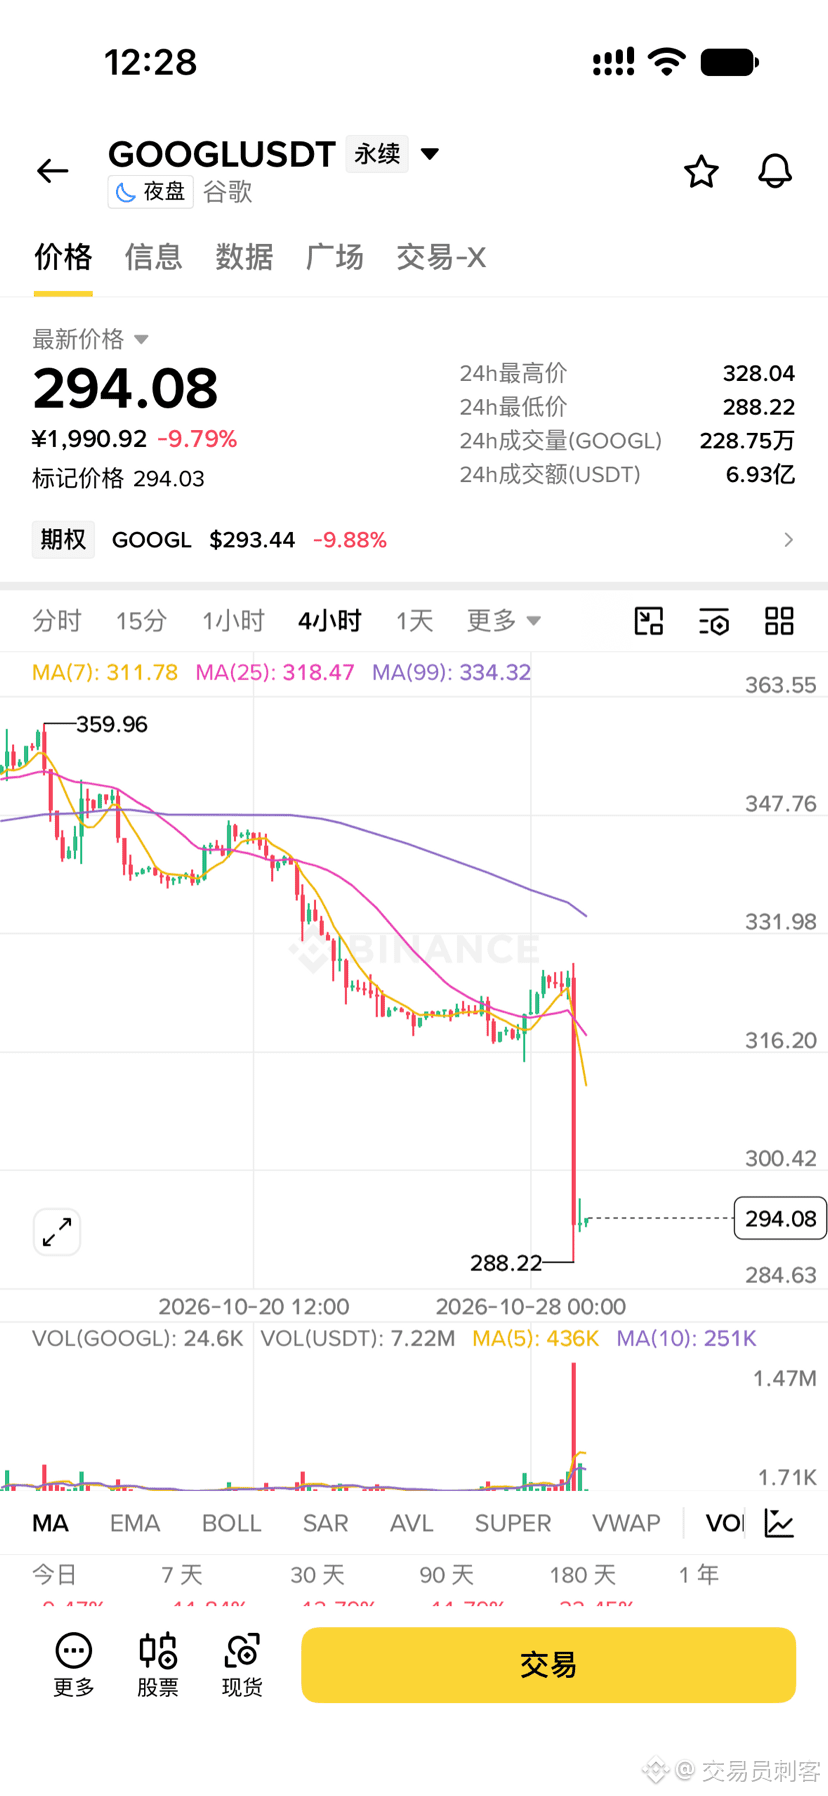
#谷歌财报能否守住基本盘
Google is now at 294, right on the key short-term dividing line between bulls and bears. After its earnings shock, the stock broke below the heavy-volume base at 300, turning 294 from support into the first layer of resistance.
Bearish case: Deteriorating cash flow is a serious flaw
The core problem in the earnings report wasn’t the cloud business (revenue rose 103%), but out-of-control spending. Quarterly capital expenditures came in at $51.3 billion, far above expectations, while free cash flow plunged to negative $9.065 billion, marking a second consecutive quarter in the red and a $33.5 billion year-over-year decline. More damaging still, buybacks are set to drop to zero in 2026, removing the biggest buyer that had been supporting the stock. Management itself acknowledged that AI search ads are temporarily monetizing at a lower rate than traditional search. Heavy investment isn’t yet generating commensurate returns, and concerns are spreading that the payback period for AI investment is getting longer.
Technically, the breakdown below 300 is clear, with the 7-day, 20-day, 50-day, and 200-day moving averages all hanging overhead as resistance. The next level with genuinely strong support is the year-to-date low of $270. That’s where shares accumulated from active fund buying early in the year, and it also marks an extreme valuation discount at 17.5 to 18 times forward earnings.
Bullish case: Deeply oversold, with room for a rebound
Based on the after-hours price, the 14-day RSI has already plunged to 24.58, deep in oversold territory, so a short-term technical bounce could come at any time. The cloud business fundamentals remain intact, and AI demand is still strong. But a trend reversal won’t be credible unless the stock gets back above 301.20. Until then, any move up should be treated only as an oversold bounce.
Specific strategies
Short: Enter short if a rebound into the 294–298 range meets resistance. Set a stop above 302. First target: 281 to 271.77; if that breaks, look for 270. The risk-reward ratio works out to roughly 2:1 or better, making this the path of least resistance right now.
Long: Play only a short oversold bounce. Probe near 295 with a small position, stop at 290, target 305 to retest the lower Bollinger Band, and reduce the position at 313. Keep the position below 10% of your portfolio, and don’t mistake the first bullish candle for a reversal.
Overall, the bearish trend isn’t over, and 270 is the next level to watch closely. Long positions are only for catching a bounce; shorts are aligned with the prevailing trend. GDP and PCE data are due tonight, so avoid taking a large one-way bet before the data is released.
4
3
19
14.2k
·
--
Verified

Article
Last night’s market action laid bare Wall Street’s true colors. The Fed held rates steady, with a 10–2 vote; Cook and Hammack dissented, calling for a rate hike.Last night’s market action laid bare Wall Street’s true colors. The Fed held rates steady, with a 10–2 vote; Cook and Hammack dissented, calling for a rate hike. What does that tell us? That fears of inflation inside the Fed haven’t gone away at all, and the December rate-hike guillotine is still hanging over our heads. A pause in rate hikes absolutely does not mean the end of tightening.
But what really sent a chill down my spine was the tech giants’ earnings. Microsoft and Google, on the same AI theme, were worlds apart.
Microsoft Azure grew 48%, and for the first time the company disclosed quarterly revenue of $33.1 billion. It managed to generate a whopping $18.6 billion in free cash flow, and its shares briefly surged after hours. Google Cloud revenue grew 103%, but its free cash flow was negative $9.065 billion, marking its second consecutive quarter in the red. Its shares plunged more than 7% after hours. Investors’ standards are now brutally unforgiving: you can burn cash, but you have to prove you can keep generating it while you do. Microsoft proved it could. Google didn’t.
Last night’s market action laid bare Wall Street’s true colors. The Fed held rates steady, with a 10–2 vote; Cook and Hammack dissented, calling for a rate hike.
Last night’s market action laid bare Wall Street’s true colors. The Fed held rates steady, with a 10–2 vote; Cook and Hammack dissented, calling for a rate hike. What does that tell us? That fears of inflation inside the Fed haven’t gone away at all, and the December rate-hike guillotine is still hanging over our heads. A pause in rate hikes absolutely does not mean the end of tightening.
But what really sent a chill down my spine was the tech giants’ earnings. Microsoft and Google, on the same AI theme, were worlds apart.
Microsoft Azure grew 48%, and for the first time the company disclosed quarterly revenue of $33.1 billion. It managed to generate a whopping $18.6 billion in free cash flow, and its shares briefly surged after hours. Google Cloud revenue grew 103%, but its free cash flow was negative $9.065 billion, marking its second consecutive quarter in the red. Its shares plunged more than 7% after hours. Investors’ standards are now brutally unforgiving: you can burn cash, but you have to prove you can keep generating it while you do. Microsoft proved it could. Google didn’t.

大吉大利!
From 交易员刺客
4
11
841
Log in to explore more content
Join global crypto users on Binance Square
⚡️ Get latest and useful information about crypto.
💬 Trusted by the world’s largest crypto exchange.
👍 Discover real insights from verified creators.
Email / Phone number
Trending Topics
BinanceSAFUFundTransferCompleted7499BTC
24,897 views
627 Discussing
Binance Says SAFU Fund Transfer Completed, Covering 7,499 BTC
Binance News
·32 Likes
·15.1k views
BinanceRecovery90% of stolen assets
105,476 views
148 Discussing
YiHe:ProofOfReserves:10TokensAt100%Backing
113,161 views
645 Discussing