

Trader Joe
5 Posts

Trader Joe
Report
Block User
5 Following
0 Followers
4 Liked
Posts
·
--
Bullish
See translation
Solana ($SOL ) Brief Update & 4H Technical Analysis
(as of October 2, 2026)
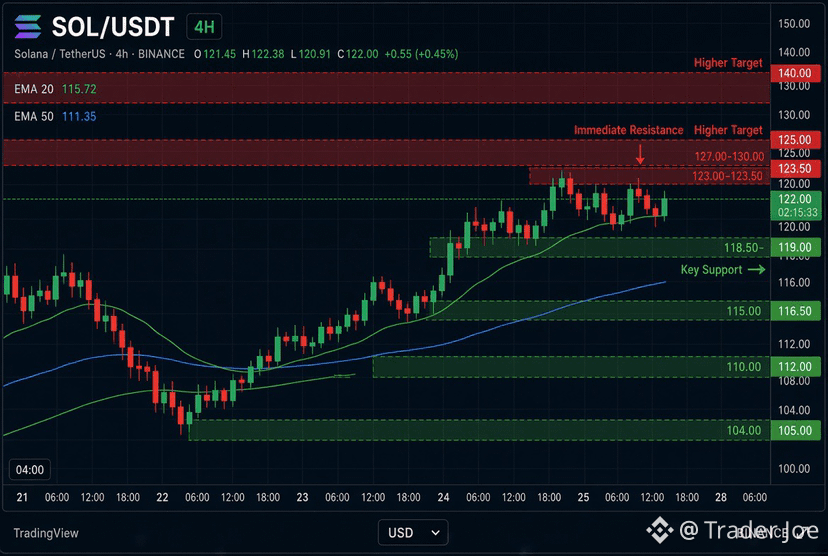
Current Price: Approximately $121.80 – $122.50
SOL is up roughly +3–4% in the last 24 hours, showing relative strength alongside Bitcoin’s recovery. It continues to trade in a broader uptrend after recovering from lower levels earlier in the year. 
Quick Market Context
Solana remains in a constructive recovery structure on higher timeframes, trading above key moving averages with a strong bullish bias on the daily chart. On the 4-hour timeframe, price has been consolidating near recent highs after a solid upward move, with momentum remaining positive but not yet extremely overextended. RSI sits in a healthy bullish zone (around mid-60s on daily).
Overall bias on 4H: Bullish while price holds above key support. A clean break of immediate resistance would open further upside, while a deeper pullback would likely find buyers in the lower support zones.
Key 4H Support & Resistance Levels
Resistance:
• Immediate: $123.00 – $123.50 (nearest resistance / recent swing area)
• Next: $127.00 – $130.00
• Higher targets: $140.00 – $150.00 (measured moves / stronger supply)
Support:
• Immediate / critical: $118.50 – $119.00 (key near-term demand)
• Stronger: $115.00 – $116.50
• Deeper: $110.00 – $112.00 (important structural support)
• Major: $104.00 – $105.00
Invalidation for the near-term bullish case: Sustained 4H closes back below ~$118 would weaken the short-term structure and increase the chance of a deeper retracement toward $110–$112.
Disclaimer: This is technical analysis based on publicly available data and is not financial advice. Cryptocurrency markets are highly volatile — always do your own research and manage risk carefully.#sol #solana
{spot}(SOLUSDT)
Solana ($SOL ) Brief Update & 4H Technical Analysis
(as of October 2, 2026)
Current Price: Approximately $121.80 – $122.50
SOL is up roughly +3–4% in the last 24 hours, showing relative strength alongside Bitcoin’s recovery. It continues to trade in a broader uptrend after recovering from lower levels earlier in the year. 
Quick Market Context
Solana remains in a constructive recovery structure on higher timeframes, trading above key moving averages with a strong bullish bias on the daily chart. On the 4-hour timeframe, price has been consolidating near recent highs after a solid upward move, with momentum remaining positive but not yet extremely overextended. RSI sits in a healthy bullish zone (around mid-60s on daily).
Overall bias on 4H: Bullish while price holds above key support. A clean break of immediate resistance would open further upside, while a deeper pullback would likely find buyers in the lower support zones.
Key 4H Support & Resistance Levels
Resistance:
• Immediate: $123.00 – $123.50 (nearest resistance / recent swing area)
• Next: $127.00 – $130.00
• Higher targets: $140.00 – $150.00 (measured moves / stronger supply)
Support:
• Immediate / critical: $118.50 – $119.00 (key near-term demand)
• Stronger: $115.00 – $116.50
• Deeper: $110.00 – $112.00 (important structural support)
• Major: $104.00 – $105.00
Invalidation for the near-term bullish case: Sustained 4H closes back below ~$118 would weaken the short-term structure and increase the chance of a deeper retracement toward $110–$112.
Disclaimer: This is technical analysis based on publicly available data and is not financial advice. Cryptocurrency markets are highly volatile — always do your own research and manage risk carefully.#sol #solana
(as of October 2, 2026)
Current Price: Approximately $121.80 – $122.50
SOL is up roughly +3–4% in the last 24 hours, showing relative strength alongside Bitcoin’s recovery. It continues to trade in a broader uptrend after recovering from lower levels earlier in the year. 
Quick Market Context
Solana remains in a constructive recovery structure on higher timeframes, trading above key moving averages with a strong bullish bias on the daily chart. On the 4-hour timeframe, price has been consolidating near recent highs after a solid upward move, with momentum remaining positive but not yet extremely overextended. RSI sits in a healthy bullish zone (around mid-60s on daily).
Overall bias on 4H: Bullish while price holds above key support. A clean break of immediate resistance would open further upside, while a deeper pullback would likely find buyers in the lower support zones.
Key 4H Support & Resistance Levels
Resistance:
• Immediate: $123.00 – $123.50 (nearest resistance / recent swing area)
• Next: $127.00 – $130.00
• Higher targets: $140.00 – $150.00 (measured moves / stronger supply)
Support:
• Immediate / critical: $118.50 – $119.00 (key near-term demand)
• Stronger: $115.00 – $116.50
• Deeper: $110.00 – $112.00 (important structural support)
• Major: $104.00 – $105.00
Invalidation for the near-term bullish case: Sustained 4H closes back below ~$118 would weaken the short-term structure and increase the chance of a deeper retracement toward $110–$112.
Disclaimer: This is technical analysis based on publicly available data and is not financial advice. Cryptocurrency markets are highly volatile — always do your own research and manage risk carefully.#sol #solana
55
·
--
See translation
Bitcoin ($BTC ) Brief Update & 4H Technical Analysis
(as of October 2, 2026)
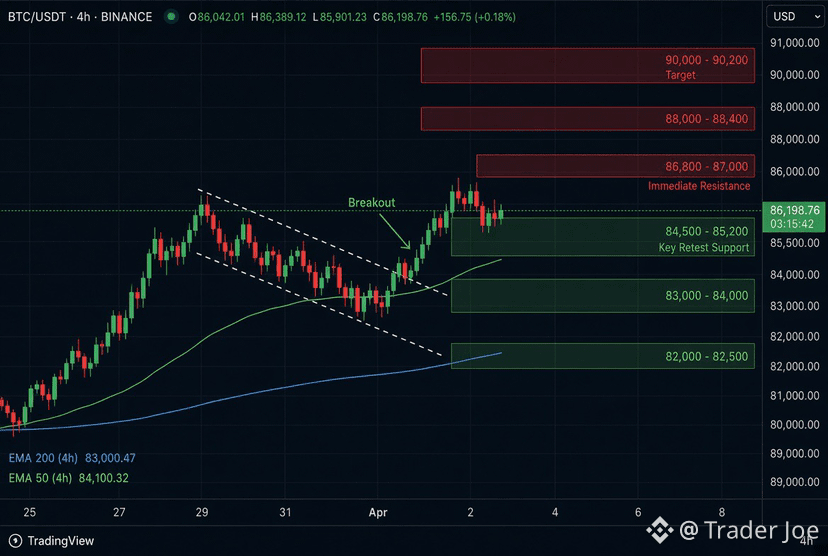
Current Price: Approximately $86,000 – $86,300
BTC is up roughly +2–3% in the last 24 hours, continuing a recovery after consolidating from recent highs near $87,000–$87,400. 
Quick Market Context
Bitcoin has been in a constructive recovery structure since breaking higher from the mid-$70k region earlier. On the 4-hour timeframe, price recently broke above a descending channel and is holding above key short-term moving averages (roughly $83k–$84.1k). Momentum remains constructive overall, though short-term consolidation or mild pullbacks are normal after the recent push. 
Overall bias on 4H: Cautiously bullish while price stays above key support. Stronger confirmation would come from a successful retest of the broken channel area or a clean break of nearby resistance.
Key 4H Support & Resistance Levels
Resistance:
• Immediate: $86,800 – $87,000 (recent highs / prior rejection zone)
• Next: $88,000 – $88,400
• Major target: $90,000 – $90,200 (measured move from recent channel patterns)
Support:
• Immediate / critical retest zone: $84,500 – $85,200 (broken channel upper boundary / prior resistance now potential support)
• Stronger: $83,000 – $84,000 (near EMAs and recent structure)
• Deeper: $82,000 – $82,500 (key demand / order block area)
• Major: $80,000 – $81,000
Invalidation for the near-term bullish case: Sustained 4H closes back below ~$84,000 would suggest the channel breakout has failed and open the door to deeper retracement toward the $80k–$82k zone.#btc #BTC走势分析
{spot}(BTCUSDT)
Bitcoin ($BTC ) Brief Update & 4H Technical Analysis
(as of October 2, 2026)
Current Price: Approximately $86,000 – $86,300
BTC is up roughly +2–3% in the last 24 hours, continuing a recovery after consolidating from recent highs near $87,000–$87,400. 
Quick Market Context
Bitcoin has been in a constructive recovery structure since breaking higher from the mid-$70k region earlier. On the 4-hour timeframe, price recently broke above a descending channel and is holding above key short-term moving averages (roughly $83k–$84.1k). Momentum remains constructive overall, though short-term consolidation or mild pullbacks are normal after the recent push. 
Overall bias on 4H: Cautiously bullish while price stays above key support. Stronger confirmation would come from a successful retest of the broken channel area or a clean break of nearby resistance.
Key 4H Support & Resistance Levels
Resistance:
• Immediate: $86,800 – $87,000 (recent highs / prior rejection zone)
• Next: $88,000 – $88,400
• Major target: $90,000 – $90,200 (measured move from recent channel patterns)
Support:
• Immediate / critical retest zone: $84,500 – $85,200 (broken channel upper boundary / prior resistance now potential support)
• Stronger: $83,000 – $84,000 (near EMAs and recent structure)
• Deeper: $82,000 – $82,500 (key demand / order block area)
• Major: $80,000 – $81,000
Invalidation for the near-term bullish case: Sustained 4H closes back below ~$84,000 would suggest the channel breakout has failed and open the door to deeper retracement toward the $80k–$82k zone.#btc #BTC走势分析
(as of October 2, 2026)
Current Price: Approximately $86,000 – $86,300
BTC is up roughly +2–3% in the last 24 hours, continuing a recovery after consolidating from recent highs near $87,000–$87,400. 
Quick Market Context
Bitcoin has been in a constructive recovery structure since breaking higher from the mid-$70k region earlier. On the 4-hour timeframe, price recently broke above a descending channel and is holding above key short-term moving averages (roughly $83k–$84.1k). Momentum remains constructive overall, though short-term consolidation or mild pullbacks are normal after the recent push. 
Overall bias on 4H: Cautiously bullish while price stays above key support. Stronger confirmation would come from a successful retest of the broken channel area or a clean break of nearby resistance.
Key 4H Support & Resistance Levels
Resistance:
• Immediate: $86,800 – $87,000 (recent highs / prior rejection zone)
• Next: $88,000 – $88,400
• Major target: $90,000 – $90,200 (measured move from recent channel patterns)
Support:
• Immediate / critical retest zone: $84,500 – $85,200 (broken channel upper boundary / prior resistance now potential support)
• Stronger: $83,000 – $84,000 (near EMAs and recent structure)
• Deeper: $82,000 – $82,500 (key demand / order block area)
• Major: $80,000 – $81,000
Invalidation for the near-term bullish case: Sustained 4H closes back below ~$84,000 would suggest the channel breakout has failed and open the door to deeper retracement toward the $80k–$82k zone.#btc #BTC走势分析
1
51
·
--
See translation
Ethereum $ETH is trading around $2,740–$2,760 as of October 2, 2026, up roughly 1.4–2.8% in the past 24 hours (depending on the exchange), with a market cap near $335–337 billion. 
Recent Performance
• 24h: Up ~1.4–2.8%, with a typical range of ~$2,670–$2,775.
• 7 days: Modest gains of ~1.5–3%.
• 30 days: Stronger recovery of ~12–15%.
• Longer term: Down ~37% over the past year and still ~44–45% below its all-time high of ~$4,950–$4,956 (reached August 24, 2025). Circulating supply is about 122.1 million ETH. 
ETH has been consolidating in a roughly $2,600–$2,800 range since late September after a solid recovery from lower levels earlier in 2026. It has outperformed Bitcoin over the past 60 days in some analyses (up ~45% vs. BTC’s ~33% in one report). 
Brief Analysis
Bullish factors:
• Institutional interest is supportive — Citi recently raised its 12-month ETH target to $3,028 (from $2,240), citing stronger crypto activity, a better macro backdrop, and expected steady ETF inflows (potentially ~$5B across crypto ETFs).
• Price is holding above key short-term moving averages in a constructive structure, with support near $2,600–$2,620 and resistance at $2,730–$2,800. A break higher could target $2,850–$3,000.
• Recent short liquidations and ETF-related flows have added volatility and upside pressure. 
Risks / Bearish notes:
• Momentum has stalled at times near resistance, with mixed technical signals (flat MACD in some views, crowded retail longs). A drop below ~$2,600 could open $2,400–$2,500.
• Macro sensitivity remains high (U.S. jobs data/NFP, CPI, Fed path, and yields). Crypto still faces regulatory and broader risk-off pressures.
• Year-to-date and 1-year performance remain negative after the 2025 peak. 
Overall bias: Mildly constructive / range-bound with upside bias while above ~$2,600 support. Watch for a decisive break of $2,800 or a failure back toward $2,600. This is not financial advice — crypto is highly volatile.#eth #ETFvsBTC
{spot}(ETHUSDT)
Ethereum $ETH is trading around $2,740–$2,760 as of October 2, 2026, up roughly 1.4–2.8% in the past 24 hours (depending on the exchange), with a market cap near $335–337 billion. 
Recent Performance
• 24h: Up ~1.4–2.8%, with a typical range of ~$2,670–$2,775.
• 7 days: Modest gains of ~1.5–3%.
• 30 days: Stronger recovery of ~12–15%.
• Longer term: Down ~37% over the past year and still ~44–45% below its all-time high of ~$4,950–$4,956 (reached August 24, 2025). Circulating supply is about 122.1 million ETH. 
ETH has been consolidating in a roughly $2,600–$2,800 range since late September after a solid recovery from lower levels earlier in 2026. It has outperformed Bitcoin over the past 60 days in some analyses (up ~45% vs. BTC’s ~33% in one report). 
Brief Analysis
Bullish factors:
• Institutional interest is supportive — Citi recently raised its 12-month ETH target to $3,028 (from $2,240), citing stronger crypto activity, a better macro backdrop, and expected steady ETF inflows (potentially ~$5B across crypto ETFs).
• Price is holding above key short-term moving averages in a constructive structure, with support near $2,600–$2,620 and resistance at $2,730–$2,800. A break higher could target $2,850–$3,000.
• Recent short liquidations and ETF-related flows have added volatility and upside pressure. 
Risks / Bearish notes:
• Momentum has stalled at times near resistance, with mixed technical signals (flat MACD in some views, crowded retail longs). A drop below ~$2,600 could open $2,400–$2,500.
• Macro sensitivity remains high (U.S. jobs data/NFP, CPI, Fed path, and yields). Crypto still faces regulatory and broader risk-off pressures.
• Year-to-date and 1-year performance remain negative after the 2025 peak. 
Overall bias: Mildly constructive / range-bound with upside bias while above ~$2,600 support. Watch for a decisive break of $2,800 or a failure back toward $2,600. This is not financial advice — crypto is highly volatile.#eth #ETFvsBTC
Recent Performance
• 24h: Up ~1.4–2.8%, with a typical range of ~$2,670–$2,775.
• 7 days: Modest gains of ~1.5–3%.
• 30 days: Stronger recovery of ~12–15%.
• Longer term: Down ~37% over the past year and still ~44–45% below its all-time high of ~$4,950–$4,956 (reached August 24, 2025). Circulating supply is about 122.1 million ETH. 
ETH has been consolidating in a roughly $2,600–$2,800 range since late September after a solid recovery from lower levels earlier in 2026. It has outperformed Bitcoin over the past 60 days in some analyses (up ~45% vs. BTC’s ~33% in one report). 
Brief Analysis
Bullish factors:
• Institutional interest is supportive — Citi recently raised its 12-month ETH target to $3,028 (from $2,240), citing stronger crypto activity, a better macro backdrop, and expected steady ETF inflows (potentially ~$5B across crypto ETFs).
• Price is holding above key short-term moving averages in a constructive structure, with support near $2,600–$2,620 and resistance at $2,730–$2,800. A break higher could target $2,850–$3,000.
• Recent short liquidations and ETF-related flows have added volatility and upside pressure. 
Risks / Bearish notes:
• Momentum has stalled at times near resistance, with mixed technical signals (flat MACD in some views, crowded retail longs). A drop below ~$2,600 could open $2,400–$2,500.
• Macro sensitivity remains high (U.S. jobs data/NFP, CPI, Fed path, and yields). Crypto still faces regulatory and broader risk-off pressures.
• Year-to-date and 1-year performance remain negative after the 2025 peak. 
Overall bias: Mildly constructive / range-bound with upside bias while above ~$2,600 support. Watch for a decisive break of $2,800 or a failure back toward $2,600. This is not financial advice — crypto is highly volatile.#eth #ETFvsBTC
1
93
·
--
See translation
$BTC latest update (Oct 2, 2026)
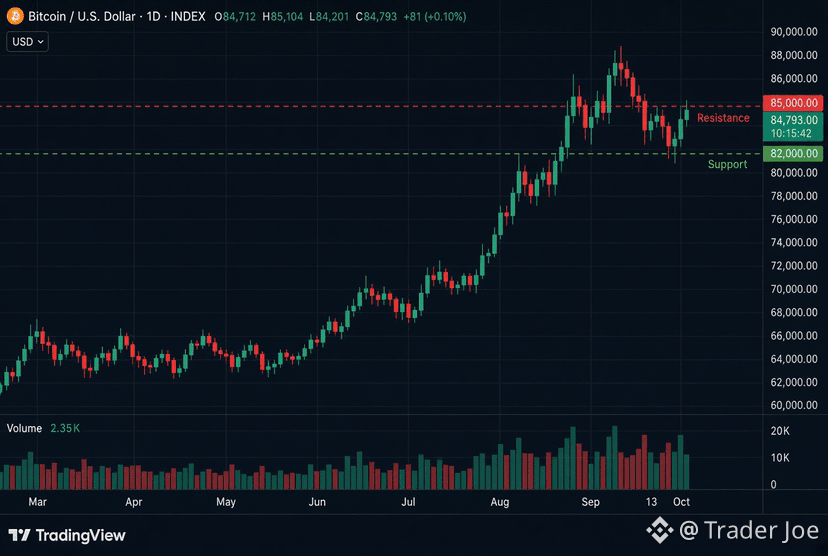
Price: ~$83,500–$84,650
Range-bound between $82,000–$85,000 for over a week.
Key points
• Brief push above $85k after softer U.S. inflation data, but failed to hold.
• U.S. spot ETFs saw net outflows (~$149M) after a strong inflow streak.
• Stronger USD and yields adding mild pressure.
Technicals (1D chart)
• Support: $82,000 (critical)
• Resistance: $85,500 → $88,000
• Structure remains constructive above major MAs after the recovery from June lows.
Outlook
Sideways action likely until a clear break of $85.5k (bullish) or $82k (bearish risk toward $80k).
Current level: ~$84,500–$84,600
Stuck in the $82k–$85k range after failing to hold above $85k.
#btc #BTC走势分析 #BTC🔥🔥🔥🔥🔥
{spot}(BTCUSDT)
$BTC latest update (Oct 2, 2026)
Price: ~$83,500–$84,650
Range-bound between $82,000–$85,000 for over a week.
Key points
• Brief push above $85k after softer U.S. inflation data, but failed to hold.
• U.S. spot ETFs saw net outflows (~$149M) after a strong inflow streak.
• Stronger USD and yields adding mild pressure.
Technicals (1D chart)
• Support: $82,000 (critical)
• Resistance: $85,500 → $88,000
• Structure remains constructive above major MAs after the recovery from June lows.
Outlook
Sideways action likely until a clear break of $85.5k (bullish) or $82k (bearish risk toward $80k).
Current level: ~$84,500–$84,600
Stuck in the $82k–$85k range after failing to hold above $85k.
#btc #BTC走势分析 #BTC🔥🔥🔥🔥🔥
Price: ~$83,500–$84,650
Range-bound between $82,000–$85,000 for over a week.
Key points
• Brief push above $85k after softer U.S. inflation data, but failed to hold.
• U.S. spot ETFs saw net outflows (~$149M) after a strong inflow streak.
• Stronger USD and yields adding mild pressure.
Technicals (1D chart)
• Support: $82,000 (critical)
• Resistance: $85,500 → $88,000
• Structure remains constructive above major MAs after the recovery from June lows.
Outlook
Sideways action likely until a clear break of $85.5k (bullish) or $82k (bearish risk toward $80k).
Current level: ~$84,500–$84,600
Stuck in the $82k–$85k range after failing to hold above $85k.
#btc #BTC走势分析 #BTC🔥🔥🔥🔥🔥
1
86
·
--
See translation
{spot}(QNTUSDT)
$QNT (Quant) brief analysis – Oct 2026
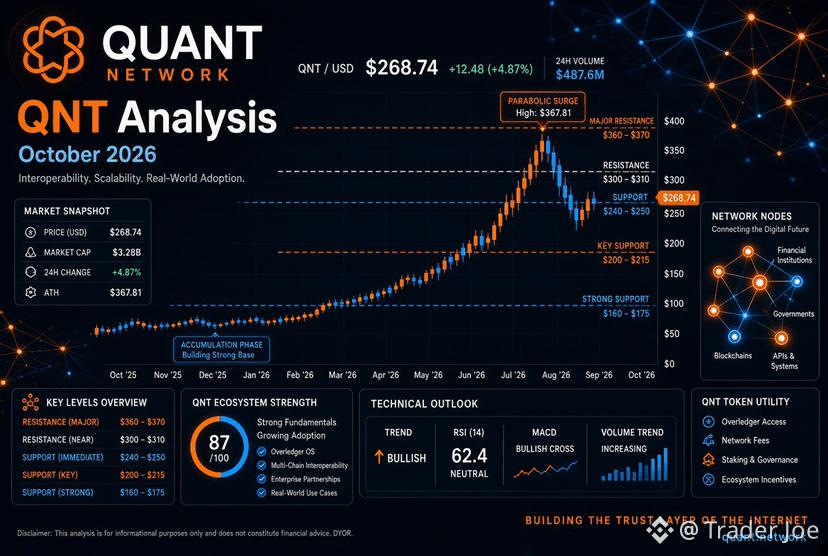
Price: ~$260–$265 (down ~10–12% in 24h after the rally).
Market cap ~$3.2–3.8B | Circulating supply ~12–14.5M.
What drove it
Late September: The Clearing House (major US banks) picked Quant for its On-Chain Money Initiative (tokenized deposits). Network targeted for H1 2027. QNT jumped 300–530% from ~$60–70 to highs near $370–375.
Technicals
Overbought (RSI 80+).
Key levels:
• Resistance: $300–330 → $360–400
• Support: $270–295 → $240–260
Outlook
Short-term: Likely consolidation or pullback while RSI cools.
Longer-term: Constructive into 2027 if the bank network launches and adoption grows. Some forecasts point toward $440–450 range next year.
Risks: Profit-taking, delays in rollout, broader market weakness.
Not financial advice.
DYOR.#QNT/USDT #QNTUSDT #US10YearYieldNears5.3%
$QNT (Quant) brief analysis – Oct 2026
Price: ~$260–$265 (down ~10–12% in 24h after the rally).
Market cap ~$3.2–3.8B | Circulating supply ~12–14.5M.
What drove it
Late September: The Clearing House (major US banks) picked Quant for its On-Chain Money Initiative (tokenized deposits). Network targeted for H1 2027. QNT jumped 300–530% from ~$60–70 to highs near $370–375.
Technicals
Overbought (RSI 80+).
Key levels:
• Resistance: $300–330 → $360–400
• Support: $270–295 → $240–260
Outlook
Short-term: Likely consolidation or pullback while RSI cools.
Longer-term: Constructive into 2027 if the bank network launches and adoption grows. Some forecasts point toward $440–450 range next year.
Risks: Profit-taking, delays in rollout, broader market weakness.
Not financial advice.
DYOR.#QNT/USDT #QNTUSDT #US10YearYieldNears5.3%
Price: ~$260–$265 (down ~10–12% in 24h after the rally).
Market cap ~$3.2–3.8B | Circulating supply ~12–14.5M.
What drove it
Late September: The Clearing House (major US banks) picked Quant for its On-Chain Money Initiative (tokenized deposits). Network targeted for H1 2027. QNT jumped 300–530% from ~$60–70 to highs near $370–375.
Technicals
Overbought (RSI 80+).
Key levels:
• Resistance: $300–330 → $360–400
• Support: $270–295 → $240–260
Outlook
Short-term: Likely consolidation or pullback while RSI cools.
Longer-term: Constructive into 2027 if the bank network launches and adoption grows. Some forecasts point toward $440–450 range next year.
Risks: Profit-taking, delays in rollout, broader market weakness.
Not financial advice.
DYOR.#QNT/USDT #QNTUSDT #US10YearYieldNears5.3%
1
80
Log in to explore more content
Join global crypto users on Binance Square
⚡️ Get latest and useful information about crypto.
💬 Trusted by the world’s largest crypto exchange.
👍 Discover real insights from verified creators.
Email / Phone number