
独369
3 Posts

独369
23 Following
1 Followers
1 Liked
Posts
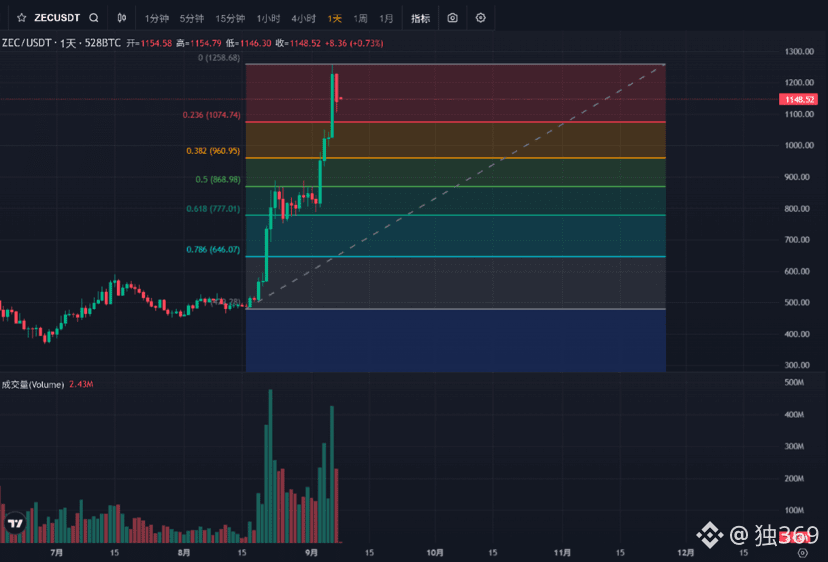
ZEC price action is very strong. Despite the headwind, shorting one wave against the trend is exactly what we did; we’re hitting the so-called “precision” traders. At the moment, the price is running tightly along the upper Bollinger Band. The MACD red histogram bars continue to expand, indicating that the bulls are in control.
Resistance above: look at the prior high around 1,258. If it breaks through, it could move up to 1,400. Support below: focus on the 1,100–1,150 range (the 0.236 retracement level).
Overall, the short term faces technical correction pressure, but the medium-term uptrend has not been broken. It’s recommended to wait for a pullback to key Fibonacci support levels before considering an entry, to avoid chasing. Suggested long setups are as follows:
● Entry levels: place orders in the 1,100–1,120 range, or directly wait for a quick intraday pullback into this area and then build positions in batches (this is the 0.236 shallow retracement support zone; in strong trends, price usually doesn’t adjust deeply).
● Stop-loss: set it below 1,080 (if price breaks below this level, be alert to a potential high-level false breakout).
● Take-profit targets: first target is the prior high at 1,258; if there is a breakout with volume expansion, the second target can be 1,400.
Reminder: For futures contract trading, be sure to strictly use stop-loss orders and control position size for each single trade.
#ZEC $ZEC
Resistance above: look at the prior high around 1,258. If it breaks through, it could move up to 1,400. Support below: focus on the 1,100–1,150 range (the 0.236 retracement level).
Overall, the short term faces technical correction pressure, but the medium-term uptrend has not been broken. It’s recommended to wait for a pullback to key Fibonacci support levels before considering an entry, to avoid chasing. Suggested long setups are as follows:
● Entry levels: place orders in the 1,100–1,120 range, or directly wait for a quick intraday pullback into this area and then build positions in batches (this is the 0.236 shallow retracement support zone; in strong trends, price usually doesn’t adjust deeply).
● Stop-loss: set it below 1,080 (if price breaks below this level, be alert to a potential high-level false breakout).
● Take-profit targets: first target is the prior high at 1,258; if there is a breakout with volume expansion, the second target can be 1,400.
Reminder: For futures contract trading, be sure to strictly use stop-loss orders and control position size for each single trade.
#ZEC $ZEC
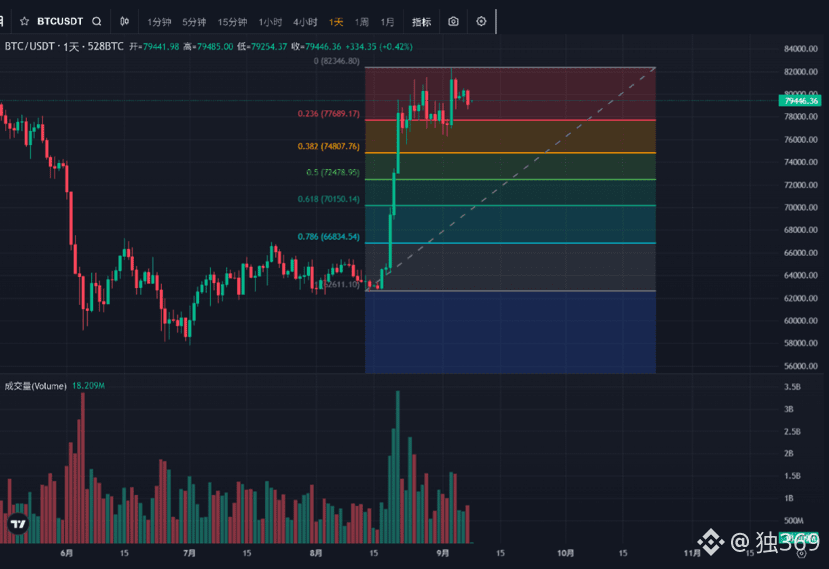
After BTC reached the 82,279 peak, it has pulled back and is currently being pressured by the upper Bollinger Band. The MACD shows signs of a bearish cross, indicating weakening short-term momentum. If it retraces to and stabilizes around the 75,890 support level (approximately the 0.382 Fibonacci retracement), it may be able to restart its uptrend; if it breaks below, it could test the 74,854 lower band and even approach around 72,478.
BTC is currently in the adjustment phase following the spike upward. It is not advisable to chase the price directly; the key strategy is to wait for the pullback to stabilize.
● Entry level: patiently wait for the price to retrace into the 75,800 - 76,000 range (around the 0.382 Fibonacci support preset in the chart). When the candlestick shows stabilization in this area (e.g., a long lower wick, followed by a small bullish engulfing/flip), it can serve as the first buy signal.
● Stop-loss: set below 74,700 (a break below the BOLL lower band in the chart and the key support zone would suggest the trend is weakening).
● Take-profit targets: first target is the previous high at 82,279; if it breaks out, the second target can be 85,000.
#美伊互袭油轮冲突升级 #BTC $BTC
BTC is currently in the adjustment phase following the spike upward. It is not advisable to chase the price directly; the key strategy is to wait for the pullback to stabilize.
● Entry level: patiently wait for the price to retrace into the 75,800 - 76,000 range (around the 0.382 Fibonacci support preset in the chart). When the candlestick shows stabilization in this area (e.g., a long lower wick, followed by a small bullish engulfing/flip), it can serve as the first buy signal.
● Stop-loss: set below 74,700 (a break below the BOLL lower band in the chart and the key support zone would suggest the trend is weakening).
● Take-profit targets: first target is the previous high at 82,279; if it breaks out, the second target can be 85,000.
#美伊互袭油轮冲突升级 #BTC $BTC
Log in to explore more content