
我是X先生
765 Posts

我是X先生
Report
Block User
尊重趋势,技术永赚
11 Following
218 Followers
265 Liked
Posts
All
Quotes
PINNED
·
--
$BTC “Cutting a boat to seek a sword”—once, how should Bitcoin’s long positions be handled?
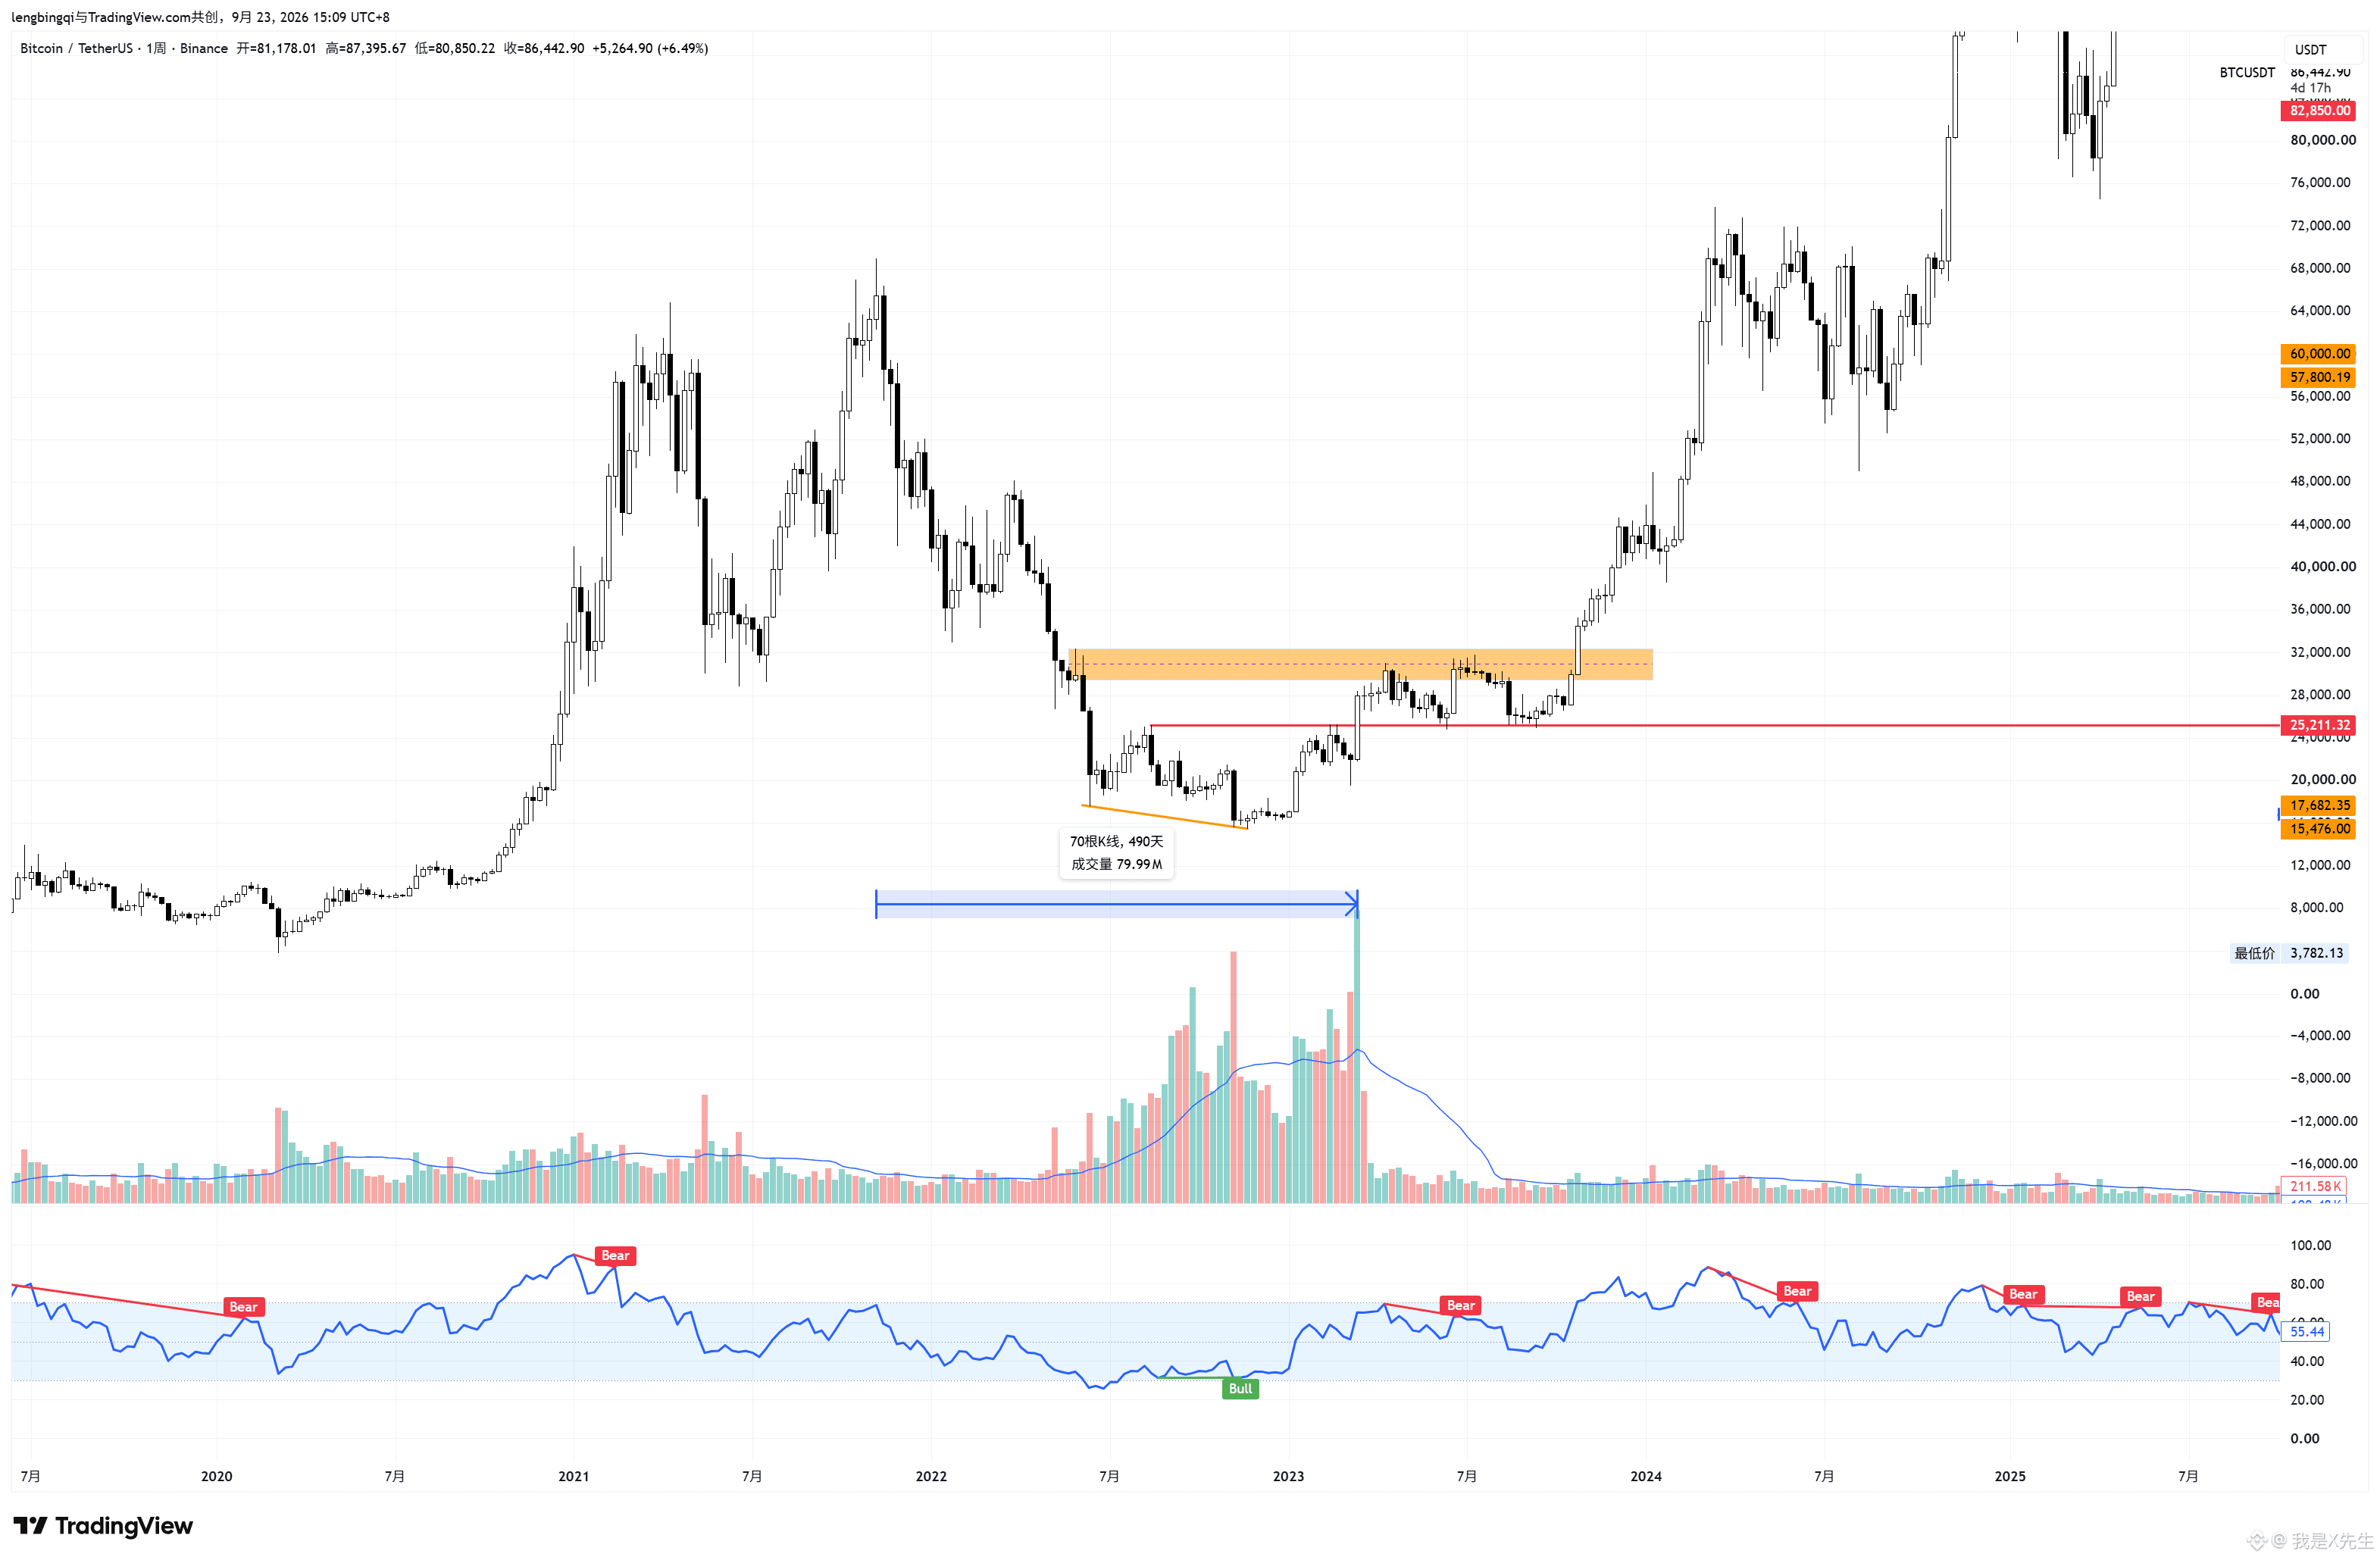
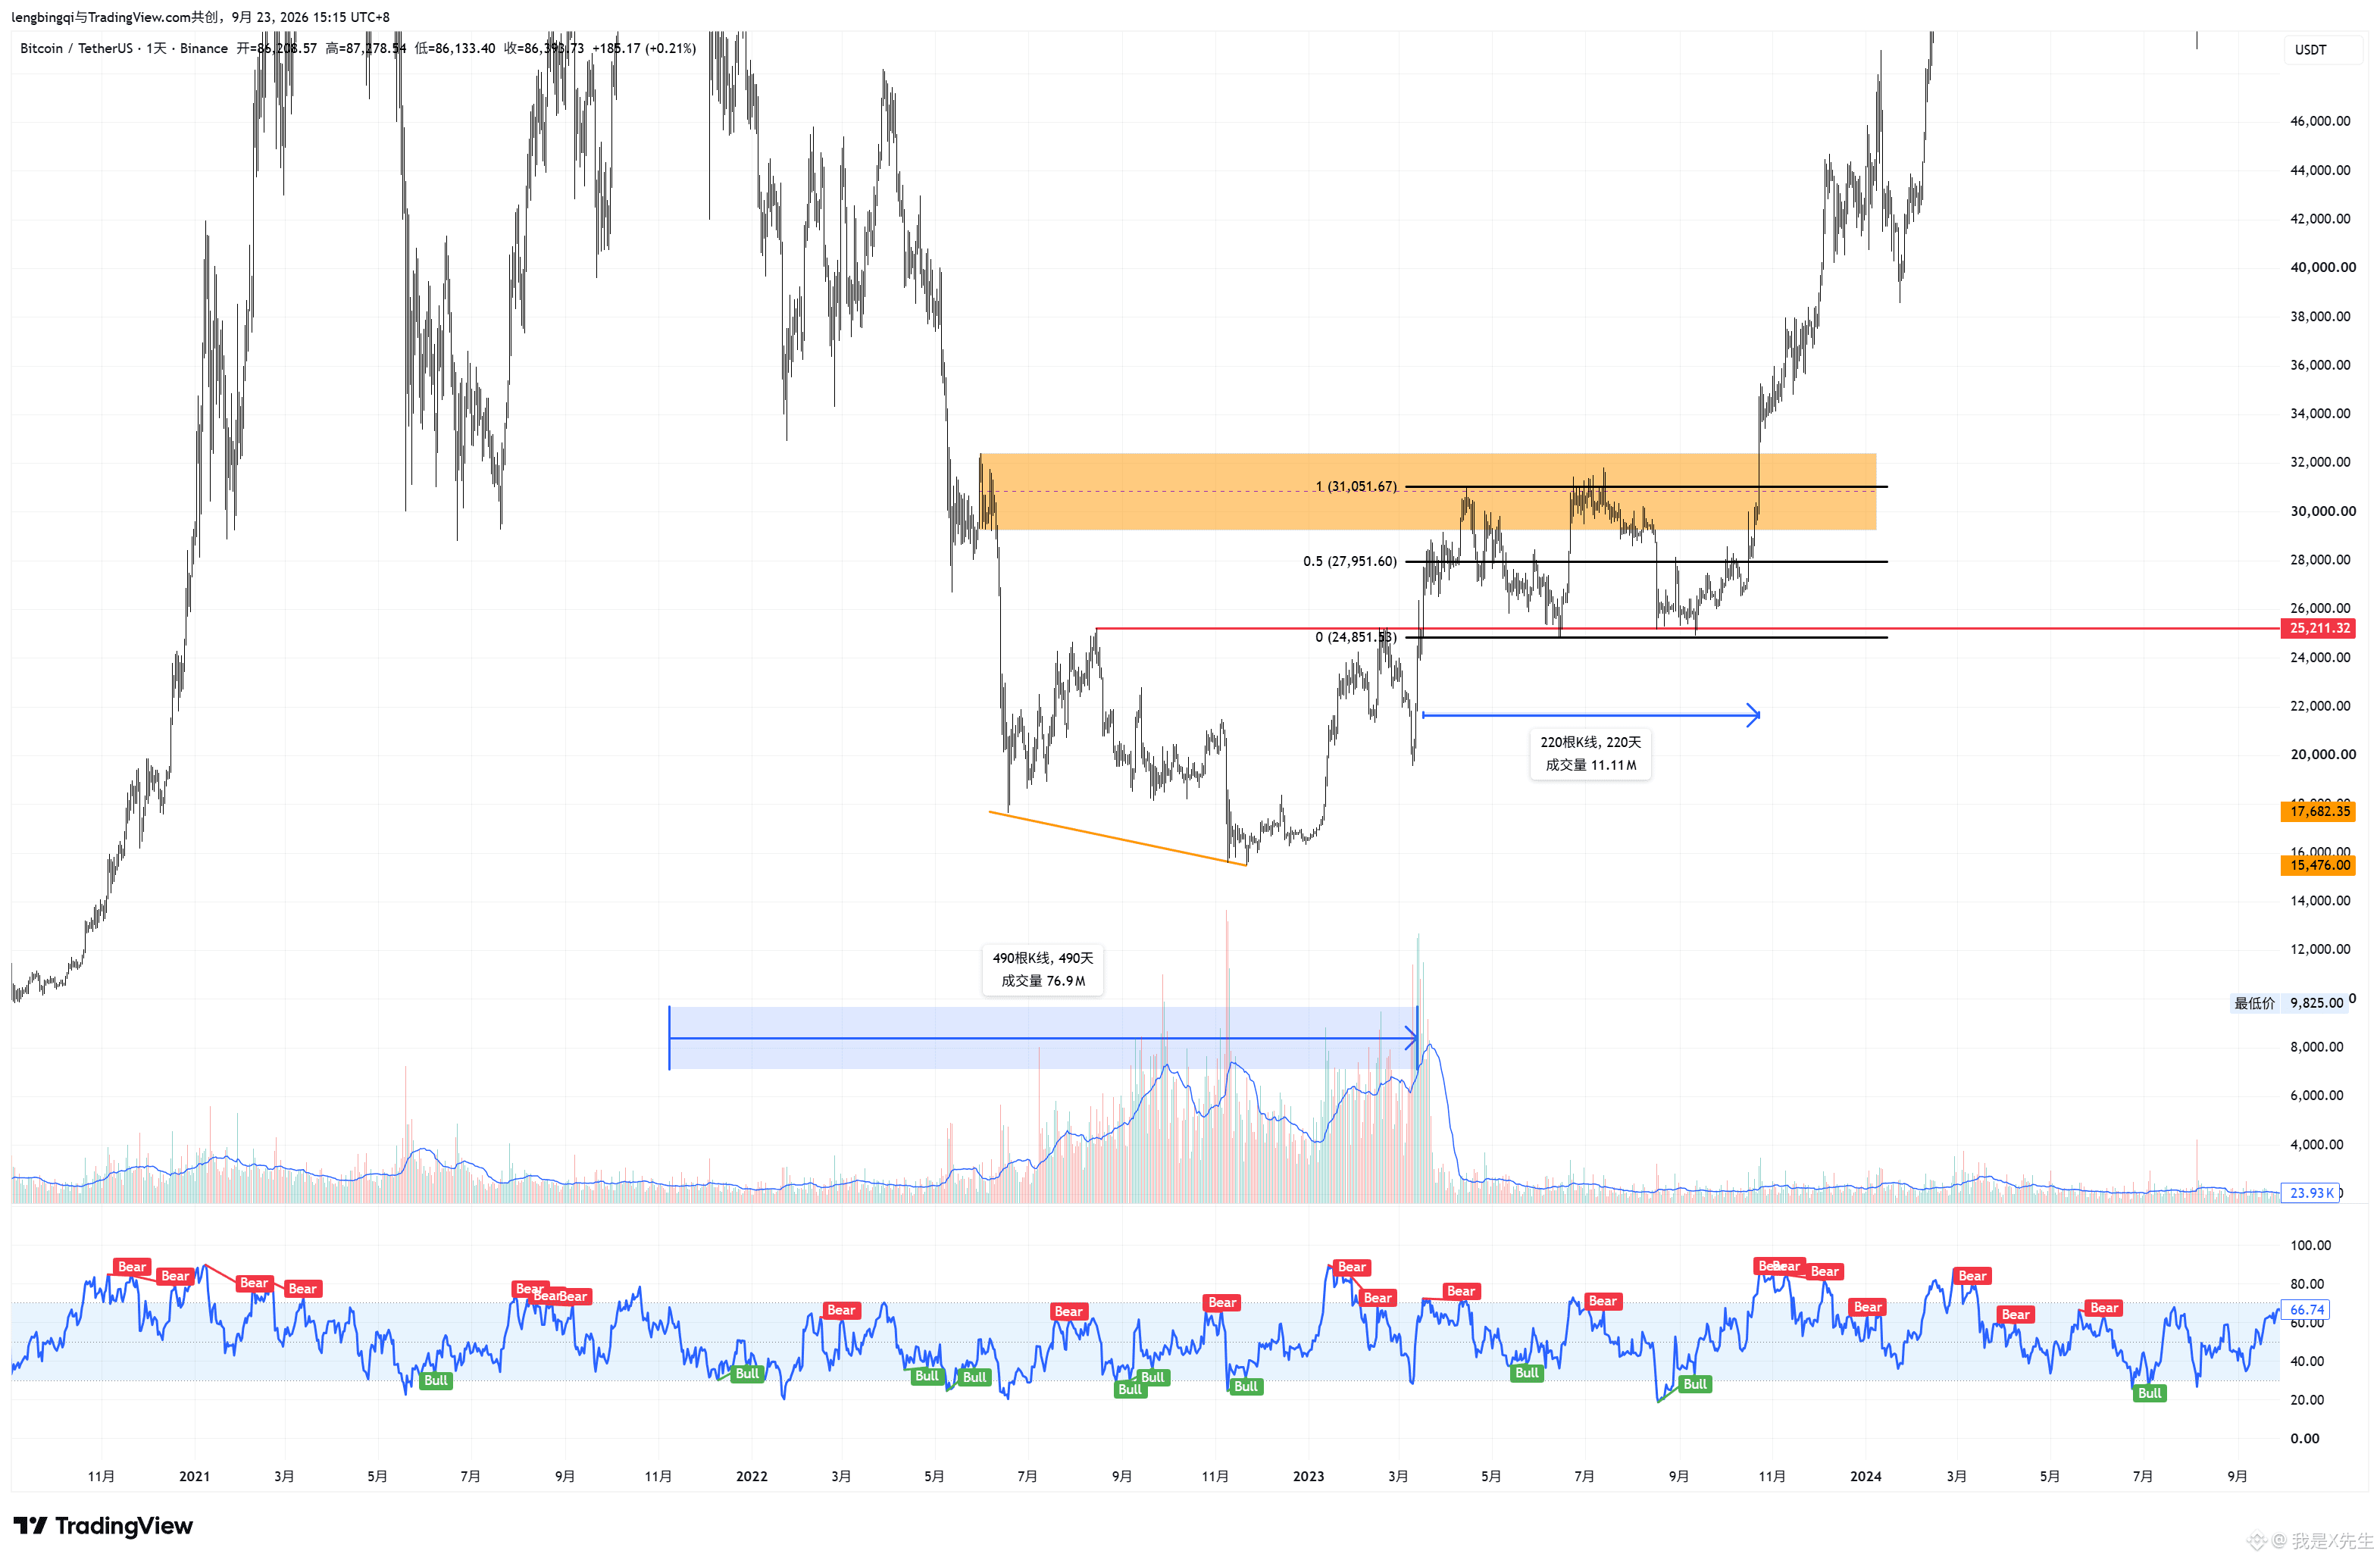
In the 2022 bear market, if counted from the highest point to the time Bitcoin bottomed and broke the bear-to-bull (bull/bear) conversion line, the weekly-level MSB took roughly 450 days (Fig. 1). After breaking 25211, during the period 25211—weekly OB, a horizontal box-like range was formed for about 22 days (Fig. 2). It then retested the area around 25211 twice to test overhead supply and wash out the market, followed by a breakout above the top of the range, starting a main uptrend that “never looks back.”
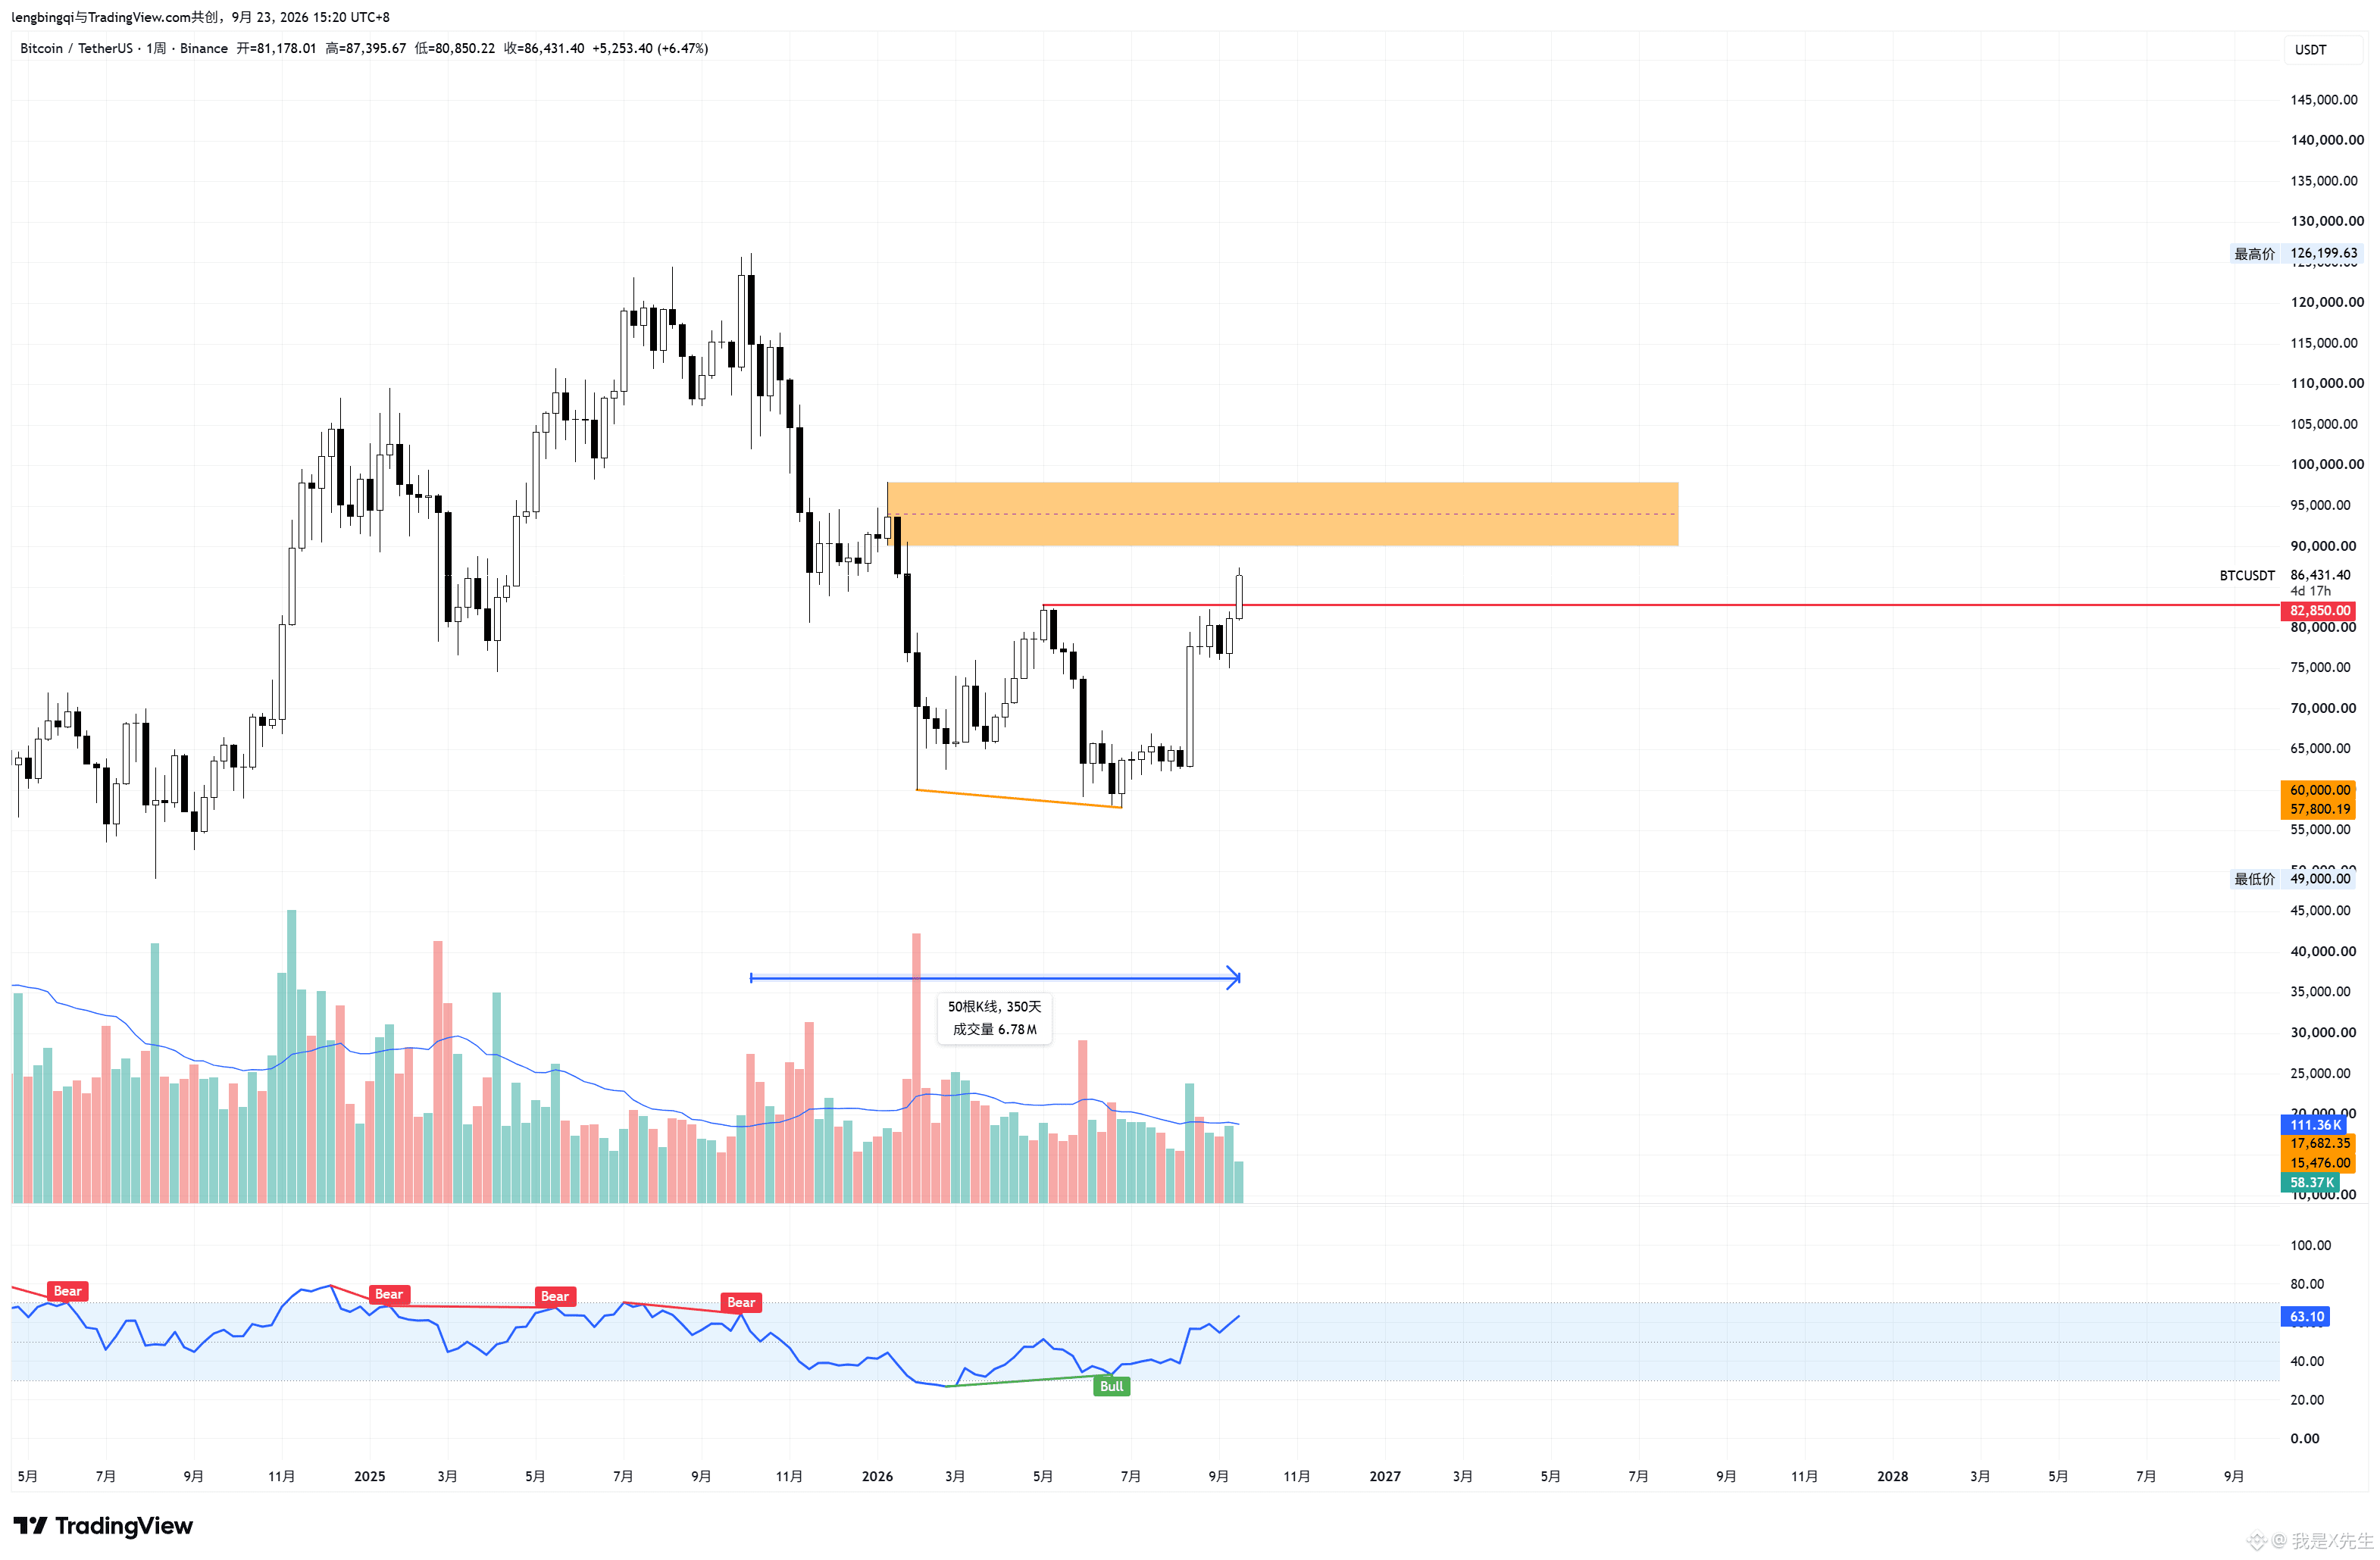
As for the current bear-to-bull conversion, it has only taken 350 days to complete the structure (Fig. 3), which is 100 days less than the previous cycle. The main players may be a bit impatient, but that also suggests the market’s consensus is currently fairly good: major institutions are “accumulating,” and at the very least this leaves room for imagination regarding the next leg up.
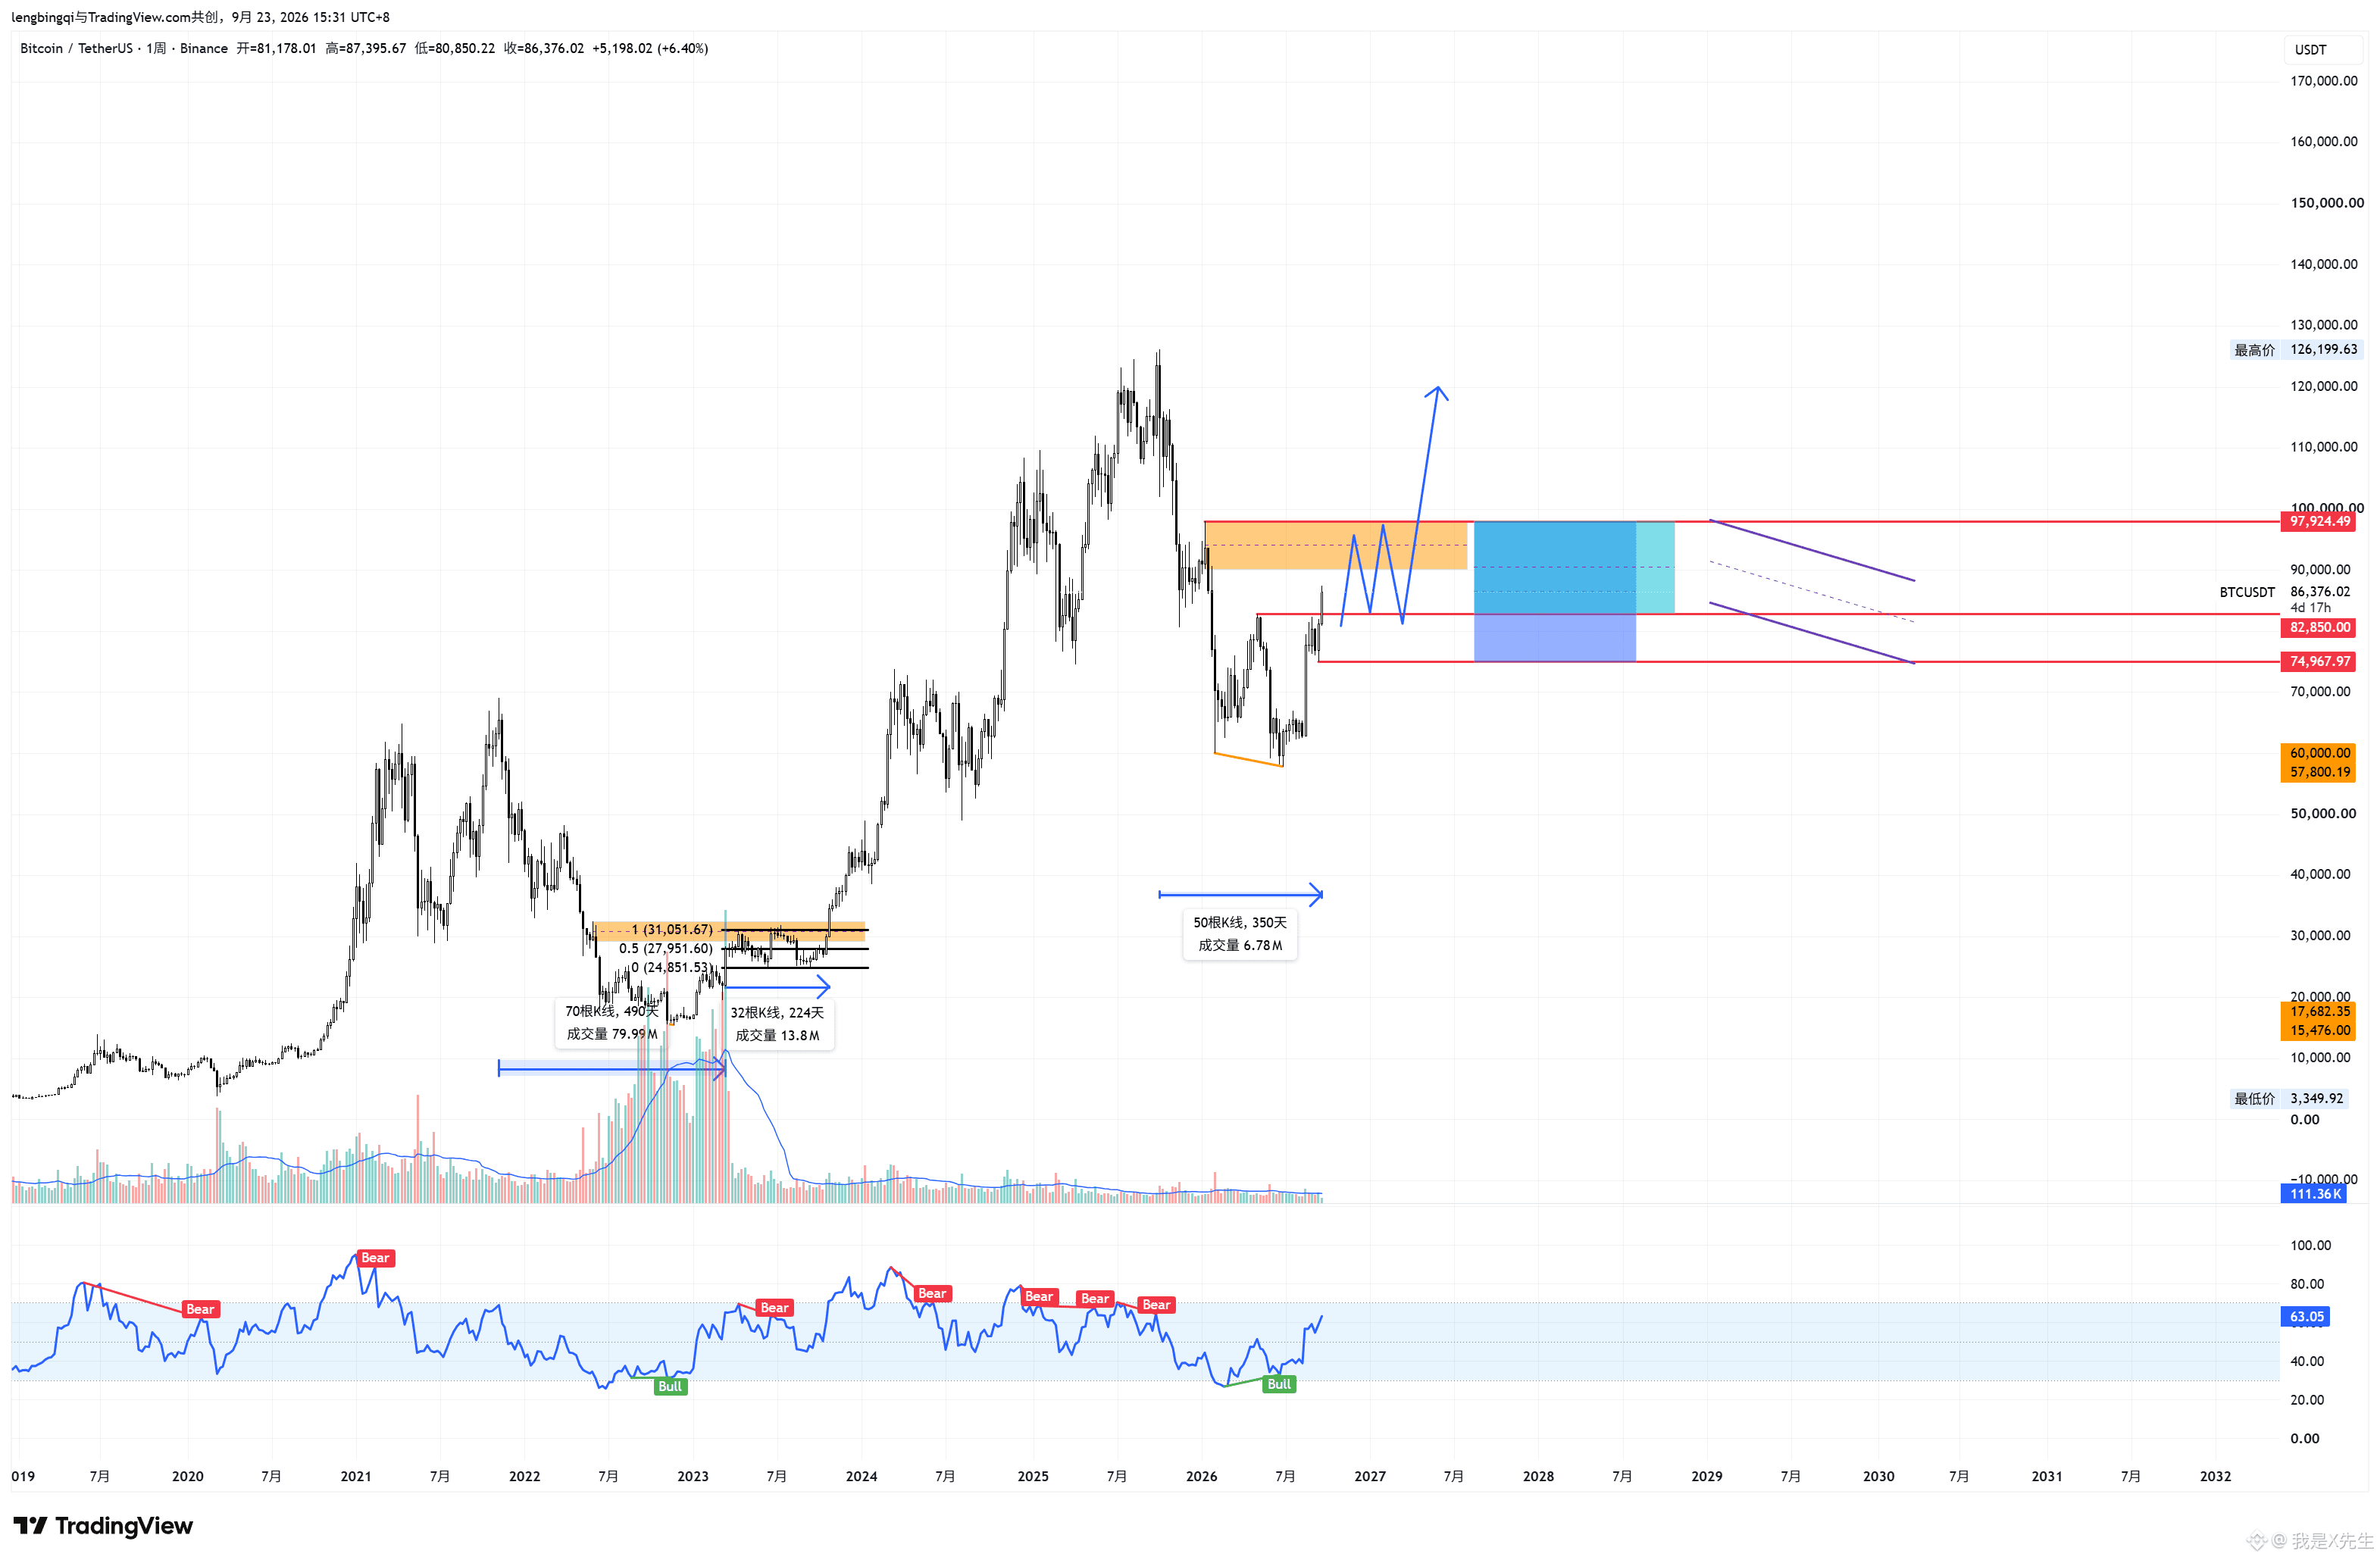
What might happen next? There is no price action that rises without pullbacks. If it goes up too much, it must come down—that’s inevitable. It’s only the depth of the pullback that’s unknown. If, going forward, capital continues to flow in strongly and overhead supply remains relatively small, it could form a range-bound consolidation between 75–98, or even 85–929. Of course, it could also form other consolidation patterns—like a bull flag. All of these are normal. Therefore, long-term longs shouldn’t be in a hurry: wait until a structure and pattern are clearly formed, then enter. One reason is to look for the lower point of the pullback; the other is to look for the breakout point. Those two long-term entry locations must be grasped.
Since there is no completely consistent price trajectory, the “cutting a boat to seek a sword” here is about copying the main players’ operational mindset.
(Of course, if the pullback breaks below 75, that would be even better—but will the main players really give an opportunity to pick up cheap chips? Who knows.)
$BTC “Cutting a boat to seek a sword”—once, how should Bitcoin’s long positions be handled?
In the 2022 bear market, if counted from the highest point to the time Bitcoin bottomed and broke the bear-to-bull (bull/bear) conversion line, the weekly-level MSB took roughly 450 days (Fig. 1). After breaking 25211, during the period 25211—weekly OB, a horizontal box-like range was formed for about 22 days (Fig. 2). It then retested the area around 25211 twice to test overhead supply and wash out the market, followed by a breakout above the top of the range, starting a main uptrend that “never looks back.”
As for the current bear-to-bull conversion, it has only taken 350 days to complete the structure (Fig. 3), which is 100 days less than the previous cycle. The main players may be a bit impatient, but that also suggests the market’s consensus is currently fairly good: major institutions are “accumulating,” and at the very least this leaves room for imagination regarding the next leg up.
What might happen next? There is no price action that rises without pullbacks. If it goes up too much, it must come down—that’s inevitable. It’s only the depth of the pullback that’s unknown. If, going forward, capital continues to flow in strongly and overhead supply remains relatively small, it could form a range-bound consolidation between 75–98, or even 85–929. Of course, it could also form other consolidation patterns—like a bull flag. All of these are normal. Therefore, long-term longs shouldn’t be in a hurry: wait until a structure and pattern are clearly formed, then enter. One reason is to look for the lower point of the pullback; the other is to look for the breakout point. Those two long-term entry locations must be grasped.
Since there is no completely consistent price trajectory, the “cutting a boat to seek a sword” here is about copying the main players’ operational mindset.
(Of course, if the pullback breaks below 75, that would be even better—but will the main players really give an opportunity to pick up cheap chips? Who knows.)
In the 2022 bear market, if counted from the highest point to the time Bitcoin bottomed and broke the bear-to-bull (bull/bear) conversion line, the weekly-level MSB took roughly 450 days (Fig. 1). After breaking 25211, during the period 25211—weekly OB, a horizontal box-like range was formed for about 22 days (Fig. 2). It then retested the area around 25211 twice to test overhead supply and wash out the market, followed by a breakout above the top of the range, starting a main uptrend that “never looks back.”
As for the current bear-to-bull conversion, it has only taken 350 days to complete the structure (Fig. 3), which is 100 days less than the previous cycle. The main players may be a bit impatient, but that also suggests the market’s consensus is currently fairly good: major institutions are “accumulating,” and at the very least this leaves room for imagination regarding the next leg up.
What might happen next? There is no price action that rises without pullbacks. If it goes up too much, it must come down—that’s inevitable. It’s only the depth of the pullback that’s unknown. If, going forward, capital continues to flow in strongly and overhead supply remains relatively small, it could form a range-bound consolidation between 75–98, or even 85–929. Of course, it could also form other consolidation patterns—like a bull flag. All of these are normal. Therefore, long-term longs shouldn’t be in a hurry: wait until a structure and pattern are clearly formed, then enter. One reason is to look for the lower point of the pullback; the other is to look for the breakout point. Those two long-term entry locations must be grasped.
Since there is no completely consistent price trajectory, the “cutting a boat to seek a sword” here is about copying the main players’ operational mindset.
(Of course, if the pullback breaks below 75, that would be even better—but will the main players really give an opportunity to pick up cheap chips? Who knows.)
3
257
PINNED
·
--
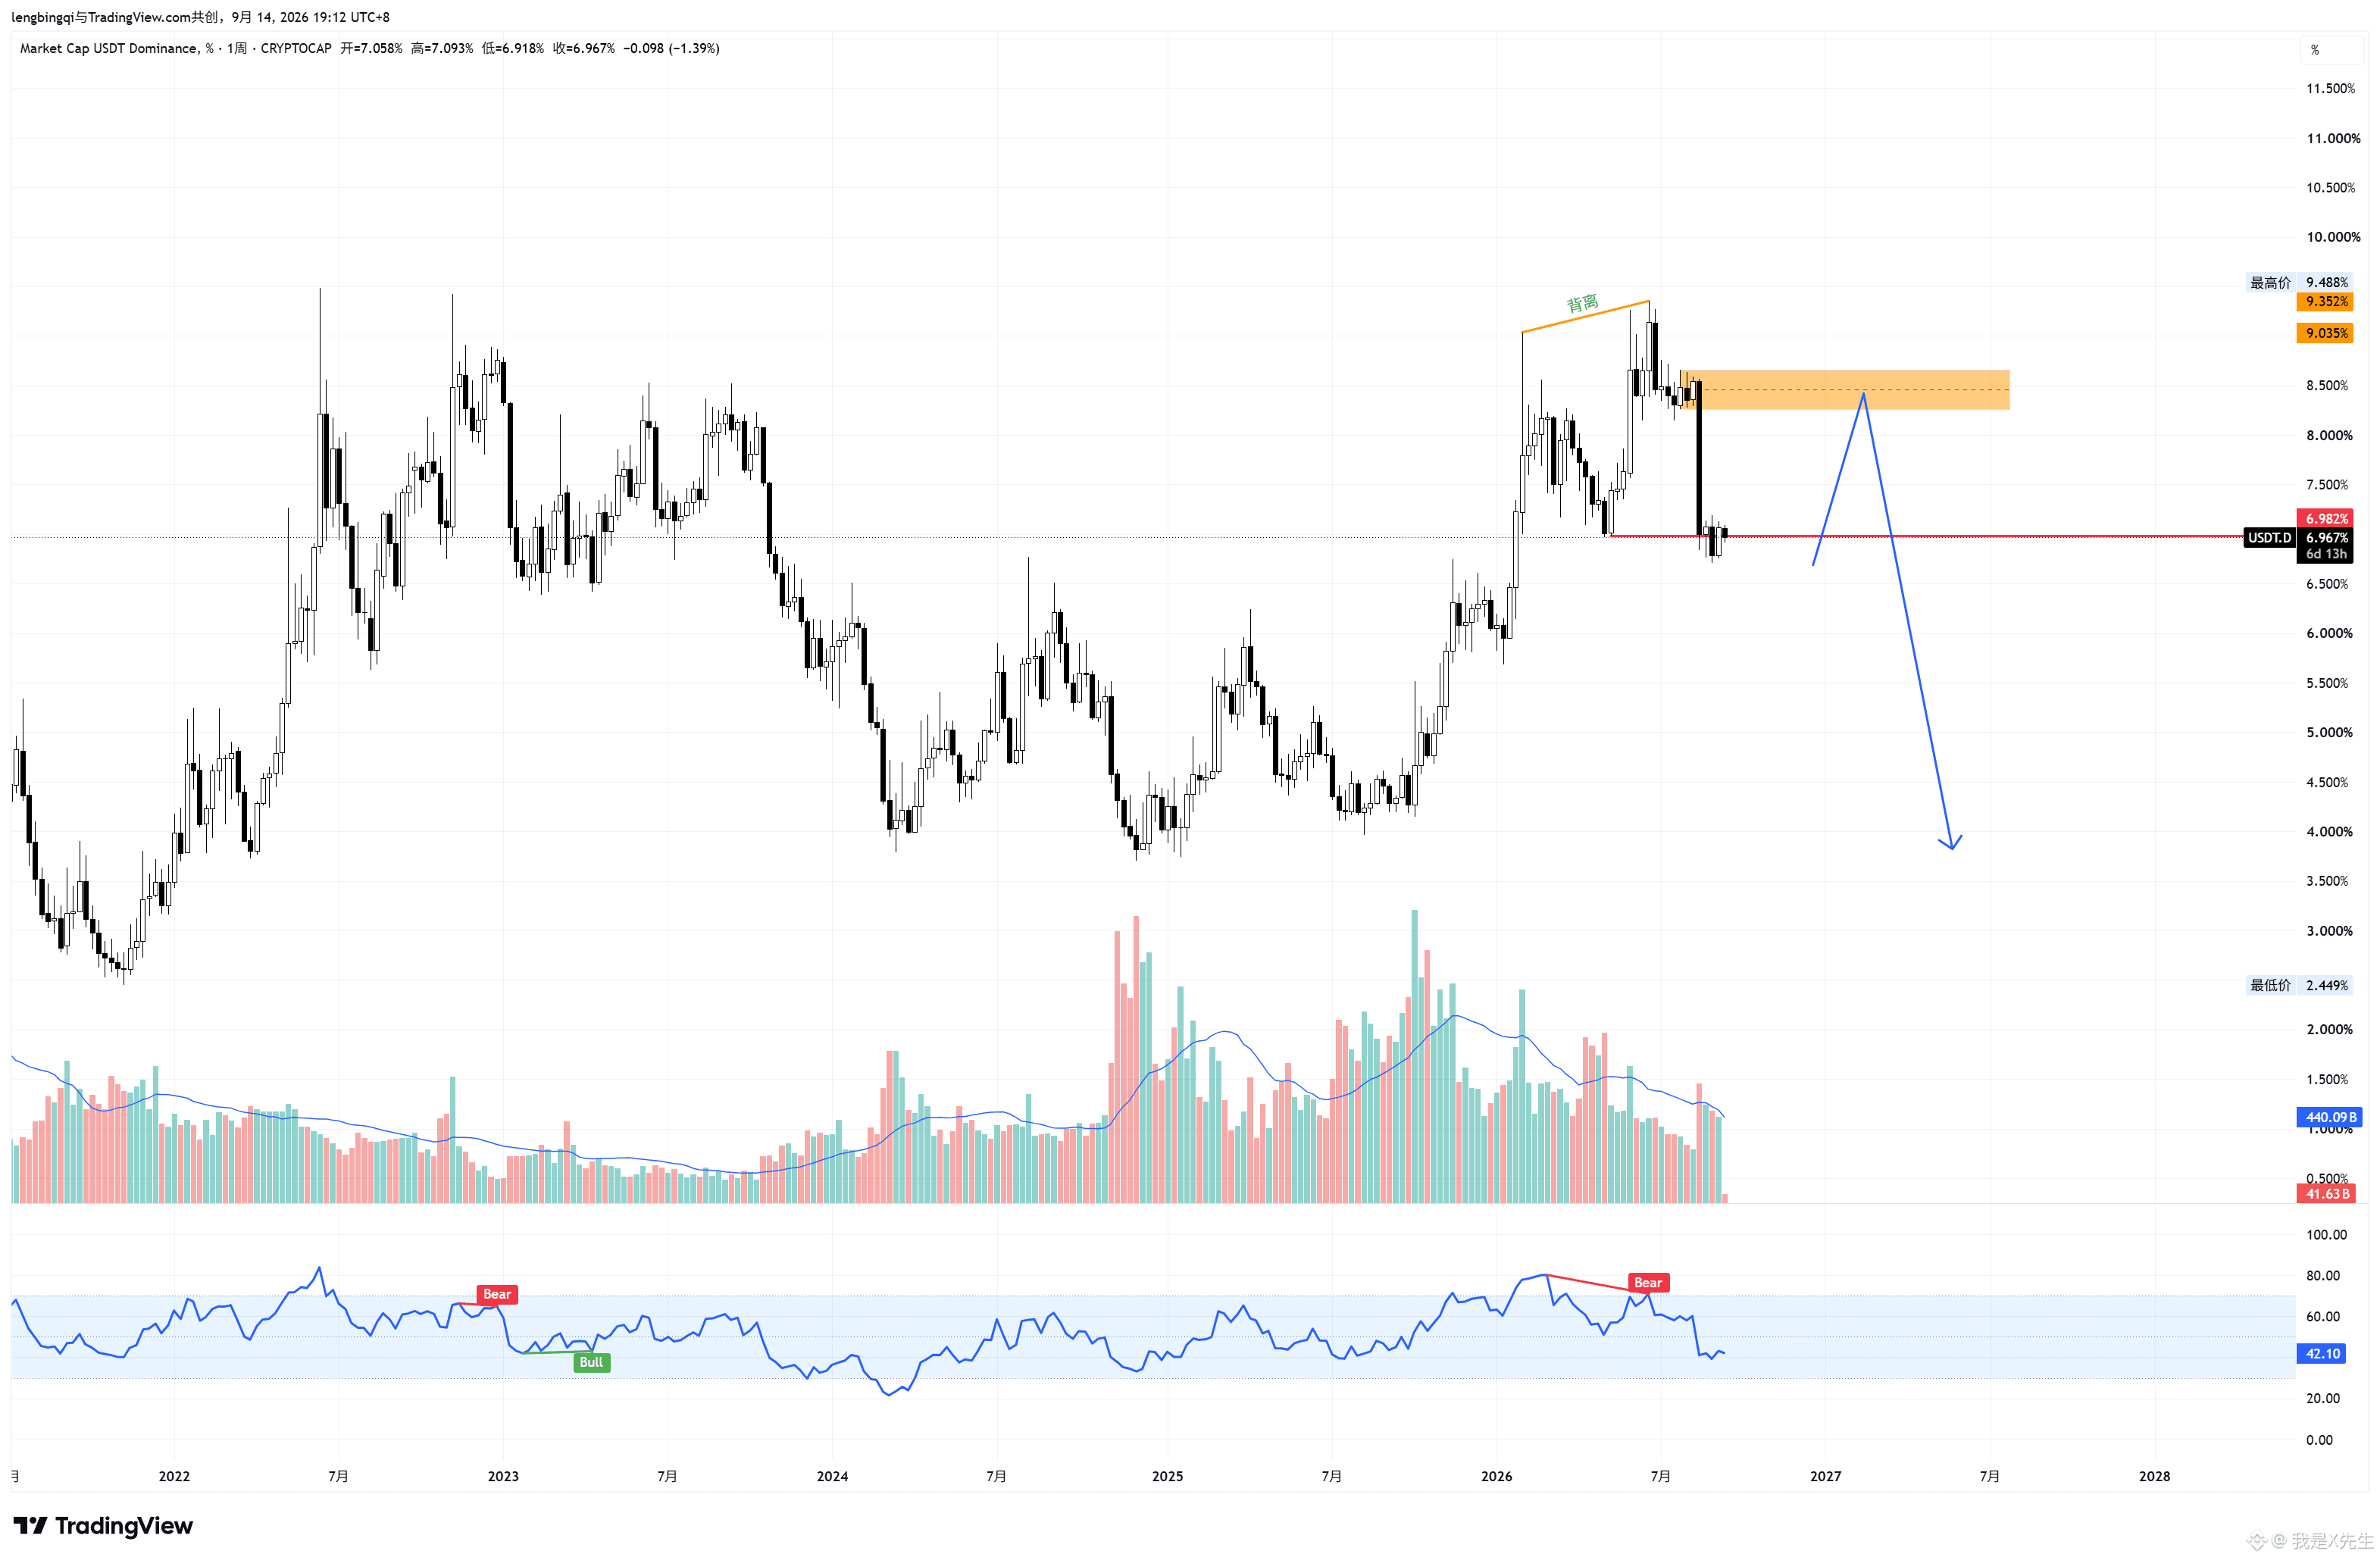
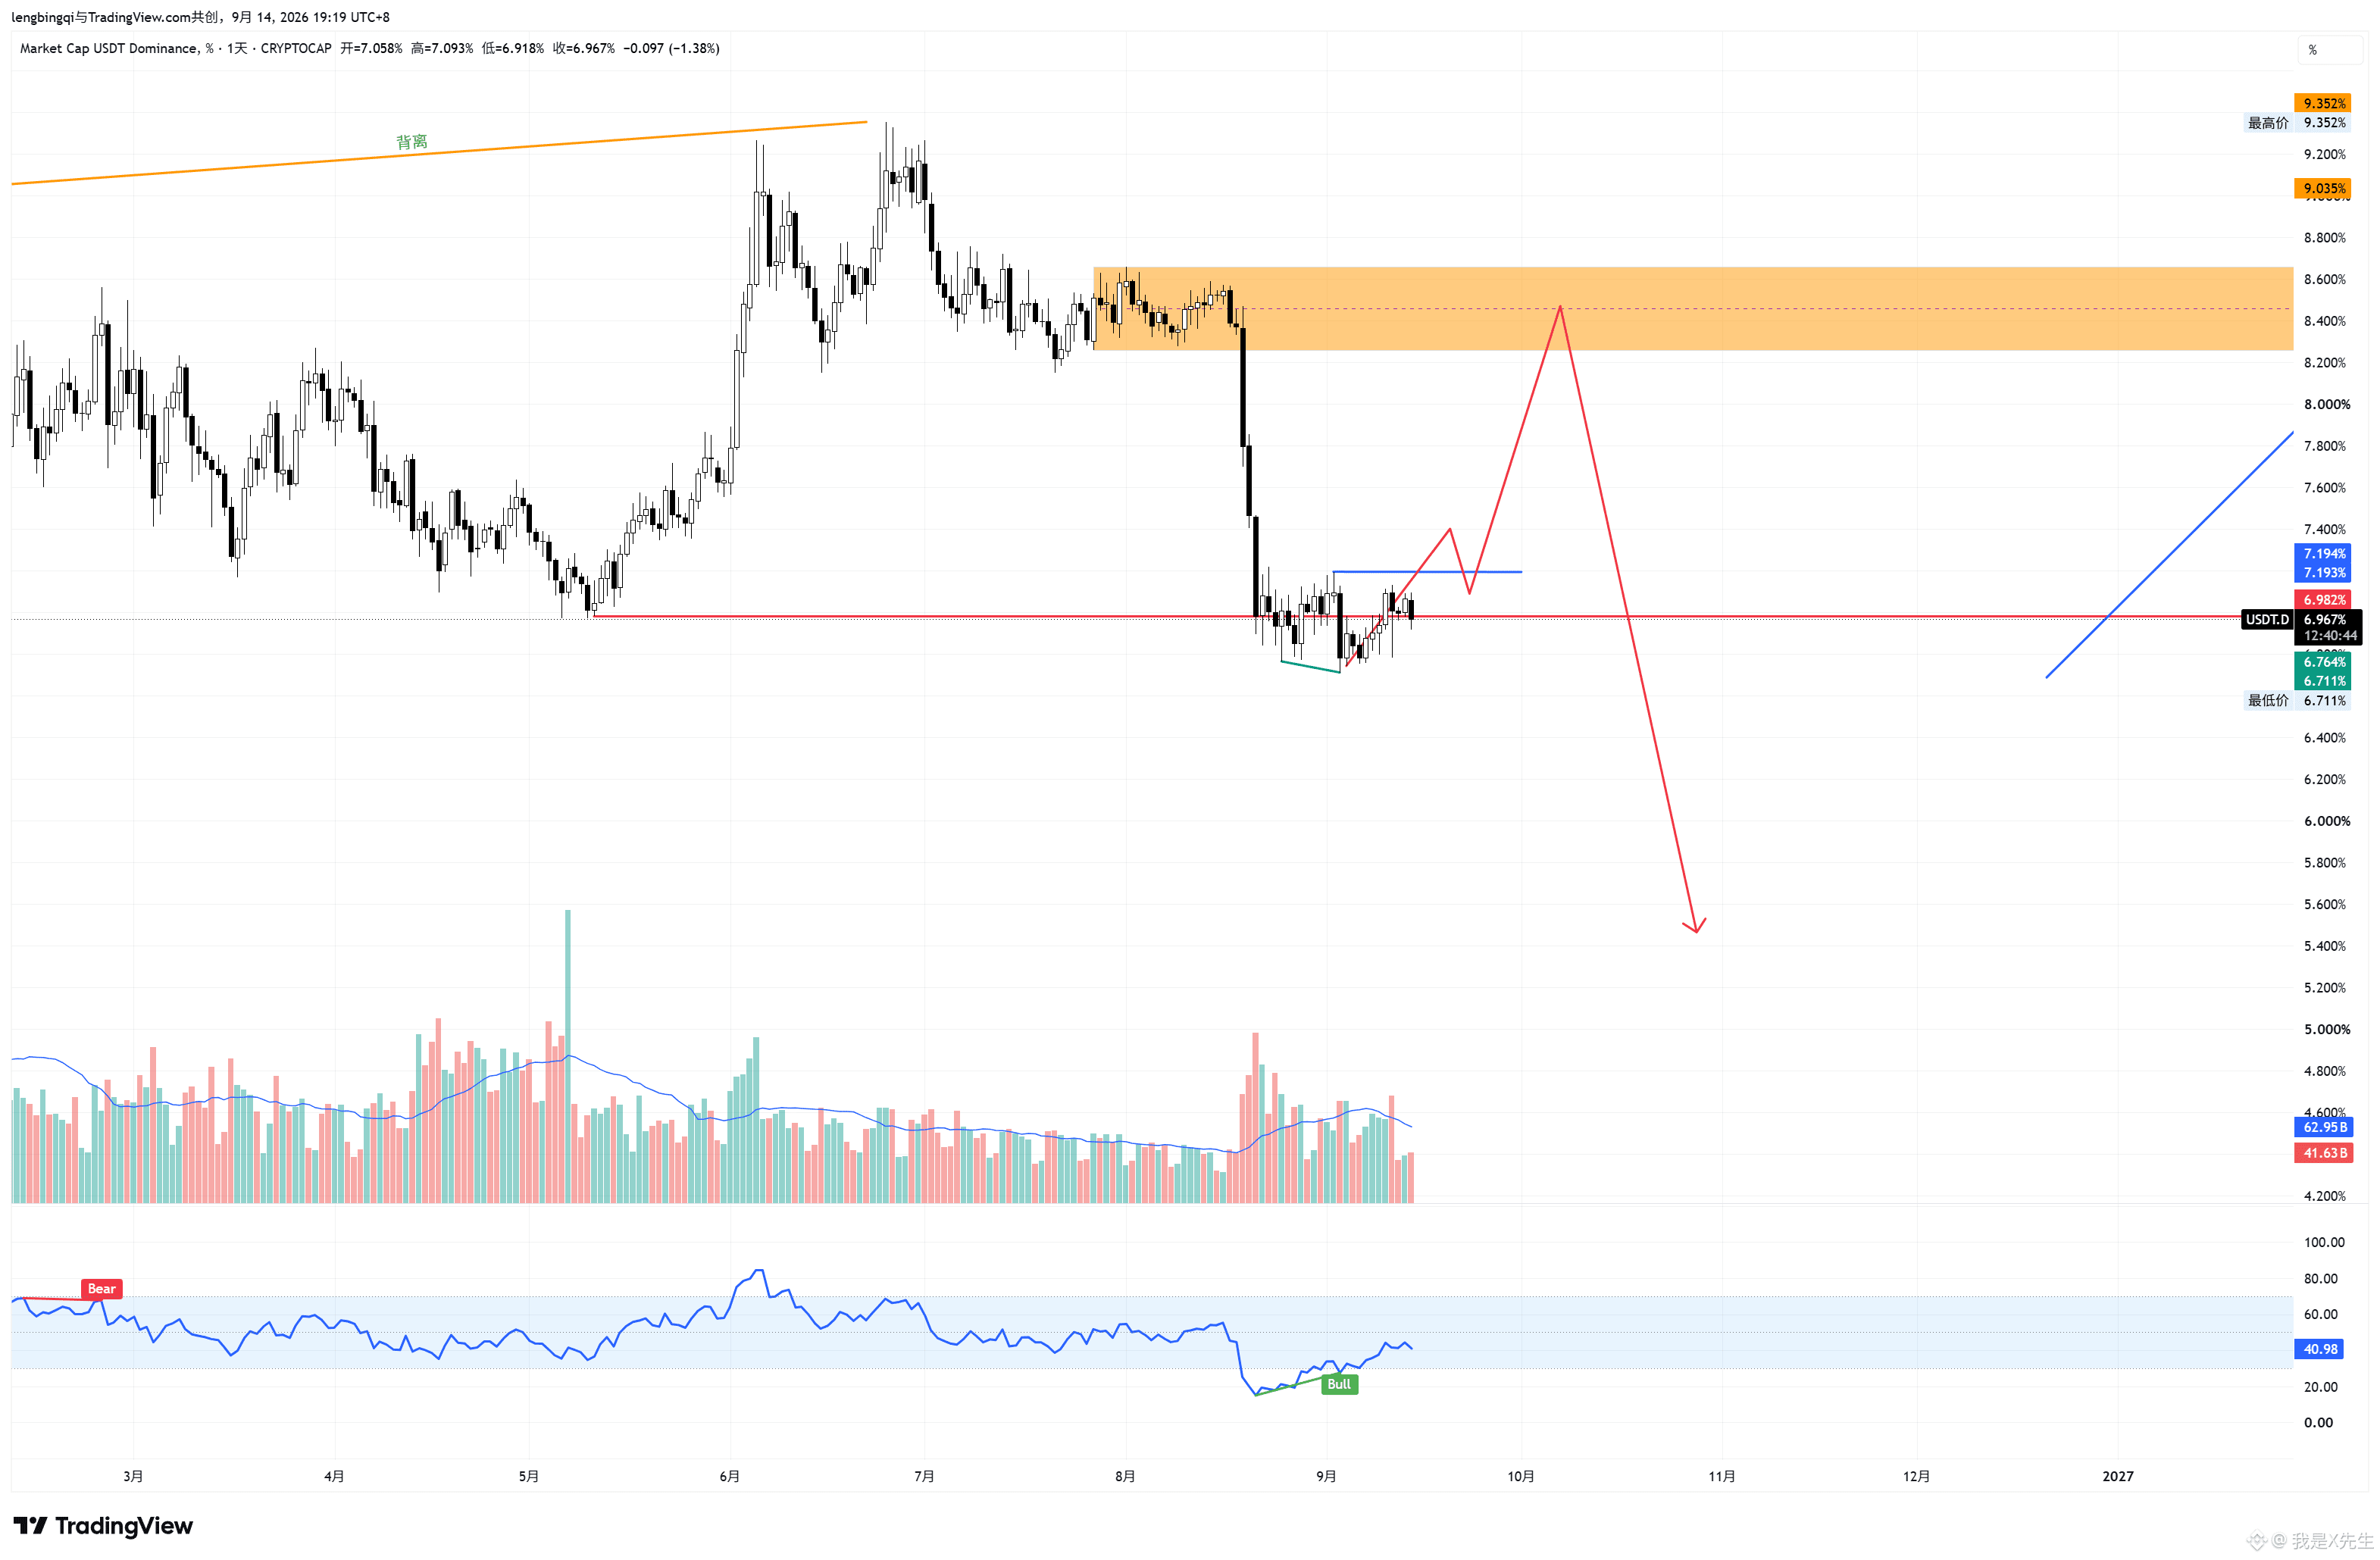
#USDT.D From USDT.P: Assessing the likelihood that the bear market is over
Figure 1: Weekly chart. Two swing highs formed near the previous high, creating a bearish divergence. Structurally, it also shows a weekly-level MSB. This can be interpreted as: the bear market has effectively ended! Of course, the end of the bear market does not mean Bitcoin won’t make new lows, but it is clear that from the current 82 level—or any new high this week (if there is one)—a further drop would be a correction, not a brand-new downturn. The difference lies in the depth of the correction.
Spot traders: your last opportunity to enter spot is about to come. Once the correction ends, BTC will rise quickly to around 90 and will not drop back below 82 again. You can refer to the earlier accumulation post: Bitcoin is currently in the “last sell-off” phase of the accumulation cycle, with panic selling already beginning to be absorbed.
Figure 2: Daily chart. A bullish divergence forms at the bottom. Break above the blue line confirms the formation of the bottom. Traders on the right side can wait for a retest and then short BTC.
#USDT.D From USDT.P: Assessing the likelihood that the bear market is over
Figure 1: Weekly chart. Two swing highs formed near the previous high, creating a bearish divergence. Structurally, it also shows a weekly-level MSB. This can be interpreted as: the bear market has effectively ended! Of course, the end of the bear market does not mean Bitcoin won’t make new lows, but it is clear that from the current 82 level—or any new high this week (if there is one)—a further drop would be a correction, not a brand-new downturn. The difference lies in the depth of the correction.
Spot traders: your last opportunity to enter spot is about to come. Once the correction ends, BTC will rise quickly to around 90 and will not drop back below 82 again. You can refer to the earlier accumulation post: Bitcoin is currently in the “last sell-off” phase of the accumulation cycle, with panic selling already beginning to be absorbed.
Figure 2: Daily chart. A bullish divergence forms at the bottom. Break above the blue line confirms the formation of the bottom. Traders on the right side can wait for a retest and then short BTC.
Figure 1: Weekly chart. Two swing highs formed near the previous high, creating a bearish divergence. Structurally, it also shows a weekly-level MSB. This can be interpreted as: the bear market has effectively ended! Of course, the end of the bear market does not mean Bitcoin won’t make new lows, but it is clear that from the current 82 level—or any new high this week (if there is one)—a further drop would be a correction, not a brand-new downturn. The difference lies in the depth of the correction.
Spot traders: your last opportunity to enter spot is about to come. Once the correction ends, BTC will rise quickly to around 90 and will not drop back below 82 again. You can refer to the earlier accumulation post: Bitcoin is currently in the “last sell-off” phase of the accumulation cycle, with panic selling already beginning to be absorbed.
Figure 2: Daily chart. A bullish divergence forms at the bottom. Break above the blue line confirms the formation of the bottom. Traders on the right side can wait for a retest and then short BTC.
1
225
·
--
Watching Bitcoin for now: the breakout stopped out the short position; go long on the pullback. If it drops, the short position profits.
Watching Bitcoin for now: the breakout stopped out the short position; go long on the pullback. If it drops, the short position profits.
208
·
--
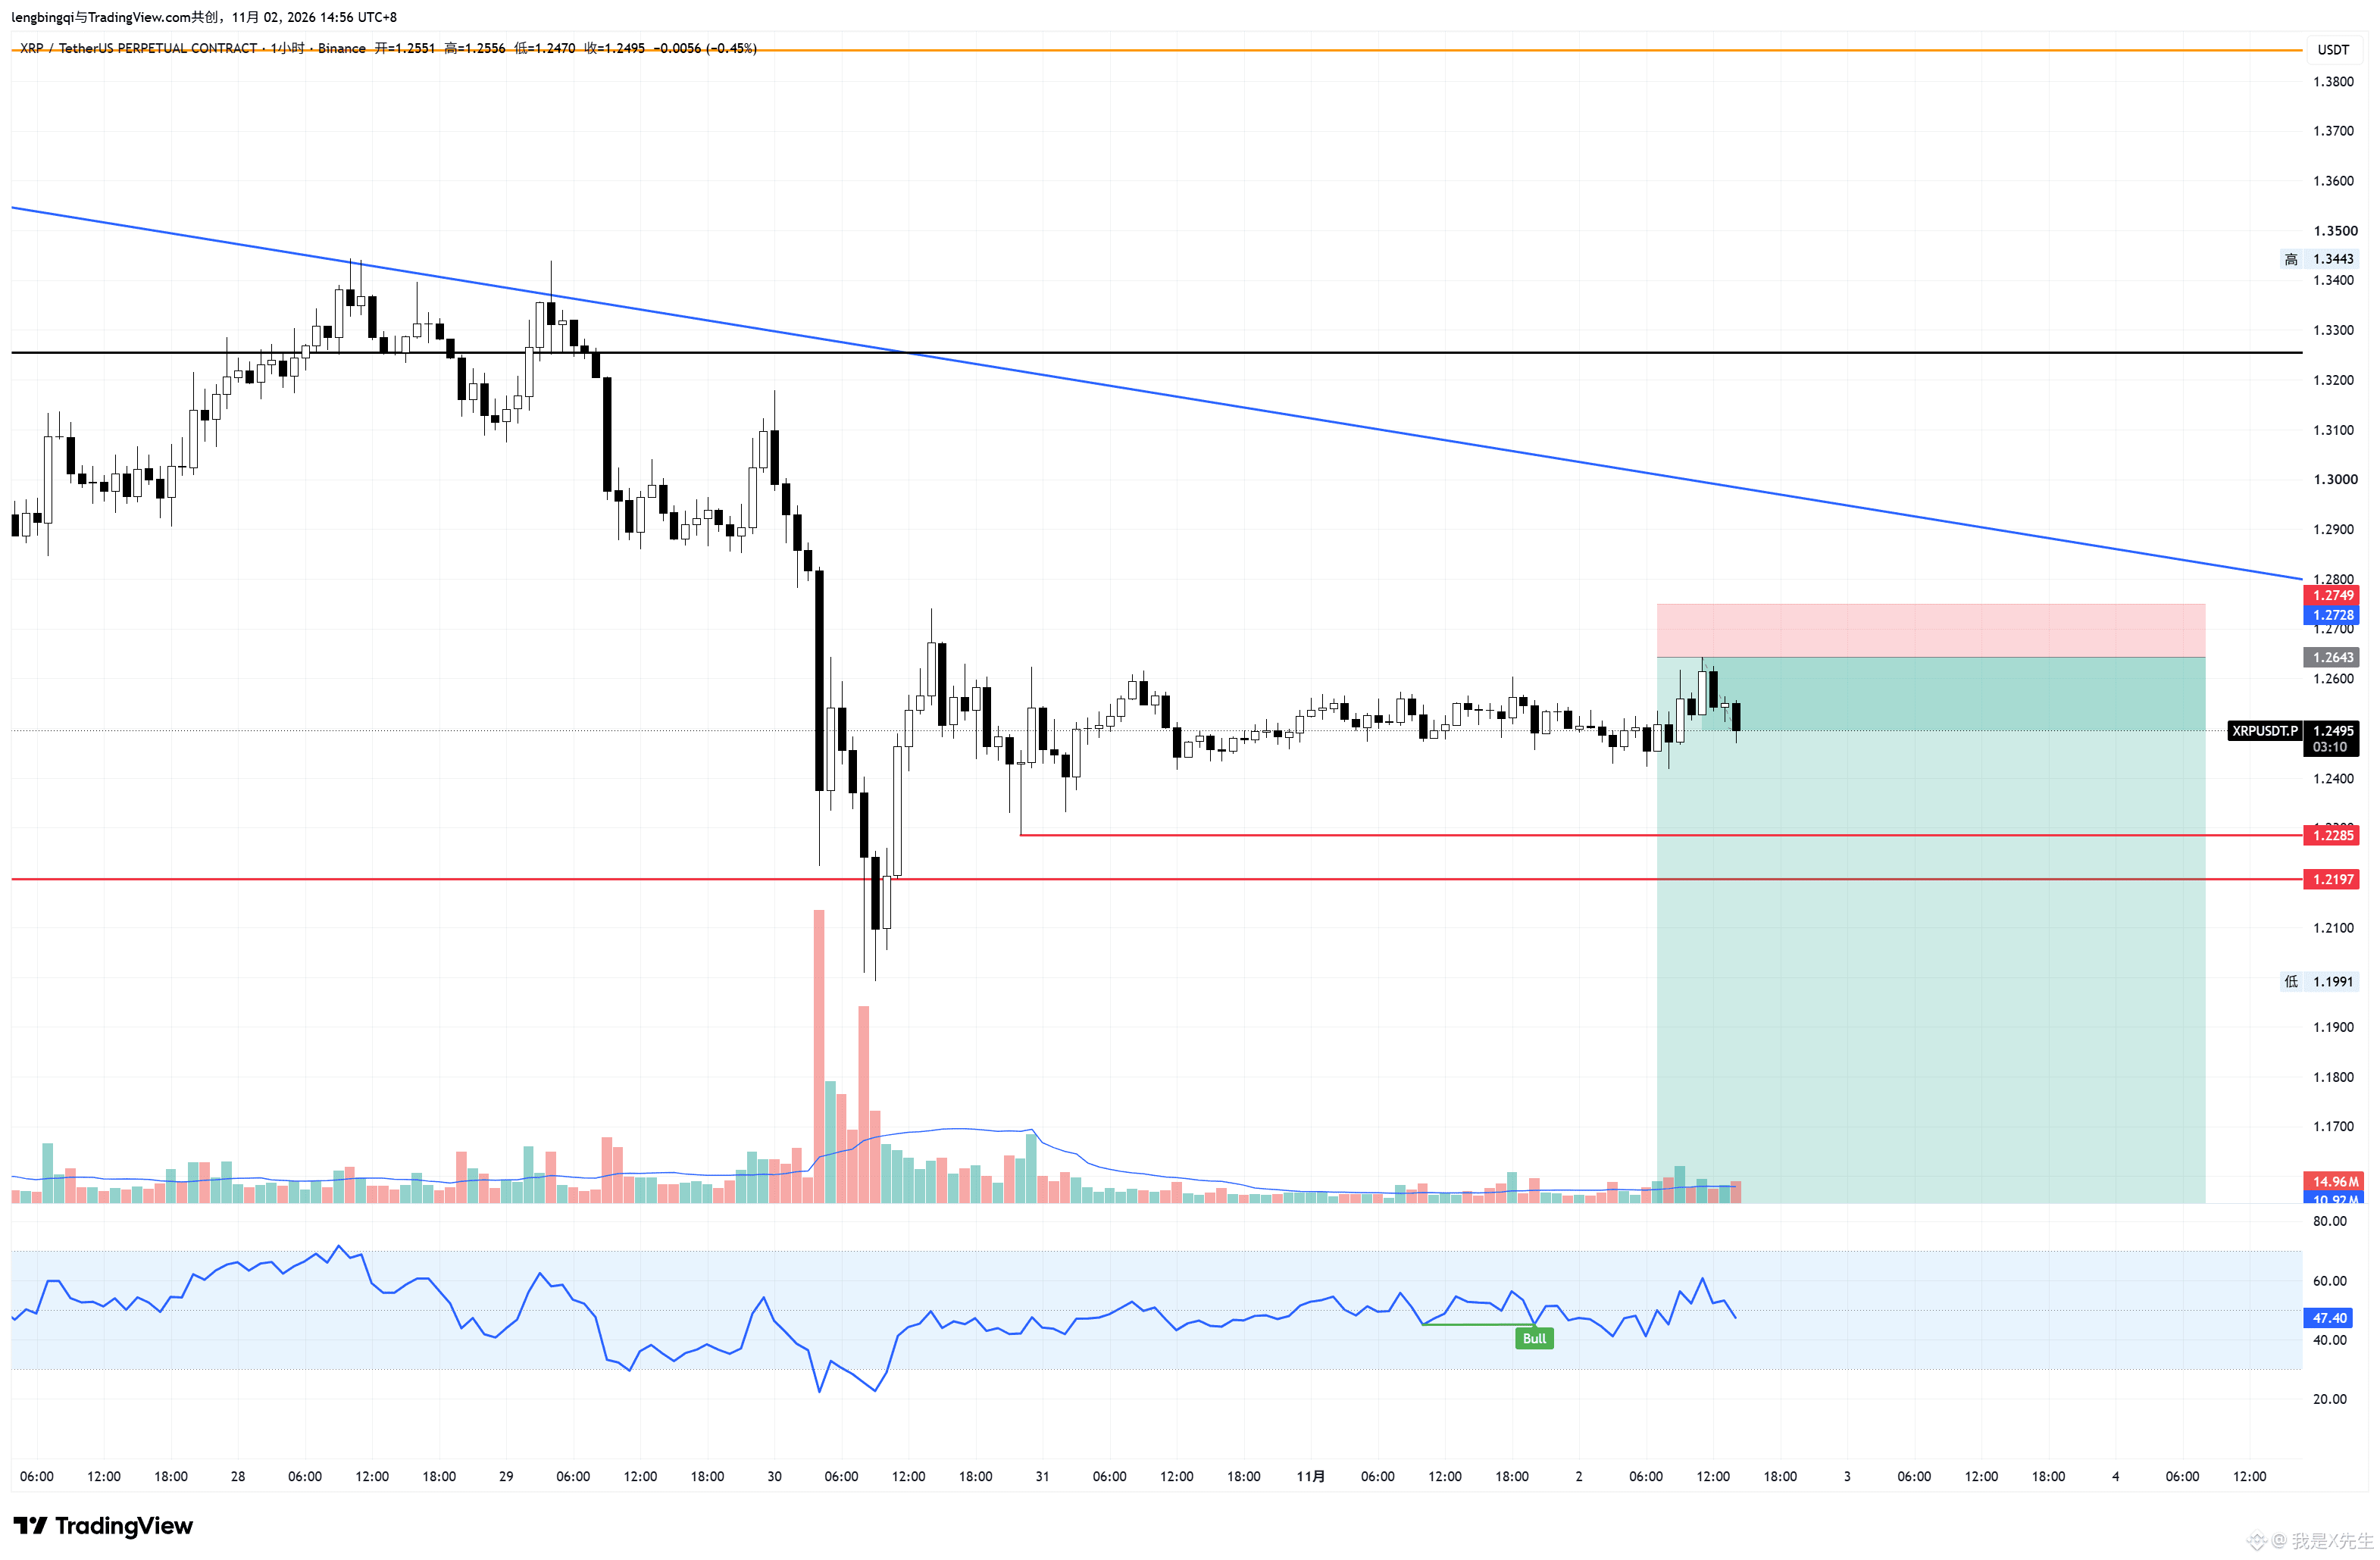
At $XRP ... Luck is sometimes part of making money. Let's see if we can get down.
At $XRP ... Luck is sometimes part of making money. Let's see if we can get down.
301
·
--
$ZEC is the best liquidity-harvesting guru! I reviewed it for a while—just wow! I won't post the picture; it was absolutely astonishing. Sometimes it even looks a lot like ETH, and the setup is more textbook than SOL's.
$ZEC is the best liquidity-harvesting guru! I reviewed it for a while—just wow! I won't post the picture; it was absolutely astonishing. Sometimes it even looks a lot like ETH, and the setup is more textbook than SOL's.
1
480
·
--
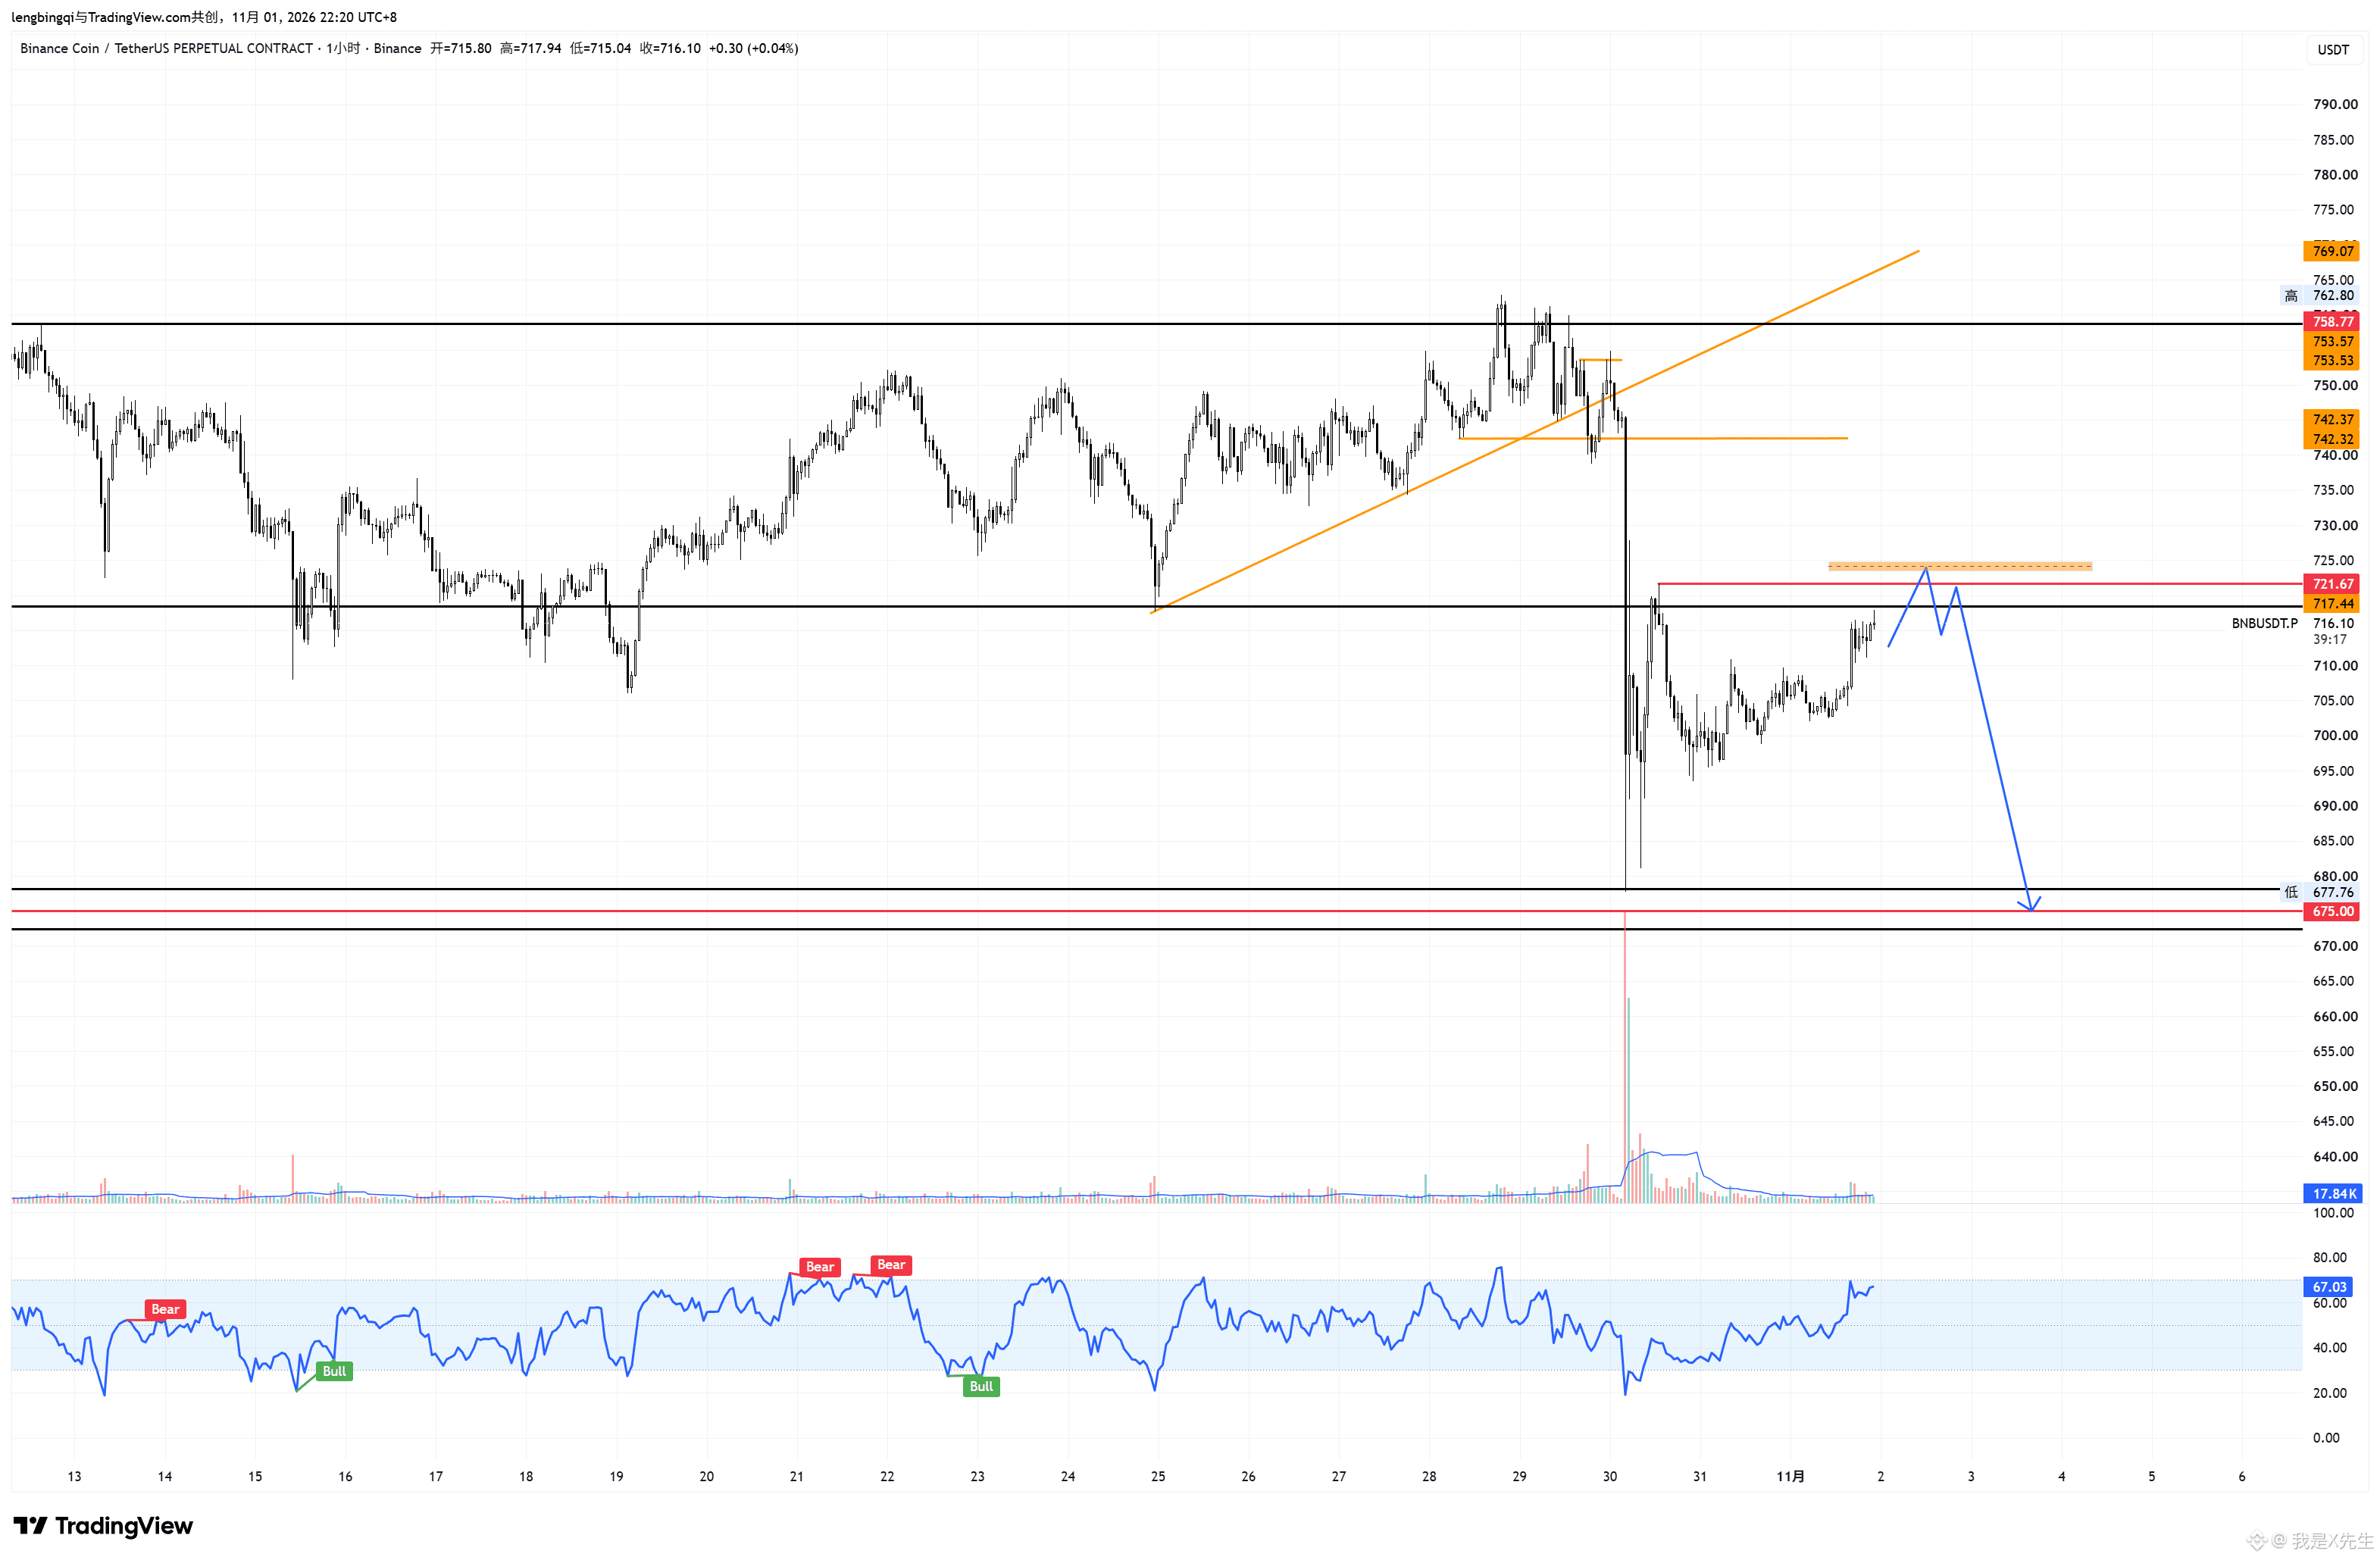
$BNB If it moves this way, I'll watch the CVD. If it meets expectations, I'll add to my short position; otherwise, if it breaks through, I'll take profit.
$BNB If it moves this way, I'll watch the CVD. If it meets expectations, I'll add to my short position; otherwise, if it breaks through, I'll take profit.
3
1
1.2k
·
--
$UNI
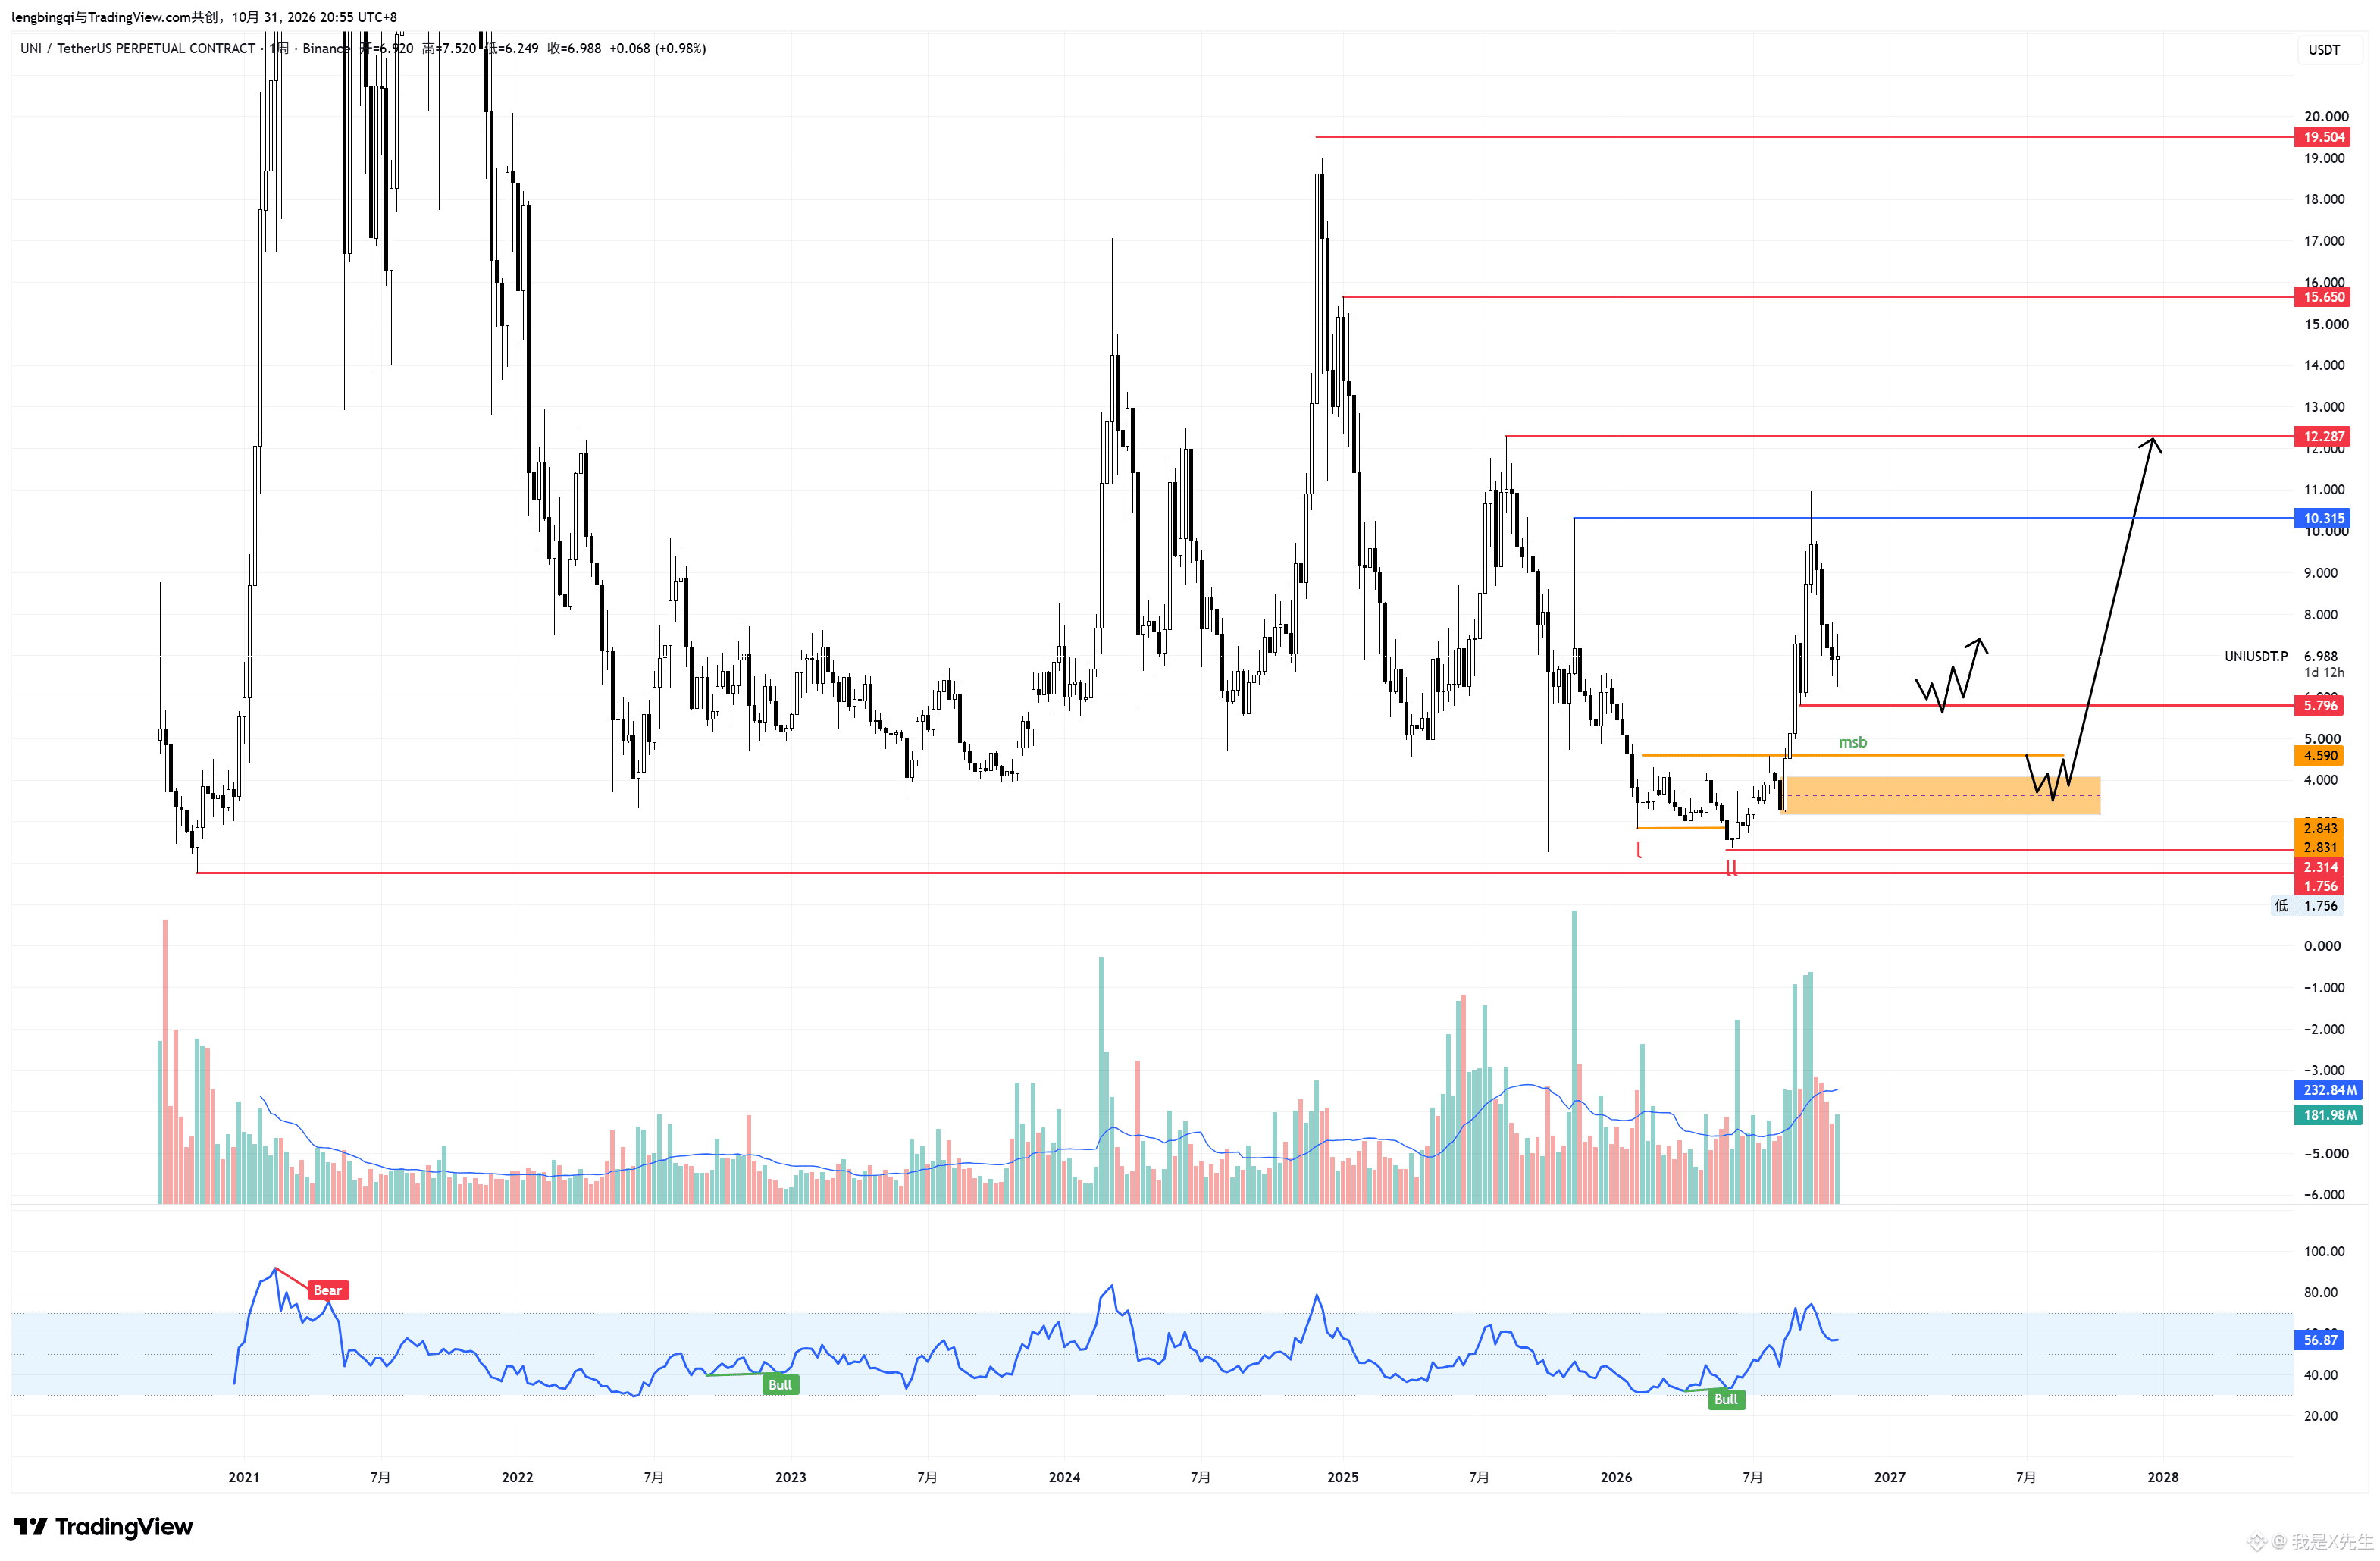
Figure 1) On the weekly chart, there was an MSB at the bottom, followed by a sharp rally. After sweeping the previous high at 10.315, price closed with a long upper wick. This means the target has been reached. The current decline is most likely a pullback; we need to find where it ends. The three targets above have already been marked. Support level 1 below: 5.796. If price sweeps this level and closes with a wick, while an MSB forms on the daily chart, the pullback may be over and a second rally could begin. If a weekly candle body breaks below it, price may drop to deeper support: there is a double-wick level at 4.395, as well as a bullish OB on the weekly chart. If that breaks, the outlook is very weak; this may not be a pullback but a renewed downtrend, with liquidity at 1.756 in view.
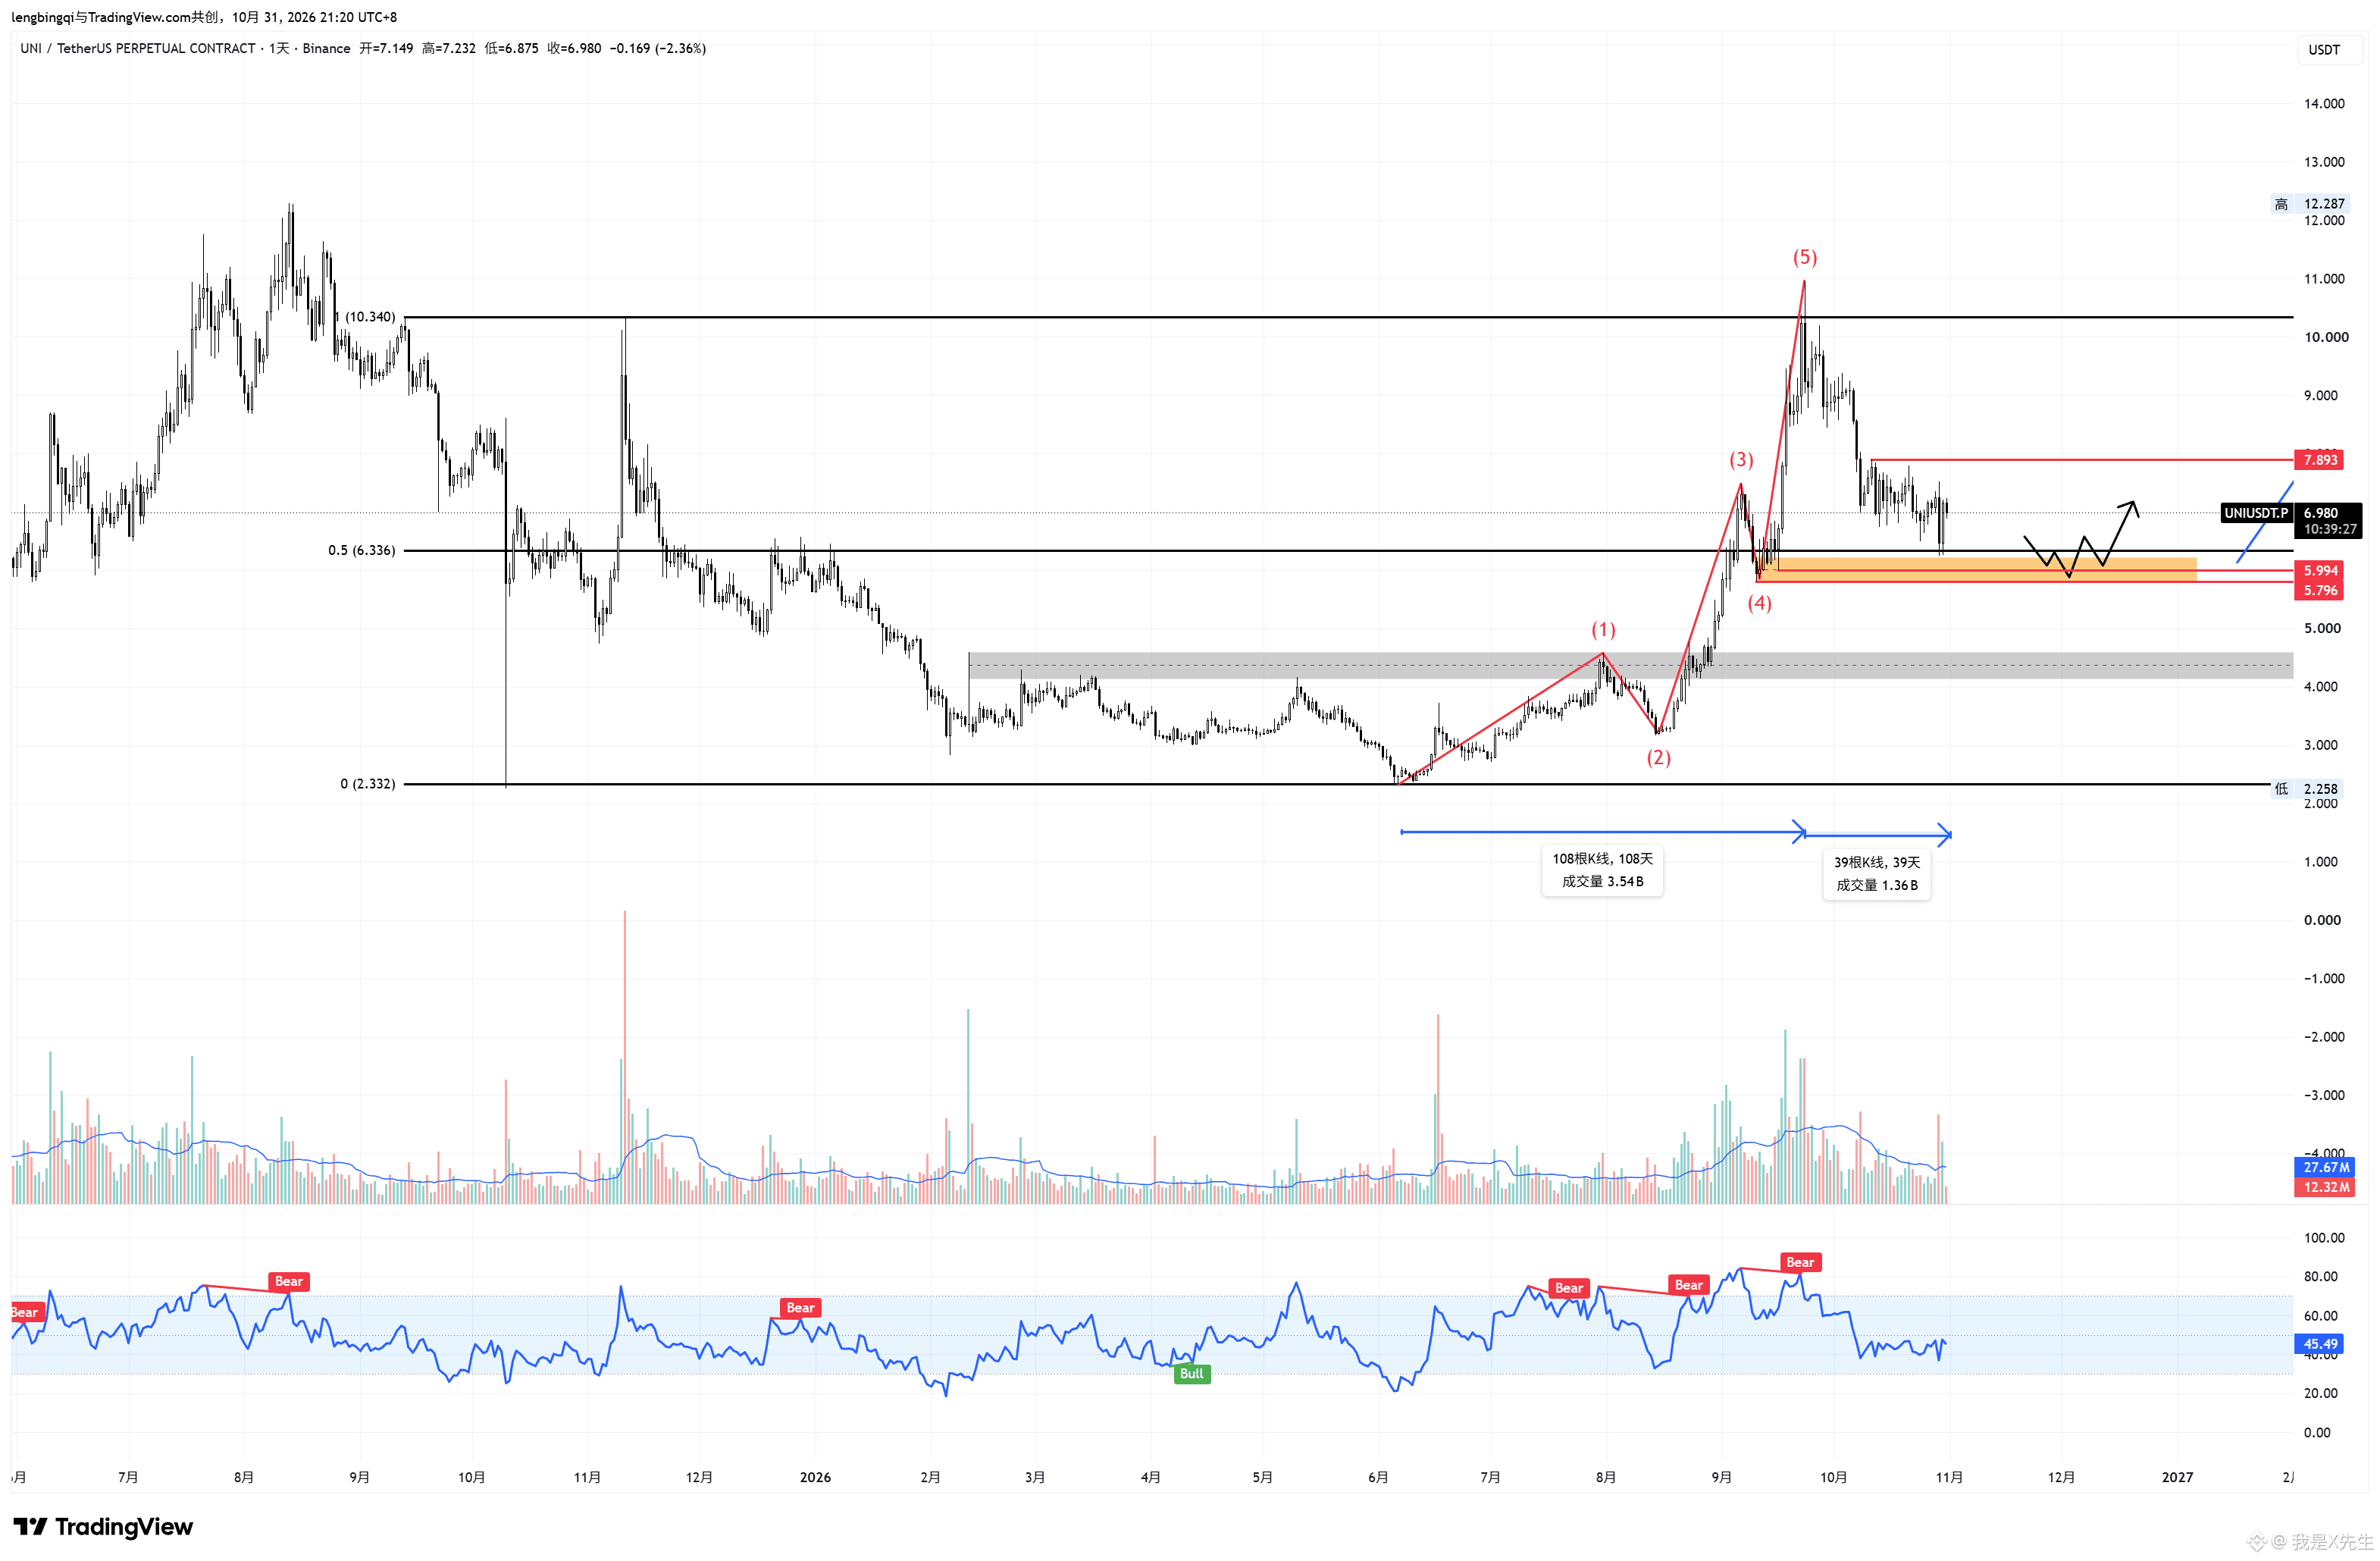
Figure 2) On the daily chart, the five-wave rally has ended and price is currently in a pullback. Structurally, it is now in the range's EQ (midline) area, where there is a bullish OB (yellow area). Don't buy straight away. Wait for a lower-timeframe structure break, then buy if price retests and fails to hold, aiming to catch a rebound. You can take profit gradually as price rises. The highest target is 7.893; if price breaks above it, you can hold. If a candle body breaks below 5.796, price will likely continue lower.
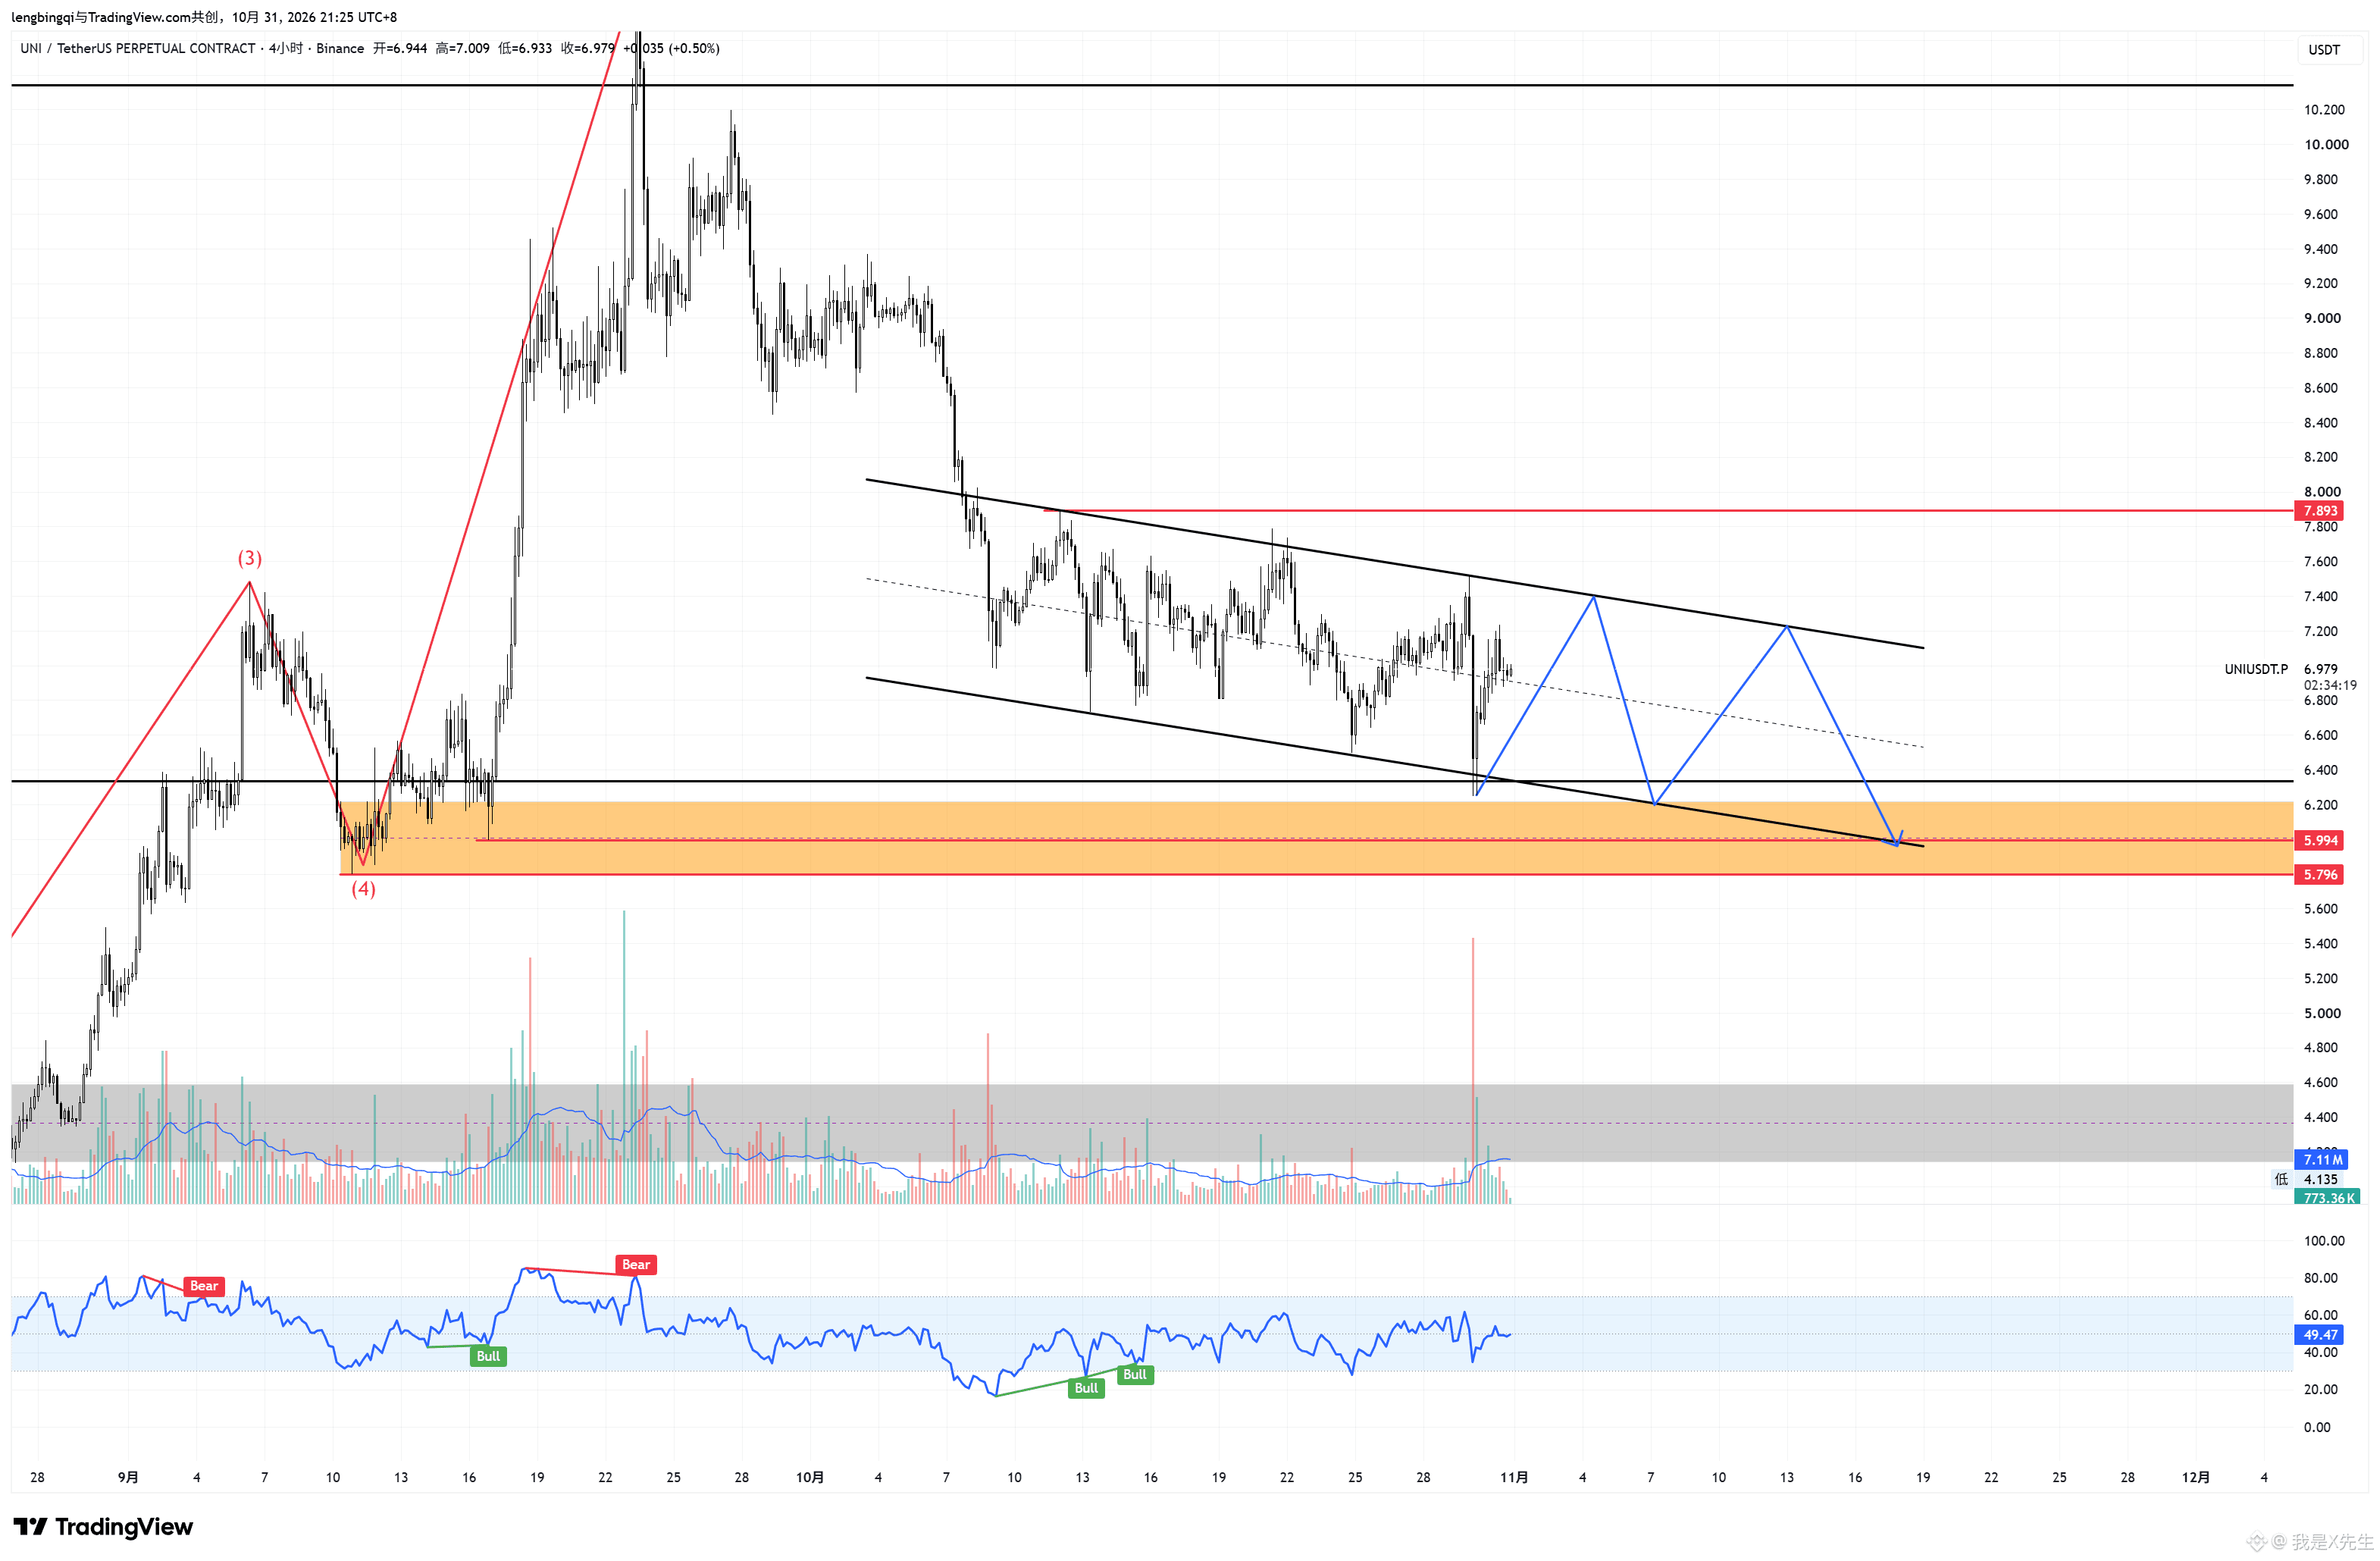
Figure 3) The 4H chart looks somewhat like a descending channel. You can use a small position to sell high and buy low in this range-bound market.
Altcoins are highly volatile, and none of the structures or reasoning is necessarily reliable. Always follow Bitcoin's price action when considering trading altcoins. Altcoins may only reach their bottoms once Bitcoin's pullback is complete. Most altcoins rise without any logic, and fall without any logic either. Manage your position size carefully. A few wins can add up; staying in the game is what gives you a chance.
$UNI
Figure 1) On the weekly chart, there was an MSB at the bottom, followed by a sharp rally. After sweeping the previous high at 10.315, price closed with a long upper wick. This means the target has been reached. The current decline is most likely a pullback; we need to find where it ends. The three targets above have already been marked. Support level 1 below: 5.796. If price sweeps this level and closes with a wick, while an MSB forms on the daily chart, the pullback may be over and a second rally could begin. If a weekly candle body breaks below it, price may drop to deeper support: there is a double-wick level at 4.395, as well as a bullish OB on the weekly chart. If that breaks, the outlook is very weak; this may not be a pullback but a renewed downtrend, with liquidity at 1.756 in view.
Figure 2) On the daily chart, the five-wave rally has ended and price is currently in a pullback. Structurally, it is now in the range's EQ (midline) area, where there is a bullish OB (yellow area). Don't buy straight away. Wait for a lower-timeframe structure break, then buy if price retests and fails to hold, aiming to catch a rebound. You can take profit gradually as price rises. The highest target is 7.893; if price breaks above it, you can hold. If a candle body breaks below 5.796, price will likely continue lower.
Figure 3) The 4H chart looks somewhat like a descending channel. You can use a small position to sell high and buy low in this range-bound market.
Altcoins are highly volatile, and none of the structures or reasoning is necessarily reliable. Always follow Bitcoin's price action when considering trading altcoins. Altcoins may only reach their bottoms once Bitcoin's pullback is complete. Most altcoins rise without any logic, and fall without any logic either. Manage your position size carefully. A few wins can add up; staying in the game is what gives you a chance.
Figure 1) On the weekly chart, there was an MSB at the bottom, followed by a sharp rally. After sweeping the previous high at 10.315, price closed with a long upper wick. This means the target has been reached. The current decline is most likely a pullback; we need to find where it ends. The three targets above have already been marked. Support level 1 below: 5.796. If price sweeps this level and closes with a wick, while an MSB forms on the daily chart, the pullback may be over and a second rally could begin. If a weekly candle body breaks below it, price may drop to deeper support: there is a double-wick level at 4.395, as well as a bullish OB on the weekly chart. If that breaks, the outlook is very weak; this may not be a pullback but a renewed downtrend, with liquidity at 1.756 in view.
Figure 2) On the daily chart, the five-wave rally has ended and price is currently in a pullback. Structurally, it is now in the range's EQ (midline) area, where there is a bullish OB (yellow area). Don't buy straight away. Wait for a lower-timeframe structure break, then buy if price retests and fails to hold, aiming to catch a rebound. You can take profit gradually as price rises. The highest target is 7.893; if price breaks above it, you can hold. If a candle body breaks below 5.796, price will likely continue lower.
Figure 3) The 4H chart looks somewhat like a descending channel. You can use a small position to sell high and buy low in this range-bound market.
Altcoins are highly volatile, and none of the structures or reasoning is necessarily reliable. Always follow Bitcoin's price action when considering trading altcoins. Altcoins may only reach their bottoms once Bitcoin's pullback is complete. Most altcoins rise without any logic, and fall without any logic either. Manage your position size carefully. A few wins can add up; staying in the game is what gives you a chance.
1
1
1
1.2k
·
--
$BTC 1 H-level Bollinger Bands are contracting. I think it’s more likely to go up first to take liquidity, then fall. Let’s take a gamble.
$BTC 1 H-level Bollinger Bands are contracting. I think it’s more likely to go up first to take liquidity, then fall. Let’s take a gamble.

我是X先生
·
--
I didn't dare... hahaha
4
358
·
--
I didn't dare... hahaha
I didn't dare... hahaha

我是X先生
·
--
$BTC is about to rebound and target liquidity around 80.
1
284
·
--
Solid insights—drop a like!!
First, a question: given the same black swan event, why does SOL seem stronger than Ethereum?
If you've thought about it, congratulations—you've learned to think critically.
There are two answers: first, black swan events affect different cryptocurrencies differently; second, market structure.
For the first point, you can check out analyses by other experts.
Let's focus on the second point: comparing charts 1 and 2, you can see that ETH's sharp rally happened without much consolidation. As a result, the current price range hasn't seen enough trading activity and is in a liquidity vacuum. The price rises quickly when pushed up, but there's also no strong support when it pulls back to this area. So Ethereum may be difficult to trade on the rebound over the next little while—there's no clear structure. SOL, however, has a clearer structure. For now, it's only swept the liquidity below the previous daily low. There are lots of stop-loss orders from people who went long earlier, and when the price reaches this area, it's easy to trigger a cascade of liquidations. That's why the drop can be so deep and liquidate so many positions. After shorts take profit and close their positions, there may be a seemingly “strong” rebound, but that doesn't mean spot buyers are stepping in. Spot buying is the key indicator of how far the price can go.
Now, a forecast of what might happen next: for ETH, as shown by the black line, I'd like to see a daily-timeframe rebound. If it reaches the OB above, look for a lower-timeframe structure break or spot distribution, then consider entering a short. The downside target is around the EQ at 1982 in the previous range. For SOL, it could be 103 or 109—we'll only know when it gets there. The key is still to watch Bitcoin.
This forecast is just a general overview of my thinking; it doesn't mean you should trade as soon as the price reaches those levels.
Solid insights—drop a like!!
First, a question: given the same black swan event, why does SOL seem stronger than Ethereum?
If you've thought about it, congratulations—you've learned to think critically.
There are two answers: first, black swan events affect different cryptocurrencies differently; second, market structure.
For the first point, you can check out analyses by other experts.
Let's focus on the second point: comparing charts 1 and 2, you can see that ETH's sharp rally happened without much consolidation. As a result, the current price range hasn't seen enough trading activity and is in a liquidity vacuum. The price rises quickly when pushed up, but there's also no strong support when it pulls back to this area. So Ethereum may be difficult to trade on the rebound over the next little while—there's no clear structure. SOL, however, has a clearer structure. For now, it's only swept the liquidity below the previous daily low. There are lots of stop-loss orders from people who went long earlier, and when the price reaches this area, it's easy to trigger a cascade of liquidations. That's why the drop can be so deep and liquidate so many positions. After shorts take profit and close their positions, there may be a seemingly “strong” rebound, but that doesn't mean spot buyers are stepping in. Spot buying is the key indicator of how far the price can go.
Now, a forecast of what might happen next: for ETH, as shown by the black line, I'd like to see a daily-timeframe rebound. If it reaches the OB above, look for a lower-timeframe structure break or spot distribution, then consider entering a short. The downside target is around the EQ at 1982 in the previous range. For SOL, it could be 103 or 109—we'll only know when it gets there. The key is still to watch Bitcoin.
This forecast is just a general overview of my thinking; it doesn't mean you should trade as soon as the price reaches those levels.
First, a question: given the same black swan event, why does SOL seem stronger than Ethereum?
If you've thought about it, congratulations—you've learned to think critically.
There are two answers: first, black swan events affect different cryptocurrencies differently; second, market structure.
For the first point, you can check out analyses by other experts.
Let's focus on the second point: comparing charts 1 and 2, you can see that ETH's sharp rally happened without much consolidation. As a result, the current price range hasn't seen enough trading activity and is in a liquidity vacuum. The price rises quickly when pushed up, but there's also no strong support when it pulls back to this area. So Ethereum may be difficult to trade on the rebound over the next little while—there's no clear structure. SOL, however, has a clearer structure. For now, it's only swept the liquidity below the previous daily low. There are lots of stop-loss orders from people who went long earlier, and when the price reaches this area, it's easy to trigger a cascade of liquidations. That's why the drop can be so deep and liquidate so many positions. After shorts take profit and close their positions, there may be a seemingly “strong” rebound, but that doesn't mean spot buyers are stepping in. Spot buying is the key indicator of how far the price can go.
Now, a forecast of what might happen next: for ETH, as shown by the black line, I'd like to see a daily-timeframe rebound. If it reaches the OB above, look for a lower-timeframe structure break or spot distribution, then consider entering a short. The downside target is around the EQ at 1982 in the previous range. For SOL, it could be 103 or 109—we'll only know when it gets there. The key is still to watch Bitcoin.
This forecast is just a general overview of my thinking; it doesn't mean you should trade as soon as the price reaches those levels.


3
660
·
--
$SOL The price isn't important; what matters is that SOL's old market makers are using almost exactly the same playbook.
$SOL The price isn't important; what matters is that SOL's old market makers are using almost exactly the same playbook.

438
·
--
$BTC is about to rebound and target liquidity around 80.
$BTC is about to rebound and target liquidity around 80.

4
1
1
537
·
--
$BNB gives you the frustrating feeling of a stock that rises in fits and starts, falls in a sluggish, sticky way, feels bloated and indecisive, and never drops decisively. It’s not a pleasant one to hold.
$BNB gives you the frustrating feeling of a stock that rises in fits and starts, falls in a sluggish, sticky way, feels bloated and indecisive, and never drops decisively. It’s not a pleasant one to hold.

1
1
288
·
--
$ETH 2222 Liquidity has been wiped out; for now, it's still an oversold rebound
$SOL as well; currently in an oversold rebound
$ETH 2222 Liquidity has been wiped out; for now, it's still an oversold rebound
$SOL as well; currently in an oversold rebound
$SOL as well; currently in an oversold rebound

2
1
551
·
--
Let's talk about U.S. stocks. The earnings impact hit right away, just like with Google, but I don't dare go long directly here. I did buy spot at a pretty good level, though. $INTC
Let's talk about U.S. stocks. The earnings impact hit right away, just like with Google, but I don't dare go long directly here. I did buy spot at a pretty good level, though. $INTC


1
1.8k
·
--
$BTC There's nothing you can do about a black swan event. I hesitated and didn't short, so I missed a move—but you can't really call it missing out, and I don't regret it.
For now, there's definitely no going long. One reason is the structure, and the other is sentiment. Going long would be like trying to catch a falling knife. We'll see how things look around 749. A V-shaped reversal is impossible; it'll definitely need to consolidate for a while.
$BNB It's almost there, but it hasn't been swept yet. For now, I'll hold and see how it goes.
$BTC There's nothing you can do about a black swan event. I hesitated and didn't short, so I missed a move—but you can't really call it missing out, and I don't regret it.
For now, there's definitely no going long. One reason is the structure, and the other is sentiment. Going long would be like trying to catch a falling knife. We'll see how things look around 749. A V-shaped reversal is impossible; it'll definitely need to consolidate for a while.
$BNB It's almost there, but it hasn't been swept yet. For now, I'll hold and see how it goes.
For now, there's definitely no going long. One reason is the structure, and the other is sentiment. Going long would be like trying to catch a falling knife. We'll see how things look around 749. A V-shaped reversal is impossible; it'll definitely need to consolidate for a while.
$BNB It's almost there, but it hasn't been swept yet. For now, I'll hold and see how it goes.


1
695
·
--
$BTC is fucking selling again—should I short or not? This choppy market is driving me crazy.
$BTC is fucking selling again—should I short or not? This choppy market is driving me crazy.

3
382
·
--
$PEPE is incomprehensible; it makes no sense at all.
$PEPE is incomprehensible; it makes no sense at all.

948
·
--
$BTC and usdt to the position before there is a chance to short
$BTC and usdt to the position before there is a chance to short

1
368
Log in to explore more content
Join global crypto users on Binance Square
⚡️ Get latest and useful information about crypto.
💬 Trusted by the world’s largest crypto exchange.
👍 Discover real insights from verified creators.
Email / Phone number
Trending Topics
BinanceWithdrawalScamWarning
45,324 views
678 Discussing
Binance Warns Users of Withdrawal Scams as Services Resume: It Will Never Charge Fees, Sell Queue Spots or Ask You to Move Funds to a “Vault”
Binance News
·15 Likes
·8.3k views
USMidtermElections
611,340 views
3,251 Discussing
USOctoberNFP-AreRateCutsStillPossible
51,767 views
550 Discussing