
Crypto慕白
8.4k Posts

Crypto慕白
Report
Block User
公众号:Crypto慕白 X :@mubai456 微博; Trader慕白
粉丝称呼我为大白,上涨中的巴菲特,下跌中的索罗斯说的就是大白
凭借精准的市场判断和稳健的操作风格,成为全能型交易高手,现货为主,合约为辅
大白一出手,即是你的极限

Level 1 Creator
241 Following
24.7K+ Followers
102.2K+ Liked
1 Badges
Posts
All
Quotes
Videos
Live
PINNED
·
--
Bullish
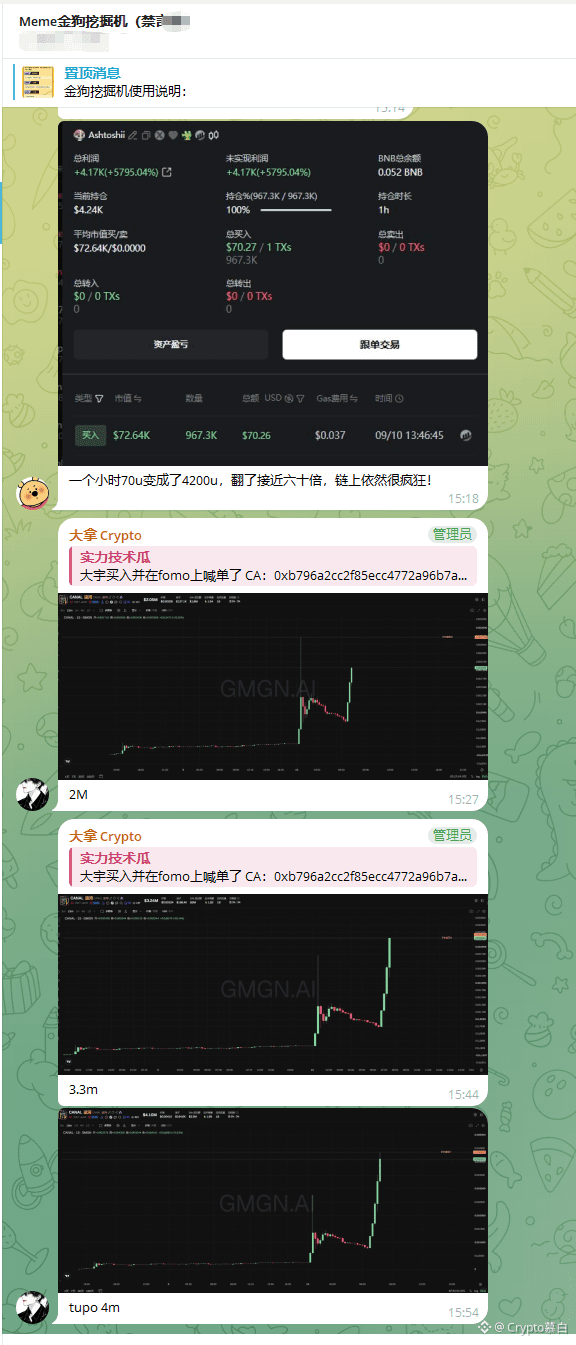
How about the big white’s latest laid-out big bull dog? If you keep up, you can say you can all get more than ten times returns
$4Stock , 7Stock, and also $PONS before that, ROBINCA, AI, etc.—all got multiple times more than that!
These are temporarily publicly available big bull dog passwords. Recently, Big White has also been constantly going after big bull dogs, and they’ve all been made public. Everyone has also seen the win rate. Recently, Big White Community came up with a very good big bull dog operation: Meme Bull Dog Excavator
The Meme Bull Dog Excavator is jointly built by multiple “p” commanders. We collect the best monitoring tools on the market, then do another 24-hour manual screening, directly pushing the most reliable information to you. At the same time, we use a single sentence to simply describe the narrative of this IP and provide a one-stop service for beginners to trade bull dogs.
Our monitoring includes: Fome Pump GMGN, the top-early profitable address activity, big car heads like Calm, Wang Xiaoe, Little Yellow Man—whatever these top players bought first, we have it from the first hand. Also included is monitoring of tweets from key marketers like Twitter (Elon Musk), CZ (Trump), and the founder of Robinhood, as well as on-chain big-pool monitoring, plus monitoring of Form and Flap launch pads for new pools, etc.
Playing meme information arbitrage is money. If your消息 is one step slower, then you might end up missing the chance and arriving for the tenfold run later than p’s little brother. There are many monitoring bots on the market, but ours is the first that can aggregate all messages and manually sort them, packaging the most useful information directly for you in one product.
We gather information from across the entire web. When the market is good, the messages we push may be a lot—so not every CA is a buy recommendation.
Monitoring messages: for reference only, no buy recommendations included.
Lottery: means high risk of being watered down, but the return can be very high for small-cap coins.
Big coin: generally refers to a medium baseline.
Strong buy: means a project with relatively higher certainty. But these projects also rise very quickly—so pay attention not to enter at too high a price and take profit promptly.
We move dynamically with the market’s direction; otherwise, if we miss the first-mover advantage, we also lose the chance to make money!
The on-chain market is very active right now. More and more big bull dogs are emerging from the Robinhood chain and the BSC chain—will you miss out?
#苹果发布首款折叠屏手机
How about the big white’s latest laid-out big bull dog? If you keep up, you can say you can all get more than ten times returns
$4Stock , 7Stock, and also $PONS before that, ROBINCA, AI, etc.—all got multiple times more than that!
These are temporarily publicly available big bull dog passwords. Recently, Big White has also been constantly going after big bull dogs, and they’ve all been made public. Everyone has also seen the win rate. Recently, Big White Community came up with a very good big bull dog operation: Meme Bull Dog Excavator
The Meme Bull Dog Excavator is jointly built by multiple “p” commanders. We collect the best monitoring tools on the market, then do another 24-hour manual screening, directly pushing the most reliable information to you. At the same time, we use a single sentence to simply describe the narrative of this IP and provide a one-stop service for beginners to trade bull dogs.
Our monitoring includes: Fome Pump GMGN, the top-early profitable address activity, big car heads like Calm, Wang Xiaoe, Little Yellow Man—whatever these top players bought first, we have it from the first hand. Also included is monitoring of tweets from key marketers like Twitter (Elon Musk), CZ (Trump), and the founder of Robinhood, as well as on-chain big-pool monitoring, plus monitoring of Form and Flap launch pads for new pools, etc.
Playing meme information arbitrage is money. If your消息 is one step slower, then you might end up missing the chance and arriving for the tenfold run later than p’s little brother. There are many monitoring bots on the market, but ours is the first that can aggregate all messages and manually sort them, packaging the most useful information directly for you in one product.
We gather information from across the entire web. When the market is good, the messages we push may be a lot—so not every CA is a buy recommendation.
Monitoring messages: for reference only, no buy recommendations included.
Lottery: means high risk of being watered down, but the return can be very high for small-cap coins.
Big coin: generally refers to a medium baseline.
Strong buy: means a project with relatively higher certainty. But these projects also rise very quickly—so pay attention not to enter at too high a price and take profit promptly.
We move dynamically with the market’s direction; otherwise, if we miss the first-mover advantage, we also lose the chance to make money!
The on-chain market is very active right now. More and more big bull dogs are emerging from the Robinhood chain and the BSC chain—will you miss out?
#苹果发布首款折叠屏手机
$4Stock , 7Stock, and also $PONS before that, ROBINCA, AI, etc.—all got multiple times more than that!
These are temporarily publicly available big bull dog passwords. Recently, Big White has also been constantly going after big bull dogs, and they’ve all been made public. Everyone has also seen the win rate. Recently, Big White Community came up with a very good big bull dog operation: Meme Bull Dog Excavator
The Meme Bull Dog Excavator is jointly built by multiple “p” commanders. We collect the best monitoring tools on the market, then do another 24-hour manual screening, directly pushing the most reliable information to you. At the same time, we use a single sentence to simply describe the narrative of this IP and provide a one-stop service for beginners to trade bull dogs.
Our monitoring includes: Fome Pump GMGN, the top-early profitable address activity, big car heads like Calm, Wang Xiaoe, Little Yellow Man—whatever these top players bought first, we have it from the first hand. Also included is monitoring of tweets from key marketers like Twitter (Elon Musk), CZ (Trump), and the founder of Robinhood, as well as on-chain big-pool monitoring, plus monitoring of Form and Flap launch pads for new pools, etc.
Playing meme information arbitrage is money. If your消息 is one step slower, then you might end up missing the chance and arriving for the tenfold run later than p’s little brother. There are many monitoring bots on the market, but ours is the first that can aggregate all messages and manually sort them, packaging the most useful information directly for you in one product.
We gather information from across the entire web. When the market is good, the messages we push may be a lot—so not every CA is a buy recommendation.
Monitoring messages: for reference only, no buy recommendations included.
Lottery: means high risk of being watered down, but the return can be very high for small-cap coins.
Big coin: generally refers to a medium baseline.
Strong buy: means a project with relatively higher certainty. But these projects also rise very quickly—so pay attention not to enter at too high a price and take profit promptly.
We move dynamically with the market’s direction; otherwise, if we miss the first-mover advantage, we also lose the chance to make money!
The on-chain market is very active right now. More and more big bull dogs are emerging from the Robinhood chain and the BSC chain—will you miss out?
#苹果发布首款折叠屏手机



8
11
2.1k
PINNED
·
--
Bullish
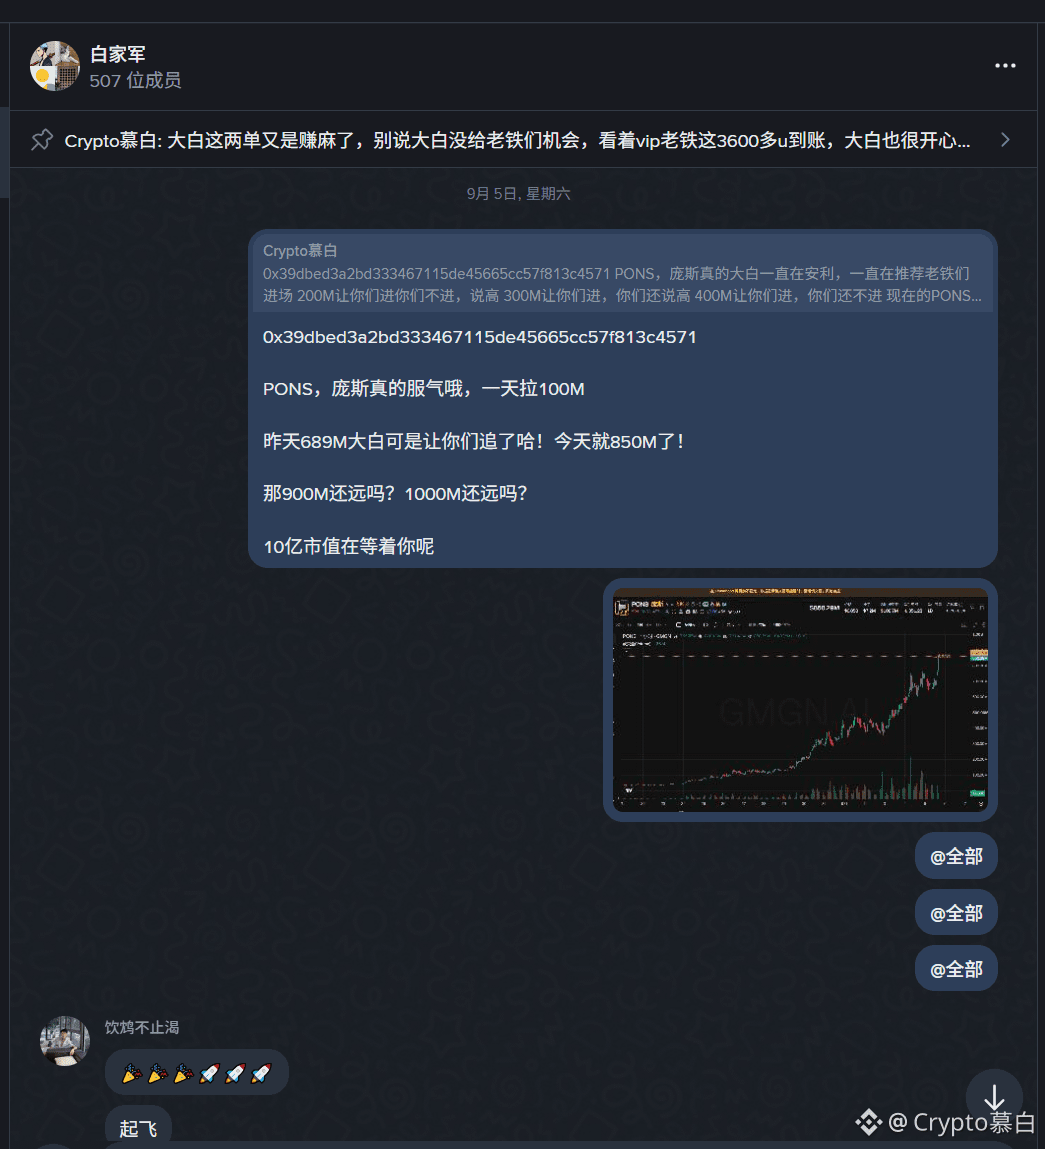
Come join Binance’s Bai Army and hunt for big on-chain gems!
Big gems across all kinds of chains: Robinhood Chain, BSC, SOL, ETH, X Chain, and more!
Some of the big gems we’ve already found include PONS, AI, Niulai, MarsCoin, BONER, Shiba Bro, ROBINCAT, and Biyou, and many more!!!
If you love hunting for big gems, come join us!
[币安白家军](https://app.binance.com/uni-qr/2TJvR1Pk)
Come join Binance’s Bai Army and hunt for big on-chain gems!
Big gems across all kinds of chains: Robinhood Chain, BSC, SOL, ETH, X Chain, and more!
Some of the big gems we’ve already found include PONS, AI, Niulai, MarsCoin, BONER, Shiba Bro, ROBINCAT, and Biyou, and many more!!!
If you love hunting for big gems, come join us!
币安白家军
Big gems across all kinds of chains: Robinhood Chain, BSC, SOL, ETH, X Chain, and more!
Some of the big gems we’ve already found include PONS, AI, Niulai, MarsCoin, BONER, Shiba Bro, ROBINCAT, and Biyou, and many more!!!
If you love hunting for big gems, come join us!
币安白家军

Crypto慕白
·
--
Bullish0xe9337dde3dd9e97f1f45a56412767ce5098e7777
Many coins have already gone live on Alpha. With a supply of 4.55M coins, is there still a chance to get in?
It’s a pity you didn’t join when it was at its hottest. If you get in now, you can catch up with the pace.
#IMF称萨尔瓦多购币未用公共资金
Many coins have already gone live on Alpha. With a supply of 4.55M coins, is there still a chance to get in?
It’s a pity you didn’t join when it was at its hottest. If you get in now, you can catch up with the pace.
#IMF称萨尔瓦多购币未用公共资金
3
1.2k
·
--
Bearish
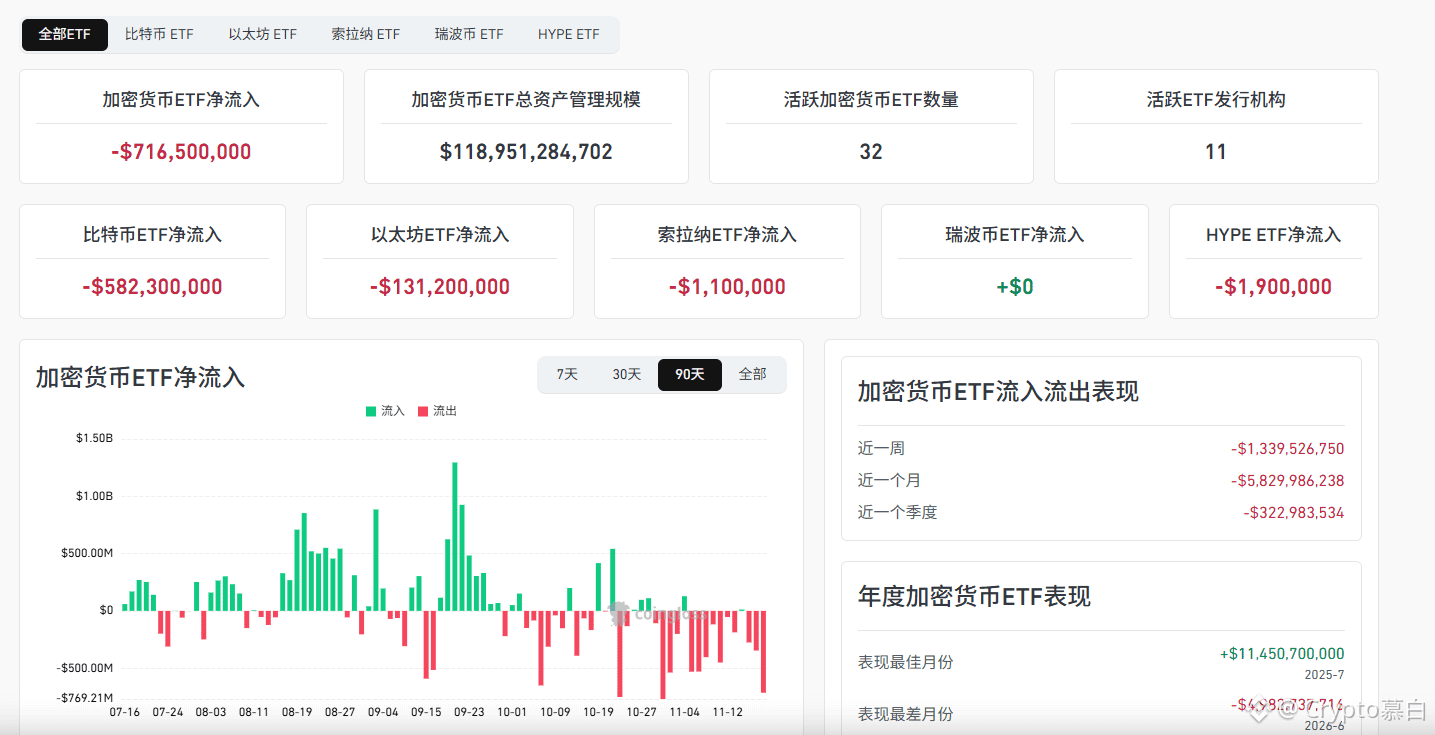
ETF funds are still fleeing
And this time, $BTC and $ETH are fleeing together
Yesterday’s U.S. spot ETFs:
Bitcoin saw net outflows of $582.3 million, marking three consecutive trading days of large outflows;
Ethereum saw net outflows of $131.2 million, marking four consecutive trading days of outflows.
This didn’t happen all of a sudden in a single day. Since the end of October, ETFs have repeatedly seen consecutive days of withdrawals.
On October 31, BTC had net outflows of $643.2 million, while ETH was on its fifth consecutive day of outflows;
On November 3, BTC saw large outflows for a second consecutive day, while ETH was on its sixth. This current wave is a continuation of the same round of withdrawals.
The shift in the pattern is even more noteworthy. On September 12 and October 24, there were instances of ETH inflows against the trend while BTC alone saw outflows;
Since the end of October, both have shifted to synchronized net outflows—the withdrawals have spread from BTC to ETH.
A closer look: BTC’s single-day outflow of $582.3 million is its largest since the $643.2 million outflow on October 31;
But ETH has now seen outflows for one more consecutive day. BTC outflows are more concentrated, while ETH withdrawals are more persistent.
#加息预期叠加美股分流,比特币跌破6.2万美元
ETF funds are still fleeing
And this time, $BTC and $ETH are fleeing together
Yesterday’s U.S. spot ETFs:
Bitcoin saw net outflows of $582.3 million, marking three consecutive trading days of large outflows;
Ethereum saw net outflows of $131.2 million, marking four consecutive trading days of outflows.
This didn’t happen all of a sudden in a single day. Since the end of October, ETFs have repeatedly seen consecutive days of withdrawals.
On October 31, BTC had net outflows of $643.2 million, while ETH was on its fifth consecutive day of outflows;
On November 3, BTC saw large outflows for a second consecutive day, while ETH was on its sixth. This current wave is a continuation of the same round of withdrawals.
The shift in the pattern is even more noteworthy. On September 12 and October 24, there were instances of ETH inflows against the trend while BTC alone saw outflows;
Since the end of October, both have shifted to synchronized net outflows—the withdrawals have spread from BTC to ETH.
A closer look: BTC’s single-day outflow of $582.3 million is its largest since the $643.2 million outflow on October 31;
But ETH has now seen outflows for one more consecutive day. BTC outflows are more concentrated, while ETH withdrawals are more persistent.
#加息预期叠加美股分流,比特币跌破6.2万美元
And this time, $BTC and $ETH are fleeing together
Yesterday’s U.S. spot ETFs:
Bitcoin saw net outflows of $582.3 million, marking three consecutive trading days of large outflows;
Ethereum saw net outflows of $131.2 million, marking four consecutive trading days of outflows.
This didn’t happen all of a sudden in a single day. Since the end of October, ETFs have repeatedly seen consecutive days of withdrawals.
On October 31, BTC had net outflows of $643.2 million, while ETH was on its fifth consecutive day of outflows;
On November 3, BTC saw large outflows for a second consecutive day, while ETH was on its sixth. This current wave is a continuation of the same round of withdrawals.
The shift in the pattern is even more noteworthy. On September 12 and October 24, there were instances of ETH inflows against the trend while BTC alone saw outflows;
Since the end of October, both have shifted to synchronized net outflows—the withdrawals have spread from BTC to ETH.
A closer look: BTC’s single-day outflow of $582.3 million is its largest since the $643.2 million outflow on October 31;
But ETH has now seen outflows for one more consecutive day. BTC outflows are more concentrated, while ETH withdrawals are more persistent.
#加息预期叠加美股分流,比特币跌破6.2万美元
2
2.5k
·
--
Bearish
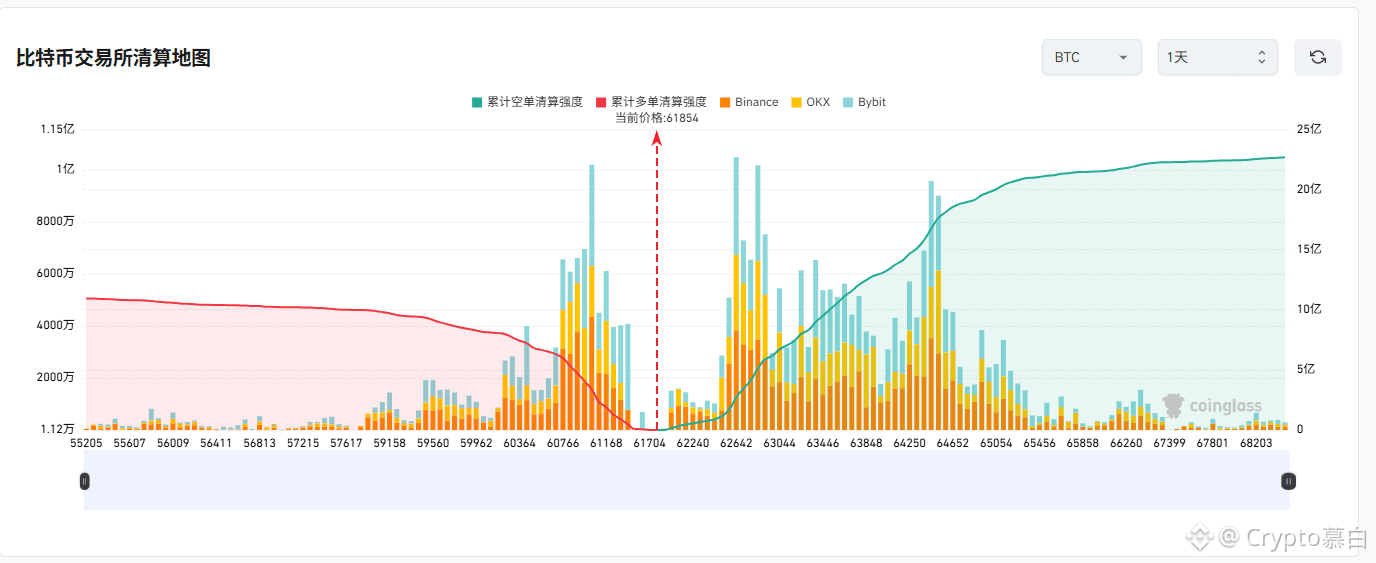
$BTC 's liquidation concentration
has shifted down to the 60,000 level
There are now two key levels:
Below 60,000, cumulative liquidation intensity for long positions on major CEXs is $781 million.
Above 63,000, cumulative liquidation intensity for short positions is $622 million.
Leverage is slightly more concentrated on the long side. The 60,000 level has shifted from “support” to a liquidation battleground for longs and shorts.
But compared with six months ago, the liquidation risks on both sides have diminished.
At the same thresholds in June 2026, liquidation intensity for long and short positions was $1.064 billion and $1.243 billion, respectively.
Now, one is $781 million and the other $622 million—showing that the previous decline had already flushed out some leverage.
If the price really breaks below 60,000, the fuel for a deleveraging cascade will be weaker than it was six months ago.
Now look at the price range: in June 2025, the liquidation map was still centered around 103,000–106,000. Today, the concentration has shifted down to 60,000–63,000. The center has reset: 60,000 is no longer reliable support, but a liquidation battleground.
#加息预期叠加美股分流,比特币跌破6.2万美元
{future}(BTCUSDT)
$BTC 's liquidation concentration
has shifted down to the 60,000 level
There are now two key levels:
Below 60,000, cumulative liquidation intensity for long positions on major CEXs is $781 million.
Above 63,000, cumulative liquidation intensity for short positions is $622 million.
Leverage is slightly more concentrated on the long side. The 60,000 level has shifted from “support” to a liquidation battleground for longs and shorts.
But compared with six months ago, the liquidation risks on both sides have diminished.
At the same thresholds in June 2026, liquidation intensity for long and short positions was $1.064 billion and $1.243 billion, respectively.
Now, one is $781 million and the other $622 million—showing that the previous decline had already flushed out some leverage.
If the price really breaks below 60,000, the fuel for a deleveraging cascade will be weaker than it was six months ago.
Now look at the price range: in June 2025, the liquidation map was still centered around 103,000–106,000. Today, the concentration has shifted down to 60,000–63,000. The center has reset: 60,000 is no longer reliable support, but a liquidation battleground.
#加息预期叠加美股分流,比特币跌破6.2万美元
has shifted down to the 60,000 level
There are now two key levels:
Below 60,000, cumulative liquidation intensity for long positions on major CEXs is $781 million.
Above 63,000, cumulative liquidation intensity for short positions is $622 million.
Leverage is slightly more concentrated on the long side. The 60,000 level has shifted from “support” to a liquidation battleground for longs and shorts.
But compared with six months ago, the liquidation risks on both sides have diminished.
At the same thresholds in June 2026, liquidation intensity for long and short positions was $1.064 billion and $1.243 billion, respectively.
Now, one is $781 million and the other $622 million—showing that the previous decline had already flushed out some leverage.
If the price really breaks below 60,000, the fuel for a deleveraging cascade will be weaker than it was six months ago.
Now look at the price range: in June 2025, the liquidation map was still centered around 103,000–106,000. Today, the concentration has shifted down to 60,000–63,000. The center has reset: 60,000 is no longer reliable support, but a liquidation battleground.
#加息预期叠加美股分流,比特币跌破6.2万美元
1.2k
·
--
Bearish
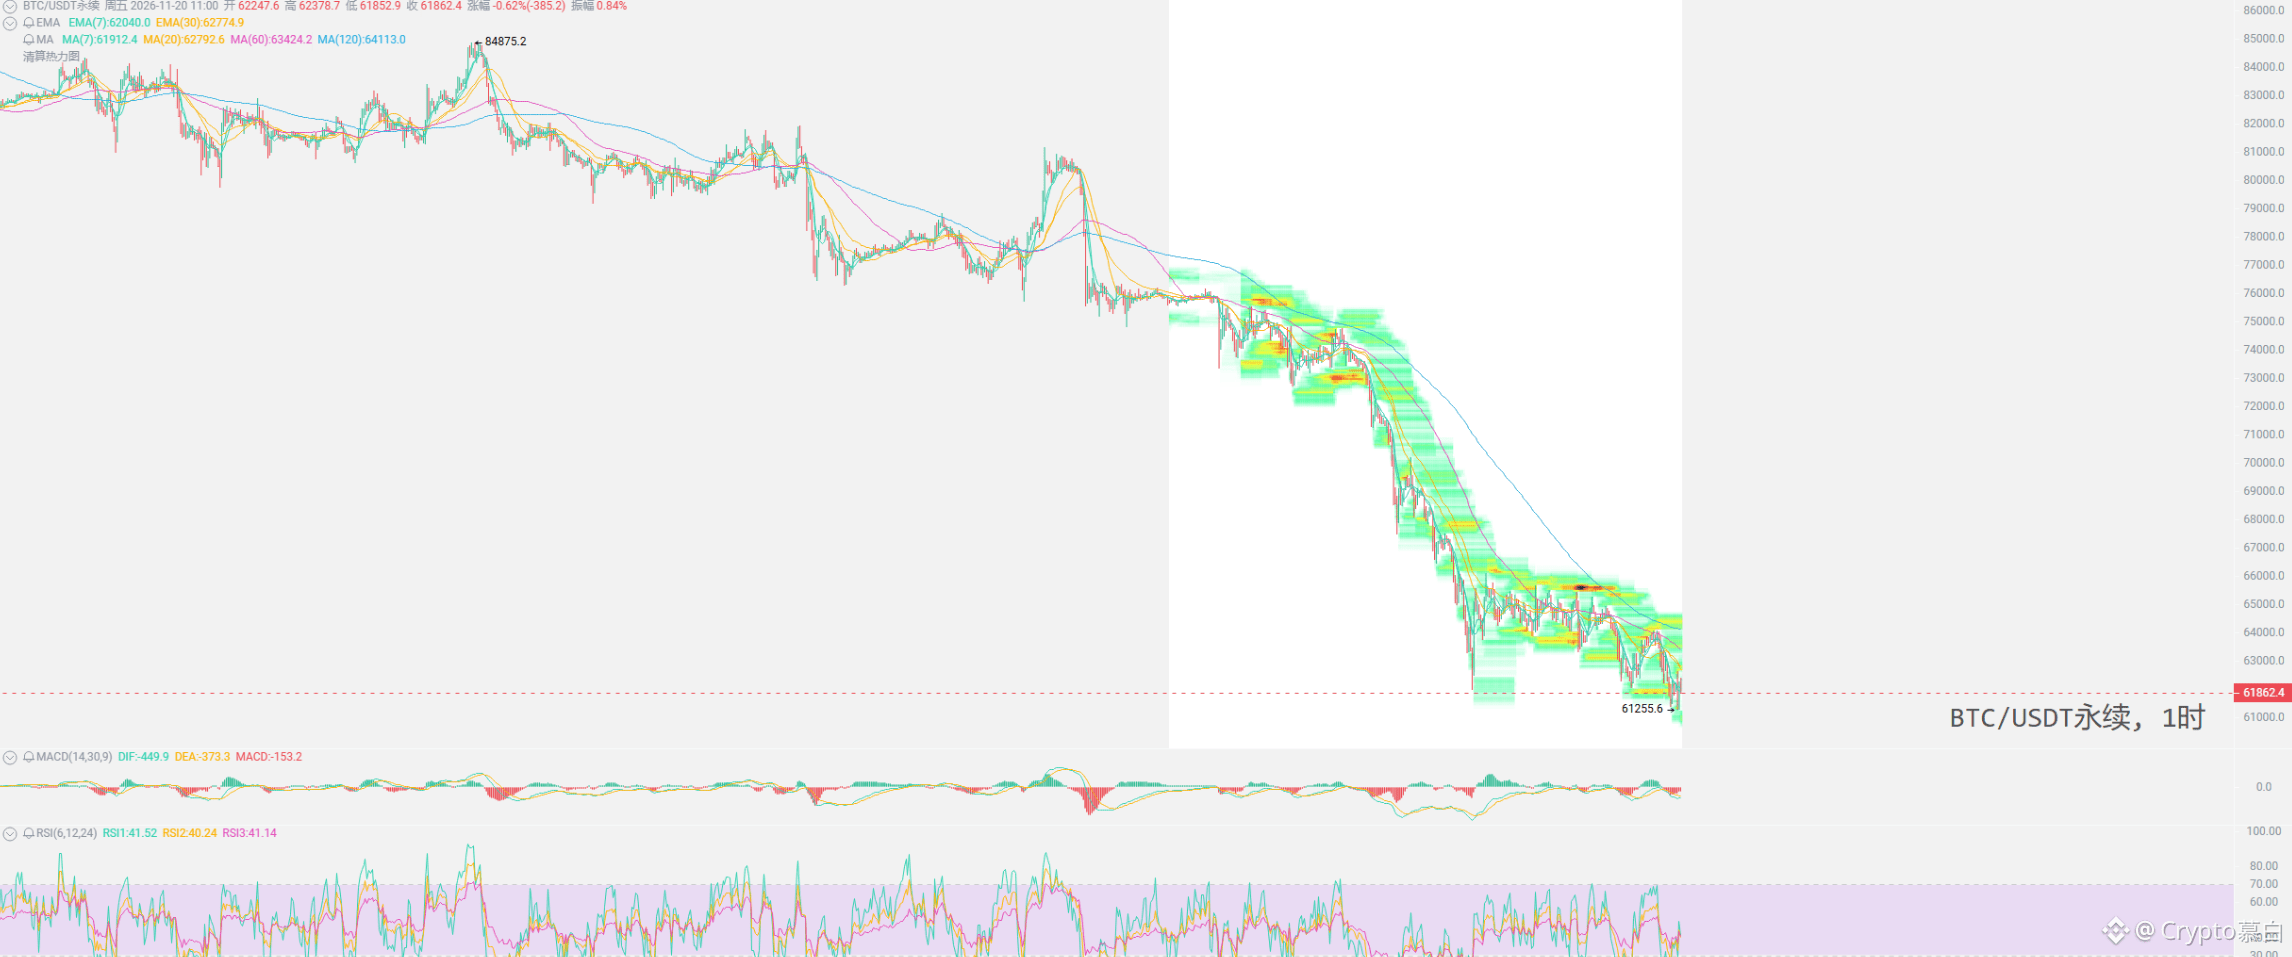
On Friday, markets took another “opening-day hit”
$BTC fell below $62,000, hitting a new low since September
All three major U.S. stock indexes fell more than 2%
Three pressures converged:
Risk sentiment came under pressure;
Even Anthropic’s mega-IPO failed to reignite enthusiasm for AI;
The dollar index continued to fluctuate at elevated levels.
Oil prices edged higher, as reports of tanker traffic disruptions in the Strait of Hormuz outweighed rising U.S. crude inventories and forecasts of a supply glut.
Fed’s Goolsbee struck an even more hawkish tone: with inflation high, all options are on the table, and a sharp rate hike cannot be ruled out.
{future}(BTCUSDT)
#加息预期叠加美股分流,比特币跌破6.2万美元
On Friday, markets took another “opening-day hit”
$BTC fell below $62,000, hitting a new low since September
All three major U.S. stock indexes fell more than 2%
Three pressures converged:
Risk sentiment came under pressure;
Even Anthropic’s mega-IPO failed to reignite enthusiasm for AI;
The dollar index continued to fluctuate at elevated levels.
Oil prices edged higher, as reports of tanker traffic disruptions in the Strait of Hormuz outweighed rising U.S. crude inventories and forecasts of a supply glut.
Fed’s Goolsbee struck an even more hawkish tone: with inflation high, all options are on the table, and a sharp rate hike cannot be ruled out.
#加息预期叠加美股分流,比特币跌破6.2万美元
$BTC fell below $62,000, hitting a new low since September
All three major U.S. stock indexes fell more than 2%
Three pressures converged:
Risk sentiment came under pressure;
Even Anthropic’s mega-IPO failed to reignite enthusiasm for AI;
The dollar index continued to fluctuate at elevated levels.
Oil prices edged higher, as reports of tanker traffic disruptions in the Strait of Hormuz outweighed rising U.S. crude inventories and forecasts of a supply glut.
Fed’s Goolsbee struck an even more hawkish tone: with inflation high, all options are on the table, and a sharp rate hike cannot be ruled out.
#加息预期叠加美股分流,比特币跌破6.2万美元
1
4
5.1k
·
--
Bearish
$BTC Major shorts make large-scale buybacks, totaling about $120 million
Shorts have covered $120 million, but shorts still have the overall edge
Next, don’t just watch the long/short rankings—keep an eye on when large positions are reduced in bulk
If the market keeps falling, watch whether highly leveraged longs are forced to close positions in bulk
If it rebounds, watch whether top shorts cover
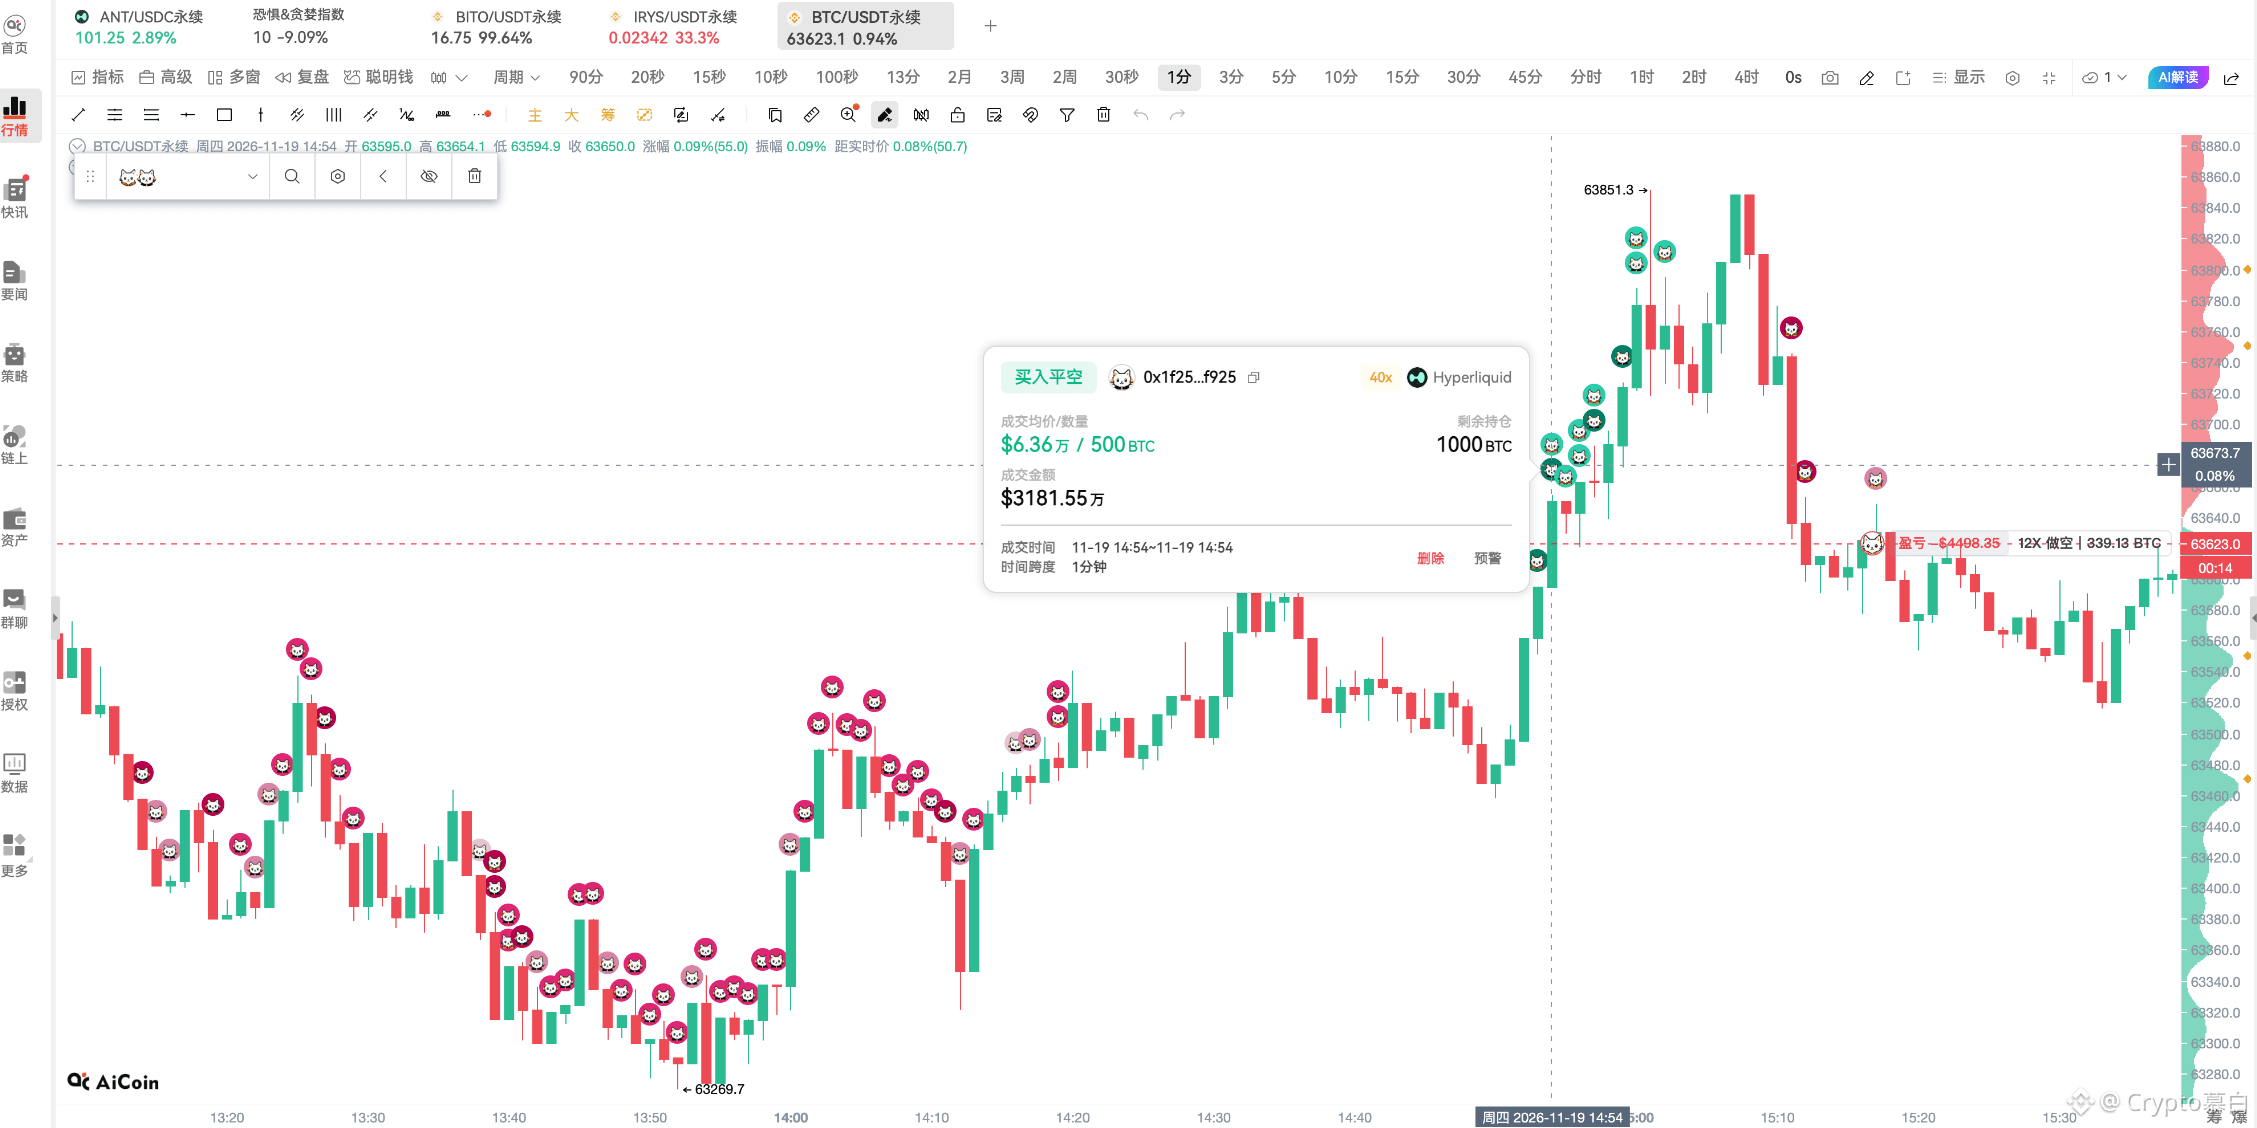
Around 3 p.m. today, major shorts clearly covered positions, and short-term buying followed.
Two key trades:
0x1f25...f925: Closed a short position of 1,500 BTC, worth about $95.25 million; the entire short position was closed;
0x0488...d87d: Closed a short position of 238.6 BTC, worth about $15.18 million, then opened a new short position. It currently still holds about 339 BTC.
The two trades totaled about $120 million. This address was previously the largest short on the whale position leaderboard and was also the biggest buyer back this time around.
But don’t rush to say the shorts have surrendered.
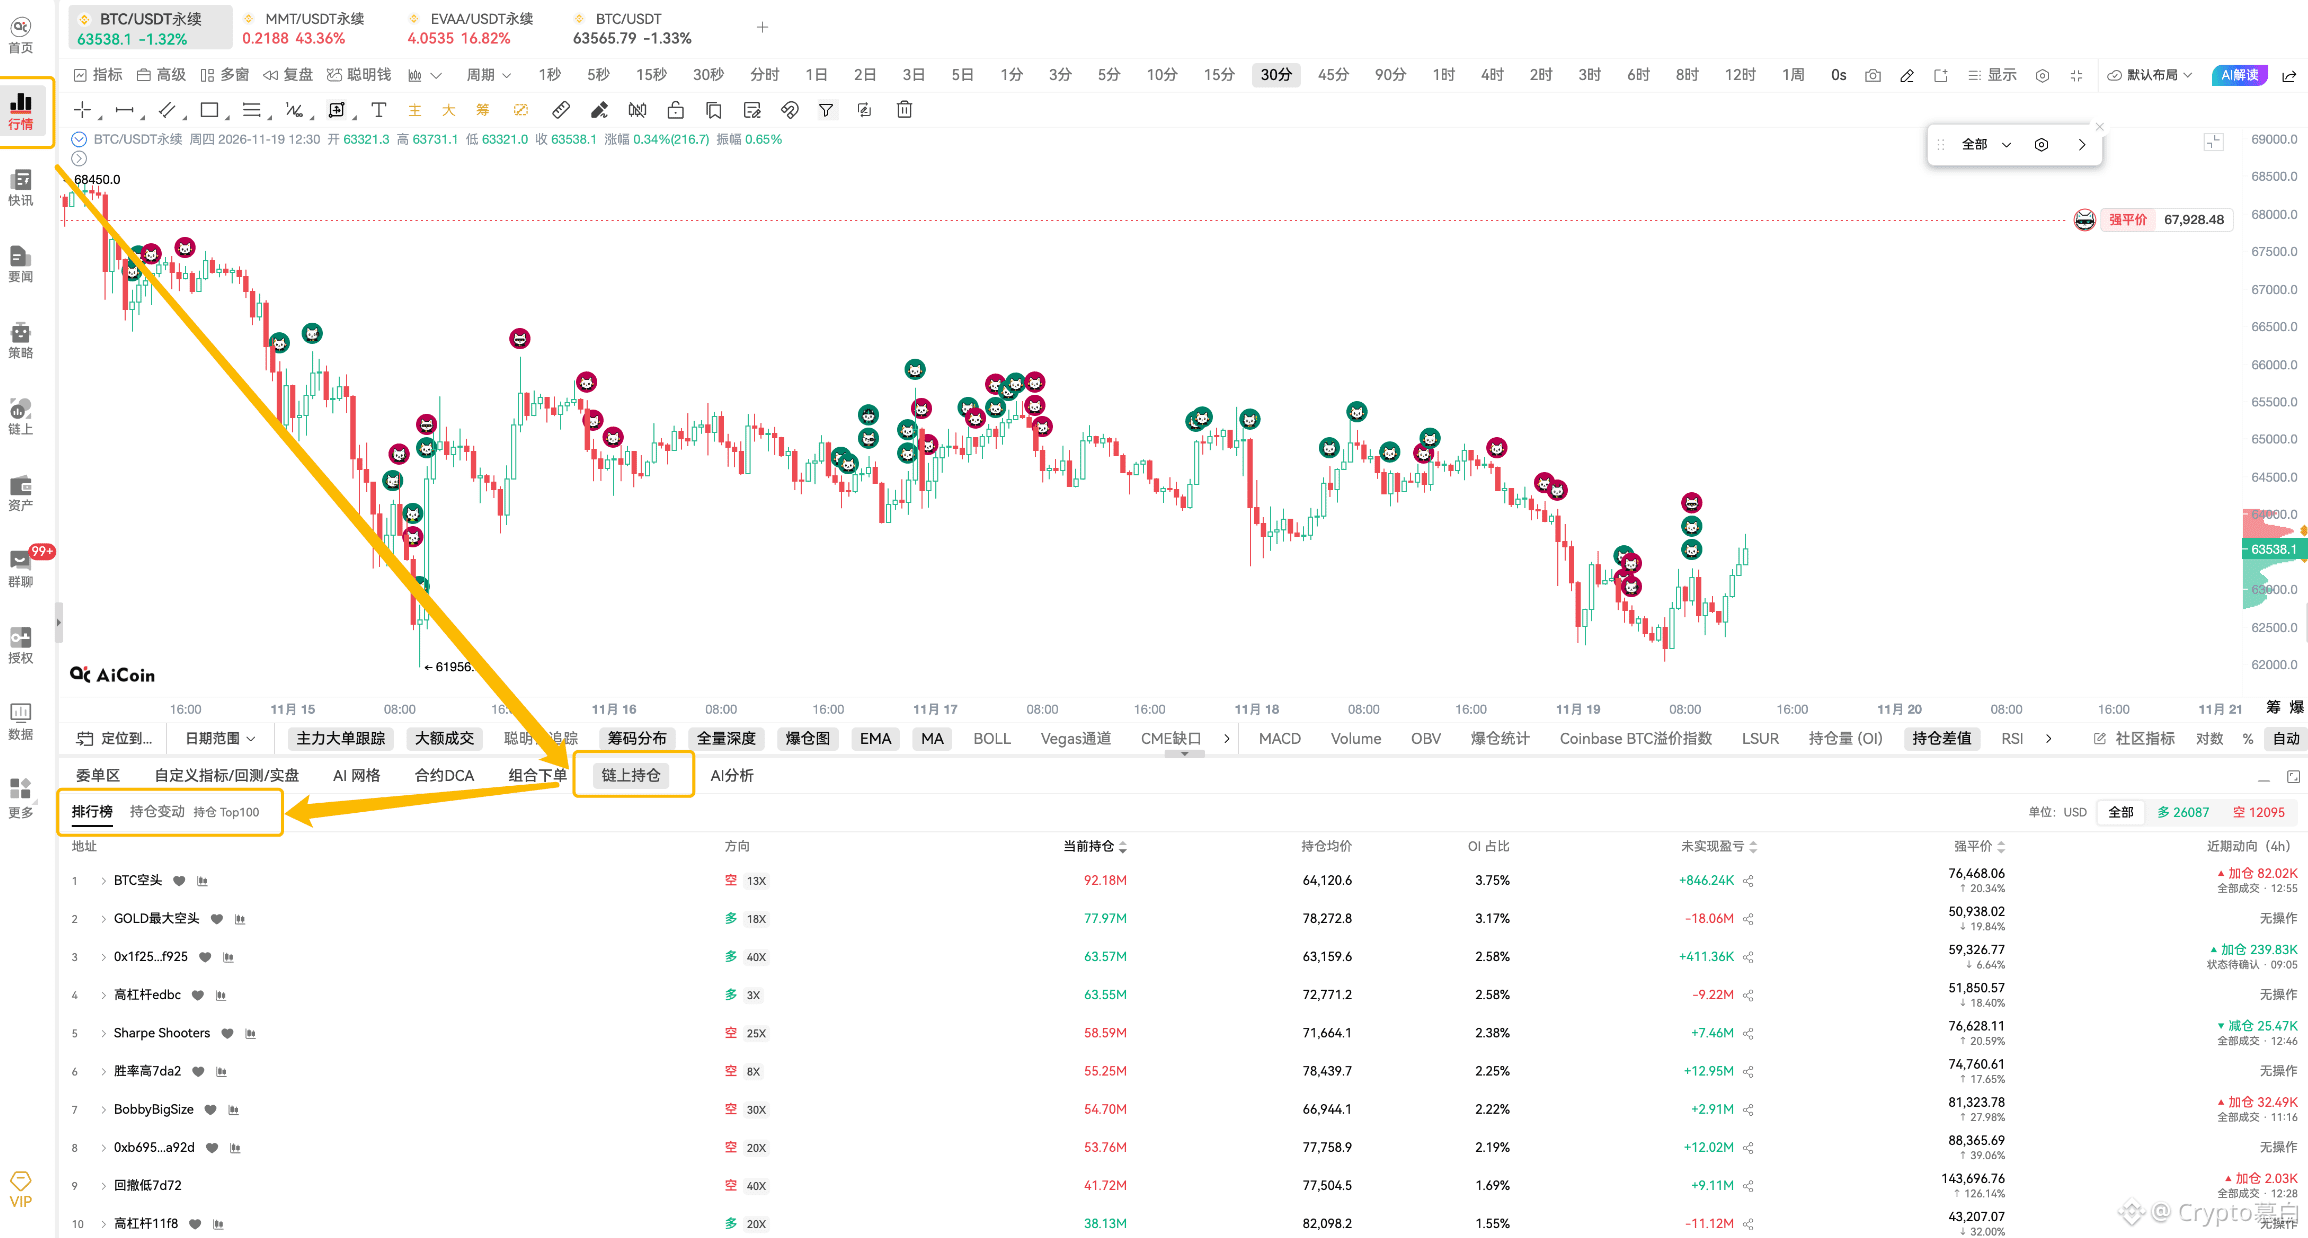
Among the top 10 addresses in Hyperliquid BTC/USDC perpetuals, 6 hold shorts totaling $354 million, while 4 hold longs totaling $242 million. The short position size is about 1.46 times the long position size.
The top shorts haven’t all exited either:
TOP1 short, 0x3ff5, holds a $92.18 million position, with an average entry price of 64,120.6 and a liquidation price of 76,468.06. Recent roll trades have generated $7.65 million in profit;
TOP2 “Sharpe Shooters” holds a $58.59 million position with $7.46 million in unrealized profit, and has only made a small short-term reduction.
Highly leveraged longs haven’t backed down either. AguilaTrades still maintains a large long exposure, with a position worth $63.55 million.
#美联储纪要放鹰,比特币继续承压
{future}(BTCUSDT)
$BTC Major shorts make large-scale buybacks, totaling about $120 million
Shorts have covered $120 million, but shorts still have the overall edge
Next, don’t just watch the long/short rankings—keep an eye on when large positions are reduced in bulk
If the market keeps falling, watch whether highly leveraged longs are forced to close positions in bulk
If it rebounds, watch whether top shorts cover
Around 3 p.m. today, major shorts clearly covered positions, and short-term buying followed.
Two key trades:
0x1f25...f925: Closed a short position of 1,500 BTC, worth about $95.25 million; the entire short position was closed;
0x0488...d87d: Closed a short position of 238.6 BTC, worth about $15.18 million, then opened a new short position. It currently still holds about 339 BTC.
The two trades totaled about $120 million. This address was previously the largest short on the whale position leaderboard and was also the biggest buyer back this time around.
But don’t rush to say the shorts have surrendered.
Among the top 10 addresses in Hyperliquid BTC/USDC perpetuals, 6 hold shorts totaling $354 million, while 4 hold longs totaling $242 million. The short position size is about 1.46 times the long position size.
The top shorts haven’t all exited either:
TOP1 short, 0x3ff5, holds a $92.18 million position, with an average entry price of 64,120.6 and a liquidation price of 76,468.06. Recent roll trades have generated $7.65 million in profit;
TOP2 “Sharpe Shooters” holds a $58.59 million position with $7.46 million in unrealized profit, and has only made a small short-term reduction.
Highly leveraged longs haven’t backed down either. AguilaTrades still maintains a large long exposure, with a position worth $63.55 million.
#美联储纪要放鹰,比特币继续承压
Shorts have covered $120 million, but shorts still have the overall edge
Next, don’t just watch the long/short rankings—keep an eye on when large positions are reduced in bulk
If the market keeps falling, watch whether highly leveraged longs are forced to close positions in bulk
If it rebounds, watch whether top shorts cover
Around 3 p.m. today, major shorts clearly covered positions, and short-term buying followed.
Two key trades:
0x1f25...f925: Closed a short position of 1,500 BTC, worth about $95.25 million; the entire short position was closed;
0x0488...d87d: Closed a short position of 238.6 BTC, worth about $15.18 million, then opened a new short position. It currently still holds about 339 BTC.
The two trades totaled about $120 million. This address was previously the largest short on the whale position leaderboard and was also the biggest buyer back this time around.
But don’t rush to say the shorts have surrendered.
Among the top 10 addresses in Hyperliquid BTC/USDC perpetuals, 6 hold shorts totaling $354 million, while 4 hold longs totaling $242 million. The short position size is about 1.46 times the long position size.
The top shorts haven’t all exited either:
TOP1 short, 0x3ff5, holds a $92.18 million position, with an average entry price of 64,120.6 and a liquidation price of 76,468.06. Recent roll trades have generated $7.65 million in profit;
TOP2 “Sharpe Shooters” holds a $58.59 million position with $7.46 million in unrealized profit, and has only made a small short-term reduction.
Highly leveraged longs haven’t backed down either. AguilaTrades still maintains a large long exposure, with a position worth $63.55 million.
#美联储纪要放鹰,比特币继续承压
898
·
--
Bearish
ETFs are still bleeding
And this time, it’s not just the big players pulling out—second-tier funds are starting to retreat too.
Yesterday’s U.S. spot ETFs:
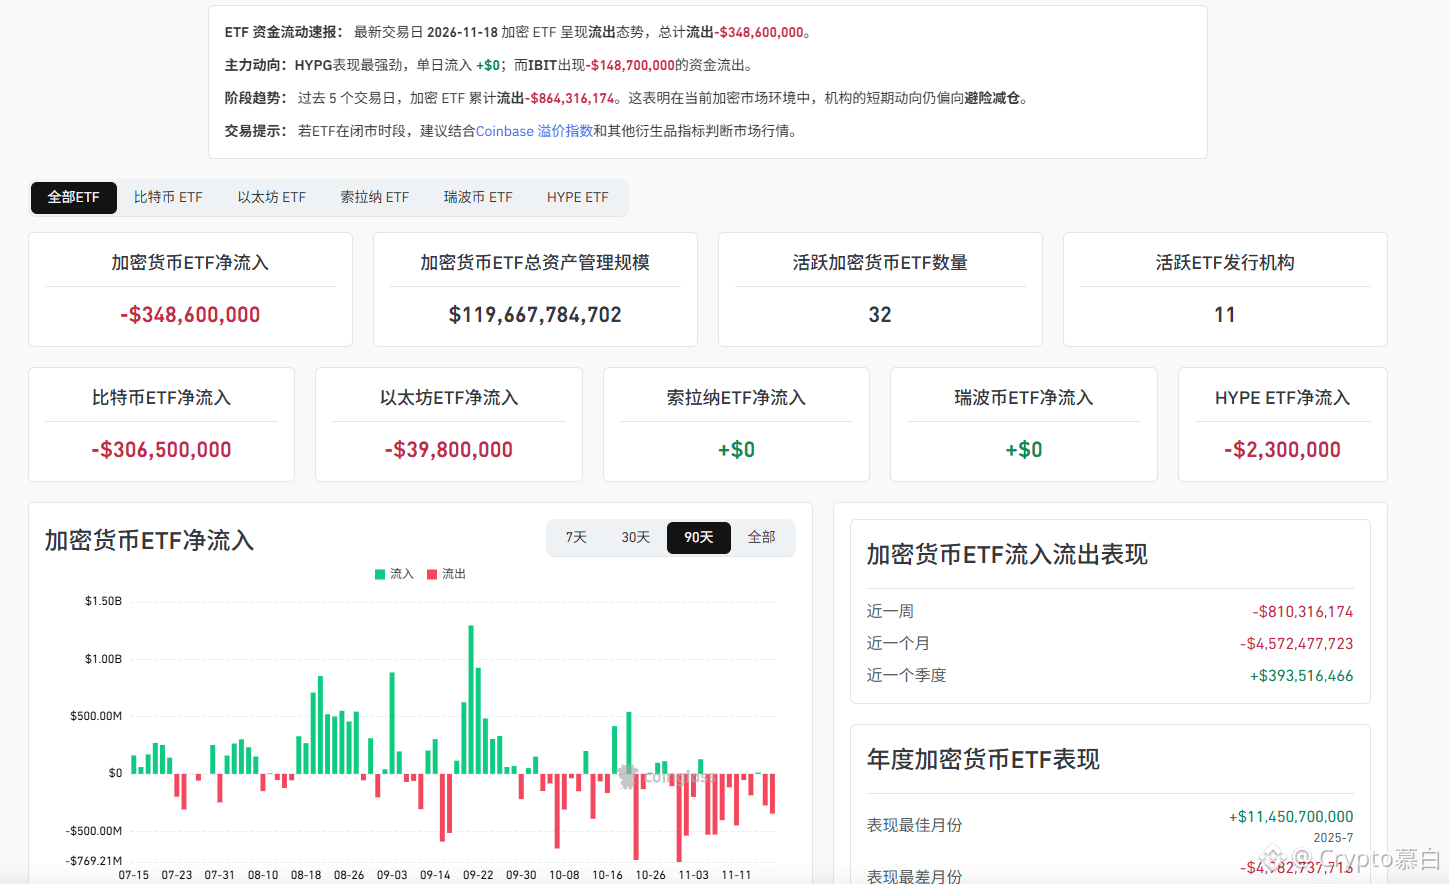
Bitcoin net outflows: $306.5 million; Ethereum net outflows: $39.8 million
One change on the $BTC end is worth watching:
IBIT saw outflows of $148.7 million, down from $209.5 million the day before. But FBTC, BITB, and ARKB saw combined outflows of $125.2 million—the selling pressure has spread from the leaders to second-tier funds.
GBTC saw outflows of $20.3 million, and Grayscale BTC saw outflows of $10.5 million. More importantly, MSBT and Grayscale BTC, which were buying against the trend the previous day, this time one went to zero and the other turned negative.
The $ETH end is also seeing outflows:
ETHA saw outflows of $17.4 million, Grayscale ETH $15 million, ETHB $5.4 million, and ETHE $2 million.
Looking at November, this isn’t a one-day anomaly. Outflows in the $240–300 million range have occurred several times, and the reported figure on October 23 was as high as $635 million.
#比特币现货ETF净流出3.06亿美元
{future}(ETHUSDT)
{future}(BTCUSDT)
ETFs are still bleeding
And this time, it’s not just the big players pulling out—second-tier funds are starting to retreat too.
Yesterday’s U.S. spot ETFs:
Bitcoin net outflows: $306.5 million; Ethereum net outflows: $39.8 million
One change on the $BTC end is worth watching:
IBIT saw outflows of $148.7 million, down from $209.5 million the day before. But FBTC, BITB, and ARKB saw combined outflows of $125.2 million—the selling pressure has spread from the leaders to second-tier funds.
GBTC saw outflows of $20.3 million, and Grayscale BTC saw outflows of $10.5 million. More importantly, MSBT and Grayscale BTC, which were buying against the trend the previous day, this time one went to zero and the other turned negative.
The $ETH end is also seeing outflows:
ETHA saw outflows of $17.4 million, Grayscale ETH $15 million, ETHB $5.4 million, and ETHE $2 million.
Looking at November, this isn’t a one-day anomaly. Outflows in the $240–300 million range have occurred several times, and the reported figure on October 23 was as high as $635 million.
#比特币现货ETF净流出3.06亿美元
And this time, it’s not just the big players pulling out—second-tier funds are starting to retreat too.
Yesterday’s U.S. spot ETFs:
Bitcoin net outflows: $306.5 million; Ethereum net outflows: $39.8 million
One change on the $BTC end is worth watching:
IBIT saw outflows of $148.7 million, down from $209.5 million the day before. But FBTC, BITB, and ARKB saw combined outflows of $125.2 million—the selling pressure has spread from the leaders to second-tier funds.
GBTC saw outflows of $20.3 million, and Grayscale BTC saw outflows of $10.5 million. More importantly, MSBT and Grayscale BTC, which were buying against the trend the previous day, this time one went to zero and the other turned negative.
The $ETH end is also seeing outflows:
ETHA saw outflows of $17.4 million, Grayscale ETH $15 million, ETHB $5.4 million, and ETHE $2 million.
Looking at November, this isn’t a one-day anomaly. Outflows in the $240–300 million range have occurred several times, and the reported figure on October 23 was as high as $635 million.
#比特币现货ETF净流出3.06亿美元
9
13k
·
--
Bearish
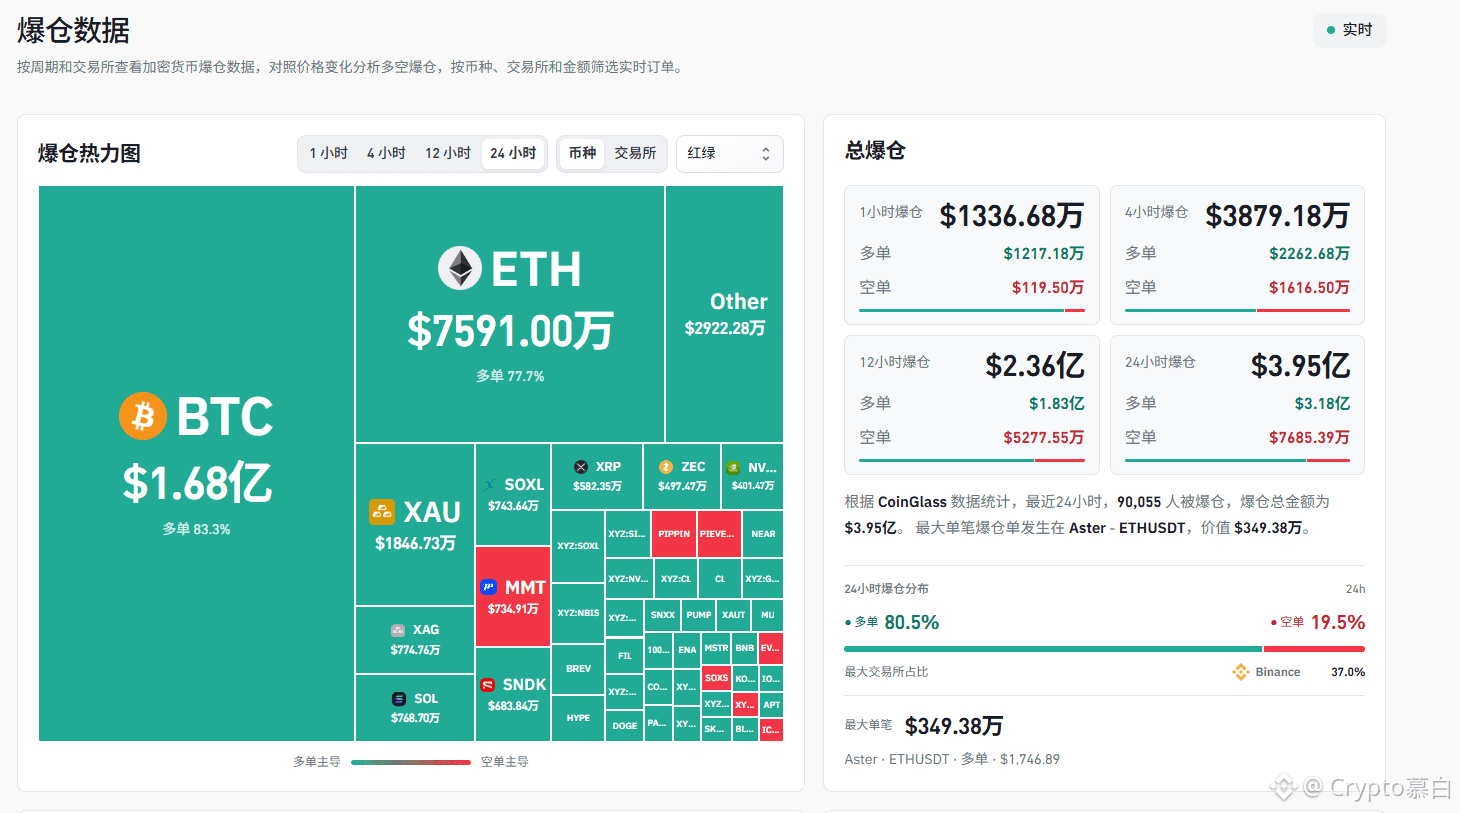
Extreme fear has arrived:
Nearly $400 million in crypto liquidations concentrated in one day
$BTC fell to around 62,000, wiping out another batch of longs
In early trading on November 19, BTC was hovering around 63,000, briefly dipping to 62,000.
The market Fear & Greed Index is just 10—deep in “Extreme Fear” territory.
Over the past 24 hours, approximately $377 million in crypto positions were forcibly liquidated, just shy of $400 million. BTC liquidation data from CoinGlass shows that long liquidations accounted for a larger share—as prices fell, leveraged longs took the biggest hit.
But don’t rush to declare that “risk has been cleared.”
Open interest and price action are diverging. Rising open interest doesn’t necessarily mean shorts are adding positions across the board; funding rates and aggressive buying and selling activity also need to be considered. A short-term rebound has yet to be confirmed.
For now, keep an eye on two levels:
The 63,300–63,500 range is short-term resistance. If the rebound can’t hold above 63,500, be alert for another test of 62,000.
If 62,000 gives way again, downside risks could increase further.
Conversely, only a sustained hold above 63,500, accompanied by continued aggressive buying, could pave the way for a recovery toward around 64,000.
#美联储纪要放鹰,比特币继续承压
{future}(BTCUSDT)
Extreme fear has arrived:
Nearly $400 million in crypto liquidations concentrated in one day
$BTC fell to around 62,000, wiping out another batch of longs
In early trading on November 19, BTC was hovering around 63,000, briefly dipping to 62,000.
The market Fear & Greed Index is just 10—deep in “Extreme Fear” territory.
Over the past 24 hours, approximately $377 million in crypto positions were forcibly liquidated, just shy of $400 million. BTC liquidation data from CoinGlass shows that long liquidations accounted for a larger share—as prices fell, leveraged longs took the biggest hit.
But don’t rush to declare that “risk has been cleared.”
Open interest and price action are diverging. Rising open interest doesn’t necessarily mean shorts are adding positions across the board; funding rates and aggressive buying and selling activity also need to be considered. A short-term rebound has yet to be confirmed.
For now, keep an eye on two levels:
The 63,300–63,500 range is short-term resistance. If the rebound can’t hold above 63,500, be alert for another test of 62,000.
If 62,000 gives way again, downside risks could increase further.
Conversely, only a sustained hold above 63,500, accompanied by continued aggressive buying, could pave the way for a recovery toward around 64,000.
#美联储纪要放鹰,比特币继续承压
Nearly $400 million in crypto liquidations concentrated in one day
$BTC fell to around 62,000, wiping out another batch of longs
In early trading on November 19, BTC was hovering around 63,000, briefly dipping to 62,000.
The market Fear & Greed Index is just 10—deep in “Extreme Fear” territory.
Over the past 24 hours, approximately $377 million in crypto positions were forcibly liquidated, just shy of $400 million. BTC liquidation data from CoinGlass shows that long liquidations accounted for a larger share—as prices fell, leveraged longs took the biggest hit.
But don’t rush to declare that “risk has been cleared.”
Open interest and price action are diverging. Rising open interest doesn’t necessarily mean shorts are adding positions across the board; funding rates and aggressive buying and selling activity also need to be considered. A short-term rebound has yet to be confirmed.
For now, keep an eye on two levels:
The 63,300–63,500 range is short-term resistance. If the rebound can’t hold above 63,500, be alert for another test of 62,000.
If 62,000 gives way again, downside risks could increase further.
Conversely, only a sustained hold above 63,500, accompanied by continued aggressive buying, could pave the way for a recovery toward around 64,000.
#美联储纪要放鹰,比特币继续承压
2
4.7k
·
--
Bullish
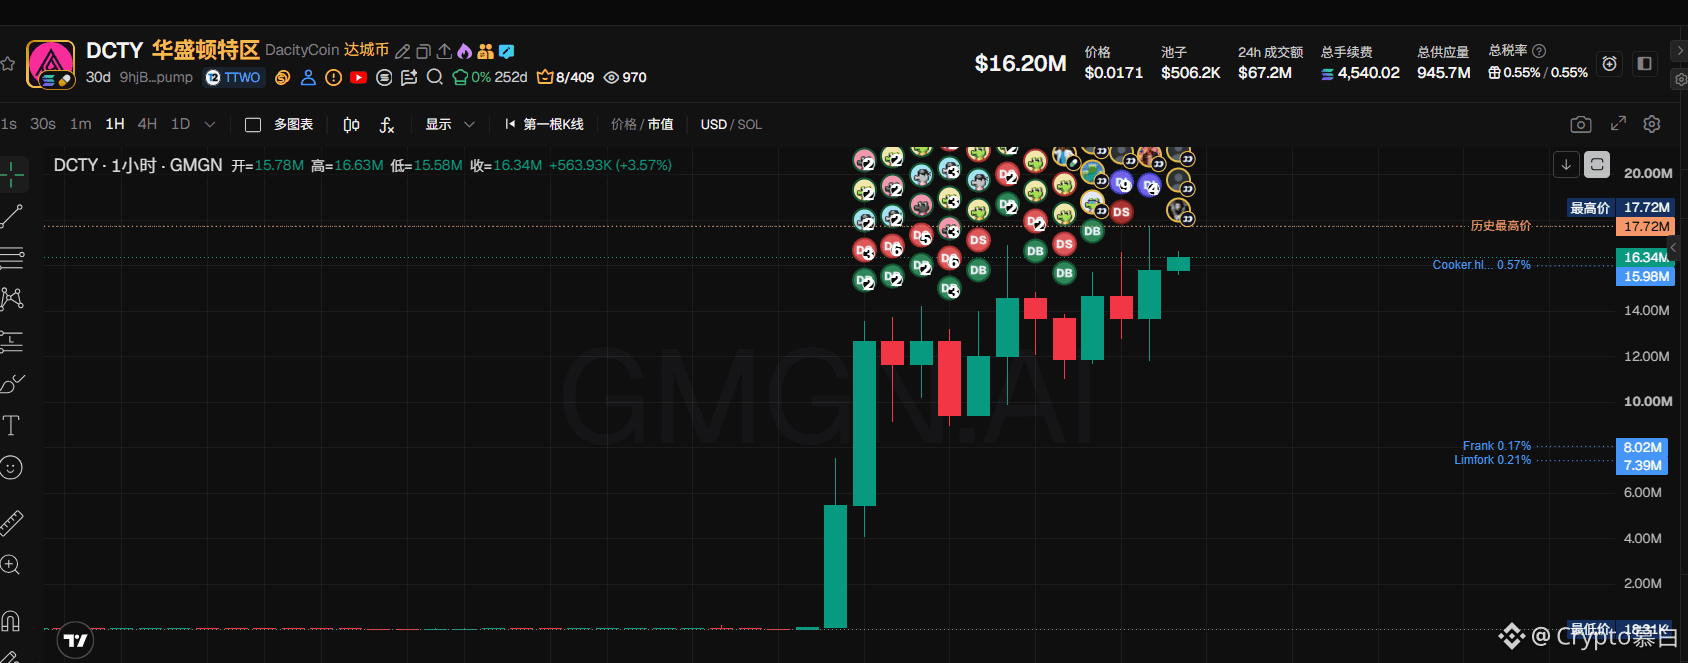
GTA 6 officially launches today
Related meme coins took off, with #DCTY surging 381x in 24 hours
9hjBLBrc7WZW2H8UQvBAvG5WiTZotXUv2Bdcn4f4pump
DCTY, on Solana, surged 381x in 24 hours, with a market cap of $13.64 million and trading volume of $65 million.
The game itself is also exploding: presales are estimated at nearly or over 17 million copies, generating around $1.65 billion in revenue. PS5 accounts for 75% and Xbox for 25%. Take-Two says it’s “far beyond internal expectations.”
It’s even wilder in the UK: BrightHR analyzed data from over 1.2 million employees and 70,000 businesses, estimating that around 83,000 days of annual leave will be taken for GTA 6 in November and December, costing businesses about £12.4 million.
Around £3.14 million was already lost on launch day. GTA was mentioned in 4.63% of leave requests, with more requests than for honeymoons. Some people simply wrote, “If you refuse, I quit.”
DCTY’s origins are pretty amusing, too: the “AudaCity” brand appeared in leaked GTA 6 footage. The game does indeed feature DCTY-related content, but it may simply be poking fun at absurd meme coins.
Presales are booming, UK leave requests are booming, and DCTY is up 381x;
GTA 6 has ignited FOMO both in the real world and on-chain
{web3_wallet_create}(CT_5019hjBLBrc7WZW2H8UQvBAvG5WiTZotXUv2Bdcn4f4pump)
#GTA6正式发售,TTWO股价能否迎来提振?
GTA 6 officially launches today
Related meme coins took off, with #DCTY surging 381x in 24 hours
9hjBLBrc7WZW2H8UQvBAvG5WiTZotXUv2Bdcn4f4pump
DCTY, on Solana, surged 381x in 24 hours, with a market cap of $13.64 million and trading volume of $65 million.
The game itself is also exploding: presales are estimated at nearly or over 17 million copies, generating around $1.65 billion in revenue. PS5 accounts for 75% and Xbox for 25%. Take-Two says it’s “far beyond internal expectations.”
It’s even wilder in the UK: BrightHR analyzed data from over 1.2 million employees and 70,000 businesses, estimating that around 83,000 days of annual leave will be taken for GTA 6 in November and December, costing businesses about £12.4 million.
Around £3.14 million was already lost on launch day. GTA was mentioned in 4.63% of leave requests, with more requests than for honeymoons. Some people simply wrote, “If you refuse, I quit.”
DCTY’s origins are pretty amusing, too: the “AudaCity” brand appeared in leaked GTA 6 footage. The game does indeed feature DCTY-related content, but it may simply be poking fun at absurd meme coins.
Presales are booming, UK leave requests are booming, and DCTY is up 381x;
GTA 6 has ignited FOMO both in the real world and on-chain
#GTA6正式发售,TTWO股价能否迎来提振?
Related meme coins took off, with #DCTY surging 381x in 24 hours
9hjBLBrc7WZW2H8UQvBAvG5WiTZotXUv2Bdcn4f4pump
DCTY, on Solana, surged 381x in 24 hours, with a market cap of $13.64 million and trading volume of $65 million.
The game itself is also exploding: presales are estimated at nearly or over 17 million copies, generating around $1.65 billion in revenue. PS5 accounts for 75% and Xbox for 25%. Take-Two says it’s “far beyond internal expectations.”
It’s even wilder in the UK: BrightHR analyzed data from over 1.2 million employees and 70,000 businesses, estimating that around 83,000 days of annual leave will be taken for GTA 6 in November and December, costing businesses about £12.4 million.
Around £3.14 million was already lost on launch day. GTA was mentioned in 4.63% of leave requests, with more requests than for honeymoons. Some people simply wrote, “If you refuse, I quit.”
DCTY’s origins are pretty amusing, too: the “AudaCity” brand appeared in leaked GTA 6 footage. The game does indeed feature DCTY-related content, but it may simply be poking fun at absurd meme coins.
Presales are booming, UK leave requests are booming, and DCTY is up 381x;
GTA 6 has ignited FOMO both in the real world and on-chain
#GTA6正式发售,TTWO股价能否迎来提振?
1.9k
·
--
Bearish
Verified
The Fed’s October minutes struck a hawkish tone: almost all officials thought further rate hikes would still be needed
Waller was even more aggressive:
A 50-basis-point hike in December could be considered
First, the key points from the minutes:
At its October meeting, the FOMC voted 10–2 to hold rates at 3.75%–4%. The two dissenters, Cook and Hammack, had argued for a 25-basis-point hike.
“Almost all” officials thought further rate hikes in the coming months might be appropriate to ensure inflation returned to 2% in a timely manner. A few officials were more direct: if upcoming inflation data were unfavorable, a hike of more than 25 basis points could be considered in December.
Some officials also warned that delaying rate hikes further could cause high inflation to become entrenched, forcing the Fed to tighten later by more and in a more disruptive way.
Waller’s remarks were even more hawkish than the minutes.
On November 18, he told CNBC that he was “very, very worried about inflation,” which was “moving in the wrong direction and spreading,” rather than being concentrated in just a few areas.
His proposal: either hike by 50 basis points all at once in December, or clearly tell markets that rate hikes would accelerate in 2027. He also said it might be necessary to “give the market a shock” and break people’s assumption that 3% inflation is normal.
AI was also singled out. The minutes showed that officials thought demand for AI infrastructure could become a significant source of inflation, while also posing risks to financial stability.
Expectations for a 25-basis-point hike in December are already well established; pricing for a 50-basis-point hike remains very low.
#美联储纪要放鹰,比特币继续承压
The Fed’s October minutes struck a hawkish tone: almost all officials thought further rate hikes would still be needed
Waller was even more aggressive:
A 50-basis-point hike in December could be considered
First, the key points from the minutes:
At its October meeting, the FOMC voted 10–2 to hold rates at 3.75%–4%. The two dissenters, Cook and Hammack, had argued for a 25-basis-point hike.
“Almost all” officials thought further rate hikes in the coming months might be appropriate to ensure inflation returned to 2% in a timely manner. A few officials were more direct: if upcoming inflation data were unfavorable, a hike of more than 25 basis points could be considered in December.
Some officials also warned that delaying rate hikes further could cause high inflation to become entrenched, forcing the Fed to tighten later by more and in a more disruptive way.
Waller’s remarks were even more hawkish than the minutes.
On November 18, he told CNBC that he was “very, very worried about inflation,” which was “moving in the wrong direction and spreading,” rather than being concentrated in just a few areas.
His proposal: either hike by 50 basis points all at once in December, or clearly tell markets that rate hikes would accelerate in 2027. He also said it might be necessary to “give the market a shock” and break people’s assumption that 3% inflation is normal.
AI was also singled out. The minutes showed that officials thought demand for AI infrastructure could become a significant source of inflation, while also posing risks to financial stability.
Expectations for a 25-basis-point hike in December are already well established; pricing for a 50-basis-point hike remains very low.
#美联储纪要放鹰,比特币继续承压
Waller was even more aggressive:
A 50-basis-point hike in December could be considered
First, the key points from the minutes:
At its October meeting, the FOMC voted 10–2 to hold rates at 3.75%–4%. The two dissenters, Cook and Hammack, had argued for a 25-basis-point hike.
“Almost all” officials thought further rate hikes in the coming months might be appropriate to ensure inflation returned to 2% in a timely manner. A few officials were more direct: if upcoming inflation data were unfavorable, a hike of more than 25 basis points could be considered in December.
Some officials also warned that delaying rate hikes further could cause high inflation to become entrenched, forcing the Fed to tighten later by more and in a more disruptive way.
Waller’s remarks were even more hawkish than the minutes.
On November 18, he told CNBC that he was “very, very worried about inflation,” which was “moving in the wrong direction and spreading,” rather than being concentrated in just a few areas.
His proposal: either hike by 50 basis points all at once in December, or clearly tell markets that rate hikes would accelerate in 2027. He also said it might be necessary to “give the market a shock” and break people’s assumption that 3% inflation is normal.
AI was also singled out. The minutes showed that officials thought demand for AI infrastructure could become a significant source of inflation, while also posing risks to financial stability.
Expectations for a 25-basis-point hike in December are already well established; pricing for a 50-basis-point hike remains very low.
#美联储纪要放鹰,比特币继续承压

728
·
--
Bearish
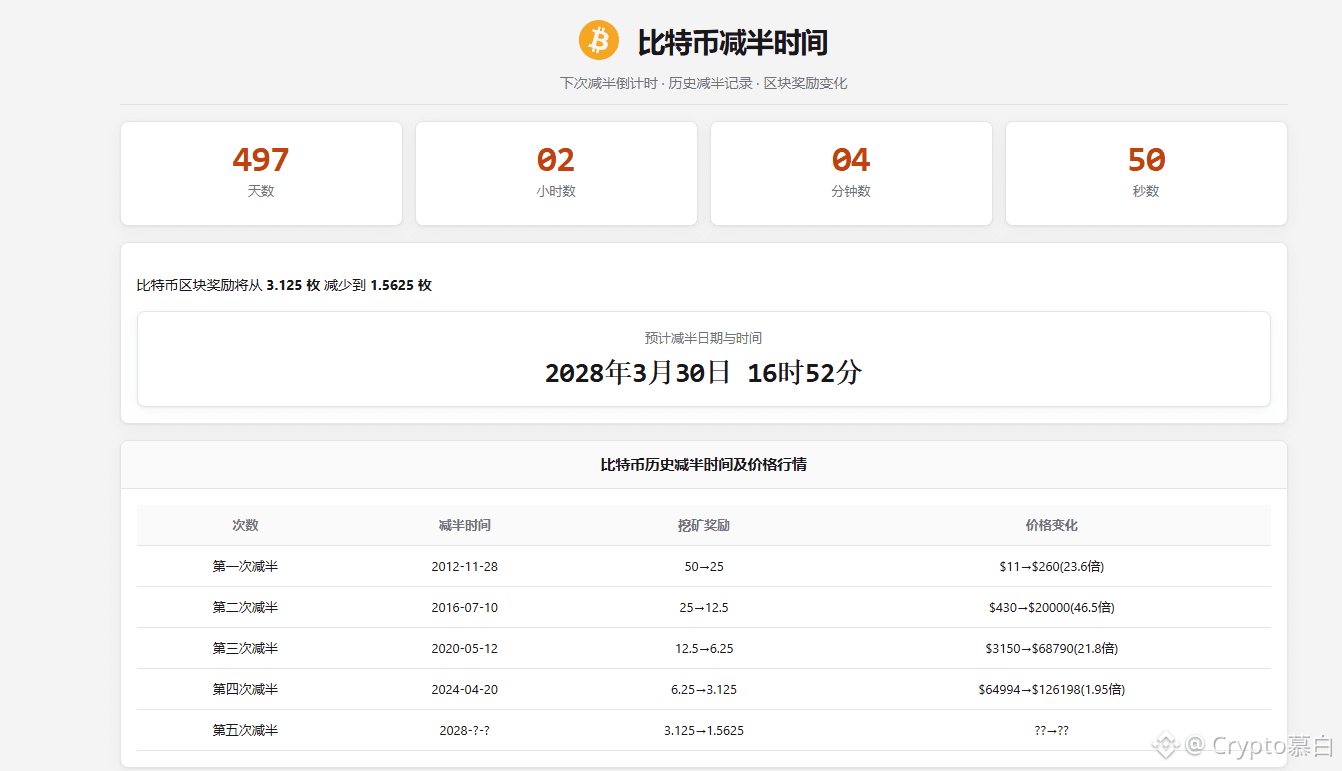
940 days after the halving, $BTC has barely moved
This is the first time
the halving narrative has failed to play out over the same period
On the day of the halving, April 20, 2024, BTC closed at 64940; 940 days later, it is still around 64500—essentially a full round trip
Compared with the same period in the previous three cycles, the gap is striking:
The 2012 cycle rose about 1,888%, the 2016 cycle about 427%, and the 2020 cycle about 96%. This cycle: roughly zero
What’s more, BTC has fallen about 49% from its October 2025 high of 126199, putting the claim that it is “building up momentum after the halving” under considerable pressure
The timing window is even more worth watching. The bear-market bottoms in the previous three cycles all came 364—406 days after their all-time highs;
It is now day 407. The window has just passed, but a bottom has yet to be confirmed. This is the signal to watch most closely.
There are too few cycle samples, and ETFs have already reshaped the demand anchor
The halving calendar is no longer the only pricing reference. ETF flows, miner costs, and macro liquidity are now taking over marginal pricing
#BTC #美联储纪要放鹰,比特币继续承压
{future}(BTCUSDT)
940 days after the halving, $BTC has barely moved
This is the first time
the halving narrative has failed to play out over the same period
On the day of the halving, April 20, 2024, BTC closed at 64940; 940 days later, it is still around 64500—essentially a full round trip
Compared with the same period in the previous three cycles, the gap is striking:
The 2012 cycle rose about 1,888%, the 2016 cycle about 427%, and the 2020 cycle about 96%. This cycle: roughly zero
What’s more, BTC has fallen about 49% from its October 2025 high of 126199, putting the claim that it is “building up momentum after the halving” under considerable pressure
The timing window is even more worth watching. The bear-market bottoms in the previous three cycles all came 364—406 days after their all-time highs;
It is now day 407. The window has just passed, but a bottom has yet to be confirmed. This is the signal to watch most closely.
There are too few cycle samples, and ETFs have already reshaped the demand anchor
The halving calendar is no longer the only pricing reference. ETF flows, miner costs, and macro liquidity are now taking over marginal pricing
#BTC #美联储纪要放鹰,比特币继续承压
This is the first time
the halving narrative has failed to play out over the same period
On the day of the halving, April 20, 2024, BTC closed at 64940; 940 days later, it is still around 64500—essentially a full round trip
Compared with the same period in the previous three cycles, the gap is striking:
The 2012 cycle rose about 1,888%, the 2016 cycle about 427%, and the 2020 cycle about 96%. This cycle: roughly zero
What’s more, BTC has fallen about 49% from its October 2025 high of 126199, putting the claim that it is “building up momentum after the halving” under considerable pressure
The timing window is even more worth watching. The bear-market bottoms in the previous three cycles all came 364—406 days after their all-time highs;
It is now day 407. The window has just passed, but a bottom has yet to be confirmed. This is the signal to watch most closely.
There are too few cycle samples, and ETFs have already reshaped the demand anchor
The halving calendar is no longer the only pricing reference. ETF flows, miner costs, and macro liquidity are now taking over marginal pricing
#BTC #美联储纪要放鹰,比特币继续承压
1k
·
--
Bearish
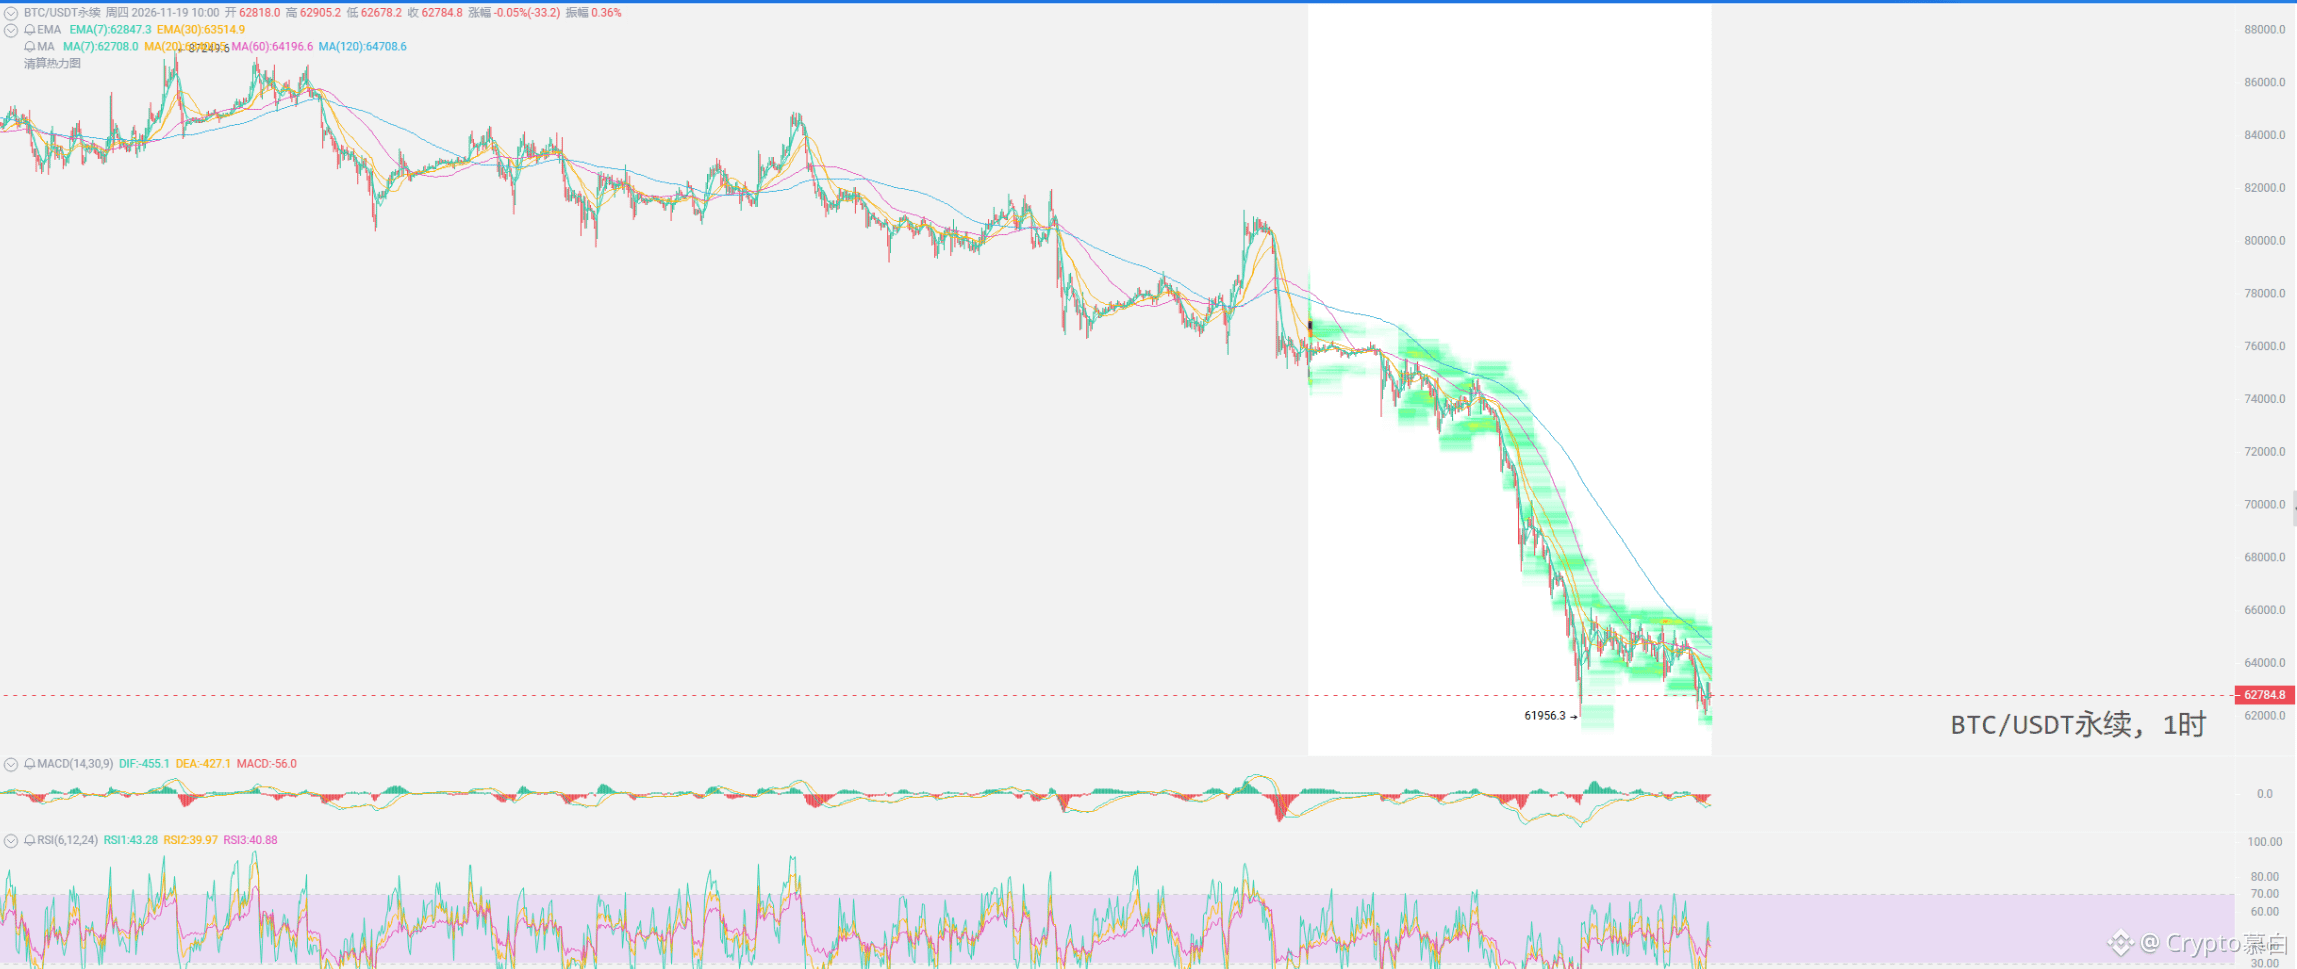
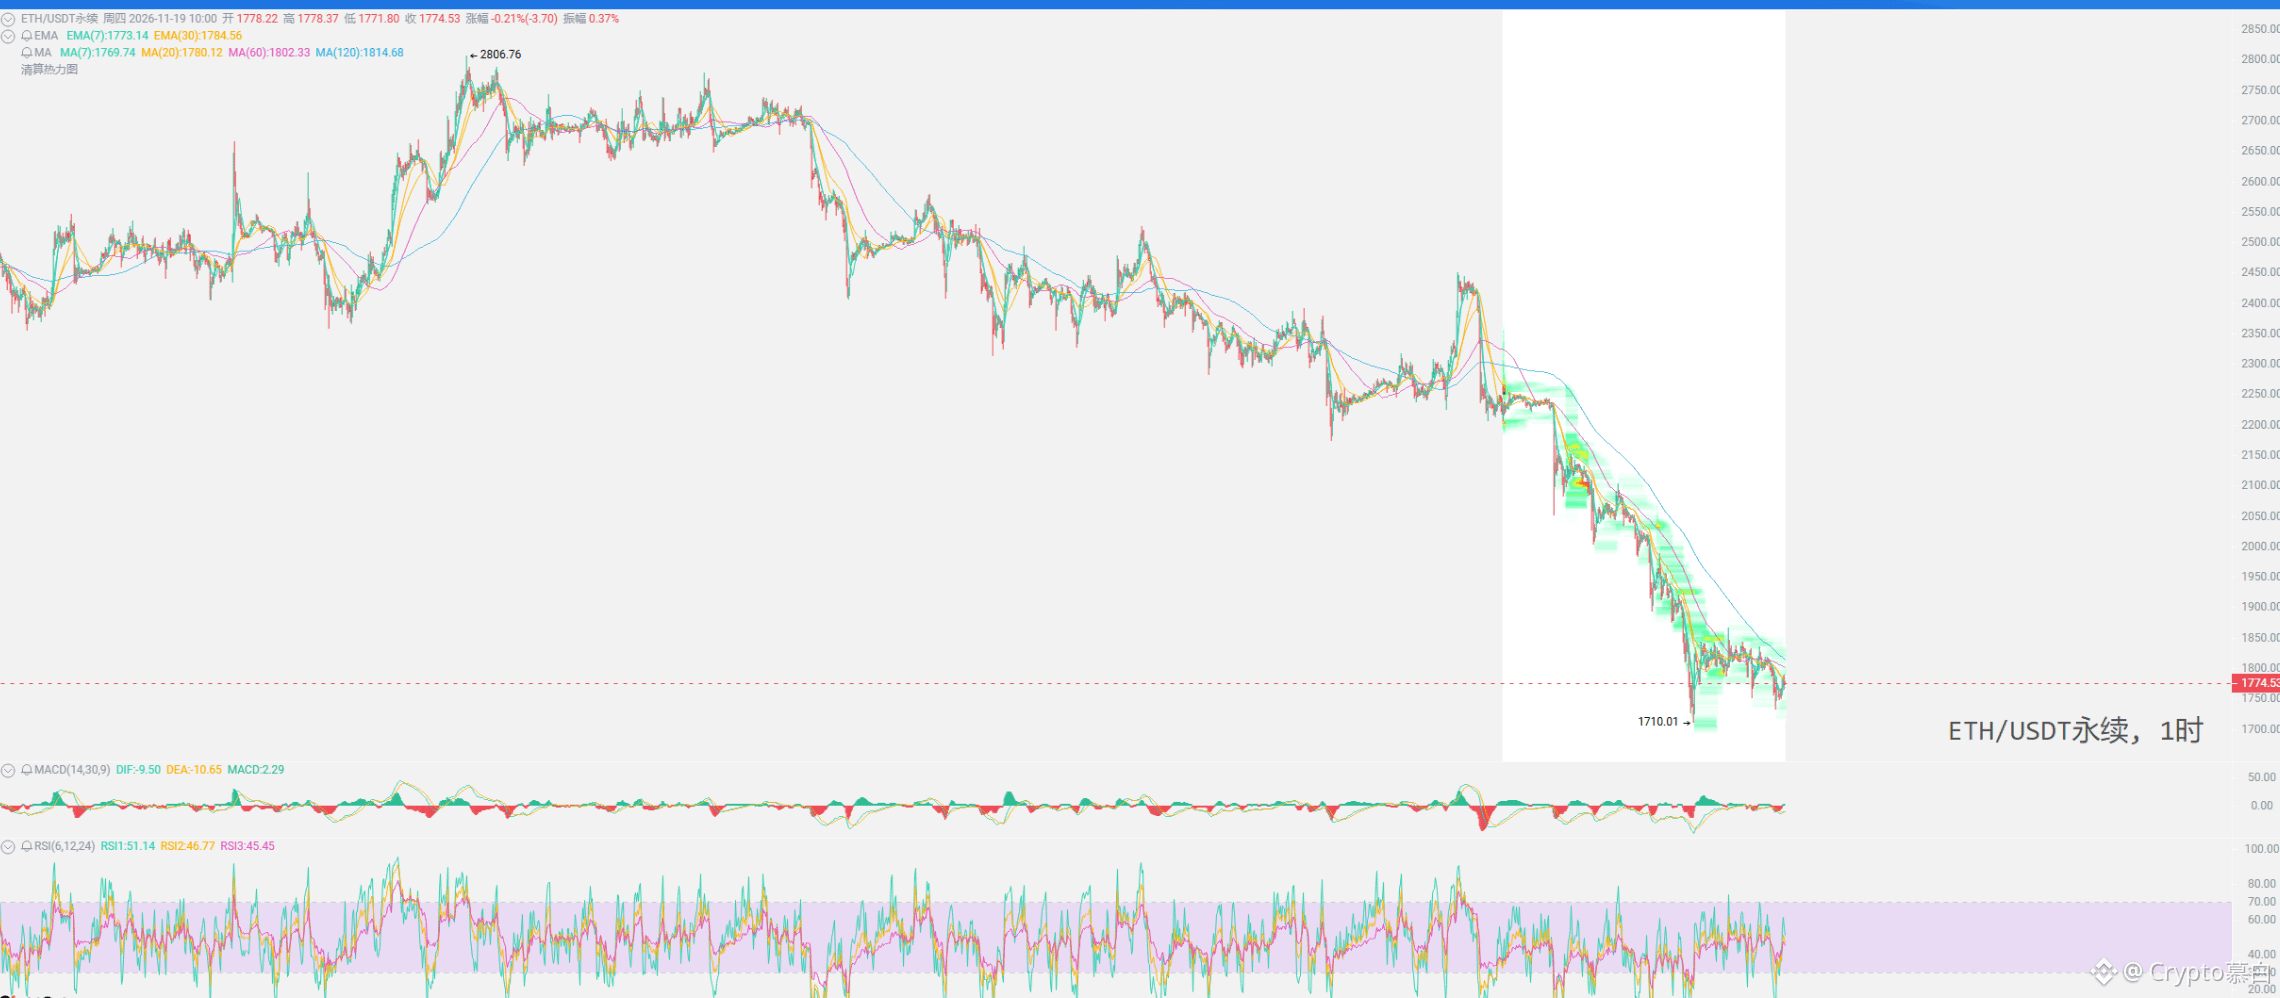
$BTC $ETH Keep coming up empty, keep feeling great!
You can make money even when you come up empty!
#美联储纪要放鹰,比特币继续承压
{future}(ETHUSDT)
{future}(BTCUSDT)
$BTC $ETH Keep coming up empty, keep feeling great!
You can make money even when you come up empty!
#美联储纪要放鹰,比特币继续承压
You can make money even when you come up empty!
#美联储纪要放鹰,比特币继续承压
Crypto慕白
·
--
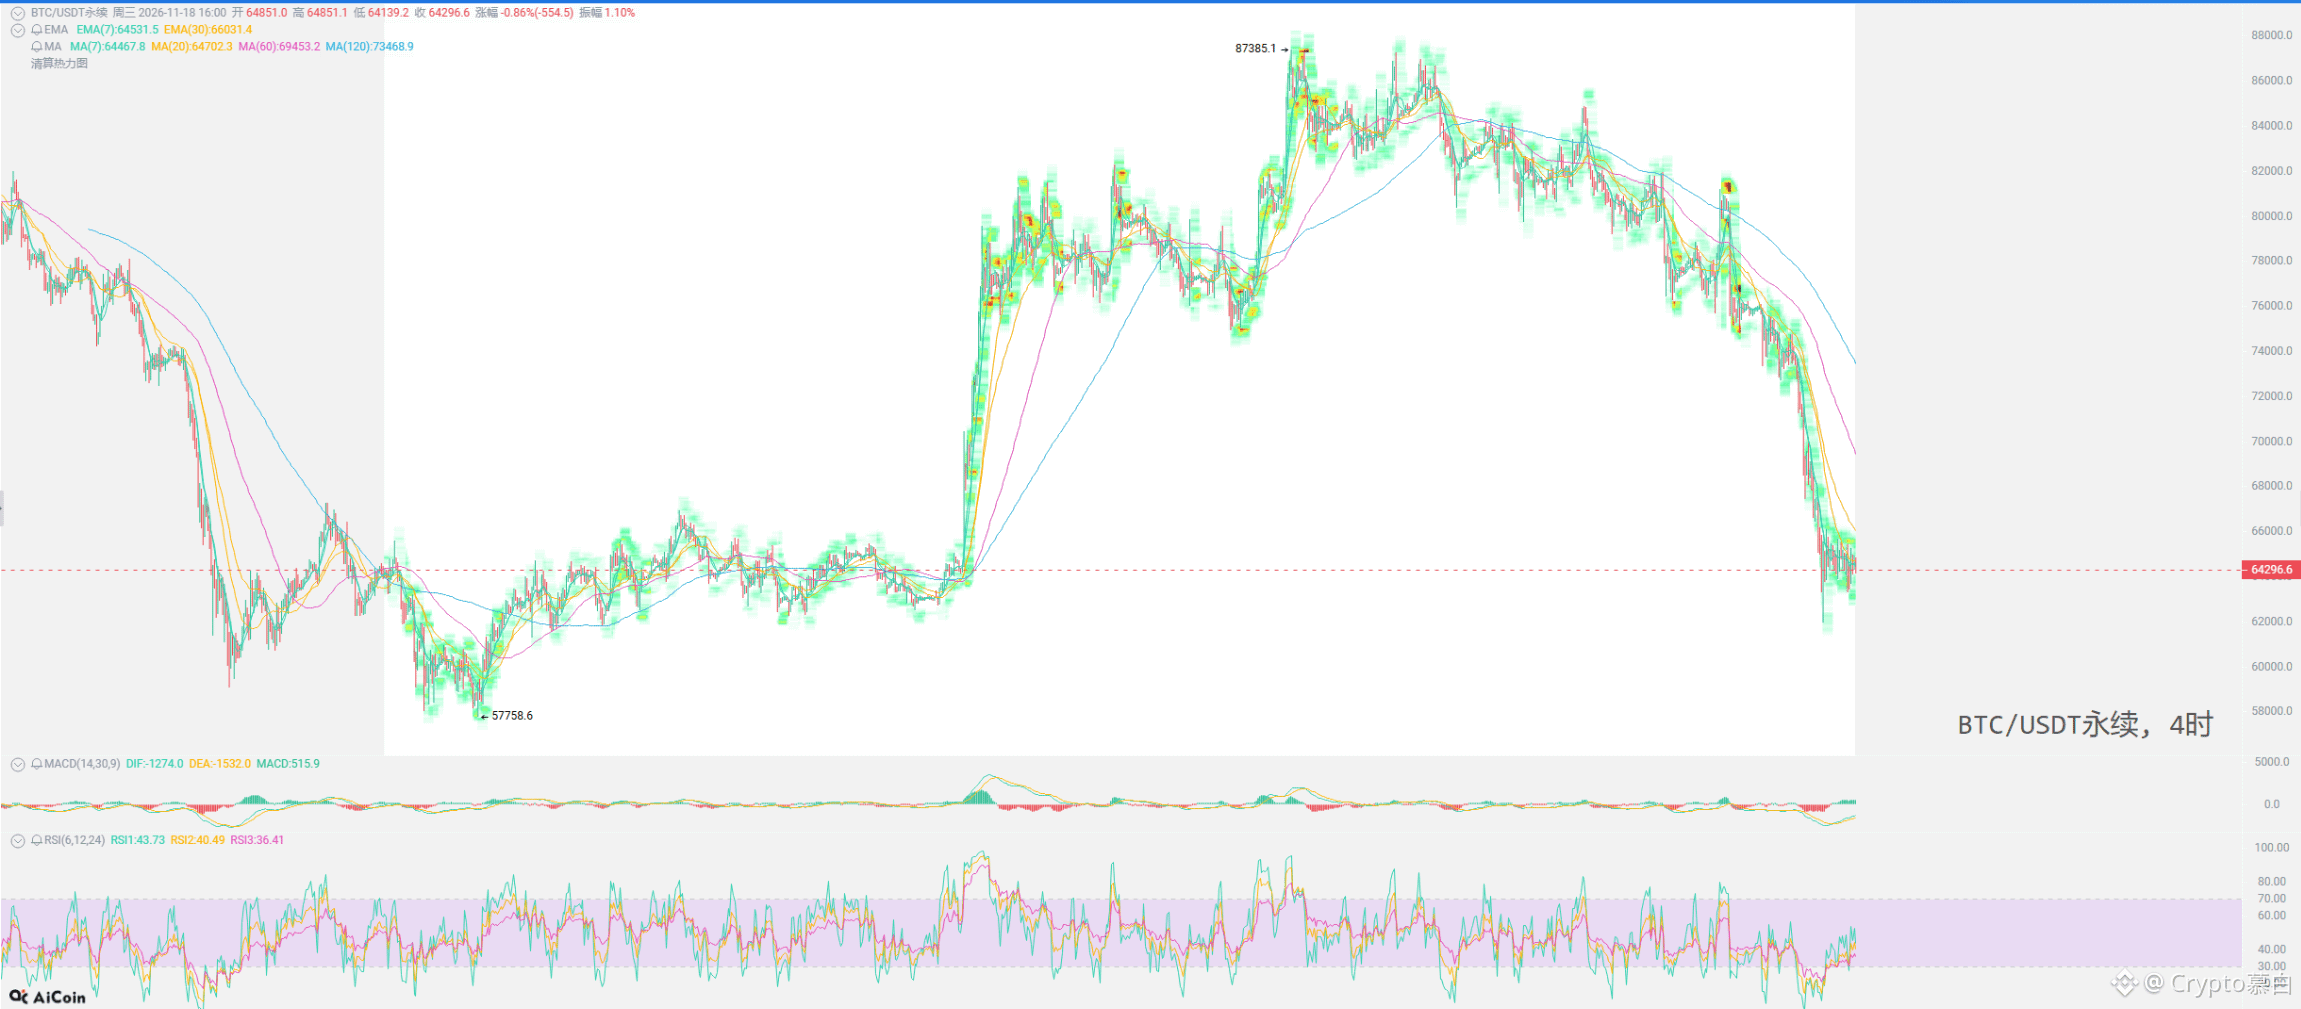
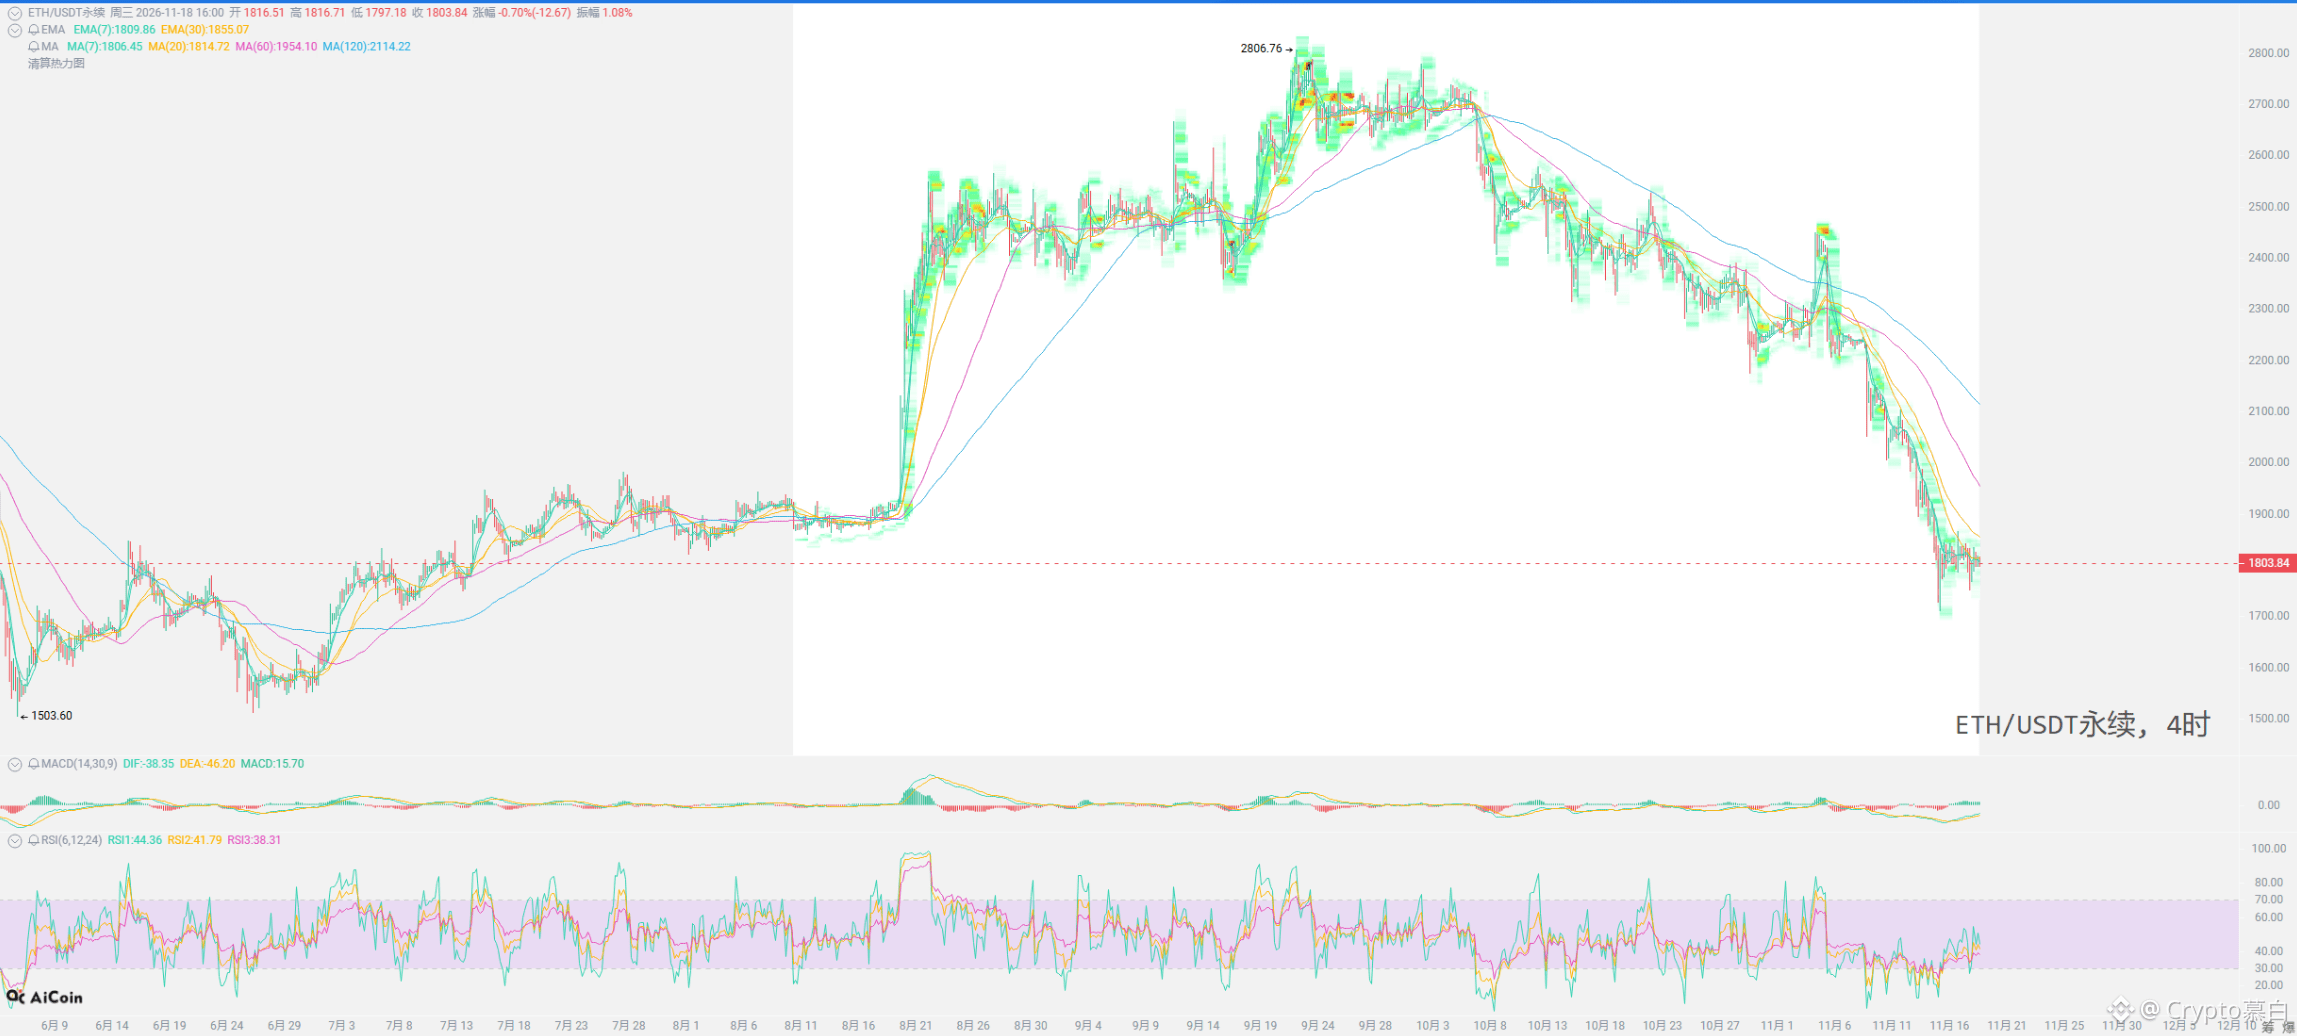
Bearish$BTC $ETH Are we still staying short tonight?
#英伟达财报大超预期,Q4营收展望1300亿美元
#英伟达财报大超预期,Q4营收展望1300亿美元
567
·
--
Partly True
One question every night: $BTC $ETH , are you free?
Da Bai said we’re keeping tonight free, after all.
#英伟达财报大超预期,Q4营收展望1300亿美元
{future}(ETHUSDT)
{future}(BTCUSDT)
One question every night: $BTC $ETH , are you free?
Da Bai said we’re keeping tonight free, after all.
#英伟达财报大超预期,Q4营收展望1300亿美元
Da Bai said we’re keeping tonight free, after all.
#英伟达财报大超预期,Q4营收展望1300亿美元
1.5k
·
--
Bearish
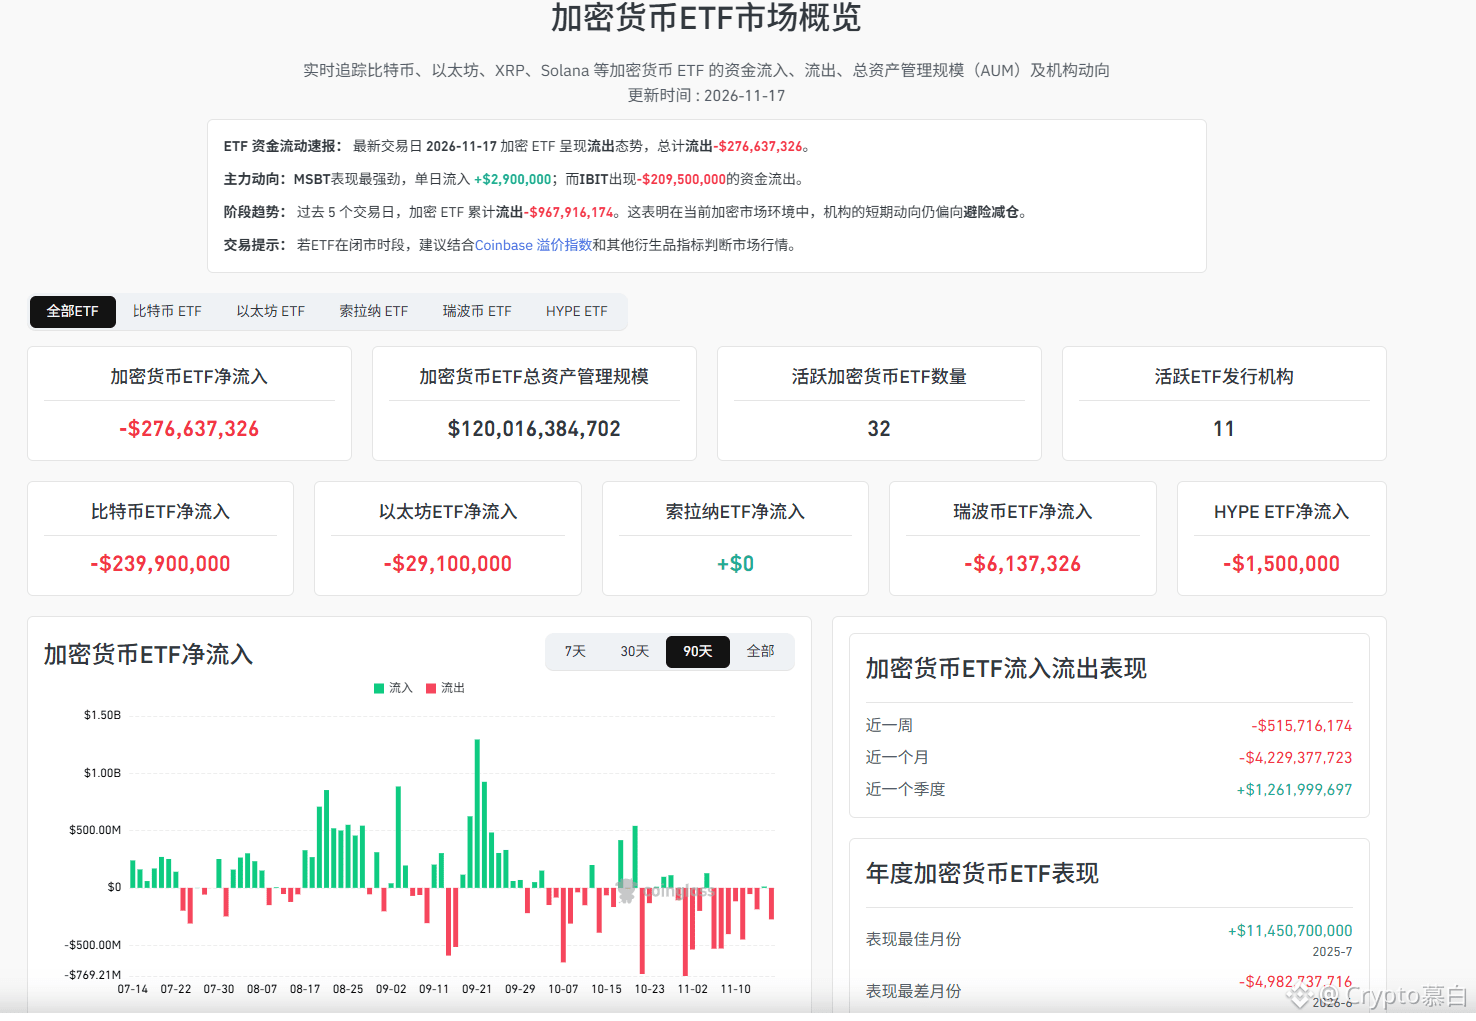
ETF funds flowed out again, and the outflows were highly concentrated
$BTC and $ETH saw outflows, with IBIT and ETHA leading the way
Most products saw zero flows. Money is flowing out, while also concentrating in the largest funds
Yesterday’s U.S. spot ETFs:
Bitcoin saw net outflows of $239.9 million, and Ethereum saw net outflows of $29.1 million.
On the BTC side, outflows came almost entirely from the biggest funds:
IBIT saw $209.5 million in outflows for the day, GBTC saw $17.7 million, ARKB $13.1 million, and BRRR $3.6 million.
Only MSBT bucked the trend, with $2.9 million in inflows. Grayscale BTC saw inflows of $1.1 million, while FBTC, BITB, BTCO, EZBC, HODL, and BTCW all recorded zero flows.
The ETH side was similar:
ETHA saw $27.6 million in outflows, and ETHB $2.8 million. Only ETHW bucked the trend, with $1.3 million in inflows; most of the rest recorded zero flows.
This isn’t a market-wide retreat; money is concentrating in a handful of leading products.
In late October, BTC ETFs saw daily outflows of as much as $635 million, then $137.3 million flowed back in on October 29. Institutions have been shifting back and forth in the short term, and IBIT remains the key variable in the overall picture.
#英伟达财报大超预期,Q4营收展望1300亿美元
ETF funds flowed out again, and the outflows were highly concentrated
$BTC and $ETH saw outflows, with IBIT and ETHA leading the way
Most products saw zero flows. Money is flowing out, while also concentrating in the largest funds
Yesterday’s U.S. spot ETFs:
Bitcoin saw net outflows of $239.9 million, and Ethereum saw net outflows of $29.1 million.
On the BTC side, outflows came almost entirely from the biggest funds:
IBIT saw $209.5 million in outflows for the day, GBTC saw $17.7 million, ARKB $13.1 million, and BRRR $3.6 million.
Only MSBT bucked the trend, with $2.9 million in inflows. Grayscale BTC saw inflows of $1.1 million, while FBTC, BITB, BTCO, EZBC, HODL, and BTCW all recorded zero flows.
The ETH side was similar:
ETHA saw $27.6 million in outflows, and ETHB $2.8 million. Only ETHW bucked the trend, with $1.3 million in inflows; most of the rest recorded zero flows.
This isn’t a market-wide retreat; money is concentrating in a handful of leading products.
In late October, BTC ETFs saw daily outflows of as much as $635 million, then $137.3 million flowed back in on October 29. Institutions have been shifting back and forth in the short term, and IBIT remains the key variable in the overall picture.
#英伟达财报大超预期,Q4营收展望1300亿美元
$BTC and $ETH saw outflows, with IBIT and ETHA leading the way
Most products saw zero flows. Money is flowing out, while also concentrating in the largest funds
Yesterday’s U.S. spot ETFs:
Bitcoin saw net outflows of $239.9 million, and Ethereum saw net outflows of $29.1 million.
On the BTC side, outflows came almost entirely from the biggest funds:
IBIT saw $209.5 million in outflows for the day, GBTC saw $17.7 million, ARKB $13.1 million, and BRRR $3.6 million.
Only MSBT bucked the trend, with $2.9 million in inflows. Grayscale BTC saw inflows of $1.1 million, while FBTC, BITB, BTCO, EZBC, HODL, and BTCW all recorded zero flows.
The ETH side was similar:
ETHA saw $27.6 million in outflows, and ETHB $2.8 million. Only ETHW bucked the trend, with $1.3 million in inflows; most of the rest recorded zero flows.
This isn’t a market-wide retreat; money is concentrating in a handful of leading products.
In late October, BTC ETFs saw daily outflows of as much as $635 million, then $137.3 million flowed back in on October 29. Institutions have been shifting back and forth in the short term, and IBIT remains the key variable in the overall picture.
#英伟达财报大超预期,Q4营收展望1300亿美元
834
·
--
Bearish
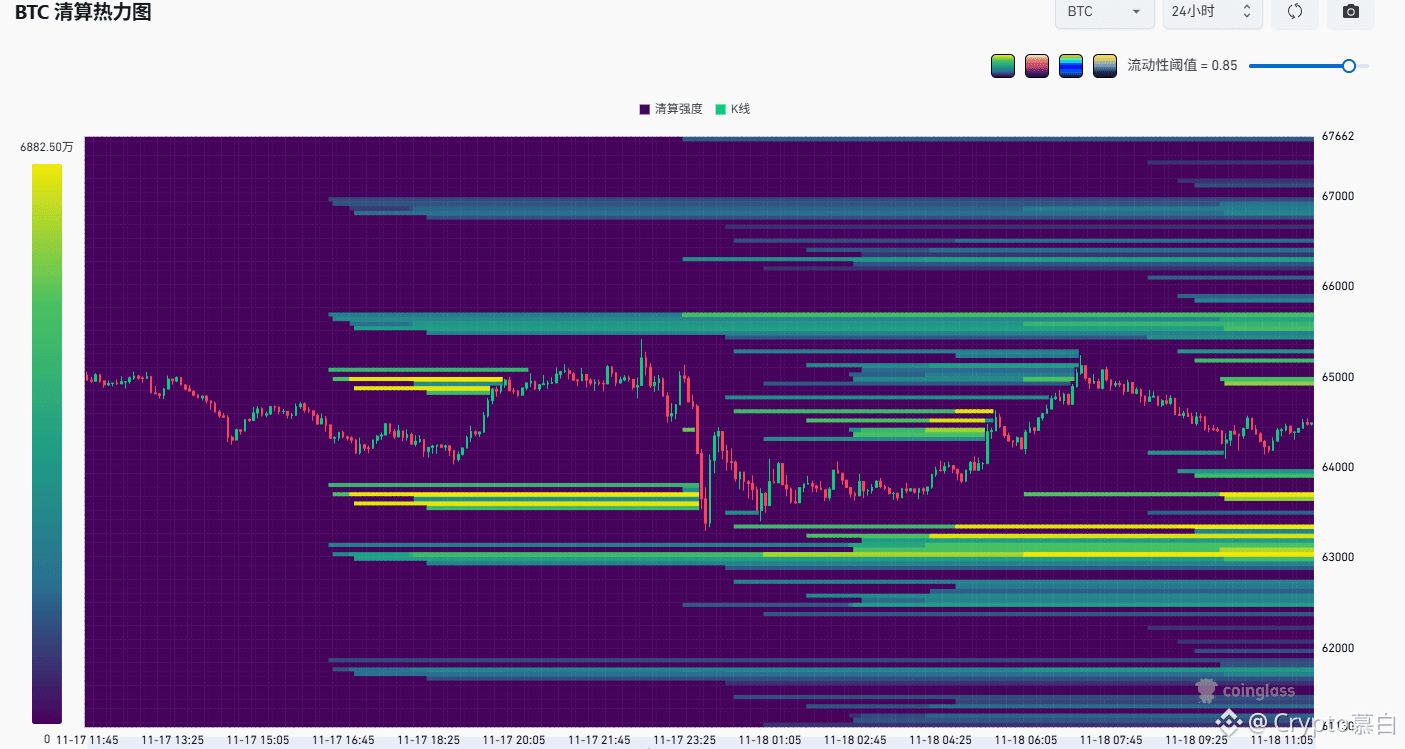
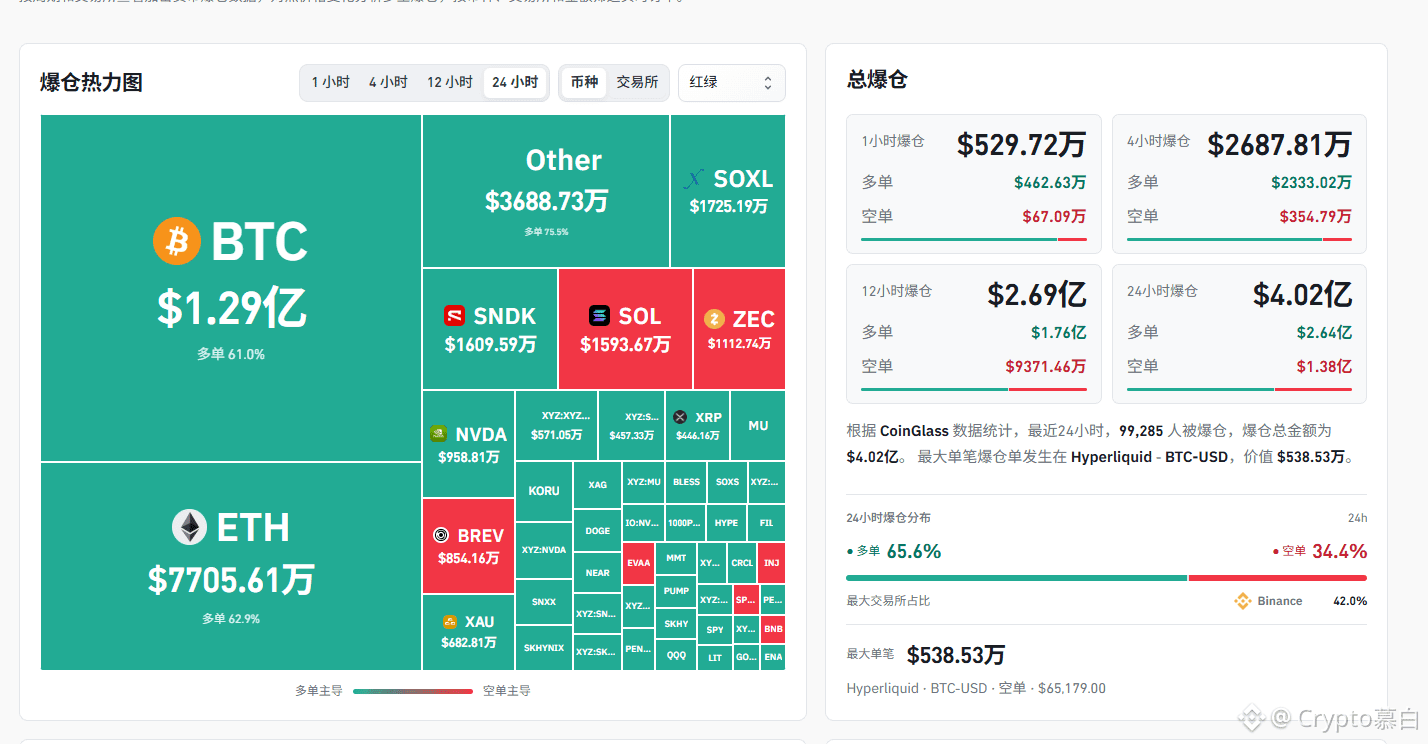
$BTC bounced but got stuck again. $2.34 billion liquidated in 24 hours, and major players remain bearish
The 65,500 level above is the short squeeze trigger; 63,400 below is the long liquidation warning
Major players hold $168 million in net shorts. Don’t rush to chase the bounce
BTC has been chopping around $64,000. It surged to 65,268 in the morning session, then fell back, with bulls unable to gain traction. Over the past 7 days, it has fallen a total of 12.6%.
Longs took heavy losses. About $2.34 billion was liquidated across the market in 24 hours, including $1.517 billion in long liquidations—about 1.84 times the amount of short liquidations.
Large traders remain bearish. The top 50 BTC traders on Hyperliquid hold $692 million in short positions, compared with just $524 million in longs, leaving net shorts of $168 million. Net aggressive selling came to about $14.95 million.
The liquidation map shows:
Above, between 65,500 and 66,500, there are about $48.52 million in short liquidation levels.
Below, between 60,500 and 62,000, there are about $169 million in long liquidation levels.
The next move hinges on two levels:
A break above 65,500 could force some shorts to close, accelerating the bounce;
A drop below 63,400 would further heighten the risk of long liquidations below.
But large traders are bearish for now. Whether the bounce can last depends on whether aggressive trading and open interest rise in tandem. One quick spike higher isn’t enough.
#英伟达财报大超预期,Q4营收展望1300亿美元
{future}(BTCUSDT)
$BTC bounced but got stuck again. $2.34 billion liquidated in 24 hours, and major players remain bearish
The 65,500 level above is the short squeeze trigger; 63,400 below is the long liquidation warning
Major players hold $168 million in net shorts. Don’t rush to chase the bounce
BTC has been chopping around $64,000. It surged to 65,268 in the morning session, then fell back, with bulls unable to gain traction. Over the past 7 days, it has fallen a total of 12.6%.
Longs took heavy losses. About $2.34 billion was liquidated across the market in 24 hours, including $1.517 billion in long liquidations—about 1.84 times the amount of short liquidations.
Large traders remain bearish. The top 50 BTC traders on Hyperliquid hold $692 million in short positions, compared with just $524 million in longs, leaving net shorts of $168 million. Net aggressive selling came to about $14.95 million.
The liquidation map shows:
Above, between 65,500 and 66,500, there are about $48.52 million in short liquidation levels.
Below, between 60,500 and 62,000, there are about $169 million in long liquidation levels.
The next move hinges on two levels:
A break above 65,500 could force some shorts to close, accelerating the bounce;
A drop below 63,400 would further heighten the risk of long liquidations below.
But large traders are bearish for now. Whether the bounce can last depends on whether aggressive trading and open interest rise in tandem. One quick spike higher isn’t enough.
#英伟达财报大超预期,Q4营收展望1300亿美元
The 65,500 level above is the short squeeze trigger; 63,400 below is the long liquidation warning
Major players hold $168 million in net shorts. Don’t rush to chase the bounce
BTC has been chopping around $64,000. It surged to 65,268 in the morning session, then fell back, with bulls unable to gain traction. Over the past 7 days, it has fallen a total of 12.6%.
Longs took heavy losses. About $2.34 billion was liquidated across the market in 24 hours, including $1.517 billion in long liquidations—about 1.84 times the amount of short liquidations.
Large traders remain bearish. The top 50 BTC traders on Hyperliquid hold $692 million in short positions, compared with just $524 million in longs, leaving net shorts of $168 million. Net aggressive selling came to about $14.95 million.
The liquidation map shows:
Above, between 65,500 and 66,500, there are about $48.52 million in short liquidation levels.
Below, between 60,500 and 62,000, there are about $169 million in long liquidation levels.
The next move hinges on two levels:
A break above 65,500 could force some shorts to close, accelerating the bounce;
A drop below 63,400 would further heighten the risk of long liquidations below.
But large traders are bearish for now. Whether the bounce can last depends on whether aggressive trading and open interest rise in tandem. One quick spike higher isn’t enough.
#英伟达财报大超预期,Q4营收展望1300亿美元
628
·
--
Bearish
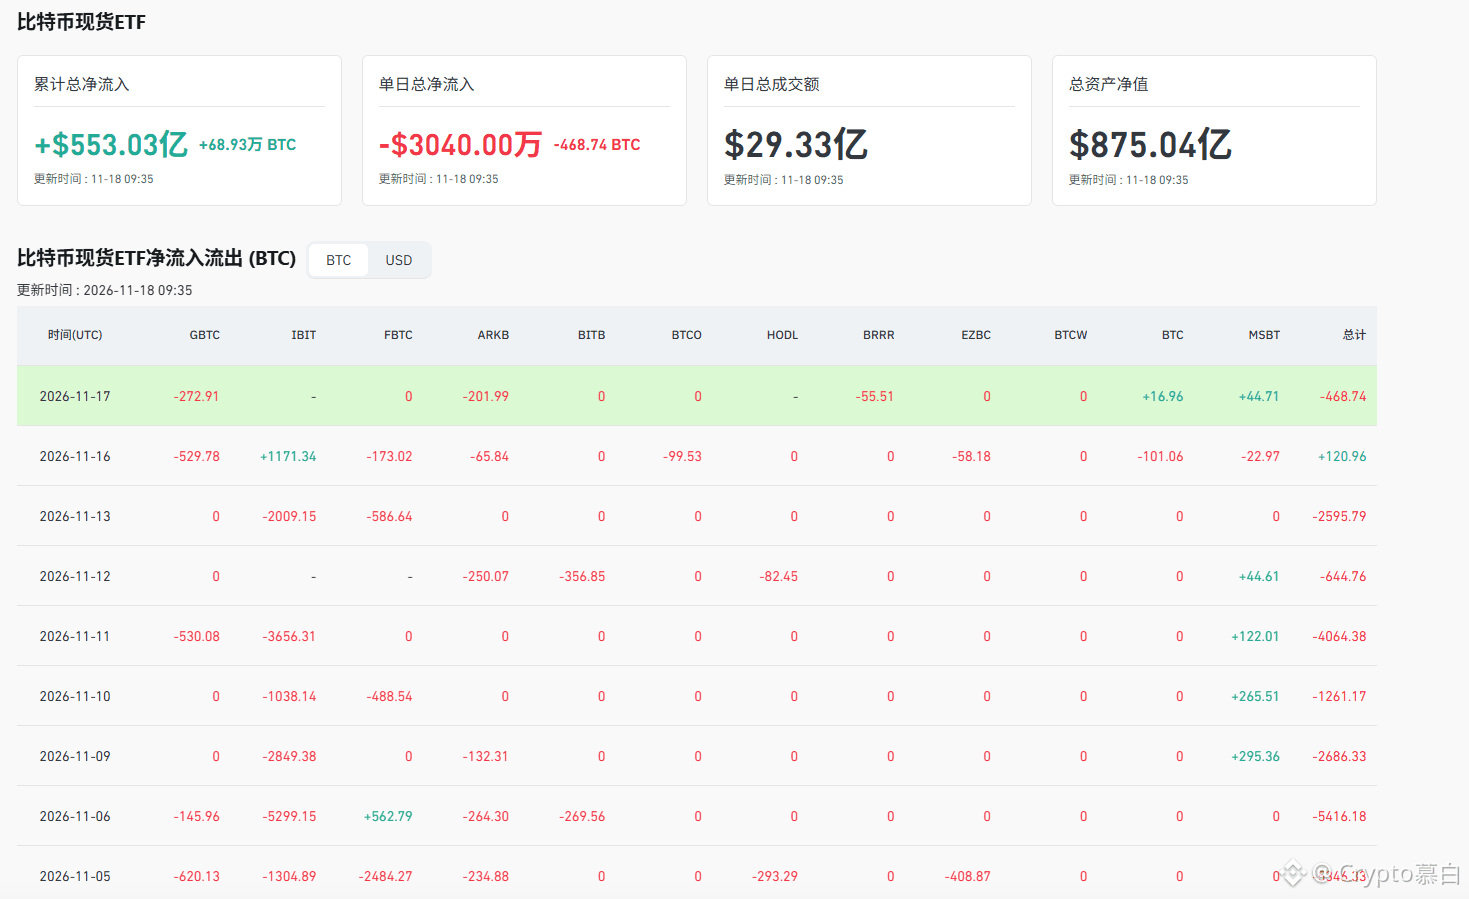
$BTC fell to around 64,000, retracing about half from the high
But the dip buyers haven’t come back yet
About half of the circulating BTC is at a loss; in late September, it was less than one quarter
In on-chain transfers on November 15, total losses were 5.6 times profits, the highest since mid-July. Note that on-chain transfers do not equal selling; they just move cost basis.
The holding structure is also shortening: the short-term/long-term holder ratio rose to the highest since late February, and long-term holders have reduced by 112,000 BTC in one month.
Liquidity is tight on both sides: the 30-day stablecoin supply fell by about $16.5 billion, mainly USDT and USDC, and it is concentrated on trading platforms;
Bitcoin ETF saw net outflows of over $850 million in a week. This round of declines also came before weekend liquidations, while rising U.S. Treasury yields and a stronger dollar are adding pressure.
On the other side, the Anthropic IPO is drawing attention: two valuation-linked contracts on Hyperliquid have open interest exceeding $334 million. CZ also listed it as a possible cause, but said correlation does not imply causation, and there is no evidence that people sold coins to chase the IPO.
#AnthropicIPO需求强劲,发行价或超80美元
{future}(BTCUSDT)
$BTC fell to around 64,000, retracing about half from the high
But the dip buyers haven’t come back yet
About half of the circulating BTC is at a loss; in late September, it was less than one quarter
In on-chain transfers on November 15, total losses were 5.6 times profits, the highest since mid-July. Note that on-chain transfers do not equal selling; they just move cost basis.
The holding structure is also shortening: the short-term/long-term holder ratio rose to the highest since late February, and long-term holders have reduced by 112,000 BTC in one month.
Liquidity is tight on both sides: the 30-day stablecoin supply fell by about $16.5 billion, mainly USDT and USDC, and it is concentrated on trading platforms;
Bitcoin ETF saw net outflows of over $850 million in a week. This round of declines also came before weekend liquidations, while rising U.S. Treasury yields and a stronger dollar are adding pressure.
On the other side, the Anthropic IPO is drawing attention: two valuation-linked contracts on Hyperliquid have open interest exceeding $334 million. CZ also listed it as a possible cause, but said correlation does not imply causation, and there is no evidence that people sold coins to chase the IPO.
#AnthropicIPO需求强劲,发行价或超80美元
But the dip buyers haven’t come back yet
About half of the circulating BTC is at a loss; in late September, it was less than one quarter
In on-chain transfers on November 15, total losses were 5.6 times profits, the highest since mid-July. Note that on-chain transfers do not equal selling; they just move cost basis.
The holding structure is also shortening: the short-term/long-term holder ratio rose to the highest since late February, and long-term holders have reduced by 112,000 BTC in one month.
Liquidity is tight on both sides: the 30-day stablecoin supply fell by about $16.5 billion, mainly USDT and USDC, and it is concentrated on trading platforms;
Bitcoin ETF saw net outflows of over $850 million in a week. This round of declines also came before weekend liquidations, while rising U.S. Treasury yields and a stronger dollar are adding pressure.
On the other side, the Anthropic IPO is drawing attention: two valuation-linked contracts on Hyperliquid have open interest exceeding $334 million. CZ also listed it as a possible cause, but said correlation does not imply causation, and there is no evidence that people sold coins to chase the IPO.
#AnthropicIPO需求强劲,发行价或超80美元
682
·
--
Bearish
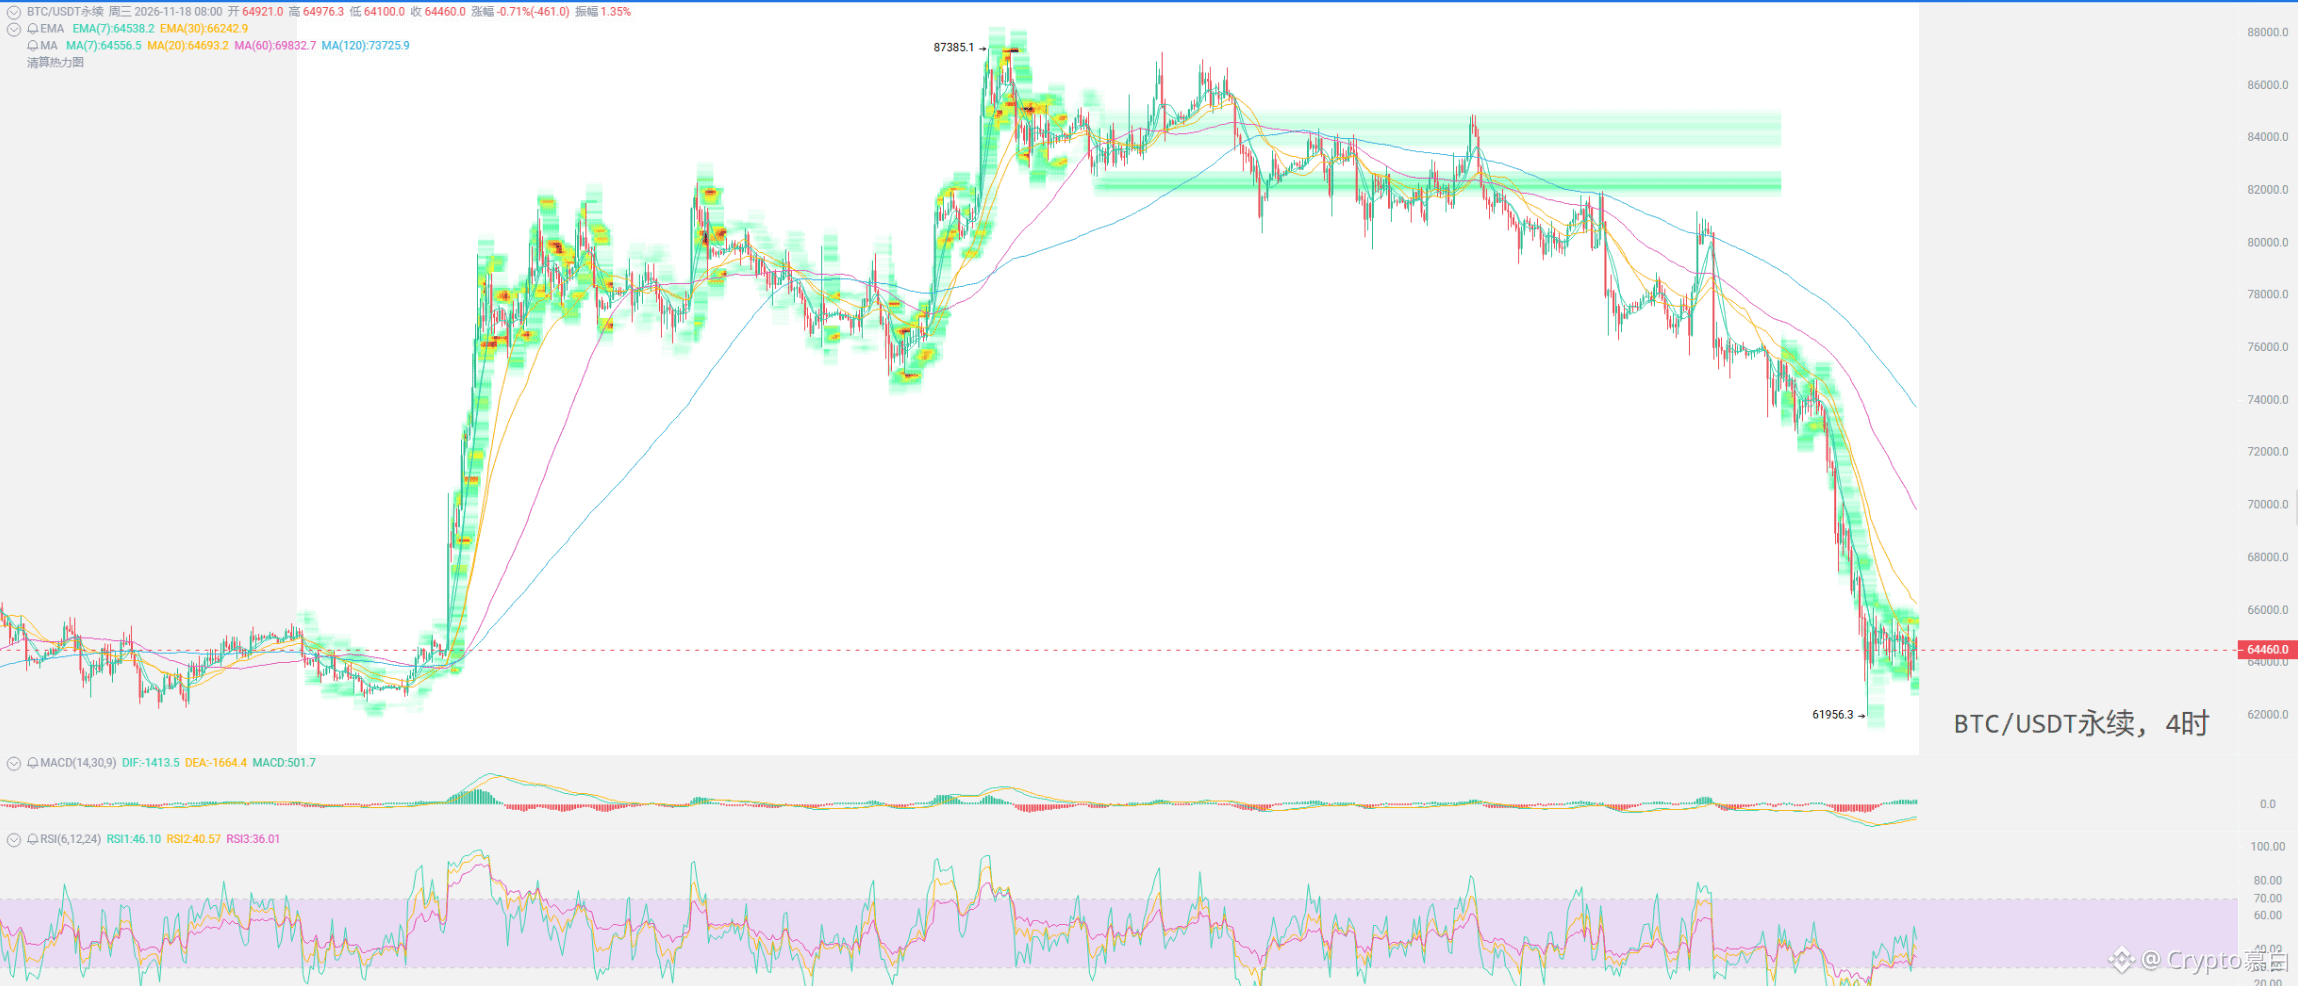
$BTC This sell-off is starting to look like “capitulation”
The 62,000–66,000 range is a key support zone
A break below 62,000 puts 58,500 and even 53,700 in sight; a move back above 74,100 would confirm a bottom
Realized losses have surged to near a local historic low, while leveraged longs have also been liquidated en masse. On November 13–14, long liquidations relative to total open interest reached one of their highest levels since 2023.
Around one-fifth of short-term holders’ coins are concentrated in the 62,000–66,000 range. Some 66,000 BTC also changed hands there during the two days of heavy selling. Some investors are cutting their losses here, while others are buying.
Overall demand remains weak: stablecoin supply has fallen 4.2% over the past 90 days; Bitcoin ETFs saw $2.6 billion in net outflows over the 10 trading days through November 13; and MARA and Riot sold around 28,000 BTC this month to fund AI and HPC efforts. Only Strategy is still buying.
Here are two levels to watch:
To the downside, a daily close below 62,000 would put short-term holders under greater pressure. Combined with the concentration of leveraged long liquidations below, this could lead to a rapid drop to the June low of 58,500, or even the realized price of 53,700.
To the upside, a move back above the short-term holder cost basis of 74,100 would make a confirmed bottom more likely.
#英伟达财报大超预期,Q4营收展望1300亿美元
{future}(BTCUSDT)
$BTC This sell-off is starting to look like “capitulation”
The 62,000–66,000 range is a key support zone
A break below 62,000 puts 58,500 and even 53,700 in sight; a move back above 74,100 would confirm a bottom
Realized losses have surged to near a local historic low, while leveraged longs have also been liquidated en masse. On November 13–14, long liquidations relative to total open interest reached one of their highest levels since 2023.
Around one-fifth of short-term holders’ coins are concentrated in the 62,000–66,000 range. Some 66,000 BTC also changed hands there during the two days of heavy selling. Some investors are cutting their losses here, while others are buying.
Overall demand remains weak: stablecoin supply has fallen 4.2% over the past 90 days; Bitcoin ETFs saw $2.6 billion in net outflows over the 10 trading days through November 13; and MARA and Riot sold around 28,000 BTC this month to fund AI and HPC efforts. Only Strategy is still buying.
Here are two levels to watch:
To the downside, a daily close below 62,000 would put short-term holders under greater pressure. Combined with the concentration of leveraged long liquidations below, this could lead to a rapid drop to the June low of 58,500, or even the realized price of 53,700.
To the upside, a move back above the short-term holder cost basis of 74,100 would make a confirmed bottom more likely.
#英伟达财报大超预期,Q4营收展望1300亿美元
The 62,000–66,000 range is a key support zone
A break below 62,000 puts 58,500 and even 53,700 in sight; a move back above 74,100 would confirm a bottom
Realized losses have surged to near a local historic low, while leveraged longs have also been liquidated en masse. On November 13–14, long liquidations relative to total open interest reached one of their highest levels since 2023.
Around one-fifth of short-term holders’ coins are concentrated in the 62,000–66,000 range. Some 66,000 BTC also changed hands there during the two days of heavy selling. Some investors are cutting their losses here, while others are buying.
Overall demand remains weak: stablecoin supply has fallen 4.2% over the past 90 days; Bitcoin ETFs saw $2.6 billion in net outflows over the 10 trading days through November 13; and MARA and Riot sold around 28,000 BTC this month to fund AI and HPC efforts. Only Strategy is still buying.
Here are two levels to watch:
To the downside, a daily close below 62,000 would put short-term holders under greater pressure. Combined with the concentration of leveraged long liquidations below, this could lead to a rapid drop to the June low of 58,500, or even the realized price of 53,700.
To the upside, a move back above the short-term holder cost basis of 74,100 would make a confirmed bottom more likely.
#英伟达财报大超预期,Q4营收展望1300亿美元
1
1k
·
--
Bearish
Bitcoin ETFs have finally turned positive, but don’t celebrate too soon
This looks more like one player propping things up than a market-wide recovery
The numbers are positive, but breadth hasn’t followed; IBIT is carrying the show while GBTC is still bleeding
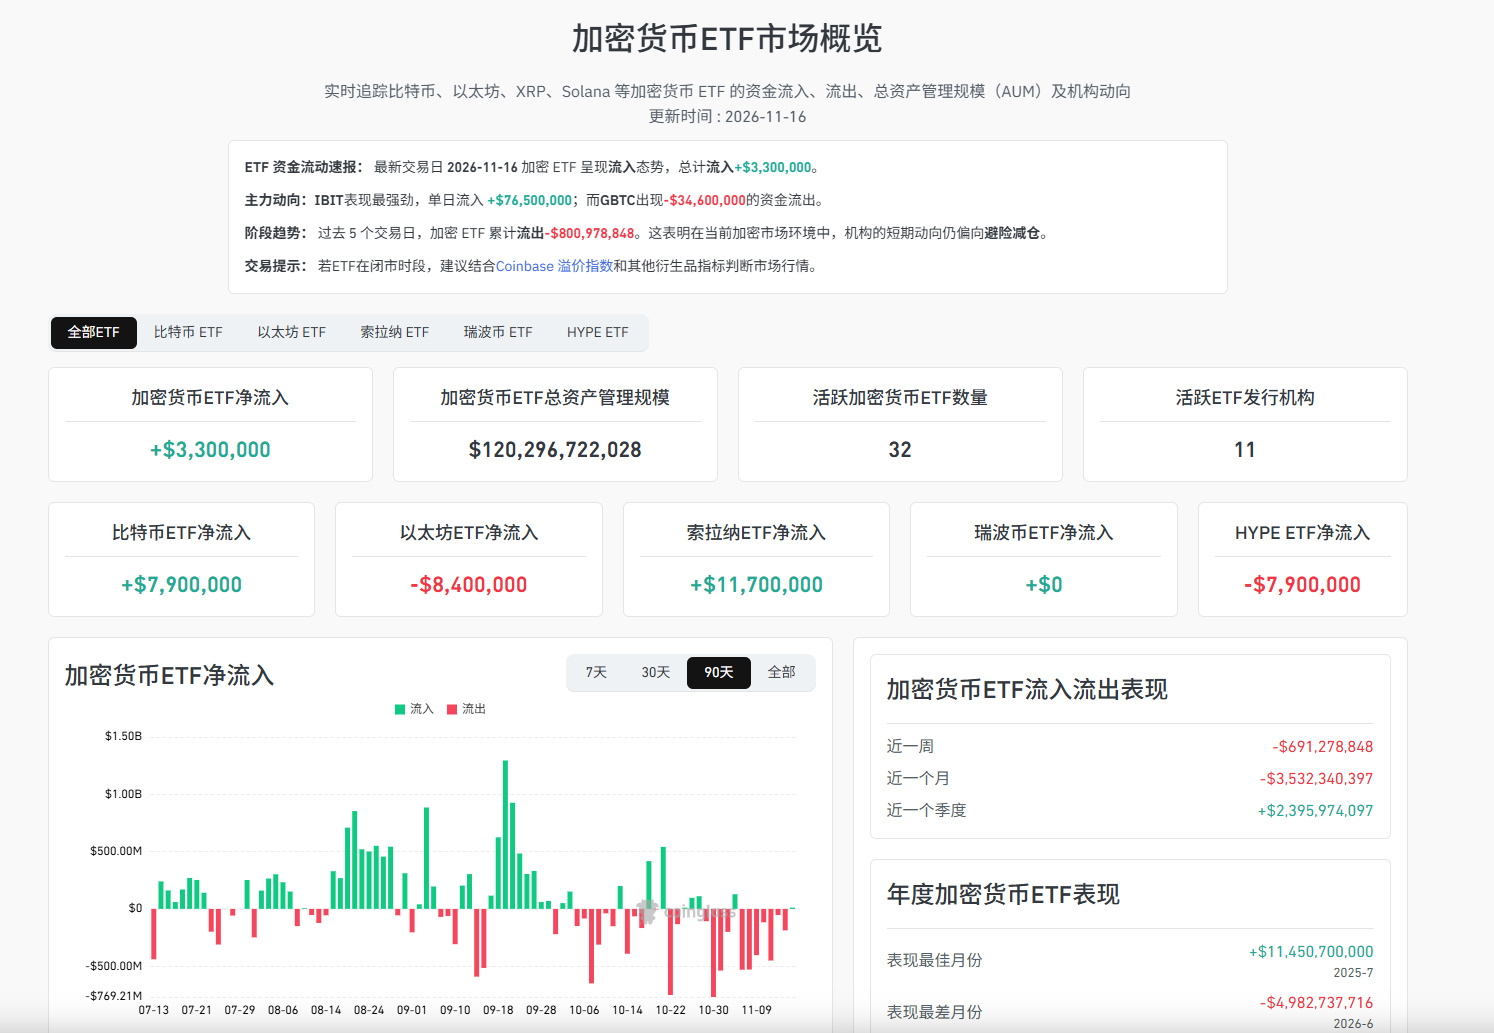
Yesterday, U.S. spot Bitcoin ETFs saw net inflows of $7.9 million, their first positive day in seven trading days.
But the breakdown tells the story: it was almost entirely thanks to BlackRock’s IBIT, which posted $76.5 million in net inflows for the day.
Most of the rest were bleeding: GBTC saw $34.6 million in outflows, and Grayscale BTC saw $6.6 million. Fidelity’s FBTC, ARKB, BTCO, EZBC, and MSBT also all saw outflows, eating up most of IBIT’s inflows.
Ethereum hasn’t bounced back yet: spot ETFs saw $8.4 million in net outflows, with Fidelity’s FETH losing $5 million and Grayscale’s ETHE losing $4.4 million. Only Grayscale Mini ETH bucked the trend, bringing in $1 million.
Over the past few months, flows have repeatedly followed the same pattern: IBIT flips positive for a day, while GBTC continues to see outflows. Existing high-fee channels are still bleeding, and nearly all new money is coming through IBIT.
So this return to positive territory looks more like a rebound through a single channel than a recovery in market-wide risk appetite.
$BTC $ETH #本周财报与宏观事件密集,市场再迎波动考验
{future}(ETHUSDT)
{future}(BTCUSDT)
Bitcoin ETFs have finally turned positive, but don’t celebrate too soon
This looks more like one player propping things up than a market-wide recovery
The numbers are positive, but breadth hasn’t followed; IBIT is carrying the show while GBTC is still bleeding
Yesterday, U.S. spot Bitcoin ETFs saw net inflows of $7.9 million, their first positive day in seven trading days.
But the breakdown tells the story: it was almost entirely thanks to BlackRock’s IBIT, which posted $76.5 million in net inflows for the day.
Most of the rest were bleeding: GBTC saw $34.6 million in outflows, and Grayscale BTC saw $6.6 million. Fidelity’s FBTC, ARKB, BTCO, EZBC, and MSBT also all saw outflows, eating up most of IBIT’s inflows.
Ethereum hasn’t bounced back yet: spot ETFs saw $8.4 million in net outflows, with Fidelity’s FETH losing $5 million and Grayscale’s ETHE losing $4.4 million. Only Grayscale Mini ETH bucked the trend, bringing in $1 million.
Over the past few months, flows have repeatedly followed the same pattern: IBIT flips positive for a day, while GBTC continues to see outflows. Existing high-fee channels are still bleeding, and nearly all new money is coming through IBIT.
So this return to positive territory looks more like a rebound through a single channel than a recovery in market-wide risk appetite.
$BTC $ETH #本周财报与宏观事件密集,市场再迎波动考验
This looks more like one player propping things up than a market-wide recovery
The numbers are positive, but breadth hasn’t followed; IBIT is carrying the show while GBTC is still bleeding
Yesterday, U.S. spot Bitcoin ETFs saw net inflows of $7.9 million, their first positive day in seven trading days.
But the breakdown tells the story: it was almost entirely thanks to BlackRock’s IBIT, which posted $76.5 million in net inflows for the day.
Most of the rest were bleeding: GBTC saw $34.6 million in outflows, and Grayscale BTC saw $6.6 million. Fidelity’s FBTC, ARKB, BTCO, EZBC, and MSBT also all saw outflows, eating up most of IBIT’s inflows.
Ethereum hasn’t bounced back yet: spot ETFs saw $8.4 million in net outflows, with Fidelity’s FETH losing $5 million and Grayscale’s ETHE losing $4.4 million. Only Grayscale Mini ETH bucked the trend, bringing in $1 million.
Over the past few months, flows have repeatedly followed the same pattern: IBIT flips positive for a day, while GBTC continues to see outflows. Existing high-fee channels are still bleeding, and nearly all new money is coming through IBIT.
So this return to positive territory looks more like a rebound through a single channel than a recovery in market-wide risk appetite.
$BTC $ETH #本周财报与宏观事件密集,市场再迎波动考验
4
4k
Log in to explore more content
Join global crypto users on Binance Square
⚡️ Get latest and useful information about crypto.
💬 Trusted by the world’s largest crypto exchange.
👍 Discover real insights from verified creators.
Email / Phone number
Trending Topics
IsAnthropic’s$1.5TMarketCapJustified?
60,489 views
303 Discussing
Anthropic Set to Open at $105 in Record Nasdaq Debut
Binance News
·16 Likes
·18.7k views
BTCBelow$62KAmidHikeFearsAndShiftToAnthropic
17,542 views
111 Discussing
NvidiaBoardReportedlySplitOverHuang’sReturn
251,080 views
1,990 Discussing