
Kamile Uray
1.7k Posts

Kamile Uray
Report
Block User
20 Following
4.0K+ Followers
12.1K+ Liked
Posts
All
Quotes
Videos
·
--
See translation
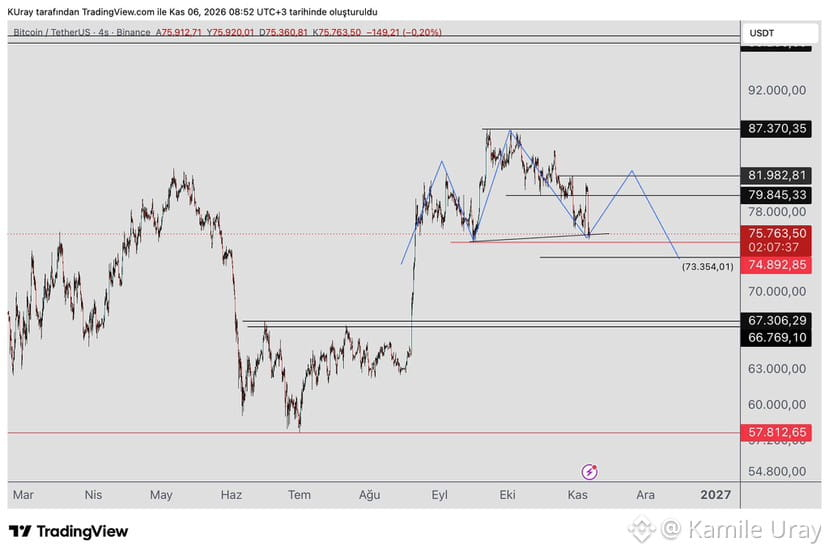
The rally in #BTC yesterday was short-lived, followed by a sharp sell-off across all markets. As previously discussed, the recent rise appears to be merely a corrective bounce within a broader downtrend; our outlook remains unchanged.
The structure—marked in blue—still appears to be completing the "shoulder" of a Head and Shoulders (H&S) pattern. If the price fails to close above 81,982, the rally should be viewed as a corrective bounce, and the downward trend may continue.
A daily close below 74,892 would activate the H&S pattern, signaling further declines with a target in the 66,000–67,000 range. It is important to note that declines rarely occur in a straight line; intermittent upward bounces—acting as reactions to the downward movement—are to be expected.
Key support levels to monitor are 74,892, followed by 73,354, 67,306, and 66,769.
The 74,892 level is critical during this decline; if it holds on a daily timeframe, a "lower low" (relative to the most recent downward wave) will not be established, potentially allowing for an upward move before the pattern’s target is reached.
The rally in #BTC yesterday was short-lived, followed by a sharp sell-off across all markets. As previously discussed, the recent rise appears to be merely a corrective bounce within a broader downtrend; our outlook remains unchanged.
The structure—marked in blue—still appears to be completing the "shoulder" of a Head and Shoulders (H&S) pattern. If the price fails to close above 81,982, the rally should be viewed as a corrective bounce, and the downward trend may continue.
A daily close below 74,892 would activate the H&S pattern, signaling further declines with a target in the 66,000–67,000 range. It is important to note that declines rarely occur in a straight line; intermittent upward bounces—acting as reactions to the downward movement—are to be expected.
Key support levels to monitor are 74,892, followed by 73,354, 67,306, and 66,769.
The 74,892 level is critical during this decline; if it holds on a daily timeframe, a "lower low" (relative to the most recent downward wave) will not be established, potentially allowing for an upward move before the pattern’s target is reached.
The structure—marked in blue—still appears to be completing the "shoulder" of a Head and Shoulders (H&S) pattern. If the price fails to close above 81,982, the rally should be viewed as a corrective bounce, and the downward trend may continue.
A daily close below 74,892 would activate the H&S pattern, signaling further declines with a target in the 66,000–67,000 range. It is important to note that declines rarely occur in a straight line; intermittent upward bounces—acting as reactions to the downward movement—are to be expected.
Key support levels to monitor are 74,892, followed by 73,354, 67,306, and 66,769.
The 74,892 level is critical during this decline; if it holds on a daily timeframe, a "lower low" (relative to the most recent downward wave) will not be established, potentially allowing for an upward move before the pattern’s target is reached.
2
2
171
·
--
See translation
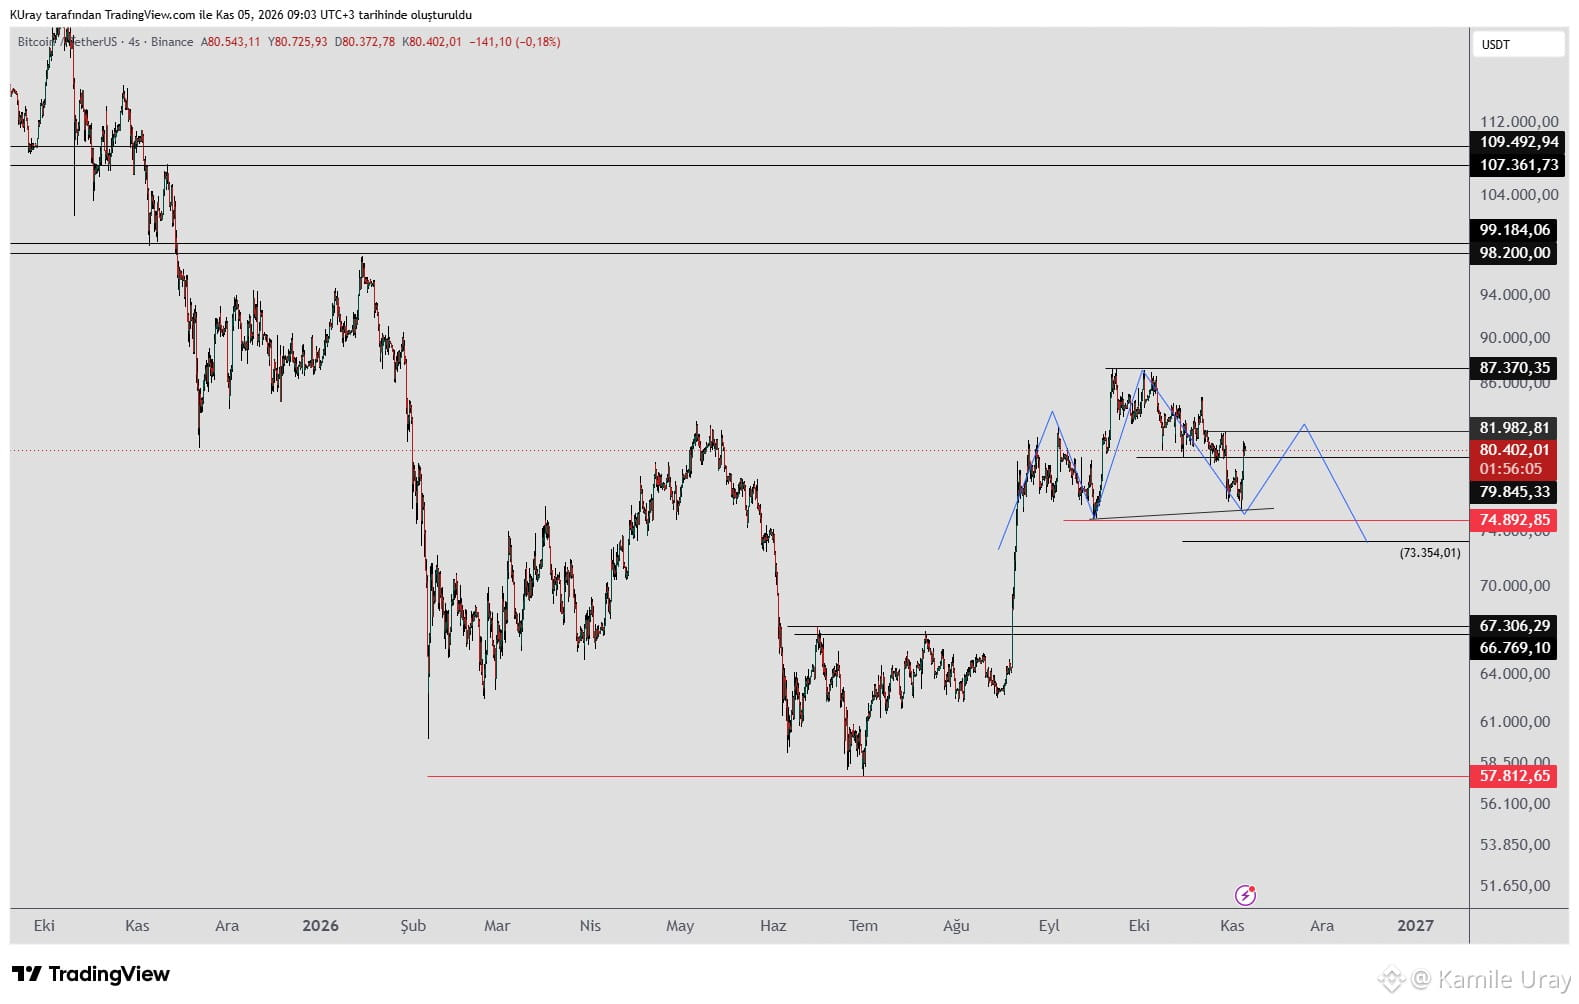
#BTC – The outcome of the midterm elections—specifically Trump’s loss—was perceived positively by the market, triggering an upward move.
This rally is currently completing the shoulder of a potential Head and Shoulders (H&S) pattern (marked in blue).
A daily close above the 81,982 peak would invalidate this pattern, suggesting that the uptrend is likely to continue.
If the price fails to close above 81,982, the current rise may be interpreted merely as a corrective rebound within a broader downtrend, meaning the decline could resume.
A daily close below 74,892 would activate the H&S pattern, pointing toward further downside, with the 66,000–67,000 range as the target.
Declines rarely occur in a straight line; temporary rallies—acting as corrective rebounds—can emerge along the way.
Key support levels to monitor are 74,892, followed by 73,354, 67,306, and 66,769.
If the price manages to hold the 74,892 level on a daily basis during a pullback, it would mean a "lower low" (relative to the most recent downward wave) has not been established; in this scenario, an upward move could occur before the pattern’s target is reached.
#BTC – The outcome of the midterm elections—specifically Trump’s loss—was perceived positively by the market, triggering an upward move.
This rally is currently completing the shoulder of a potential Head and Shoulders (H&S) pattern (marked in blue).
A daily close above the 81,982 peak would invalidate this pattern, suggesting that the uptrend is likely to continue.
If the price fails to close above 81,982, the current rise may be interpreted merely as a corrective rebound within a broader downtrend, meaning the decline could resume.
A daily close below 74,892 would activate the H&S pattern, pointing toward further downside, with the 66,000–67,000 range as the target.
Declines rarely occur in a straight line; temporary rallies—acting as corrective rebounds—can emerge along the way.
Key support levels to monitor are 74,892, followed by 73,354, 67,306, and 66,769.
If the price manages to hold the 74,892 level on a daily basis during a pullback, it would mean a "lower low" (relative to the most recent downward wave) has not been established; in this scenario, an upward move could occur before the pattern’s target is reached.
This rally is currently completing the shoulder of a potential Head and Shoulders (H&S) pattern (marked in blue).
A daily close above the 81,982 peak would invalidate this pattern, suggesting that the uptrend is likely to continue.
If the price fails to close above 81,982, the current rise may be interpreted merely as a corrective rebound within a broader downtrend, meaning the decline could resume.
A daily close below 74,892 would activate the H&S pattern, pointing toward further downside, with the 66,000–67,000 range as the target.
Declines rarely occur in a straight line; temporary rallies—acting as corrective rebounds—can emerge along the way.
Key support levels to monitor are 74,892, followed by 73,354, 67,306, and 66,769.
If the price manages to hold the 74,892 level on a daily basis during a pullback, it would mean a "lower low" (relative to the most recent downward wave) has not been established; in this scenario, an upward move could occur before the pattern’s target is reached.
236
·
--
See translation
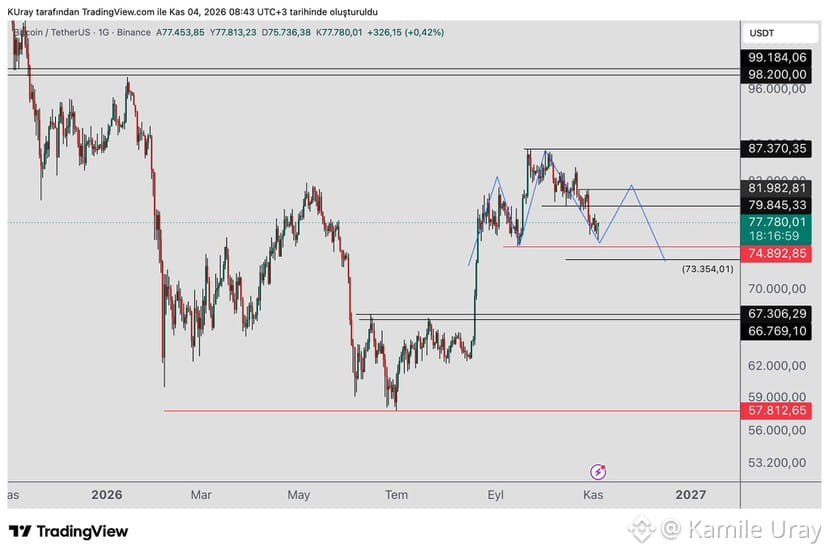
#BTC could form a head-and-shoulders (H&S) pattern, as illustrated in blue at the top.
A close above the 81,982 peak would invalidate this pattern. If the price fails to close above 81,982, the current rise may be viewed merely as a corrective rebound, and the downward trend could continue.
The support levels to watch are 74,892 and 73,354.
In the event of a decline, the 74,892 level is significant on a daily timeframe; if the price holds above this, a recovery is possible.
#BTC could form a head-and-shoulders (H&S) pattern, as illustrated in blue at the top.
A close above the 81,982 peak would invalidate this pattern. If the price fails to close above 81,982, the current rise may be viewed merely as a corrective rebound, and the downward trend could continue.
The support levels to watch are 74,892 and 73,354.
In the event of a decline, the 74,892 level is significant on a daily timeframe; if the price holds above this, a recovery is possible.
A close above the 81,982 peak would invalidate this pattern. If the price fails to close above 81,982, the current rise may be viewed merely as a corrective rebound, and the downward trend could continue.
The support levels to watch are 74,892 and 73,354.
In the event of a decline, the 74,892 level is significant on a daily timeframe; if the price holds above this, a recovery is possible.
161
·
--
See translation
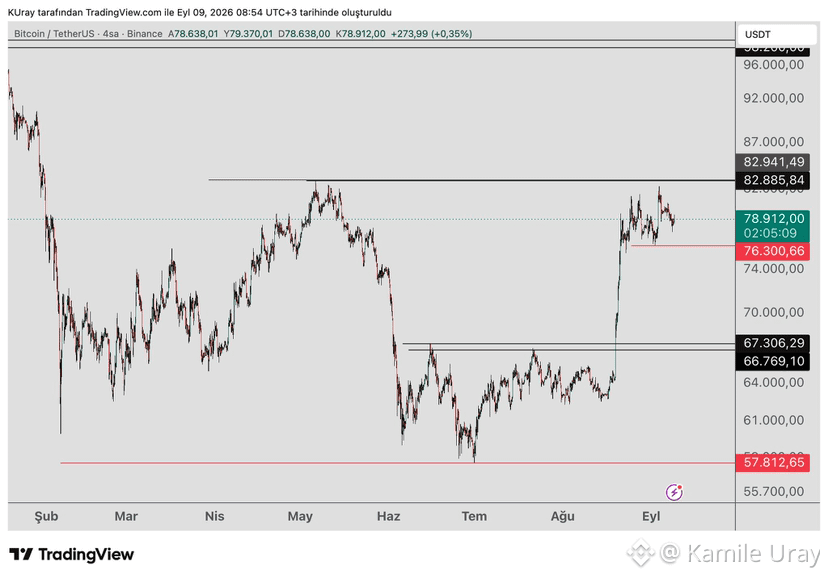
#BTC Unless a close occurs above the 81,982 peak, any upward movement should be viewed as a corrective bounce within a broader downtrend, meaning the decline could potentially continue.
The support levels to monitor are 74,892 and 73,354.
In the event of a decline, the 74,892 level is significant on the daily timeframe; holding above it could allow for a recovery.
Even if a recovery takes place, there remains a possibility of a head-and-shoulders (H&S) pattern forming at the top, signaling further downside—we will continue to track the price waves.
#BTC Unless a close occurs above the 81,982 peak, any upward movement should be viewed as a corrective bounce within a broader downtrend, meaning the decline could potentially continue.
The support levels to monitor are 74,892 and 73,354.
In the event of a decline, the 74,892 level is significant on the daily timeframe; holding above it could allow for a recovery.
Even if a recovery takes place, there remains a possibility of a head-and-shoulders (H&S) pattern forming at the top, signaling further downside—we will continue to track the price waves.
The support levels to monitor are 74,892 and 73,354.
In the event of a decline, the 74,892 level is significant on the daily timeframe; holding above it could allow for a recovery.
Even if a recovery takes place, there remains a possibility of a head-and-shoulders (H&S) pattern forming at the top, signaling further downside—we will continue to track the price waves.
1
280
·
--
See translation
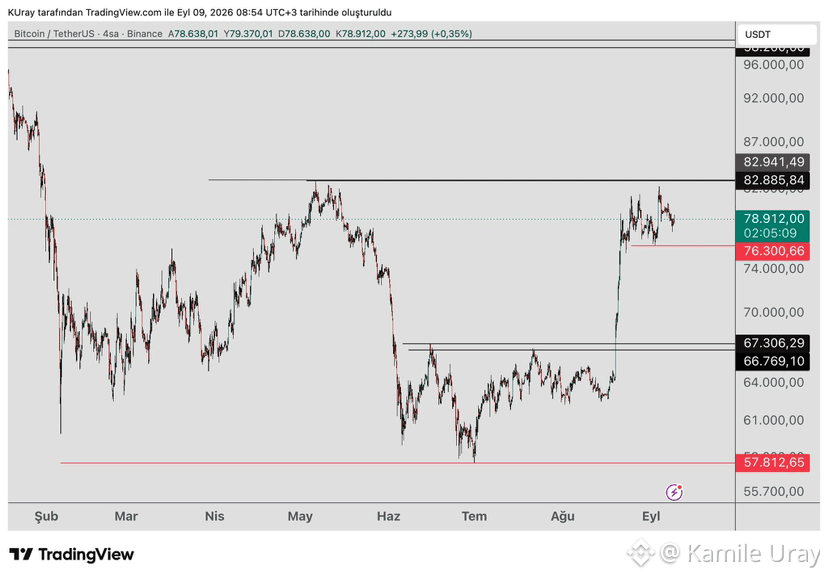
#BTC On the daily timeframe, the price broke below the 79,845 low, with the initial reaction occurring at the 77,569 support level. The second target of the bearish 2.618 pattern we have been tracking has now been reached.
On the upside, we will now monitor the 81,982 peak; the decline may continue as long as there is no daily close above this level.
The support levels to watch are 77,565, 74,892, and 73,354.
Notably, the 74,892 level is significant on the daily chart; if the price holds above it, a recovery is possible. Even in the event of a recovery, a bearish head-and-shoulders (H&S) pattern could form at the top. The structure is not yet complete, so we will continue to monitor the price waves.
#BTC On the daily timeframe, the price broke below the 79,845 low, with the initial reaction occurring at the 77,569 support level. The second target of the bearish 2.618 pattern we have been tracking has now been reached.
On the upside, we will now monitor the 81,982 peak; the decline may continue as long as there is no daily close above this level.
The support levels to watch are 77,565, 74,892, and 73,354.
Notably, the 74,892 level is significant on the daily chart; if the price holds above it, a recovery is possible. Even in the event of a recovery, a bearish head-and-shoulders (H&S) pattern could form at the top. The structure is not yet complete, so we will continue to monitor the price waves.
On the upside, we will now monitor the 81,982 peak; the decline may continue as long as there is no daily close above this level.
The support levels to watch are 77,565, 74,892, and 73,354.
Notably, the 74,892 level is significant on the daily chart; if the price holds above it, a recovery is possible. Even in the event of a recovery, a bearish head-and-shoulders (H&S) pattern could form at the top. The structure is not yet complete, so we will continue to monitor the price waves.
330
·
--
See translation
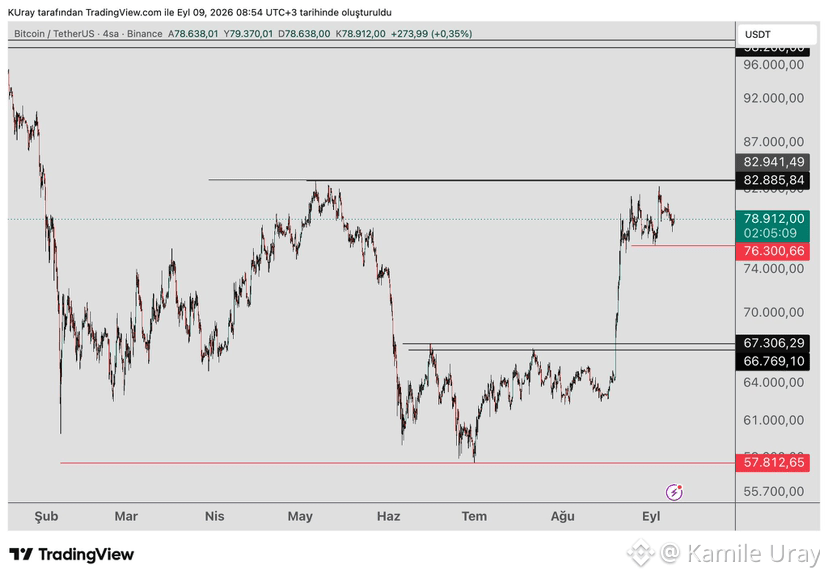
#BTC The interest rate decision was announced yesterday, and the Fed kept rates unchanged. Following the volatility seen last night, the market movement has resumed its previous course.
On the daily timeframe, we are monitoring the 79,845 low; if this level holds, it could trigger some upward momentum.
As long as the price fails to close above the 84,853 peak, the possibility of a decline remains.
If the price stays below 79,845 on the daily chart, it may test the 77,565, 74,892, and 73,354 levels.
In the event of a decline, the 74,892 level is significant on the daily timeframe. If the price remains above this, a recovery is possible. If it closes below this level, we will look to the support zones located at 73,354, 67,306, and 66,769.
#BTC The interest rate decision was announced yesterday, and the Fed kept rates unchanged. Following the volatility seen last night, the market movement has resumed its previous course.
On the daily timeframe, we are monitoring the 79,845 low; if this level holds, it could trigger some upward momentum.
As long as the price fails to close above the 84,853 peak, the possibility of a decline remains.
If the price stays below 79,845 on the daily chart, it may test the 77,565, 74,892, and 73,354 levels.
In the event of a decline, the 74,892 level is significant on the daily timeframe. If the price remains above this, a recovery is possible. If it closes below this level, we will look to the support zones located at 73,354, 67,306, and 66,769.
On the daily timeframe, we are monitoring the 79,845 low; if this level holds, it could trigger some upward momentum.
As long as the price fails to close above the 84,853 peak, the possibility of a decline remains.
If the price stays below 79,845 on the daily chart, it may test the 77,565, 74,892, and 73,354 levels.
In the event of a decline, the 74,892 level is significant on the daily timeframe. If the price remains above this, a recovery is possible. If it closes below this level, we will look to the support zones located at 73,354, 67,306, and 66,769.
2
160
·
--
Verified
See translation
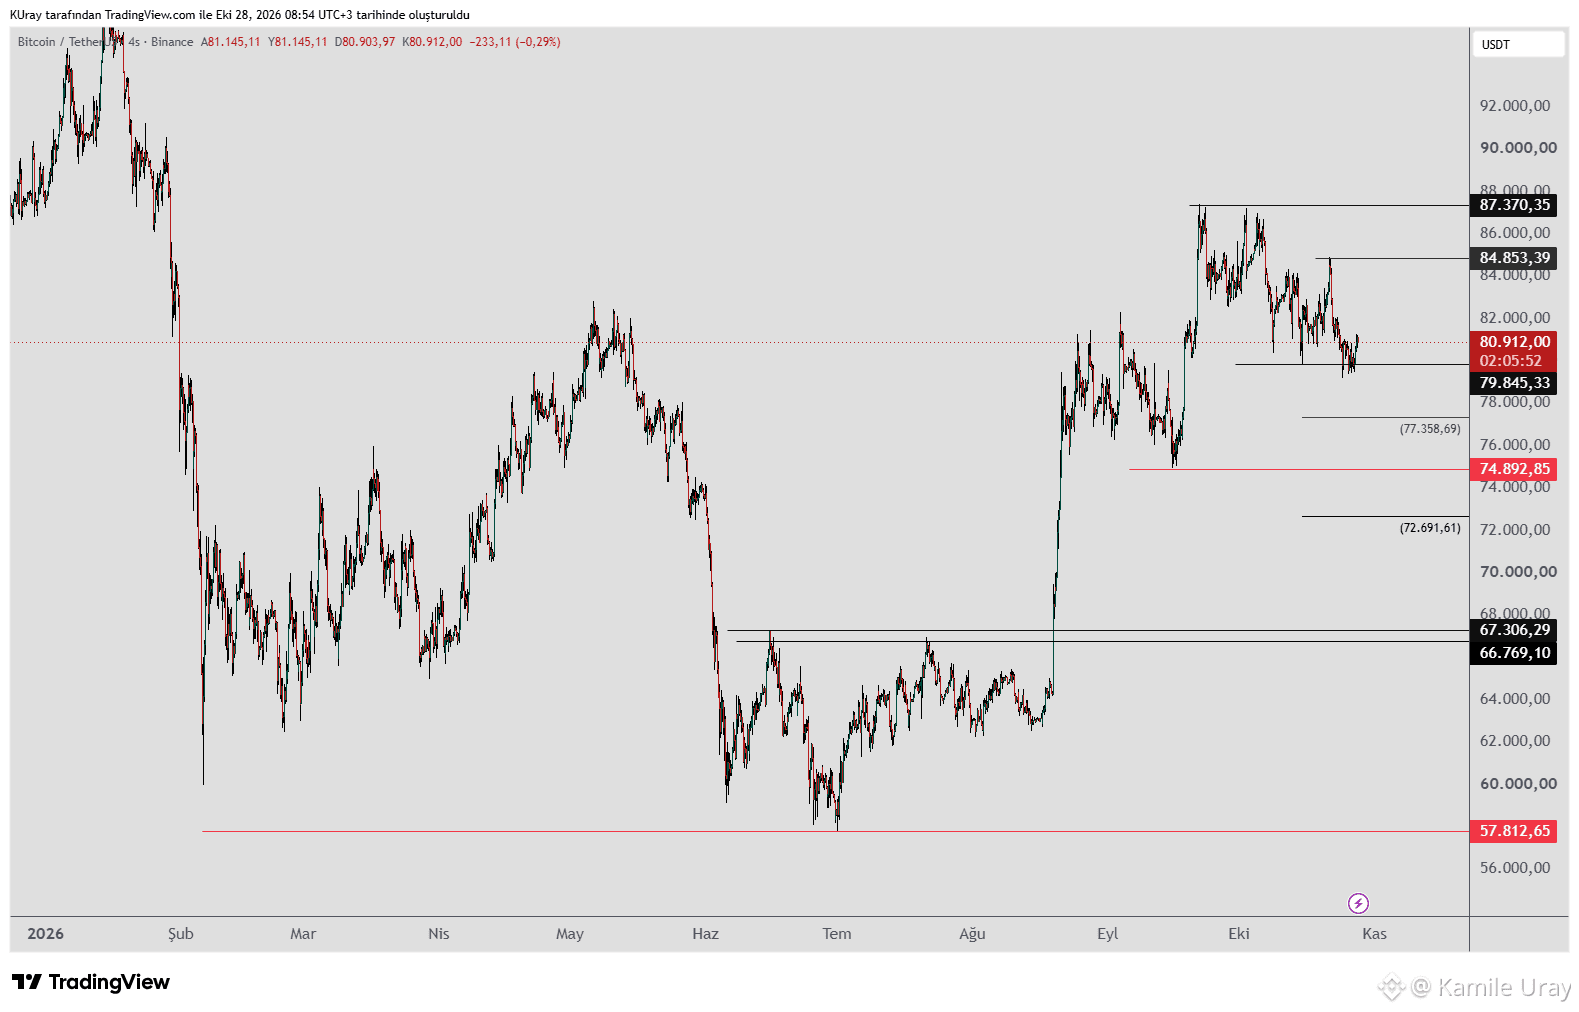
#BTC – The Fed’s interest rate decision will be announced today, which could trigger sharp price movements.
We will be monitoring key levels on the chart. Once the volatility settles, the market will likely resume its underlying trend.
On the daily timeframe, holding the 79,845 low could lead to some upside.
However, as long as the price fails to close above the 84,853 high, the possibility of a decline remains.
If it stays below 79,845, it may test the 77,565, 74,892, and 73,354 levels.
In the event of a decline, the 74,892 level is significant on the daily chart; holding above it could allow for a recovery. If it closes below this level, we will look to the support zones at 73,354, 67,306, and 66,769.
On the upside, if the price closes above 87,370, we will watch for resistance at 98,000 and the 107,000–109,000 range.
The price could face rejection at these resistance levels. If the rally continues toward the 107,000–109,000 zone, a bearish "Libra" pattern may emerge.
Should this pattern form, a decline would be expected, with a weekly close above 126,000 serving as the stop-loss level.
#BTC – The Fed’s interest rate decision will be announced today, which could trigger sharp price movements.
We will be monitoring key levels on the chart. Once the volatility settles, the market will likely resume its underlying trend.
On the daily timeframe, holding the 79,845 low could lead to some upside.
However, as long as the price fails to close above the 84,853 high, the possibility of a decline remains.
If it stays below 79,845, it may test the 77,565, 74,892, and 73,354 levels.
In the event of a decline, the 74,892 level is significant on the daily chart; holding above it could allow for a recovery. If it closes below this level, we will look to the support zones at 73,354, 67,306, and 66,769.
On the upside, if the price closes above 87,370, we will watch for resistance at 98,000 and the 107,000–109,000 range.
The price could face rejection at these resistance levels. If the rally continues toward the 107,000–109,000 zone, a bearish "Libra" pattern may emerge.
Should this pattern form, a decline would be expected, with a weekly close above 126,000 serving as the stop-loss level.
We will be monitoring key levels on the chart. Once the volatility settles, the market will likely resume its underlying trend.
On the daily timeframe, holding the 79,845 low could lead to some upside.
However, as long as the price fails to close above the 84,853 high, the possibility of a decline remains.
If it stays below 79,845, it may test the 77,565, 74,892, and 73,354 levels.
In the event of a decline, the 74,892 level is significant on the daily chart; holding above it could allow for a recovery. If it closes below this level, we will look to the support zones at 73,354, 67,306, and 66,769.
On the upside, if the price closes above 87,370, we will watch for resistance at 98,000 and the 107,000–109,000 range.
The price could face rejection at these resistance levels. If the rally continues toward the 107,000–109,000 zone, a bearish "Libra" pattern may emerge.
Should this pattern form, a decline would be expected, with a weekly close above 126,000 serving as the stop-loss level.
2
285
·
--
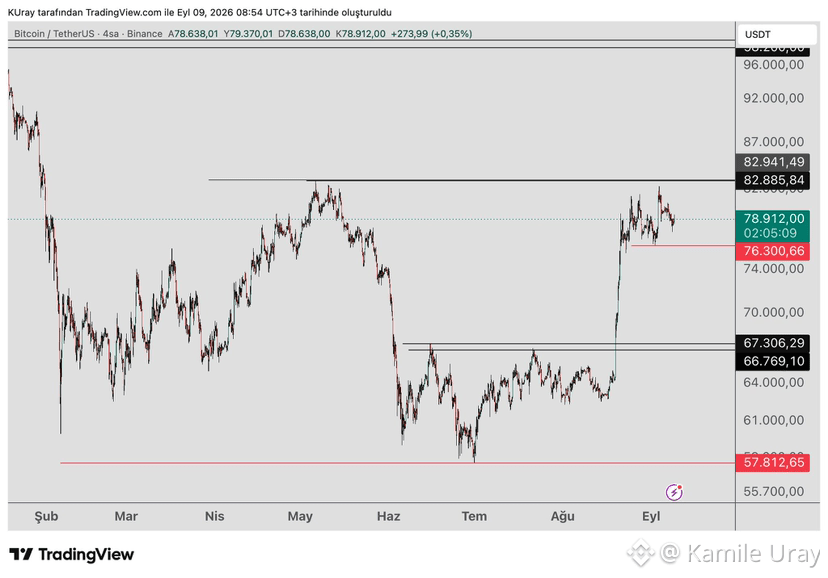
We are watching the 82,616 level on the #BTC 4-hour chart. The rise may continue as long as the price stays above this level. If it fails to hold above 82,616, keep an eye on the 74,892 level as support. If the price holds there, the rise could still continue.
On the way up, the 98,000 and 107,000–109,000 zones are resistance levels. A bearish Libra pattern may form if the price reaches the 107,000–109,000 zone. If it does, a decline is expected unless the price closes a weekly candle above 126,000.
If the price closes below 74,892, the decline is expected to continue. On the way down, we are watching the 67,306–66,769 zones for support.
We are watching the 82,616 level on the #BTC 4-hour chart. The rise may continue as long as the price stays above this level. If it fails to hold above 82,616, keep an eye on the 74,892 level as support. If the price holds there, the rise could still continue.
On the way up, the 98,000 and 107,000–109,000 zones are resistance levels. A bearish Libra pattern may form if the price reaches the 107,000–109,000 zone. If it does, a decline is expected unless the price closes a weekly candle above 126,000.
If the price closes below 74,892, the decline is expected to continue. On the way down, we are watching the 67,306–66,769 zones for support.
On the way up, the 98,000 and 107,000–109,000 zones are resistance levels. A bearish Libra pattern may form if the price reaches the 107,000–109,000 zone. If it does, a decline is expected unless the price closes a weekly candle above 126,000.
If the price closes below 74,892, the decline is expected to continue. On the way down, we are watching the 67,306–66,769 zones for support.
1
2
532
·
--
See translation
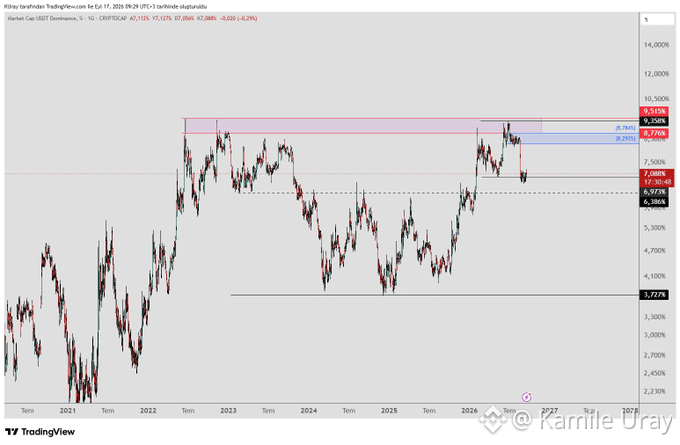
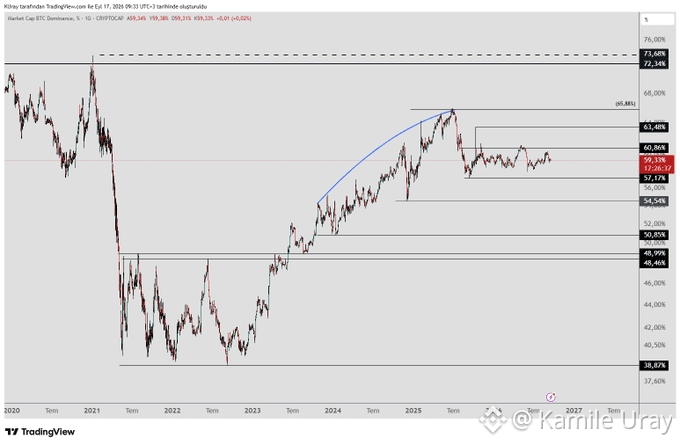
We haven't looked at BTC and USDT dominance for quite some time.
#USDT Dominance has given the first signal that a decline has begun by closing the day below 6.97. Any upward moves from here should be viewed as mere reactions to the downtrend. This bearish outlook would be invalidated if the price closes above 9.36. A drop in USDT dominance indicates that investors are shifting capital into BTC or altcoins.
When we look at #BTC Dominance, bearish patterns have emerged; if it remains below 57, the decline is likely to continue.
An analysis of the patterns forming in both dominance metrics suggests that a decline is the most probable outcome. This strengthens the likelihood of a rotation into altcoins.
Of course, I do not expect this to apply to *all* altcoins; I anticipate gains primarily for those with favorable charts, active teams, and solid projects.
We haven't looked at BTC and USDT dominance for quite some time.
#USDT Dominance has given the first signal that a decline has begun by closing the day below 6.97. Any upward moves from here should be viewed as mere reactions to the downtrend. This bearish outlook would be invalidated if the price closes above 9.36. A drop in USDT dominance indicates that investors are shifting capital into BTC or altcoins.
When we look at #BTC Dominance, bearish patterns have emerged; if it remains below 57, the decline is likely to continue.
An analysis of the patterns forming in both dominance metrics suggests that a decline is the most probable outcome. This strengthens the likelihood of a rotation into altcoins.
Of course, I do not expect this to apply to *all* altcoins; I anticipate gains primarily for those with favorable charts, active teams, and solid projects.
#USDT Dominance has given the first signal that a decline has begun by closing the day below 6.97. Any upward moves from here should be viewed as mere reactions to the downtrend. This bearish outlook would be invalidated if the price closes above 9.36. A drop in USDT dominance indicates that investors are shifting capital into BTC or altcoins.
When we look at #BTC Dominance, bearish patterns have emerged; if it remains below 57, the decline is likely to continue.
An analysis of the patterns forming in both dominance metrics suggests that a decline is the most probable outcome. This strengthens the likelihood of a rotation into altcoins.
Of course, I do not expect this to apply to *all* altcoins; I anticipate gains primarily for those with favorable charts, active teams, and solid projects.
4
373
·
--
See translation
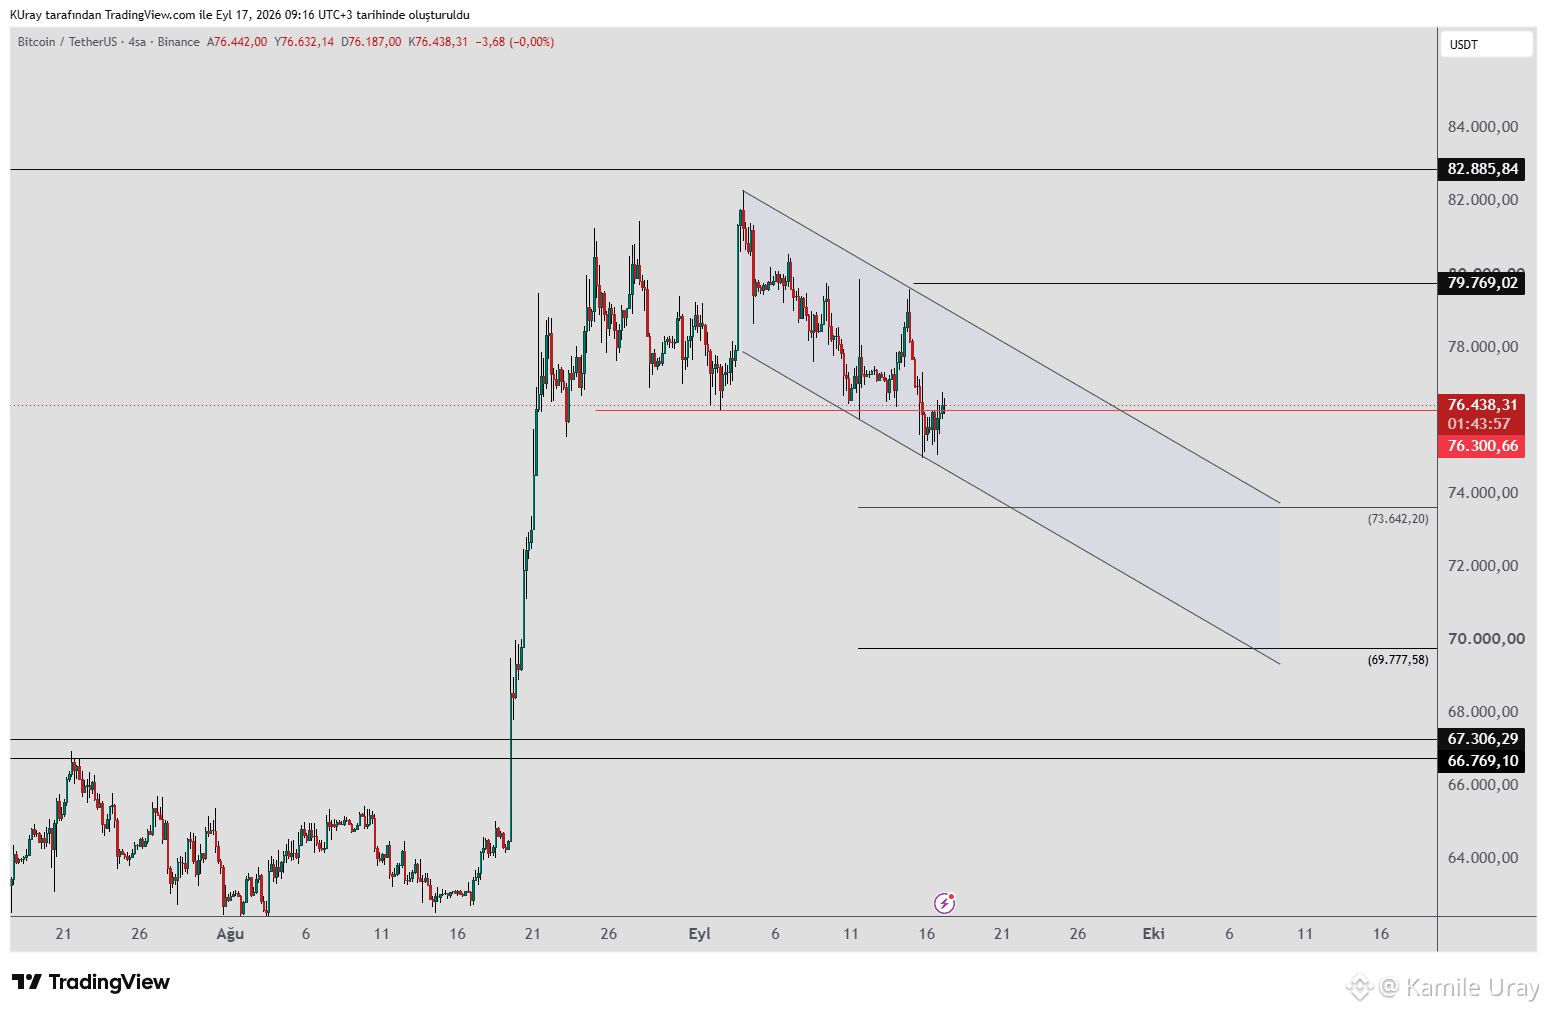
#BTC The downward wave is moving within a channel. The upper band of this channel may act as resistance, while the lower band acts as support. As long as the upper band remains unbroken (a breakout would require a daily close around 79,800), there is a possibility that the decline will continue.
During the decline, we will monitor support levels at 73,642, 69,777, 67,306, and 66,769. If buying pressure emerges at any of these levels, a renewed rise is expected. The decline could potentially form the final shoulder of an Inverse Head and Shoulders (IH&S) pattern; if the price holds above 83,000, the pattern would activate, and a continued rise toward upper resistance levels would be anticipated.
If a daily or weekly close occurs above 82,885, it would mark the first higher peak relative to the recent downward wave. This would provide a further signal that the upward trend is likely to continue, after which we can monitor the upper resistance levels.
#BTC The downward wave is moving within a channel. The upper band of this channel may act as resistance, while the lower band acts as support. As long as the upper band remains unbroken (a breakout would require a daily close around 79,800), there is a possibility that the decline will continue.
During the decline, we will monitor support levels at 73,642, 69,777, 67,306, and 66,769. If buying pressure emerges at any of these levels, a renewed rise is expected. The decline could potentially form the final shoulder of an Inverse Head and Shoulders (IH&S) pattern; if the price holds above 83,000, the pattern would activate, and a continued rise toward upper resistance levels would be anticipated.
If a daily or weekly close occurs above 82,885, it would mark the first higher peak relative to the recent downward wave. This would provide a further signal that the upward trend is likely to continue, after which we can monitor the upper resistance levels.
During the decline, we will monitor support levels at 73,642, 69,777, 67,306, and 66,769. If buying pressure emerges at any of these levels, a renewed rise is expected. The decline could potentially form the final shoulder of an Inverse Head and Shoulders (IH&S) pattern; if the price holds above 83,000, the pattern would activate, and a continued rise toward upper resistance levels would be anticipated.
If a daily or weekly close occurs above 82,885, it would mark the first higher peak relative to the recent downward wave. This would provide a further signal that the upward trend is likely to continue, after which we can monitor the upper resistance levels.
3
2
464
·
--
See translation
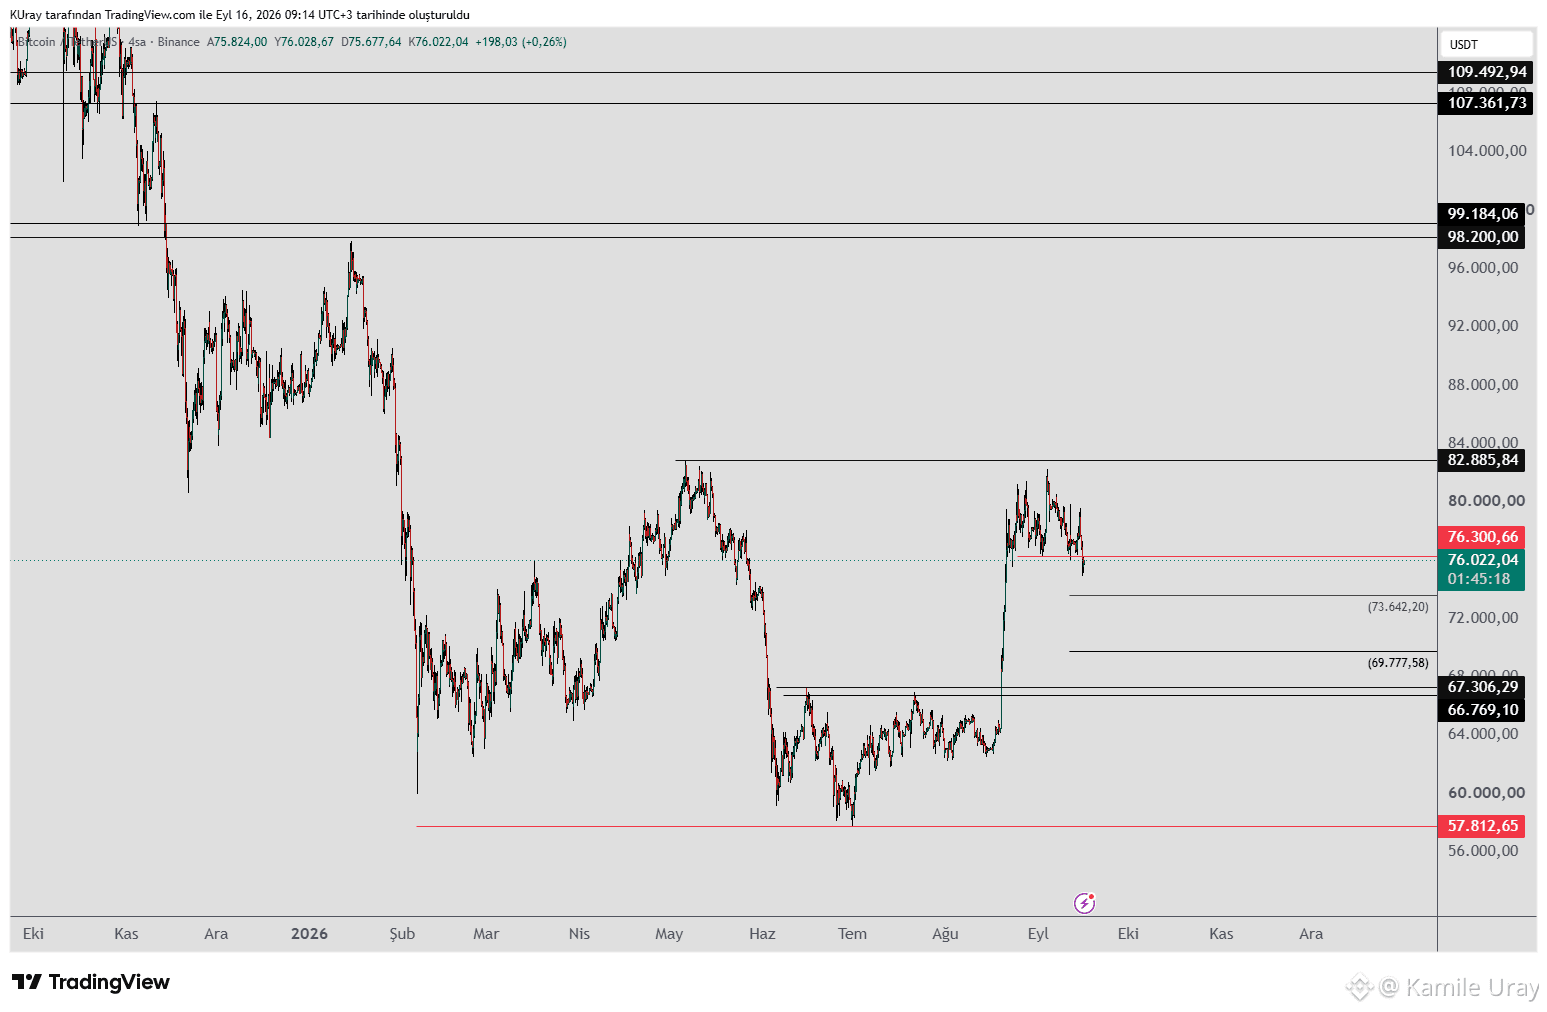
#BTC closed below the 76,300 level prior to the announcement of the Fed's interest rate decision. This has raised the possibility of a continued decline.
During the decline, we will monitor support levels at 73,642, 69,777, 67,306, and 66,769.
If buying activity emerges at any of these levels, a renewed rise is expected.
The decline could potentially form the final shoulder of an inverse head-and-shoulders (H&S) pattern. If the price holds above 83,000, the pattern would be activated, and a continued rise toward upper resistance levels would be anticipated.
If a daily or weekly close occurs above 82,885, it would mark the first higher peak relative to the most recent downward wave. This would provide a further signal that the upward trend is likely to continue, after which upper resistance levels can be monitored.
#BTC closed below the 76,300 level prior to the announcement of the Fed's interest rate decision. This has raised the possibility of a continued decline.
During the decline, we will monitor support levels at 73,642, 69,777, 67,306, and 66,769.
If buying activity emerges at any of these levels, a renewed rise is expected.
The decline could potentially form the final shoulder of an inverse head-and-shoulders (H&S) pattern. If the price holds above 83,000, the pattern would be activated, and a continued rise toward upper resistance levels would be anticipated.
If a daily or weekly close occurs above 82,885, it would mark the first higher peak relative to the most recent downward wave. This would provide a further signal that the upward trend is likely to continue, after which upper resistance levels can be monitored.
During the decline, we will monitor support levels at 73,642, 69,777, 67,306, and 66,769.
If buying activity emerges at any of these levels, a renewed rise is expected.
The decline could potentially form the final shoulder of an inverse head-and-shoulders (H&S) pattern. If the price holds above 83,000, the pattern would be activated, and a continued rise toward upper resistance levels would be anticipated.
If a daily or weekly close occurs above 82,885, it would mark the first higher peak relative to the most recent downward wave. This would provide a further signal that the upward trend is likely to continue, after which upper resistance levels can be monitored.
2
306
·
--
See translation
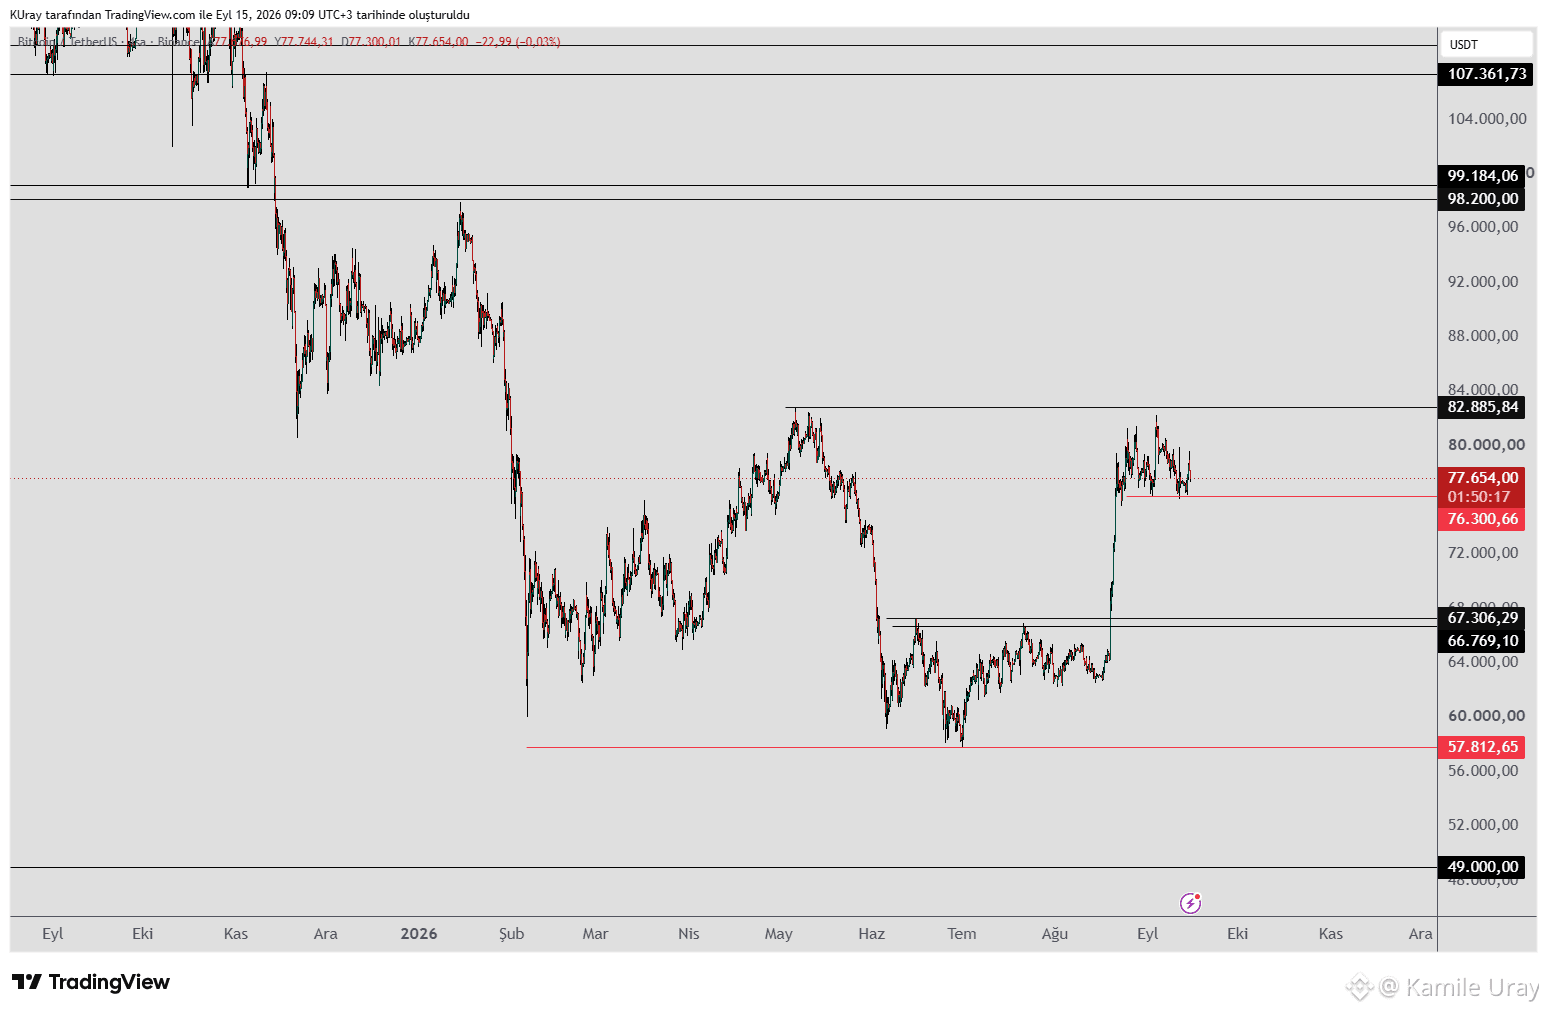
#BTC appears set to trade within the same range until the Fed interest rate decision on the 16th.
Sharp price swings—in either direction—are likely on the day of the decision. We are keeping a close watch on the 76,300 level; regardless of volatility, 4-hour candle closes remain the key indicator for us.
As long as the price holds above 76,300 on the 4-hour chart, the potential for an upward move remains intact.
If the price closes below 76,300, there is a possibility of testing the support zone around 67,000–66,000. Such a decline could form the final shoulder of a potential inverse head-and-shoulders (H&S) pattern. If the price subsequently holds above 83,000, the pattern would be activated, and a continued rise toward upper resistance levels would be expected.
If a daily or weekly close occurs above 82,885, it would mark the first higher high relative to the most recent downward wave. This would provide further confirmation that the upward trend is likely to continue, allowing us to monitor the upper resistance levels thereafter.
#BTC appears set to trade within the same range until the Fed interest rate decision on the 16th.
Sharp price swings—in either direction—are likely on the day of the decision. We are keeping a close watch on the 76,300 level; regardless of volatility, 4-hour candle closes remain the key indicator for us.
As long as the price holds above 76,300 on the 4-hour chart, the potential for an upward move remains intact.
If the price closes below 76,300, there is a possibility of testing the support zone around 67,000–66,000. Such a decline could form the final shoulder of a potential inverse head-and-shoulders (H&S) pattern. If the price subsequently holds above 83,000, the pattern would be activated, and a continued rise toward upper resistance levels would be expected.
If a daily or weekly close occurs above 82,885, it would mark the first higher high relative to the most recent downward wave. This would provide further confirmation that the upward trend is likely to continue, allowing us to monitor the upper resistance levels thereafter.
Sharp price swings—in either direction—are likely on the day of the decision. We are keeping a close watch on the 76,300 level; regardless of volatility, 4-hour candle closes remain the key indicator for us.
As long as the price holds above 76,300 on the 4-hour chart, the potential for an upward move remains intact.
If the price closes below 76,300, there is a possibility of testing the support zone around 67,000–66,000. Such a decline could form the final shoulder of a potential inverse head-and-shoulders (H&S) pattern. If the price subsequently holds above 83,000, the pattern would be activated, and a continued rise toward upper resistance levels would be expected.
If a daily or weekly close occurs above 82,885, it would mark the first higher high relative to the most recent downward wave. This would provide further confirmation that the upward trend is likely to continue, allowing us to monitor the upper resistance levels thereafter.
1
326
·
--
See translation
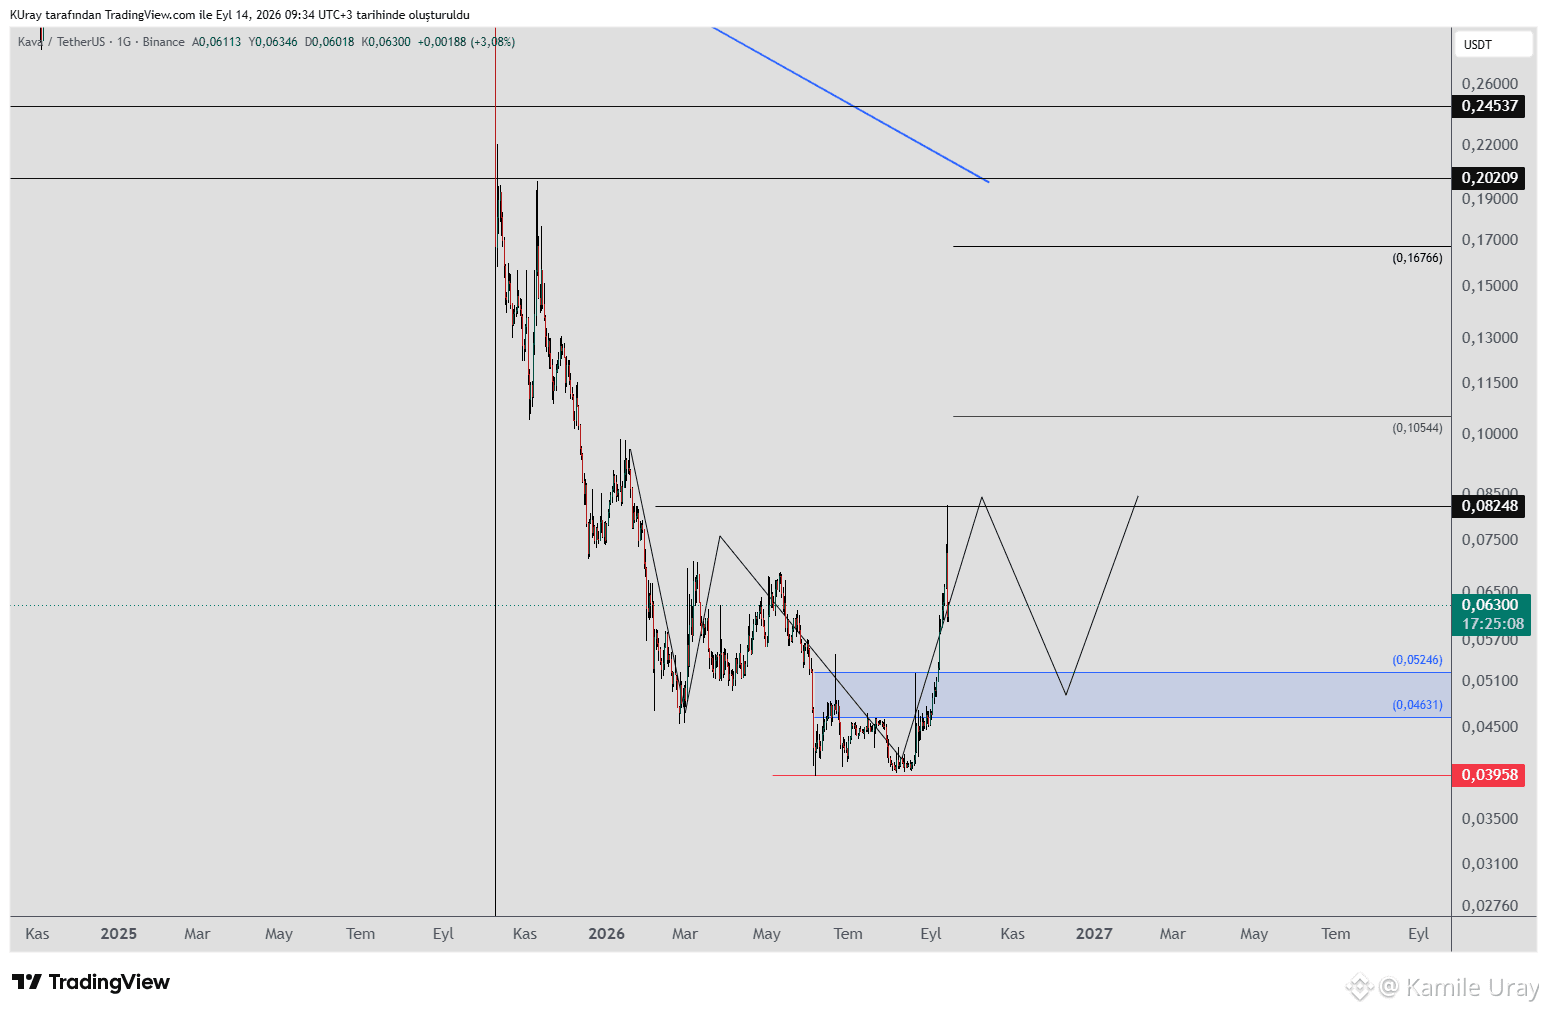
I spotted a potential Libra pattern. 🙂
Let me share it with you.
#KAVA: A Libra pattern could form if the price drops.
Entry zone: 0.05246–0.04631
Stop: 0.03958
Targets: 0.08248–0.10544–0.16766
You can determine your strategy based on your own risk appetite. I recommend using a stop-loss while tracking the trade.
I spotted a potential Libra pattern. 🙂
Let me share it with you.
#KAVA: A Libra pattern could form if the price drops.
Entry zone: 0.05246–0.04631
Stop: 0.03958
Targets: 0.08248–0.10544–0.16766
You can determine your strategy based on your own risk appetite. I recommend using a stop-loss while tracking the trade.
Let me share it with you.
#KAVA: A Libra pattern could form if the price drops.
Entry zone: 0.05246–0.04631
Stop: 0.03958
Targets: 0.08248–0.10544–0.16766
You can determine your strategy based on your own risk appetite. I recommend using a stop-loss while tracking the trade.
1
515
·
--
See translation
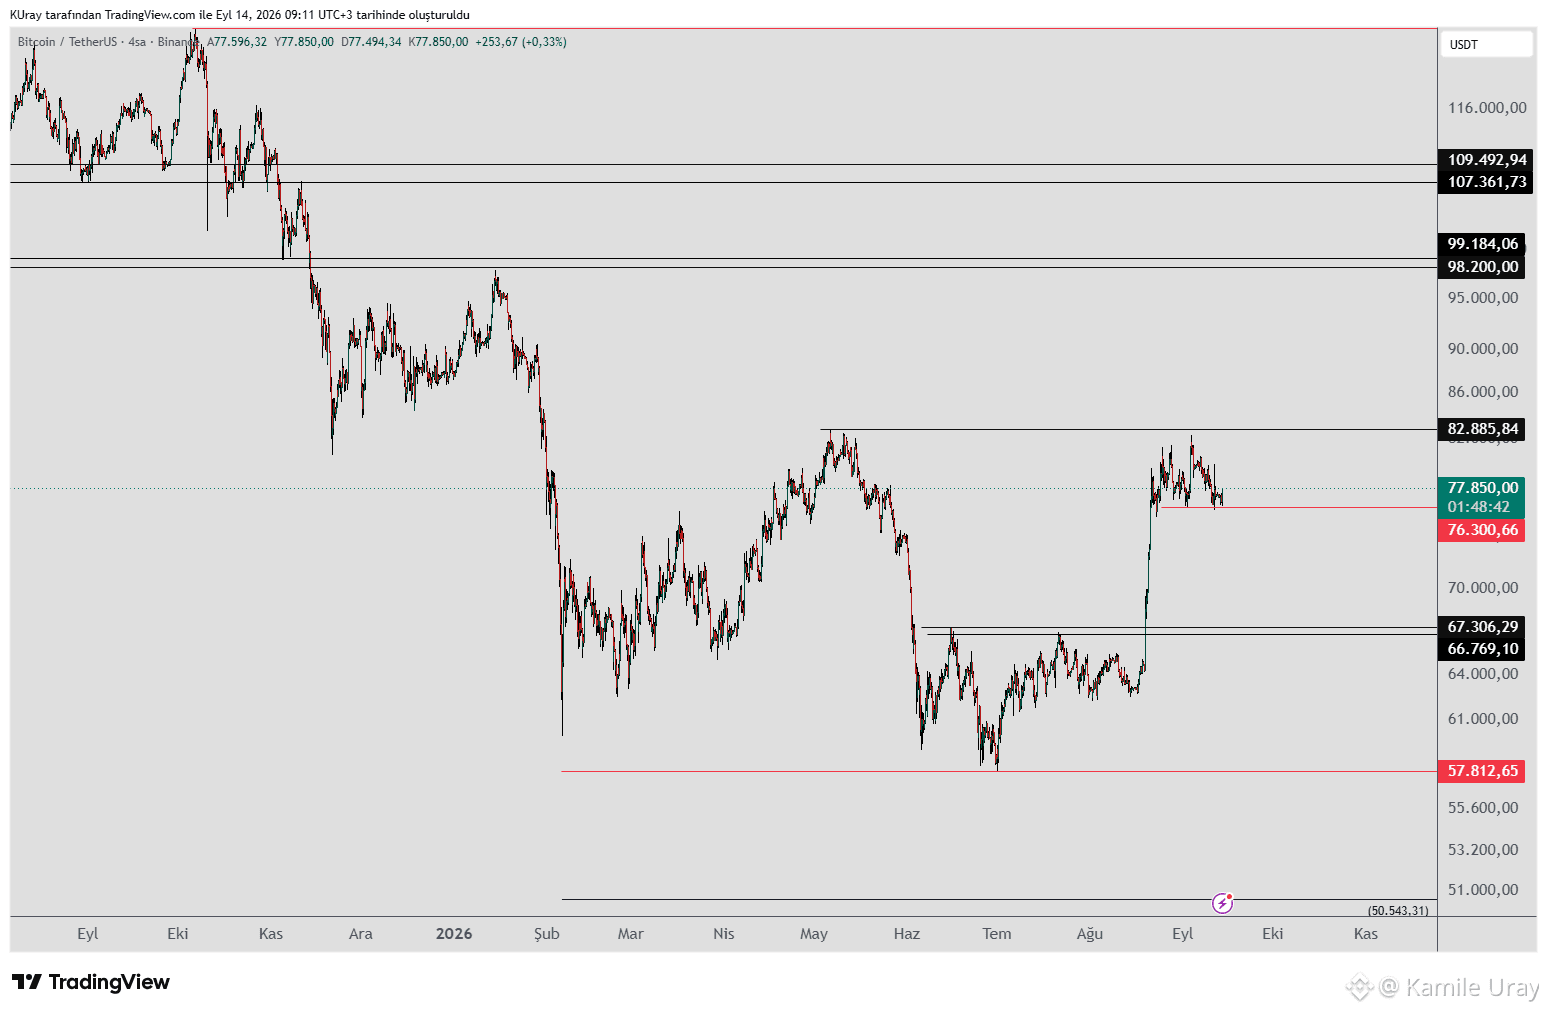
We are monitoring the #BTC level at 76,300. As long as it holds above this level, the potential for an upward move remains.
If the price closes below 76,300, there is a possibility of testing the support zone around 67,000–66,000. Declines could lead to the formation of the final shoulder of a potential inverse head-and-shoulders (H&S) pattern; if the price holds above 83,000, the pattern would activate, and a continued rise toward upper resistance levels would be expected.
If a daily or weekly close occurs above 82,885, it would mark the first higher peak relative to the most recent downward wave. This would provide another signal that the upward trend is likely to continue, after which upper resistance levels can be monitored.
We are monitoring the #BTC level at 76,300. As long as it holds above this level, the potential for an upward move remains.
If the price closes below 76,300, there is a possibility of testing the support zone around 67,000–66,000. Declines could lead to the formation of the final shoulder of a potential inverse head-and-shoulders (H&S) pattern; if the price holds above 83,000, the pattern would activate, and a continued rise toward upper resistance levels would be expected.
If a daily or weekly close occurs above 82,885, it would mark the first higher peak relative to the most recent downward wave. This would provide another signal that the upward trend is likely to continue, after which upper resistance levels can be monitored.
If the price closes below 76,300, there is a possibility of testing the support zone around 67,000–66,000. Declines could lead to the formation of the final shoulder of a potential inverse head-and-shoulders (H&S) pattern; if the price holds above 83,000, the pattern would activate, and a continued rise toward upper resistance levels would be expected.
If a daily or weekly close occurs above 82,885, it would mark the first higher peak relative to the most recent downward wave. This would provide another signal that the upward trend is likely to continue, after which upper resistance levels can be monitored.
1
3
346
·
--
See translation
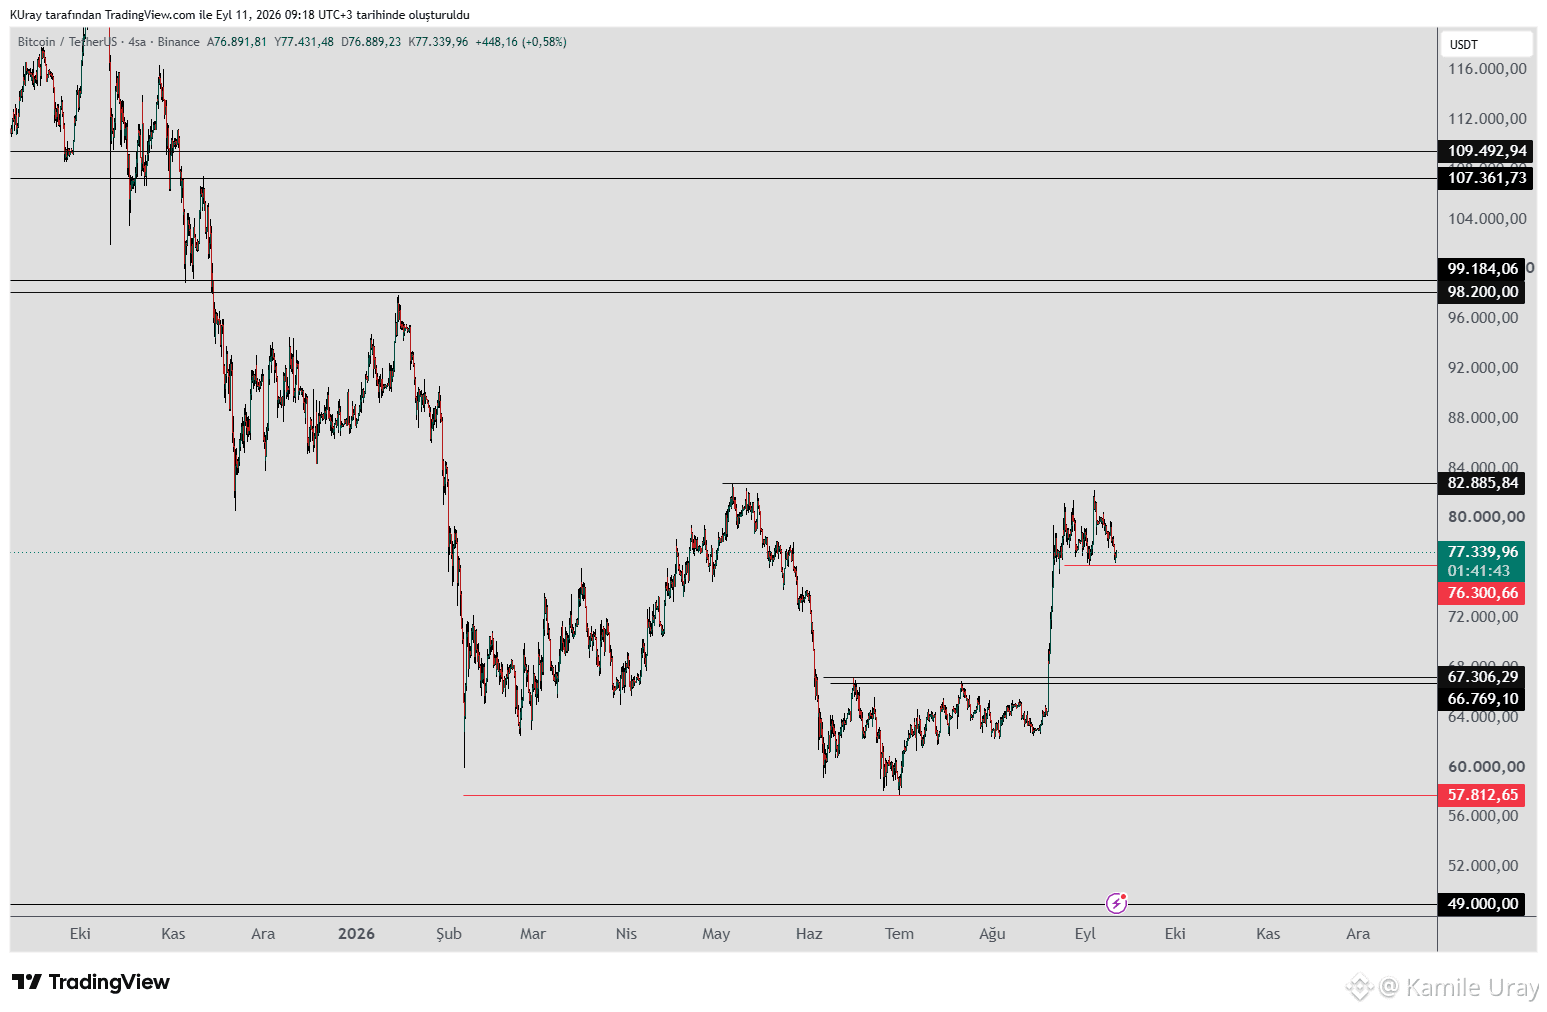
#BTC US PPI had risen, and CPI data is due today; it promises to be another volatile day for the markets. We will exercise caution, particularly with short-term trades.
Once the data is released, the market will stabilize and resume its movement.
We are monitoring the $76,300 level for BTC. As long as it holds above this level, the potential for an upward move remains.
If a daily or weekly close occurs above $82,885, it would mark the first higher peak relative to the recent downward wave. This would provide another signal that the rally is likely to continue, after which we can monitor higher resistance levels.
If the price closes below $76,300, there is a possibility of testing the support zone around $66,000–$67,000. Such a decline could form the final shoulder of a potential inverse head-and-shoulders (H&S) pattern. If the price holds above $83,000, the pattern would be activated, and a continued rise toward higher resistance levels would be expected.
#BTC US PPI had risen, and CPI data is due today; it promises to be another volatile day for the markets. We will exercise caution, particularly with short-term trades.
Once the data is released, the market will stabilize and resume its movement.
We are monitoring the $76,300 level for BTC. As long as it holds above this level, the potential for an upward move remains.
If a daily or weekly close occurs above $82,885, it would mark the first higher peak relative to the recent downward wave. This would provide another signal that the rally is likely to continue, after which we can monitor higher resistance levels.
If the price closes below $76,300, there is a possibility of testing the support zone around $66,000–$67,000. Such a decline could form the final shoulder of a potential inverse head-and-shoulders (H&S) pattern. If the price holds above $83,000, the pattern would be activated, and a continued rise toward higher resistance levels would be expected.
Once the data is released, the market will stabilize and resume its movement.
We are monitoring the $76,300 level for BTC. As long as it holds above this level, the potential for an upward move remains.
If a daily or weekly close occurs above $82,885, it would mark the first higher peak relative to the recent downward wave. This would provide another signal that the rally is likely to continue, after which we can monitor higher resistance levels.
If the price closes below $76,300, there is a possibility of testing the support zone around $66,000–$67,000. Such a decline could form the final shoulder of a potential inverse head-and-shoulders (H&S) pattern. If the price holds above $83,000, the pattern would be activated, and a continued rise toward higher resistance levels would be expected.
1
355
·
--
See translation
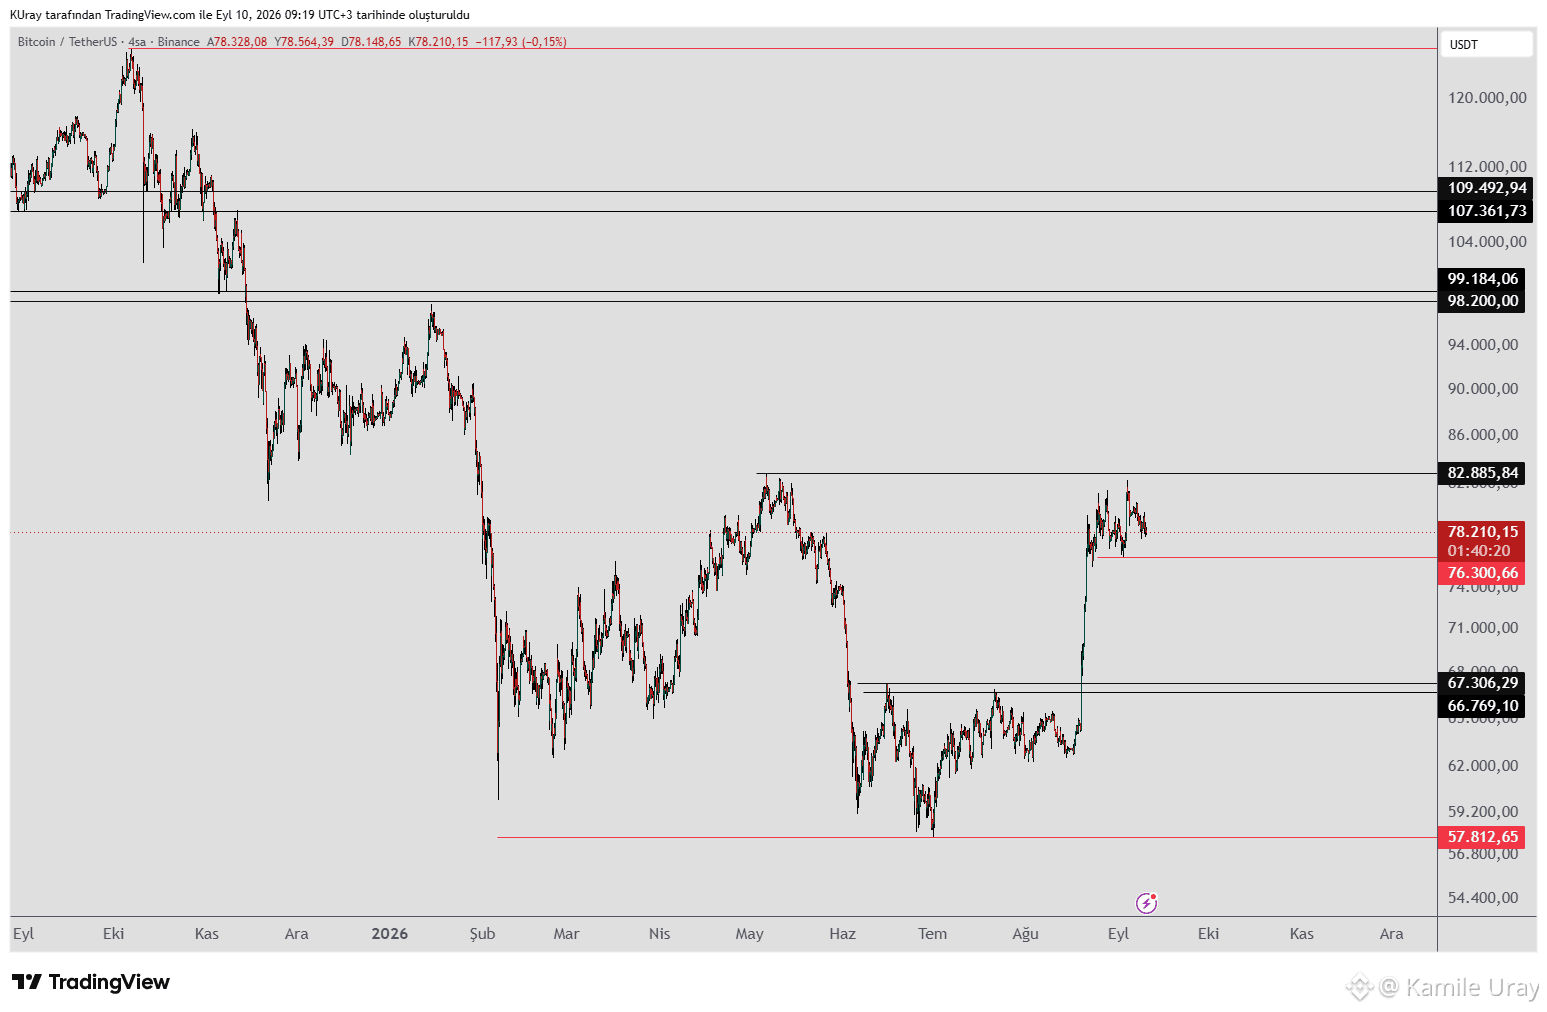
#BTC US producer inflation data is due today; markets tend to tread cautiously on data release days and experience sharp volatility once the figures are announced.
Therefore, short-term traders, in particular, should exercise caution.
As for BTC, the levels we are monitoring are clear: the potential for an upward move remains as long as the price stays above 76,300.
If a daily or weekly close occurs above 82,885, it would mark the first higher high relative to the most recent downward wave. This would provide a further signal that the uptrend is likely to continue, allowing us to monitor higher resistance levels thereafter.
If the price closes below 76,300, there is a possibility of testing the support zone around 67,000–66,000. Such a decline could form the final shoulder of a potential inverse head-and-shoulders (H&S) pattern. If the price subsequently holds above 83,000, the pattern would be activated, and a continued rise toward higher resistance levels would be expected.
#BTC US producer inflation data is due today; markets tend to tread cautiously on data release days and experience sharp volatility once the figures are announced.
Therefore, short-term traders, in particular, should exercise caution.
As for BTC, the levels we are monitoring are clear: the potential for an upward move remains as long as the price stays above 76,300.
If a daily or weekly close occurs above 82,885, it would mark the first higher high relative to the most recent downward wave. This would provide a further signal that the uptrend is likely to continue, allowing us to monitor higher resistance levels thereafter.
If the price closes below 76,300, there is a possibility of testing the support zone around 67,000–66,000. Such a decline could form the final shoulder of a potential inverse head-and-shoulders (H&S) pattern. If the price subsequently holds above 83,000, the pattern would be activated, and a continued rise toward higher resistance levels would be expected.
Therefore, short-term traders, in particular, should exercise caution.
As for BTC, the levels we are monitoring are clear: the potential for an upward move remains as long as the price stays above 76,300.
If a daily or weekly close occurs above 82,885, it would mark the first higher high relative to the most recent downward wave. This would provide a further signal that the uptrend is likely to continue, allowing us to monitor higher resistance levels thereafter.
If the price closes below 76,300, there is a possibility of testing the support zone around 67,000–66,000. Such a decline could form the final shoulder of a potential inverse head-and-shoulders (H&S) pattern. If the price subsequently holds above 83,000, the pattern would be activated, and a continued rise toward higher resistance levels would be expected.
1
401
·
--
See translation
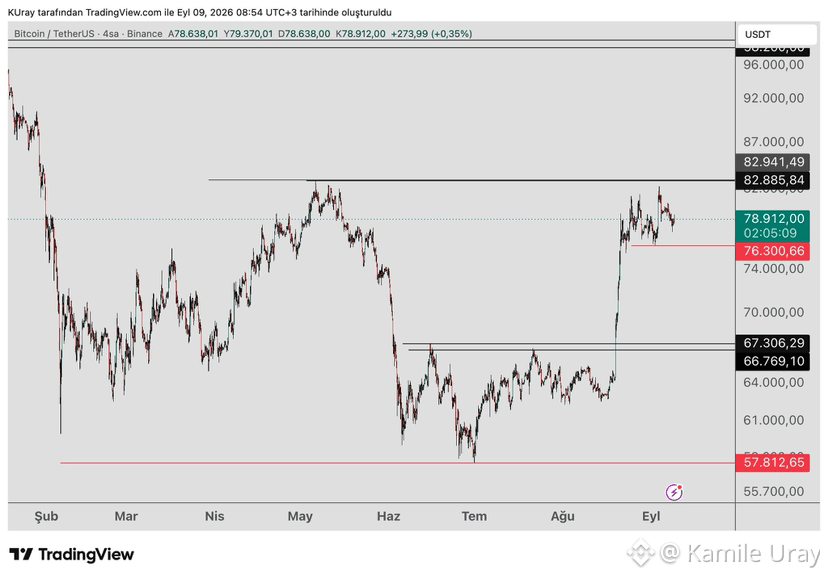
#BTC The potential for an upward move remains as long as it stays above the 76,300 level.
If a daily or weekly close occurs above 82,885, it would mark the first higher peak relative to the most recent downward wave. This would provide a further signal that the uptrend is likely to continue, after which higher resistance levels can be monitored.
If the price closes below 76,300, there is a possibility of testing the support zone around 67,000–66,000. Such a decline could form the final shoulder of a potential inverse head-and-shoulders (H&S) pattern.
If it holds above 83,000, the pattern would become active, and the price would be expected to continue rising toward higher resistance levels.
#BTC The potential for an upward move remains as long as it stays above the 76,300 level.
If a daily or weekly close occurs above 82,885, it would mark the first higher peak relative to the most recent downward wave. This would provide a further signal that the uptrend is likely to continue, after which higher resistance levels can be monitored.
If the price closes below 76,300, there is a possibility of testing the support zone around 67,000–66,000. Such a decline could form the final shoulder of a potential inverse head-and-shoulders (H&S) pattern.
If it holds above 83,000, the pattern would become active, and the price would be expected to continue rising toward higher resistance levels.
If a daily or weekly close occurs above 82,885, it would mark the first higher peak relative to the most recent downward wave. This would provide a further signal that the uptrend is likely to continue, after which higher resistance levels can be monitored.
If the price closes below 76,300, there is a possibility of testing the support zone around 67,000–66,000. Such a decline could form the final shoulder of a potential inverse head-and-shoulders (H&S) pattern.
If it holds above 83,000, the pattern would become active, and the price would be expected to continue rising toward higher resistance levels.
370
·
--
See translation
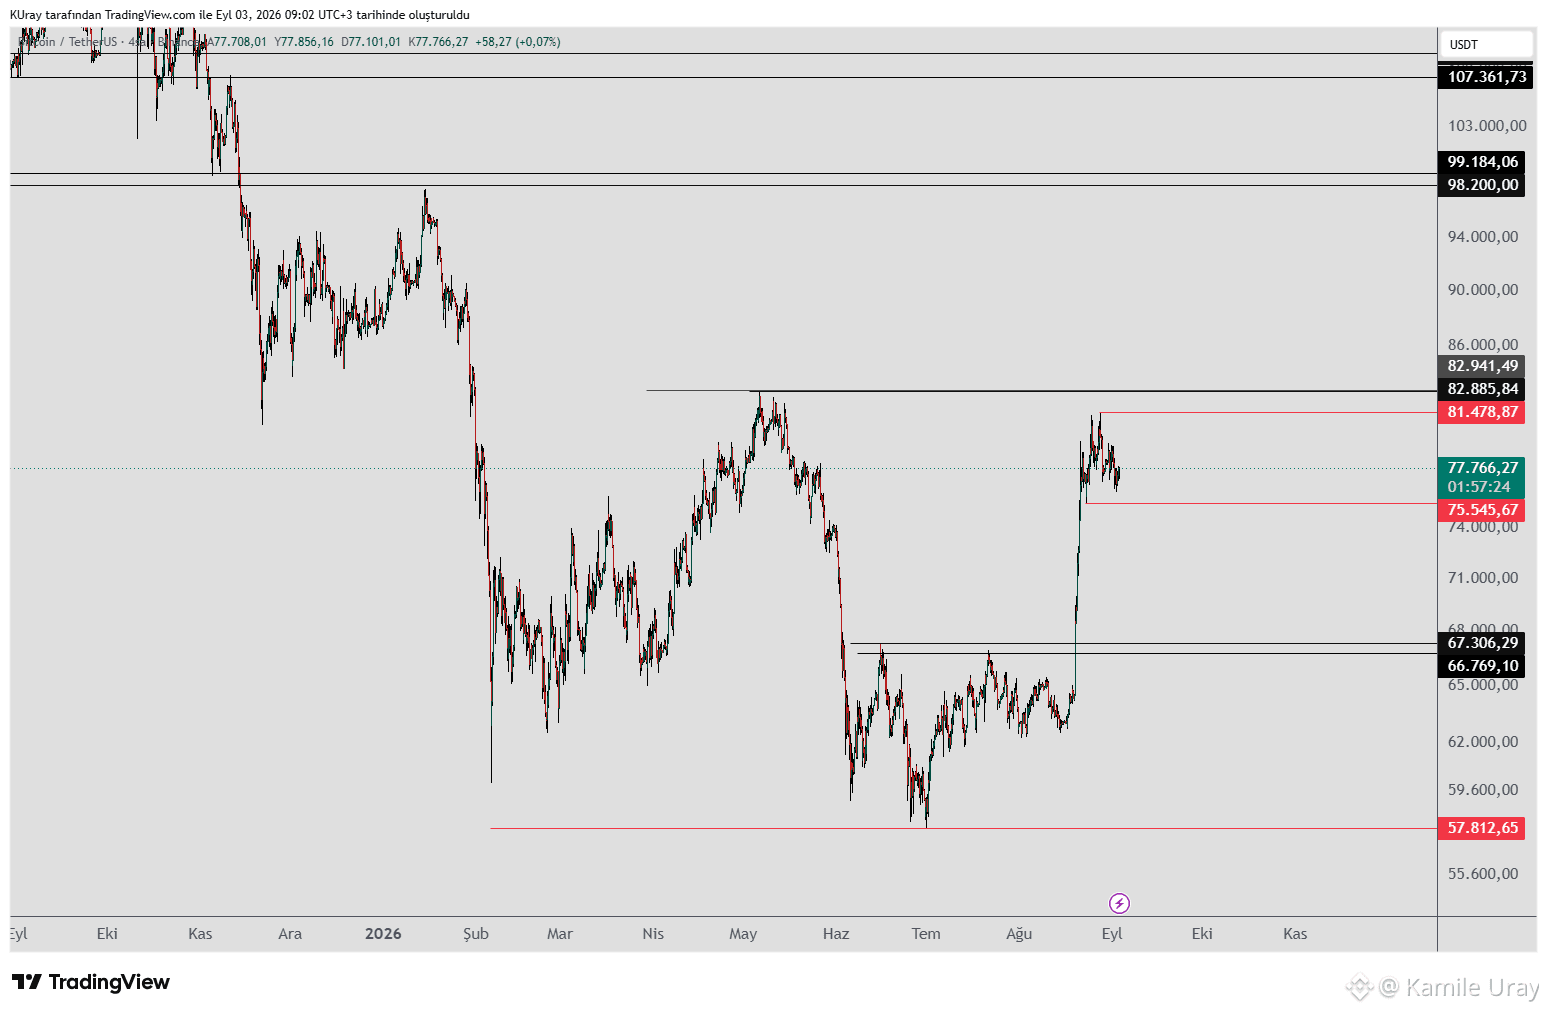
#BTC has been moving within the 81,478–75,545 range—a $6,000 spread—for the past eight days.
If the price closes below 75,545, there is a possibility of testing the support zone around 67,000–66,000. Such a decline could form the final shoulder of a potential Inverse Head and Shoulders (IH&S) pattern. Although a drop is anticipated, the potential for a larger bullish IH&S pattern is emerging; if the price holds above 83,000, the pattern would activate, and a continued rise toward upper resistance levels would be expected.
If daily and weekly closes occur above 82,885, it would mark the first higher high relative to the most recent downward wave, providing another positive signal that the upward trend is likely to continue.
#BTC has been moving within the 81,478–75,545 range—a $6,000 spread—for the past eight days.
If the price closes below 75,545, there is a possibility of testing the support zone around 67,000–66,000. Such a decline could form the final shoulder of a potential Inverse Head and Shoulders (IH&S) pattern. Although a drop is anticipated, the potential for a larger bullish IH&S pattern is emerging; if the price holds above 83,000, the pattern would activate, and a continued rise toward upper resistance levels would be expected.
If daily and weekly closes occur above 82,885, it would mark the first higher high relative to the most recent downward wave, providing another positive signal that the upward trend is likely to continue.
If the price closes below 75,545, there is a possibility of testing the support zone around 67,000–66,000. Such a decline could form the final shoulder of a potential Inverse Head and Shoulders (IH&S) pattern. Although a drop is anticipated, the potential for a larger bullish IH&S pattern is emerging; if the price holds above 83,000, the pattern would activate, and a continued rise toward upper resistance levels would be expected.
If daily and weekly closes occur above 82,885, it would mark the first higher high relative to the most recent downward wave, providing another positive signal that the upward trend is likely to continue.
1
633
·
--
See translation
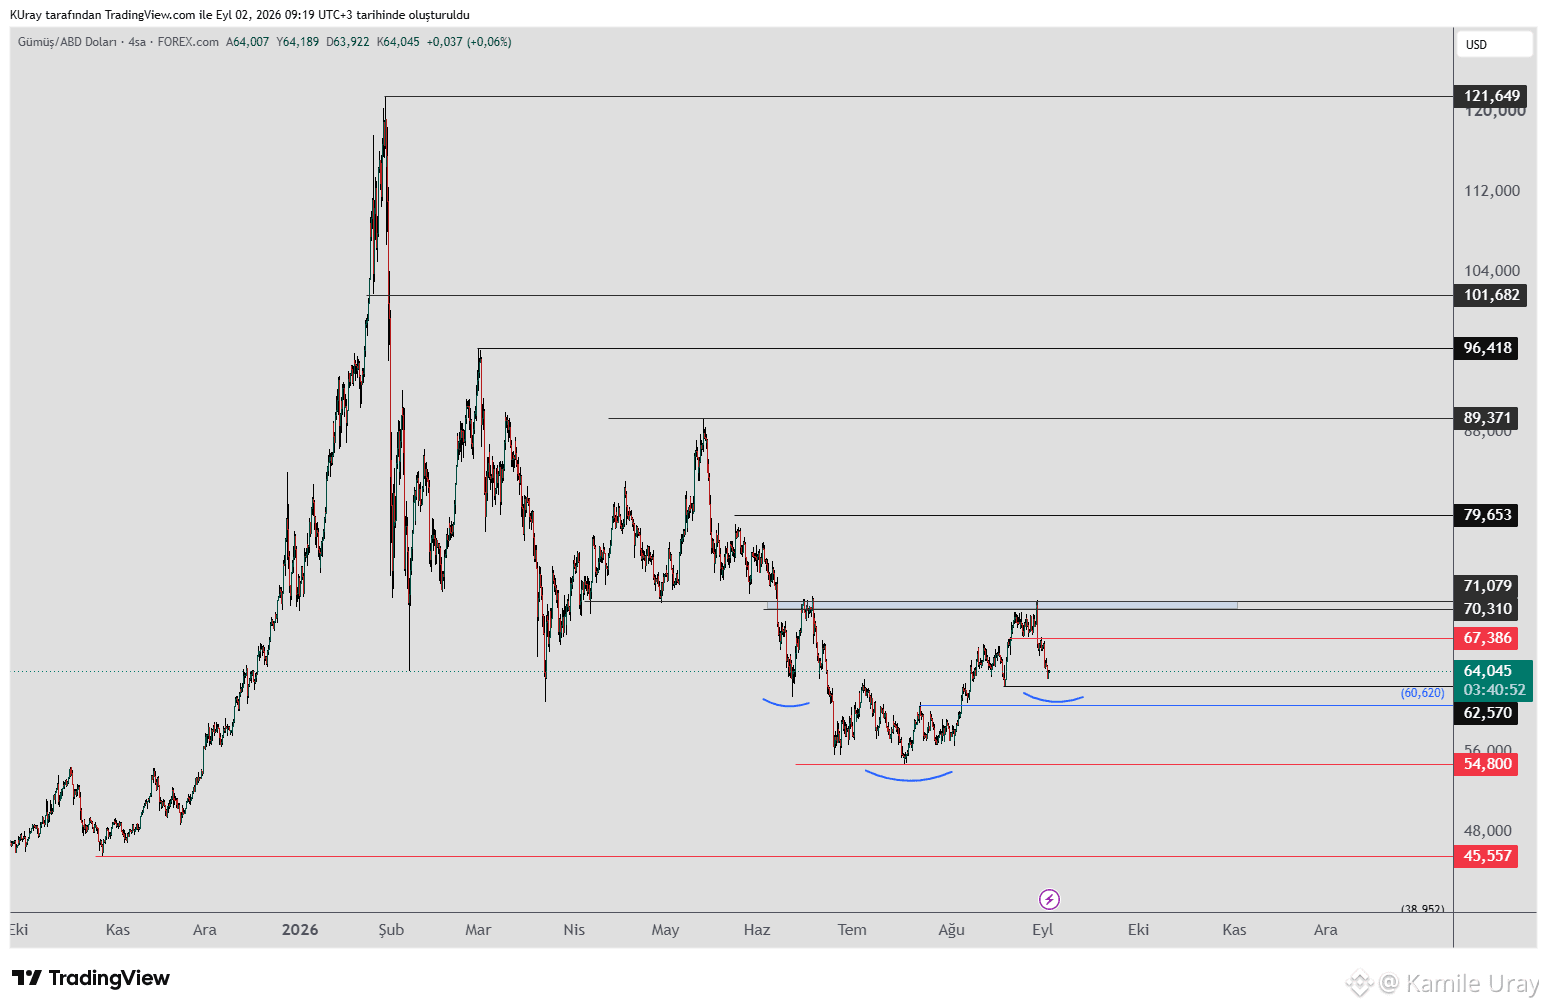
For #XAG (Silver), we will be monitoring the resistance at the "blue box" on the daily chart. Specifically, if the price breaks above the blue box located in the 70–71 range and closes there, further upward movement is expected; we can then look toward the 79 and 89 resistance levels.
The potential for an upward move remains as long as the price stays above the 62 level. If it drops below 62, we will monitor lower support levels. A renewed rise is expected if the price finds support during declines.
Looking at the price waves, the downward movements continue to appear as corrections to the overall uptrend.
For #XAG (Silver), we will be monitoring the resistance at the "blue box" on the daily chart. Specifically, if the price breaks above the blue box located in the 70–71 range and closes there, further upward movement is expected; we can then look toward the 79 and 89 resistance levels.
The potential for an upward move remains as long as the price stays above the 62 level. If it drops below 62, we will monitor lower support levels. A renewed rise is expected if the price finds support during declines.
Looking at the price waves, the downward movements continue to appear as corrections to the overall uptrend.
The potential for an upward move remains as long as the price stays above the 62 level. If it drops below 62, we will monitor lower support levels. A renewed rise is expected if the price finds support during declines.
Looking at the price waves, the downward movements continue to appear as corrections to the overall uptrend.
736
·
--
See translation
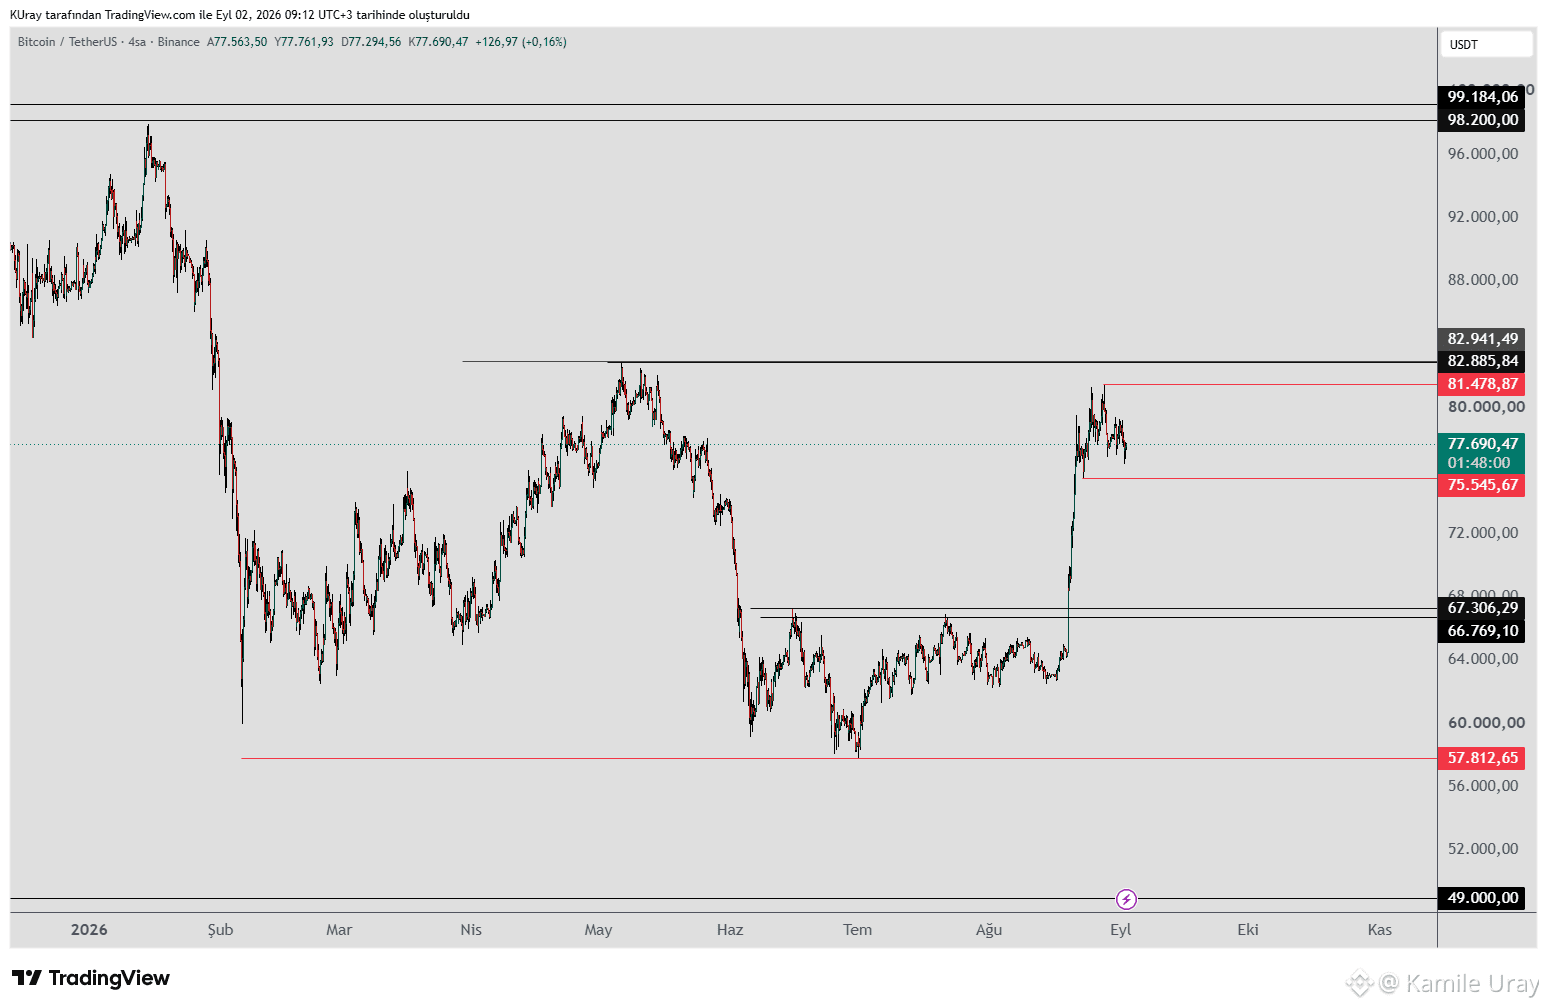
#BTC remains unchanged, trading within the 81,478–75,545 range. The current structure reinforces the likelihood of a continued decline; notably, the rebound following the last downward wave failed to close above the previous peak.
If the price closes below 75,545, it may test the support zone around 67,000–66,000.
These declines could potentially form the final shoulder of an Inverse Head and Shoulders (H&S) pattern.
Although a decline is anticipated, the possibility of a larger bullish Inverse H&S pattern is emerging.
If the price holds above 83,000, the pattern would activate, and a continued rise toward upper resistance levels would be expected.
A daily or weekly close above 82,885 would mark the first higher peak relative to the recent downward wave, serving as a positive signal that the upward trend is likely to continue.
#BTC remains unchanged, trading within the 81,478–75,545 range. The current structure reinforces the likelihood of a continued decline; notably, the rebound following the last downward wave failed to close above the previous peak.
If the price closes below 75,545, it may test the support zone around 67,000–66,000.
These declines could potentially form the final shoulder of an Inverse Head and Shoulders (H&S) pattern.
Although a decline is anticipated, the possibility of a larger bullish Inverse H&S pattern is emerging.
If the price holds above 83,000, the pattern would activate, and a continued rise toward upper resistance levels would be expected.
A daily or weekly close above 82,885 would mark the first higher peak relative to the recent downward wave, serving as a positive signal that the upward trend is likely to continue.
If the price closes below 75,545, it may test the support zone around 67,000–66,000.
These declines could potentially form the final shoulder of an Inverse Head and Shoulders (H&S) pattern.
Although a decline is anticipated, the possibility of a larger bullish Inverse H&S pattern is emerging.
If the price holds above 83,000, the pattern would activate, and a continued rise toward upper resistance levels would be expected.
A daily or weekly close above 82,885 would mark the first higher peak relative to the recent downward wave, serving as a positive signal that the upward trend is likely to continue.
261
Log in to explore more content
Join global crypto users on Binance Square
⚡️ Get latest and useful information about crypto.
💬 Trusted by the world’s largest crypto exchange.
👍 Discover real insights from verified creators.
Email / Phone number
Trending Topics
JobsReportRaisesHikeOdds
398,611 views
2,874 Discussing
TradFi News | US Adds 165,000 Jobs in October, More Than Double the 65,000 Forecast, as Unemployment Falls to 4.1%
Binance News
·39 Likes
·23.8k views
CPITestsDecemberRateOutlook
94,325 views
844 Discussing
BitcoinRebounds$75KAsChipsLead
34,291 views
288 Discussing