
Justcryptopays
2.2k Posts

Justcryptopays
Report
Block User
Crypto enthusiast | Exploring blockchain | insightful and Trader | CMC KOL
27 Following
4.9K+ Followers
5.1K+ Liked
Posts
All
Quotes
PINNED

Article
See translation
Crypto Volatility: How Traders Can Profit From Market SwingsCryptocurrency markets are famous for one defining characteristic volatility. Unlike traditional equities or bonds, major digital assets like $BTC and Litecoin (LTC) can swing 10–30% or more in a single day sometimes much more.
While volatility scares conservative investors, it creates opportunities for knowledgeable traders to profit from price movements in both directions.
What Is Crypto Volatility?
Volatility measures how dramatically prices move over time. In crypto:
Bitcoin : historically has seen annualized volatility far above most stocks
Litecoin : correlated with BTC but often more erratic has experienced huge range-bound swings from its lows to all-time highs
This volatility is driven by factors like 24/7 trading, sentiment-driven news cycles, shifting liquidity, and macroeconomic events that affect risk assets.
Historical BTC & LTC Spikes
Bitcoin
2020–2021 Rally + Crash:
Bitcoin surged from roughly $10,000 to over $64,000 in less than a year, before crashing back toward $30,000 within months a move of nearly ±50%+ peak-to-trough
2011–2013 Experiences:
Early in its life, BTC bounced from $31 to nearly $300, then collapsed again
COVID Crash (March 2020):
BTC’s largest one-day drop was about 50%, followed by an aggressive rebound the kind of volatility that infuses opportunity and risk.
Litecoin (LTC)
$LTC , one of the oldest Bitcoin forks, has shown even larger historical percentage moves:
In the 2013–2015 era, LTC fell 97% from its peak to valley, then rallied to a new high in 2017 a 27,600% gain from earlier lows.
Its all-time high of over $400 remains a landmark of crypto volatility.
These dramatic movements underline why volatility isn’t just noise it fuels tradable price swings.
How Traders Make Money From Volatility
Swing Trading
Swing traders hold positions for days to weeks to capture significant price swings as markets trend up or down. They use tools like RSI, MACD, and Fibonacci retracements to time entries and exits
This strategy works in BTC and LTC alike watch for sharp pullbacks followed by momentum continuation to enter positions.
Scalping
Scalpers make many small trades within short timeframes aiming to profit from frequent mini-swings. Volatility creates constant opportunities for quick entry/exit patterns. It requires discipline, fast reactions, and platforms with low fees.
Arbitrage
During volatile periods, price spreads between exchanges often widen.
Traders buy on a cheaper exchange and sell on a more expensive one. Crypto arbitrage is especially relevant across global exchanges where liquidity imbalances arise.This strategy works well in highly volatile regimes where prices momentarily dislocate across platforms.
Derivatives
Advanced traders use futures, options, and other derivatives to tailor risk and amplify profits:
Futures allow directional bets on price movement with leverage. Options strategies (like straddles or strangles) profit when price swings either way, even if direction is uncertain.
Why Volatility Is the Trader’s Friend
Traditional investors often interpret volatility as instability and heightened risk. Traders, on the other hand, see it as opportunity in motion. Rapid price swings create clear entry and exit points. Temporary imbalances in price open the door for strategic positioning.
Different market conditions allow traders to apply multiple approaches, from short-term scalping to longer-term swing setups. Most importantly, volatility rewards those who stay disciplined, manage risk carefully, and stick to a well-defined plan.
In conclusion BTC and LTC volatility isn’t randomly chaotic it’s systematic and repeatable. Historical spikes give traders a roadmap for patterns, reactions, and range boundaries. With a solid strategy, good risk controls, and technical discipline, crypto market swings are not just fluctuations they’re opportunities.
#CZAMAonBinanceSquare
Crypto Volatility: How Traders Can Profit From Market Swings
Cryptocurrency markets are famous for one defining characteristic volatility. Unlike traditional equities or bonds, major digital assets like $BTC and Litecoin (LTC) can swing 10–30% or more in a single day sometimes much more.
While volatility scares conservative investors, it creates opportunities for knowledgeable traders to profit from price movements in both directions.
What Is Crypto Volatility?
Volatility measures how dramatically prices move over time. In crypto:
Bitcoin : historically has seen annualized volatility far above most stocks
Litecoin : correlated with BTC but often more erratic has experienced huge range-bound swings from its lows to all-time highs
This volatility is driven by factors like 24/7 trading, sentiment-driven news cycles, shifting liquidity, and macroeconomic events that affect risk assets.
Historical BTC & LTC Spikes
Bitcoin
2020–2021 Rally + Crash:
Bitcoin surged from roughly $10,000 to over $64,000 in less than a year, before crashing back toward $30,000 within months a move of nearly ±50%+ peak-to-trough
2011–2013 Experiences:
Early in its life, BTC bounced from $31 to nearly $300, then collapsed again
COVID Crash (March 2020):
BTC’s largest one-day drop was about 50%, followed by an aggressive rebound the kind of volatility that infuses opportunity and risk.
Litecoin (LTC)
$LTC , one of the oldest Bitcoin forks, has shown even larger historical percentage moves:
In the 2013–2015 era, LTC fell 97% from its peak to valley, then rallied to a new high in 2017 a 27,600% gain from earlier lows.
Its all-time high of over $400 remains a landmark of crypto volatility.
These dramatic movements underline why volatility isn’t just noise it fuels tradable price swings.
How Traders Make Money From Volatility
Swing Trading
Swing traders hold positions for days to weeks to capture significant price swings as markets trend up or down. They use tools like RSI, MACD, and Fibonacci retracements to time entries and exits
This strategy works in BTC and LTC alike watch for sharp pullbacks followed by momentum continuation to enter positions.
Scalping
Scalpers make many small trades within short timeframes aiming to profit from frequent mini-swings. Volatility creates constant opportunities for quick entry/exit patterns. It requires discipline, fast reactions, and platforms with low fees.
Arbitrage
During volatile periods, price spreads between exchanges often widen.
Traders buy on a cheaper exchange and sell on a more expensive one. Crypto arbitrage is especially relevant across global exchanges where liquidity imbalances arise.This strategy works well in highly volatile regimes where prices momentarily dislocate across platforms.
Derivatives
Advanced traders use futures, options, and other derivatives to tailor risk and amplify profits:
Futures allow directional bets on price movement with leverage. Options strategies (like straddles or strangles) profit when price swings either way, even if direction is uncertain.
Why Volatility Is the Trader’s Friend
Traditional investors often interpret volatility as instability and heightened risk. Traders, on the other hand, see it as opportunity in motion. Rapid price swings create clear entry and exit points. Temporary imbalances in price open the door for strategic positioning.
Different market conditions allow traders to apply multiple approaches, from short-term scalping to longer-term swing setups. Most importantly, volatility rewards those who stay disciplined, manage risk carefully, and stick to a well-defined plan.
In conclusion BTC and LTC volatility isn’t randomly chaotic it’s systematic and repeatable. Historical spikes give traders a roadmap for patterns, reactions, and range boundaries. With a solid strategy, good risk controls, and technical discipline, crypto market swings are not just fluctuations they’re opportunities.
#CZAMAonBinanceSquare
While volatility scares conservative investors, it creates opportunities for knowledgeable traders to profit from price movements in both directions.
What Is Crypto Volatility?
Volatility measures how dramatically prices move over time. In crypto:
Bitcoin : historically has seen annualized volatility far above most stocks
Litecoin : correlated with BTC but often more erratic has experienced huge range-bound swings from its lows to all-time highs
This volatility is driven by factors like 24/7 trading, sentiment-driven news cycles, shifting liquidity, and macroeconomic events that affect risk assets.
Historical BTC & LTC Spikes
Bitcoin
2020–2021 Rally + Crash:
Bitcoin surged from roughly $10,000 to over $64,000 in less than a year, before crashing back toward $30,000 within months a move of nearly ±50%+ peak-to-trough
2011–2013 Experiences:
Early in its life, BTC bounced from $31 to nearly $300, then collapsed again
COVID Crash (March 2020):
BTC’s largest one-day drop was about 50%, followed by an aggressive rebound the kind of volatility that infuses opportunity and risk.
Litecoin (LTC)
$LTC , one of the oldest Bitcoin forks, has shown even larger historical percentage moves:
In the 2013–2015 era, LTC fell 97% from its peak to valley, then rallied to a new high in 2017 a 27,600% gain from earlier lows.
Its all-time high of over $400 remains a landmark of crypto volatility.
These dramatic movements underline why volatility isn’t just noise it fuels tradable price swings.
How Traders Make Money From Volatility
Swing Trading
Swing traders hold positions for days to weeks to capture significant price swings as markets trend up or down. They use tools like RSI, MACD, and Fibonacci retracements to time entries and exits
This strategy works in BTC and LTC alike watch for sharp pullbacks followed by momentum continuation to enter positions.
Scalping
Scalpers make many small trades within short timeframes aiming to profit from frequent mini-swings. Volatility creates constant opportunities for quick entry/exit patterns. It requires discipline, fast reactions, and platforms with low fees.
Arbitrage
During volatile periods, price spreads between exchanges often widen.
Traders buy on a cheaper exchange and sell on a more expensive one. Crypto arbitrage is especially relevant across global exchanges where liquidity imbalances arise.This strategy works well in highly volatile regimes where prices momentarily dislocate across platforms.
Derivatives
Advanced traders use futures, options, and other derivatives to tailor risk and amplify profits:
Futures allow directional bets on price movement with leverage. Options strategies (like straddles or strangles) profit when price swings either way, even if direction is uncertain.
Why Volatility Is the Trader’s Friend
Traditional investors often interpret volatility as instability and heightened risk. Traders, on the other hand, see it as opportunity in motion. Rapid price swings create clear entry and exit points. Temporary imbalances in price open the door for strategic positioning.
Different market conditions allow traders to apply multiple approaches, from short-term scalping to longer-term swing setups. Most importantly, volatility rewards those who stay disciplined, manage risk carefully, and stick to a well-defined plan.
In conclusion BTC and LTC volatility isn’t randomly chaotic it’s systematic and repeatable. Historical spikes give traders a roadmap for patterns, reactions, and range boundaries. With a solid strategy, good risk controls, and technical discipline, crypto market swings are not just fluctuations they’re opportunities.
#CZAMAonBinanceSquare
9
2
37
16.3k
PINNED
Article
See translation
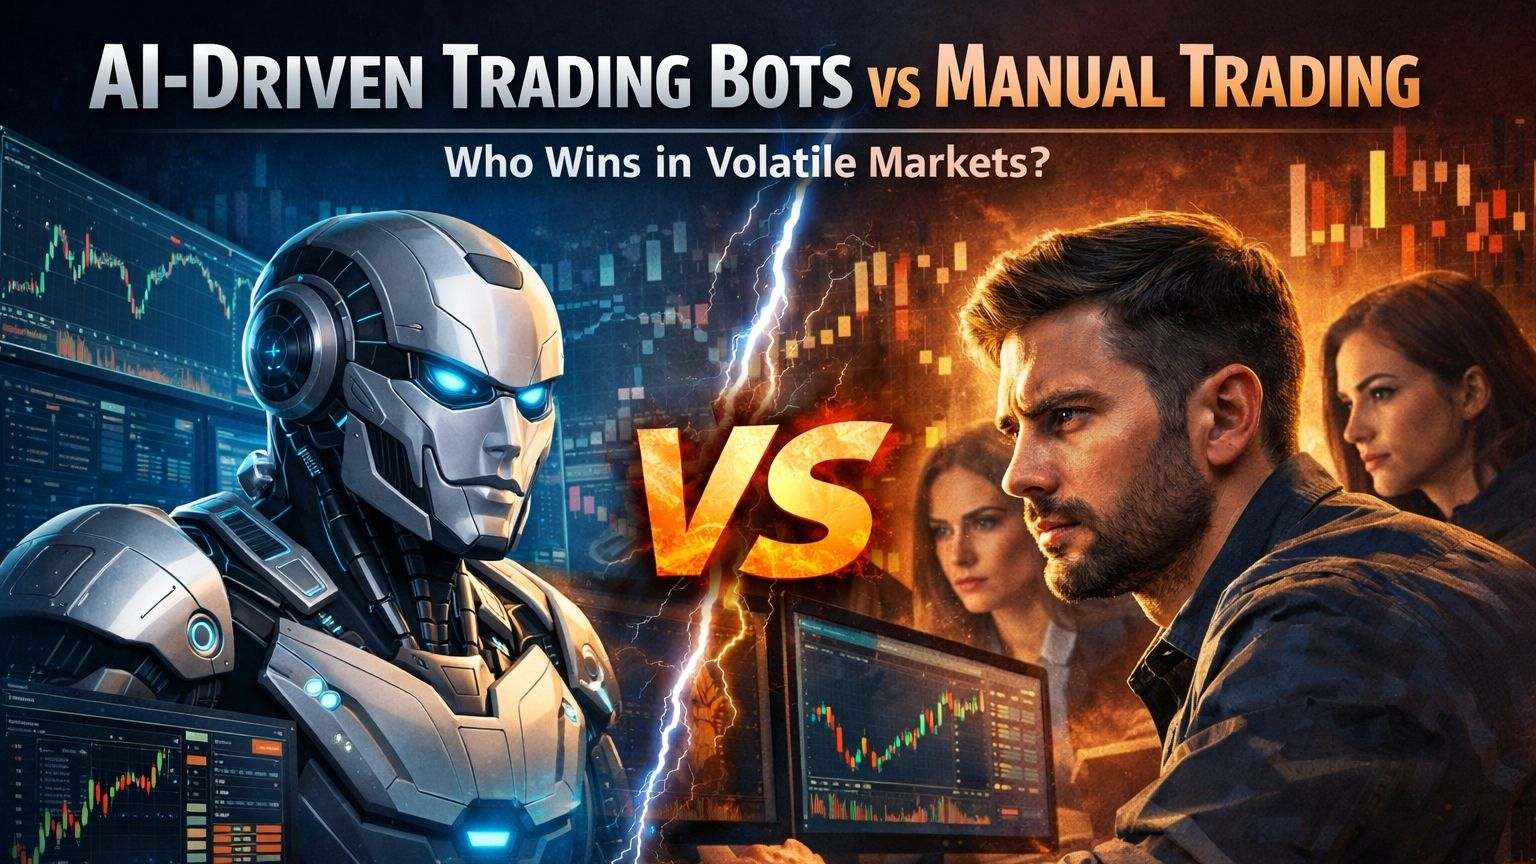
AI-Driven Trading Bots vs Manual Trading: Who Wins in Volatile Markets?Volatility is the lifeblood of financial markets and nowhere is this more evident than in crypto. When $BTC spikes 8% in an hour or altcoins swing double digits overnight, traders face a defining question:
Do algorithms outperform human intuition when markets turn chaotic?
Let's break it down
What Are AI-Driven Trading Bots
AI-driven trading bots are automated software programs that use artificial intelligence and machine learning to analyze market data and execute trades without human intervention.
Instead of a trader manually watching charts, these bots:
Scan large amounts of real-time data
Identify patterns and probabilities
Generate buy/sell signals
Execute trades automatically
Manage risk based on preset rules
Why Bots Thrive in Volatile Markets
1. Speed & Execution Markets can move in milliseconds. Bots execute instantly no hesitation, no emotional delay.
2. 24/7 Operation Crypto never sleeps. Bots monitor markets around the clock without fatigue.
3. Data Processing Power AI models analyze order books, funding rates, volatility clusters, and on-chain metrics simultaneously.
4. Emotionless Decisions Fear and greed destroy human traders during flash crashes. Bots follow predefined rules.
Where Bots Struggle
Overfitting to past data
Poor performance during black swan events
Strategy breakdown in regime shifts
Dependence on clean liquidity and stable infrastructure
When volatility becomes irrational rather than statistical, bots can malfunction or amplify losses.
What Is Manual Trading?
Manual trading is when a human trader personally analyzes the market and executes buy or sell orders without automated systems making decisions for them.
Every step from chart analysis to clicking buy or sell is controlled by the trader.
The Case for Manual Trading
Manual trading relies on discretion, macro interpretation, market psychology, and experience.
Why Humans Still Matter
1. Context Awareness Humans understand narratives ETF approvals, regulatory shocks, geopolitical risk.
For example, during major news tied to Bitcoin or Ethereum, discretionary traders can react to tone and sentiment before models adjust.
2. Adaptive Thinking Markets change regimes trending, ranging, panic-driven. Experienced traders can shift strategies faster than rigid algorithms.
3. Creative Risk Management Humans can reduce exposure, hedge creatively, or step aside entirely during extreme uncertainty.
Where Humans Fail
Emotional bias (revenge trading, FOMO, panic selling)
Inconsistent discipline
Slower execution
Fatigue in 24/7 markets
In highly volatile environments, emotions become the biggest liability.
Performance in Volatile Markets: Who Has the Edge?
1. Structured Volatility (Trending + Liquidity Present)
Bots often outperform.
Momentum models and breakout algorithms thrive.
2. News-Driven Spikes
Manual traders may win.
Context and interpretation beat pure pattern recognition.
3. Flash Crashes / Liquidity Gaps
Mixed results.
Bots can either capture arbitrage instantly or get liquidated rapidly.
4. Extended Sideways Chop
Both struggle but disciplined humans may preserve capital better.
What Is the Hybrid Model in Trading?
The hybrid model in trading is a combination of AI-driven automation and human decision making.
Instead of choosing between bots or manual trading, traders use both allowing technology to handle speed and data, while humans manage strategy and risk.
How the Hybrid Model Works
1. AI Handles the Heavy Lifting
Scans markets 24/7
Detects patterns and volatility shifts
Generates trade signals
Executes trades instantly
2. Humans Provide Oversight
Adjust strategy during regime changes
Interpret macro events and narratives
Manage portfolio-level risk
Override or pause systems during extreme conditions
The Hybrid Model: The Real Winner
Increasingly, professional traders combine both approaches:
AI for signal generation
Automation for execution
Human oversight for risk control
Institutional desks use algorithms to exploit micro-inefficiencies while portfolio managers oversee macro exposure.
The edge is no longer bot vs human.
It’s bot plus human.
Key comparison between AI trading and Manual trading
1.Speed
AI Bots: Instant
Manual Trading: Slower
2. Emotional Control
AI Bots: Perfect
Manual Trading: Vulnerable
3. Adaptability
AI Bots: Depends on model
Manual Trading: High (if experienced)
4. 24/7 Capability
AI Bots: Yes
Manual Trading: Limited
5. Narrative Awareness
AI Bots: Weak
Manual Trading: Strong
In conclusion, In highly volatile crypto markets, the winner often depends on the type of movement unfolding. During short-term, high-frequency chaos, AI-driven bots typically have the advantage thanks to their speed and precision. But when markets shift due to powerful narratives or macro regime changes, experienced human traders tend to perform better because they can interpret context and adapt quickly.
Over the long run, however, neither speed nor intuition guarantees success disciplined risk management does. The real edge isn’t about ego or raw intelligence; it’s about structure and consistency. Markets don’t consistently reward who is smartest they reward who manages risk best. And in volatile conditions, the trader who controls downside exposure whether human or algorithm is the one who ultimately survives and wins.
#CPIWatch
AI-Driven Trading Bots vs Manual Trading: Who Wins in Volatile Markets?
Volatility is the lifeblood of financial markets and nowhere is this more evident than in crypto. When $BTC spikes 8% in an hour or altcoins swing double digits overnight, traders face a defining question:
Do algorithms outperform human intuition when markets turn chaotic?
Let's break it down
What Are AI-Driven Trading Bots
AI-driven trading bots are automated software programs that use artificial intelligence and machine learning to analyze market data and execute trades without human intervention.
Instead of a trader manually watching charts, these bots:
Scan large amounts of real-time data
Identify patterns and probabilities
Generate buy/sell signals
Execute trades automatically
Manage risk based on preset rules
Why Bots Thrive in Volatile Markets
1. Speed & Execution Markets can move in milliseconds. Bots execute instantly no hesitation, no emotional delay.
2. 24/7 Operation Crypto never sleeps. Bots monitor markets around the clock without fatigue.
3. Data Processing Power AI models analyze order books, funding rates, volatility clusters, and on-chain metrics simultaneously.
4. Emotionless Decisions Fear and greed destroy human traders during flash crashes. Bots follow predefined rules.
Where Bots Struggle
Overfitting to past data
Poor performance during black swan events
Strategy breakdown in regime shifts
Dependence on clean liquidity and stable infrastructure
When volatility becomes irrational rather than statistical, bots can malfunction or amplify losses.
What Is Manual Trading?
Manual trading is when a human trader personally analyzes the market and executes buy or sell orders without automated systems making decisions for them.
Every step from chart analysis to clicking buy or sell is controlled by the trader.
The Case for Manual Trading
Manual trading relies on discretion, macro interpretation, market psychology, and experience.
Why Humans Still Matter
1. Context Awareness Humans understand narratives ETF approvals, regulatory shocks, geopolitical risk.
For example, during major news tied to Bitcoin or Ethereum, discretionary traders can react to tone and sentiment before models adjust.
2. Adaptive Thinking Markets change regimes trending, ranging, panic-driven. Experienced traders can shift strategies faster than rigid algorithms.
3. Creative Risk Management Humans can reduce exposure, hedge creatively, or step aside entirely during extreme uncertainty.
Where Humans Fail
Emotional bias (revenge trading, FOMO, panic selling)
Inconsistent discipline
Slower execution
Fatigue in 24/7 markets
In highly volatile environments, emotions become the biggest liability.
Performance in Volatile Markets: Who Has the Edge?
1. Structured Volatility (Trending + Liquidity Present)
Bots often outperform.
Momentum models and breakout algorithms thrive.
2. News-Driven Spikes
Manual traders may win.
Context and interpretation beat pure pattern recognition.
3. Flash Crashes / Liquidity Gaps
Mixed results.
Bots can either capture arbitrage instantly or get liquidated rapidly.
4. Extended Sideways Chop
Both struggle but disciplined humans may preserve capital better.
What Is the Hybrid Model in Trading?
The hybrid model in trading is a combination of AI-driven automation and human decision making.
Instead of choosing between bots or manual trading, traders use both allowing technology to handle speed and data, while humans manage strategy and risk.
How the Hybrid Model Works
1. AI Handles the Heavy Lifting
Scans markets 24/7
Detects patterns and volatility shifts
Generates trade signals
Executes trades instantly
2. Humans Provide Oversight
Adjust strategy during regime changes
Interpret macro events and narratives
Manage portfolio-level risk
Override or pause systems during extreme conditions
The Hybrid Model: The Real Winner
Increasingly, professional traders combine both approaches:
AI for signal generation
Automation for execution
Human oversight for risk control
Institutional desks use algorithms to exploit micro-inefficiencies while portfolio managers oversee macro exposure.
The edge is no longer bot vs human.
It’s bot plus human.
Key comparison between AI trading and Manual trading
1.Speed
AI Bots: Instant
Manual Trading: Slower
2. Emotional Control
AI Bots: Perfect
Manual Trading: Vulnerable
3. Adaptability
AI Bots: Depends on model
Manual Trading: High (if experienced)
4. 24/7 Capability
AI Bots: Yes
Manual Trading: Limited
5. Narrative Awareness
AI Bots: Weak
Manual Trading: Strong
In conclusion, In highly volatile crypto markets, the winner often depends on the type of movement unfolding. During short-term, high-frequency chaos, AI-driven bots typically have the advantage thanks to their speed and precision. But when markets shift due to powerful narratives or macro regime changes, experienced human traders tend to perform better because they can interpret context and adapt quickly.
Over the long run, however, neither speed nor intuition guarantees success disciplined risk management does. The real edge isn’t about ego or raw intelligence; it’s about structure and consistency. Markets don’t consistently reward who is smartest they reward who manages risk best. And in volatile conditions, the trader who controls downside exposure whether human or algorithm is the one who ultimately survives and wins.
#CPIWatch
Do algorithms outperform human intuition when markets turn chaotic?
Let's break it down
What Are AI-Driven Trading Bots
AI-driven trading bots are automated software programs that use artificial intelligence and machine learning to analyze market data and execute trades without human intervention.
Instead of a trader manually watching charts, these bots:
Scan large amounts of real-time data
Identify patterns and probabilities
Generate buy/sell signals
Execute trades automatically
Manage risk based on preset rules
Why Bots Thrive in Volatile Markets
1. Speed & Execution Markets can move in milliseconds. Bots execute instantly no hesitation, no emotional delay.
2. 24/7 Operation Crypto never sleeps. Bots monitor markets around the clock without fatigue.
3. Data Processing Power AI models analyze order books, funding rates, volatility clusters, and on-chain metrics simultaneously.
4. Emotionless Decisions Fear and greed destroy human traders during flash crashes. Bots follow predefined rules.
Where Bots Struggle
Overfitting to past data
Poor performance during black swan events
Strategy breakdown in regime shifts
Dependence on clean liquidity and stable infrastructure
When volatility becomes irrational rather than statistical, bots can malfunction or amplify losses.
What Is Manual Trading?
Manual trading is when a human trader personally analyzes the market and executes buy or sell orders without automated systems making decisions for them.
Every step from chart analysis to clicking buy or sell is controlled by the trader.
The Case for Manual Trading
Manual trading relies on discretion, macro interpretation, market psychology, and experience.
Why Humans Still Matter
1. Context Awareness Humans understand narratives ETF approvals, regulatory shocks, geopolitical risk.
For example, during major news tied to Bitcoin or Ethereum, discretionary traders can react to tone and sentiment before models adjust.
2. Adaptive Thinking Markets change regimes trending, ranging, panic-driven. Experienced traders can shift strategies faster than rigid algorithms.
3. Creative Risk Management Humans can reduce exposure, hedge creatively, or step aside entirely during extreme uncertainty.
Where Humans Fail
Emotional bias (revenge trading, FOMO, panic selling)
Inconsistent discipline
Slower execution
Fatigue in 24/7 markets
In highly volatile environments, emotions become the biggest liability.
Performance in Volatile Markets: Who Has the Edge?
1. Structured Volatility (Trending + Liquidity Present)
Bots often outperform.
Momentum models and breakout algorithms thrive.
2. News-Driven Spikes
Manual traders may win.
Context and interpretation beat pure pattern recognition.
3. Flash Crashes / Liquidity Gaps
Mixed results.
Bots can either capture arbitrage instantly or get liquidated rapidly.
4. Extended Sideways Chop
Both struggle but disciplined humans may preserve capital better.
What Is the Hybrid Model in Trading?
The hybrid model in trading is a combination of AI-driven automation and human decision making.
Instead of choosing between bots or manual trading, traders use both allowing technology to handle speed and data, while humans manage strategy and risk.
How the Hybrid Model Works
1. AI Handles the Heavy Lifting
Scans markets 24/7
Detects patterns and volatility shifts
Generates trade signals
Executes trades instantly
2. Humans Provide Oversight
Adjust strategy during regime changes
Interpret macro events and narratives
Manage portfolio-level risk
Override or pause systems during extreme conditions
The Hybrid Model: The Real Winner
Increasingly, professional traders combine both approaches:
AI for signal generation
Automation for execution
Human oversight for risk control
Institutional desks use algorithms to exploit micro-inefficiencies while portfolio managers oversee macro exposure.
The edge is no longer bot vs human.
It’s bot plus human.
Key comparison between AI trading and Manual trading
1.Speed
AI Bots: Instant
Manual Trading: Slower
2. Emotional Control
AI Bots: Perfect
Manual Trading: Vulnerable
3. Adaptability
AI Bots: Depends on model
Manual Trading: High (if experienced)
4. 24/7 Capability
AI Bots: Yes
Manual Trading: Limited
5. Narrative Awareness
AI Bots: Weak
Manual Trading: Strong
In conclusion, In highly volatile crypto markets, the winner often depends on the type of movement unfolding. During short-term, high-frequency chaos, AI-driven bots typically have the advantage thanks to their speed and precision. But when markets shift due to powerful narratives or macro regime changes, experienced human traders tend to perform better because they can interpret context and adapt quickly.
Over the long run, however, neither speed nor intuition guarantees success disciplined risk management does. The real edge isn’t about ego or raw intelligence; it’s about structure and consistency. Markets don’t consistently reward who is smartest they reward who manages risk best. And in volatile conditions, the trader who controls downside exposure whether human or algorithm is the one who ultimately survives and wins.
#CPIWatch
5
3
44
13.5k
See translation
$LINK
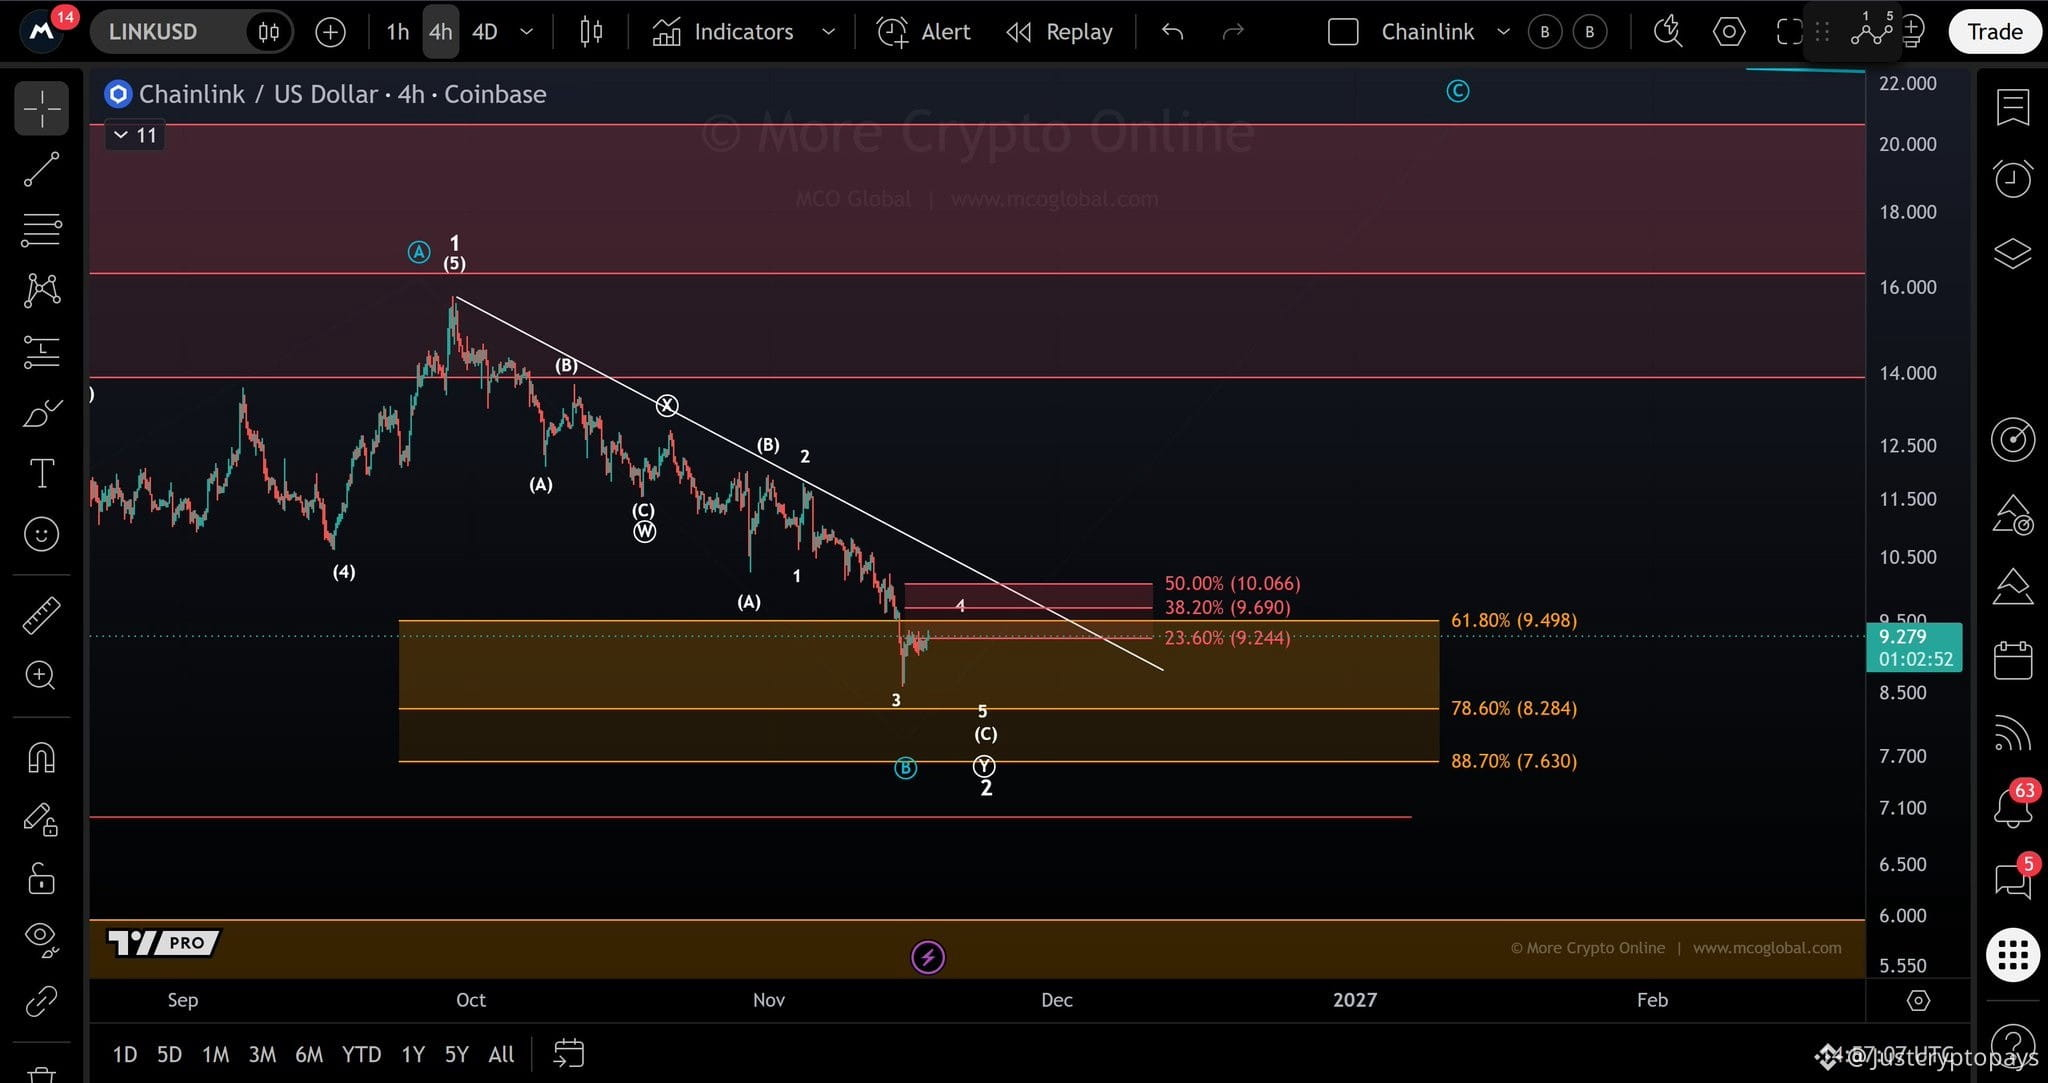
There has been very little movement, and the outlook remains unchanged. Price is still testing the first red resistance level at $9.244. As long as it stays below this level, wave 5 of wave (C) could still push lower into the orange support zone between $7.63 and $9.498. For now, there is still no clear confirmation that a bottom is in place.
#NvidiaEarningsTonight:AIStocks’NextMove?
$LINK
There has been very little movement, and the outlook remains unchanged. Price is still testing the first red resistance level at $9.244. As long as it stays below this level, wave 5 of wave (C) could still push lower into the orange support zone between $7.63 and $9.498. For now, there is still no clear confirmation that a bottom is in place.
#NvidiaEarningsTonight:AIStocks’NextMove?
There has been very little movement, and the outlook remains unchanged. Price is still testing the first red resistance level at $9.244. As long as it stays below this level, wave 5 of wave (C) could still push lower into the orange support zone between $7.63 and $9.498. For now, there is still no clear confirmation that a bottom is in place.
#NvidiaEarningsTonight:AIStocks’NextMove?
126
See translation
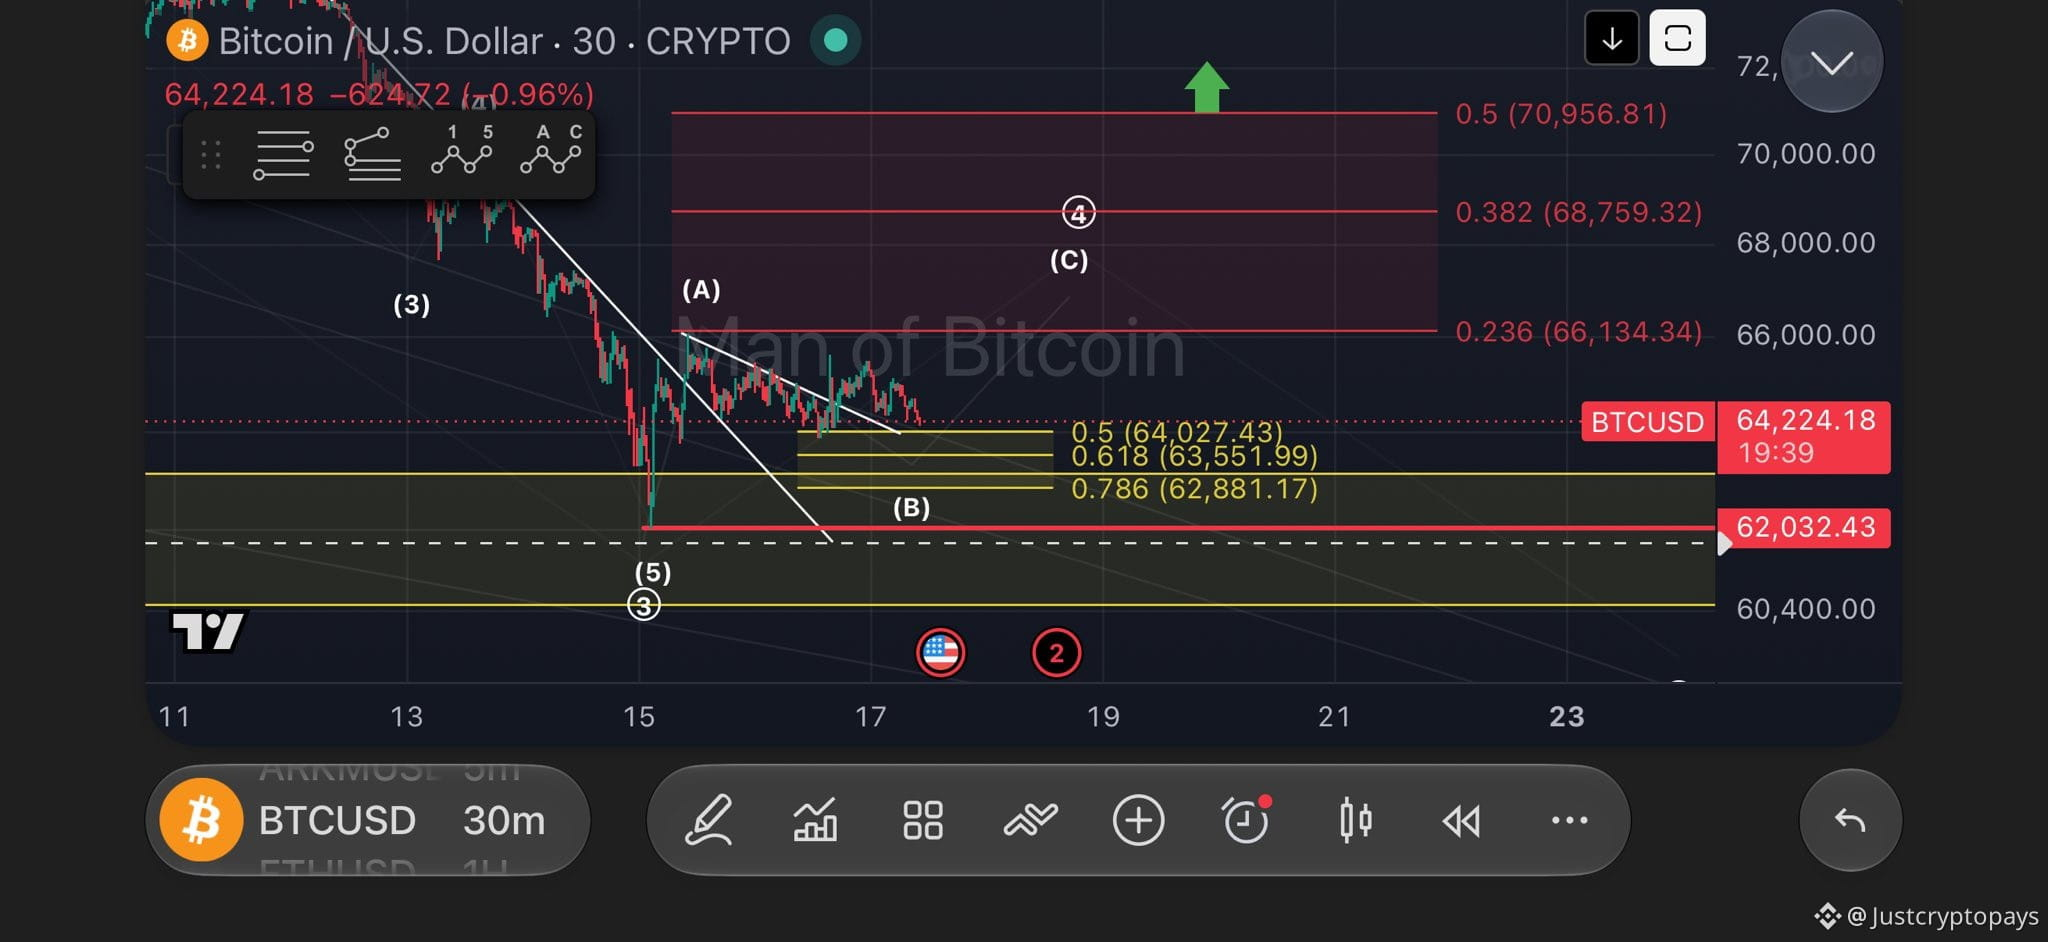
$BTC still appears to be forming wave-(B) to the downside. As long as the price holds above $62,032, the next expected move remains a wave-(C) of 4 to the upside.
The key resistance to watch is $70,956.
#NvidiaEarningsTonight:AIStocks’NextMove?
$BTC still appears to be forming wave-(B) to the downside. As long as the price holds above $62,032, the next expected move remains a wave-(C) of 4 to the upside.
The key resistance to watch is $70,956.
#NvidiaEarningsTonight:AIStocks’NextMove?
The key resistance to watch is $70,956.
#NvidiaEarningsTonight:AIStocks’NextMove?
1
111
See translation
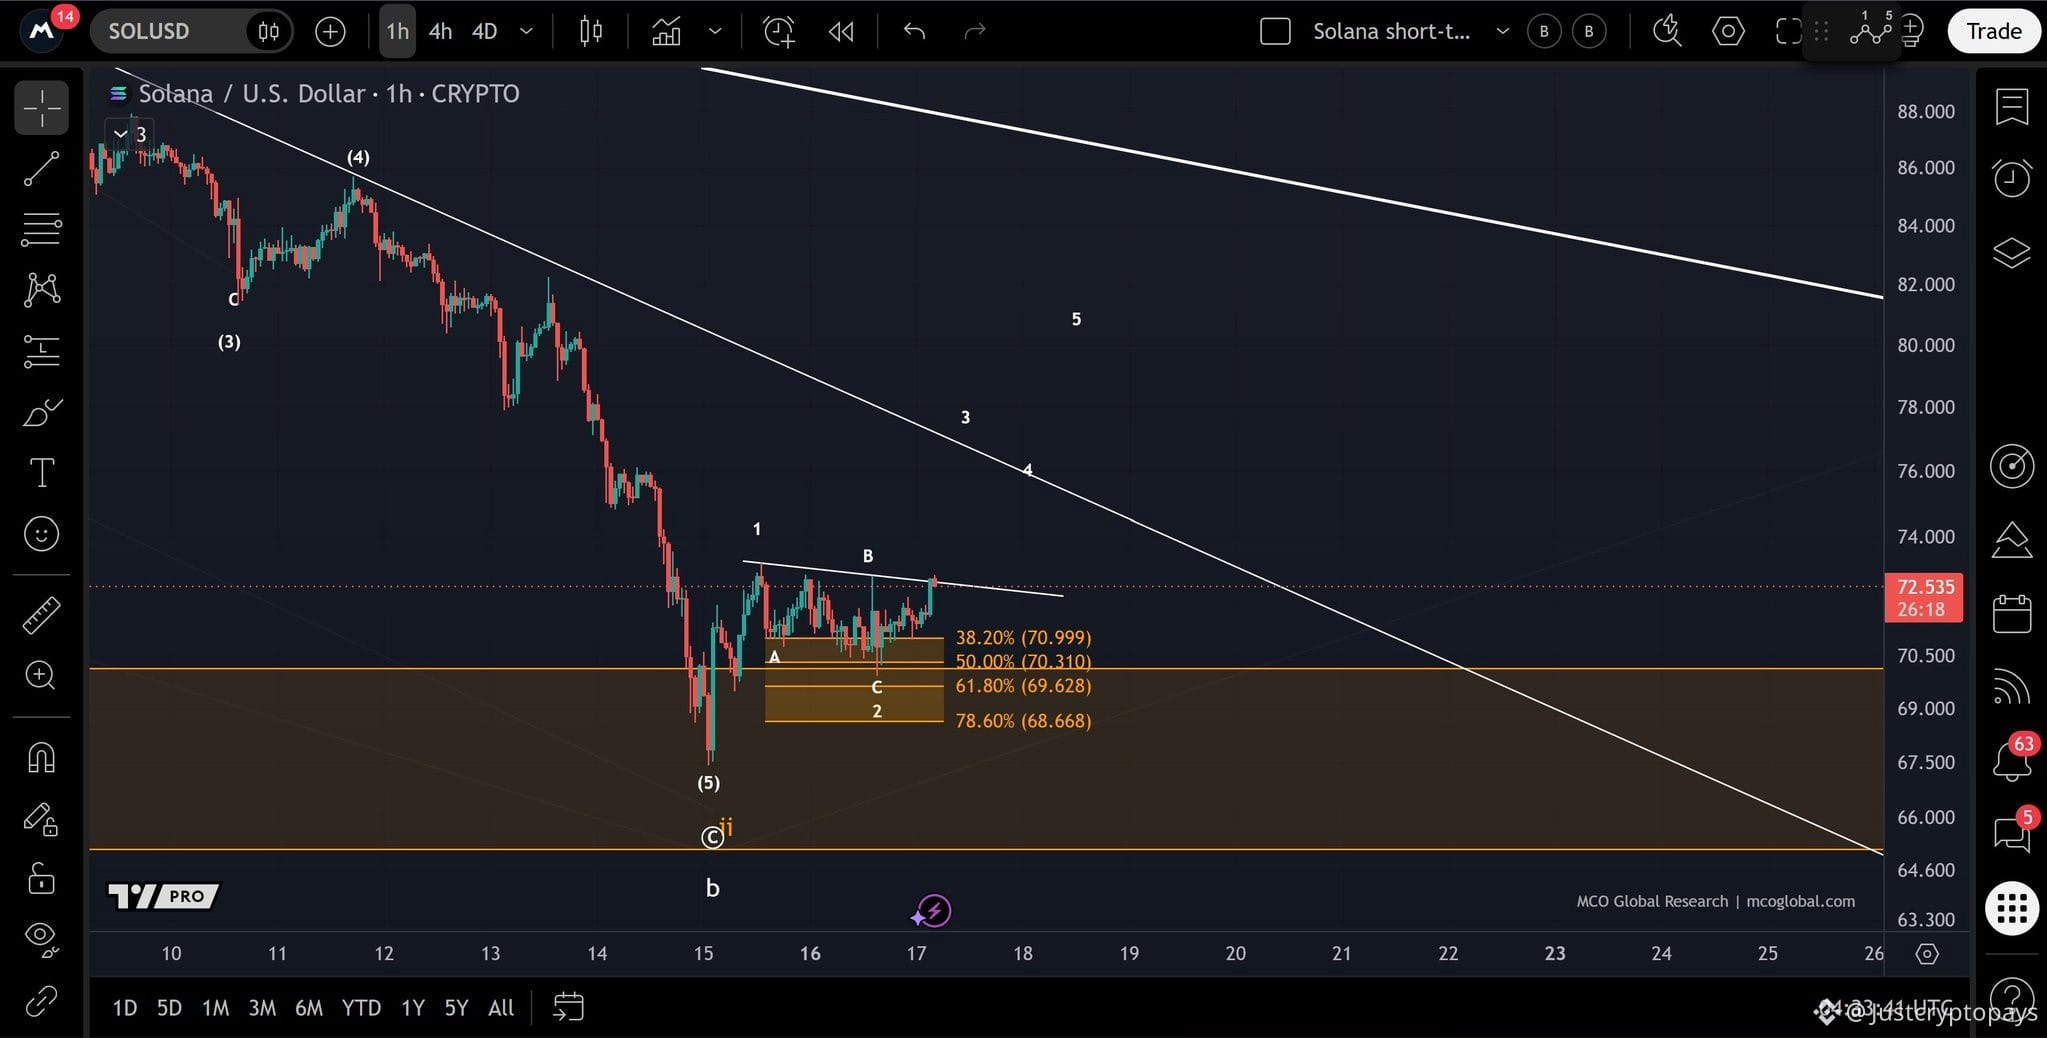
$SOL is showing its first upside reaction from the micro support zone between $68.668 and $70.999. Price is now testing the minor resistance formed by the recent highs. A break above this level would be an encouraging first sign for wave 3 in the white scenario, although the white trend line overhead remains the bigger resistance to watch.
#WhatInvestmentSignalsDo13FFilingsReveal?
$SOL is showing its first upside reaction from the micro support zone between $68.668 and $70.999. Price is now testing the minor resistance formed by the recent highs. A break above this level would be an encouraging first sign for wave 3 in the white scenario, although the white trend line overhead remains the bigger resistance to watch.
#WhatInvestmentSignalsDo13FFilingsReveal?
#WhatInvestmentSignalsDo13FFilingsReveal?
143
See translation
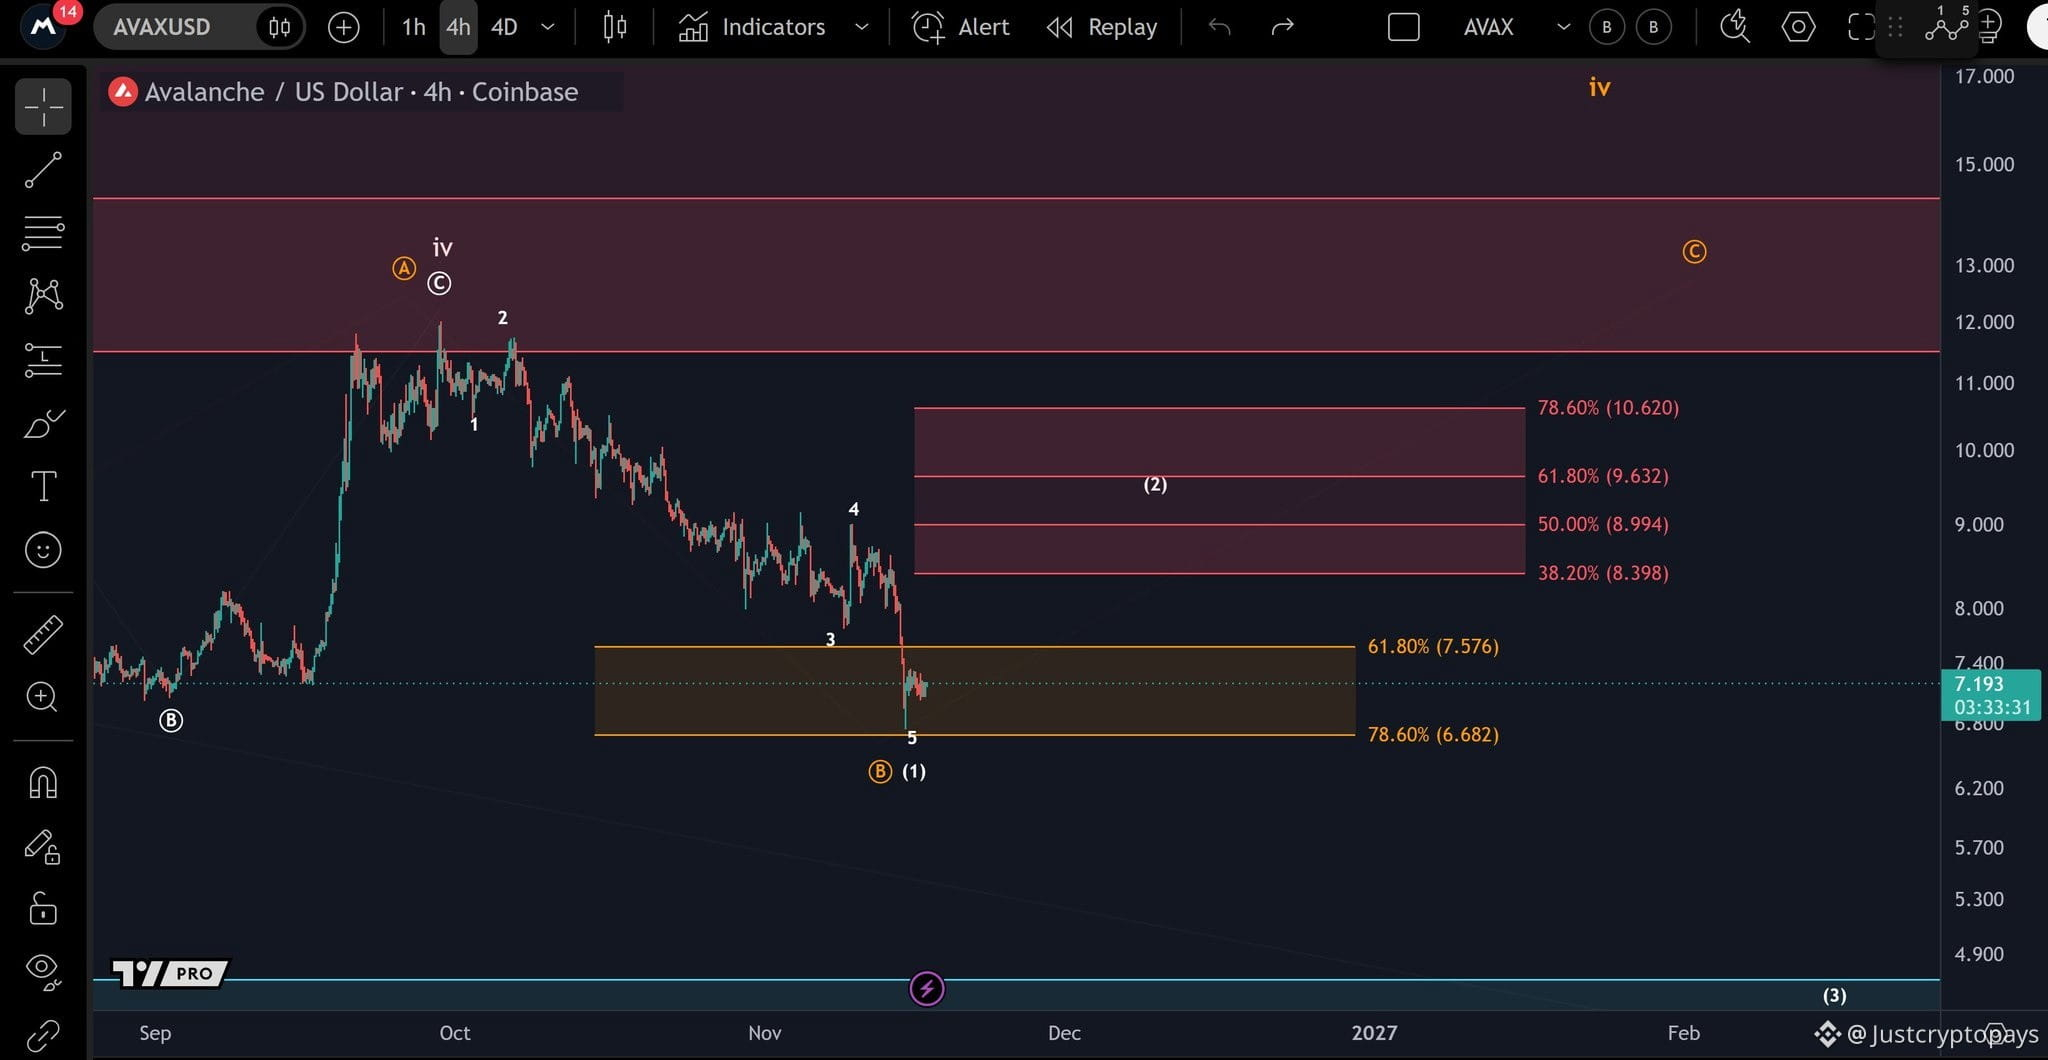
$AVAX
AVAX remains within the micro support zone between $6.682 and $7.576. If the price bounces from here, the first major hurdle will be the red resistance zone between $8.398 and $10.620.
However, the structure of the bounce will be important. A 3-wave move to the upside would likely represent wave (2) in the white scenario, leaving wave (3) to the downside as the next move. This would open the door to further declines.
#AnthropicIPOTestsInvestorAppetiteForAI
$AVAX
AVAX remains within the micro support zone between $6.682 and $7.576. If the price bounces from here, the first major hurdle will be the red resistance zone between $8.398 and $10.620.
However, the structure of the bounce will be important. A 3-wave move to the upside would likely represent wave (2) in the white scenario, leaving wave (3) to the downside as the next move. This would open the door to further declines.
#AnthropicIPOTestsInvestorAppetiteForAI
AVAX remains within the micro support zone between $6.682 and $7.576. If the price bounces from here, the first major hurdle will be the red resistance zone between $8.398 and $10.620.
However, the structure of the bounce will be important. A 3-wave move to the upside would likely represent wave (2) in the white scenario, leaving wave (3) to the downside as the next move. This would open the door to further declines.
#AnthropicIPOTestsInvestorAppetiteForAI
2
369
See translation
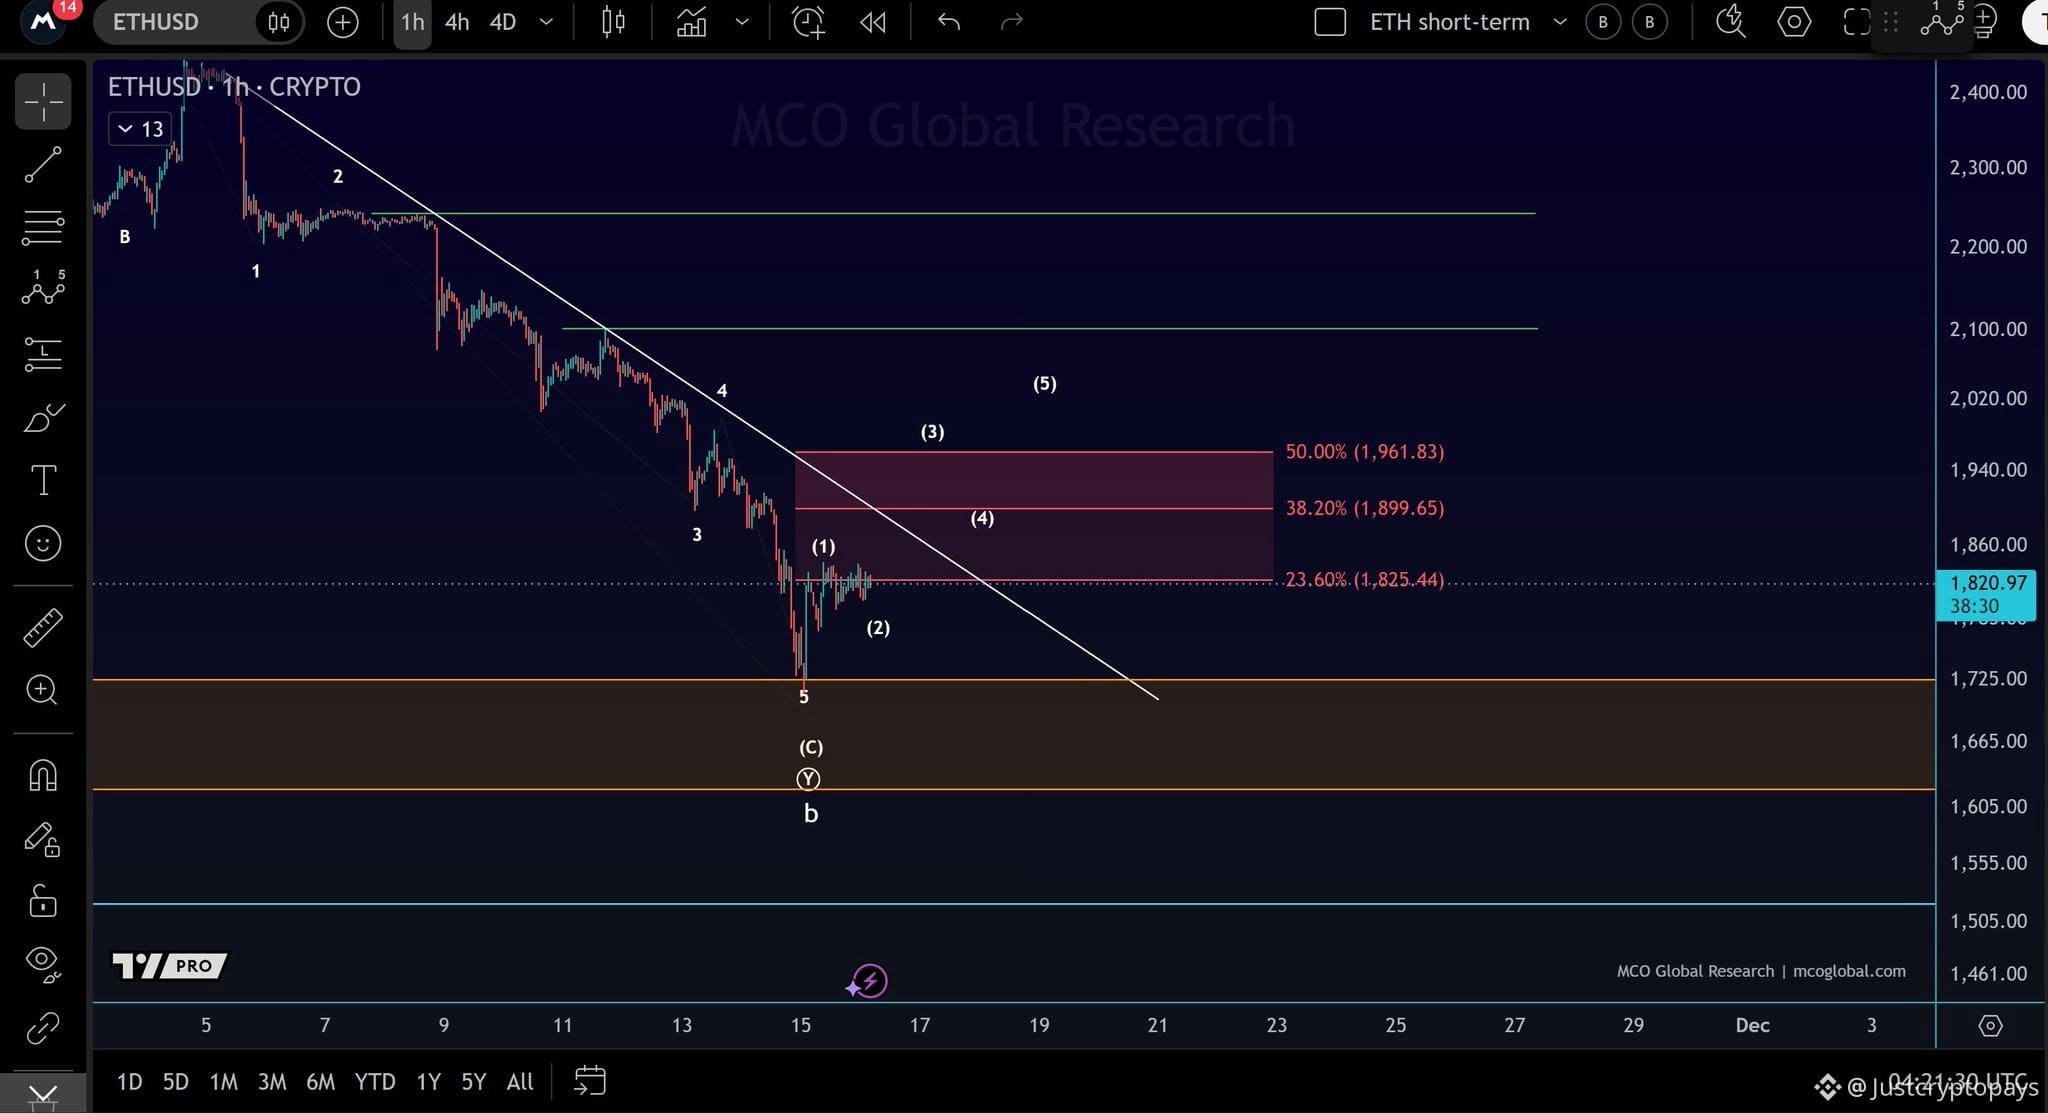
$ETH A clear 5-wave move to the upside, as outlined on the chart, is needed before we can consider a major bottom confirmed. For now, the white trendline and the red resistance zone between $1,825.44 and $1,961.83 remain key hurdles for the price to overcome.
#CryptoSelloffTriggersMultipleWhaleLiquidations
$ETH A clear 5-wave move to the upside, as outlined on the chart, is needed before we can consider a major bottom confirmed. For now, the white trendline and the red resistance zone between $1,825.44 and $1,961.83 remain key hurdles for the price to overcome.
#CryptoSelloffTriggersMultipleWhaleLiquidations
#CryptoSelloffTriggersMultipleWhaleLiquidations
1
200
See translation
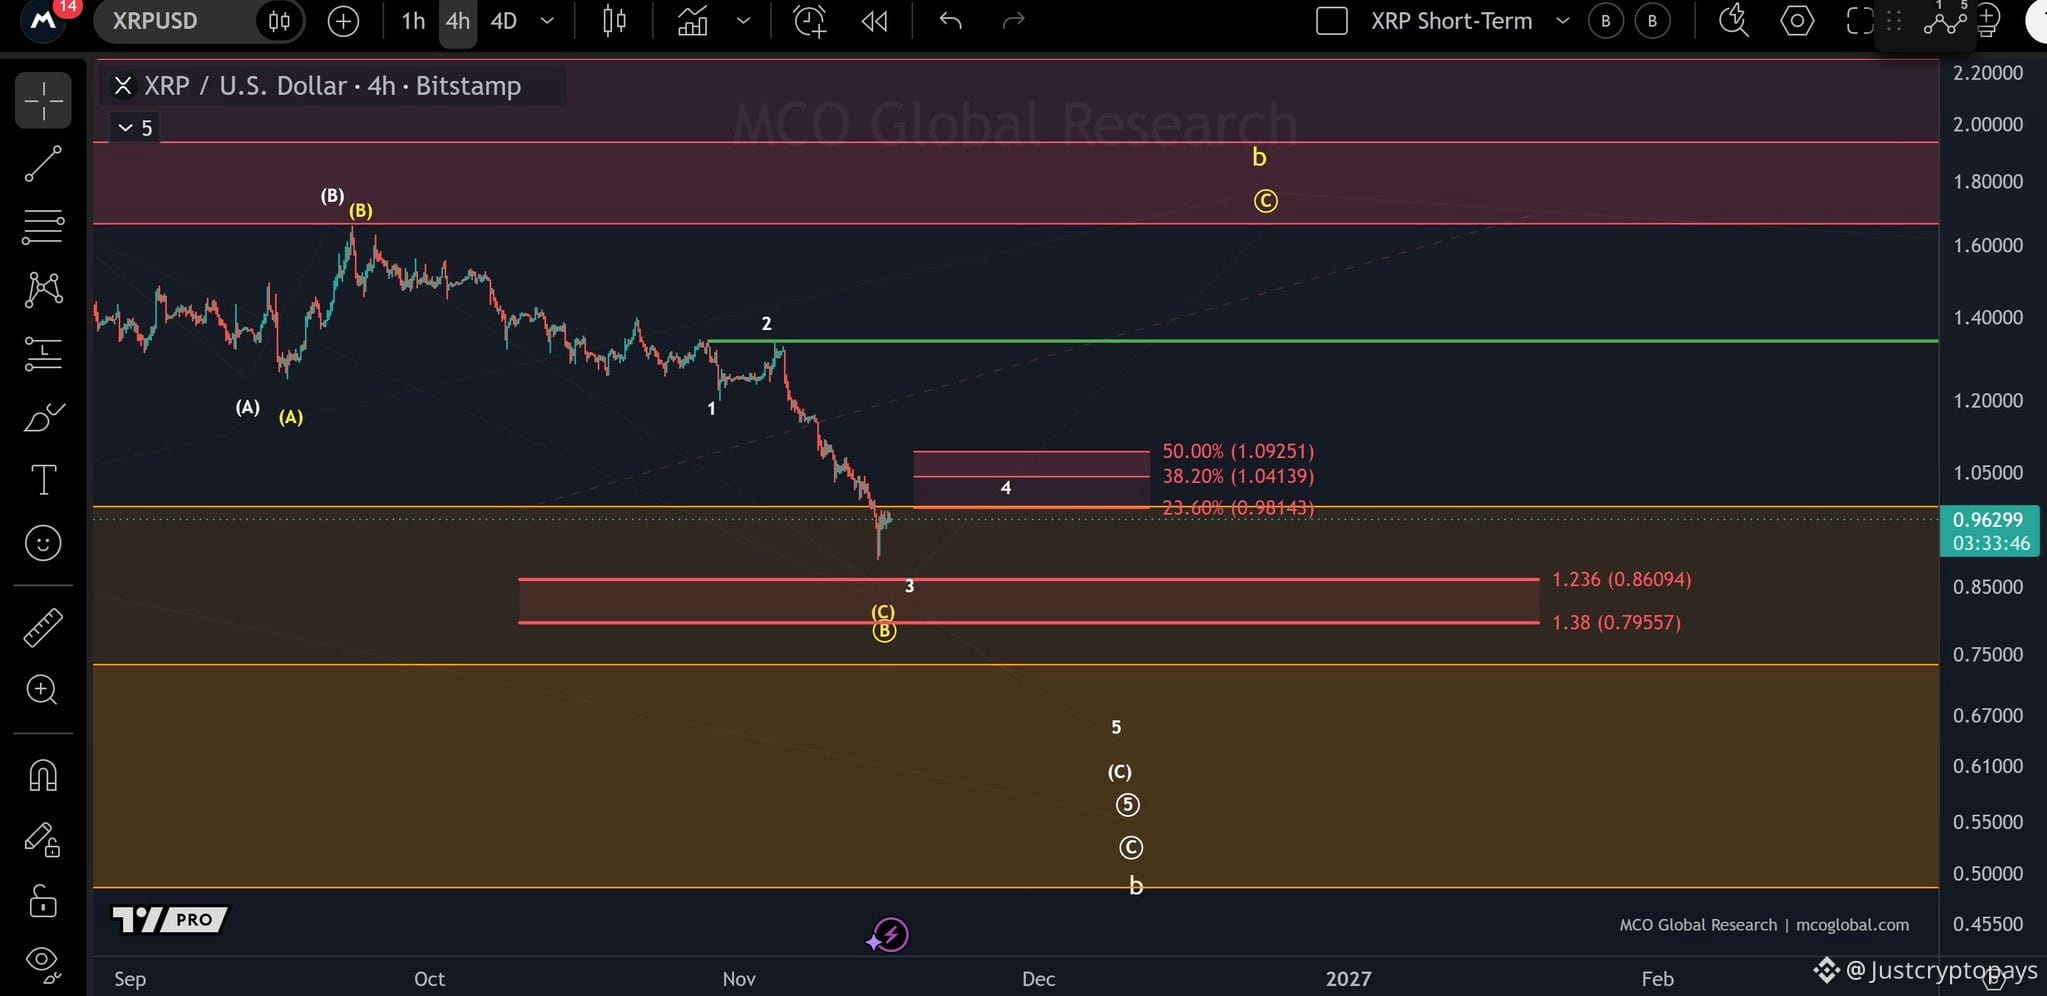
$XRP is showing a relatively weak bounce, with no clear indication of a bottom just yet. The first resistance remains between $0.981 and $1.09. A break above this zone would be the first sign that a local low may be in.
#HuangReportedlyConsidersReturnToNvidia
$XRP is showing a relatively weak bounce, with no clear indication of a bottom just yet. The first resistance remains between $0.981 and $1.09. A break above this zone would be the first sign that a local low may be in.
#HuangReportedlyConsidersReturnToNvidia
#HuangReportedlyConsidersReturnToNvidia
288
See translation
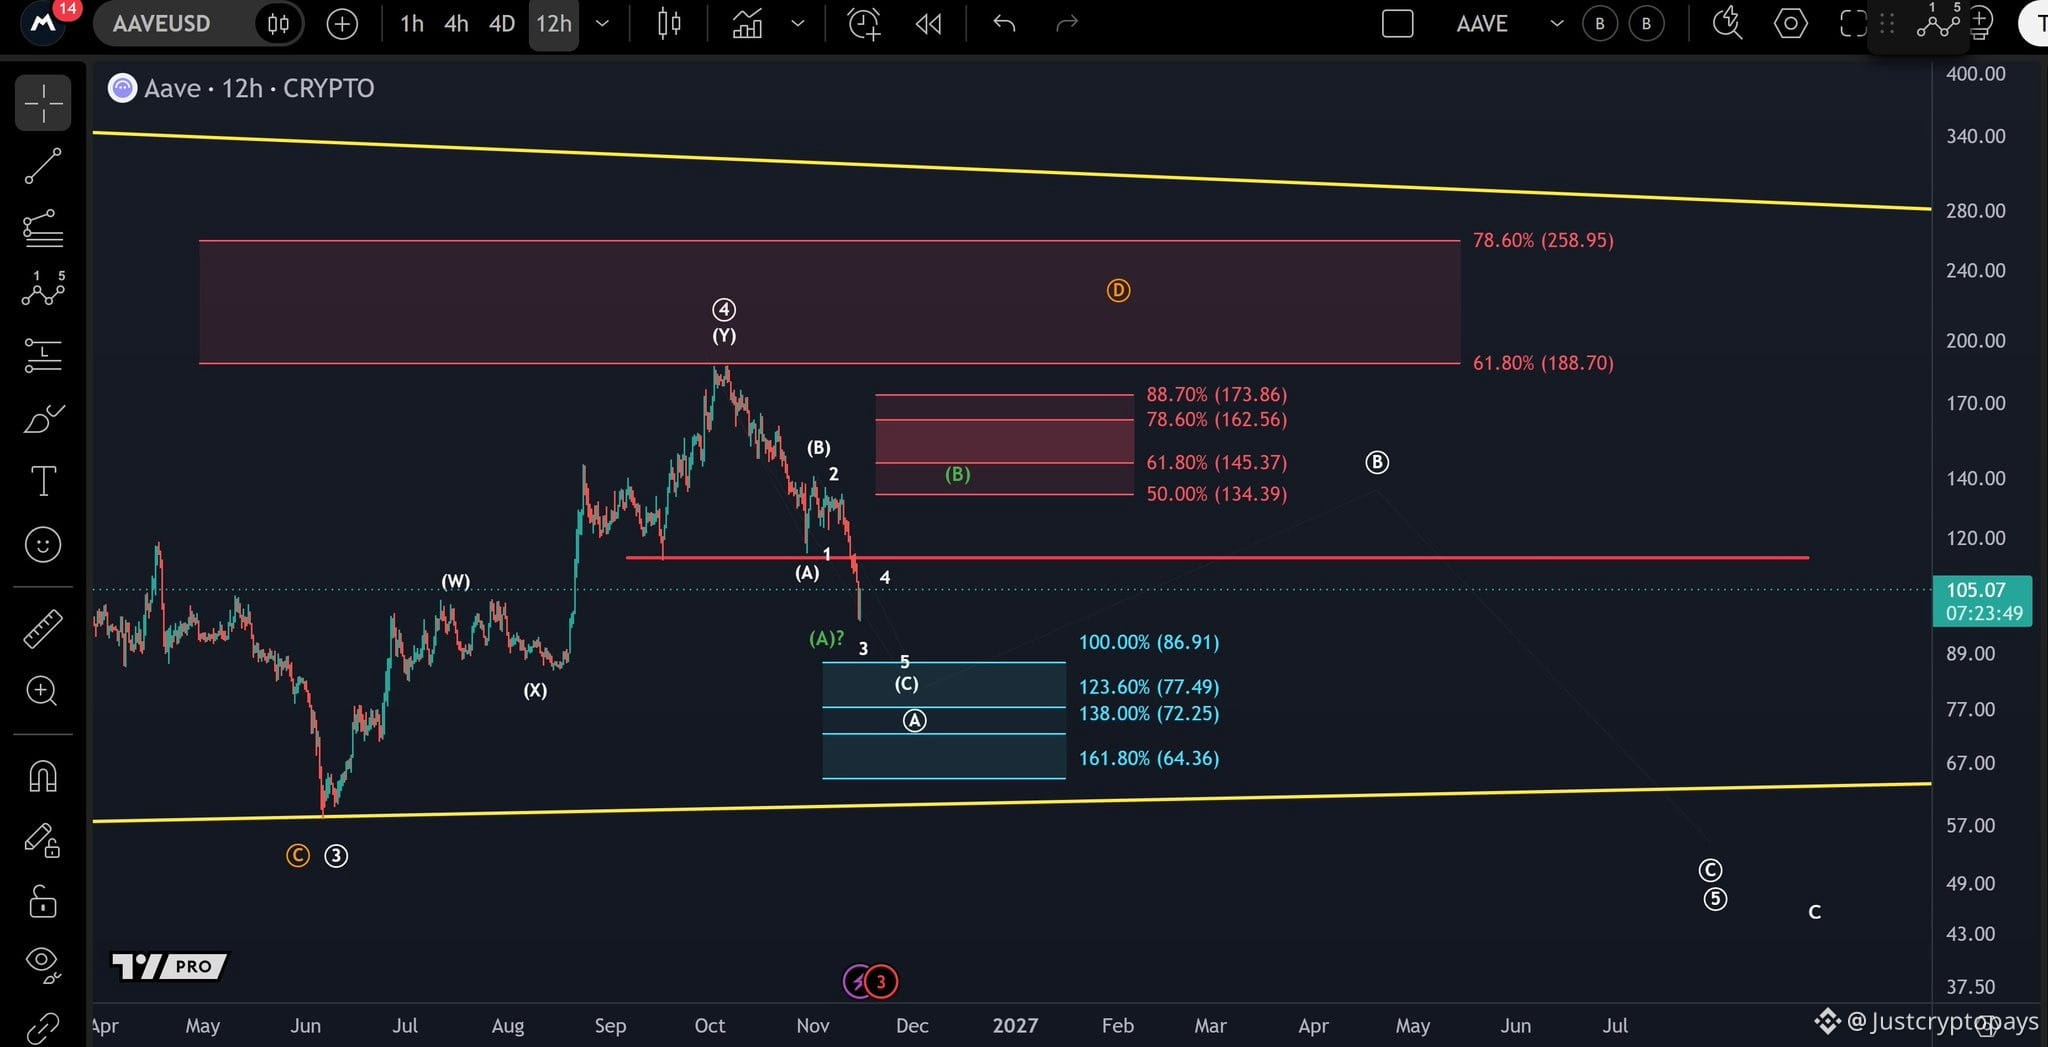
$AAVE
Under the white scenario, the price could still see further downside toward the blue target zone between $64.36 and $86.91. This is where wave (C) of circle wave A could potentially come to an end.
This scenario remains valid as long as the price stays below the red resistance level at $113.90.
#USSpotXRPETFsSeeLargestWeeklyOutflowIn8Months
$AAVE
Under the white scenario, the price could still see further downside toward the blue target zone between $64.36 and $86.91. This is where wave (C) of circle wave A could potentially come to an end.
This scenario remains valid as long as the price stays below the red resistance level at $113.90.
#USSpotXRPETFsSeeLargestWeeklyOutflowIn8Months
Under the white scenario, the price could still see further downside toward the blue target zone between $64.36 and $86.91. This is where wave (C) of circle wave A could potentially come to an end.
This scenario remains valid as long as the price stays below the red resistance level at $113.90.
#USSpotXRPETFsSeeLargestWeeklyOutflowIn8Months
2
1
466
See translation
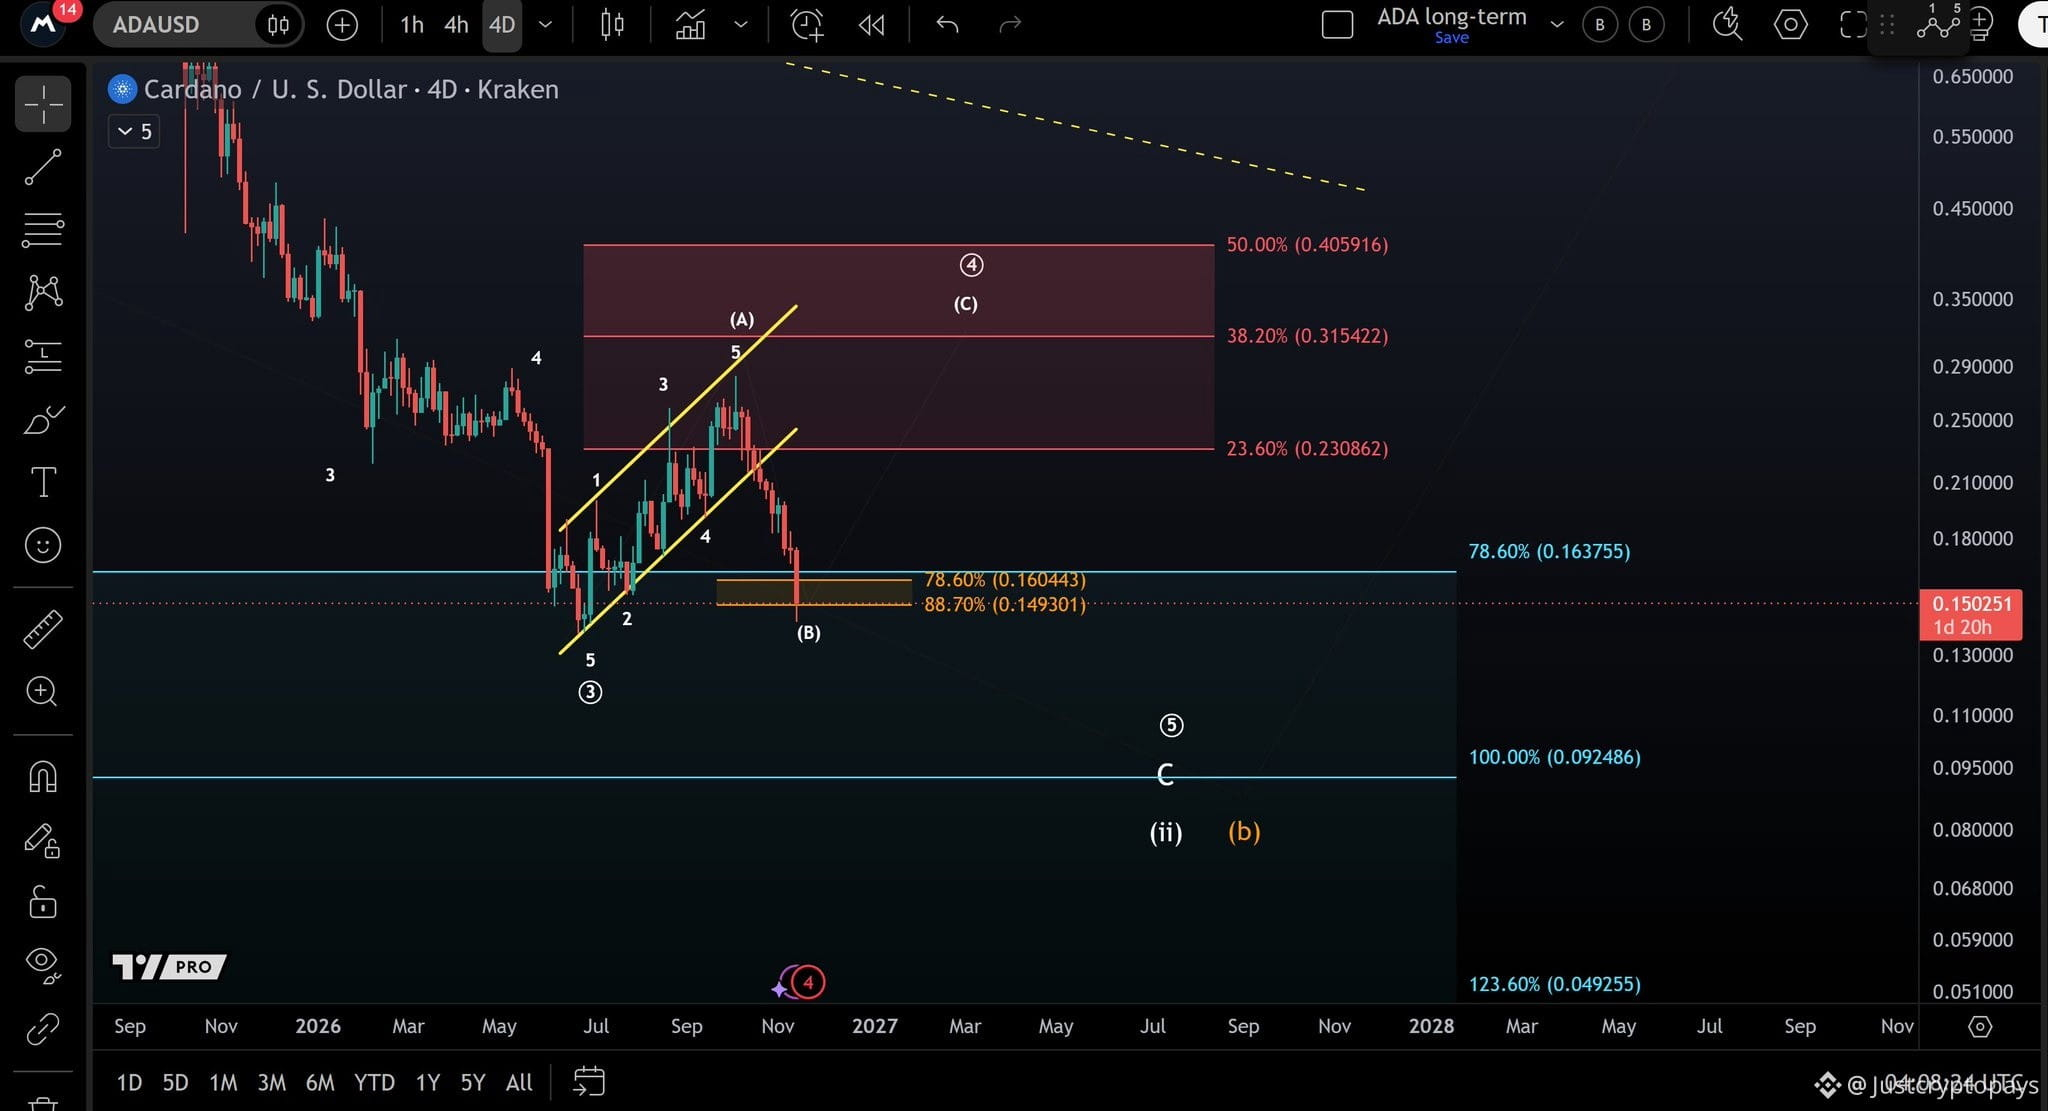
$ADA
Price is currently testing the 88.7% Fibonacci retracement at $0.149, but there is still no clear indication of a bottom.
If ADA breaks below the weekend low and fails to reclaim it, the next downside target sits at the 100% extension around $0.092.
#USSpotXRPETFsSeeLargestWeeklyOutflowIn8Months
$ADA
Price is currently testing the 88.7% Fibonacci retracement at $0.149, but there is still no clear indication of a bottom.
If ADA breaks below the weekend low and fails to reclaim it, the next downside target sits at the 100% extension around $0.092.
#USSpotXRPETFsSeeLargestWeeklyOutflowIn8Months
Price is currently testing the 88.7% Fibonacci retracement at $0.149, but there is still no clear indication of a bottom.
If ADA breaks below the weekend low and fails to reclaim it, the next downside target sits at the 100% extension around $0.092.
#USSpotXRPETFsSeeLargestWeeklyOutflowIn8Months
2
645
See translation
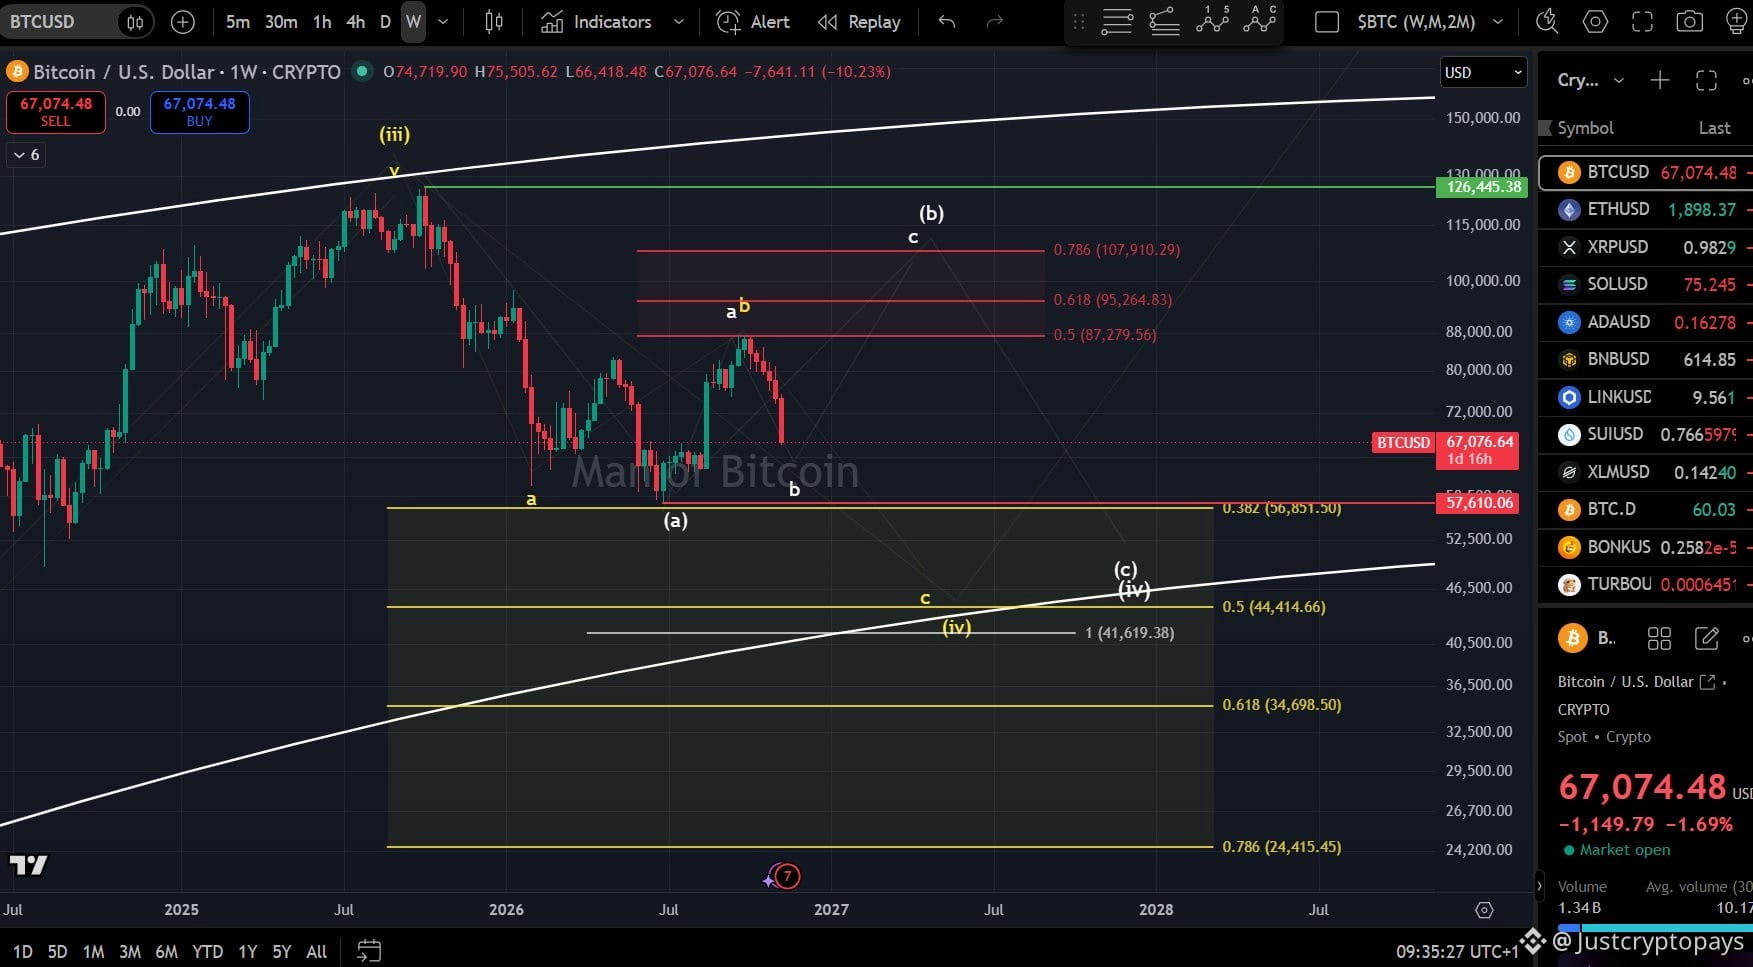
$BTC on the higher timeframe.
If this weekly candle closes around the current levels, I would expect more downside.
The key level to watch is $57,610. A break below it would put the white roadmap at risk.
#WhatWillDriveCryptoandStocks’NextRebound?
$BTC on the higher timeframe.
If this weekly candle closes around the current levels, I would expect more downside.
The key level to watch is $57,610. A break below it would put the white roadmap at risk.
#WhatWillDriveCryptoandStocks’NextRebound?
If this weekly candle closes around the current levels, I would expect more downside.
The key level to watch is $57,610. A break below it would put the white roadmap at risk.
#WhatWillDriveCryptoandStocks’NextRebound?
4
539
See translation
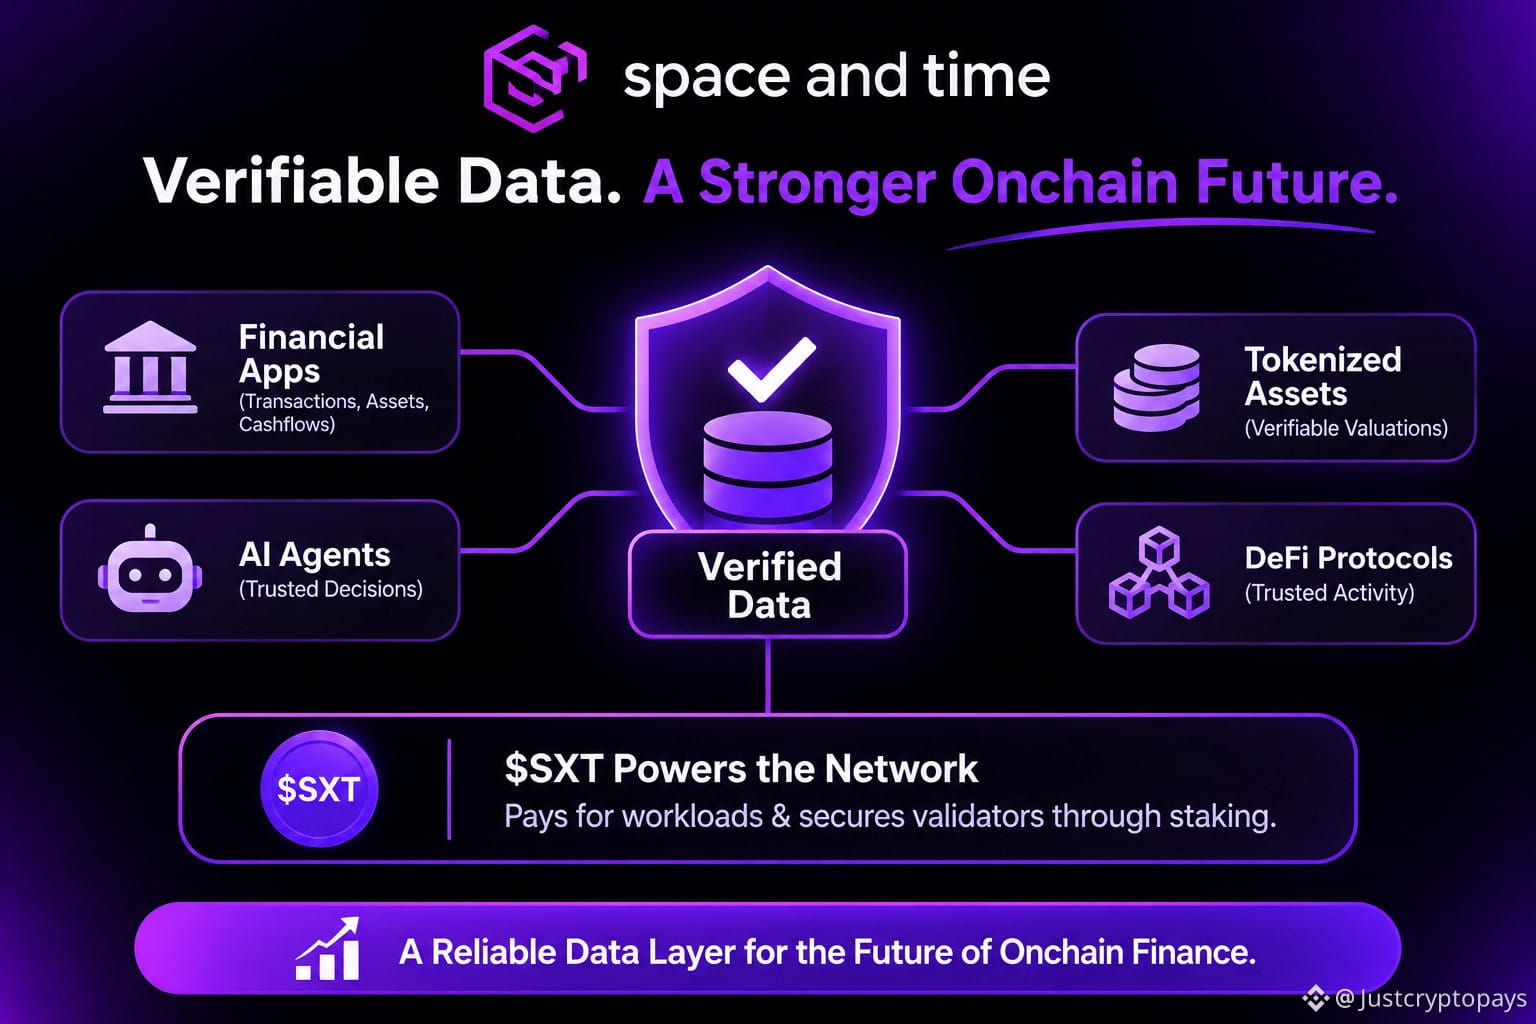
As AI, tokenization, and DeFi continue to develop, one thing that shouldn't be overlooked is the quality and reliability of the data powering them.
@SpaceandTimeDB addresses an important part of this challenge by making data verifiable, rather than simply accessible.
Financial applications depend on information such as transaction history, asset holdings, cashflows, and protocol activity. But accessing this information is only part of the equation. Being able to verify the data and the calculations behind it is just as important.
For AI agents, this provides verified information to support financial decisions. Tokenized assets can benefit from verifiable valuations and trading volumes, while DeFi protocols can use historical activity to determine rewards and user eligibility.
$SXT also plays a practical role by paying for network workloads and supporting validator security through staking.
That's an important foundation for the future of onchain finance.
#sxt
As AI, tokenization, and DeFi continue to develop, one thing that shouldn't be overlooked is the quality and reliability of the data powering them.
@SpaceandTime addresses an important part of this challenge by making data verifiable, rather than simply accessible.
Financial applications depend on information such as transaction history, asset holdings, cashflows, and protocol activity. But accessing this information is only part of the equation. Being able to verify the data and the calculations behind it is just as important.
For AI agents, this provides verified information to support financial decisions. Tokenized assets can benefit from verifiable valuations and trading volumes, while DeFi protocols can use historical activity to determine rewards and user eligibility.
$SXT also plays a practical role by paying for network workloads and supporting validator security through staking.
That's an important foundation for the future of onchain finance.
#sxt
@SpaceandTime addresses an important part of this challenge by making data verifiable, rather than simply accessible.
Financial applications depend on information such as transaction history, asset holdings, cashflows, and protocol activity. But accessing this information is only part of the equation. Being able to verify the data and the calculations behind it is just as important.
For AI agents, this provides verified information to support financial decisions. Tokenized assets can benefit from verifiable valuations and trading volumes, while DeFi protocols can use historical activity to determine rewards and user eligibility.
$SXT also plays a practical role by paying for network workloads and supporting validator security through staking.
That's an important foundation for the future of onchain finance.
#sxt
2
394
See translation
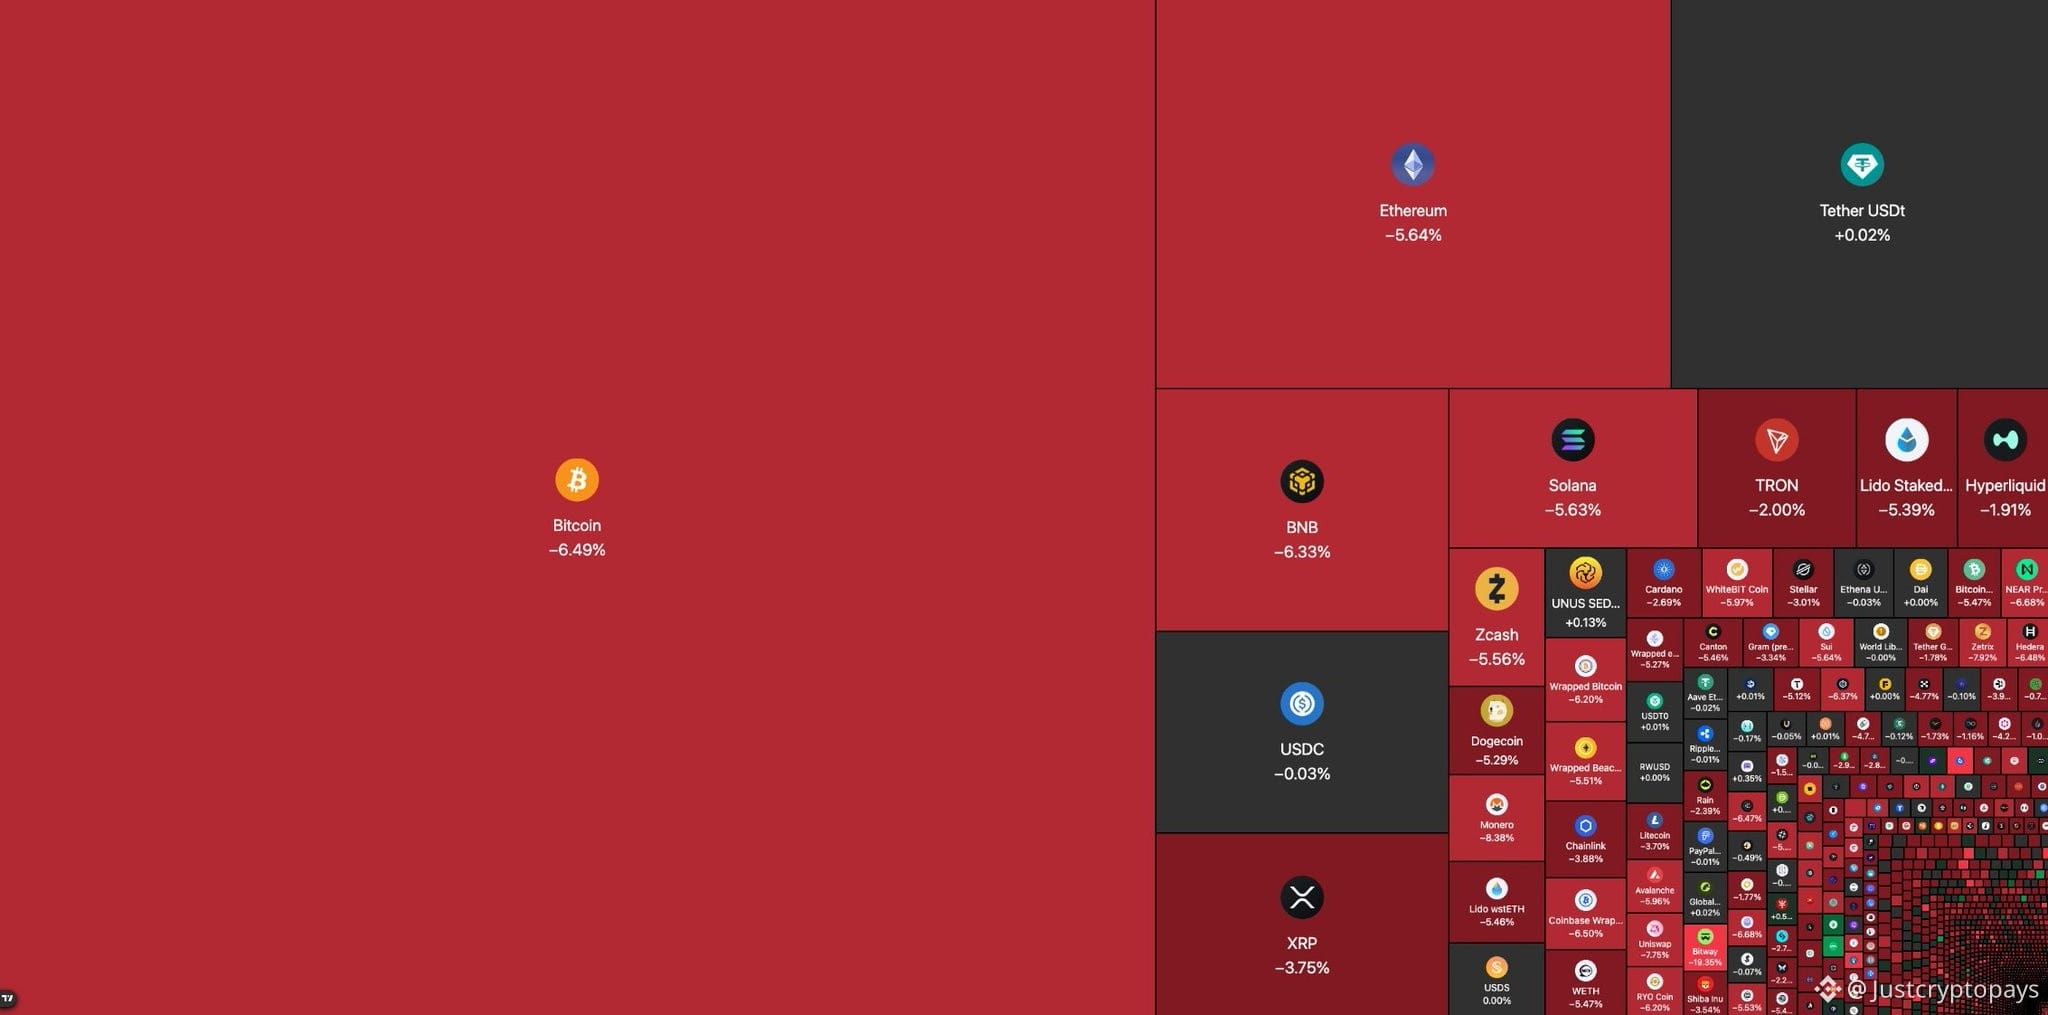
🚨 Over $440M in crypto positions were liquidated in the past hour as the market came under heavy selling pressure, with $417M coming from long positions.
$BTC dropped below $69K. $ETH fell under $1,950. SOL slipped to $78.
#Anthropic’s6xIPODemandSignalsPotentialRecordRaise
🚨 Over $440M in crypto positions were liquidated in the past hour as the market came under heavy selling pressure, with $417M coming from long positions.
$BTC dropped below $69K. $ETH fell under $1,950. SOL slipped to $78.
#Anthropic’s6xIPODemandSignalsPotentialRecordRaise
$BTC dropped below $69K. $ETH fell under $1,950. SOL slipped to $78.
#Anthropic’s6xIPODemandSignalsPotentialRecordRaise
171
See translation
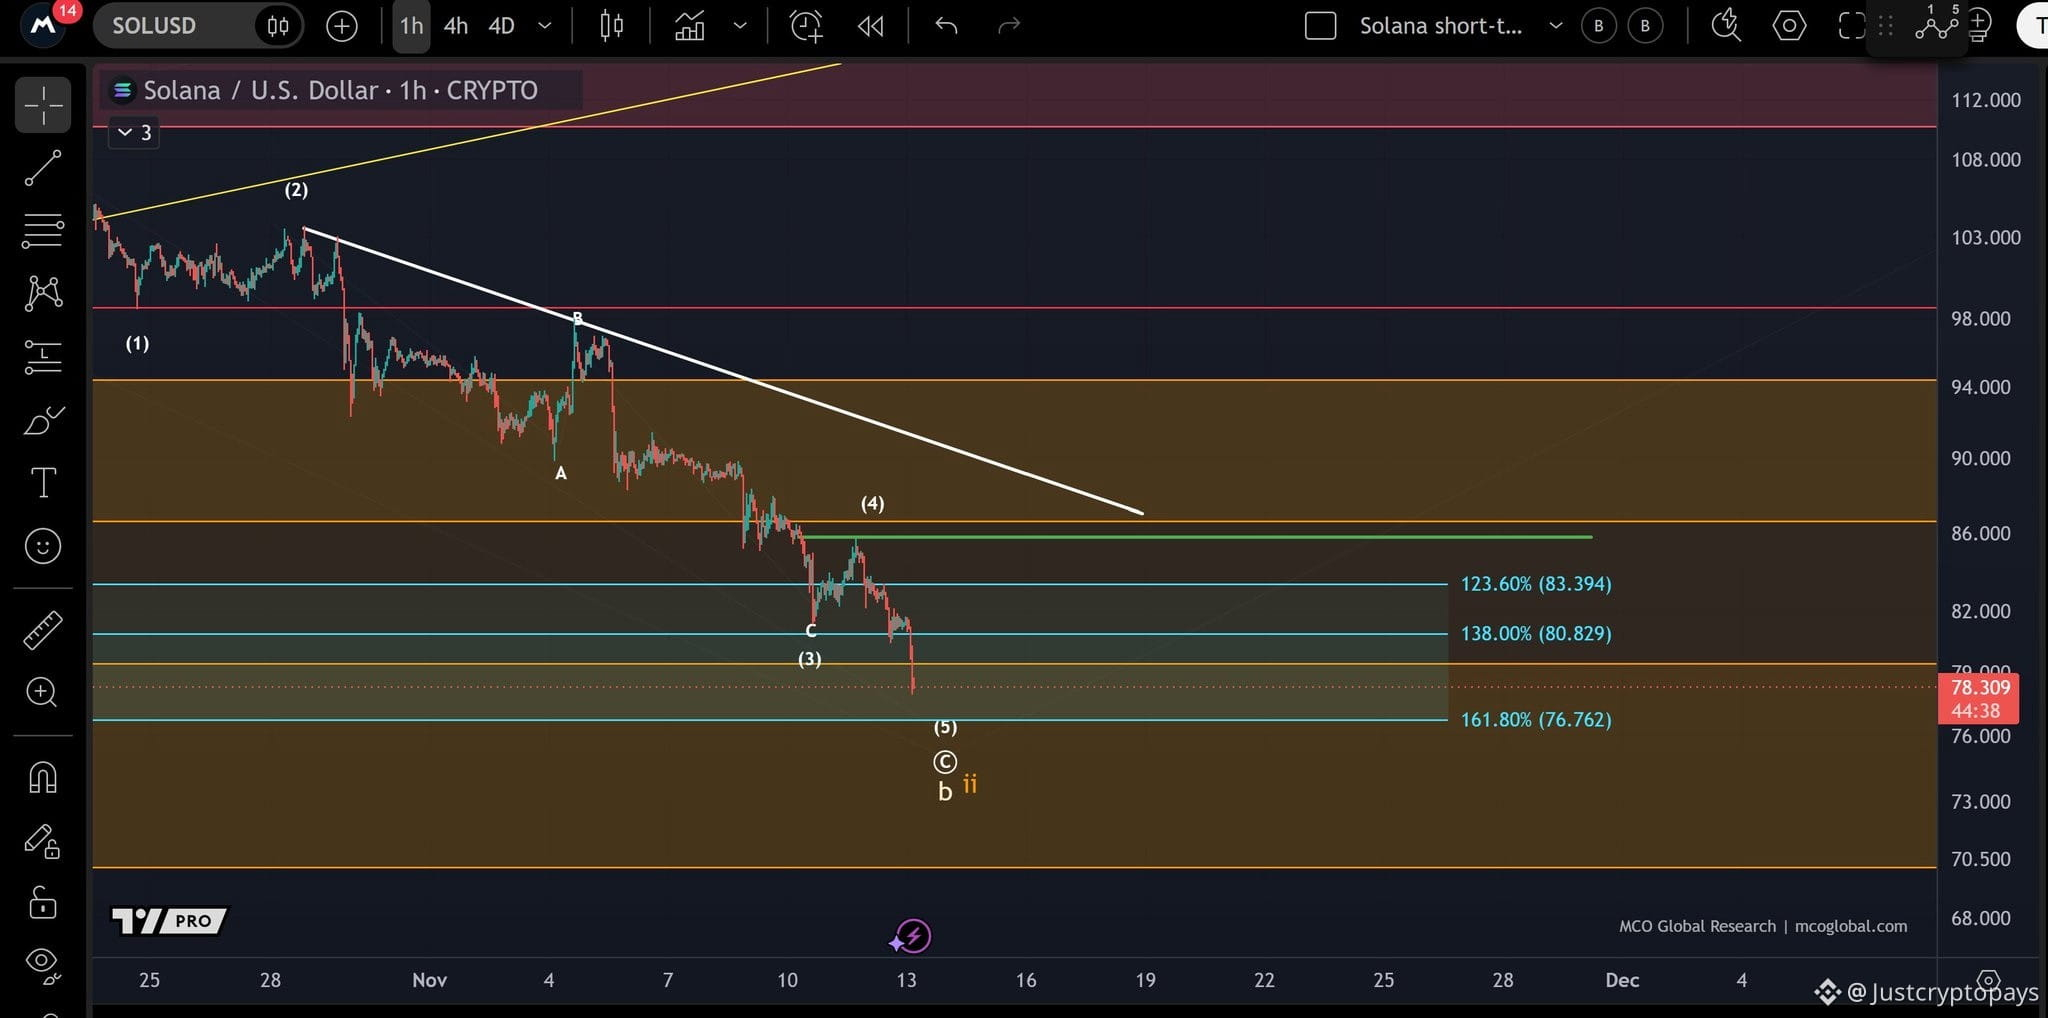
$SOL continues to move lower, following Bitcoin's direction, with no clear sign of a bottom yet.
The next support sits at $76.76, followed by $70 if the decline continues. On the upside, $85.80 is the next resistance to watch.
#WhatWillDriveCryptoandStocks’NextRebound?
$SOL continues to move lower, following Bitcoin's direction, with no clear sign of a bottom yet.
The next support sits at $76.76, followed by $70 if the decline continues. On the upside, $85.80 is the next resistance to watch.
#WhatWillDriveCryptoandStocks’NextRebound?
The next support sits at $76.76, followed by $70 if the decline continues. On the upside, $85.80 is the next resistance to watch.
#WhatWillDriveCryptoandStocks’NextRebound?
155
See translation
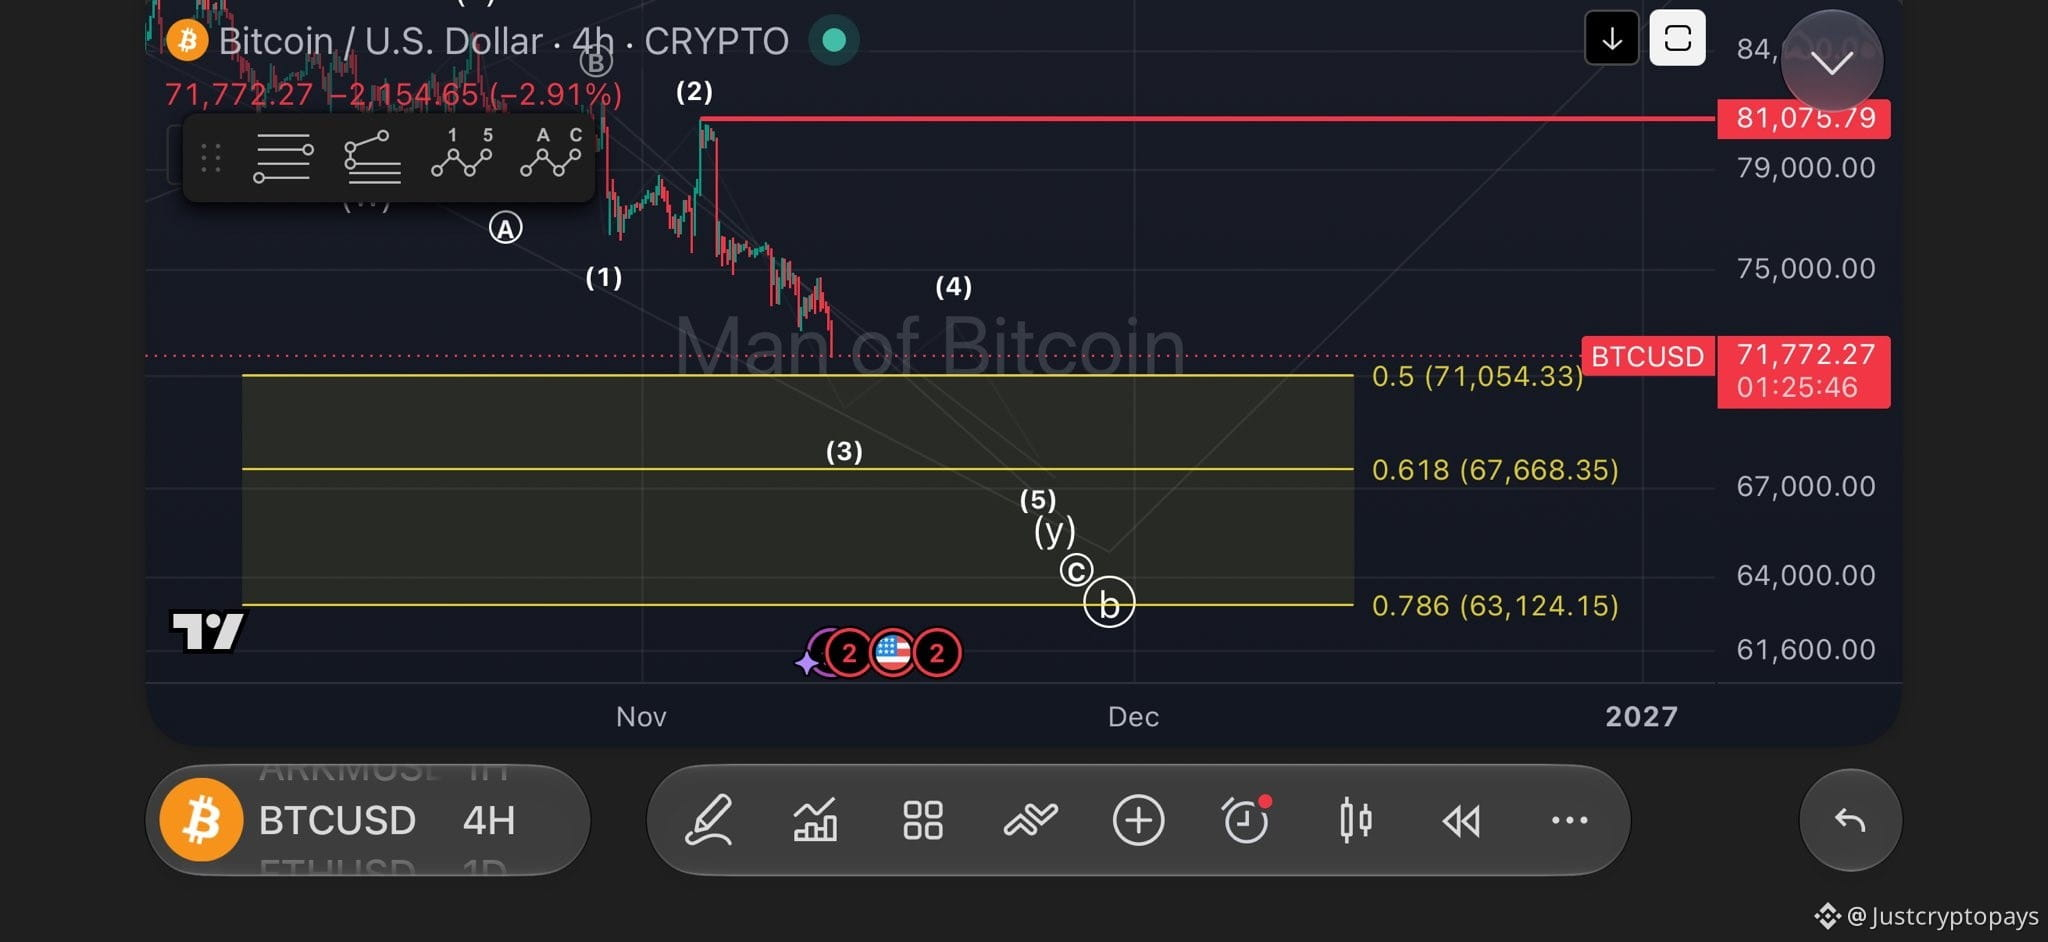
$BTC : Selling pressure remains strong, with $71,054 as the next downside target.
Ideally, price could extend its decline into the $67,668–$63,124 zone.
#HuangExitNvidiaStrategyInFocus
$BTC : Selling pressure remains strong, with $71,054 as the next downside target.
Ideally, price could extend its decline into the $67,668–$63,124 zone.
#HuangExitNvidiaStrategyInFocus
Ideally, price could extend its decline into the $67,668–$63,124 zone.
#HuangExitNvidiaStrategyInFocus
1
330
See translation
$BTC
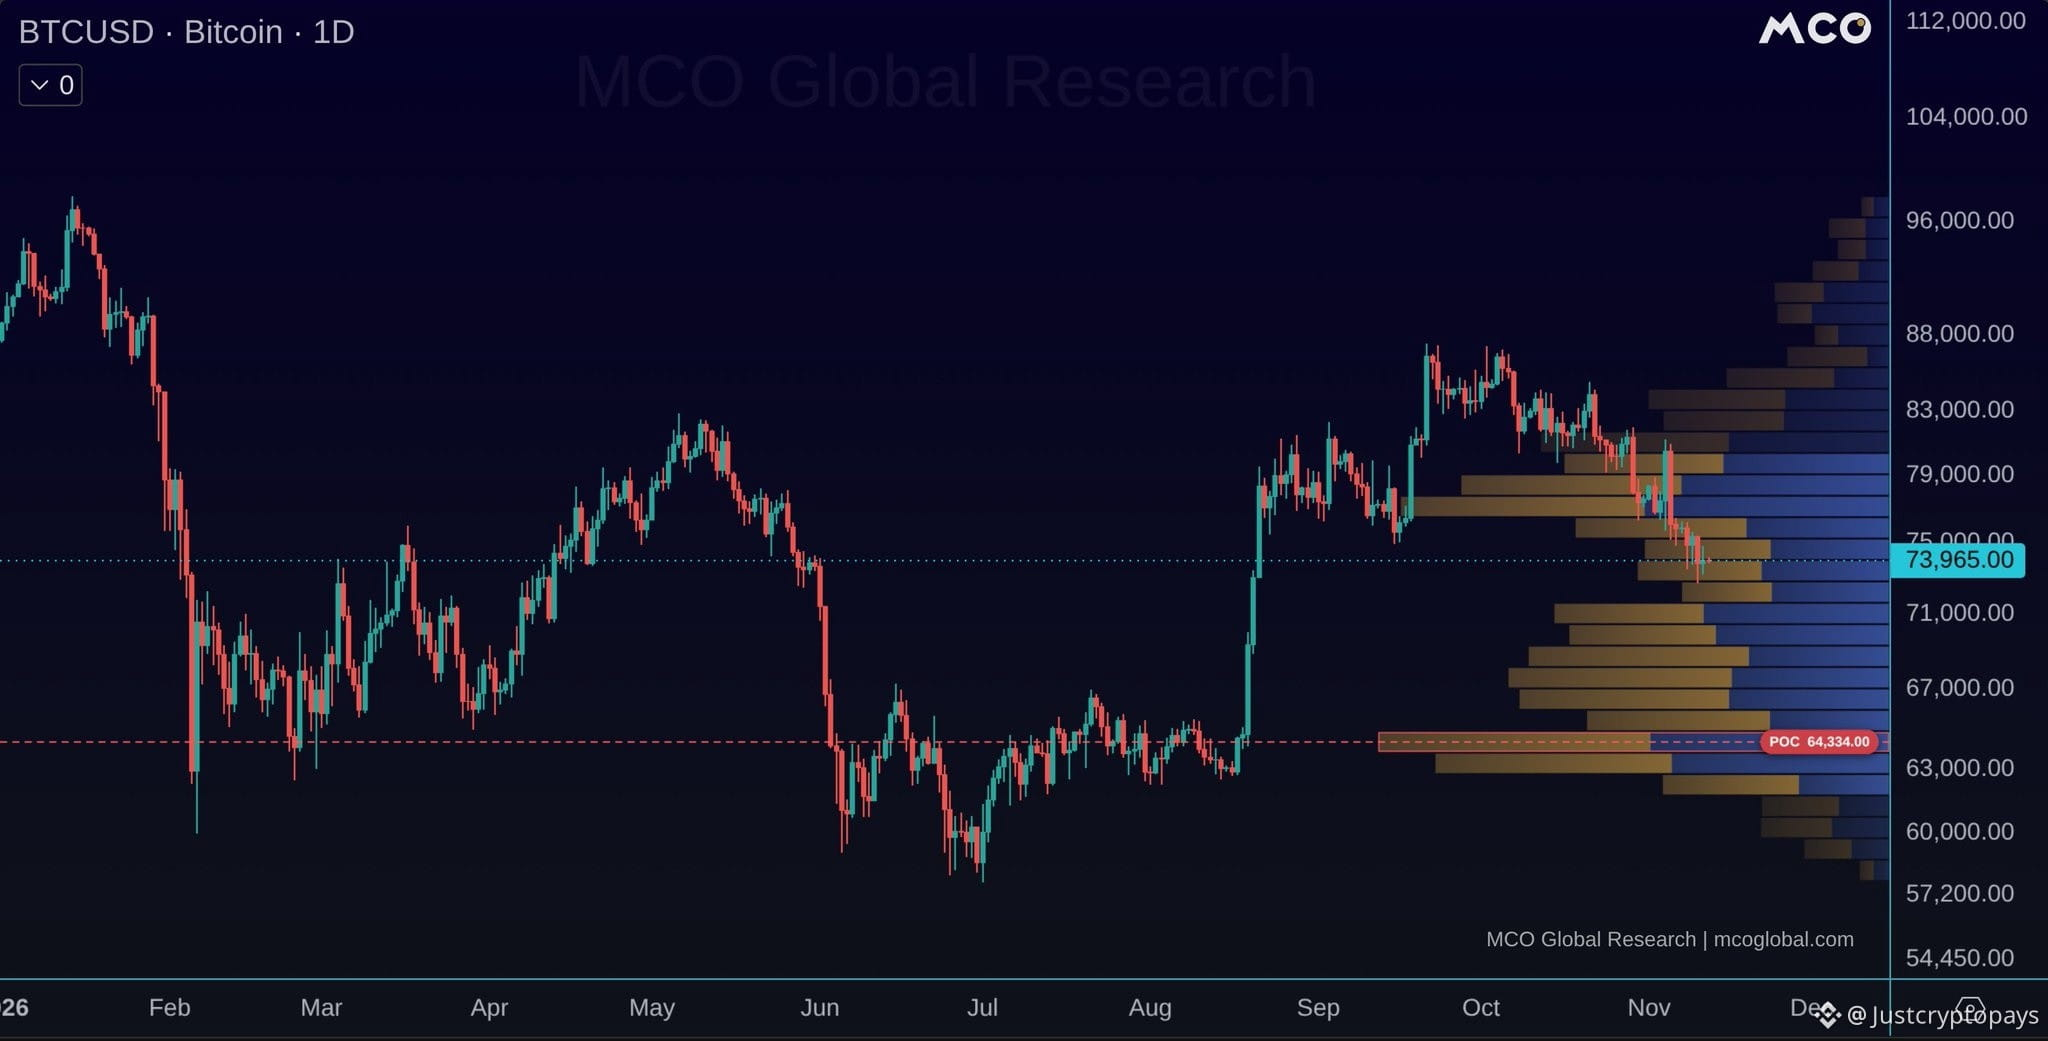
Around 46% of Bitcoin's trading volume this year has taken place between $63,300 and $74,800, and price is now trading within that range.
The highest-volume price level for 2026 sits around $64,300, making it an important area to watch.
Meanwhile, trading volume is relatively thin between $71,600 and $75,200, meaning there is limited historical trading activity to provide support in that region.
#AnthropicRejectsIPODelayValuationinQuestion
$BTC
Around 46% of Bitcoin's trading volume this year has taken place between $63,300 and $74,800, and price is now trading within that range.
The highest-volume price level for 2026 sits around $64,300, making it an important area to watch.
Meanwhile, trading volume is relatively thin between $71,600 and $75,200, meaning there is limited historical trading activity to provide support in that region.
#AnthropicRejectsIPODelayValuationinQuestion
Around 46% of Bitcoin's trading volume this year has taken place between $63,300 and $74,800, and price is now trading within that range.
The highest-volume price level for 2026 sits around $64,300, making it an important area to watch.
Meanwhile, trading volume is relatively thin between $71,600 and $75,200, meaning there is limited historical trading activity to provide support in that region.
#AnthropicRejectsIPODelayValuationinQuestion
1
263
See translation
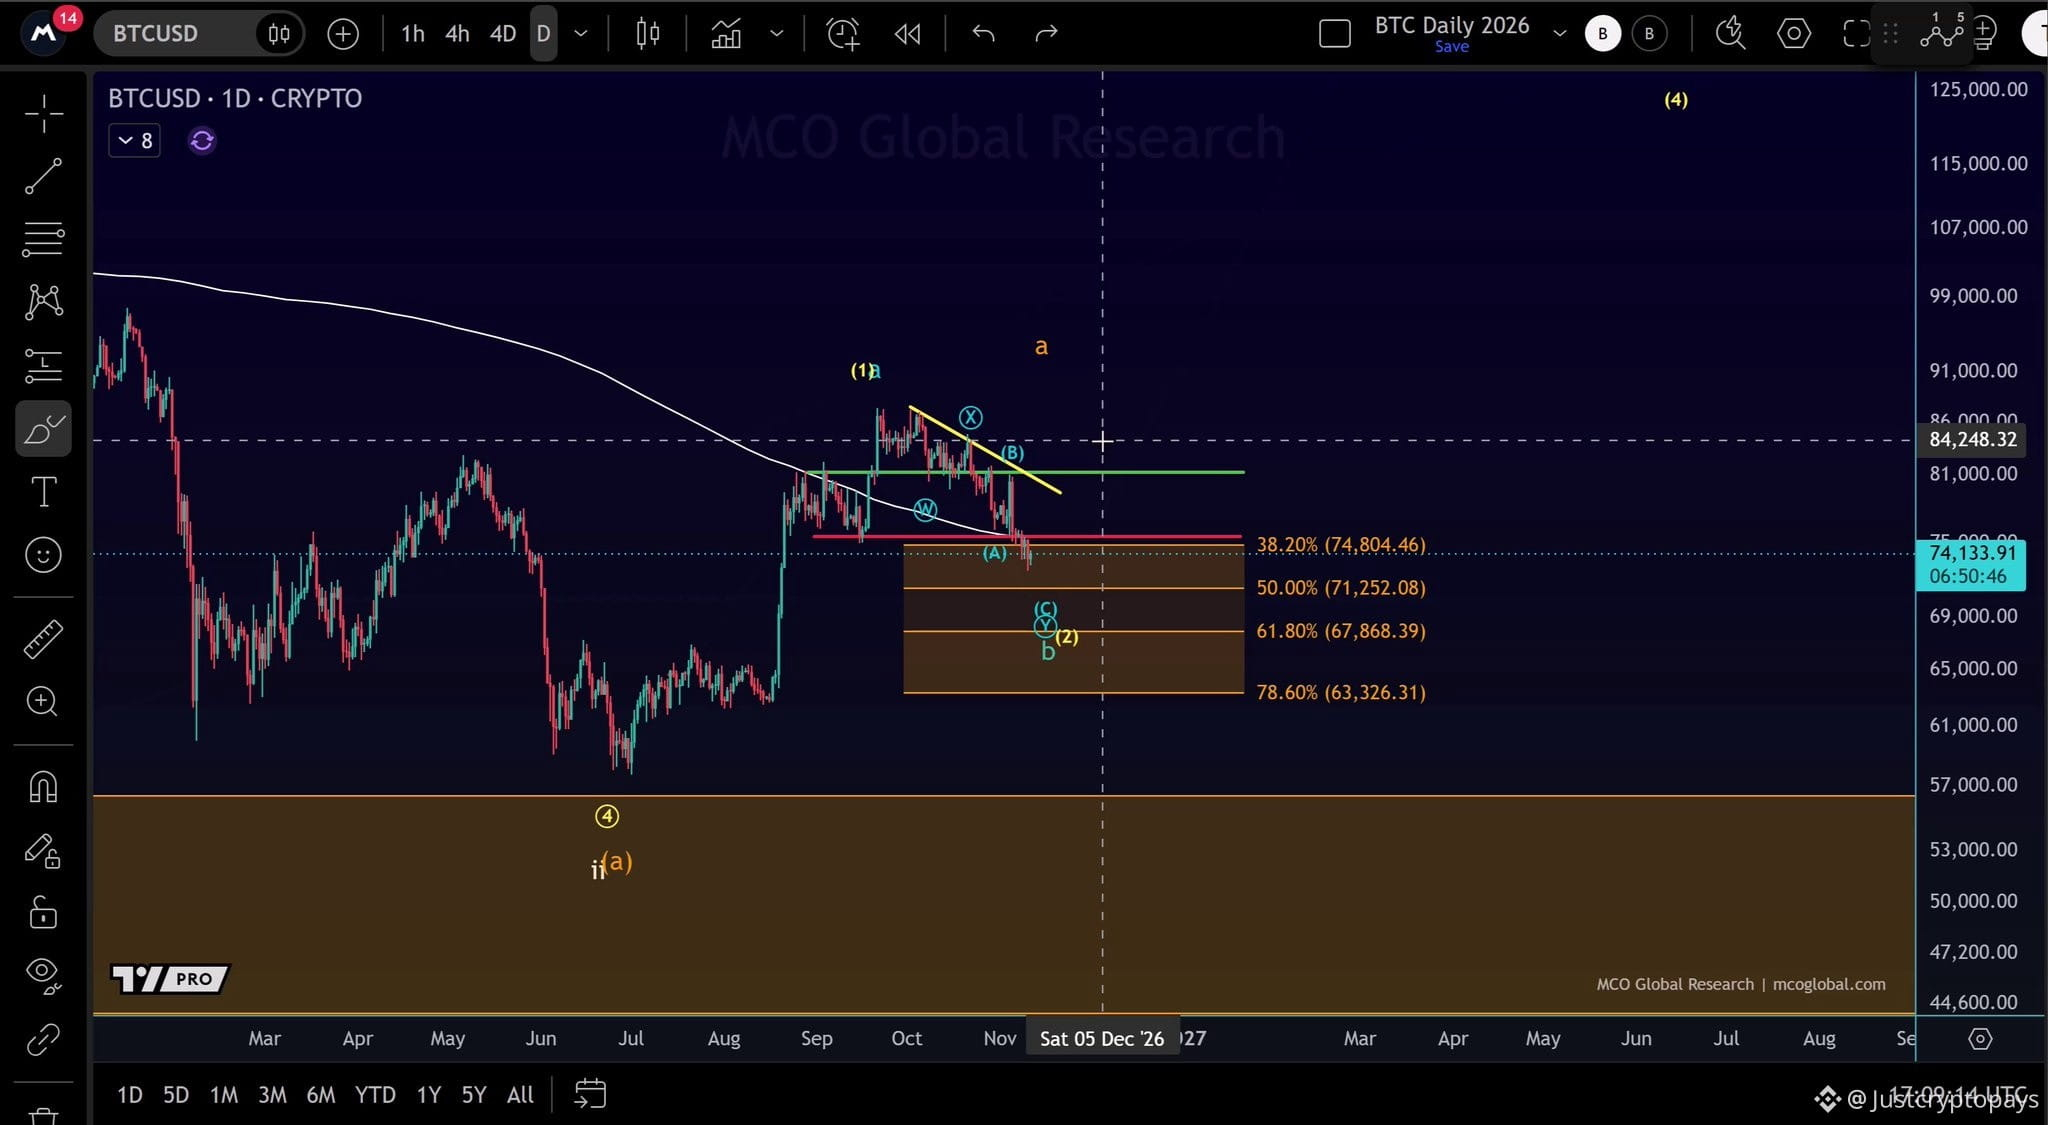
$BTC remains under selling pressure, trading below the 50-week SMA around $75,500 and beneath the red line, which previously acted as support.
On the daily chart, the rally from the July low appears to have developed in five waves, suggesting that the current decline is a corrective phase within a broader recovery.
As long as the $63,326–$74,804 support zone holds and price forms an initial bullish impulse, a move toward $100,000 remains a possibility.
#AnthropicRejectsIPODelayValuationinQuestion
$BTC remains under selling pressure, trading below the 50-week SMA around $75,500 and beneath the red line, which previously acted as support.
On the daily chart, the rally from the July low appears to have developed in five waves, suggesting that the current decline is a corrective phase within a broader recovery.
As long as the $63,326–$74,804 support zone holds and price forms an initial bullish impulse, a move toward $100,000 remains a possibility.
#AnthropicRejectsIPODelayValuationinQuestion
On the daily chart, the rally from the July low appears to have developed in five waves, suggesting that the current decline is a corrective phase within a broader recovery.
As long as the $63,326–$74,804 support zone holds and price forms an initial bullish impulse, a move toward $100,000 remains a possibility.
#AnthropicRejectsIPODelayValuationinQuestion
180
See translation
🇺🇸 Spot $BTC , $ETH , and XRP ETFs all recorded net outflows on November 10.
BTC: $95.00M outflow
ETH: $1.32M outflow
XRP: $7.62M outflow
Institutional flows were negative across all three assets.
#HotCPIDecemberHikePriced
🇺🇸 Spot $BTC , $ETH , and XRP ETFs all recorded net outflows on November 10.
BTC: $95.00M outflow
ETH: $1.32M outflow
XRP: $7.62M outflow
Institutional flows were negative across all three assets.
#HotCPIDecemberHikePriced
BTC: $95.00M outflow
ETH: $1.32M outflow
XRP: $7.62M outflow
Institutional flows were negative across all three assets.
#HotCPIDecemberHikePriced

198
See translation
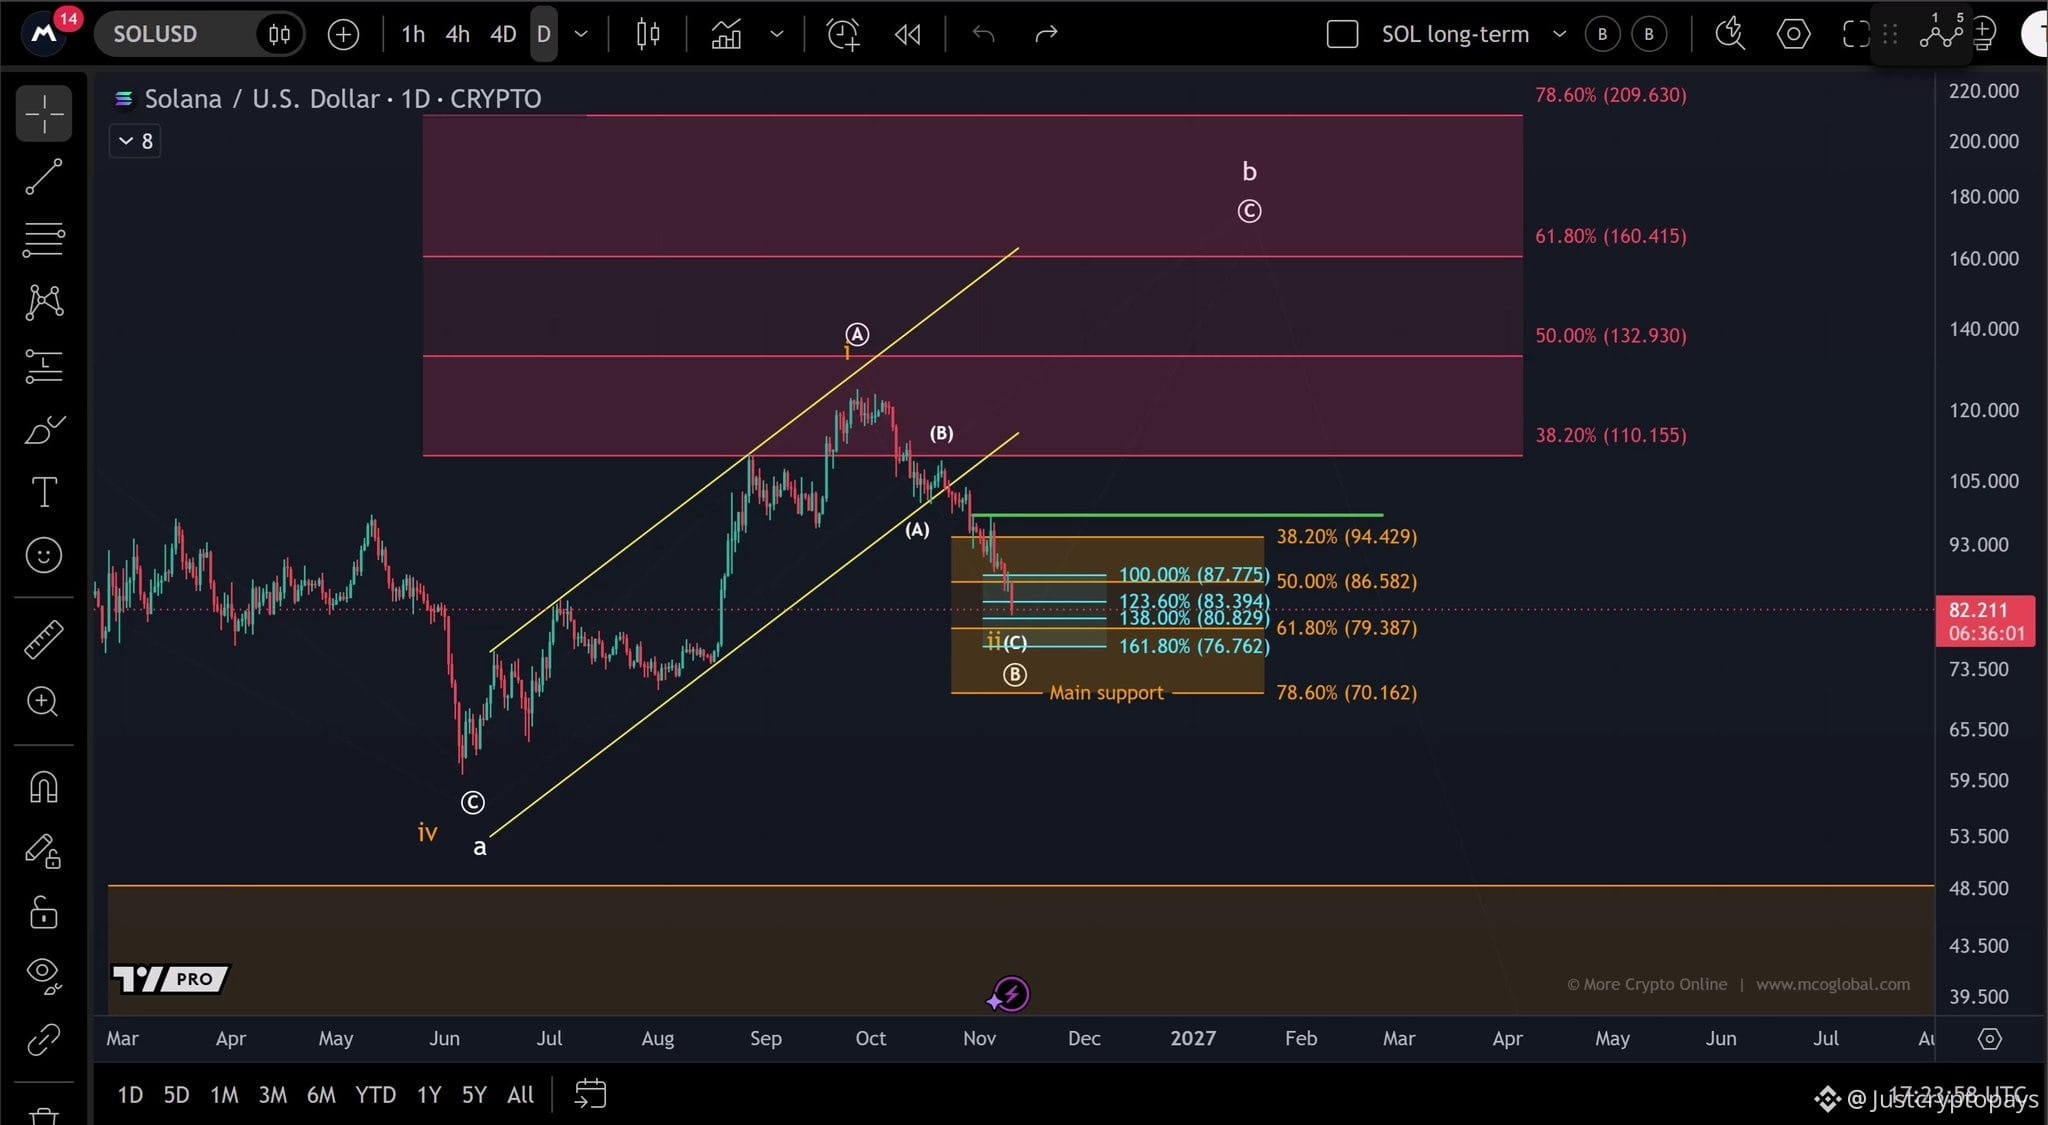
$SOL is nearing the 61.8% Fibonacci retracement at $79.38, which sits within the broader target zone of $76.76–$87.77.
Solana continues to follow Bitcoin’s price action, and further downside remains possible as BTC is also expected to move lower. The short-term outlook has remained bearish over the past few weeks. However, the bigger picture still leaves room for a stronger recovery in circle wave C of wave b once circle wave B is complete.
#HotCPIDecemberHikePriced
$SOL is nearing the 61.8% Fibonacci retracement at $79.38, which sits within the broader target zone of $76.76–$87.77.
Solana continues to follow Bitcoin’s price action, and further downside remains possible as BTC is also expected to move lower. The short-term outlook has remained bearish over the past few weeks. However, the bigger picture still leaves room for a stronger recovery in circle wave C of wave b once circle wave B is complete.
#HotCPIDecemberHikePriced
Solana continues to follow Bitcoin’s price action, and further downside remains possible as BTC is also expected to move lower. The short-term outlook has remained bearish over the past few weeks. However, the bigger picture still leaves room for a stronger recovery in circle wave C of wave b once circle wave B is complete.
#HotCPIDecemberHikePriced
2
358
See translation
⚡️ Fundstrat’s Tom Lee believes $ETH weak price action is more about market impatience than deteriorating fundamentals. He remains optimistic about the crypto market, predicting a bullish outlook over the next 24–36 months.
#NvidiaInvestigatesAfterHuang’sAffairApology
⚡️ Fundstrat’s Tom Lee believes $ETH weak price action is more about market impatience than deteriorating fundamentals. He remains optimistic about the crypto market, predicting a bullish outlook over the next 24–36 months.
#NvidiaInvestigatesAfterHuang’sAffairApology
#NvidiaInvestigatesAfterHuang’sAffairApology


1
3
214
Log in to explore more content
Join global crypto users on Binance Square
⚡️ Get latest and useful information about crypto.
💬 Trusted by the world’s largest crypto exchange.
👍 Discover real insights from verified creators.
Email / Phone number
Trending Topics
NvidiaEarningsTonight:AIStocks’NextMove?
97,189 views
1,154 Discussing
Nvidia Earnings Day: Interim CEO's First Appearance — Can the AI Story Hold?
Binance News
·17 Likes
·8k views
A Packed Week of Earnings and Data Tests Markets
135,762 views
635 Discussing
AnthropicIPOTestsInvestorAppetiteForAI
301,013 views
2,791 Discussing