

OroCryptoTrends
9.1k Posts

OroCryptoTrends
 Square Verified+
Report
Block User
OroCryptoTrends | Crypto Insights: Real-time crypto news, market analysis, Web3, DeFi & emerging trends. Research-driven, actionable insights. No hype.
Open Trade
Frequent Trader
3.3 Years
3.4K+ Following
52.1K+ Followers
49.5K+ Liked
Posts
Portfolio
All
Quotes
Videos
Live
PINNED
See translation
❤️🙏 My Dear Followers, I’m Counting on Your Kind Support!
👇
👉[🗳️ Vote here](https://app.binance.com/uni-qr/cact26user/428?uc=app_square_share_link&us=copylink)
You’ve been part of my journey, and today I’m asking for a small favor. 🥹💛
If my crypto insights and analysis have ever helped you, please take a few seconds to vote for me!
Or visit my Binance Square profile @Orocryptonc and cast your vote.
🏆 We’re currently ranked 68th — can we reach the Top 20 together? 🚀
If you’ve voted, please share a screenshot below so we can celebrate together! ❤️
Every vote matters, and every bit of support means more to me than words can express.
Thank you for being part of my journey! 🫶💛
#BinanceSquare #TheBlockchain100 #OroCryptoTrends
❤️🙏 My Dear Followers, I’m Counting on Your Kind Support!
👇
👉🗳️ Vote here
You’ve been part of my journey, and today I’m asking for a small favor. 🥹💛
If my crypto insights and analysis have ever helped you, please take a few seconds to vote for me!
Or visit my Binance Square profile @OroCryptoTrends and cast your vote.
🏆 We’re currently ranked 68th — can we reach the Top 20 together? 🚀
If you’ve voted, please share a screenshot below so we can celebrate together! ❤️
Every vote matters, and every bit of support means more to me than words can express.
Thank you for being part of my journey! 🫶💛
#BinanceSquare #TheBlockchain100 #OroCryptoTrends
👇
👉🗳️ Vote here
You’ve been part of my journey, and today I’m asking for a small favor. 🥹💛
If my crypto insights and analysis have ever helped you, please take a few seconds to vote for me!
Or visit my Binance Square profile @OroCryptoTrends and cast your vote.
🏆 We’re currently ranked 68th — can we reach the Top 20 together? 🚀
If you’ve voted, please share a screenshot below so we can celebrate together! ❤️
Every vote matters, and every bit of support means more to me than words can express.
Thank you for being part of my journey! 🫶💛
#BinanceSquare #TheBlockchain100 #OroCryptoTrends


10
1
7
434
See translation
Only Two Days Is left To End Binance Blockchain 100 Vote
please if you like my work
[VOTE HERE](https://app.binance.com/uni-qr/cact26user/428?uc=app_square_share_link&us=copylink)
#BinanceBlockchainWeek #OroCryptoTrends
Only Two Days Is left To End Binance Blockchain 100 Vote
please if you like my work
VOTE HERE
#BinanceBlockchainWeek #OroCryptoTrends
please if you like my work
VOTE HERE
#BinanceBlockchainWeek #OroCryptoTrends

194
🎙️ VOTE ME FOR BINANCE BLOCKCHAIN 100 AWARDS 2026

End
55 m 35 s
716
NIL/USDT
Market/Sell
Filled
1
0
See translation
$BTC Bitcoin Near $80K: The Fed Might Not Be the Biggest Risk
Bitcoin’s next move may depend less on what the Fed says and more on what investors are doing before it speaks.
This week brings a crowded macro calendar: the Fed’s rate decision, US Q3 GDP, core PCE inflation, and Big Tech earnings. Any surprise could change expectations for liquidity and risk appetite across crypto.
But one detail stands out to me: the reported divergence between retail and whale behavior.
Retail Bitcoin deposits on Binance have reportedly reached a six-month high, while whale activity has pulled back. If that data is accurate, I would pay attention. Rising exchange deposits can indicate that investors are preparing to sell, although deposits alone do not prove selling pressure. Likewise, reduced whale activity does not automatically mean large holders have turned bearish.
That distinction matters.
Bitcoin is struggling to hold the $80K area, and analysts have pointed to $72,500–$75,000 as a possible downside zone if macro conditions disappoint. I would treat that as a scenario, not a prediction.
Here’s my concern: traders may be focusing too heavily on the Fed headline while overlooking how positioning could amplify the reaction. Even a decision that initially looks supportive for risk assets could fail to lift BTC if inflation remains sticky or investors continue moving coins onto exchanges.
The real test is whether Bitcoin can hold support when the macro data arrives, not whether the first reaction looks bullish.
Am I reading this correctly, or is the market underestimating the impact of this week’s macro events?
$BTC Bitcoin Near $80K: The Fed Might Not Be the Biggest Risk
Bitcoin’s next move may depend less on what the Fed says and more on what investors are doing before it speaks.
This week brings a crowded macro calendar: the Fed’s rate decision, US Q3 GDP, core PCE inflation, and Big Tech earnings. Any surprise could change expectations for liquidity and risk appetite across crypto.
But one detail stands out to me: the reported divergence between retail and whale behavior.
Retail Bitcoin deposits on Binance have reportedly reached a six-month high, while whale activity has pulled back. If that data is accurate, I would pay attention. Rising exchange deposits can indicate that investors are preparing to sell, although deposits alone do not prove selling pressure. Likewise, reduced whale activity does not automatically mean large holders have turned bearish.
That distinction matters.
Bitcoin is struggling to hold the $80K area, and analysts have pointed to $72,500–$75,000 as a possible downside zone if macro conditions disappoint. I would treat that as a scenario, not a prediction.
Here’s my concern: traders may be focusing too heavily on the Fed headline while overlooking how positioning could amplify the reaction. Even a decision that initially looks supportive for risk assets could fail to lift BTC if inflation remains sticky or investors continue moving coins onto exchanges.
The real test is whether Bitcoin can hold support when the macro data arrives, not whether the first reaction looks bullish.
Am I reading this correctly, or is the market underestimating the impact of this week’s macro events?
Bitcoin’s next move may depend less on what the Fed says and more on what investors are doing before it speaks.
This week brings a crowded macro calendar: the Fed’s rate decision, US Q3 GDP, core PCE inflation, and Big Tech earnings. Any surprise could change expectations for liquidity and risk appetite across crypto.
But one detail stands out to me: the reported divergence between retail and whale behavior.
Retail Bitcoin deposits on Binance have reportedly reached a six-month high, while whale activity has pulled back. If that data is accurate, I would pay attention. Rising exchange deposits can indicate that investors are preparing to sell, although deposits alone do not prove selling pressure. Likewise, reduced whale activity does not automatically mean large holders have turned bearish.
That distinction matters.
Bitcoin is struggling to hold the $80K area, and analysts have pointed to $72,500–$75,000 as a possible downside zone if macro conditions disappoint. I would treat that as a scenario, not a prediction.
Here’s my concern: traders may be focusing too heavily on the Fed headline while overlooking how positioning could amplify the reaction. Even a decision that initially looks supportive for risk assets could fail to lift BTC if inflation remains sticky or investors continue moving coins onto exchanges.
The real test is whether Bitcoin can hold support when the macro data arrives, not whether the first reaction looks bullish.
Am I reading this correctly, or is the market underestimating the impact of this week’s macro events?
1
521


See translation
$BTC dipped below $80K. The rebound doesn't prove the danger has passed.
{future}(BTCUSDT)
Bitcoin briefly fell to around $79,000 on October 24, while crypto liquidations surged. More than $400M in leveraged long positions were wiped out in just four hours, according to reported CoinGlass data. BTC then recovered above $80K. "Source: The Block"
I keep reading this differently from the usual “buy the dip” narrative.
The interesting part isn't simply that Bitcoin bounced. It's how many traders were positioned for the price to rise, and how quickly those positions disappeared when the market moved against them.
That matters because liquidations can accelerate a decline beyond what spot selling alone might produce. Once leveraged longs are forced out, the market can rebound. But that doesn't automatically mean fresh buyers have arrived in enough size to sustain the recovery.
There's another complication: whale accumulation can look bullish on-chain while price struggles under technical resistance. Large-wallet activity matters, but it doesn't guarantee immediate buying pressure or tell us when those holders might sell.
My read: reclaiming $80K is a positive short-term signal, not confirmation that Bitcoin has found a durable bottom. I'd want to see sustained price strength and evidence of genuine spot demand before calling this a recovery.
The risk is that traders mistake a relief bounce after forced liquidations for a trend reversal.
Am I reading this wrong, or is the market treating a bounce as stronger evidence than it really is?
#BTC #Write2Earn
$BTC dipped below $80K. The rebound doesn't prove the danger has passed.
Bitcoin briefly fell to around $79,000 on October 24, while crypto liquidations surged. More than $400M in leveraged long positions were wiped out in just four hours, according to reported CoinGlass data. BTC then recovered above $80K. "Source: The Block"
I keep reading this differently from the usual “buy the dip” narrative.
The interesting part isn't simply that Bitcoin bounced. It's how many traders were positioned for the price to rise, and how quickly those positions disappeared when the market moved against them.
That matters because liquidations can accelerate a decline beyond what spot selling alone might produce. Once leveraged longs are forced out, the market can rebound. But that doesn't automatically mean fresh buyers have arrived in enough size to sustain the recovery.
There's another complication: whale accumulation can look bullish on-chain while price struggles under technical resistance. Large-wallet activity matters, but it doesn't guarantee immediate buying pressure or tell us when those holders might sell.
My read: reclaiming $80K is a positive short-term signal, not confirmation that Bitcoin has found a durable bottom. I'd want to see sustained price strength and evidence of genuine spot demand before calling this a recovery.
The risk is that traders mistake a relief bounce after forced liquidations for a trend reversal.
Am I reading this wrong, or is the market treating a bounce as stronger evidence than it really is?
#BTC #Write2Earn
Bitcoin briefly fell to around $79,000 on October 24, while crypto liquidations surged. More than $400M in leveraged long positions were wiped out in just four hours, according to reported CoinGlass data. BTC then recovered above $80K. "Source: The Block"
I keep reading this differently from the usual “buy the dip” narrative.
The interesting part isn't simply that Bitcoin bounced. It's how many traders were positioned for the price to rise, and how quickly those positions disappeared when the market moved against them.
That matters because liquidations can accelerate a decline beyond what spot selling alone might produce. Once leveraged longs are forced out, the market can rebound. But that doesn't automatically mean fresh buyers have arrived in enough size to sustain the recovery.
There's another complication: whale accumulation can look bullish on-chain while price struggles under technical resistance. Large-wallet activity matters, but it doesn't guarantee immediate buying pressure or tell us when those holders might sell.
My read: reclaiming $80K is a positive short-term signal, not confirmation that Bitcoin has found a durable bottom. I'd want to see sustained price strength and evidence of genuine spot demand before calling this a recovery.
The risk is that traders mistake a relief bounce after forced liquidations for a trend reversal.
Am I reading this wrong, or is the market treating a bounce as stronger evidence than it really is?
#BTC #Write2Earn
3
4
1.3k
See translation
$BNB is up 1.34%. So why does the money-flow data look weak?
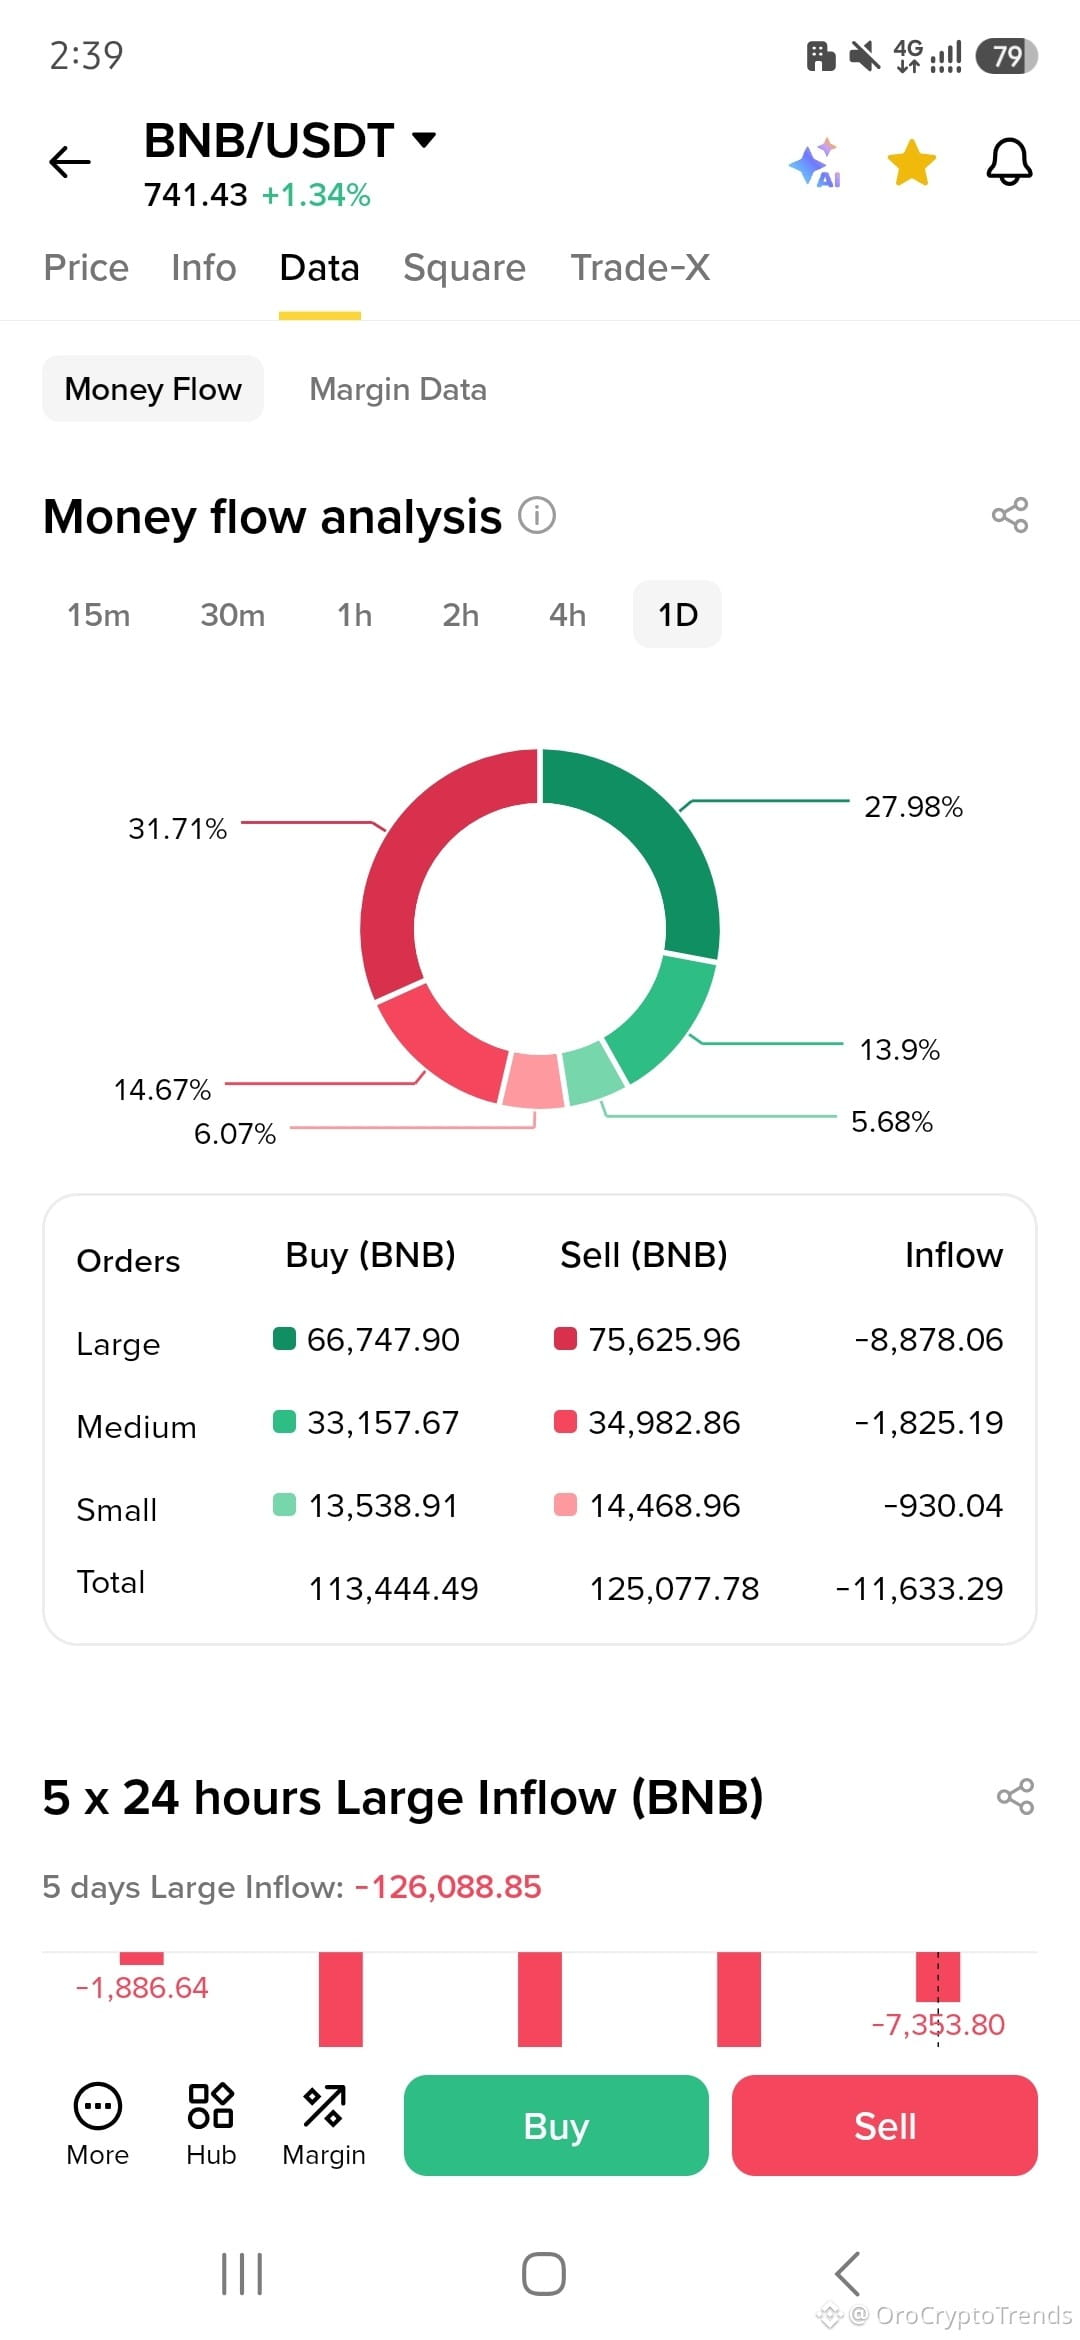
BNB/USDT is around $741.43 in the supplied screenshot, but the 1D order breakdown tells a different story.
Buyers purchased 113,444.49 BNB, while sellers accounted for 125,077.78 BNB. That's a net selling imbalance of 11,633.29 BNB.
Large orders led the pressure, with net selling of 8,878.06 BNB. The reported five-day large-order inflow is also negative at 126,088.85 BNB.
My read: Futu's expanded BNB access is a constructive longer-term development, but this snapshot doesn't yet confirm strong buying pressure. Price can rise even while the measured order flow remains negative.
The bull case is that buyers absorb the selling. The bear case is that persistent large-order outflows undermine the rebound.
Money-flow data is a snapshot, not a complete market picture. This isn't financial advice.
What would change your view first: large-order flows turning positive or BNB holding higher prices despite continued selling?
#bnb #BNBChain #Write2Earn
{future}(BNBUSDT)
$BNB is up 1.34%. So why does the money-flow data look weak?
BNB/USDT is around $741.43 in the supplied screenshot, but the 1D order breakdown tells a different story.
Buyers purchased 113,444.49 BNB, while sellers accounted for 125,077.78 BNB. That's a net selling imbalance of 11,633.29 BNB.
Large orders led the pressure, with net selling of 8,878.06 BNB. The reported five-day large-order inflow is also negative at 126,088.85 BNB.
My read: Futu's expanded BNB access is a constructive longer-term development, but this snapshot doesn't yet confirm strong buying pressure. Price can rise even while the measured order flow remains negative.
The bull case is that buyers absorb the selling. The bear case is that persistent large-order outflows undermine the rebound.
Money-flow data is a snapshot, not a complete market picture. This isn't financial advice.
What would change your view first: large-order flows turning positive or BNB holding higher prices despite continued selling?
#bnb #BNBChain #Write2Earn
BNB/USDT is around $741.43 in the supplied screenshot, but the 1D order breakdown tells a different story.
Buyers purchased 113,444.49 BNB, while sellers accounted for 125,077.78 BNB. That's a net selling imbalance of 11,633.29 BNB.
Large orders led the pressure, with net selling of 8,878.06 BNB. The reported five-day large-order inflow is also negative at 126,088.85 BNB.
My read: Futu's expanded BNB access is a constructive longer-term development, but this snapshot doesn't yet confirm strong buying pressure. Price can rise even while the measured order flow remains negative.
The bull case is that buyers absorb the selling. The bear case is that persistent large-order outflows undermine the rebound.
Money-flow data is a snapshot, not a complete market picture. This isn't financial advice.
What would change your view first: large-order flows turning positive or BNB holding higher prices despite continued selling?
#bnb #BNBChain #Write2Earn
395
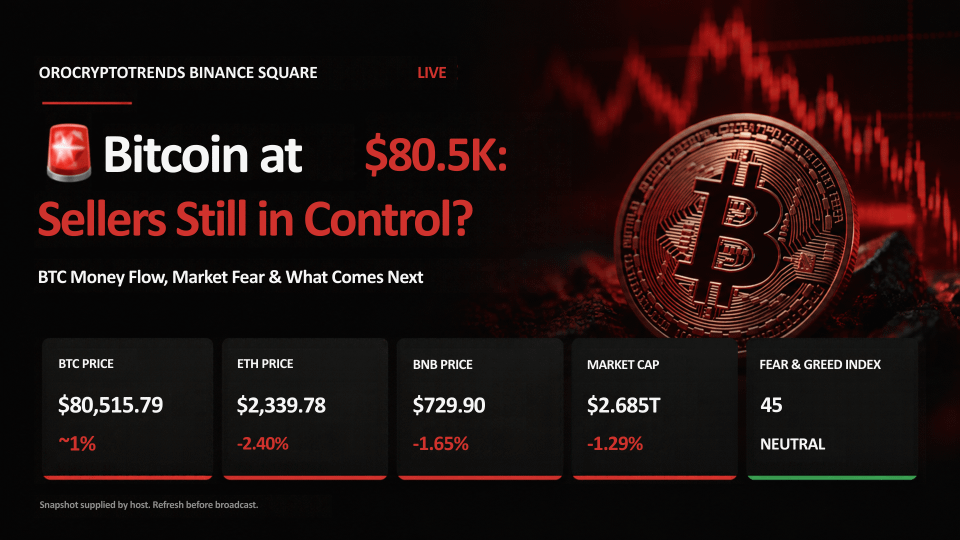
🎙️ 🚨 BTC at $80.5K: BTC M Flow, Market F & What Comes Next
End
01 h 10 m 19 s
270

BNB
Holding
+0.2
4
0
See translation
Crypto is falling, and leveraged longs are feeling the pressure. But is this a broader risk-off move or a leverage flush?
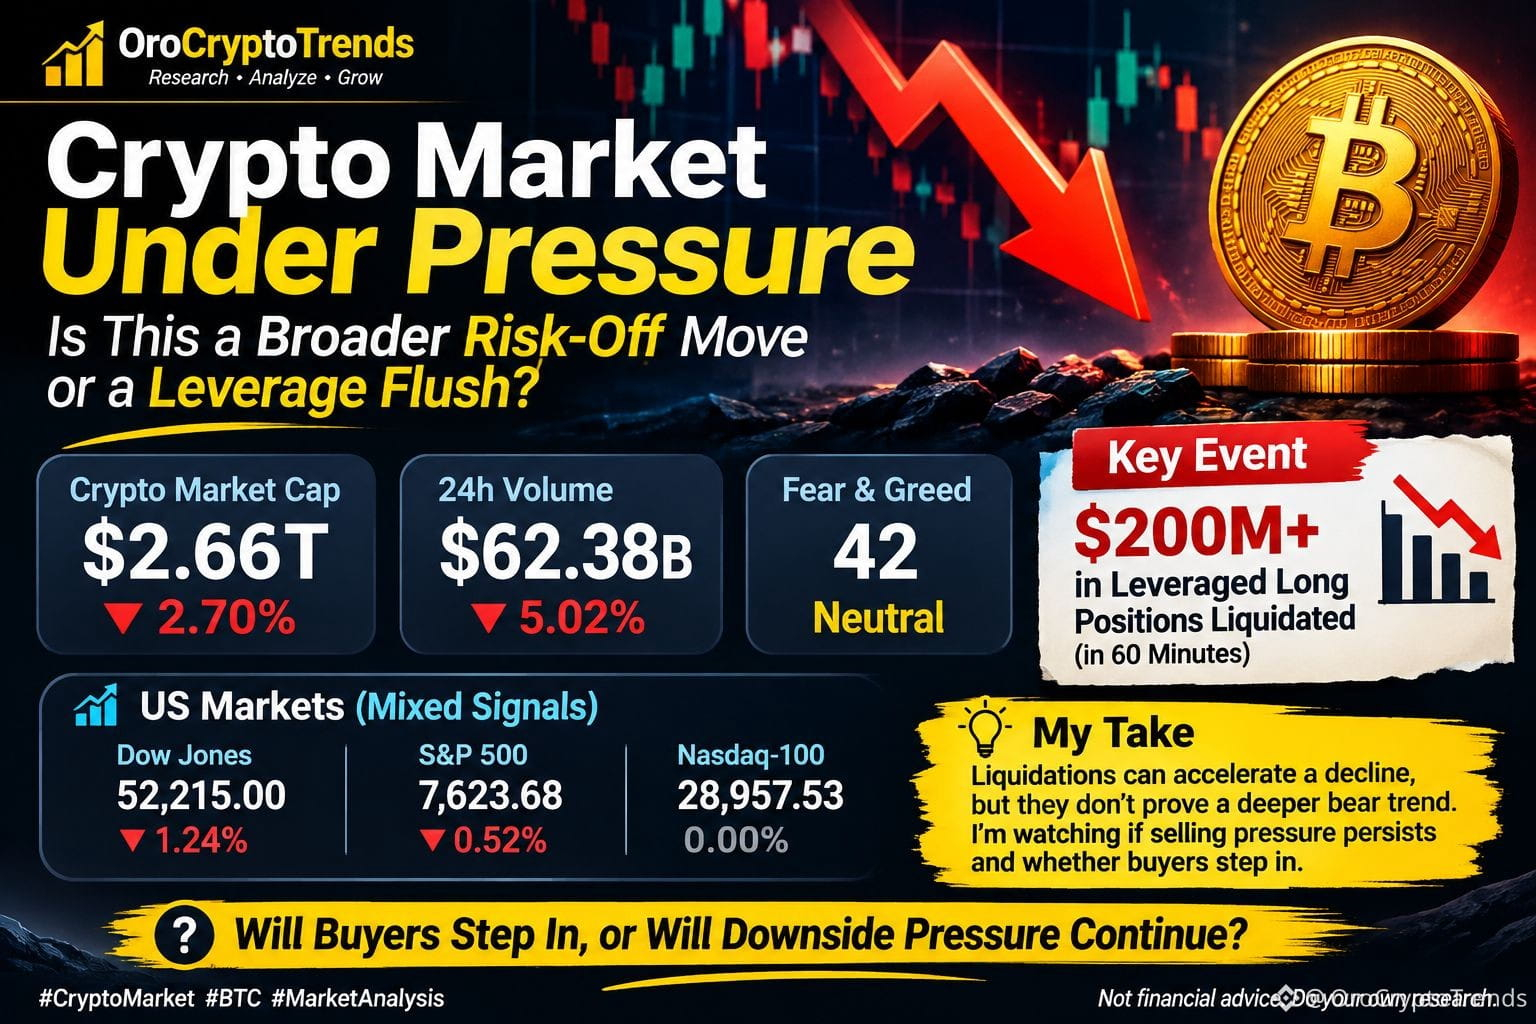
Crypto’s total market cap fell to $2.66T, down 2.70%, while 24-hour trading volume dropped 5.02% to $62.38B. The Fear & Greed Index stood at 42, labeled Neutral in the screenshot.
The reported sell-off was sharp. WatcherGuru reported that BTC fell below $80,000, ETH below $2,350, and XRP below $1.30, with more than $200 million in leveraged long positions liquidated over 60 minutes.
US equities were mixed: the Dow Jones fell 1.24%, the S&P 500 declined 0.52%, and the Nasdaq-100 was nearly unchanged.
My take: I’m watching whether this pressure spreads beyond leveraged traders. Liquidations can accelerate a decline as forced selling pushes prices lower, but they do not prove that a deeper bear trend has begun. The next signal is whether selling pressure persists after the initial liquidation wave. I’d also watch spot demand and ETF flows for evidence of renewed buying or continued weakness. The screenshots do not provide enough information to confirm those signals, so I would avoid calling a bottom or assuming the sell-off is over.
For now, the key question is whether buyers step in or downside pressure continues.
Not financial advice. Do your own research.
Crypto is falling, and leveraged longs are feeling the pressure. But is this a broader risk-off move or a leverage flush?
Crypto’s total market cap fell to $2.66T, down 2.70%, while 24-hour trading volume dropped 5.02% to $62.38B. The Fear & Greed Index stood at 42, labeled Neutral in the screenshot.
The reported sell-off was sharp. WatcherGuru reported that BTC fell below $80,000, ETH below $2,350, and XRP below $1.30, with more than $200 million in leveraged long positions liquidated over 60 minutes.
US equities were mixed: the Dow Jones fell 1.24%, the S&P 500 declined 0.52%, and the Nasdaq-100 was nearly unchanged.
My take: I’m watching whether this pressure spreads beyond leveraged traders. Liquidations can accelerate a decline as forced selling pushes prices lower, but they do not prove that a deeper bear trend has begun. The next signal is whether selling pressure persists after the initial liquidation wave. I’d also watch spot demand and ETF flows for evidence of renewed buying or continued weakness. The screenshots do not provide enough information to confirm those signals, so I would avoid calling a bottom or assuming the sell-off is over.
For now, the key question is whether buyers step in or downside pressure continues.
Not financial advice. Do your own research.
Crypto’s total market cap fell to $2.66T, down 2.70%, while 24-hour trading volume dropped 5.02% to $62.38B. The Fear & Greed Index stood at 42, labeled Neutral in the screenshot.
The reported sell-off was sharp. WatcherGuru reported that BTC fell below $80,000, ETH below $2,350, and XRP below $1.30, with more than $200 million in leveraged long positions liquidated over 60 minutes.
US equities were mixed: the Dow Jones fell 1.24%, the S&P 500 declined 0.52%, and the Nasdaq-100 was nearly unchanged.
My take: I’m watching whether this pressure spreads beyond leveraged traders. Liquidations can accelerate a decline as forced selling pushes prices lower, but they do not prove that a deeper bear trend has begun. The next signal is whether selling pressure persists after the initial liquidation wave. I’d also watch spot demand and ETF flows for evidence of renewed buying or continued weakness. The screenshots do not provide enough information to confirm those signals, so I would avoid calling a bottom or assuming the sell-off is over.
For now, the key question is whether buyers step in or downside pressure continues.
Not financial advice. Do your own research.
1
1
408
🎙️ Bitcoin $80K: Will Buyers Support or Drop Coming? ETF Flows & Fed Week

End
01 h 17 m 28 s
346
BNB
Holding
+0.19
0
0

Partly True
See translation
$META.US
$META is down 1.28% despite positive earnings headlines. Investors may want more than an EPS beat.
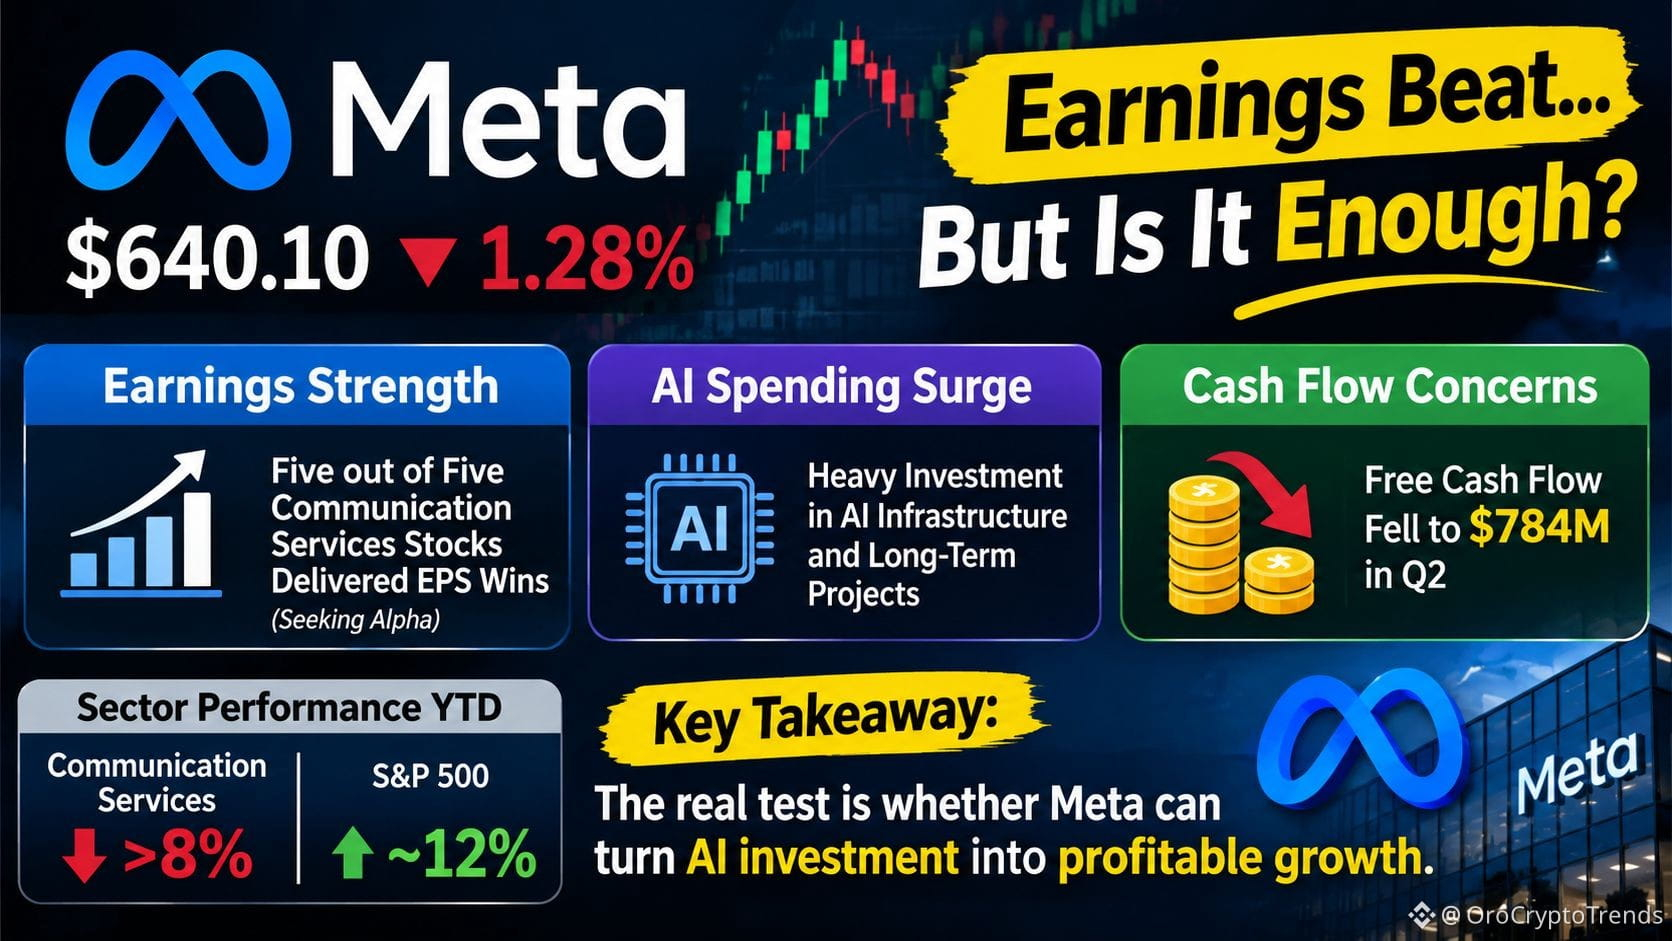
Meta Platforms is part of a broader communication services earnings scorecard. Seeking Alpha reported that all five communication services stocks covered in its weekly review delivered EPS wins, with Meta and Netflix among the major reports investors were digesting.
The supplied market data shows $META at $640.10, down 1.28%.
My take: This is the distinction I keep coming back to: beating earnings expectations and creating shareholder value are not the same thing.
Meta's AI investment thesis depends on turning infrastructure spending into measurable improvements in advertising performance, operating profitability and eventually cash flow. Strong earnings alone may not settle that question if expenses and capital expenditure continue to weigh on financial flexibility.
I'm watching advertising growth, expense control, AI spending guidance and Reality Labs losses. Evidence that AI is improving ad targeting and monetization could strengthen the bull case. Rising costs without visible returns would weaken it.
The wider sector context also matters. Seeking Alpha reported that communication services had lost more than 8% year to date while the S&P 500 was up nearly 12%. That divergence raises a question about whether positive earnings can translate into renewed sector leadership.
The key test is whether Meta can demonstrate returns on its AI spending, not simply announce more investment.
{future}(METAUSDT)
Not financial advice. Do your own research.
$META.US
$META is down 1.28% despite positive earnings headlines. Investors may want more than an EPS beat.
Meta Platforms is part of a broader communication services earnings scorecard. Seeking Alpha reported that all five communication services stocks covered in its weekly review delivered EPS wins, with Meta and Netflix among the major reports investors were digesting.
The supplied market data shows $META at $640.10, down 1.28%.
My take: This is the distinction I keep coming back to: beating earnings expectations and creating shareholder value are not the same thing.
Meta's AI investment thesis depends on turning infrastructure spending into measurable improvements in advertising performance, operating profitability and eventually cash flow. Strong earnings alone may not settle that question if expenses and capital expenditure continue to weigh on financial flexibility.
I'm watching advertising growth, expense control, AI spending guidance and Reality Labs losses. Evidence that AI is improving ad targeting and monetization could strengthen the bull case. Rising costs without visible returns would weaken it.
The wider sector context also matters. Seeking Alpha reported that communication services had lost more than 8% year to date while the S&P 500 was up nearly 12%. That divergence raises a question about whether positive earnings can translate into renewed sector leadership.
The key test is whether Meta can demonstrate returns on its AI spending, not simply announce more investment.
Not financial advice. Do your own research.
$META is down 1.28% despite positive earnings headlines. Investors may want more than an EPS beat.
Meta Platforms is part of a broader communication services earnings scorecard. Seeking Alpha reported that all five communication services stocks covered in its weekly review delivered EPS wins, with Meta and Netflix among the major reports investors were digesting.
The supplied market data shows $META at $640.10, down 1.28%.
My take: This is the distinction I keep coming back to: beating earnings expectations and creating shareholder value are not the same thing.
Meta's AI investment thesis depends on turning infrastructure spending into measurable improvements in advertising performance, operating profitability and eventually cash flow. Strong earnings alone may not settle that question if expenses and capital expenditure continue to weigh on financial flexibility.
I'm watching advertising growth, expense control, AI spending guidance and Reality Labs losses. Evidence that AI is improving ad targeting and monetization could strengthen the bull case. Rising costs without visible returns would weaken it.
The wider sector context also matters. Seeking Alpha reported that communication services had lost more than 8% year to date while the S&P 500 was up nearly 12%. That divergence raises a question about whether positive earnings can translate into renewed sector leadership.
The key test is whether Meta can demonstrate returns on its AI spending, not simply announce more investment.
Not financial advice. Do your own research.
METAUS+0.49%
1
853
See translation
#UKAlgorithmicCryptoTradingAppsMayNeedFCAAuthorization
The UK’s crypto bot rules may change more than the bots themselves. The real issue is what the app actually does.
The FCA’s new crypto regime is scheduled to take effect on 25 October 2027. Applications are open from 30 September 2026 to 28 February 2027. Firms carrying out regulated crypto activities will need the appropriate authorization. Official FCA guidance.
My read: market analytics and automated trade execution should not be treated as the same service. The legal scope matters more than the “trading bot” label.
Bull case: stronger oversight could improve accountability and consumer protection.
Bear case: compliance costs could disadvantage smaller developers and concentrate the market.
My view would change if the FCA’s perimeter guidance or subsequent enforcement showed a materially different impact on independent providers.
This is a forthcoming framework, not a blanket rule that every bot automatically needs authorization. Crypto remains risky; DYOR.
Will the UK’s new regime make automated crypto trading safer, or give larger platforms a competitive advantage?
#Write2Earn
#UKAlgorithmicCryptoTradingAppsMayNeedFCAAuthorization
The UK’s crypto bot rules may change more than the bots themselves. The real issue is what the app actually does.
The FCA’s new crypto regime is scheduled to take effect on 25 October 2027. Applications are open from 30 September 2026 to 28 February 2027. Firms carrying out regulated crypto activities will need the appropriate authorization. Official FCA guidance.
My read: market analytics and automated trade execution should not be treated as the same service. The legal scope matters more than the “trading bot” label.
Bull case: stronger oversight could improve accountability and consumer protection.
Bear case: compliance costs could disadvantage smaller developers and concentrate the market.
My view would change if the FCA’s perimeter guidance or subsequent enforcement showed a materially different impact on independent providers.
This is a forthcoming framework, not a blanket rule that every bot automatically needs authorization. Crypto remains risky; DYOR.
Will the UK’s new regime make automated crypto trading safer, or give larger platforms a competitive advantage?
#Write2Earn
The UK’s crypto bot rules may change more than the bots themselves. The real issue is what the app actually does.
The FCA’s new crypto regime is scheduled to take effect on 25 October 2027. Applications are open from 30 September 2026 to 28 February 2027. Firms carrying out regulated crypto activities will need the appropriate authorization. Official FCA guidance.
My read: market analytics and automated trade execution should not be treated as the same service. The legal scope matters more than the “trading bot” label.
Bull case: stronger oversight could improve accountability and consumer protection.
Bear case: compliance costs could disadvantage smaller developers and concentrate the market.
My view would change if the FCA’s perimeter guidance or subsequent enforcement showed a materially different impact on independent providers.
This is a forthcoming framework, not a blanket rule that every bot automatically needs authorization. Crypto remains risky; DYOR.
Will the UK’s new regime make automated crypto trading safer, or give larger platforms a competitive advantage?
#Write2Earn
1
653
See translation
$MSFT.US
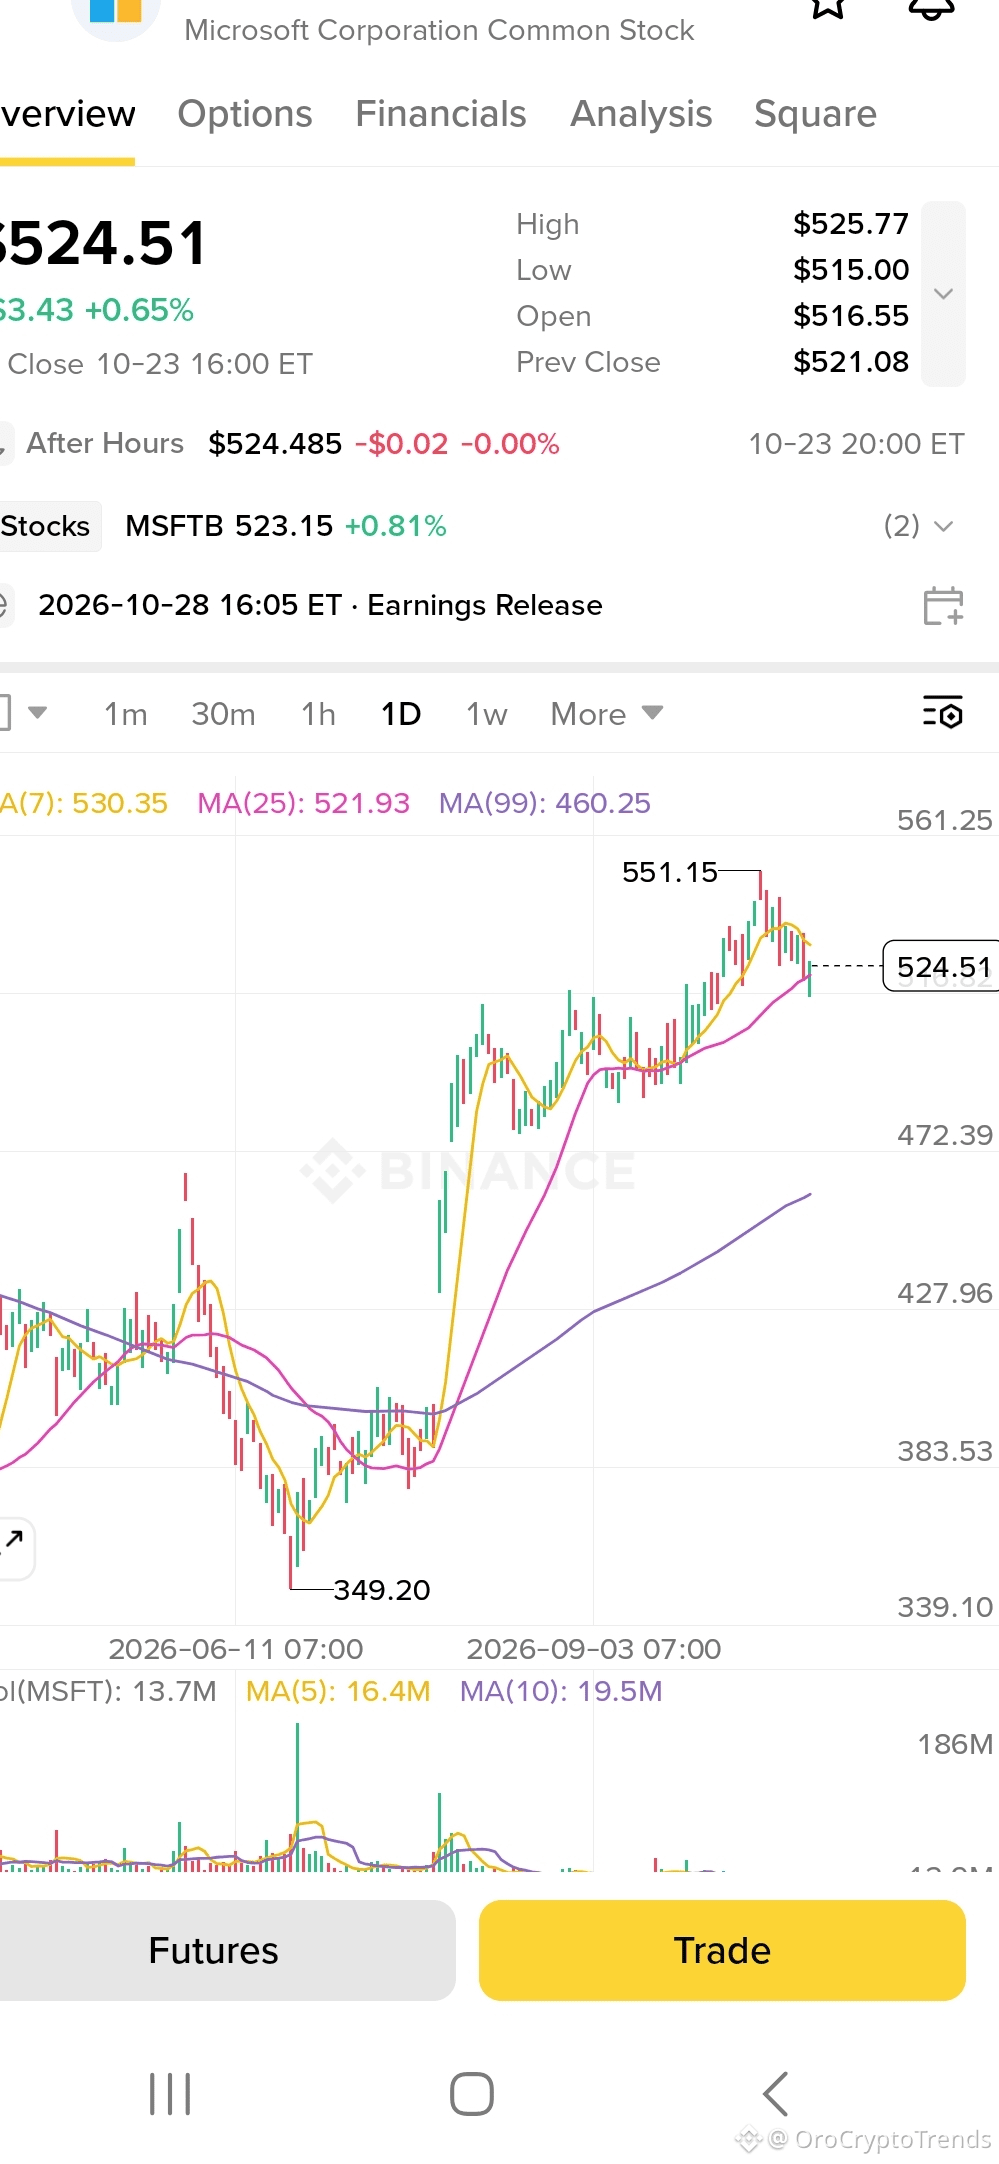
MSFT is holding above its 25-day average, but the earnings test is bigger than the chart.
Microsoft closed at $524.51 on October 23, up 0.65%, according to my Binance market live chart. The daily chart shows price below its 7-day moving average ($530.35), but above its 25-day ($521.93) and 99-day ($460.25) averages.
My read:short-term momentum has cooled, but the broader trend has not clearly broken. The next catalyst is Microsoft's October 28 earnings report. The key question is whether Azure growth and AI monetization can justify the scale of infrastructure spending.
The bull case is strong cloud demand and improving returns on AI investment. The bear case is that capital expenditure keeps rising faster than the market's confidence in future profits.
I'd reassess the constructive chart view if price loses the 25-day average and fails to recover it. A move back above the 7-day average would improve the short-term picture, but would not guarantee a positive earnings reaction.
$MSFT
{future}(MSFTUSDT)
Not financial advice. Earnings carry risk.
Would you put more weight on the $521.93 technical level or Microsoft's Azure and capital-spending guidance?
#MSFT
$MSFT.US
MSFT is holding above its 25-day average, but the earnings test is bigger than the chart.
Microsoft closed at $524.51 on October 23, up 0.65%, according to my Binance market live chart. The daily chart shows price below its 7-day moving average ($530.35), but above its 25-day ($521.93) and 99-day ($460.25) averages.
My read:short-term momentum has cooled, but the broader trend has not clearly broken. The next catalyst is Microsoft's October 28 earnings report. The key question is whether Azure growth and AI monetization can justify the scale of infrastructure spending.
The bull case is strong cloud demand and improving returns on AI investment. The bear case is that capital expenditure keeps rising faster than the market's confidence in future profits.
I'd reassess the constructive chart view if price loses the 25-day average and fails to recover it. A move back above the 7-day average would improve the short-term picture, but would not guarantee a positive earnings reaction.
$MSFT
Not financial advice. Earnings carry risk.
Would you put more weight on the $521.93 technical level or Microsoft's Azure and capital-spending guidance?
#MSFT
MSFT is holding above its 25-day average, but the earnings test is bigger than the chart.
Microsoft closed at $524.51 on October 23, up 0.65%, according to my Binance market live chart. The daily chart shows price below its 7-day moving average ($530.35), but above its 25-day ($521.93) and 99-day ($460.25) averages.
My read:short-term momentum has cooled, but the broader trend has not clearly broken. The next catalyst is Microsoft's October 28 earnings report. The key question is whether Azure growth and AI monetization can justify the scale of infrastructure spending.
The bull case is strong cloud demand and improving returns on AI investment. The bear case is that capital expenditure keeps rising faster than the market's confidence in future profits.
I'd reassess the constructive chart view if price loses the 25-day average and fails to recover it. A move back above the 7-day average would improve the short-term picture, but would not guarantee a positive earnings reaction.
$MSFT
Not financial advice. Earnings carry risk.
Would you put more weight on the $521.93 technical level or Microsoft's Azure and capital-spending guidance?
#MSFT
MSFTUS-0.08%
284
Verified
Holding $BNB 0.1 USDT
See translation
$BNB
{future}(BNBUSDT)
access to Hong Kong’s regulated brokerage channel is expanding. Will adoption follow?
Binance’s announcement feed reports that Futu Securities Hong Kong has enabled BNB deposits and withdrawals through BNB Smart Chain (BEP20) for qualified professional investors. Binance founder CZ also publicly acknowledged the announcement on X.
Market snapshot
$BNB / USDT: 732.49
Displayed change: -1.89%
I see this as a potentially meaningful access development for BNB, but not an automatic bullish catalyst.
Connecting a brokerage platform with on-chain BNB transfers could make moving assets more convenient for eligible investors. The bigger question is whether that convenience translates into sustained usage, broader participation, and measurable demand for BNB.
The displayed market snapshot shows BNBUSDT at 732.49, down 1.89%. That is a separate observation; it does not establish that the news caused the price decline.
I’m watching for evidence of actual adoption and whether this integration becomes part of a broader trend connecting digital assets with regulated financial services. If usage remains limited, the immediate impact on BNB demand may be modest.
Access opens the door. Adoption determines whether it matters.
Not financial advice. Do your own research.
#bnb #Write2Earn
$BNB
access to Hong Kong’s regulated brokerage channel is expanding. Will adoption follow?
Binance’s announcement feed reports that Futu Securities Hong Kong has enabled BNB deposits and withdrawals through BNB Smart Chain (BEP20) for qualified professional investors. Binance founder CZ also publicly acknowledged the announcement on X.
Market snapshot
$BNB / USDT: 732.49
Displayed change: -1.89%
I see this as a potentially meaningful access development for BNB, but not an automatic bullish catalyst.
Connecting a brokerage platform with on-chain BNB transfers could make moving assets more convenient for eligible investors. The bigger question is whether that convenience translates into sustained usage, broader participation, and measurable demand for BNB.
The displayed market snapshot shows BNBUSDT at 732.49, down 1.89%. That is a separate observation; it does not establish that the news caused the price decline.
I’m watching for evidence of actual adoption and whether this integration becomes part of a broader trend connecting digital assets with regulated financial services. If usage remains limited, the immediate impact on BNB demand may be modest.
Access opens the door. Adoption determines whether it matters.
Not financial advice. Do your own research.
#bnb #Write2Earn
access to Hong Kong’s regulated brokerage channel is expanding. Will adoption follow?
Binance’s announcement feed reports that Futu Securities Hong Kong has enabled BNB deposits and withdrawals through BNB Smart Chain (BEP20) for qualified professional investors. Binance founder CZ also publicly acknowledged the announcement on X.
Market snapshot
$BNB / USDT: 732.49
Displayed change: -1.89%
I see this as a potentially meaningful access development for BNB, but not an automatic bullish catalyst.
Connecting a brokerage platform with on-chain BNB transfers could make moving assets more convenient for eligible investors. The bigger question is whether that convenience translates into sustained usage, broader participation, and measurable demand for BNB.
The displayed market snapshot shows BNBUSDT at 732.49, down 1.89%. That is a separate observation; it does not establish that the news caused the price decline.
I’m watching for evidence of actual adoption and whether this integration becomes part of a broader trend connecting digital assets with regulated financial services. If usage remains limited, the immediate impact on BNB demand may be modest.
Access opens the door. Adoption determines whether it matters.
Not financial advice. Do your own research.
#bnb #Write2Earn

4
1.1k
See translation
CZ’s Japan interview highlights a bigger question: how will AI and blockchain shape the next phase of growth?
Binance founder CZ appeared in an exclusive interview with Japanese media outlet PIVOT, discussing AI, blockchain, and global expansion strategies.
He also announced an AI-generated audio version of Freedom of Money coming to Spotify, reflecting his growing engagement with AI technology.
Related assets: No direct token impact is established by the information provided.
What interests me here is the intersection of AI, blockchain, and global expansion. These are often discussed as separate growth narratives, but their long-term significance depends on whether they translate into useful products, broader adoption, and sustainable business models.
The AI-generated audiobook is a concrete example of AI being applied to an existing content product. However, it does not by itself demonstrate new blockchain adoption or a direct benefit to any particular crypto token.
I would watch for specific details about the expansion strategy, practical AI applications, and measurable ecosystem adoption. Until those details emerge, I see this as a strategic discussion worth following, rather than a standalone trading catalyst.
Not financial advice. Do your own research.
#CZ #Binance
CZ’s Japan interview highlights a bigger question: how will AI and blockchain shape the next phase of growth?
Binance founder CZ appeared in an exclusive interview with Japanese media outlet PIVOT, discussing AI, blockchain, and global expansion strategies.
He also announced an AI-generated audio version of Freedom of Money coming to Spotify, reflecting his growing engagement with AI technology.
Related assets: No direct token impact is established by the information provided.
What interests me here is the intersection of AI, blockchain, and global expansion. These are often discussed as separate growth narratives, but their long-term significance depends on whether they translate into useful products, broader adoption, and sustainable business models.
The AI-generated audiobook is a concrete example of AI being applied to an existing content product. However, it does not by itself demonstrate new blockchain adoption or a direct benefit to any particular crypto token.
I would watch for specific details about the expansion strategy, practical AI applications, and measurable ecosystem adoption. Until those details emerge, I see this as a strategic discussion worth following, rather than a standalone trading catalyst.
Not financial advice. Do your own research.
#CZ #Binance
Binance founder CZ appeared in an exclusive interview with Japanese media outlet PIVOT, discussing AI, blockchain, and global expansion strategies.
He also announced an AI-generated audio version of Freedom of Money coming to Spotify, reflecting his growing engagement with AI technology.
Related assets: No direct token impact is established by the information provided.
What interests me here is the intersection of AI, blockchain, and global expansion. These are often discussed as separate growth narratives, but their long-term significance depends on whether they translate into useful products, broader adoption, and sustainable business models.
The AI-generated audiobook is a concrete example of AI being applied to an existing content product. However, it does not by itself demonstrate new blockchain adoption or a direct benefit to any particular crypto token.
I would watch for specific details about the expansion strategy, practical AI applications, and measurable ecosystem adoption. Until those details emerge, I see this as a strategic discussion worth following, rather than a standalone trading catalyst.
Not financial advice. Do your own research.
#CZ #Binance

199
🎙️ 🚨 Bitcoin Below `$82K: Healthy Pullback? ETF Flows & What Comes Next

End
01 h 31 m 54 s
672
BNB
Holding
+0.2
4
0
See translation
$MSFT: I'm cautiously bullish heading into earnings, but AI spending is the real test.
Microsoft is scheduled to report its fiscal Q1 2027 results on October 28, after the market closes. Investors will be watching whether cloud growth and AI adoption can justify the company's substantial investment in AI infrastructure.
My prediction: Bullish, with one major condition.
Microsoft's previous quarter showed strong business momentum, including 43% growth in Azure and other cloud services. That supports the bullish case, but past performance does not guarantee another earnings beat. <Cite refs={["turn432956news17"]}/>
The key question is whether Microsoft can keep growing its cloud business while turning AI demand into sustainable revenue and profits.
I'm watching three things:
- Earnings: Can Microsoft meet or exceed market expectations?
- Azure: Does cloud growth remain strong?
- AI spending: Are the returns beginning to justify the infrastructure costs?
My bullish thesis weakens if cloud growth disappoints or management's outlook fails to justify continued AI investment. Even an earnings beat could trigger a sell-off if expectations are already too high.
My Binance Pick prediction: Bullish on $MSFT, but the guidance matters as much as the headline numbers.
#EarningsSeason #BinancePick
Not financial advice. Do your own research.
$MSFT: I'm cautiously bullish heading into earnings, but AI spending is the real test.
Microsoft is scheduled to report its fiscal Q1 2027 results on October 28, after the market closes. Investors will be watching whether cloud growth and AI adoption can justify the company's substantial investment in AI infrastructure.
My prediction: Bullish, with one major condition.
Microsoft's previous quarter showed strong business momentum, including 43% growth in Azure and other cloud services. That supports the bullish case, but past performance does not guarantee another earnings beat. <Cite refs={["turn432956news17"]}/>
The key question is whether Microsoft can keep growing its cloud business while turning AI demand into sustainable revenue and profits.
I'm watching three things:
- Earnings: Can Microsoft meet or exceed market expectations?
- Azure: Does cloud growth remain strong?
- AI spending: Are the returns beginning to justify the infrastructure costs?
My bullish thesis weakens if cloud growth disappoints or management's outlook fails to justify continued AI investment. Even an earnings beat could trigger a sell-off if expectations are already too high.
My Binance Pick prediction: Bullish on $MSFT, but the guidance matters as much as the headline numbers.
#EarningsSeason #BinancePick
Not financial advice. Do your own research.
Microsoft is scheduled to report its fiscal Q1 2027 results on October 28, after the market closes. Investors will be watching whether cloud growth and AI adoption can justify the company's substantial investment in AI infrastructure.
My prediction: Bullish, with one major condition.
Microsoft's previous quarter showed strong business momentum, including 43% growth in Azure and other cloud services. That supports the bullish case, but past performance does not guarantee another earnings beat. <Cite refs={["turn432956news17"]}/>
The key question is whether Microsoft can keep growing its cloud business while turning AI demand into sustainable revenue and profits.
I'm watching three things:
- Earnings: Can Microsoft meet or exceed market expectations?
- Azure: Does cloud growth remain strong?
- AI spending: Are the returns beginning to justify the infrastructure costs?
My bullish thesis weakens if cloud growth disappoints or management's outlook fails to justify continued AI investment. Even an earnings beat could trigger a sell-off if expectations are already too high.
My Binance Pick prediction: Bullish on $MSFT, but the guidance matters as much as the headline numbers.
#EarningsSeason #BinancePick
Not financial advice. Do your own research.

1
322
Log in to explore more content
Join global crypto users on Binance Square
⚡️ Get latest and useful information about crypto.
💬 Trusted by the world’s largest crypto exchange.
👍 Discover real insights from verified creators.
Email / Phone number