
AiCoin小编
346 Posts

AiCoin小编
Report
Block User
盯数据,看主力,偶尔聊点盘口之外的思考
1 Following
73 Followers
114 Liked
Posts
All
Quotes
Videos
·
--
Verified
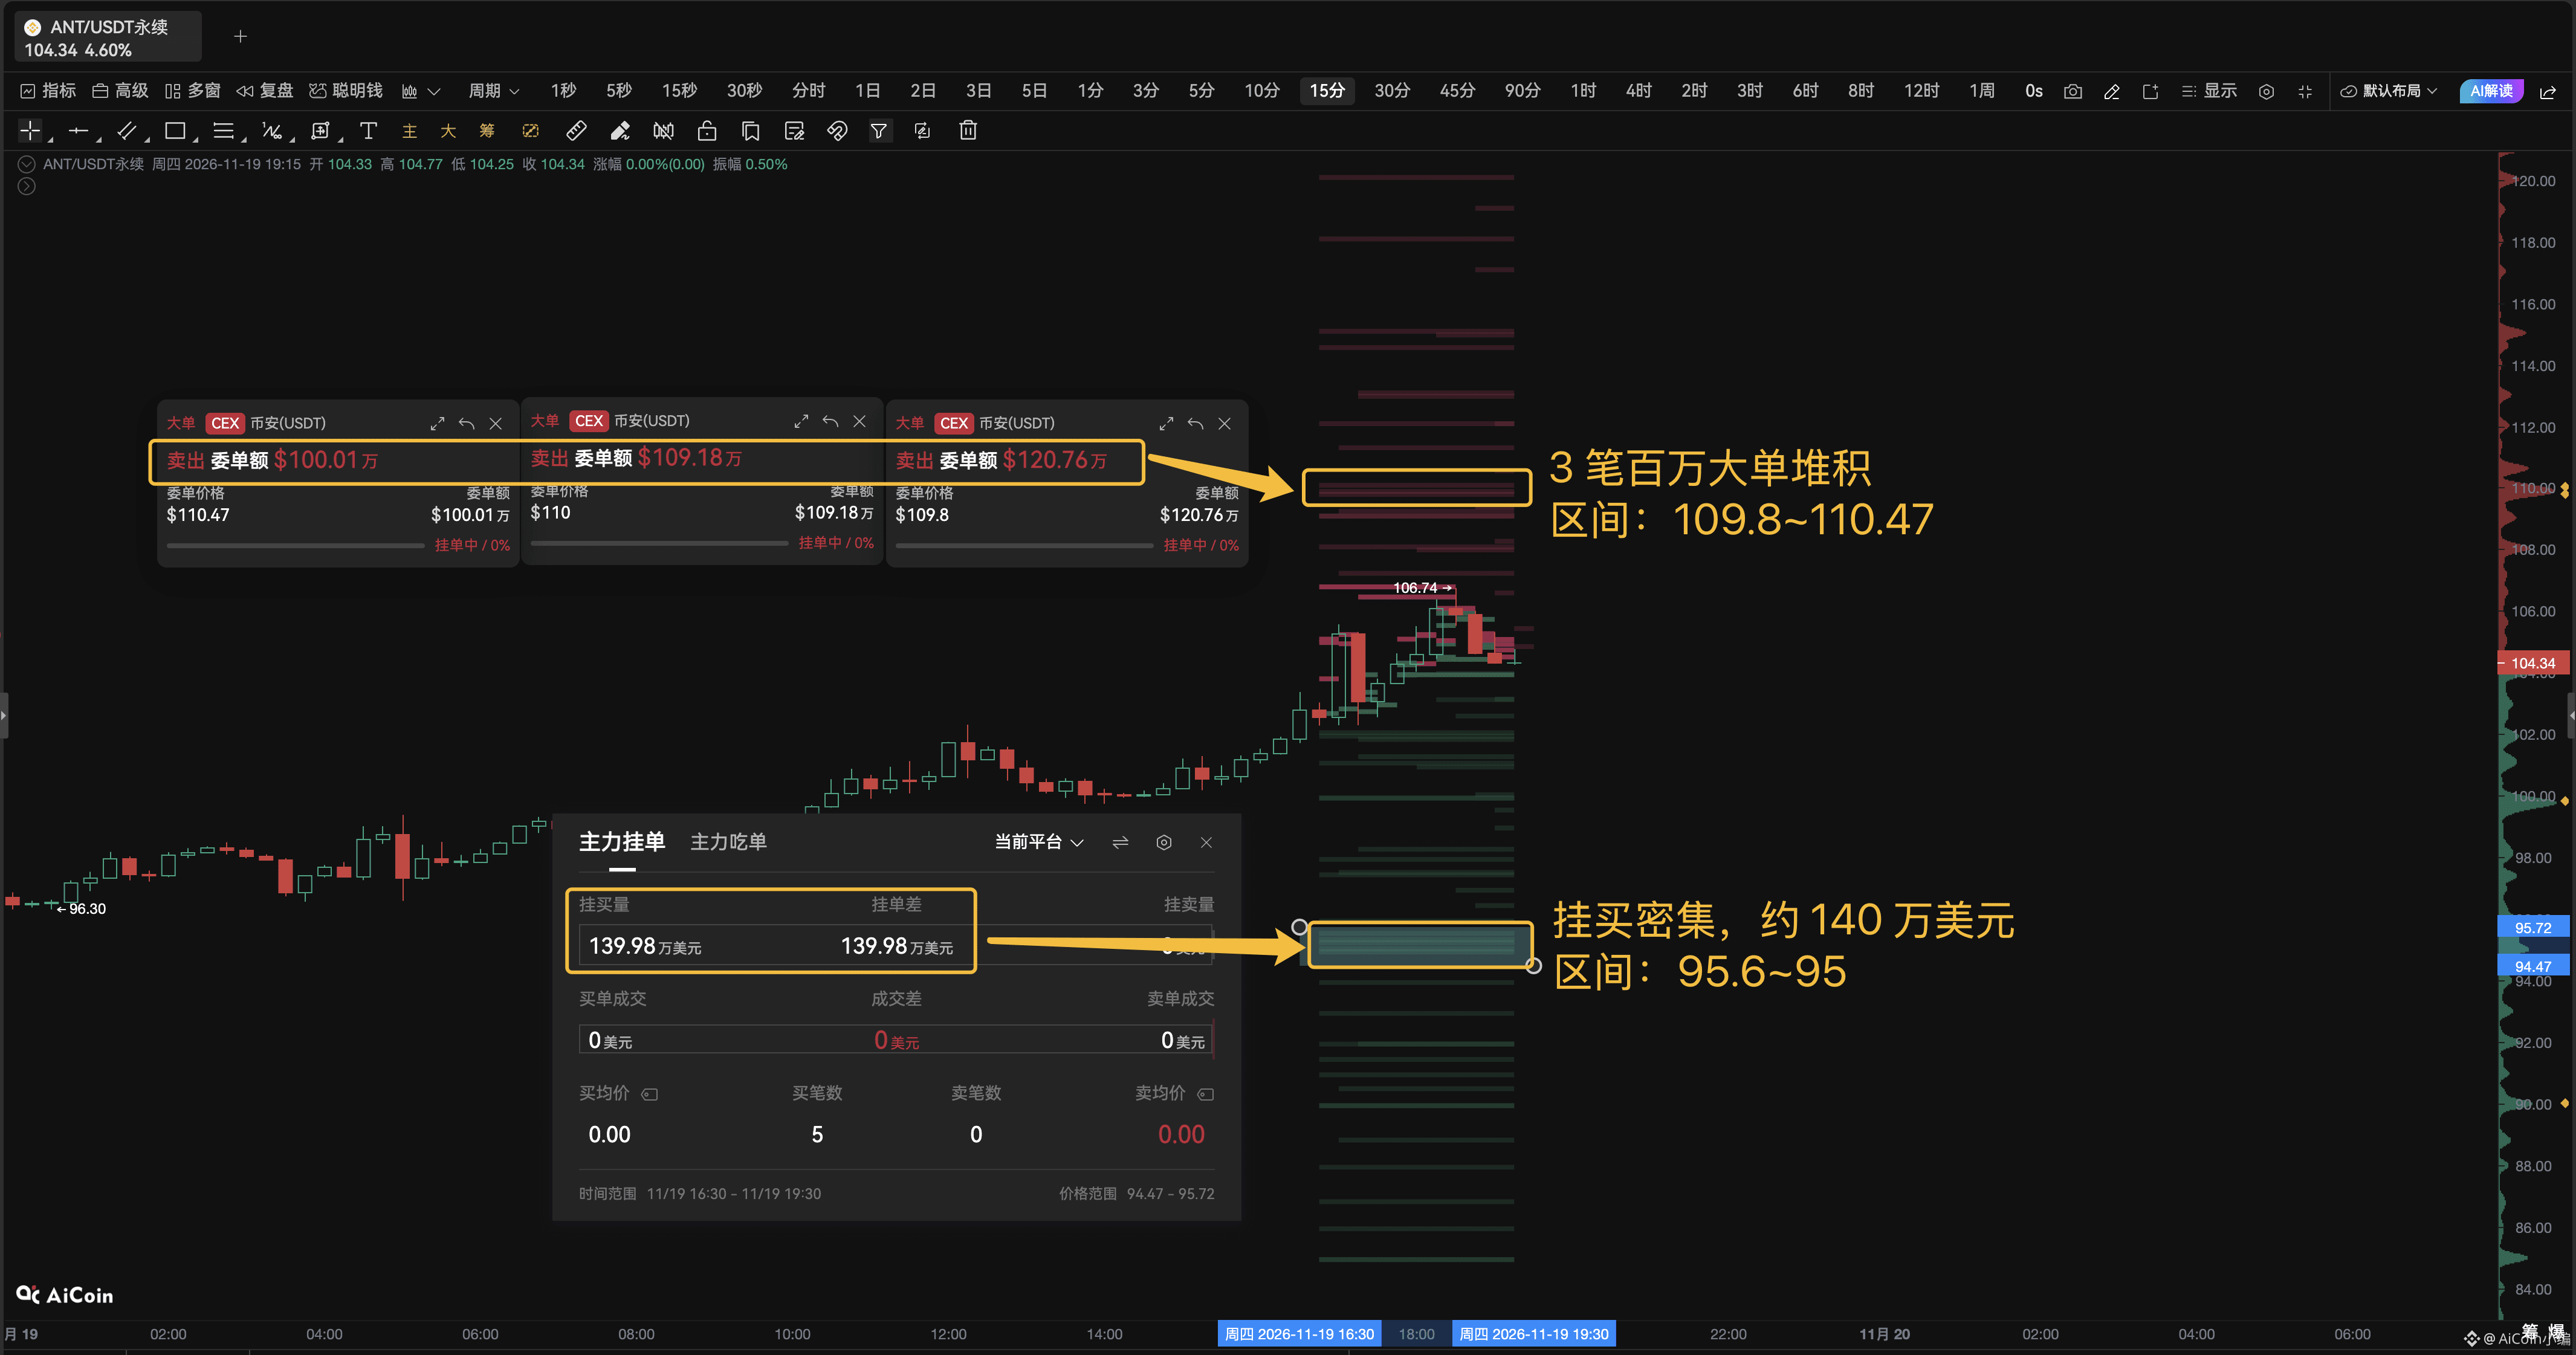
$ANTHROPIC The market hasn’t even opened yet, and crypto has already pumped it up 25% 👀
Anthropic officially debuts on Nasdaq tonight, with its IPO priced at $83.
But Binance’s ANT/USDT perpetual is already trading around $104, a premium of about 25%.
As for the order book:
🔺 Above, at $109.8–$110.47: three million-dollar sell orders, totaling around $3.3 million.
🔻 Below, at $95.6–$95: buy orders worth nearly $1.4 million are stacked up.
So the question now isn’t whether ANT will rise—it’s whether ANT is worth $95 or $110+ tonight.
If the U.S. market opens and immediately eats through the sell orders above $110, that means buyers are still scrambling to get in on day one;
if the open disappoints, the $95 area is where the first wave of early buyers will look to catch it.
#Anthropic #Claude
$ANTHROPIC The market hasn’t even opened yet, and crypto has already pumped it up 25% 👀
Anthropic officially debuts on Nasdaq tonight, with its IPO priced at $83.
But Binance’s ANT/USDT perpetual is already trading around $104, a premium of about 25%.
As for the order book:
🔺 Above, at $109.8–$110.47: three million-dollar sell orders, totaling around $3.3 million.
🔻 Below, at $95.6–$95: buy orders worth nearly $1.4 million are stacked up.
So the question now isn’t whether ANT will rise—it’s whether ANT is worth $95 or $110+ tonight.
If the U.S. market opens and immediately eats through the sell orders above $110, that means buyers are still scrambling to get in on day one;
if the open disappoints, the $95 area is where the first wave of early buyers will look to catch it.
#Anthropic #Claude
Anthropic officially debuts on Nasdaq tonight, with its IPO priced at $83.
But Binance’s ANT/USDT perpetual is already trading around $104, a premium of about 25%.
As for the order book:
🔺 Above, at $109.8–$110.47: three million-dollar sell orders, totaling around $3.3 million.
🔻 Below, at $95.6–$95: buy orders worth nearly $1.4 million are stacked up.
So the question now isn’t whether ANT will rise—it’s whether ANT is worth $95 or $110+ tonight.
If the U.S. market opens and immediately eats through the sell orders above $110, that means buyers are still scrambling to get in on day one;
if the open disappoints, the $95 area is where the first wave of early buyers will look to catch it.
#Anthropic #Claude
1
1.2k
·
--
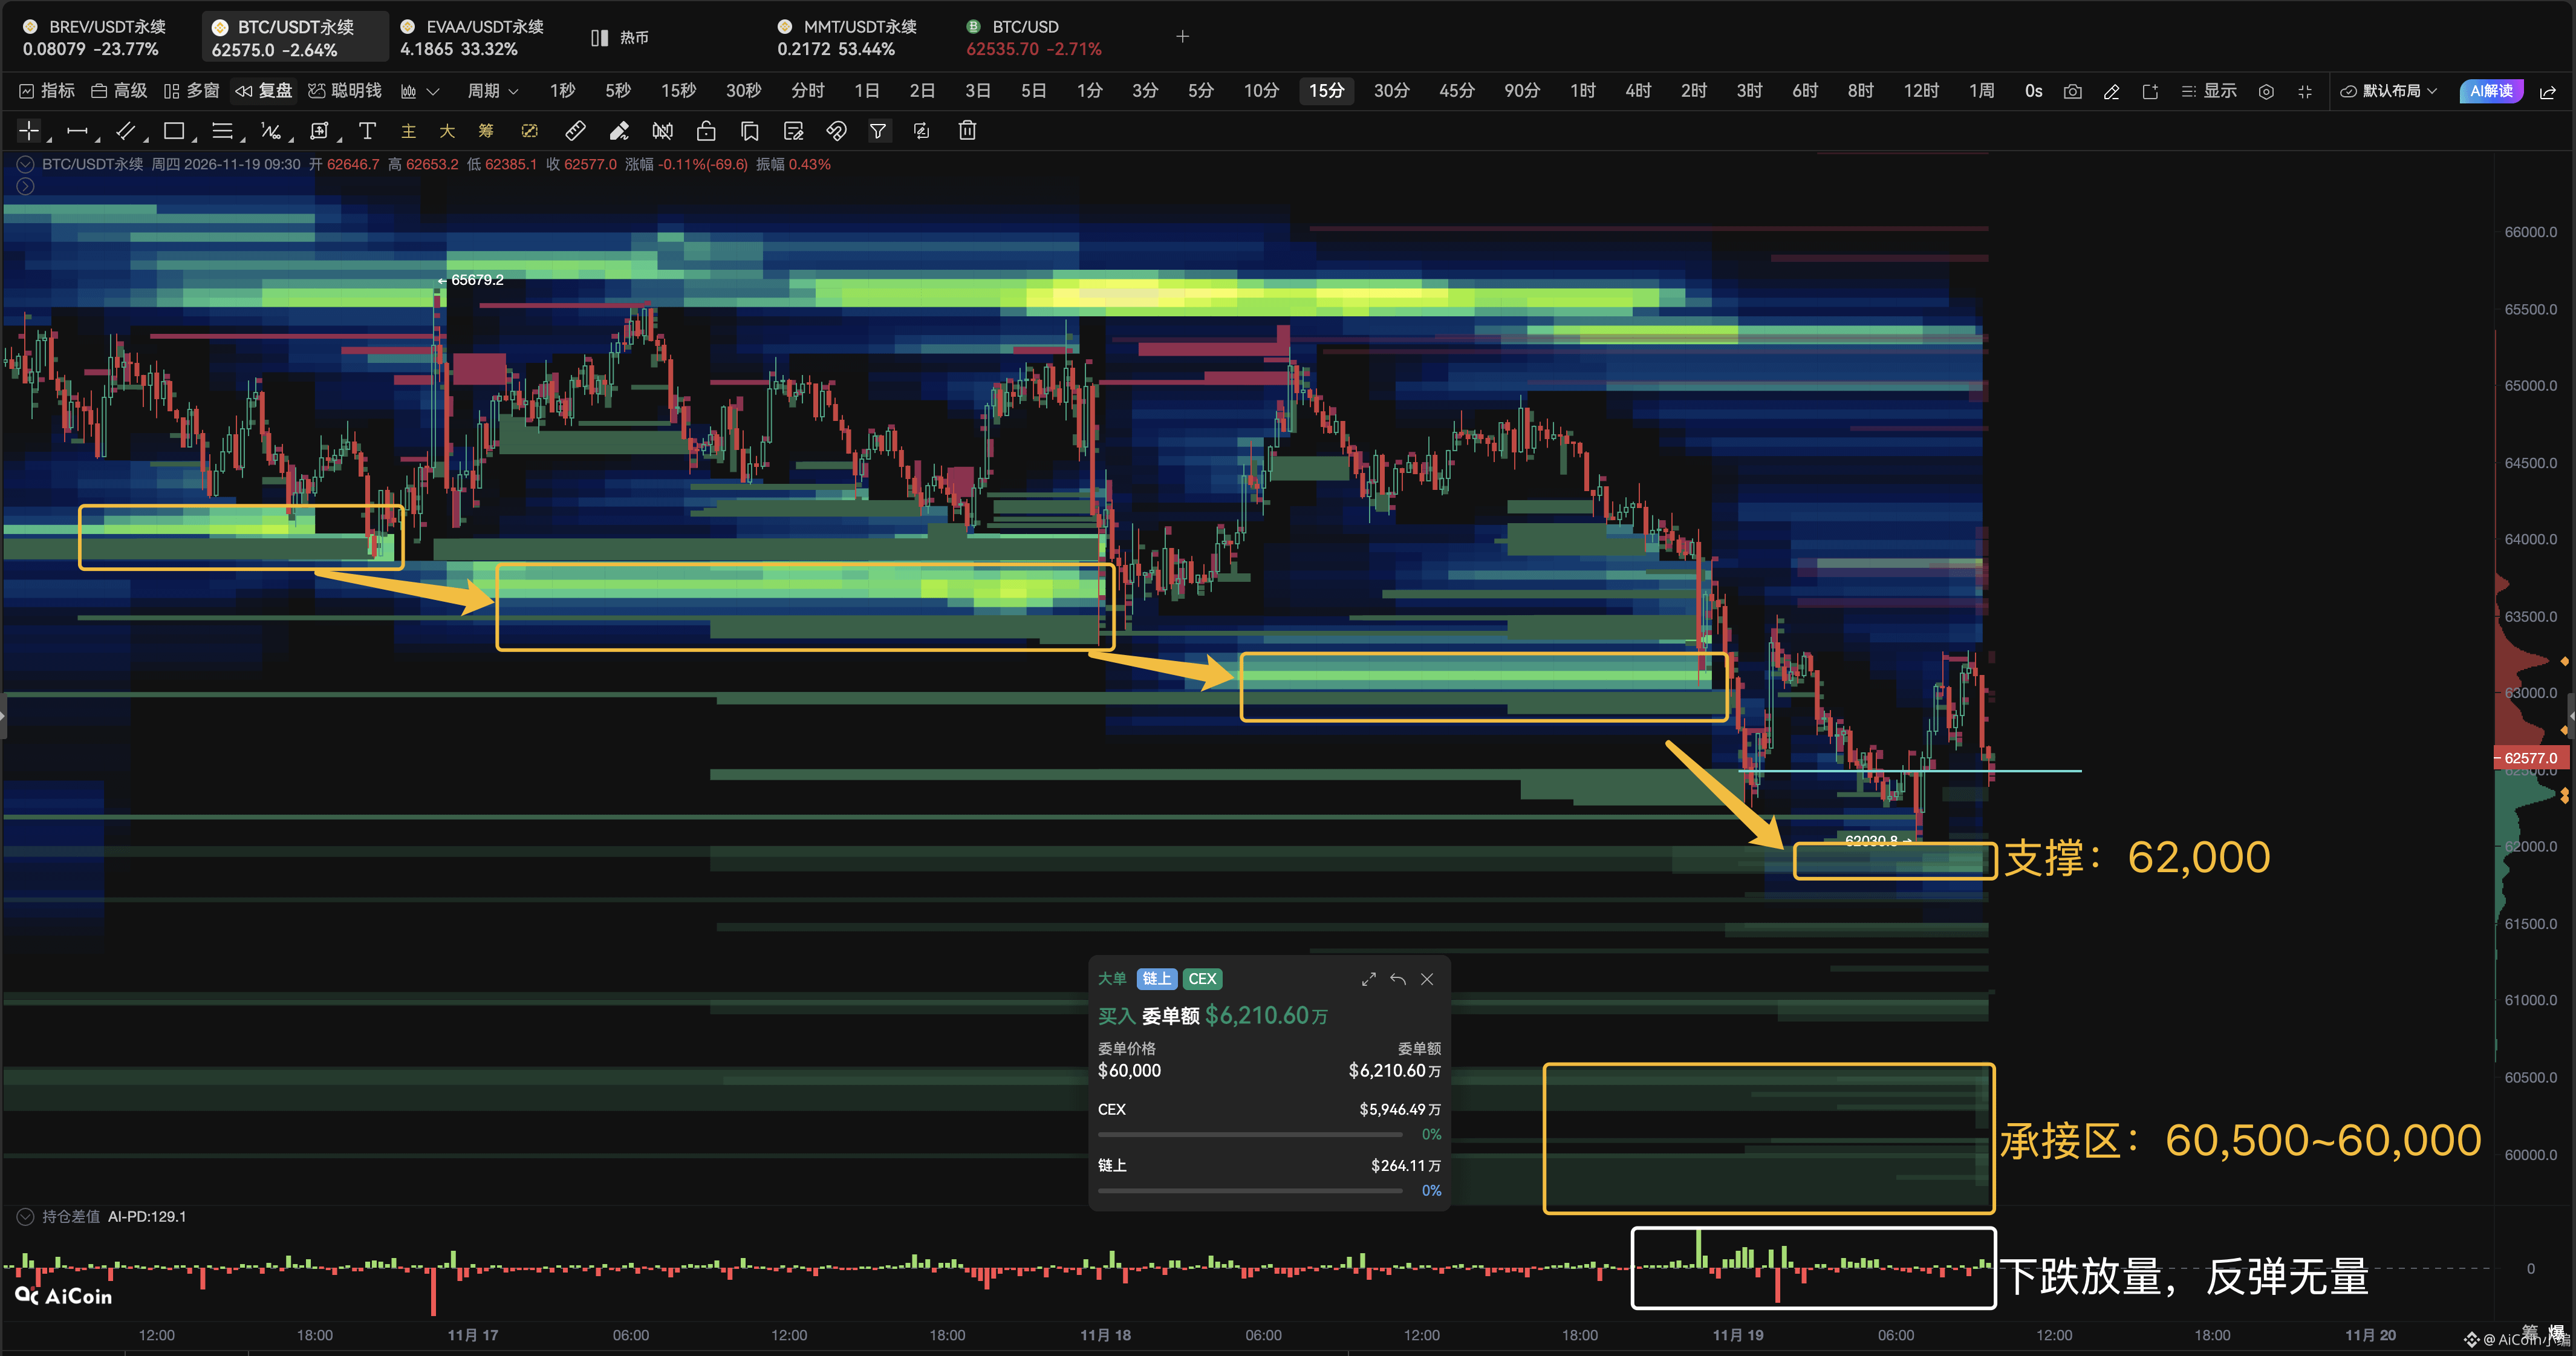
Don't rush to catch the bottom! $BTC Buyers are still waiting for lower prices…🫠
Volume is rising on the way down, but rebounds are happening on low volume. Over the past two days, highly leveraged BTC longs have been liquidated layer by layer.
More importantly, large buy orders are moving lower too: 64,000 → 63,000 → 62,000
Meanwhile, large sell orders above and the short liquidation cluster are still concentrated around 65,500.
The market is actually easy to read right now: buyers aren't in a hurry to bid prices up, and shorts aren't being squeezed.🥲
Now, sentiment:
- Fear & Greed Index: currently at 10, its lowest since June 11;
- ahr999 HODL Index: currently at 0.2968, its lowest since July 2, and already in the buy-the-dip zone.
Sentiment and valuations are both very low, but the order book hasn't shown any clear aggressive buying yet.
In the short term, watch 62,000:
- If it holds with strong volume, there may be a chance to sweep the short-side liquidity around 65,500;
- If it fails to hold, 60,500–60,000 will be the next key support zone.
Don't rush to catch the bottom! $BTC Buyers are still waiting for lower prices…🫠
Volume is rising on the way down, but rebounds are happening on low volume. Over the past two days, highly leveraged BTC longs have been liquidated layer by layer.
More importantly, large buy orders are moving lower too: 64,000 → 63,000 → 62,000
Meanwhile, large sell orders above and the short liquidation cluster are still concentrated around 65,500.
The market is actually easy to read right now: buyers aren't in a hurry to bid prices up, and shorts aren't being squeezed.🥲
Now, sentiment:
- Fear & Greed Index: currently at 10, its lowest since June 11;
- ahr999 HODL Index: currently at 0.2968, its lowest since July 2, and already in the buy-the-dip zone.
Sentiment and valuations are both very low, but the order book hasn't shown any clear aggressive buying yet.
In the short term, watch 62,000:
- If it holds with strong volume, there may be a chance to sweep the short-side liquidity around 65,500;
- If it fails to hold, 60,500–60,000 will be the next key support zone.
Volume is rising on the way down, but rebounds are happening on low volume. Over the past two days, highly leveraged BTC longs have been liquidated layer by layer.
More importantly, large buy orders are moving lower too: 64,000 → 63,000 → 62,000
Meanwhile, large sell orders above and the short liquidation cluster are still concentrated around 65,500.
The market is actually easy to read right now: buyers aren't in a hurry to bid prices up, and shorts aren't being squeezed.🥲
Now, sentiment:
- Fear & Greed Index: currently at 10, its lowest since June 11;
- ahr999 HODL Index: currently at 0.2968, its lowest since July 2, and already in the buy-the-dip zone.
Sentiment and valuations are both very low, but the order book hasn't shown any clear aggressive buying yet.
In the short term, watch 62,000:
- If it holds with strong volume, there may be a chance to sweep the short-side liquidity around 65,500;
- If it fails to hold, 60,500–60,000 will be the next key support zone.
181
·
--
Bearish
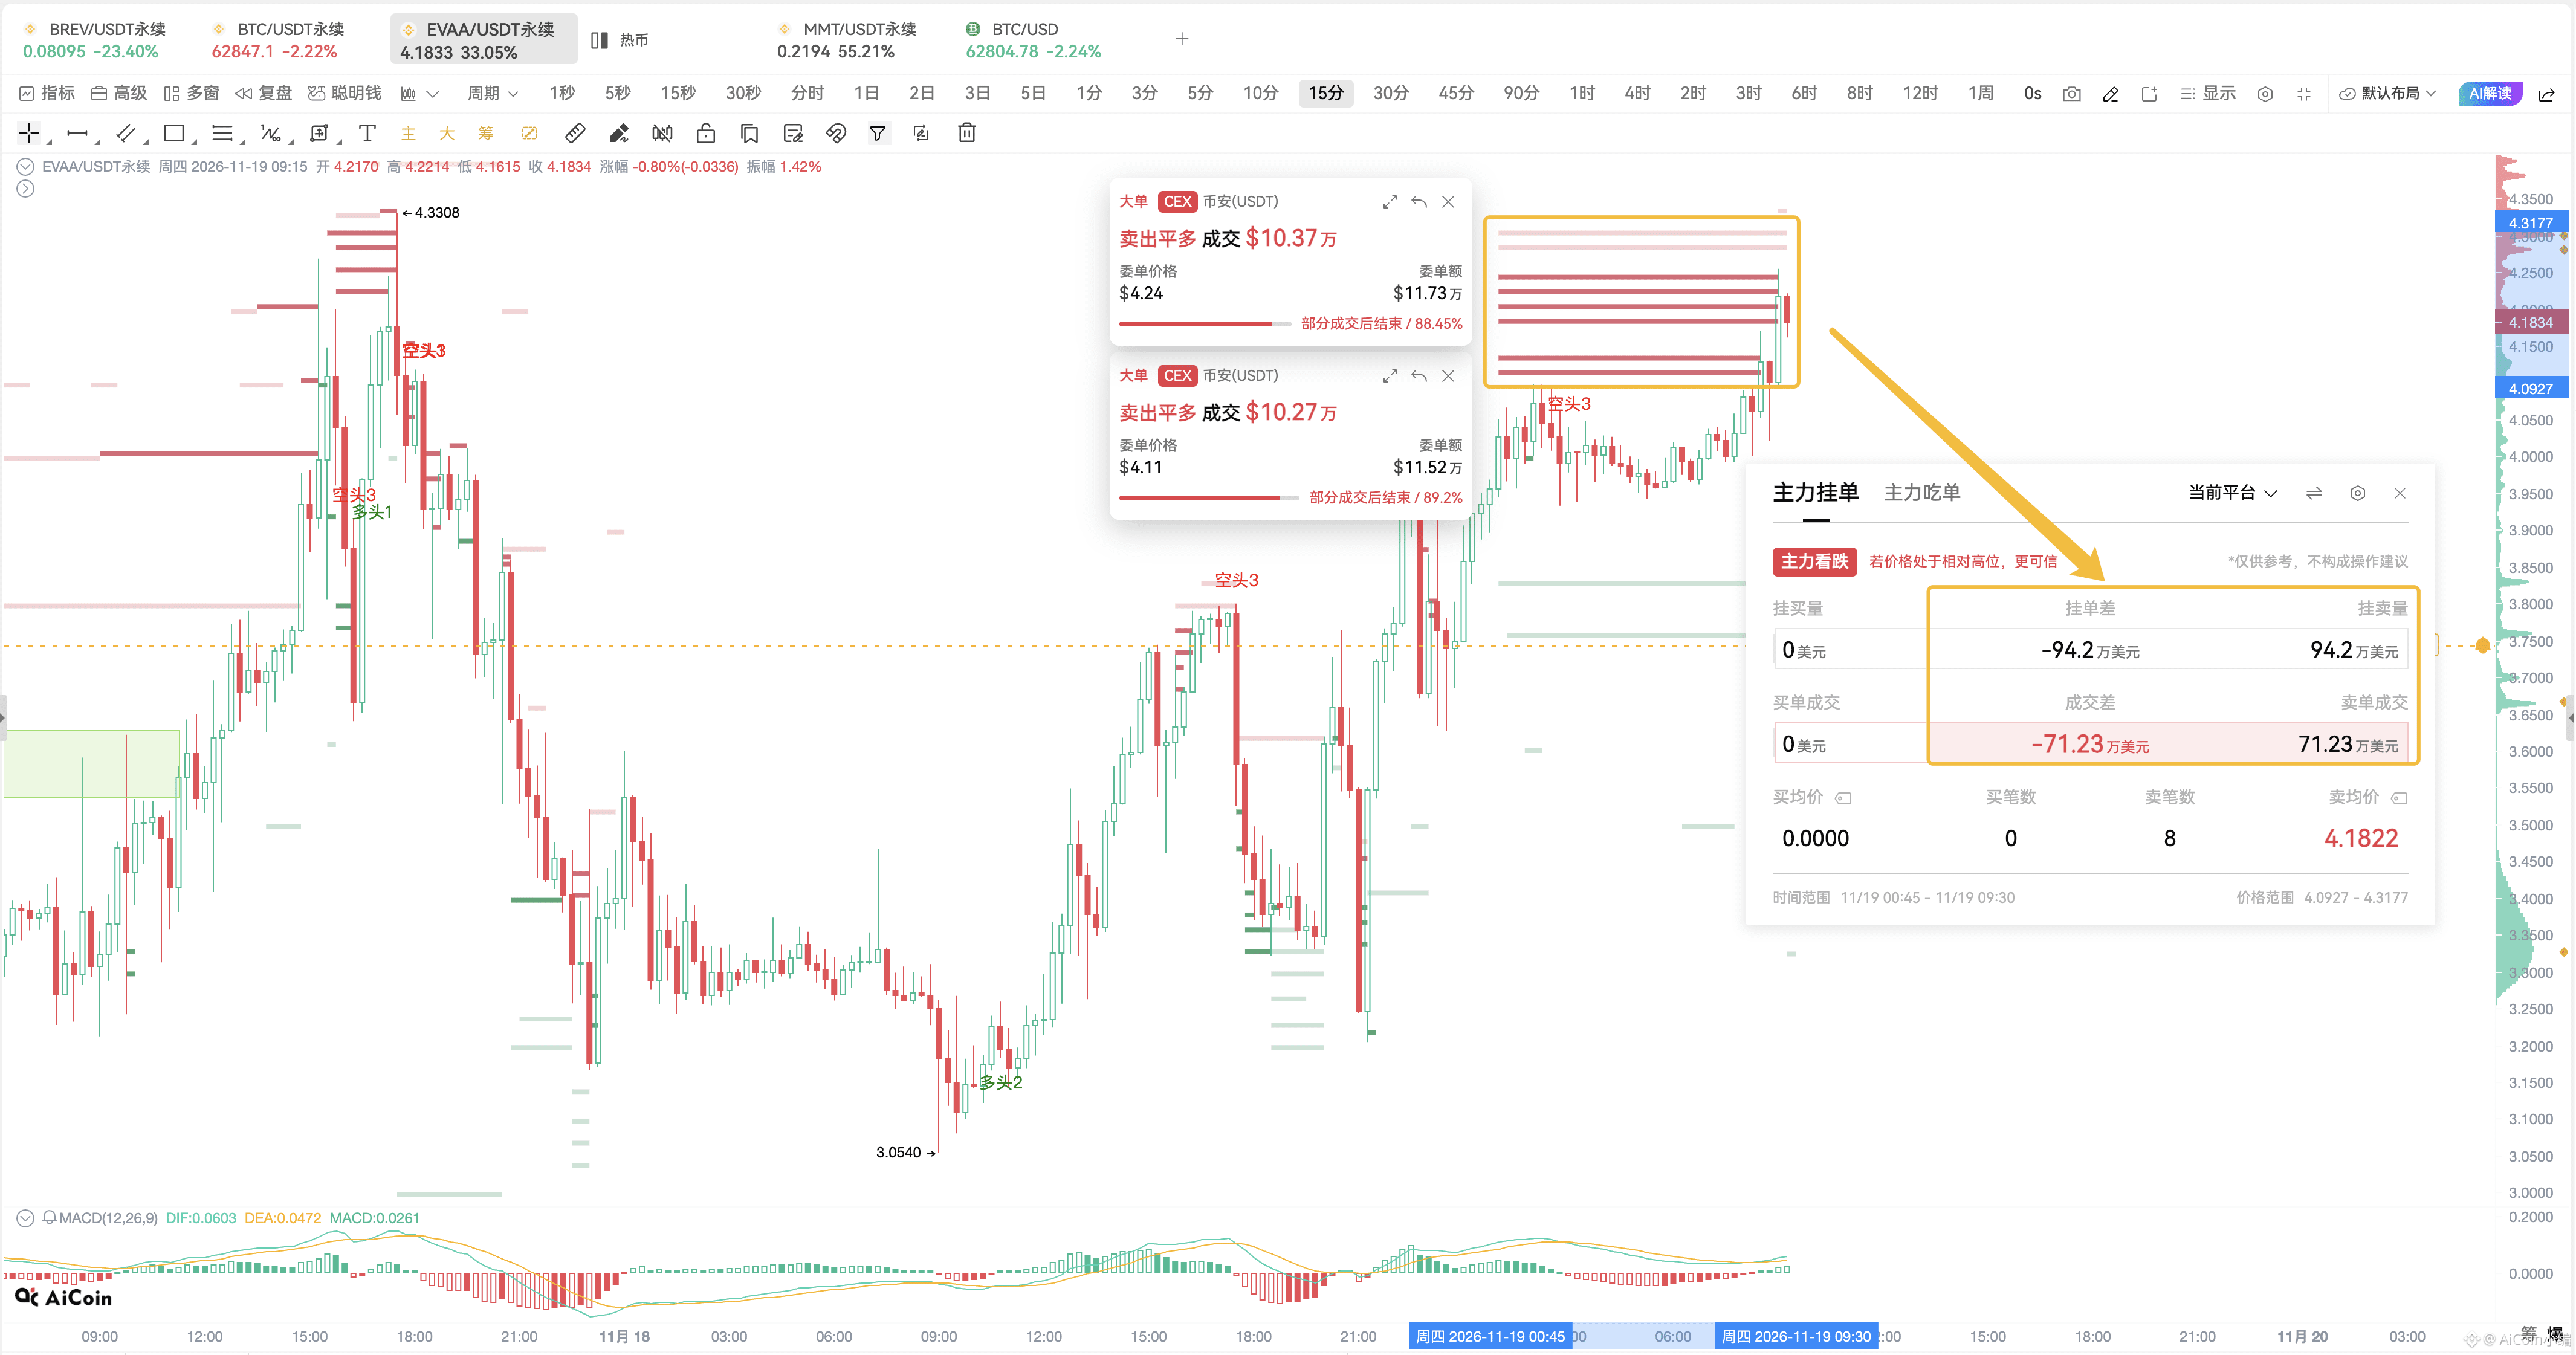
Pumping the price to sell? 🤔 $EVAA has seen 8 large sell orders appear nearby, 6 of which have been filled so far. Large players have cumulatively closed $712,300 worth of long positions, with two more sell orders pending in the 4.28–4.3 range.
These sell orders all appeared in the order book between 01:13 and 01:14 in the early morning, so they were most likely placed by the same large trader.
Pumping the price to sell? 🤔 $EVAA has seen 8 large sell orders appear nearby, 6 of which have been filled so far. Large players have cumulatively closed $712,300 worth of long positions, with two more sell orders pending in the 4.28–4.3 range.
These sell orders all appeared in the order book between 01:13 and 01:14 in the early morning, so they were most likely placed by the same large trader.
These sell orders all appeared in the order book between 01:13 and 01:14 in the early morning, so they were most likely placed by the same large trader.
1.7k
·
--
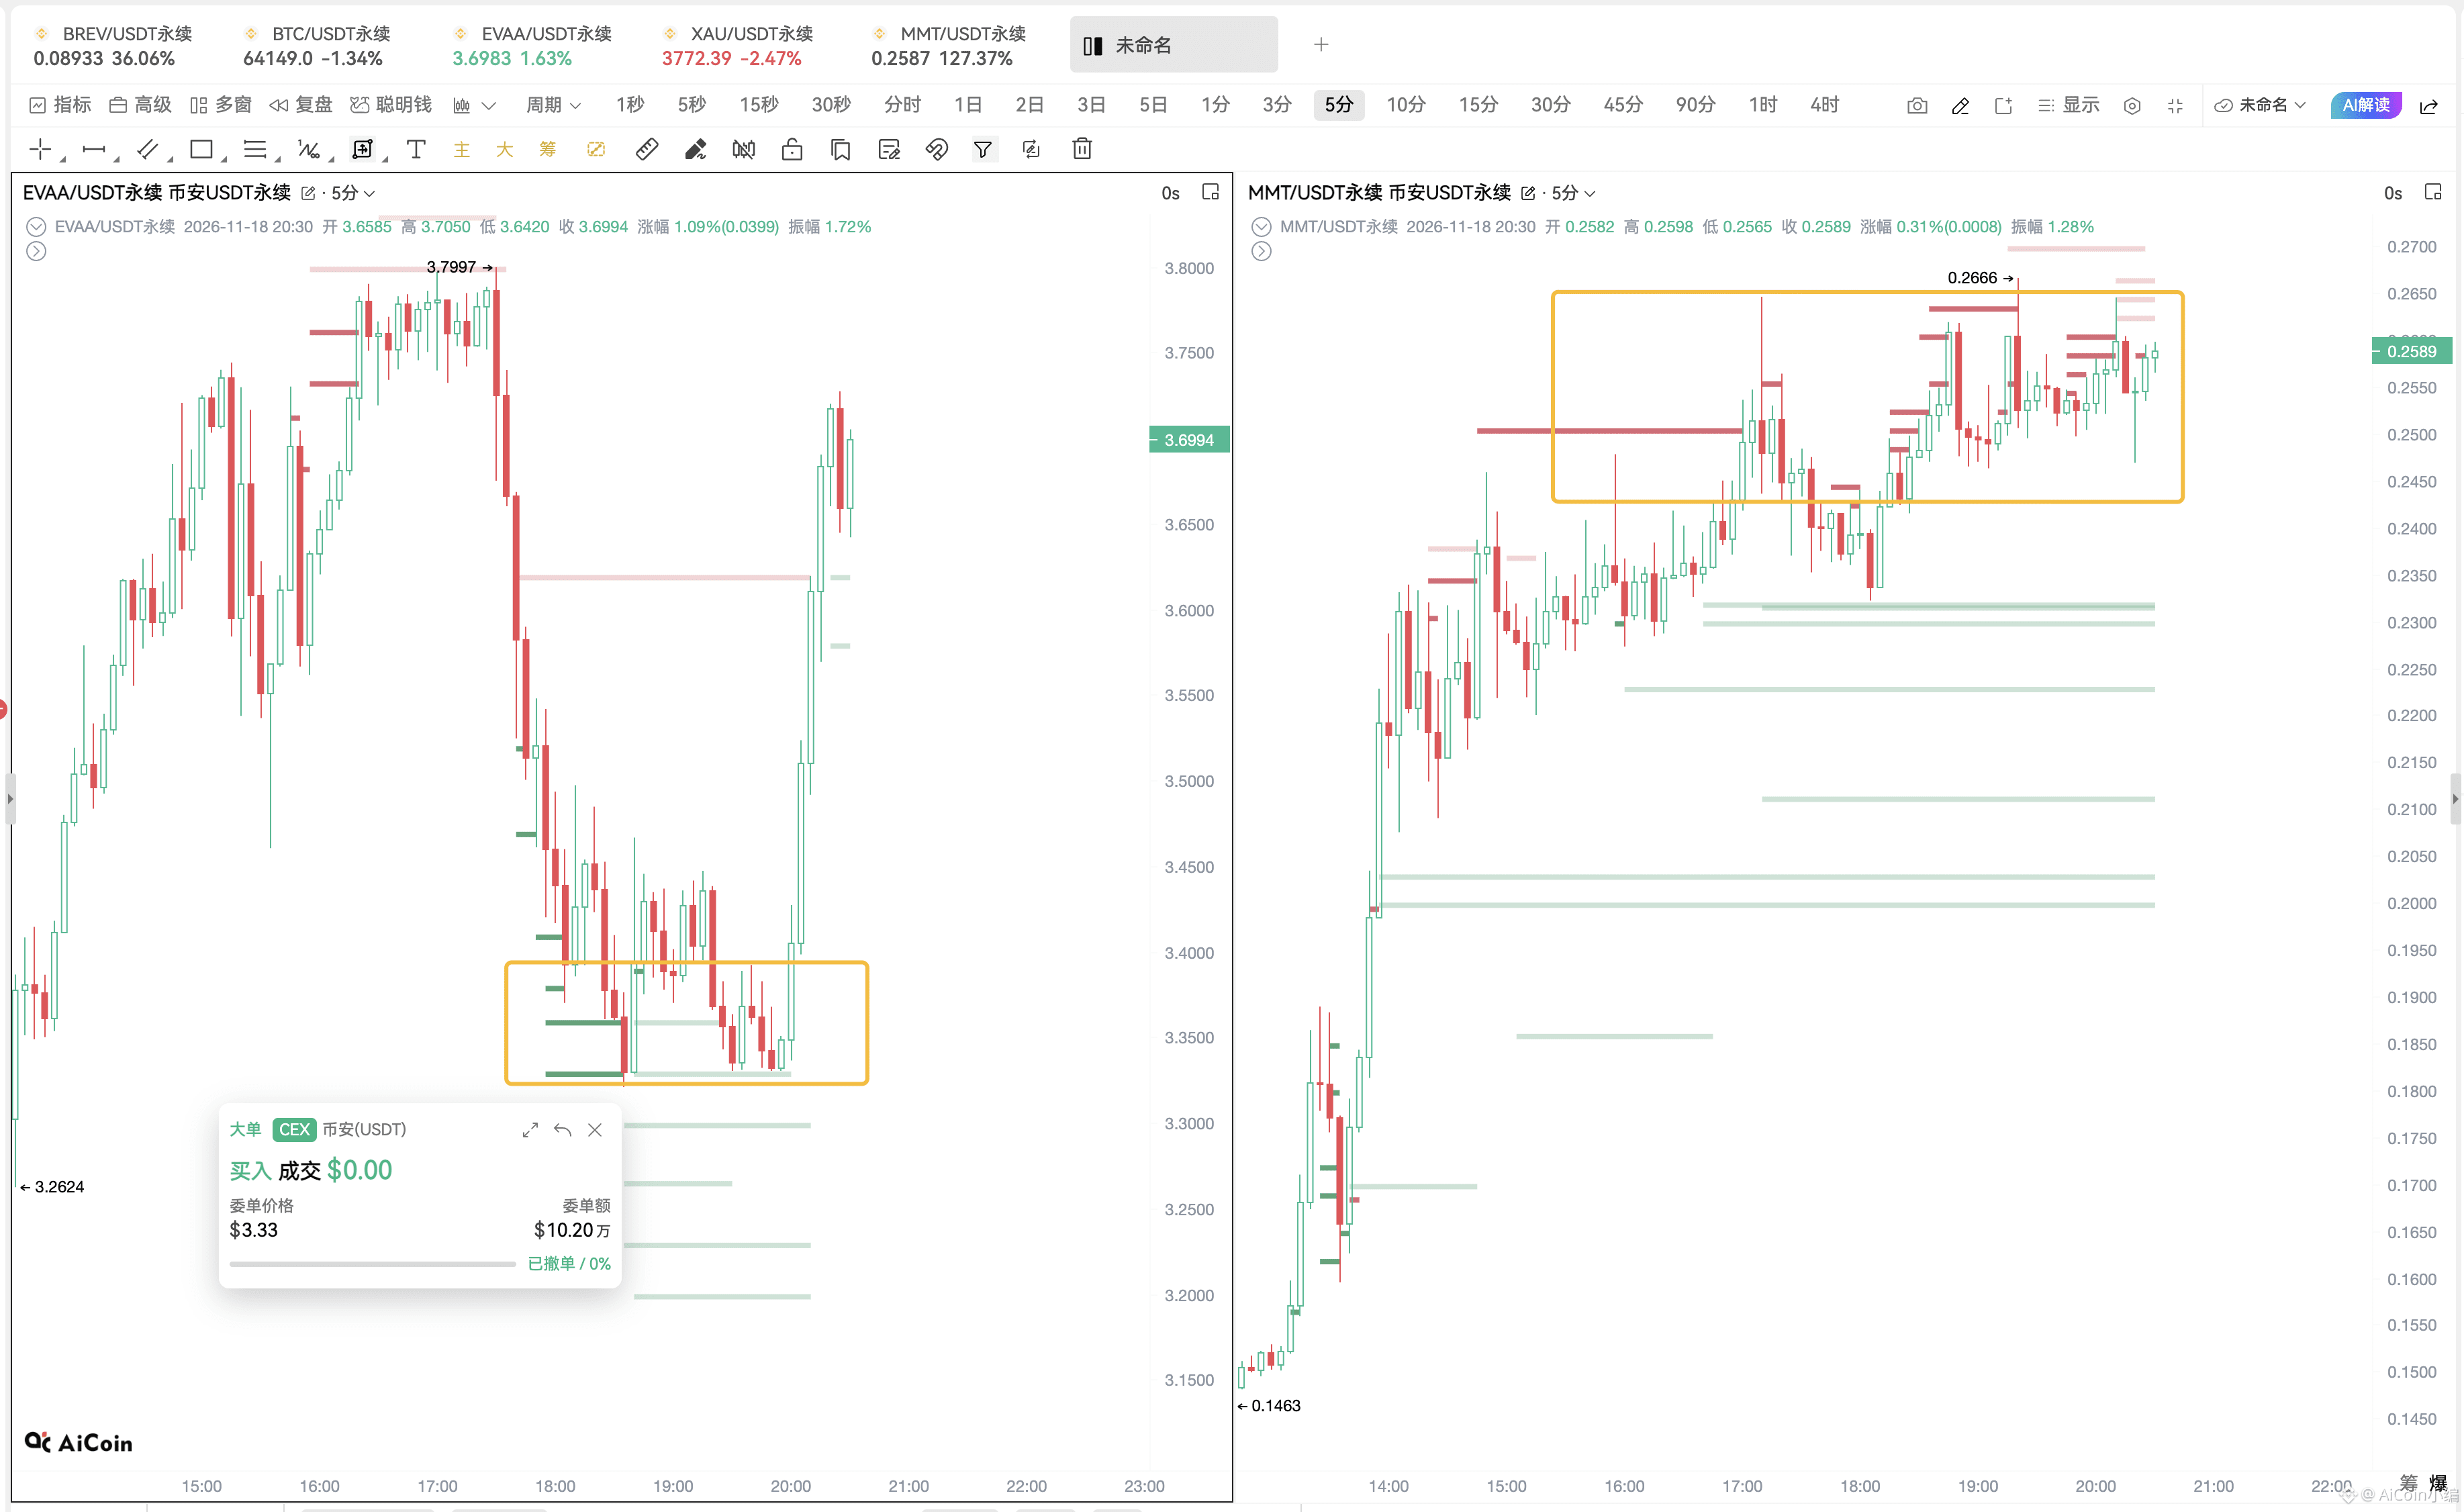
$EVAA has large buy orders providing support. I kept waiting for confirmation of buying pressure in the evening, but it shot up while I was having dinner 😅. Now waiting for buy orders around 3.62–3.54~
$MMT : Large orders closing long positions keep getting filled near the current price—the big players are taking profits. I’ll wait for a confirmed breakout above 2.66 before considering it.
$EVAA has large buy orders providing support. I kept waiting for confirmation of buying pressure in the evening, but it shot up while I was having dinner 😅. Now waiting for buy orders around 3.62–3.54~
$MMT : Large orders closing long positions keep getting filled near the current price—the big players are taking profits. I’ll wait for a confirmed breakout above 2.66 before considering it.
$MMT : Large orders closing long positions keep getting filled near the current price—the big players are taking profits. I’ll wait for a confirmed breakout above 2.66 before considering it.
1.4k
·
--
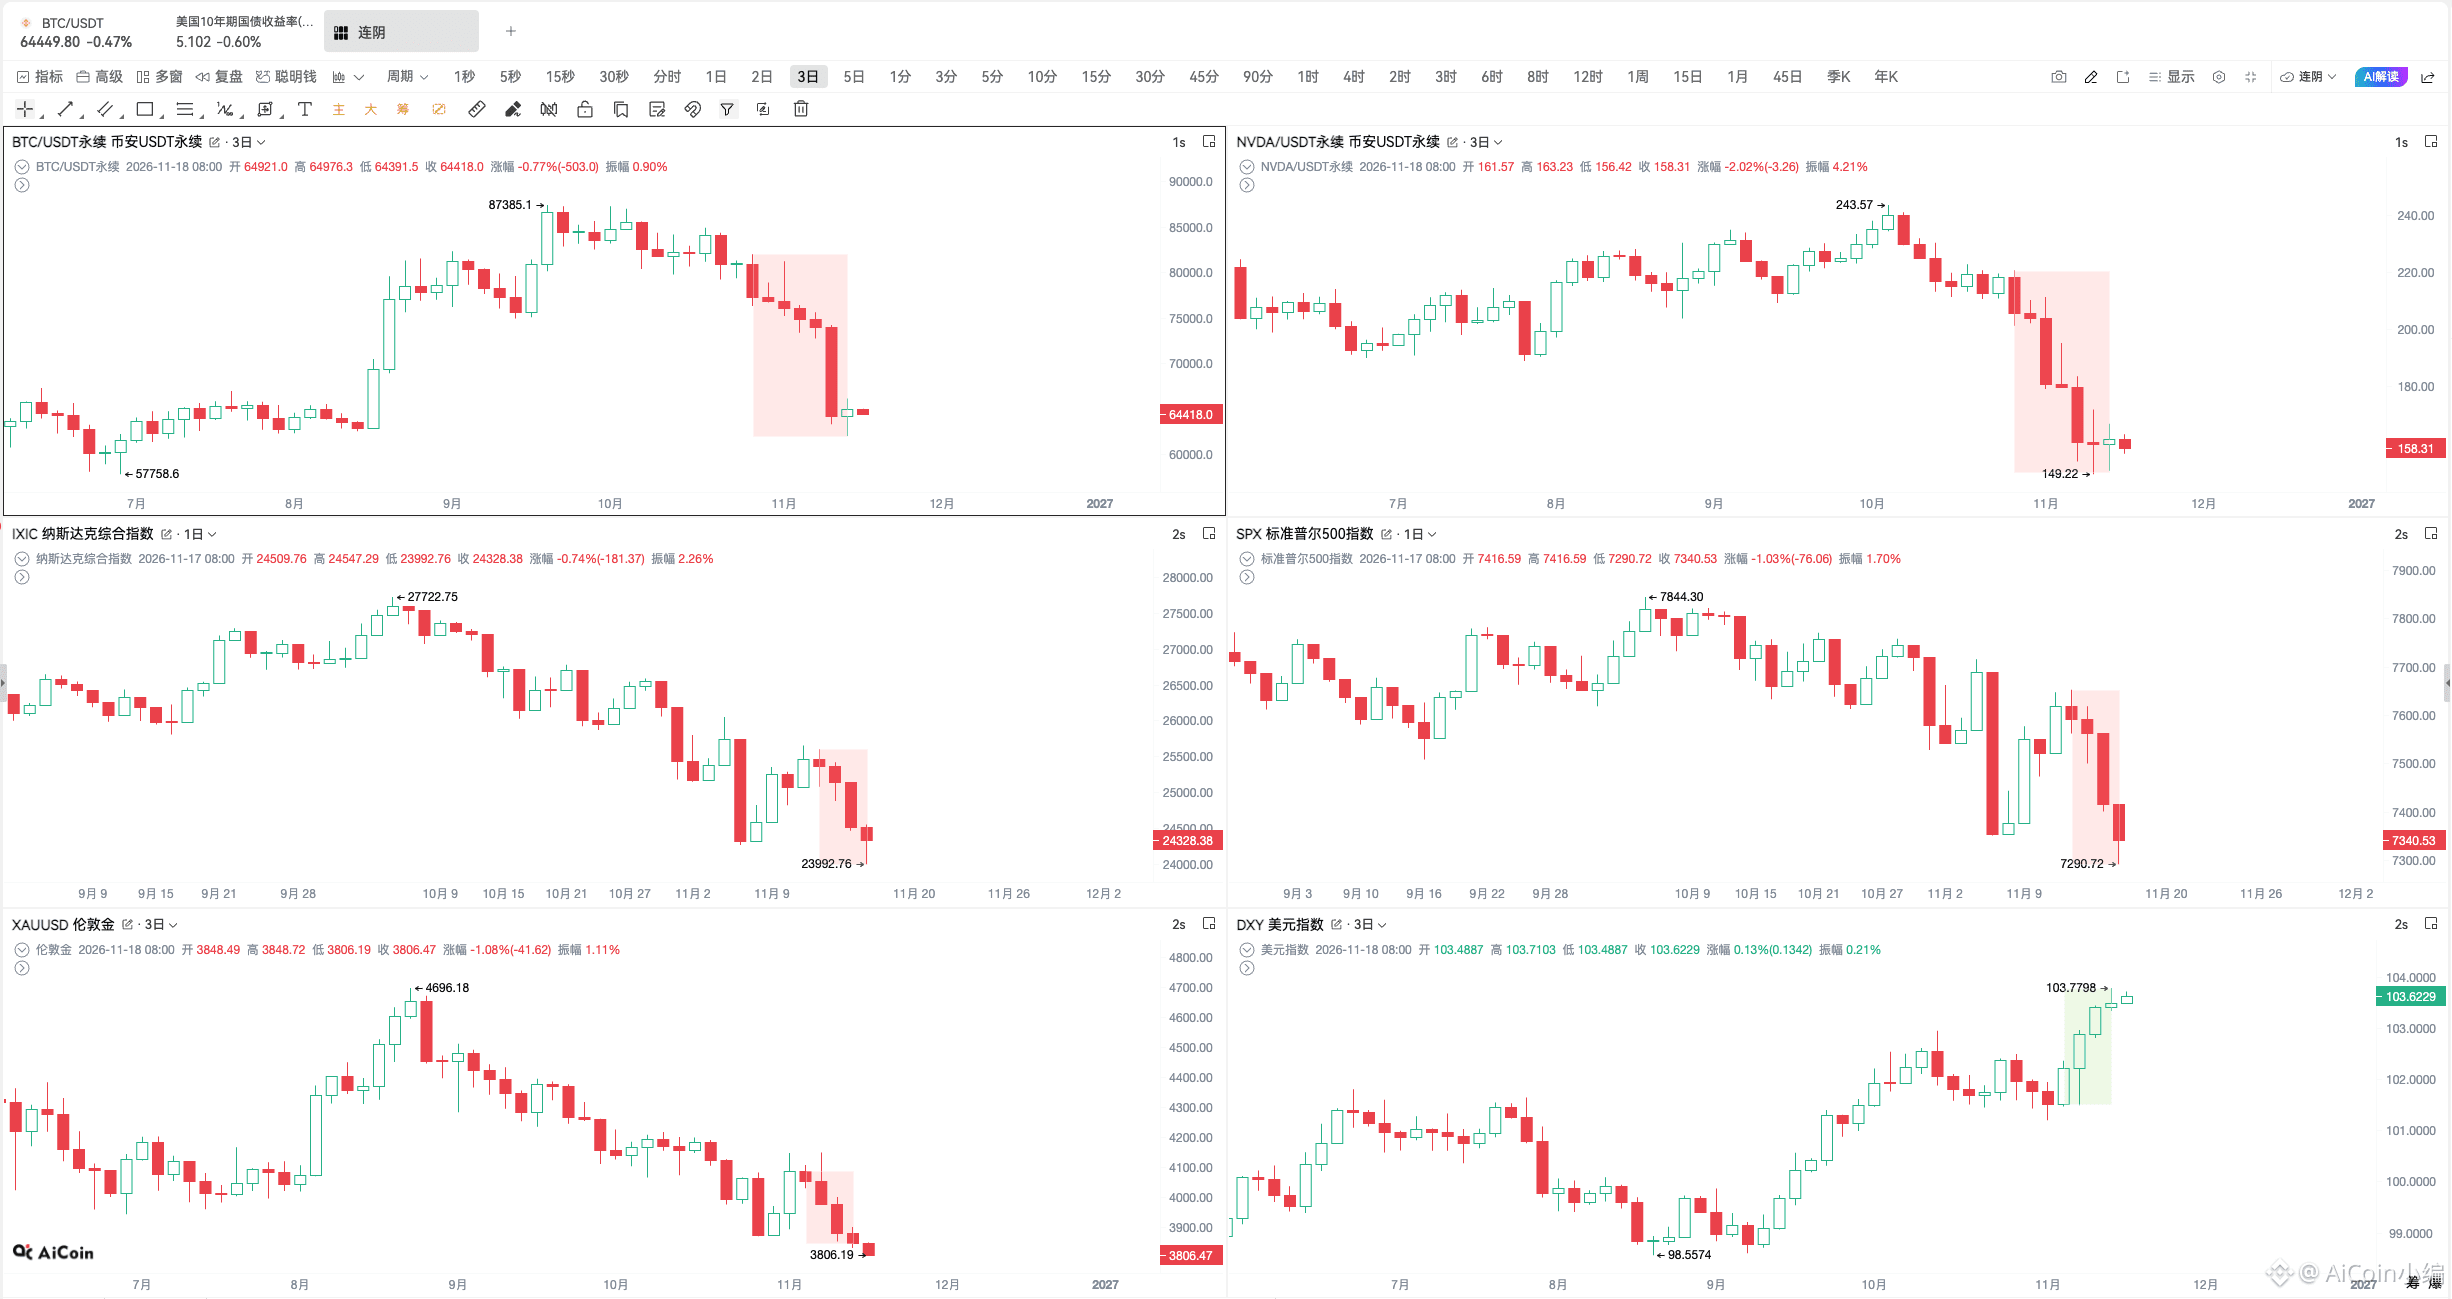
$BTC , $NVDA ended a 6-candle losing streak on the 3-day chart 🤩
BTC first swept down through the $63,860–$63,630 long liquidation zone last night, then rebounded.
NVDA, meanwhile, got a boost from its earnings report.
- Revenue: $115.8 billion, about 6% above expectations;
- Data center: $107.6 billion, about 5.6% above expectations;
- EPS: $2.68, about 8.5% above expectations;
- Q4 guidance: $130 billion, about 4% above expectations.
But the broader market still hasn't turned around. 🥲
The Nasdaq and S&P 500 are now on 4-day losing streaks on the daily chart, and London gold is also on a 4-candle losing streak on the 3-day chart.
So last night's move looked more like a brief breather for the two assets that had fallen hardest recently. Risk appetite hasn't really returned yet.
BTC is still on a 6-week losing streak on the weekly chart.
If it can close the week back in the green, that would carry more weight than ending its 6-candle losing streak on the 3-day chart last night.
Note: NVDA data is based on the Binance NVDA/USDT perpetual contract, not U.S. stock spot prices.
$BTC , $NVDA ended a 6-candle losing streak on the 3-day chart 🤩
BTC first swept down through the $63,860–$63,630 long liquidation zone last night, then rebounded.
NVDA, meanwhile, got a boost from its earnings report.
- Revenue: $115.8 billion, about 6% above expectations;
- Data center: $107.6 billion, about 5.6% above expectations;
- EPS: $2.68, about 8.5% above expectations;
- Q4 guidance: $130 billion, about 4% above expectations.
But the broader market still hasn't turned around. 🥲
The Nasdaq and S&P 500 are now on 4-day losing streaks on the daily chart, and London gold is also on a 4-candle losing streak on the 3-day chart.
So last night's move looked more like a brief breather for the two assets that had fallen hardest recently. Risk appetite hasn't really returned yet.
BTC is still on a 6-week losing streak on the weekly chart.
If it can close the week back in the green, that would carry more weight than ending its 6-candle losing streak on the 3-day chart last night.
Note: NVDA data is based on the Binance NVDA/USDT perpetual contract, not U.S. stock spot prices.
BTC first swept down through the $63,860–$63,630 long liquidation zone last night, then rebounded.
NVDA, meanwhile, got a boost from its earnings report.
- Revenue: $115.8 billion, about 6% above expectations;
- Data center: $107.6 billion, about 5.6% above expectations;
- EPS: $2.68, about 8.5% above expectations;
- Q4 guidance: $130 billion, about 4% above expectations.
But the broader market still hasn't turned around. 🥲
The Nasdaq and S&P 500 are now on 4-day losing streaks on the daily chart, and London gold is also on a 4-candle losing streak on the 3-day chart.
So last night's move looked more like a brief breather for the two assets that had fallen hardest recently. Risk appetite hasn't really returned yet.
BTC is still on a 6-week losing streak on the weekly chart.
If it can close the week back in the green, that would carry more weight than ending its 6-candle losing streak on the 3-day chart last night.
Note: NVDA data is based on the Binance NVDA/USDT perpetual contract, not U.S. stock spot prices.
432
·
--
Bullish
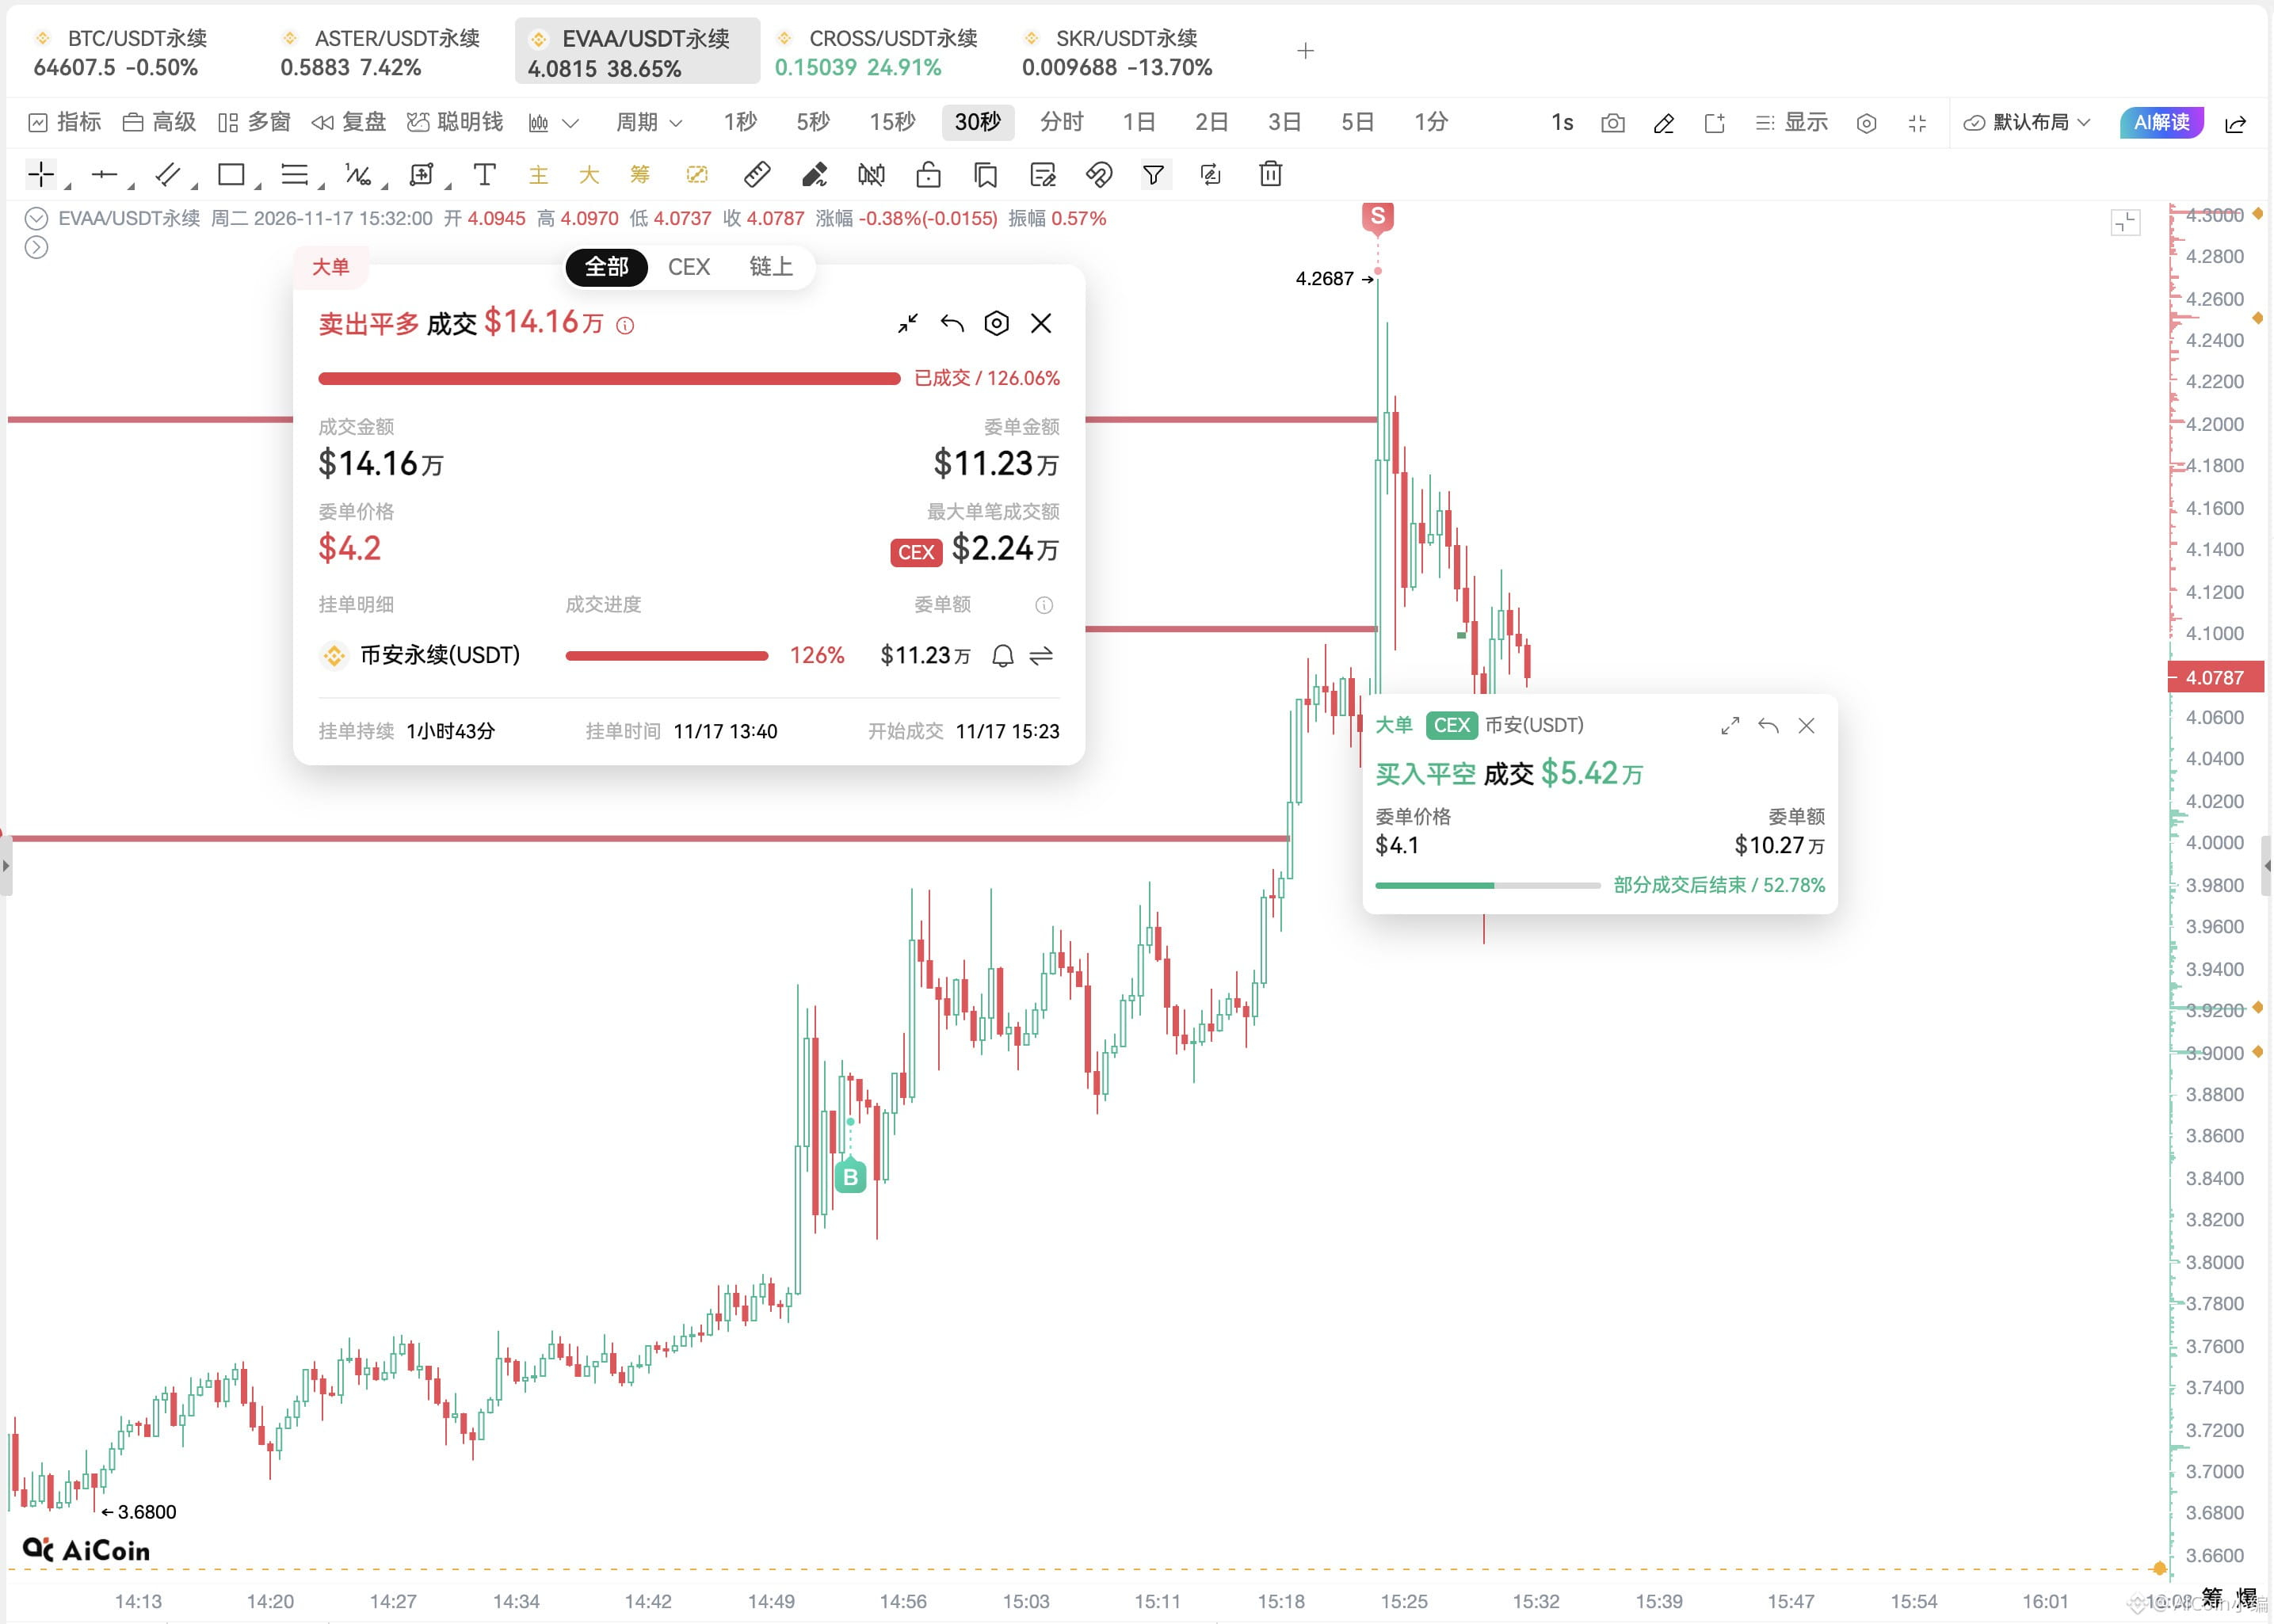
For a short-term trade, I chased a move following the large limit order $EVAA . Canceled, canceled—the sell order was filled, and the buy-side support didn't come through either. I'll wait for a pullback confirmation.
For a short-term trade, I chased a move following the large limit order $EVAA . Canceled, canceled—the sell order was filled, and the buy-side support didn't come through either. I'll wait for a pullback confirmation.
284
·
--
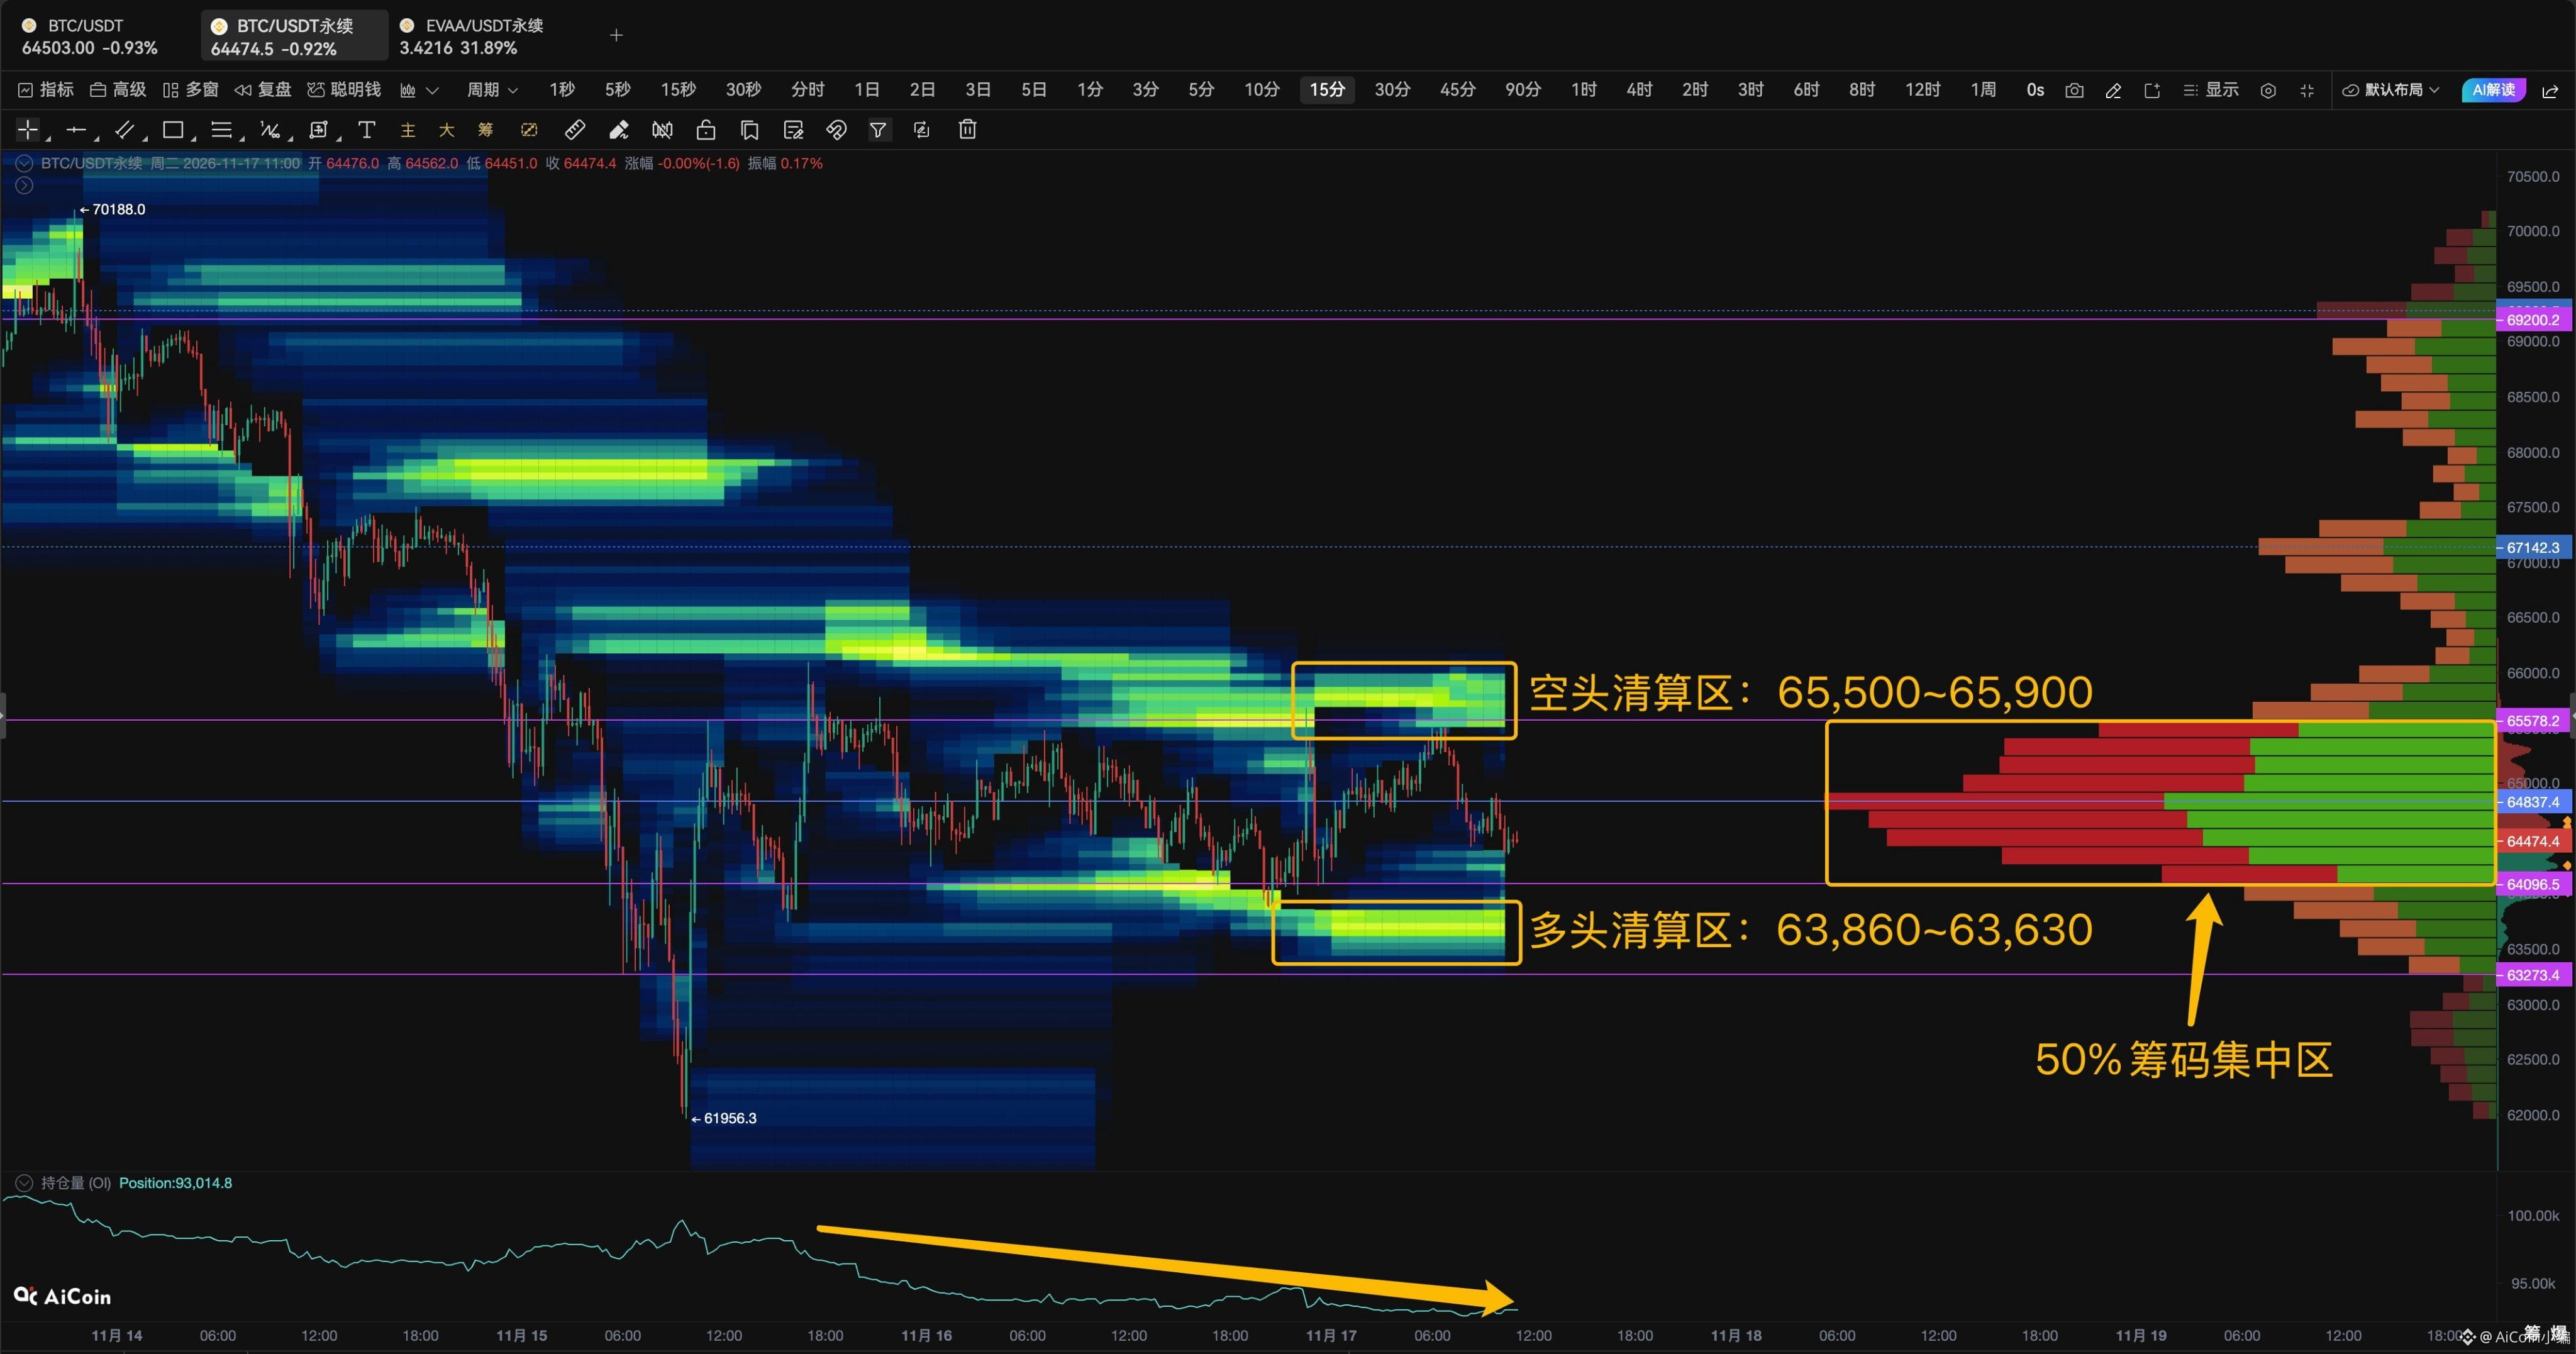
$BTC The main things to watch over the past two days are OI and the value area on the heatmap 👀
OI has continued to decline, with positions in the derivatives market steadily shrinking, but the price has never moved outside the value area.
This means leverage is still being flushed out, but so far, it hasn’t escalated into a price imbalance.
Looking at the liquidation heatmap, liquidity is concentrated right around both sides of the value area:
🔺 Above 65,500–65,900: short liquidation zone + upper edge of the value area
🔻 Below 63,860–63,630: long liquidation zone + lower edge of the value area
These two ranges are essentially the most important liquidity zones for the short term. Whichever side first moves out of the value area is more likely to accelerate, fueled by liquidation liquidity.
$BTC The main things to watch over the past two days are OI and the value area on the heatmap 👀
OI has continued to decline, with positions in the derivatives market steadily shrinking, but the price has never moved outside the value area.
This means leverage is still being flushed out, but so far, it hasn’t escalated into a price imbalance.
Looking at the liquidation heatmap, liquidity is concentrated right around both sides of the value area:
🔺 Above 65,500–65,900: short liquidation zone + upper edge of the value area
🔻 Below 63,860–63,630: long liquidation zone + lower edge of the value area
These two ranges are essentially the most important liquidity zones for the short term. Whichever side first moves out of the value area is more likely to accelerate, fueled by liquidation liquidity.
OI has continued to decline, with positions in the derivatives market steadily shrinking, but the price has never moved outside the value area.
This means leverage is still being flushed out, but so far, it hasn’t escalated into a price imbalance.
Looking at the liquidation heatmap, liquidity is concentrated right around both sides of the value area:
🔺 Above 65,500–65,900: short liquidation zone + upper edge of the value area
🔻 Below 63,860–63,630: long liquidation zone + lower edge of the value area
These two ranges are essentially the most important liquidity zones for the short term. Whichever side first moves out of the value area is more likely to accelerate, fueled by liquidation liquidity.
95
·
--
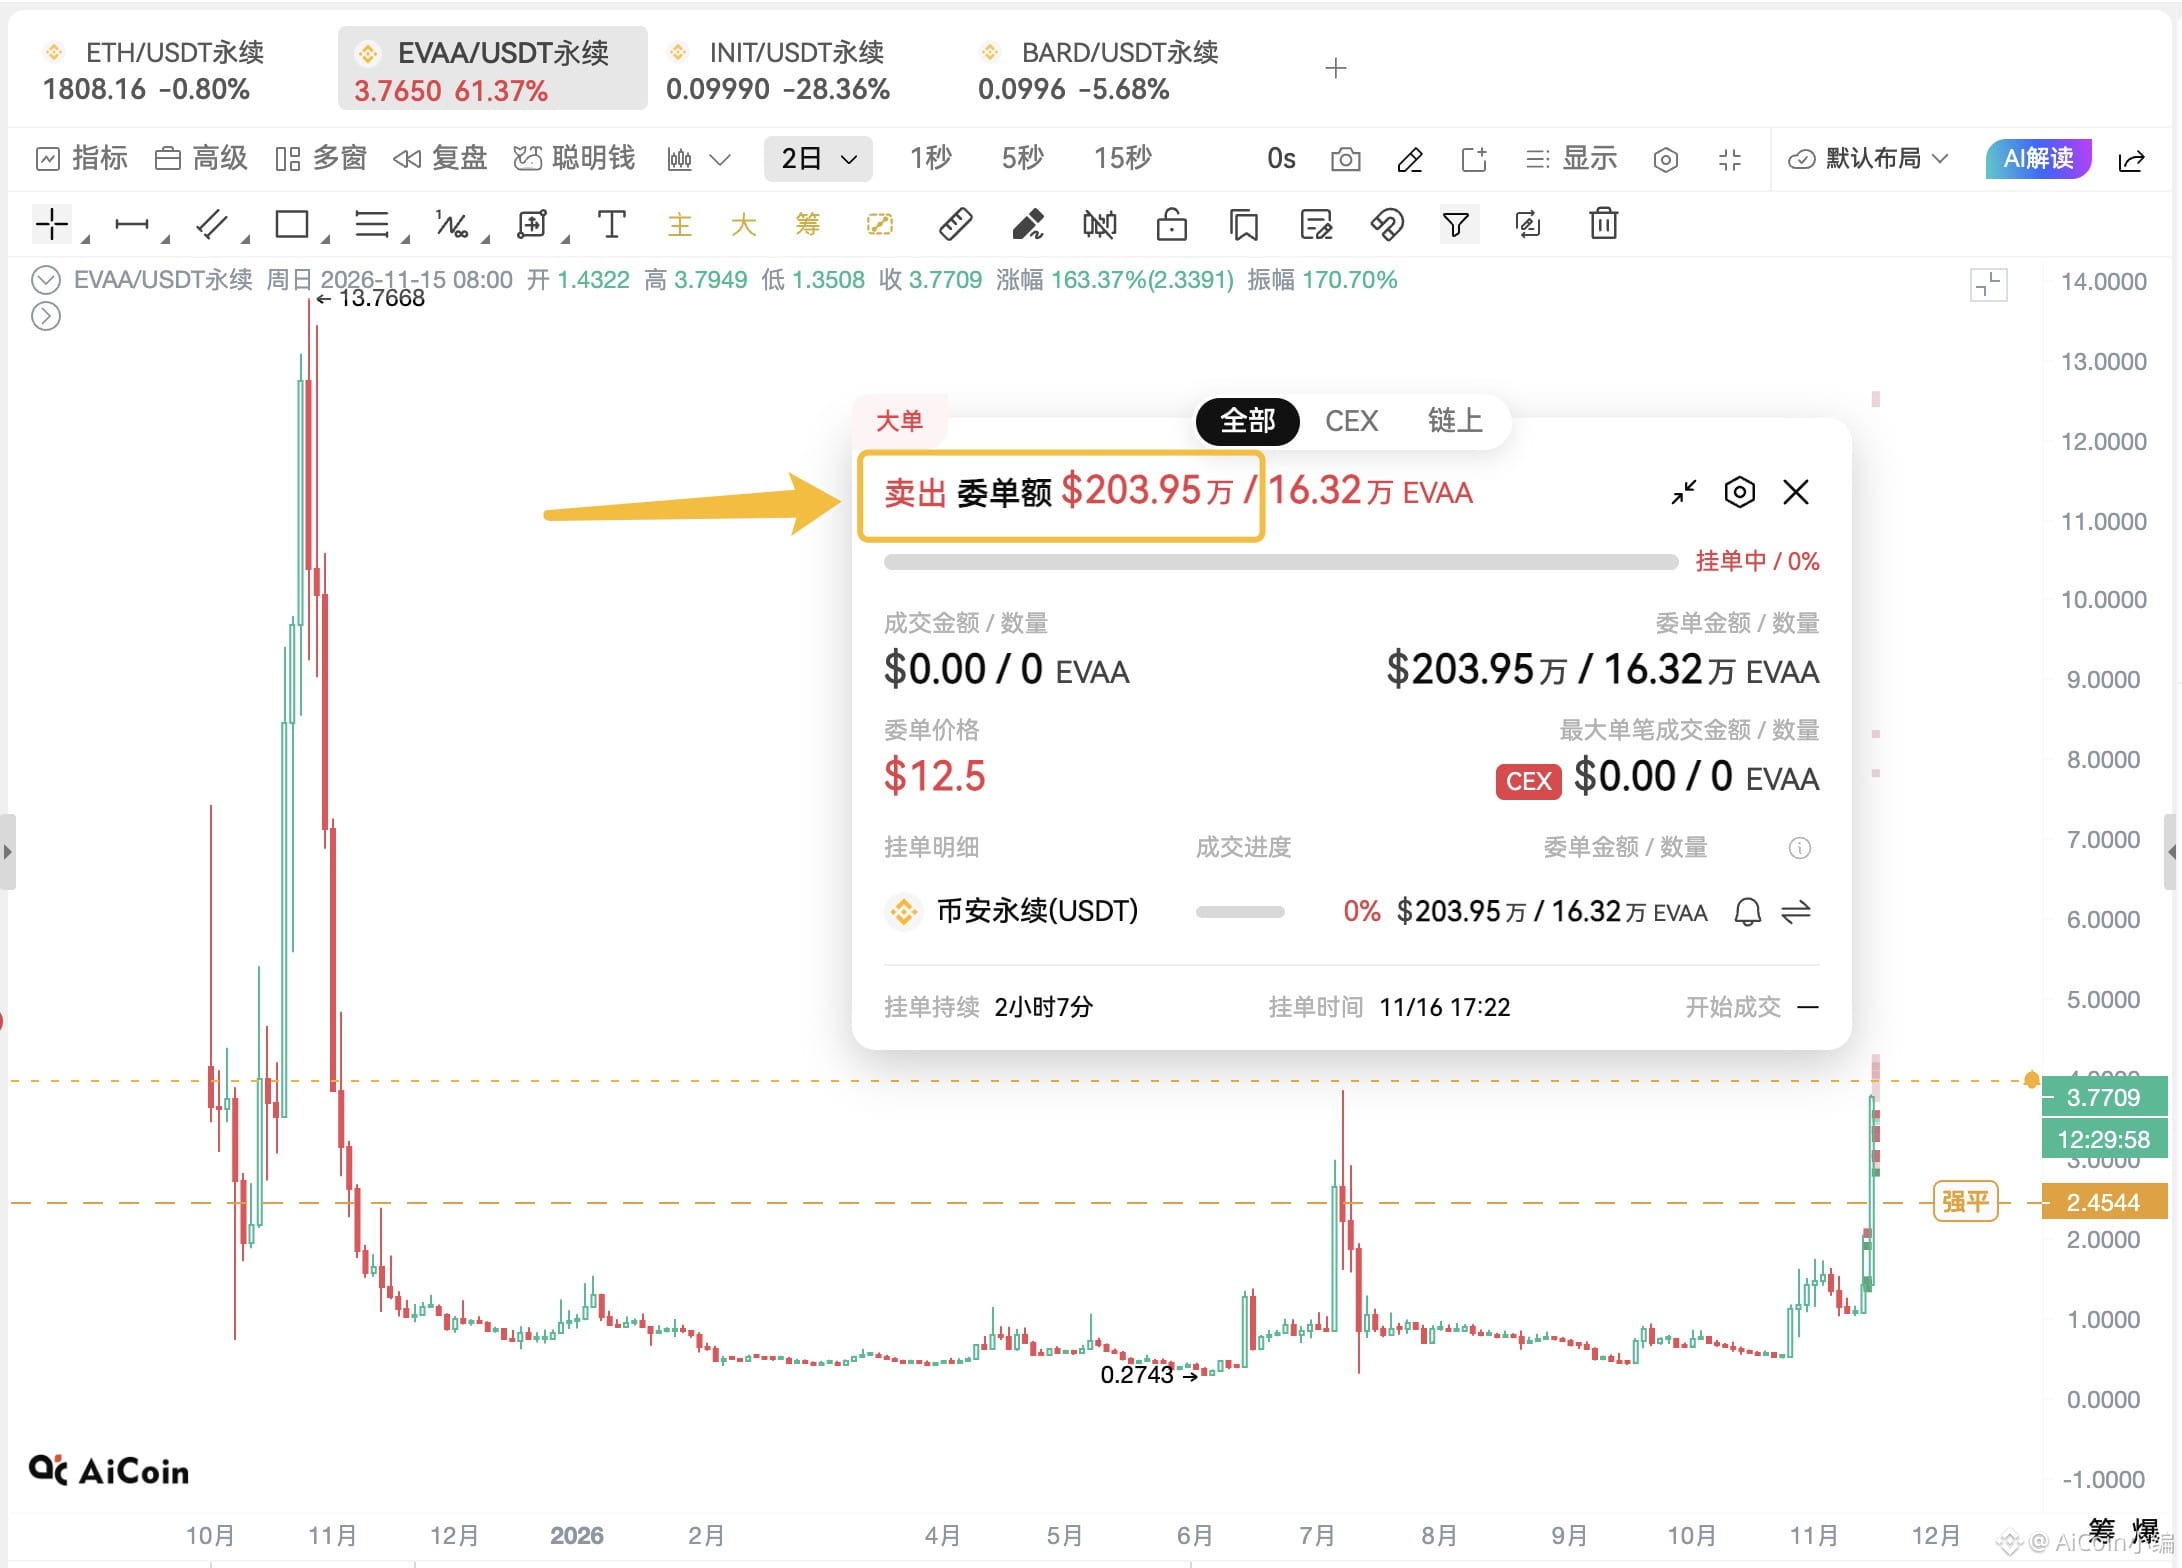
An absurd sell order worth $2.03 million appeared for $EVAA at $12.5; the price would need to rise another 230% for it to be filled
An absurd sell order worth $2.03 million appeared for $EVAA at $12.5; the price would need to rise another 230% for it to be filled
2
2.6k
·
--
Bearish
Who exactly is dumping BTC this time—$BTC ?! 🤨
No guessing institutions or whales, and no talking about OTC or split orders.
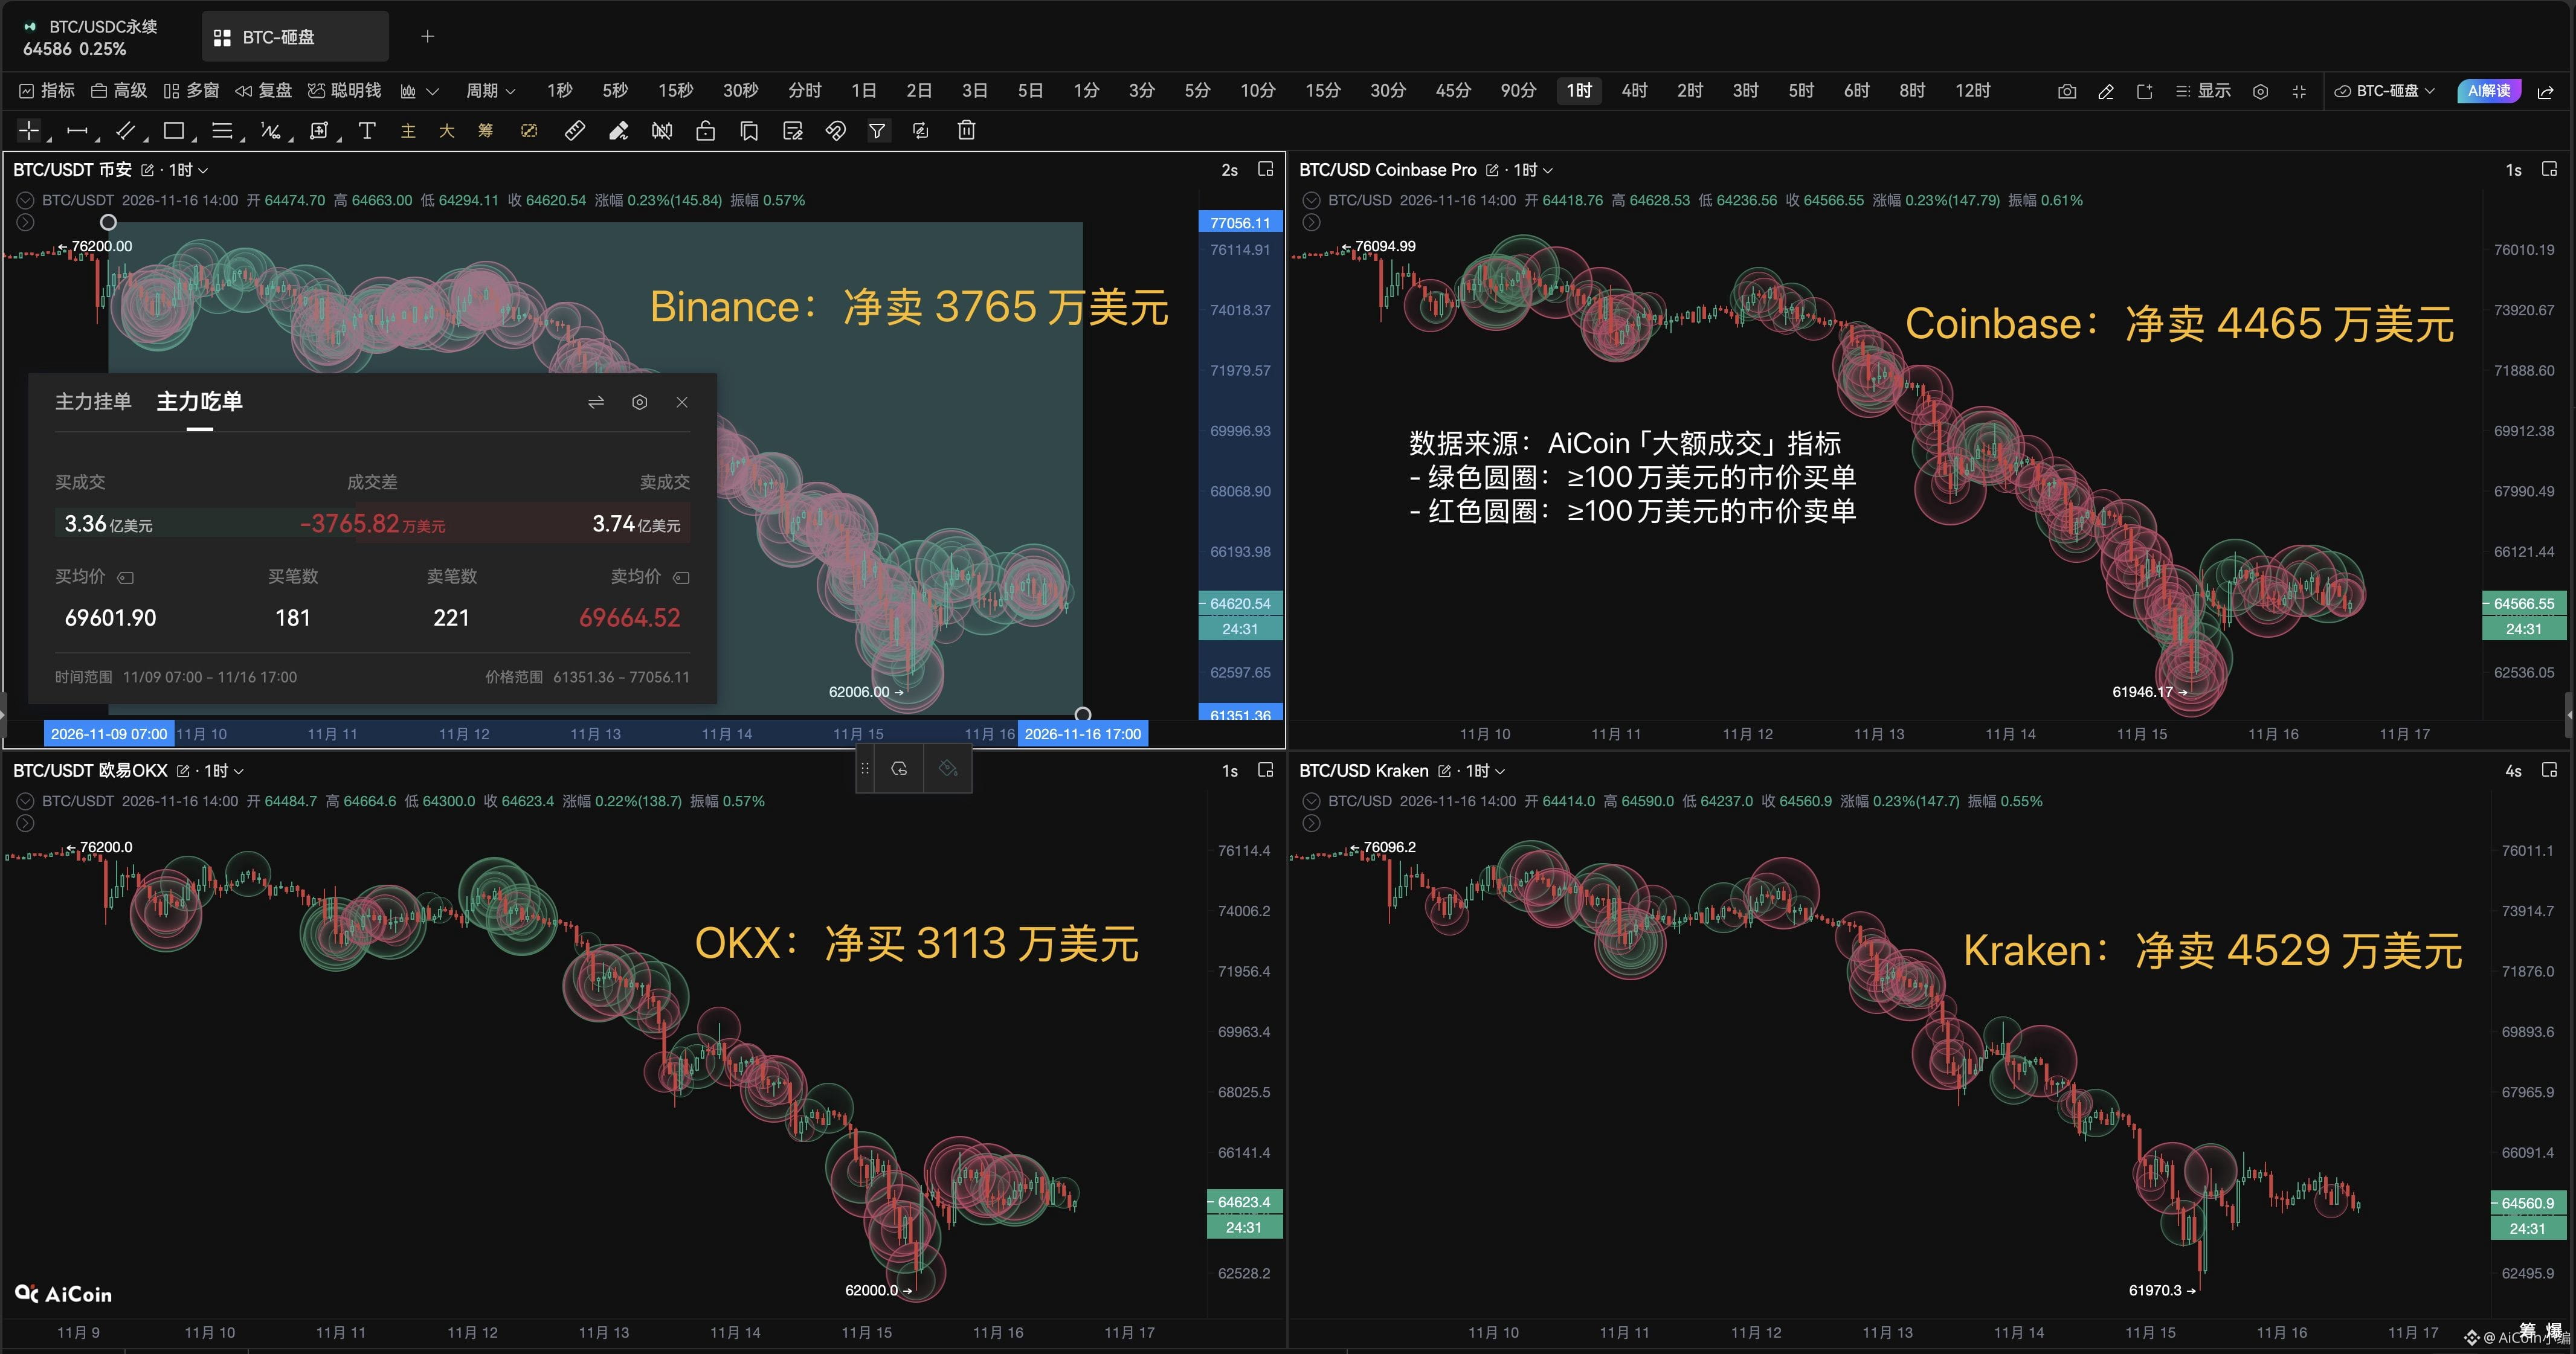
Just spot market orders of ≥$1 million over the past 7 days: 👇
- Binance: $336 million in aggressive buys, $374 million in aggressive sells, net sells of $37.65 million
- Coinbase: $185 million in aggressive buys, $230 million in aggressive sells, net sells of $44.65 million
- OKX: $112 million in aggressive buys, $80.43 million in aggressive sells, net buys of $31.13 million
- Kraken: $63.14 million in aggressive buys, $108 million in aggressive sells, net sells of $45.29 million
Across the four platforms, net selling totaled nearly $100 million, and the selling pressure was spread out—not driven by a single whale unloading on one exchange.
So at least by this measure, this drop wasn’t because “there were no buyers.” Rather, large aggressive sell orders kept dominating, while truly aggressive spot buying hasn’t returned yet.
BTC has now rebounded from 61,950 to around 64,300, but futures open interest (OI) is still declining. This looks more like a sideways recovery than a return of capital to the market.
So for now, I wouldn’t call this rebound a reversal. The real signs of a shift will be:
1️⃣ Spot net buying starts to show up consistently
2️⃣ Futures OI starts rising again
Who exactly is dumping BTC this time—$BTC ?! 🤨
No guessing institutions or whales, and no talking about OTC or split orders.
Just spot market orders of ≥$1 million over the past 7 days: 👇
- Binance: $336 million in aggressive buys, $374 million in aggressive sells, net sells of $37.65 million
- Coinbase: $185 million in aggressive buys, $230 million in aggressive sells, net sells of $44.65 million
- OKX: $112 million in aggressive buys, $80.43 million in aggressive sells, net buys of $31.13 million
- Kraken: $63.14 million in aggressive buys, $108 million in aggressive sells, net sells of $45.29 million
Across the four platforms, net selling totaled nearly $100 million, and the selling pressure was spread out—not driven by a single whale unloading on one exchange.
So at least by this measure, this drop wasn’t because “there were no buyers.” Rather, large aggressive sell orders kept dominating, while truly aggressive spot buying hasn’t returned yet.
BTC has now rebounded from 61,950 to around 64,300, but futures open interest (OI) is still declining. This looks more like a sideways recovery than a return of capital to the market.
So for now, I wouldn’t call this rebound a reversal. The real signs of a shift will be:
1️⃣ Spot net buying starts to show up consistently
2️⃣ Futures OI starts rising again
No guessing institutions or whales, and no talking about OTC or split orders.
Just spot market orders of ≥$1 million over the past 7 days: 👇
- Binance: $336 million in aggressive buys, $374 million in aggressive sells, net sells of $37.65 million
- Coinbase: $185 million in aggressive buys, $230 million in aggressive sells, net sells of $44.65 million
- OKX: $112 million in aggressive buys, $80.43 million in aggressive sells, net buys of $31.13 million
- Kraken: $63.14 million in aggressive buys, $108 million in aggressive sells, net sells of $45.29 million
Across the four platforms, net selling totaled nearly $100 million, and the selling pressure was spread out—not driven by a single whale unloading on one exchange.
So at least by this measure, this drop wasn’t because “there were no buyers.” Rather, large aggressive sell orders kept dominating, while truly aggressive spot buying hasn’t returned yet.
BTC has now rebounded from 61,950 to around 64,300, but futures open interest (OI) is still declining. This looks more like a sideways recovery than a return of capital to the market.
So for now, I wouldn’t call this rebound a reversal. The real signs of a shift will be:
1️⃣ Spot net buying starts to show up consistently
2️⃣ Futures OI starts rising again
171
·
--
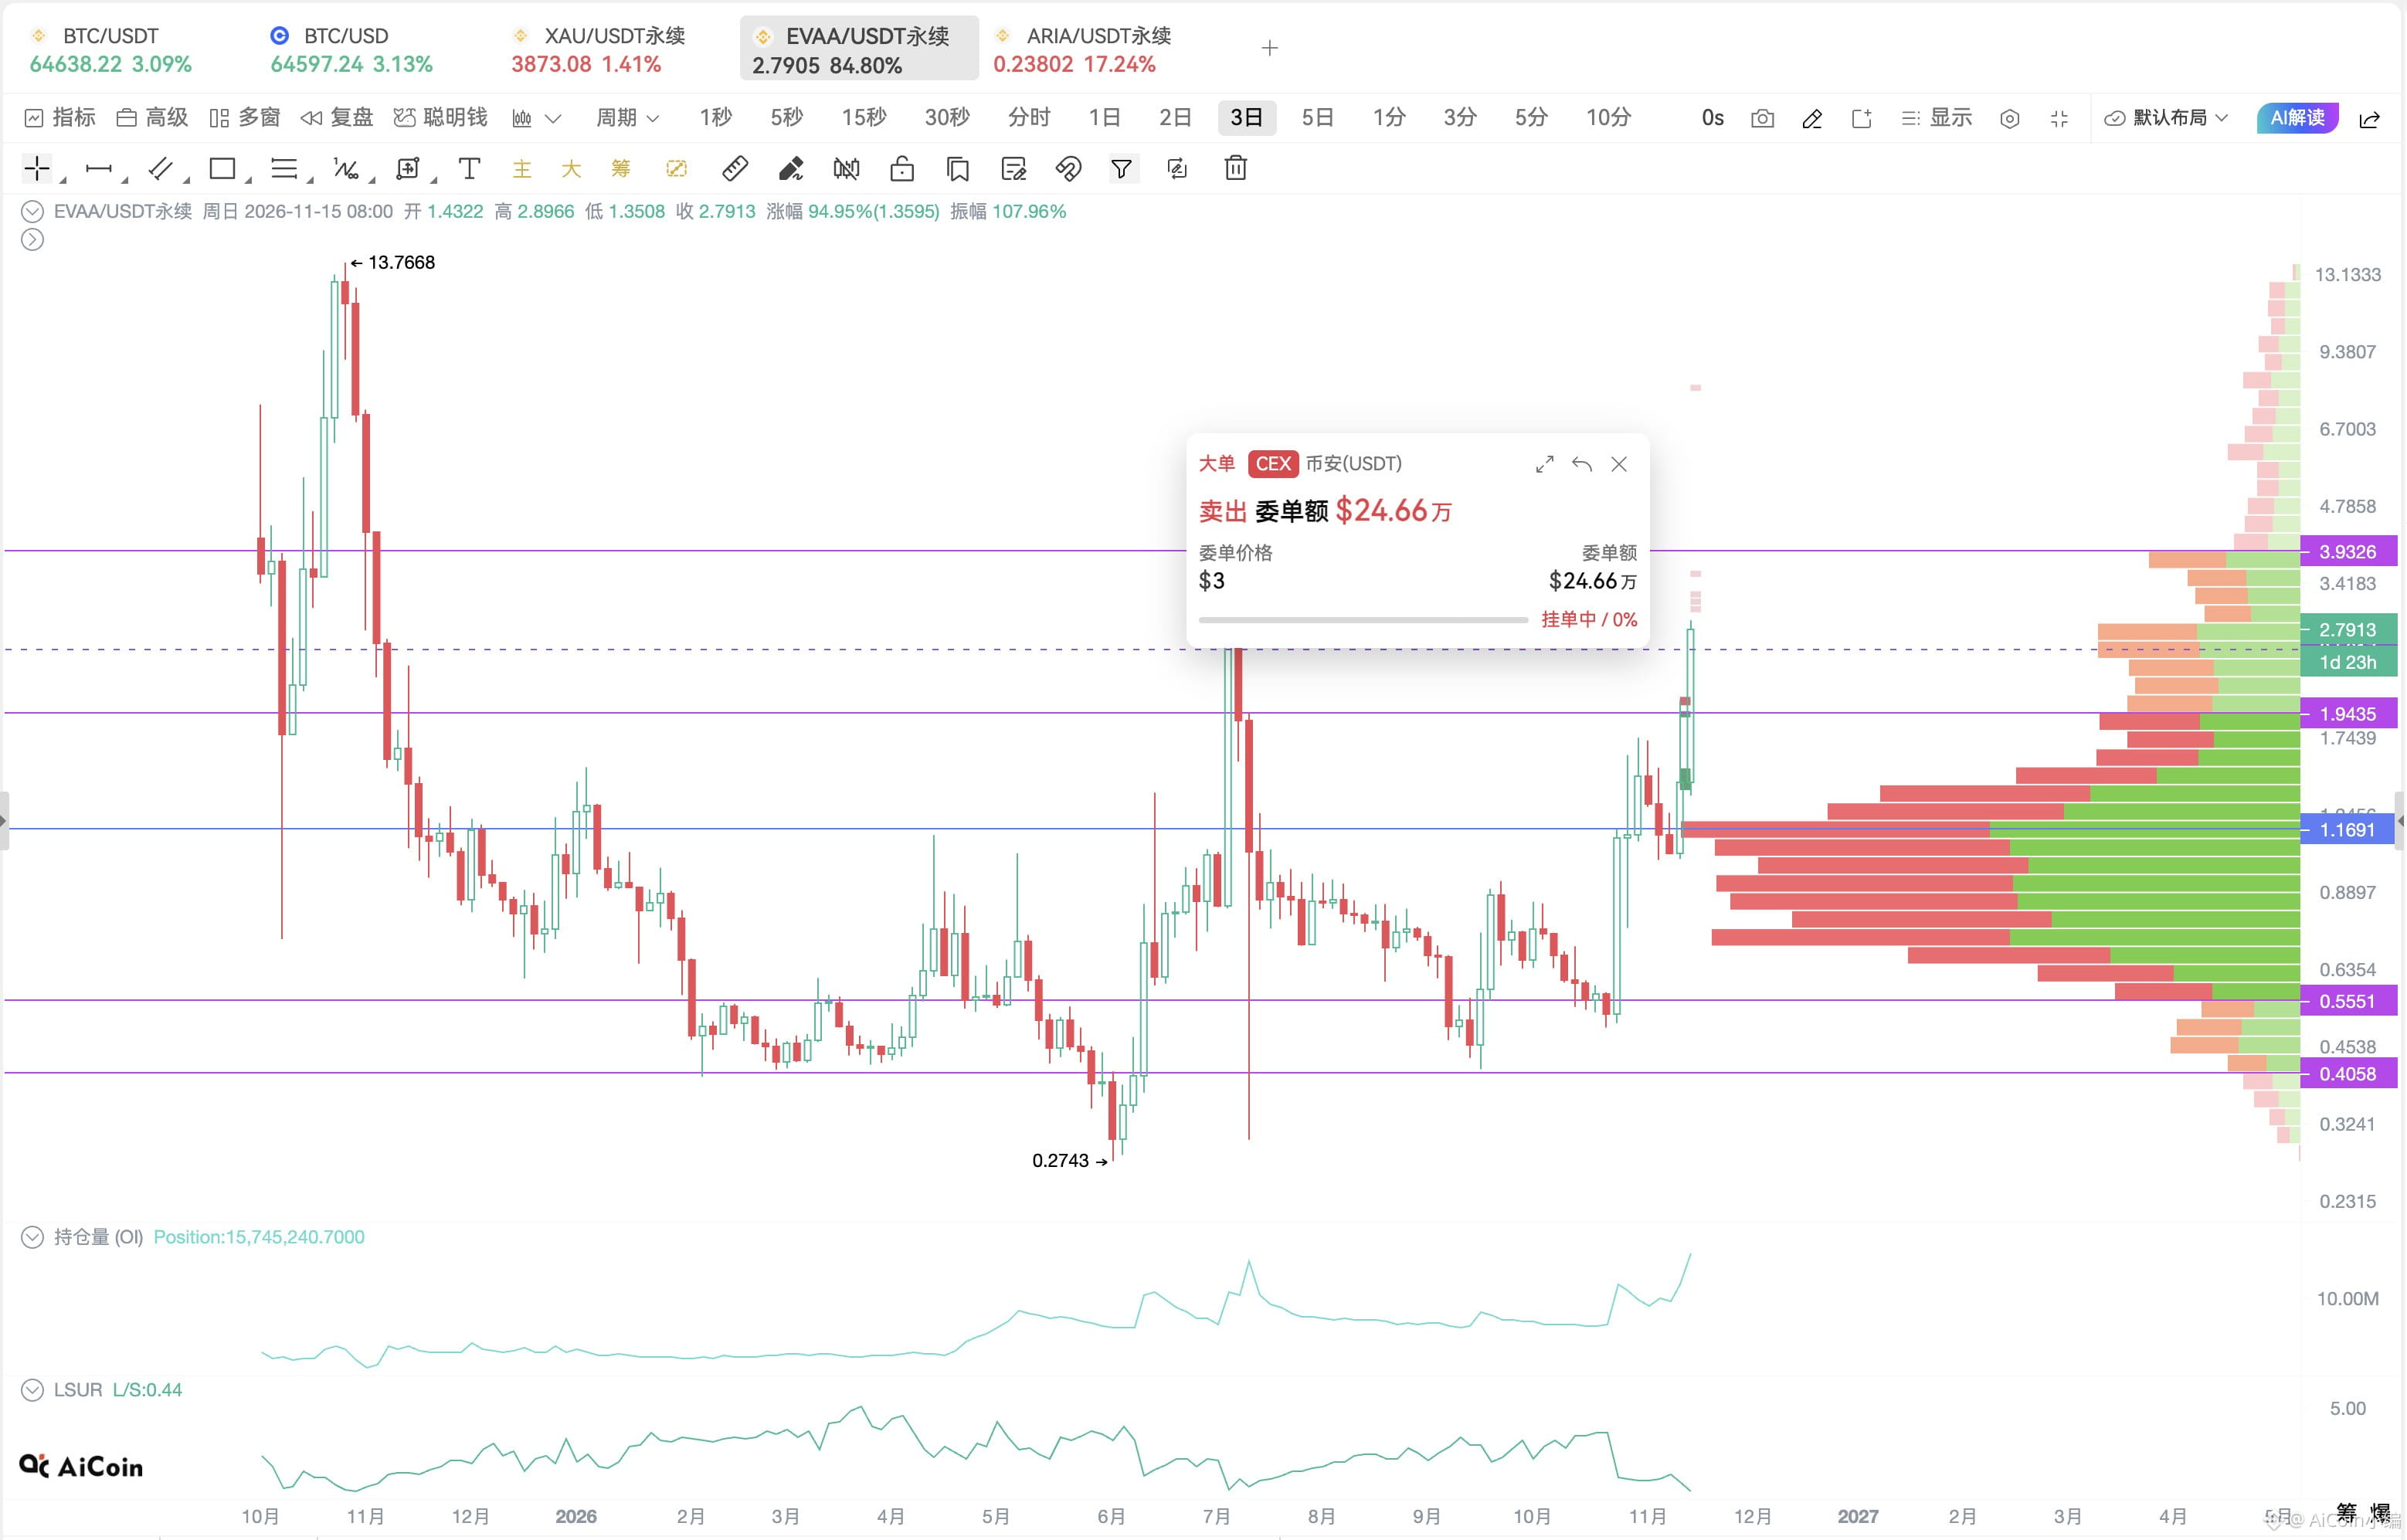
$EVAA surged nearly 5x in three weeks, then climbed another 85%+ in 24h—but the real test is only just beginning.
The price is now around $2.8, with large sell orders appearing above at $3–$3.5.
This rally has made it this far on more than just sentiment:
- 24h trading volume: $755 million
- Turnover rate: 5,090%
- Open interest rose to $62.24 million, up 24% in 24h
- Net inflows: approximately $25.75 million
High turnover means tokens are changing hands rapidly, while the simultaneous rise in OI indicates that new leveraged funds are still entering the market.
And that's where the problem lies.
EVAA's current TVL is only $6.7–$6.9 million, so the protocol's fundamentals haven't expanded in step with the token price.
That means this rally is still being driven more by capital flows than by fundamentals.
Next, watch the $3–$3.5 range:
- If the sell orders keep getting filled but the price holds, the bullish structure remains intact;
- If OI keeps rising after a push higher but the price can't break through, be wary of a round of deleveraging at elevated levels.
$EVAA surged nearly 5x in three weeks, then climbed another 85%+ in 24h—but the real test is only just beginning.
The price is now around $2.8, with large sell orders appearing above at $3–$3.5.
This rally has made it this far on more than just sentiment:
- 24h trading volume: $755 million
- Turnover rate: 5,090%
- Open interest rose to $62.24 million, up 24% in 24h
- Net inflows: approximately $25.75 million
High turnover means tokens are changing hands rapidly, while the simultaneous rise in OI indicates that new leveraged funds are still entering the market.
And that's where the problem lies.
EVAA's current TVL is only $6.7–$6.9 million, so the protocol's fundamentals haven't expanded in step with the token price.
That means this rally is still being driven more by capital flows than by fundamentals.
Next, watch the $3–$3.5 range:
- If the sell orders keep getting filled but the price holds, the bullish structure remains intact;
- If OI keeps rising after a push higher but the price can't break through, be wary of a round of deleveraging at elevated levels.
The price is now around $2.8, with large sell orders appearing above at $3–$3.5.
This rally has made it this far on more than just sentiment:
- 24h trading volume: $755 million
- Turnover rate: 5,090%
- Open interest rose to $62.24 million, up 24% in 24h
- Net inflows: approximately $25.75 million
High turnover means tokens are changing hands rapidly, while the simultaneous rise in OI indicates that new leveraged funds are still entering the market.
And that's where the problem lies.
EVAA's current TVL is only $6.7–$6.9 million, so the protocol's fundamentals haven't expanded in step with the token price.
That means this rally is still being driven more by capital flows than by fundamentals.
Next, watch the $3–$3.5 range:
- If the sell orders keep getting filled but the price holds, the bullish structure remains intact;
- If OI keeps rising after a push higher but the price can't break through, be wary of a round of deleveraging at elevated levels.
90
·
--
$130 million in unrealized profits isn’t all—Abraxas has also pocketed $28 million in funding fees
🤩🤩
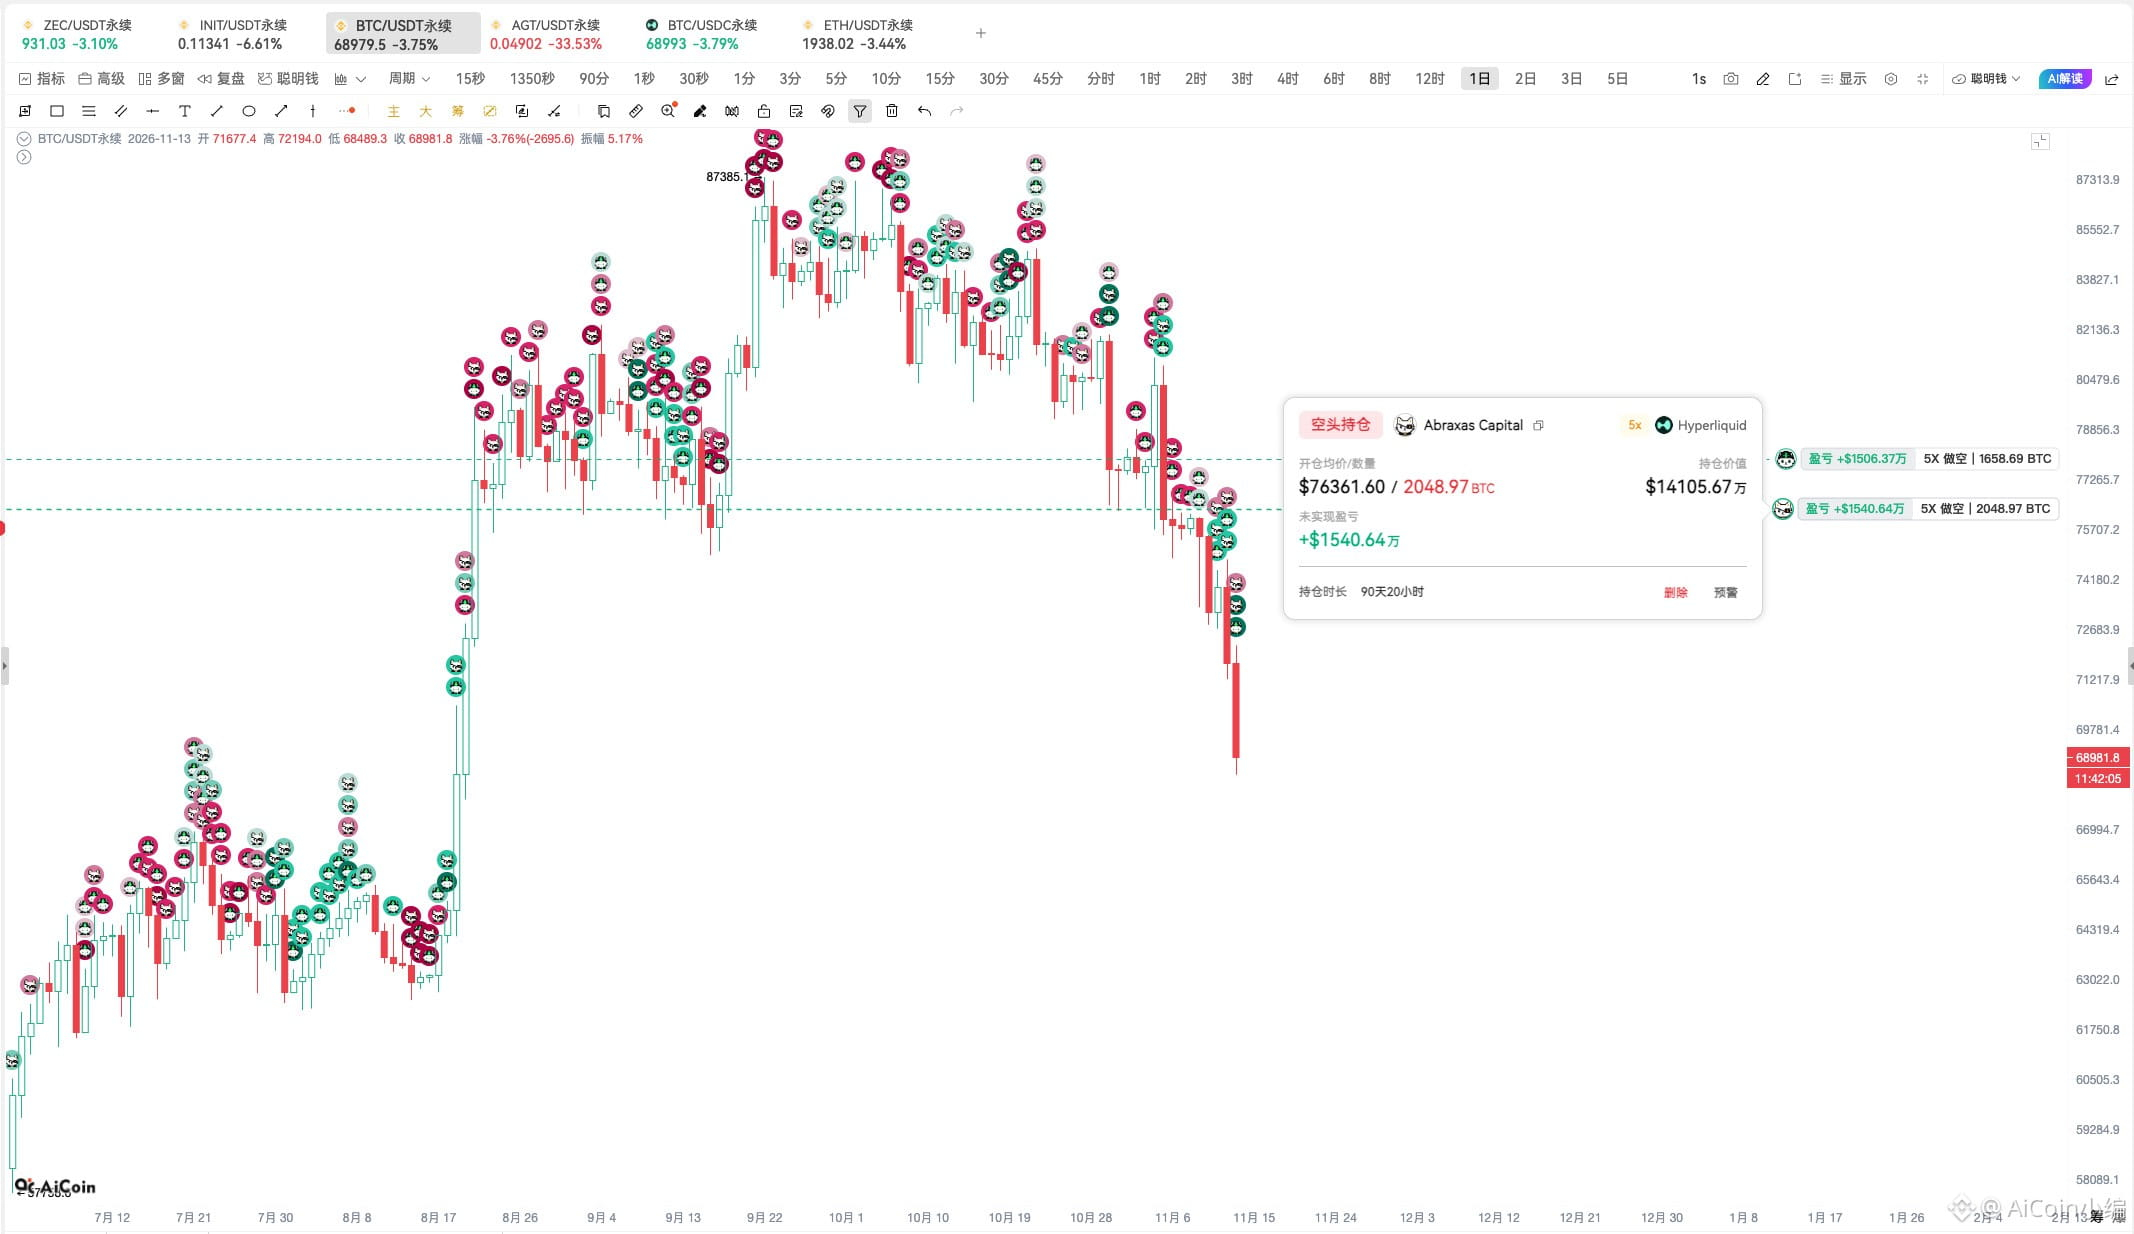
After BTC fell below $70,000, the short positions held by two addresses linked to hedge fund Abraxas Capital continued to grow more profitable. They now hold a combined short position worth about $697 million, with $130 million in unrealized profits.
A few key positions: 👇
- $BTC : short position of about $257 million, $28.93 million in unrealized profits, $7.51 million in funding fees
- HYPE: short position of about $108 million, $5.78 million in unrealized profits, $13.93 million in funding fees
- $ZEC : short position of about $80.1 million, $40.03 million in unrealized profits, $1.62 million in funding fees
- $ETH : a short position of about $64.35 million in a single address, $11.96 million in unrealized profits, $4.87 million in funding fees
Just these four positions have already generated $27.93 million in funding fees.
Most remarkable is HYPE, where funding fee income is already 2.4 times the current unrealized profit.
Abraxas is really having its cake and eating it too—making a killing…💵💵
$130 million in unrealized profits isn’t all—Abraxas has also pocketed $28 million in funding fees
🤩🤩
After BTC fell below $70,000, the short positions held by two addresses linked to hedge fund Abraxas Capital continued to grow more profitable. They now hold a combined short position worth about $697 million, with $130 million in unrealized profits.
A few key positions: 👇
- $BTC : short position of about $257 million, $28.93 million in unrealized profits, $7.51 million in funding fees
- HYPE: short position of about $108 million, $5.78 million in unrealized profits, $13.93 million in funding fees
- $ZEC : short position of about $80.1 million, $40.03 million in unrealized profits, $1.62 million in funding fees
- $ETH : a short position of about $64.35 million in a single address, $11.96 million in unrealized profits, $4.87 million in funding fees
Just these four positions have already generated $27.93 million in funding fees.
Most remarkable is HYPE, where funding fee income is already 2.4 times the current unrealized profit.
Abraxas is really having its cake and eating it too—making a killing…💵💵
🤩🤩
After BTC fell below $70,000, the short positions held by two addresses linked to hedge fund Abraxas Capital continued to grow more profitable. They now hold a combined short position worth about $697 million, with $130 million in unrealized profits.
A few key positions: 👇
- $BTC : short position of about $257 million, $28.93 million in unrealized profits, $7.51 million in funding fees
- HYPE: short position of about $108 million, $5.78 million in unrealized profits, $13.93 million in funding fees
- $ZEC : short position of about $80.1 million, $40.03 million in unrealized profits, $1.62 million in funding fees
- $ETH : a short position of about $64.35 million in a single address, $11.96 million in unrealized profits, $4.87 million in funding fees
Just these four positions have already generated $27.93 million in funding fees.
Most remarkable is HYPE, where funding fee income is already 2.4 times the current unrealized profit.
Abraxas is really having its cake and eating it too—making a killing…💵💵
121
·
--
$AGT surged 200%—is it still worth chasing?
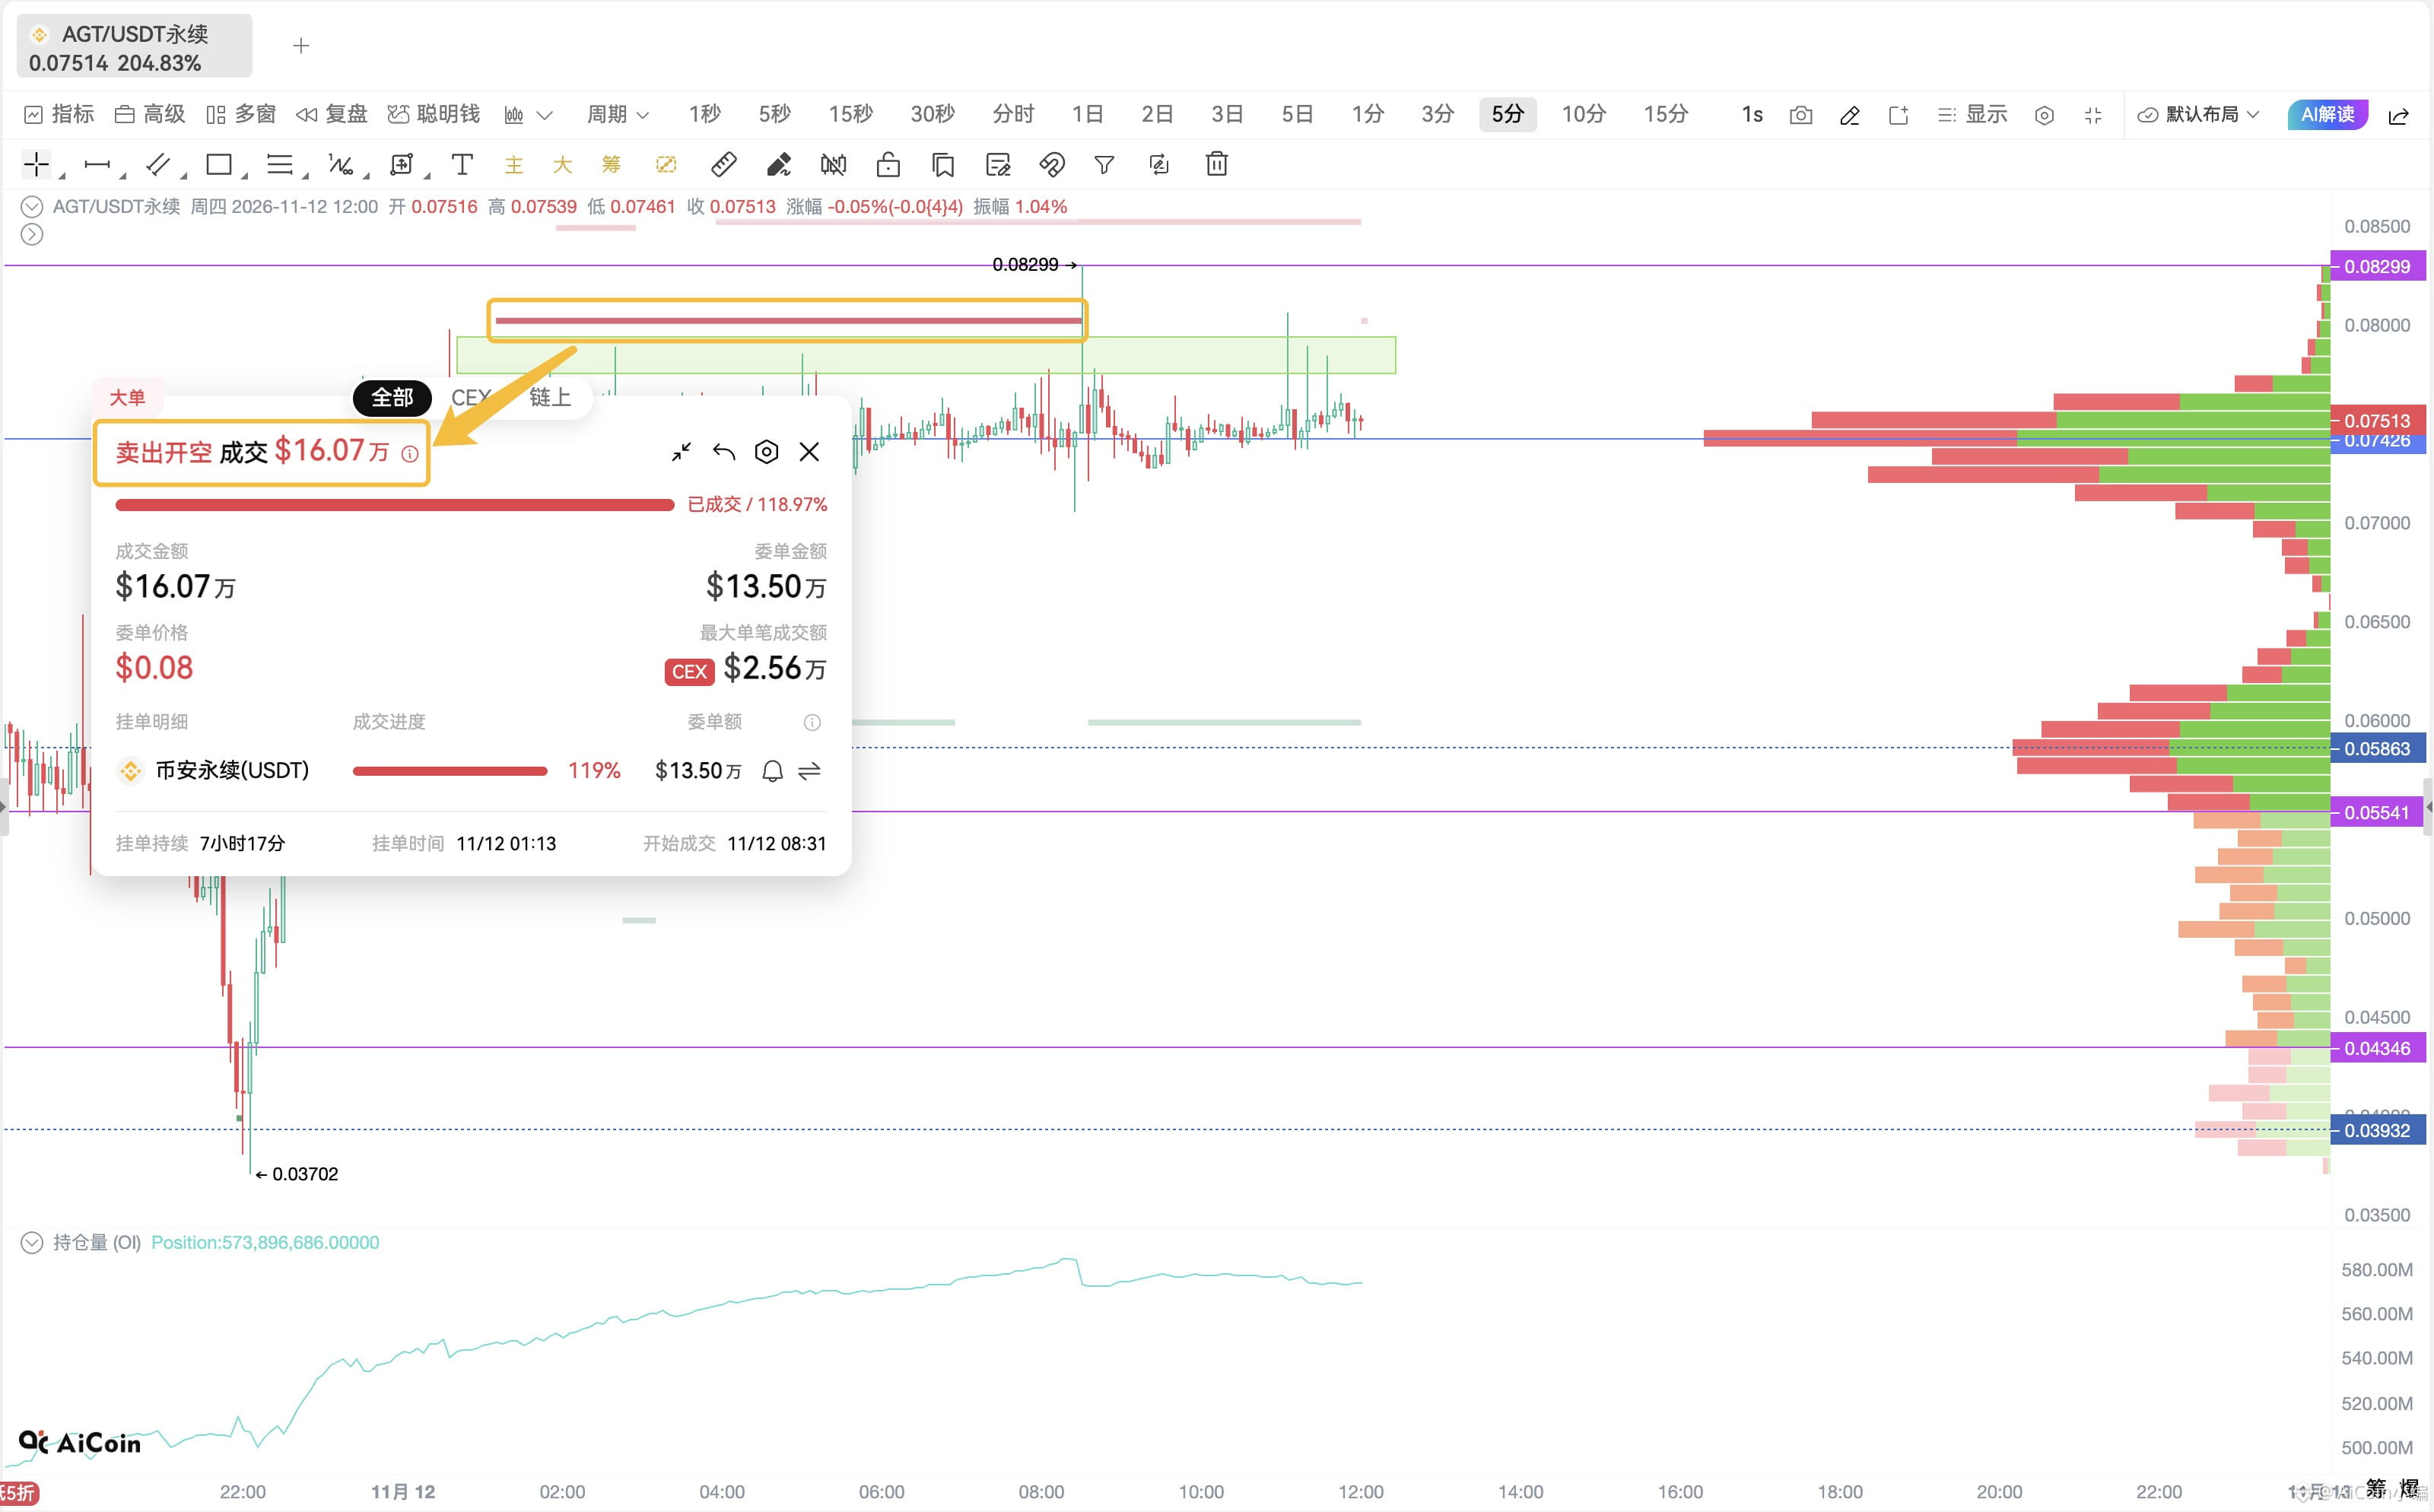
AGT’s 24-hour trading volume was 668 million (+4,321%), OI was 46.3 million (+58%), and net inflows were 28.47 million. It looks strong on the surface, but short-term OI has already started to dip slightly, suggesting that appetite for opening new positions is waning.
Also, a 160,000 short position appeared at the $0.08 level, suggesting that some traders are starting to short at these highs.
On-chain holdings are also highly concentrated: the top 100 addresses hold nearly 90% of the supply, with the top 5 holding 34%. The initial large allocations held by the No. 1 and No. 4 holders also came from the same distribution wallet.
In the short term, watch whether it can hold above $0.08–$0.083 on strong volume.
- If it holds, it could move higher;
- If it fails to break through and heavy selling pressure builds, the pullback could be swift~
$AGT surged 200%—is it still worth chasing?
AGT’s 24-hour trading volume was 668 million (+4,321%), OI was 46.3 million (+58%), and net inflows were 28.47 million. It looks strong on the surface, but short-term OI has already started to dip slightly, suggesting that appetite for opening new positions is waning.
Also, a 160,000 short position appeared at the $0.08 level, suggesting that some traders are starting to short at these highs.
On-chain holdings are also highly concentrated: the top 100 addresses hold nearly 90% of the supply, with the top 5 holding 34%. The initial large allocations held by the No. 1 and No. 4 holders also came from the same distribution wallet.
In the short term, watch whether it can hold above $0.08–$0.083 on strong volume.
- If it holds, it could move higher;
- If it fails to break through and heavy selling pressure builds, the pullback could be swift~
AGT’s 24-hour trading volume was 668 million (+4,321%), OI was 46.3 million (+58%), and net inflows were 28.47 million. It looks strong on the surface, but short-term OI has already started to dip slightly, suggesting that appetite for opening new positions is waning.
Also, a 160,000 short position appeared at the $0.08 level, suggesting that some traders are starting to short at these highs.
On-chain holdings are also highly concentrated: the top 100 addresses hold nearly 90% of the supply, with the top 5 holding 34%. The initial large allocations held by the No. 1 and No. 4 holders also came from the same distribution wallet.
In the short term, watch whether it can hold above $0.08–$0.083 on strong volume.
- If it holds, it could move higher;
- If it fails to break through and heavy selling pressure builds, the pullback could be swift~
2
394
·
--
Bearish
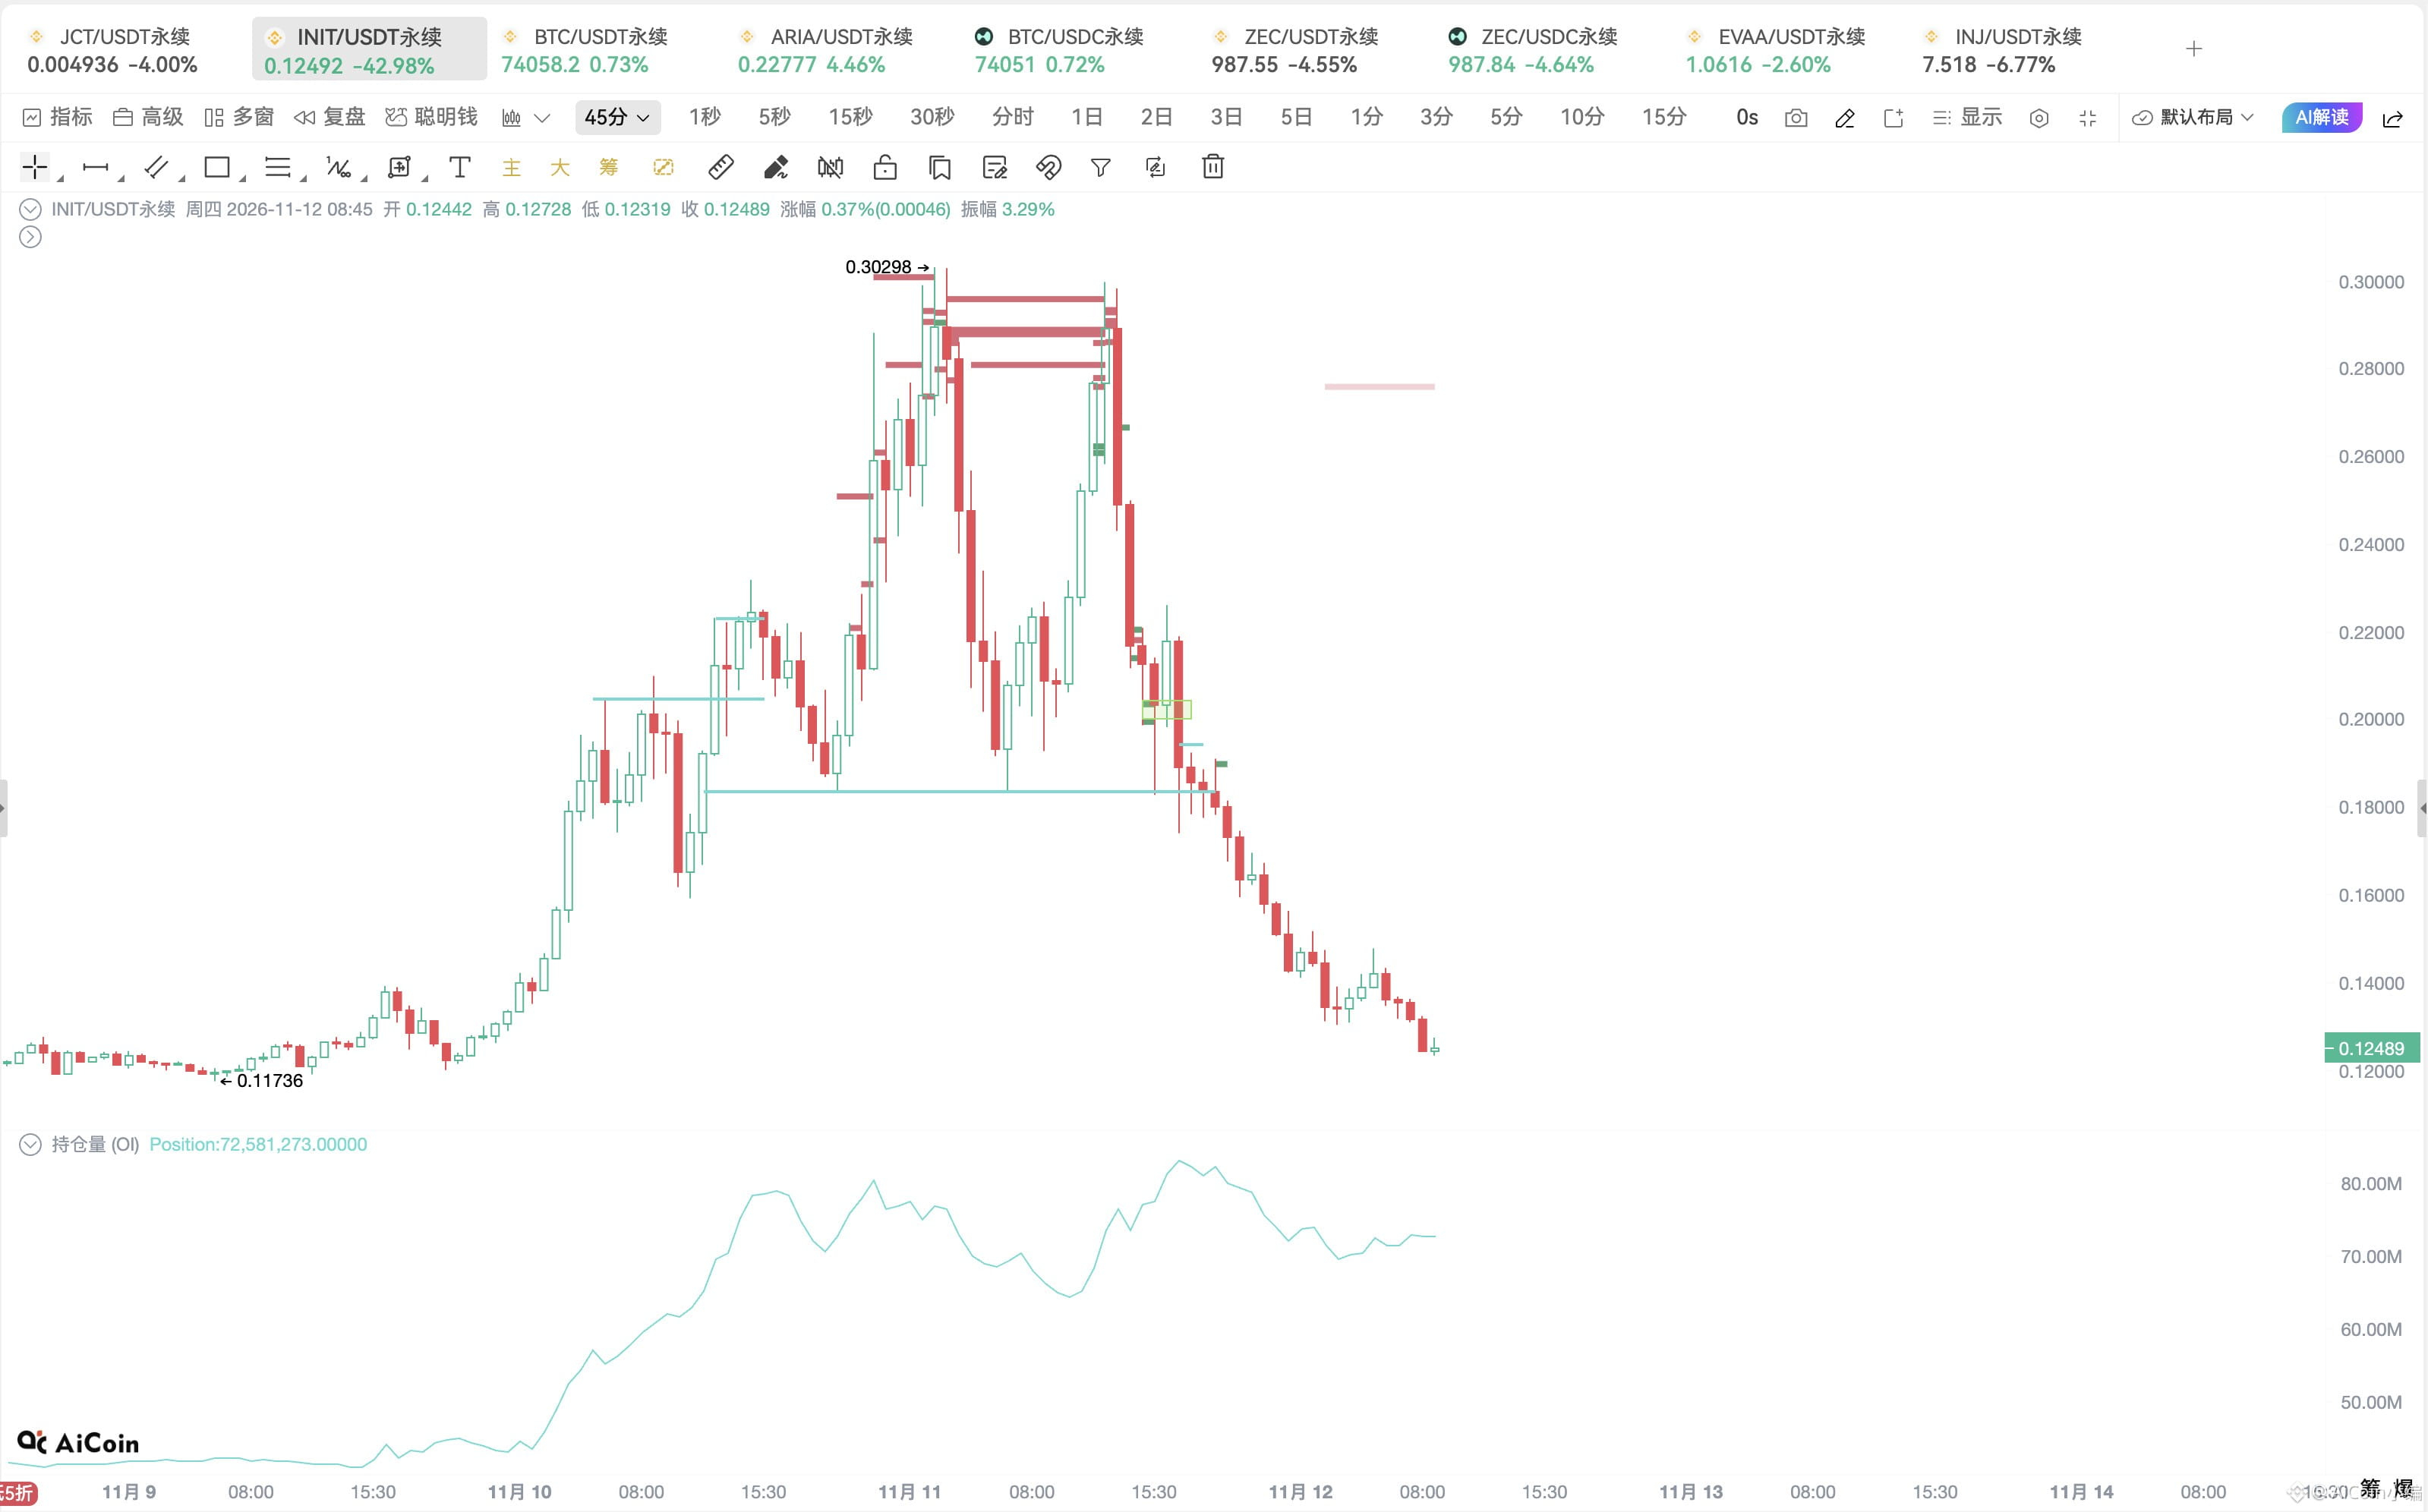
$INIT has been cut in half…
Altcoins are being harvested too quickly now.
$INIT has been cut in half…
Altcoins are being harvested too quickly now.
Altcoins are being harvested too quickly now.
635
·
--
Every rally gets dumped. $INIT These two “breakouts” both looked pretty suspicious 🤨
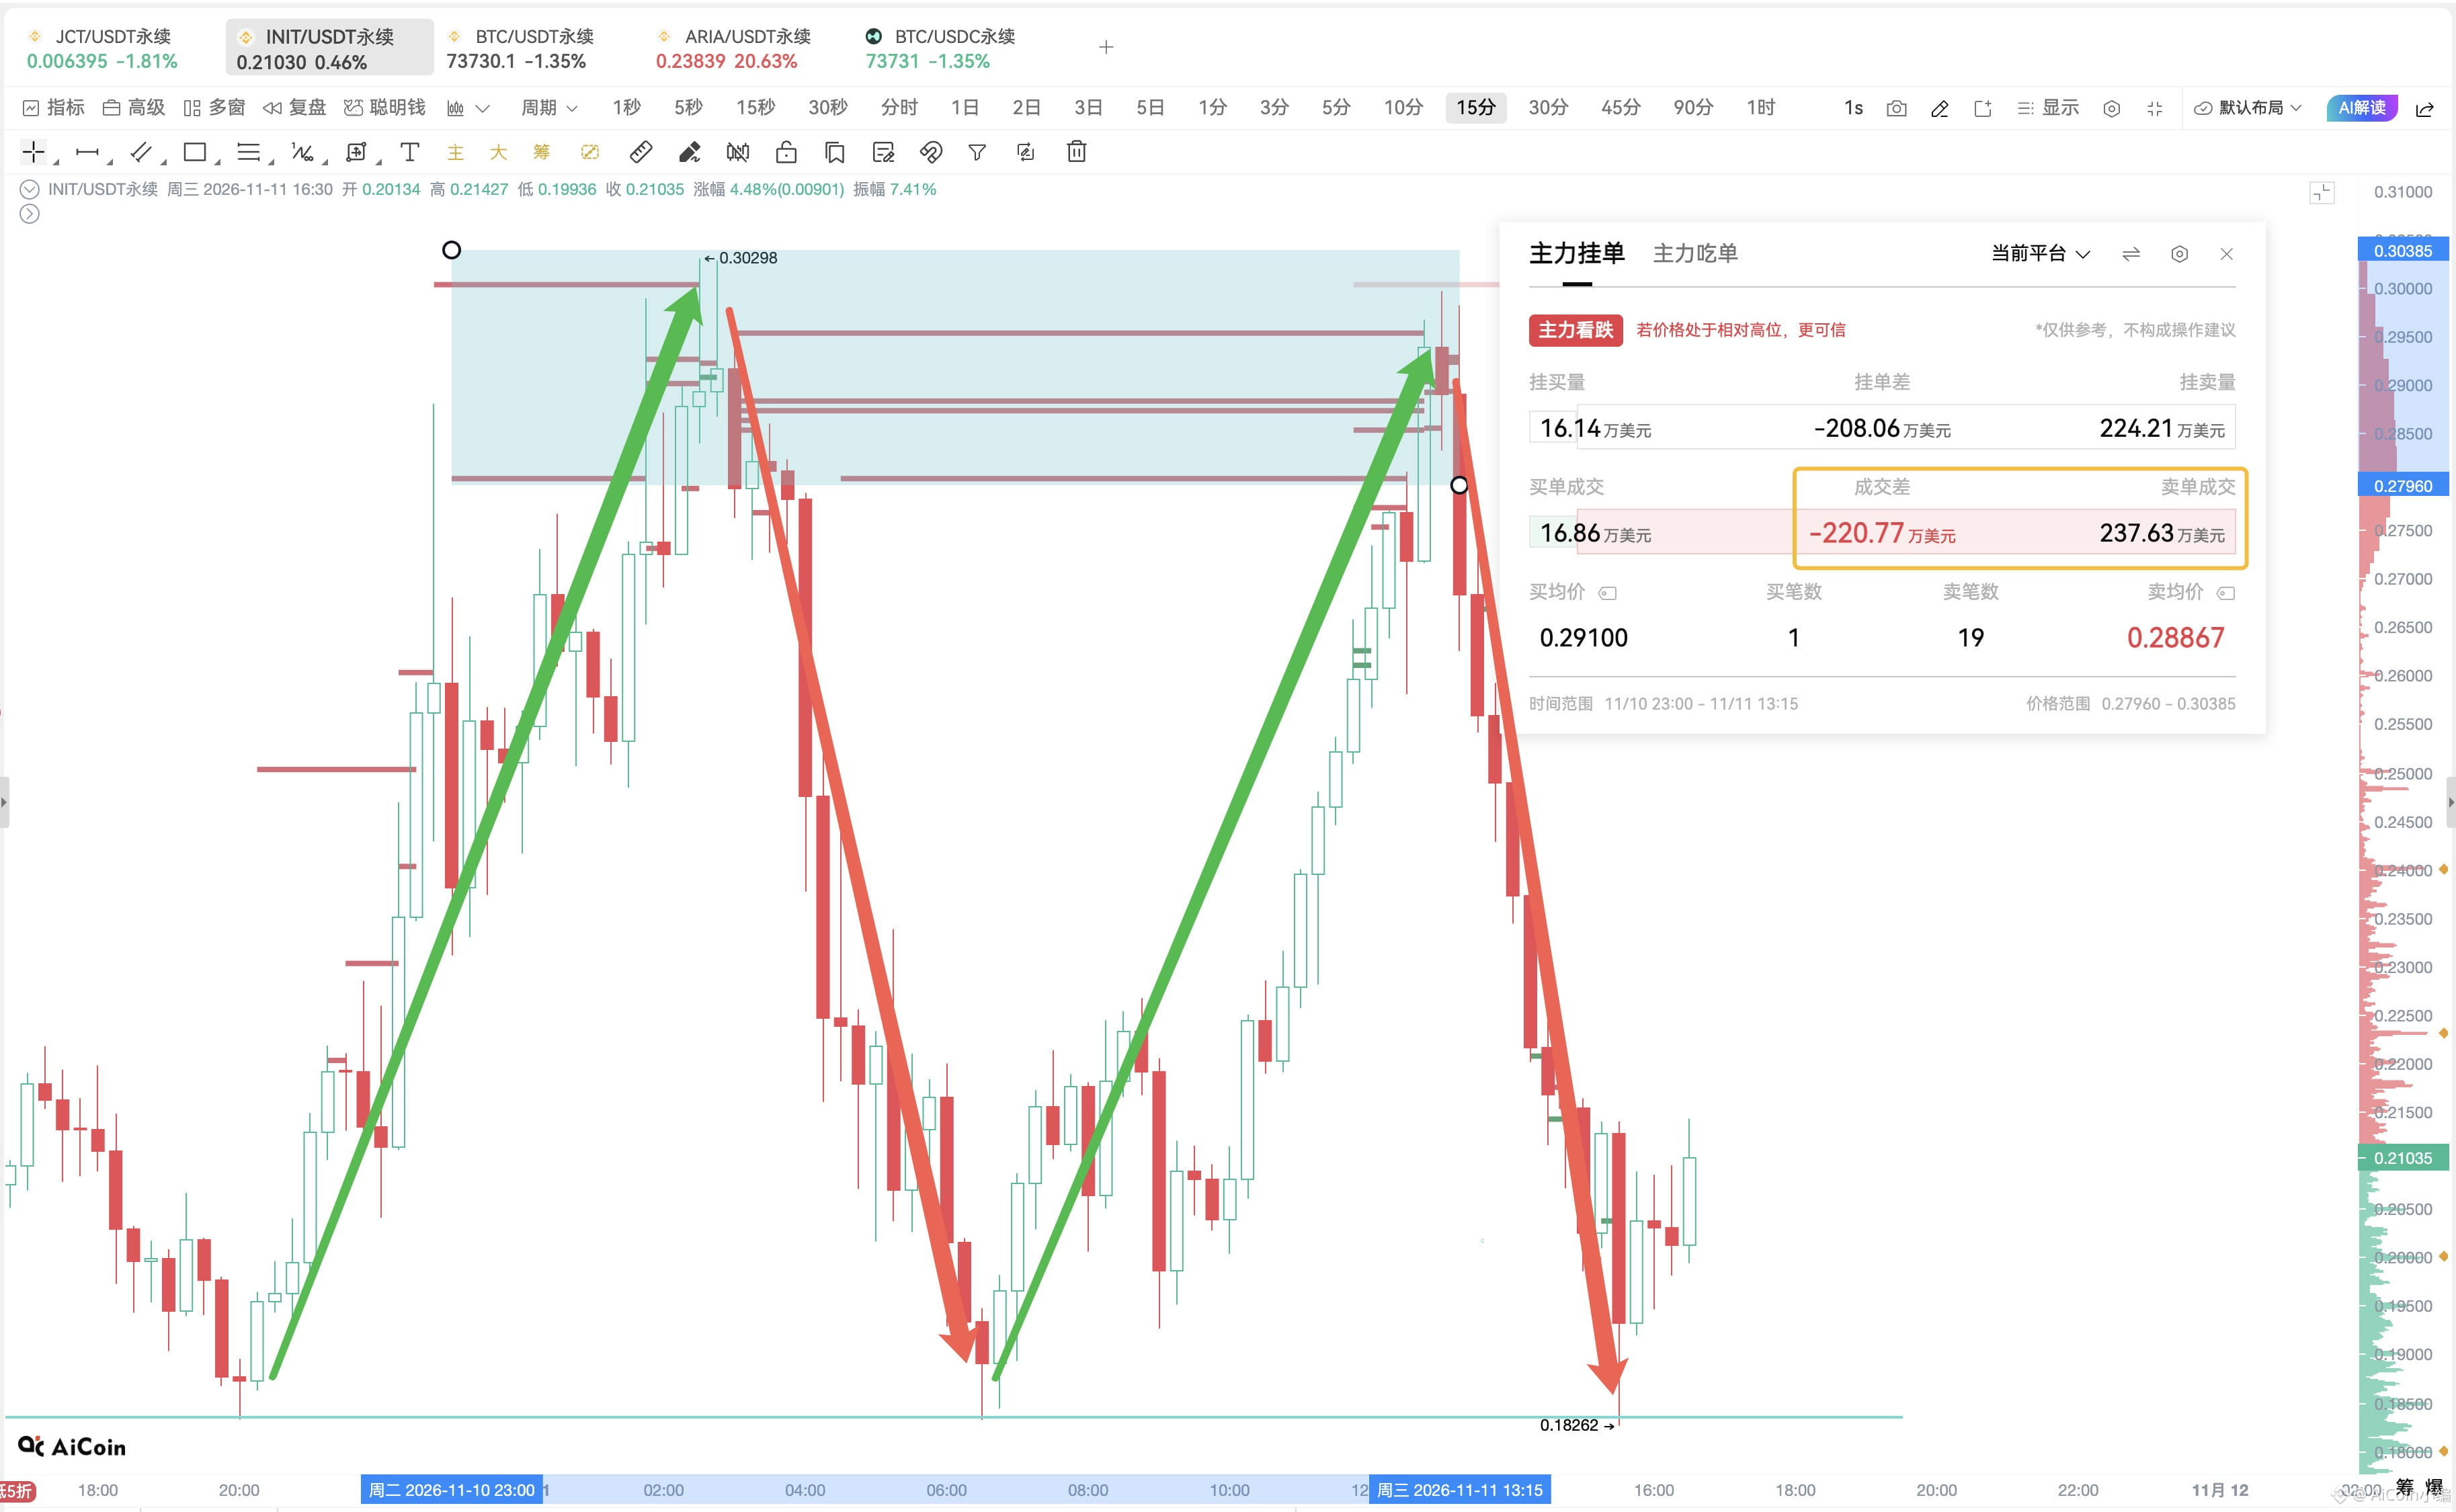
1️⃣ First spike to $0.302:
Large players closed $1.4693 million in long positions, while new long positions totaled just $168,600.
Sell orders were in the millions, while buying was very weak. The price then plunged straight to $0.182, a drop of nearly 40%.
2️⃣ Second spike to $0.299:
Large players closed $1.3335 million in long positions, while buy volume was literally zero.
The price then crashed back to around $0.198, a drop of over 38%.
Both rallies were basically bait for large players to close their long positions and dump on the market (using FOMO buyers as exit liquidity).
INIT is now back around $0.20, and two buy orders totaling $176,000 have already been filled. If the price can hold here, it may try to challenge $0.28–$0.30 again. But large sell orders are still sitting in that resistance zone.
To spot these fake breakouts early, the key is to watch large orders: when they’re placed, canceled, and actually filled. When the order book shows “large sell orders + few buy orders,” chasing the price is very risky.
Tool: “Large Player Big Order Tracker” indicator
Every rally gets dumped. $INIT These two “breakouts” both looked pretty suspicious 🤨
1️⃣ First spike to $0.302:
Large players closed $1.4693 million in long positions, while new long positions totaled just $168,600.
Sell orders were in the millions, while buying was very weak. The price then plunged straight to $0.182, a drop of nearly 40%.
2️⃣ Second spike to $0.299:
Large players closed $1.3335 million in long positions, while buy volume was literally zero.
The price then crashed back to around $0.198, a drop of over 38%.
Both rallies were basically bait for large players to close their long positions and dump on the market (using FOMO buyers as exit liquidity).
INIT is now back around $0.20, and two buy orders totaling $176,000 have already been filled. If the price can hold here, it may try to challenge $0.28–$0.30 again. But large sell orders are still sitting in that resistance zone.
To spot these fake breakouts early, the key is to watch large orders: when they’re placed, canceled, and actually filled. When the order book shows “large sell orders + few buy orders,” chasing the price is very risky.
Tool: “Large Player Big Order Tracker” indicator
1️⃣ First spike to $0.302:
Large players closed $1.4693 million in long positions, while new long positions totaled just $168,600.
Sell orders were in the millions, while buying was very weak. The price then plunged straight to $0.182, a drop of nearly 40%.
2️⃣ Second spike to $0.299:
Large players closed $1.3335 million in long positions, while buy volume was literally zero.
The price then crashed back to around $0.198, a drop of over 38%.
Both rallies were basically bait for large players to close their long positions and dump on the market (using FOMO buyers as exit liquidity).
INIT is now back around $0.20, and two buy orders totaling $176,000 have already been filled. If the price can hold here, it may try to challenge $0.28–$0.30 again. But large sell orders are still sitting in that resistance zone.
To spot these fake breakouts early, the key is to watch large orders: when they’re placed, canceled, and actually filled. When the order book shows “large sell orders + few buy orders,” chasing the price is very risky.
Tool: “Large Player Big Order Tracker” indicator
330
·
--
Sold near a local top in September, and now turned around and borrowed $22 million to scoop up $ETH ? 🤨
The on-chain whale 7 Siblings is back in action.
Over the past 10 hours, it spent $22 million to buy 10,792 ETH at an average price of $2,038.
The whale currently still holds:
💰 174,000 ETH
💸 $136 million in debt
🏦 Primarily collateralized on Aave + Spark
Its strategy has always been consistent: borrow money to add to its position during sharp dips, then sell some on the rebound to repay the debt.
Based on its current position, ETH would need to fall to around $1,180 for its Spark position to start approaching liquidation—about 43% below the current price.
Is this a buying spree too early, or did it nail a local bottom? Keep an eye on what it does next 👇
Address details: 0x28a55C4b4f9615FDE3CDAdDf6cc01FcF2E38A6b0
Sold near a local top in September, and now turned around and borrowed $22 million to scoop up $ETH ? 🤨
The on-chain whale 7 Siblings is back in action.
Over the past 10 hours, it spent $22 million to buy 10,792 ETH at an average price of $2,038.
The whale currently still holds:
💰 174,000 ETH
💸 $136 million in debt
🏦 Primarily collateralized on Aave + Spark
Its strategy has always been consistent: borrow money to add to its position during sharp dips, then sell some on the rebound to repay the debt.
Based on its current position, ETH would need to fall to around $1,180 for its Spark position to start approaching liquidation—about 43% below the current price.
Is this a buying spree too early, or did it nail a local bottom? Keep an eye on what it does next 👇
Address details: 0x28a55C4b4f9615FDE3CDAdDf6cc01FcF2E38A6b0
The on-chain whale 7 Siblings is back in action.
Over the past 10 hours, it spent $22 million to buy 10,792 ETH at an average price of $2,038.
The whale currently still holds:
💰 174,000 ETH
💸 $136 million in debt
🏦 Primarily collateralized on Aave + Spark
Its strategy has always been consistent: borrow money to add to its position during sharp dips, then sell some on the rebound to repay the debt.
Based on its current position, ETH would need to fall to around $1,180 for its Spark position to start approaching liquidation—about 43% below the current price.
Is this a buying spree too early, or did it nail a local bottom? Keep an eye on what it does next 👇
Address details: 0x28a55C4b4f9615FDE3CDAdDf6cc01FcF2E38A6b0
216
·
--
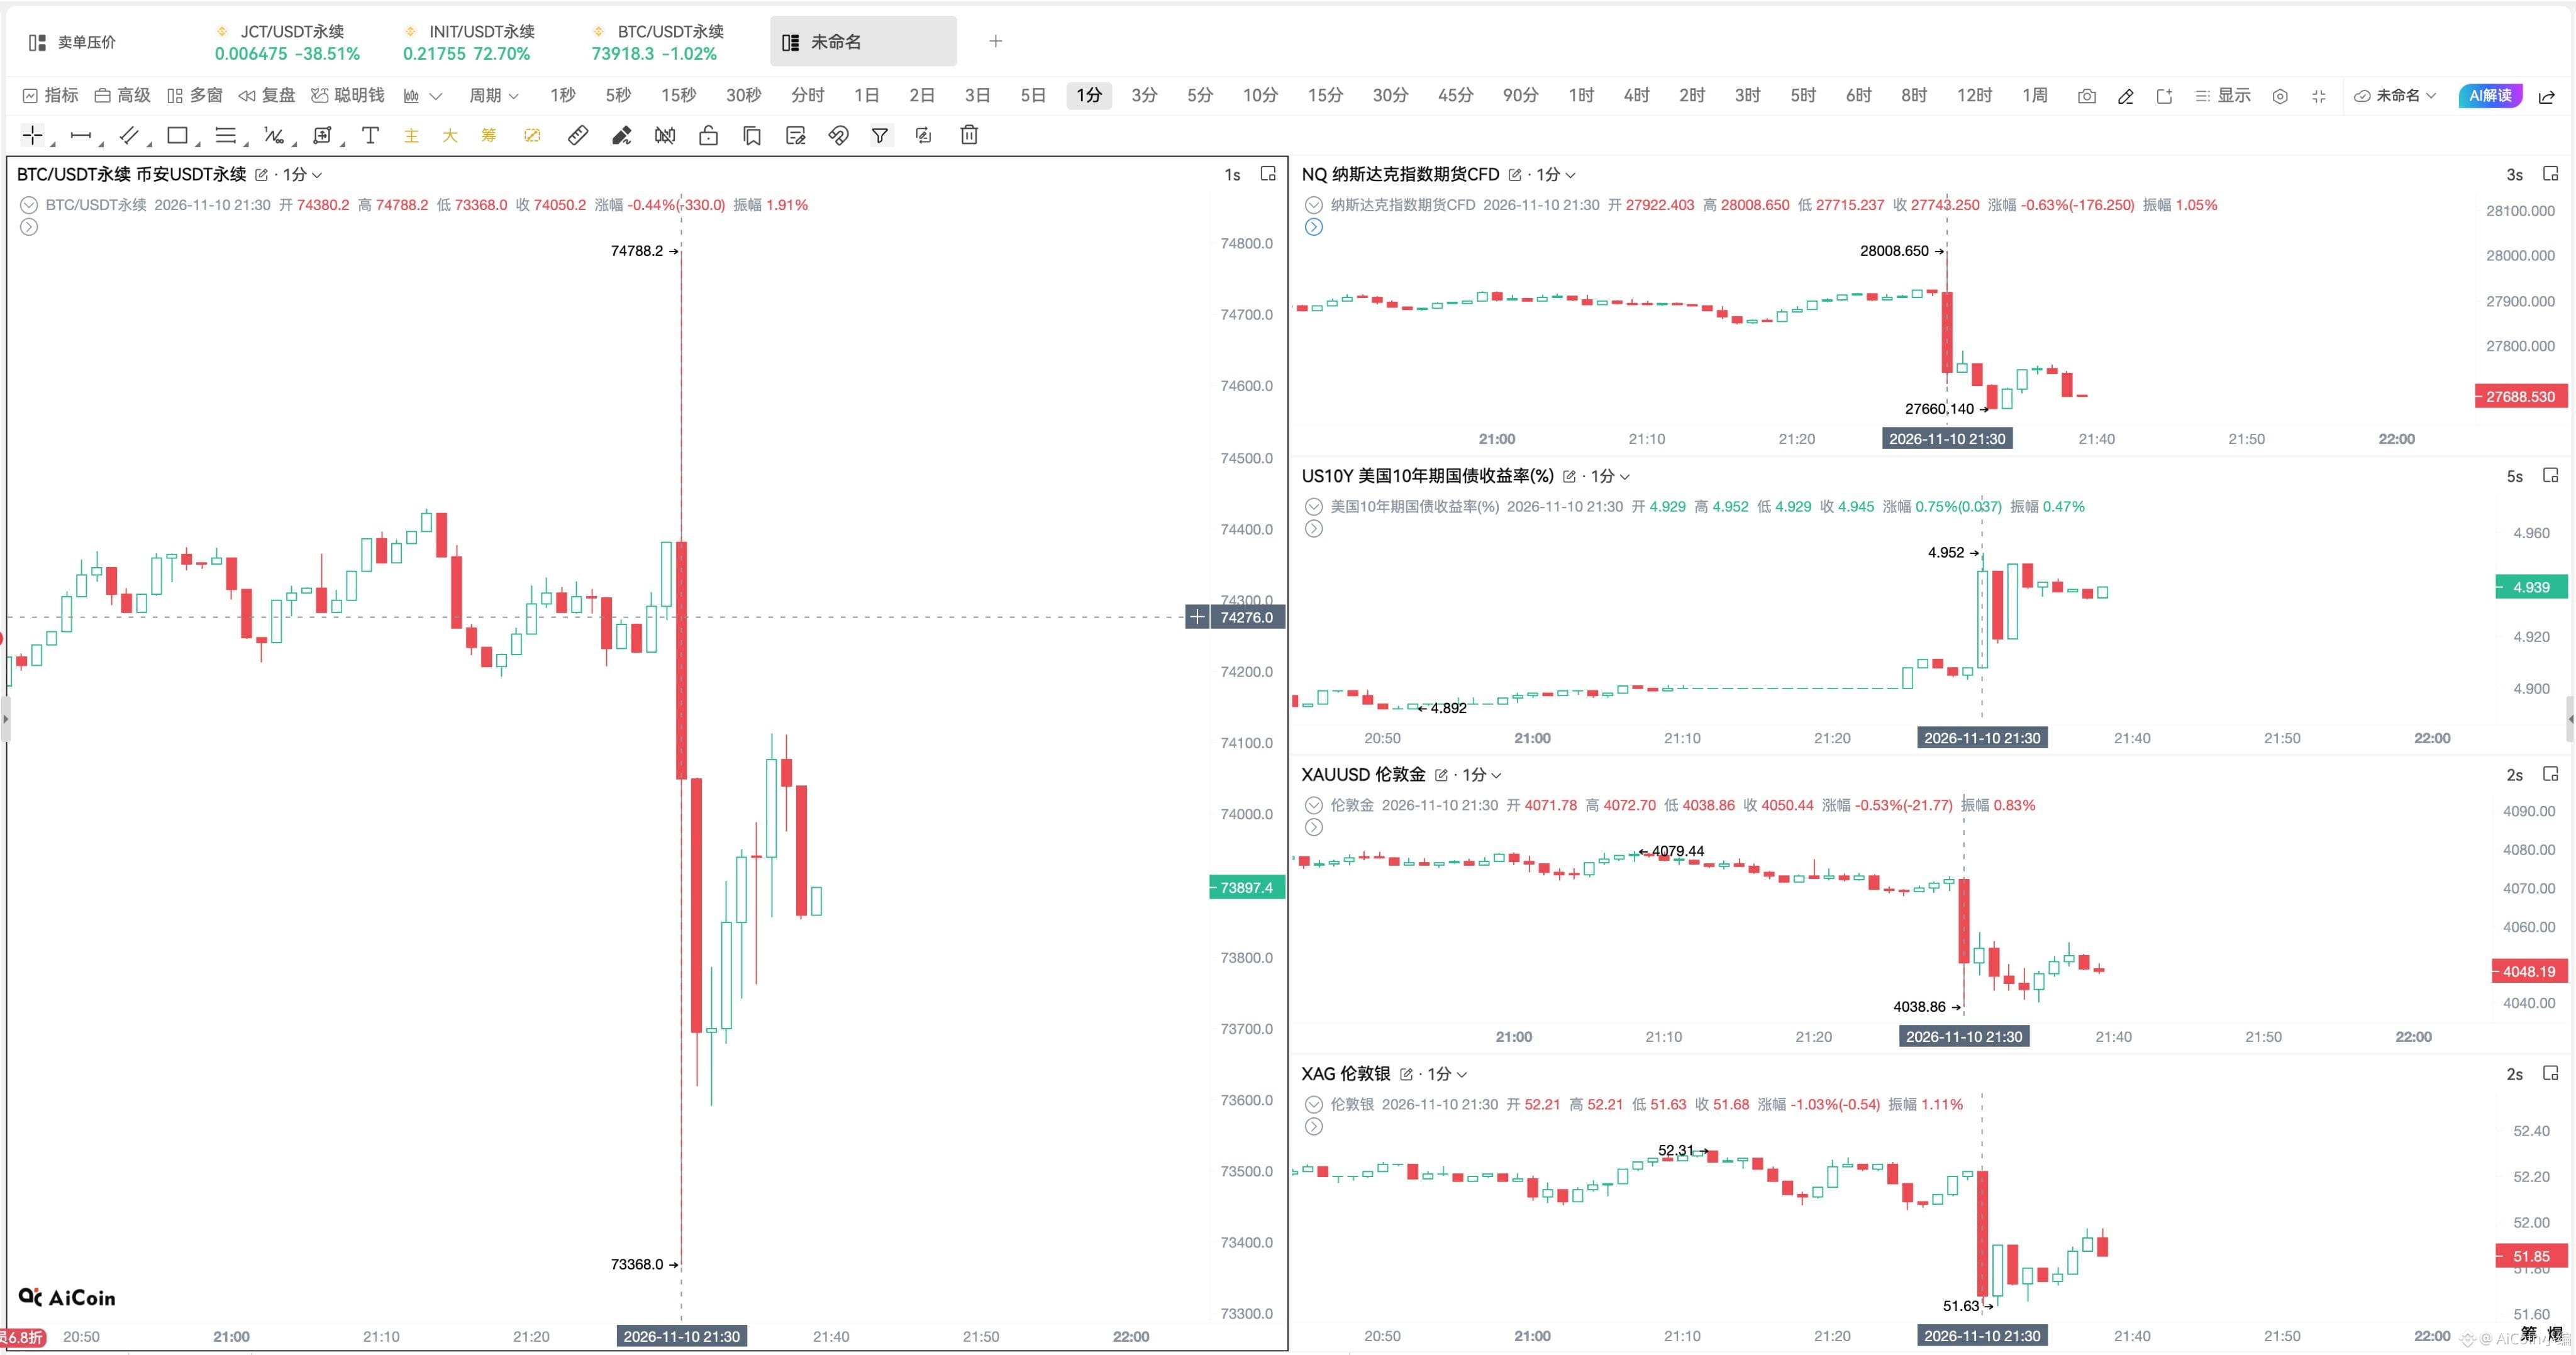
🔥CPI blew past expectations across the board! $BTC plunged straight down, falling below 74,000
U.S. October CPI and core CPI both came in higher than expected:
- CPI month-over-month: +0.4%, vs. +0.3% expected
- Core CPI: +0.3%, vs. +0.2% expected
Markets were sent into a tailspin:
🔻 BTC fell below the 74,000 mark
🔻 U.S. stock futures turned lower across the board
🔻 10-year Treasury yield surged to 4.95%
🔻 Gold and silver plunged, with silver down 1.1%
Rate cuts are completely off the table; markets are pricing in a 100% chance that the Fed will hike rates again in December~
#cpi #美联储何时降息?
🔥CPI blew past expectations across the board! $BTC plunged straight down, falling below 74,000
U.S. October CPI and core CPI both came in higher than expected:
- CPI month-over-month: +0.4%, vs. +0.3% expected
- Core CPI: +0.3%, vs. +0.2% expected
Markets were sent into a tailspin:
🔻 BTC fell below the 74,000 mark
🔻 U.S. stock futures turned lower across the board
🔻 10-year Treasury yield surged to 4.95%
🔻 Gold and silver plunged, with silver down 1.1%
Rate cuts are completely off the table; markets are pricing in a 100% chance that the Fed will hike rates again in December~
#cpi #美联储何时降息?
U.S. October CPI and core CPI both came in higher than expected:
- CPI month-over-month: +0.4%, vs. +0.3% expected
- Core CPI: +0.3%, vs. +0.2% expected
Markets were sent into a tailspin:
🔻 BTC fell below the 74,000 mark
🔻 U.S. stock futures turned lower across the board
🔻 10-year Treasury yield surged to 4.95%
🔻 Gold and silver plunged, with silver down 1.1%
Rate cuts are completely off the table; markets are pricing in a 100% chance that the Fed will hike rates again in December~
#cpi #美联储何时降息?
468
·
--
Bearish
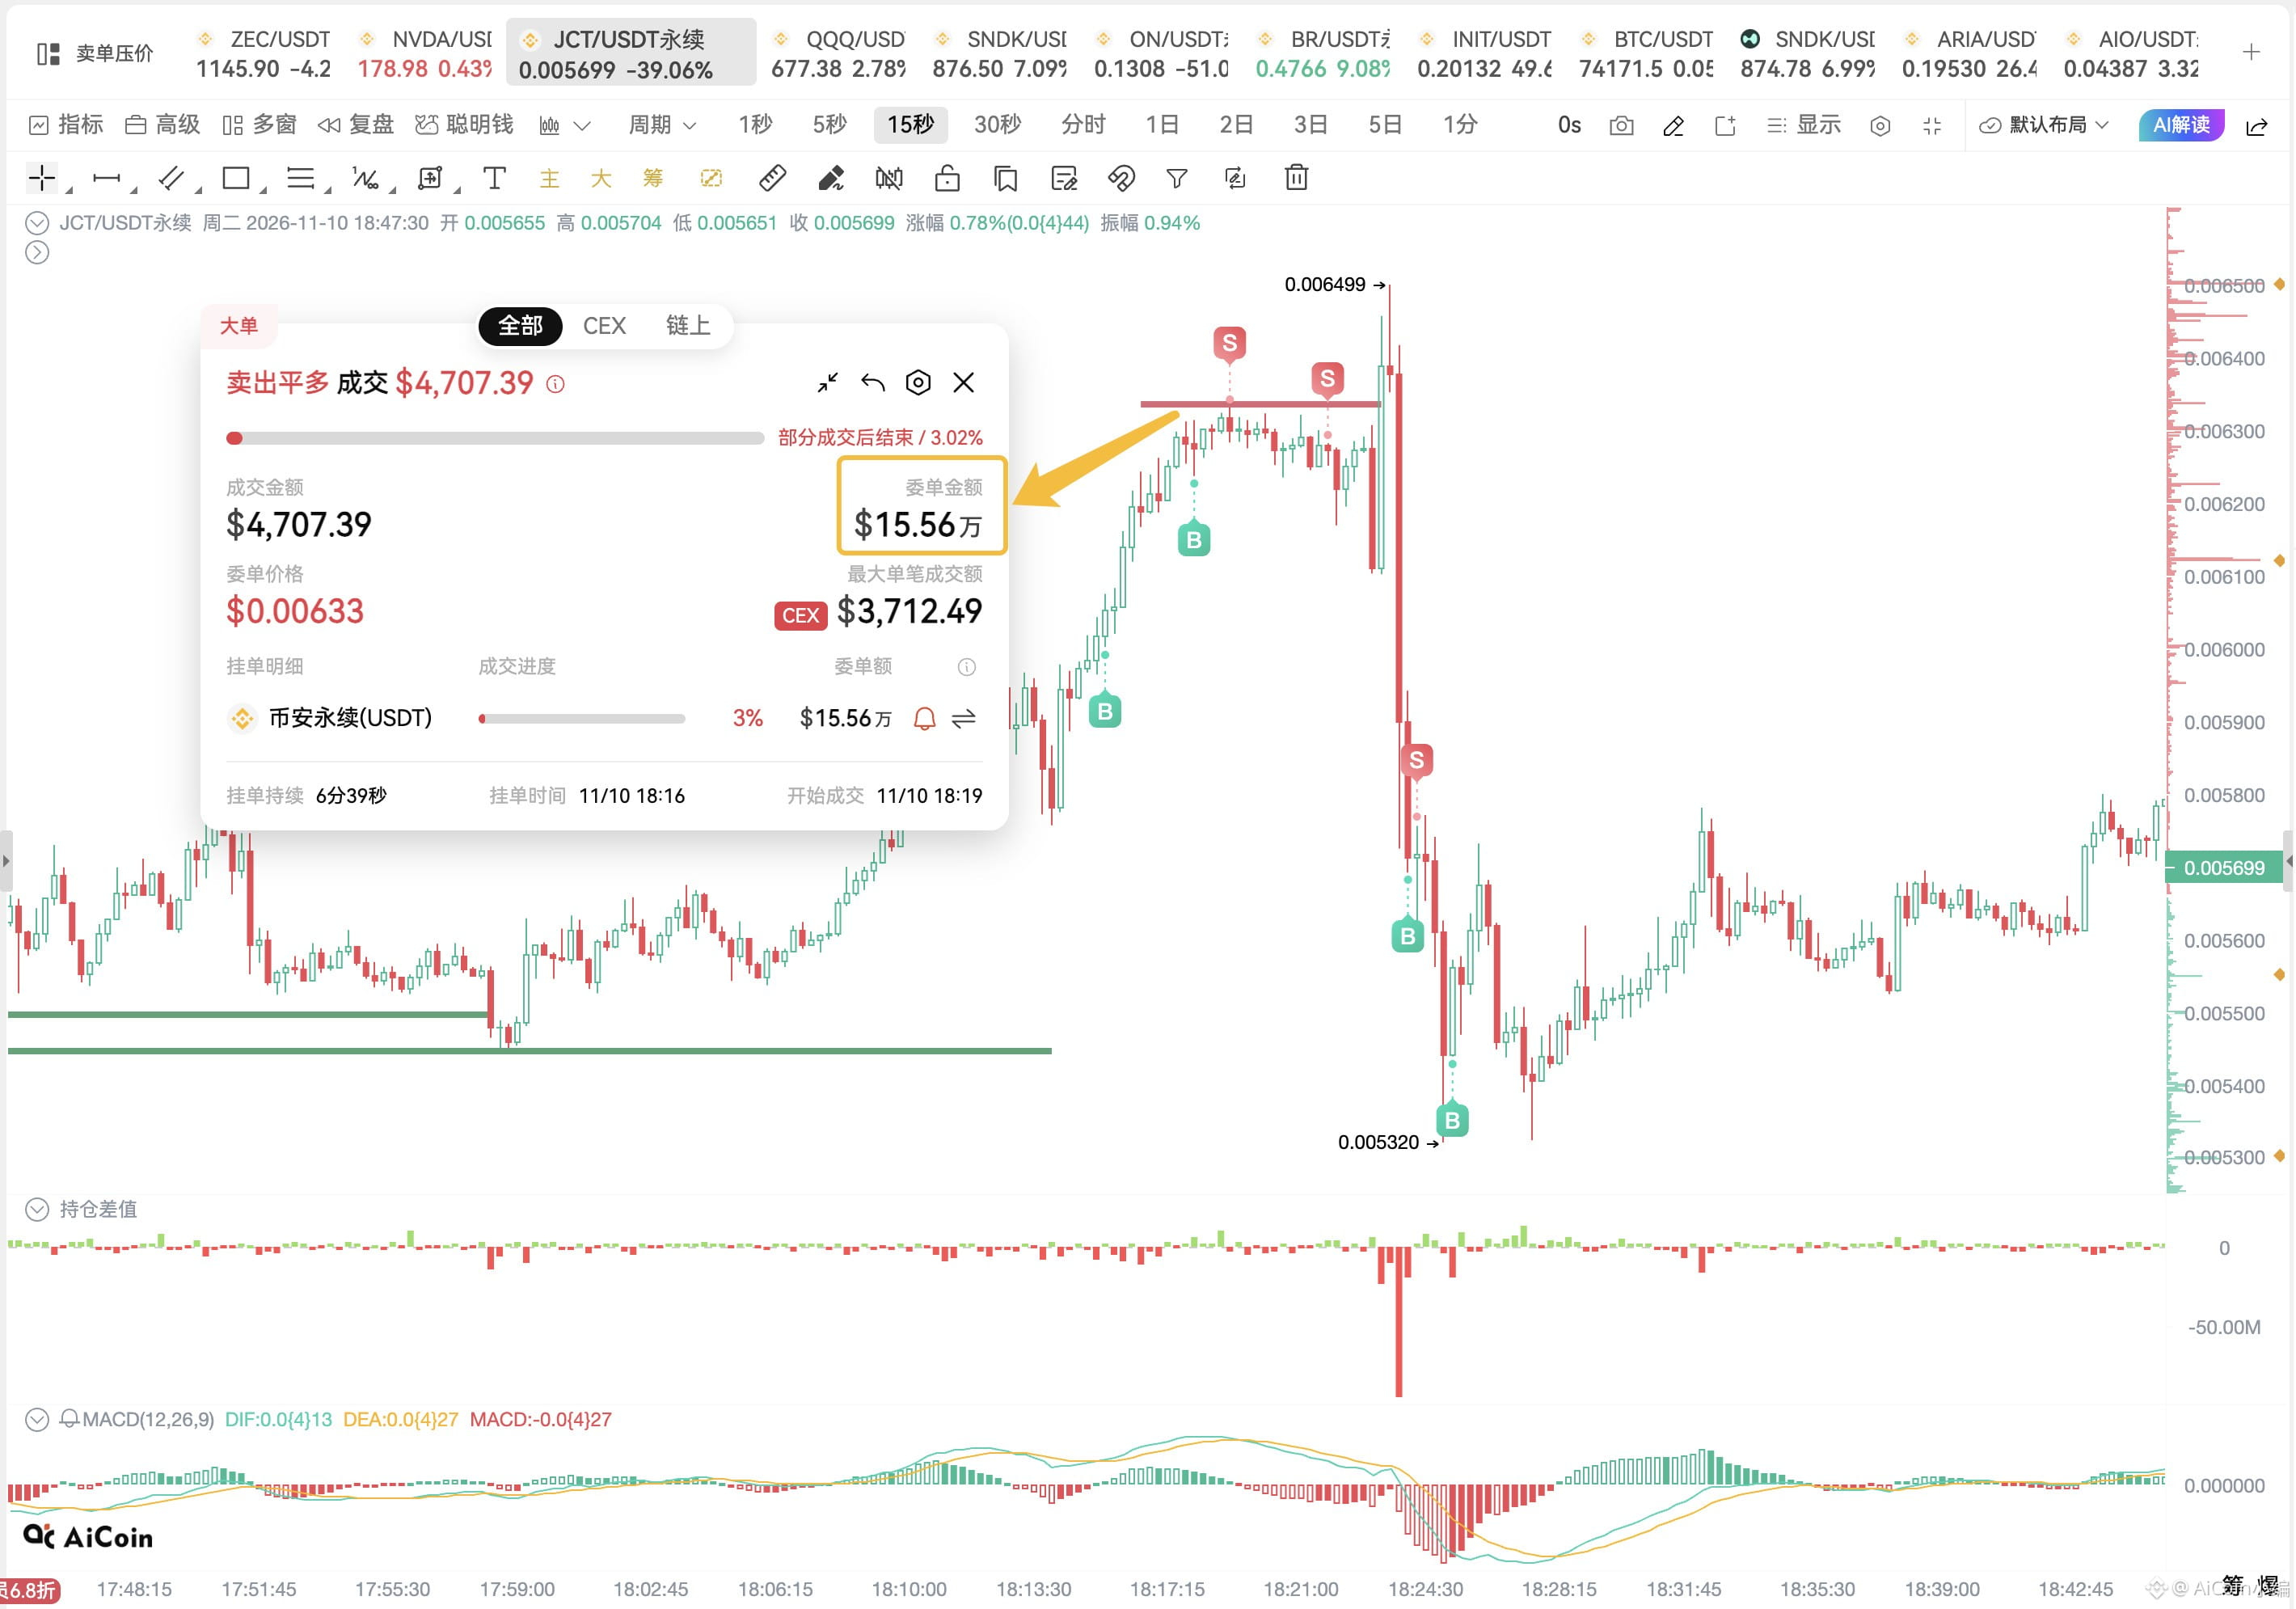
What a “paper tiger” price squeeze—the JCT big players’ latest feint was impressive 🤨
Just now, $JCT placed a huge sell order worth $155,600 at 0.00633, but it was canceled after only $4,707 had been filled.
That sub-$5,000 cost was enough to send JCT plunging 16% in the short term…
Buying high and selling low—there’s definitely something to those big limit orders. 👀
What a “paper tiger” price squeeze—the JCT big players’ latest feint was impressive 🤨
Just now, $JCT placed a huge sell order worth $155,600 at 0.00633, but it was canceled after only $4,707 had been filled.
That sub-$5,000 cost was enough to send JCT plunging 16% in the short term…
Buying high and selling low—there’s definitely something to those big limit orders. 👀
Just now, $JCT placed a huge sell order worth $155,600 at 0.00633, but it was canceled after only $4,707 had been filled.
That sub-$5,000 cost was enough to send JCT plunging 16% in the short term…
Buying high and selling low—there’s definitely something to those big limit orders. 👀
2
1
2.3k
·
--
Bearish
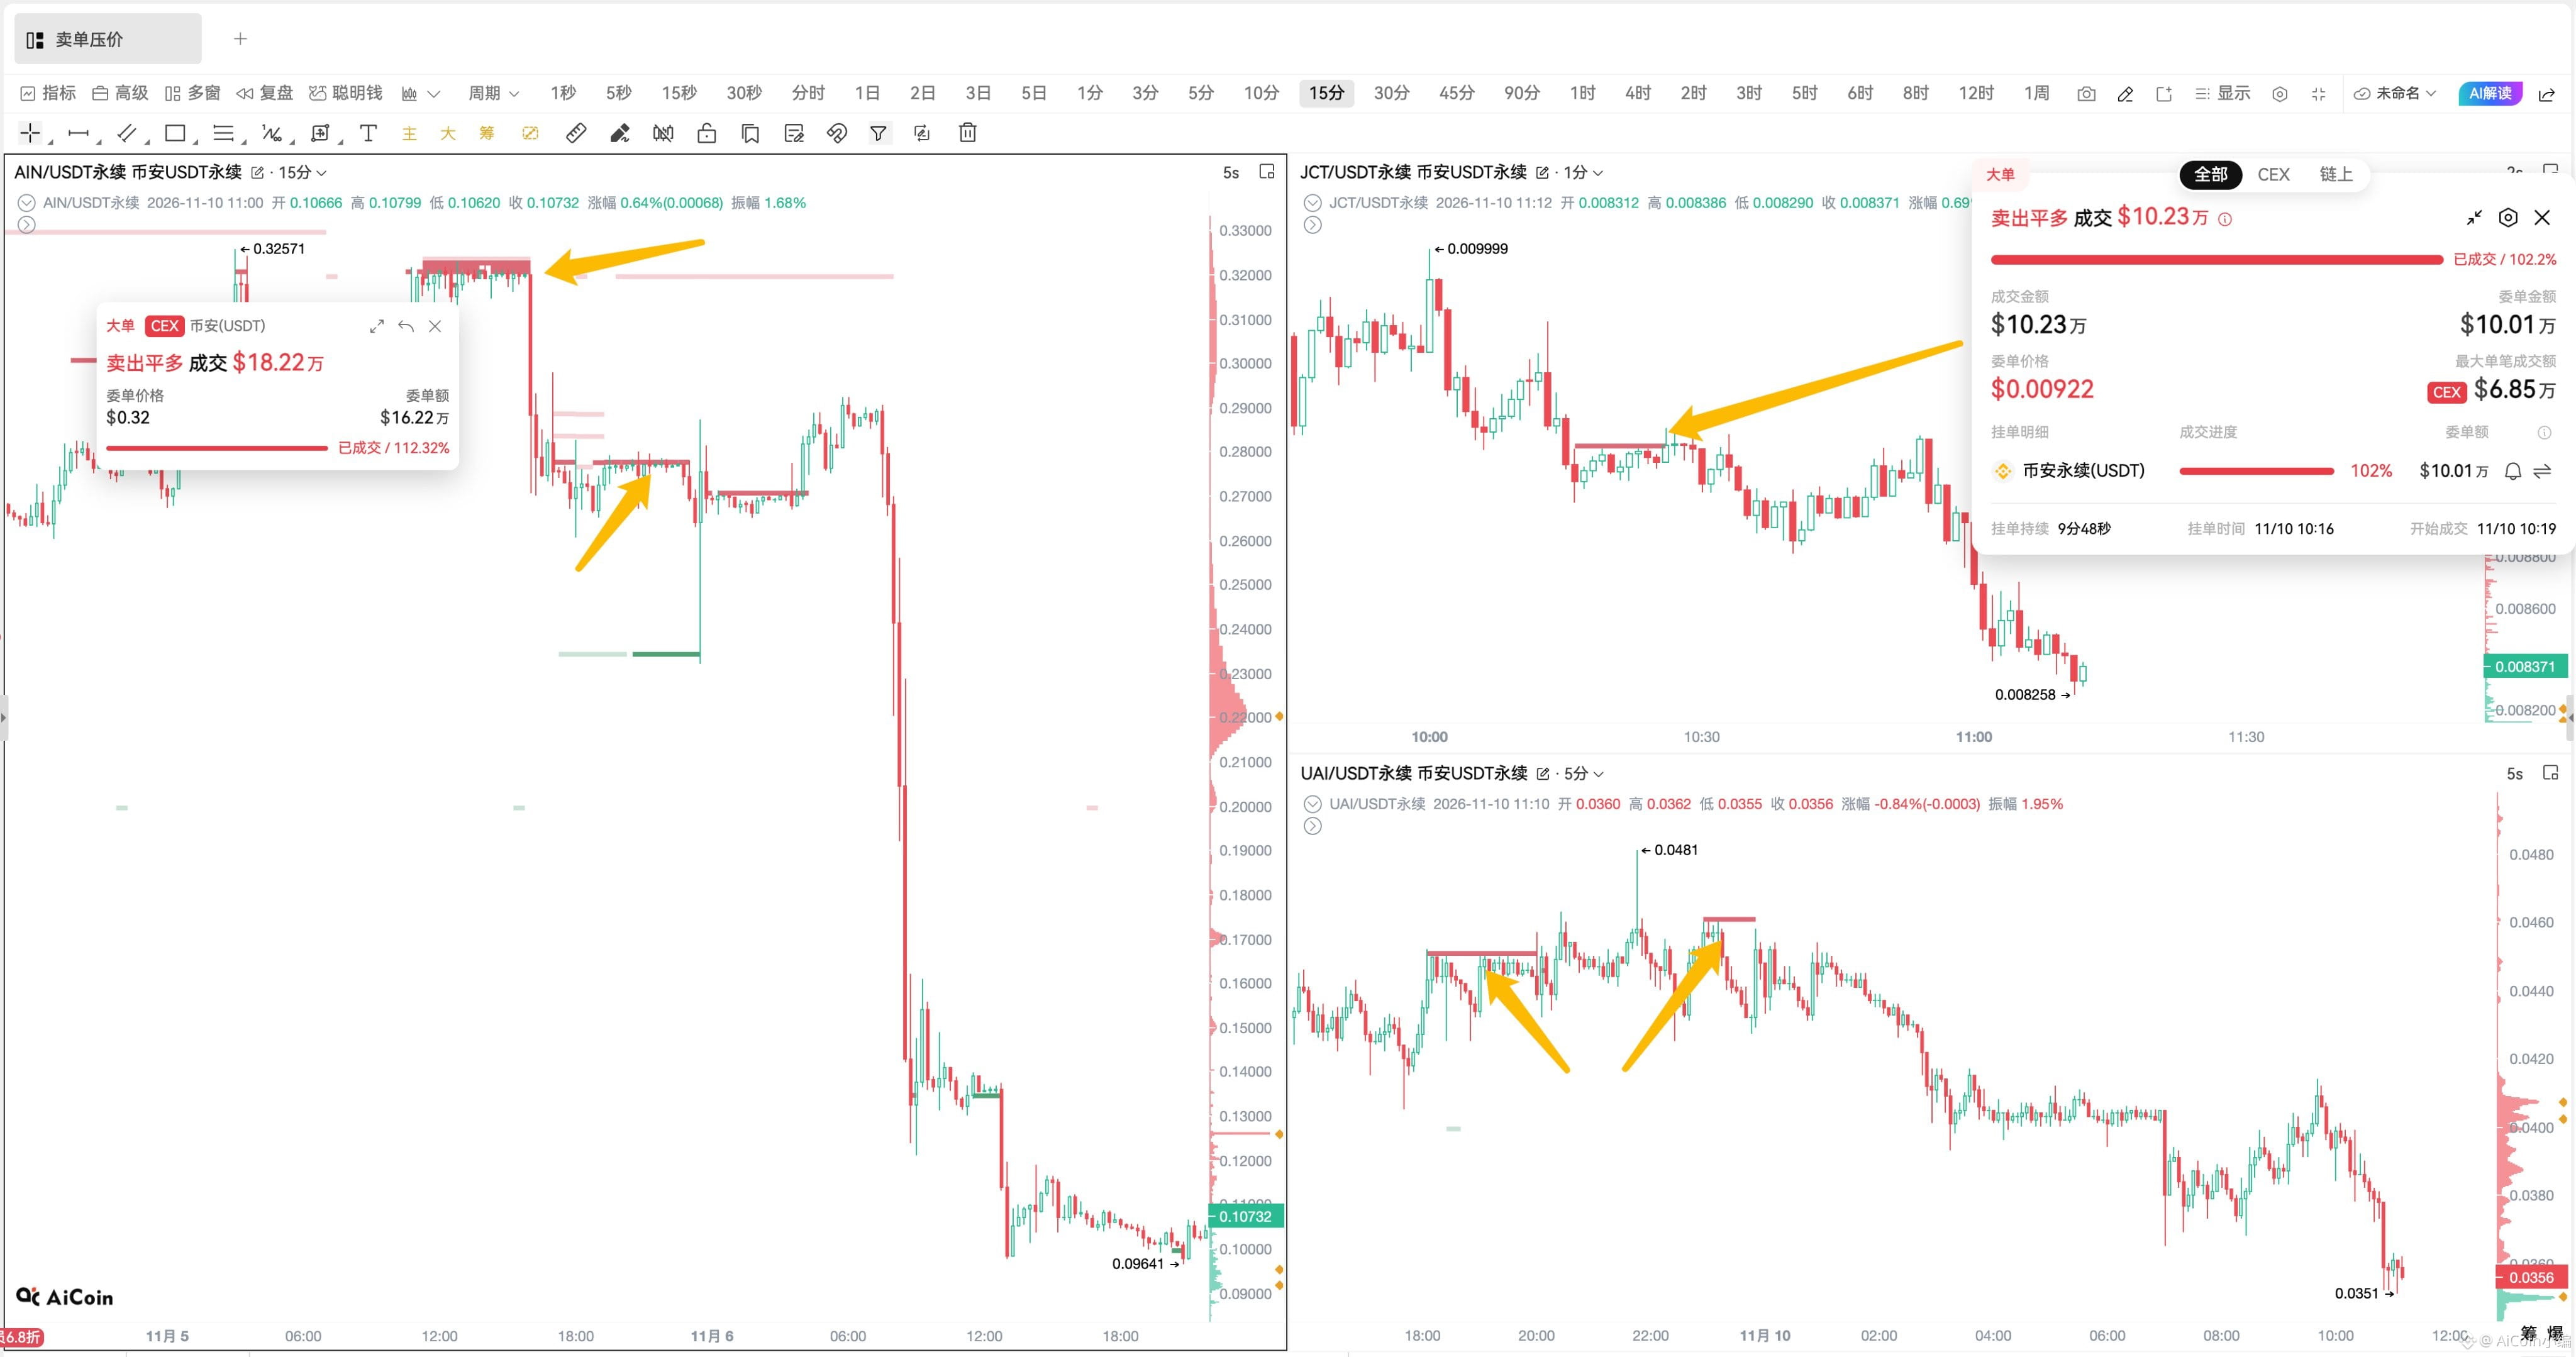
Big sell orders are capping the price. I’ve seen this episode before 🤨
$UAI : Yesterday, around $780,000 worth of sell orders were placed at 0.045–0.046. About $150,000 was then filled, and the price kept getting pushed down from that range.
$JCT : Today, a large $100,000 long-position close appeared at 0.00922, and the price hit clear resistance when it bounced back to that level.
This looks all too familiar. Not long ago, $AIN was a classic case of large sell orders pushing the price down, pinning it firmly around 0.32 and shaking people out until they had no fight left—then the price was dumped, cut in half, and traders were taken for a ride.
When big orders are capping the price like this, is it the whales putting on an act to shake out traders, or are they really preparing to bail and drive the price down? 🤔
Big sell orders are capping the price. I’ve seen this episode before 🤨
$UAI : Yesterday, around $780,000 worth of sell orders were placed at 0.045–0.046. About $150,000 was then filled, and the price kept getting pushed down from that range.
$JCT : Today, a large $100,000 long-position close appeared at 0.00922, and the price hit clear resistance when it bounced back to that level.
This looks all too familiar. Not long ago, $AIN was a classic case of large sell orders pushing the price down, pinning it firmly around 0.32 and shaking people out until they had no fight left—then the price was dumped, cut in half, and traders were taken for a ride.
When big orders are capping the price like this, is it the whales putting on an act to shake out traders, or are they really preparing to bail and drive the price down? 🤔
$UAI : Yesterday, around $780,000 worth of sell orders were placed at 0.045–0.046. About $150,000 was then filled, and the price kept getting pushed down from that range.
$JCT : Today, a large $100,000 long-position close appeared at 0.00922, and the price hit clear resistance when it bounced back to that level.
This looks all too familiar. Not long ago, $AIN was a classic case of large sell orders pushing the price down, pinning it firmly around 0.32 and shaking people out until they had no fight left—then the price was dumped, cut in half, and traders were taken for a ride.
When big orders are capping the price like this, is it the whales putting on an act to shake out traders, or are they really preparing to bail and drive the price down? 🤔
4
·
--
What’s unraveling for Jensen Huang this time goes far beyond his “devoted husband” image 😅
If this were just about an affair in his private life, $NVDA wouldn’t be this sensitive.
What’s really spooking the market is the combination of several things:
- A national security investigation
- Chip export controls
- Congressional inquiries
What makes things worse is that Nvidia has just been through a round of AI valuation declines, and now there’s another risk that almost no one had priced in before—Jensen Huang himself.
When the CEO himself becomes a risk factor, the story changes…
#黄仁勋 #英伟达
What’s unraveling for Jensen Huang this time goes far beyond his “devoted husband” image 😅
If this were just about an affair in his private life, $NVDA wouldn’t be this sensitive.
What’s really spooking the market is the combination of several things:
- A national security investigation
- Chip export controls
- Congressional inquiries
What makes things worse is that Nvidia has just been through a round of AI valuation declines, and now there’s another risk that almost no one had priced in before—Jensen Huang himself.
When the CEO himself becomes a risk factor, the story changes…
#黄仁勋 #英伟达
If this were just about an affair in his private life, $NVDA wouldn’t be this sensitive.
What’s really spooking the market is the combination of several things:
- A national security investigation
- Chip export controls
- Congressional inquiries
What makes things worse is that Nvidia has just been through a round of AI valuation declines, and now there’s another risk that almost no one had priced in before—Jensen Huang himself.
When the CEO himself becomes a risk factor, the story changes…
#黄仁勋 #英伟达
96
·
--
Bearish
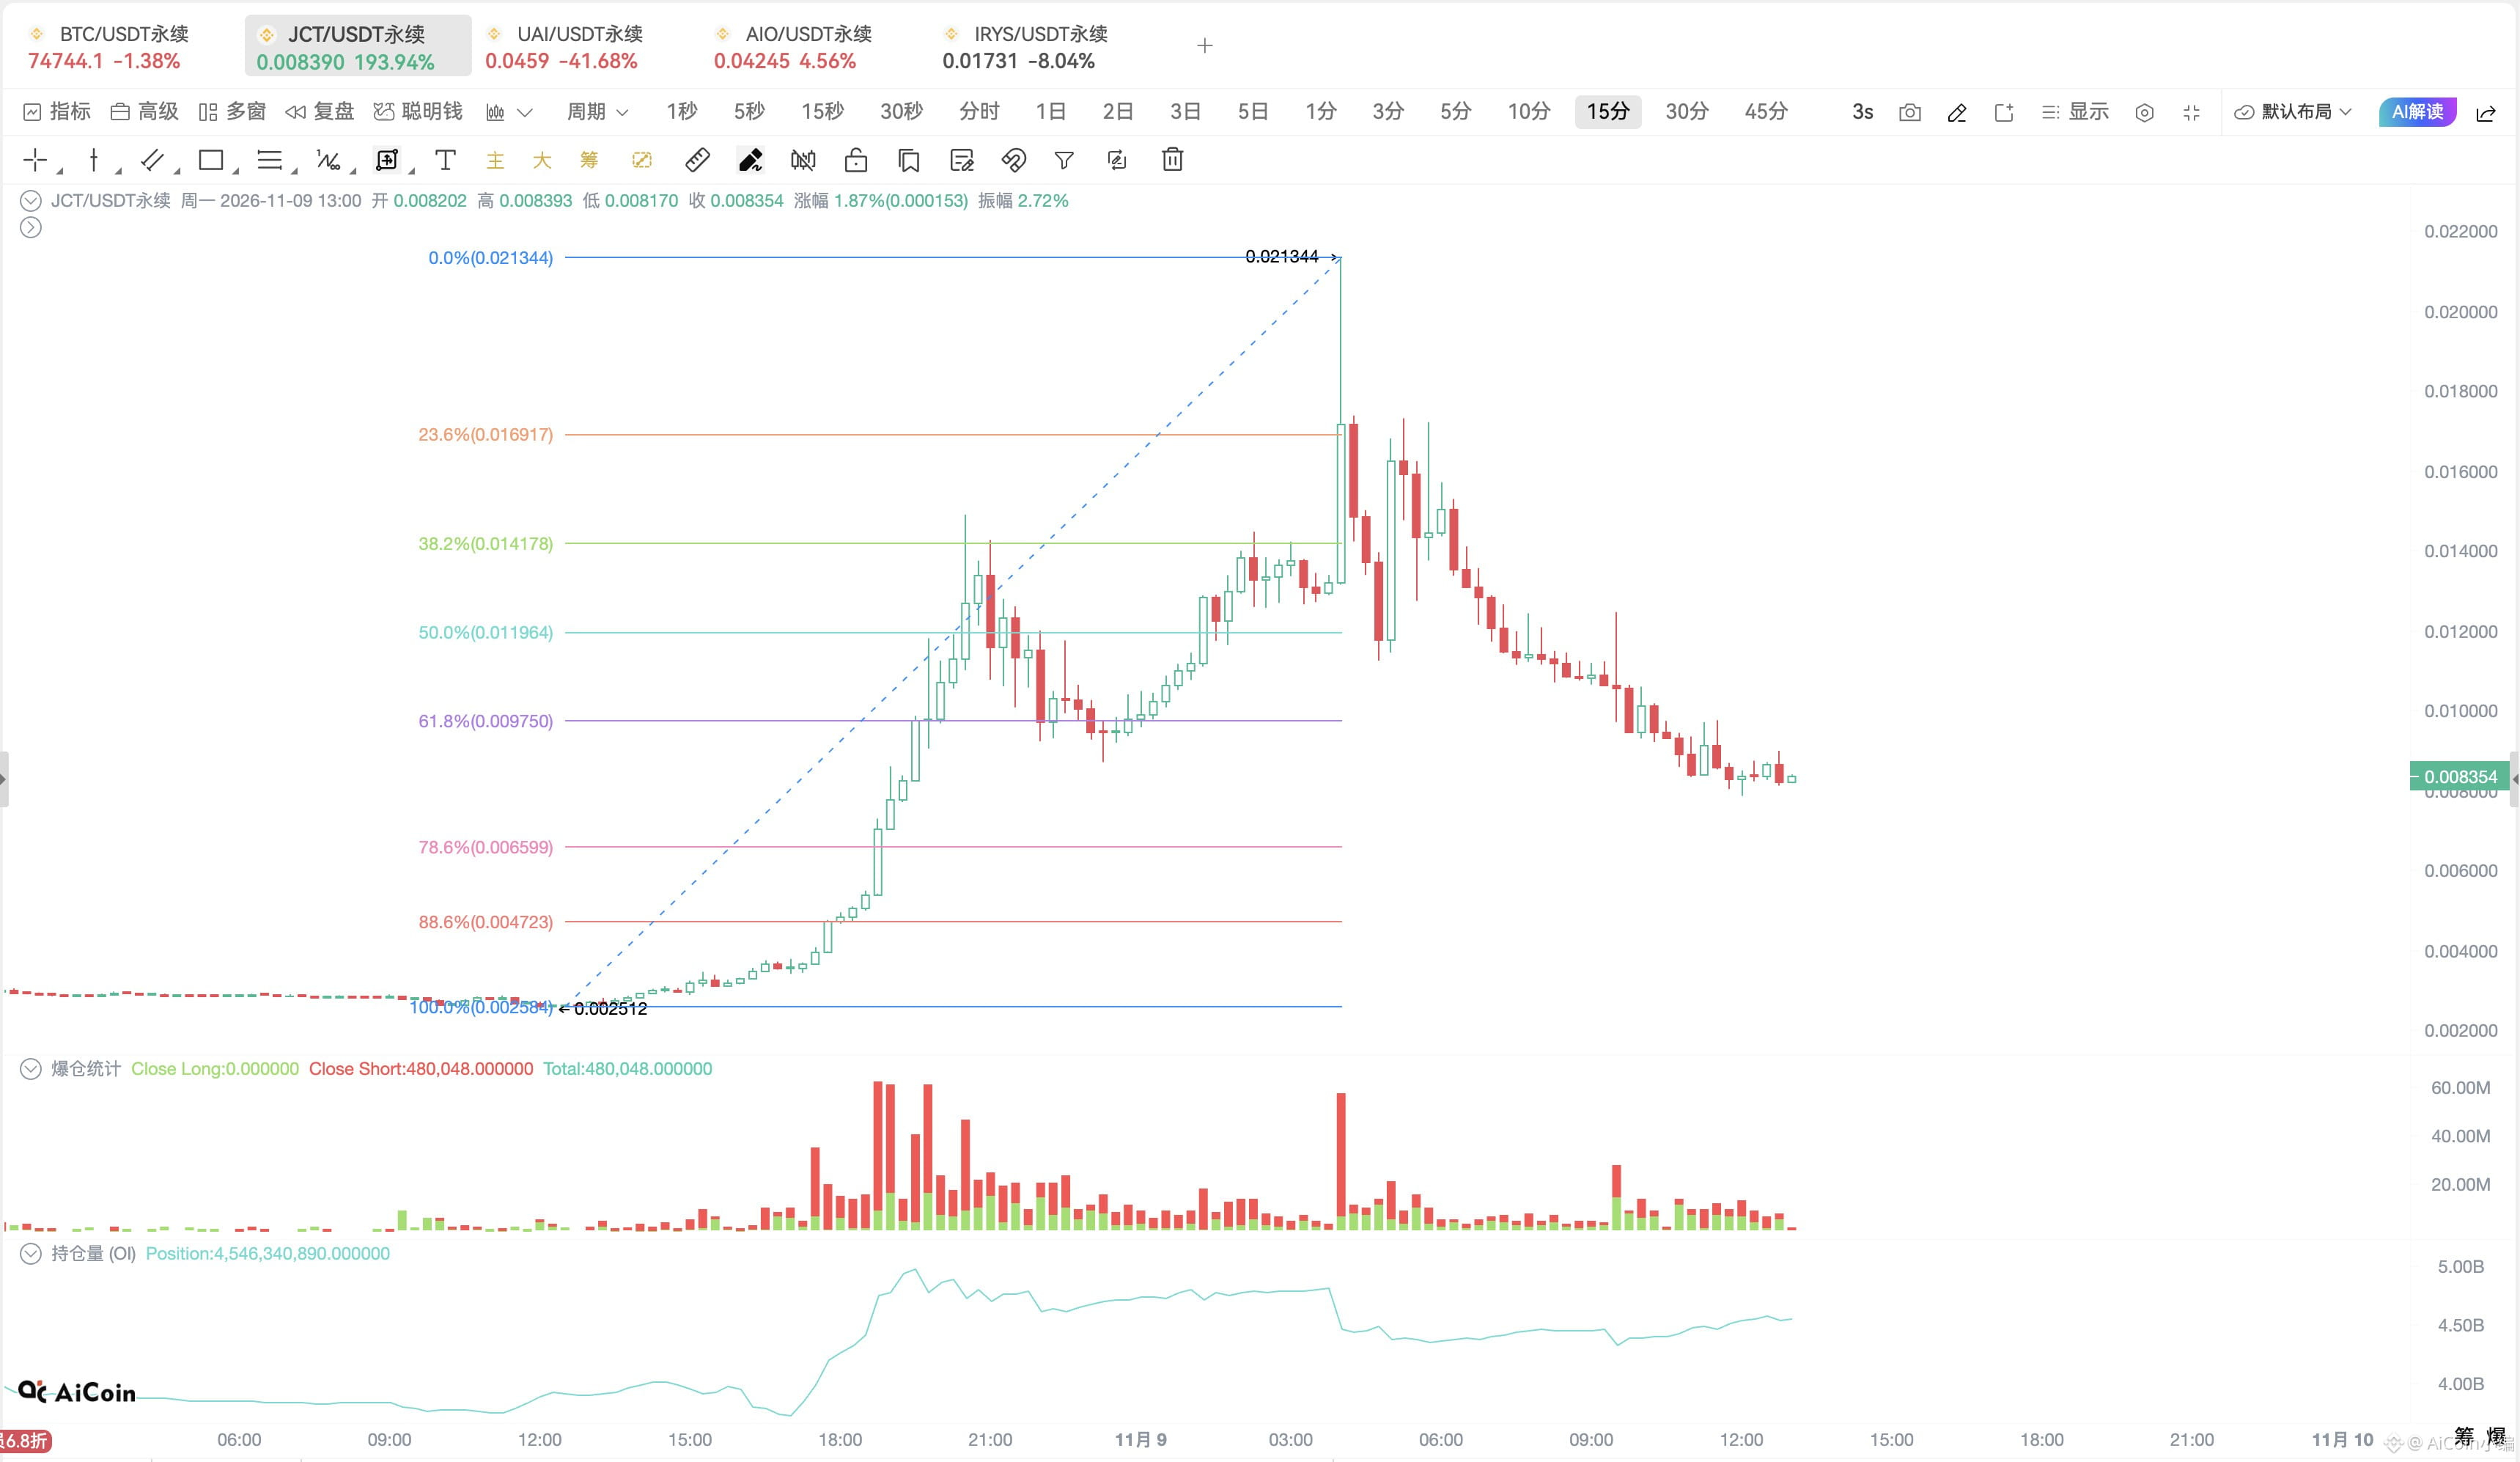
$JCT This move wiped out both longs and shorts 🤯
From a high of $0.0213, the price plunged all the way to around $0.008. It had surged 700%+ earlier, then promptly got cut in half.
Liquidations over the past 24 hours totaled nearly $22.5 million; $11.48 million were liquidated in just the past 12 hours, including $8.09 million in shorts and $3.39 million in longs.
Technically, the price has already fallen below the 50% ($0.01196) and 61.8% ($0.00975) retracement levels.
In the short term, the first thing to watch is whether it can reclaim $0.00975. If it can’t, keep an eye on the area around $0.00659 (78.6%) below.
P.S. The last one to have this kind of extreme roller-coaster ride was $IRYS , which is now down 96%+ from its high 😅
$JCT This move wiped out both longs and shorts 🤯
From a high of $0.0213, the price plunged all the way to around $0.008. It had surged 700%+ earlier, then promptly got cut in half.
Liquidations over the past 24 hours totaled nearly $22.5 million; $11.48 million were liquidated in just the past 12 hours, including $8.09 million in shorts and $3.39 million in longs.
Technically, the price has already fallen below the 50% ($0.01196) and 61.8% ($0.00975) retracement levels.
In the short term, the first thing to watch is whether it can reclaim $0.00975. If it can’t, keep an eye on the area around $0.00659 (78.6%) below.
P.S. The last one to have this kind of extreme roller-coaster ride was $IRYS , which is now down 96%+ from its high 😅
From a high of $0.0213, the price plunged all the way to around $0.008. It had surged 700%+ earlier, then promptly got cut in half.
Liquidations over the past 24 hours totaled nearly $22.5 million; $11.48 million were liquidated in just the past 12 hours, including $8.09 million in shorts and $3.39 million in longs.
Technically, the price has already fallen below the 50% ($0.01196) and 61.8% ($0.00975) retracement levels.
In the short term, the first thing to watch is whether it can reclaim $0.00975. If it can’t, keep an eye on the area around $0.00659 (78.6%) below.
P.S. The last one to have this kind of extreme roller-coaster ride was $IRYS , which is now down 96%+ from its high 😅
1
835
Log in to explore more content
Join global crypto users on Binance Square
⚡️ Get latest and useful information about crypto.
💬 Trusted by the world’s largest crypto exchange.
👍 Discover real insights from verified creators.
Email / Phone number
Trending Topics
AnthropicToDebutAfter$83IPOPricing
15,333 views
150 Discussing
Stock Futures Hold Near Flat as Anthropic Prices IPO at $83 Ahead of Debut
Binance News
·8 Likes
·7.6k views
BTCRemainsUnderPressureAfterHawkishFOMCMinutes
57,463 views
1,220 Discussing
NvidiaBoardReportedlySplitOverHuang’sReturn
19,065 views
590 Discussing