
BaykusCharts
413 Posts

BaykusCharts
 Square Verified
Report
Block User
13 Following
4.8K+ Followers
7.5K+ Liked
Posts
All
Quotes
Videos
PINNED
·
--
#Binance Launchpool project saw $#OMNI 55.
#Bitcoin Even though he had a bad week, $OMNI He left a sweet gift.
241k users $BNB
214k users participated in the staking program using $FDUSD .
Those who staked in the #BNB pool received 62% more returns than those who staked in the FDUSD pool (based on BNB = 574.2 USD)
Now all eyes are on the new #Launchpool project.
I hope it comes as soon as possible :)
#Binance Launchpool project saw $#OMNI 55.
#Bitcoin Even though he had a bad week, $OMNI He left a sweet gift.
241k users $BNB
214k users participated in the staking program using $FDUSD .
Those who staked in the #BNB pool received 62% more returns than those who staked in the FDUSD pool (based on BNB = 574.2 USD)
Now all eyes are on the new #Launchpool project.
I hope it comes as soon as possible :)
#Bitcoin Even though he had a bad week, $OMNI He left a sweet gift.
241k users $BNB
214k users participated in the staking program using $FDUSD .
Those who staked in the #BNB pool received 62% more returns than those who staked in the FDUSD pool (based on BNB = 574.2 USD)
Now all eyes are on the new #Launchpool project.
I hope it comes as soon as possible :)

47
1
49
195k
PINNED
·
--
Bullish
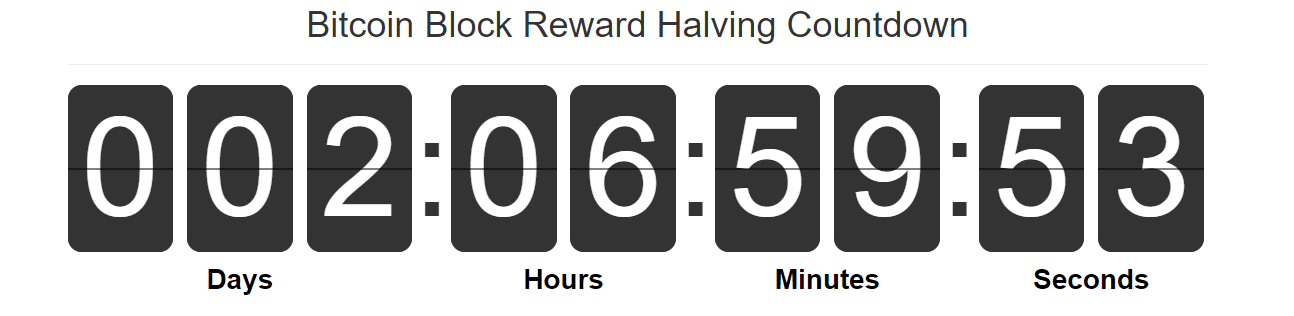
#Bitcoin Only a few days left for halving.
While the miner reward before the first halving was 50 #btc
It will be 3,125 with the last halving.
With the supply constantly decreasing, $BTC is making considerable gains.
Alright what now?
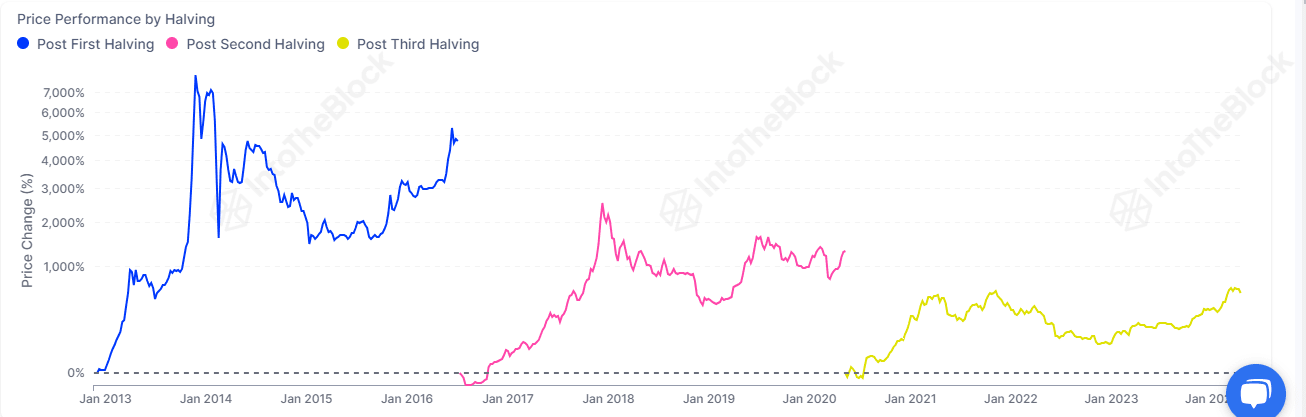
When we examine the previous movements, although there were very good increases after the Halving, BTC upward momentum has always lost its strength. Considering the regulations, this year may be the last period in which we will see incredible rises in altcoins.
Although short-term movements bother us as investors, it will not be possible to find these prices after a few months. Of course, it is not possible to call these bottoms, but they are definitely good places to buy.
So what do you think?
#Binance #ETH
#Bitcoin Only a few days left for halving.
While the miner reward before the first halving was 50 #btc
It will be 3,125 with the last halving.
With the supply constantly decreasing, $BTC is making considerable gains.
Alright what now?
When we examine the previous movements, although there were very good increases after the Halving, BTC upward momentum has always lost its strength. Considering the regulations, this year may be the last period in which we will see incredible rises in altcoins.
Although short-term movements bother us as investors, it will not be possible to find these prices after a few months. Of course, it is not possible to call these bottoms, but they are definitely good places to buy.
So what do you think?
#Binance #ETH
While the miner reward before the first halving was 50 #btc
It will be 3,125 with the last halving.
With the supply constantly decreasing, $BTC is making considerable gains.
Alright what now?
When we examine the previous movements, although there were very good increases after the Halving, BTC upward momentum has always lost its strength. Considering the regulations, this year may be the last period in which we will see incredible rises in altcoins.
Although short-term movements bother us as investors, it will not be possible to find these prices after a few months. Of course, it is not possible to call these bottoms, but they are definitely good places to buy.
So what do you think?
#Binance #ETH
5
13
115.9k
·
--
The rise in WLD this time is not visible only on the price chart: while the price rose 5.7%, spot volume increased by 179%, and buyers' share of taker trades climbed to 57.3%. The notable increase in the number of transactions also suggests that the move was not driven by a small number of large trades.
The fact that price, volume, and market participation are all moving in the same direction supports the rally with a stronger spot confirmation; however, since there is no open interest or funding data on the futures side, leverage contribution cannot be confirmed. The key point to watch is whether buyer flow and high trading activity will be sustained in the next candles.
The rise in WLD this time is not visible only on the price chart: while the price rose 5.7%, spot volume increased by 179%, and buyers' share of taker trades climbed to 57.3%. The notable increase in the number of transactions also suggests that the move was not driven by a small number of large trades.
The fact that price, volume, and market participation are all moving in the same direction supports the rally with a stronger spot confirmation; however, since there is no open interest or funding data on the futures side, leverage contribution cannot be confirmed. The key point to watch is whether buyer flow and high trading activity will be sustained in the next candles.
The fact that price, volume, and market participation are all moving in the same direction supports the rally with a stronger spot confirmation; however, since there is no open interest or funding data on the futures side, leverage contribution cannot be confirmed. The key point to watch is whether buyer flow and high trading activity will be sustained in the next candles.
104
·
--
While the price of TIA rose by 12.3%, market participation weakened significantly: spot volume fell by 41.7%, and the number of transactions declined by 20.7%. This suggests that the rally may have been driven more by price movement in existing trades than by new demand inflows.
The fact that taker buys were ahead at around 59% shows that buyer interest has not disappeared entirely; however, the declining volume and transaction count do not yet provide strong price confirmation. The only thing to watch is whether TIA’s rise will be supported by increasing volume and transaction participation.
While the price of TIA rose by 12.3%, market participation weakened significantly: spot volume fell by 41.7%, and the number of transactions declined by 20.7%. This suggests that the rally may have been driven more by price movement in existing trades than by new demand inflows.
The fact that taker buys were ahead at around 59% shows that buyer interest has not disappeared entirely; however, the declining volume and transaction count do not yet provide strong price confirmation. The only thing to watch is whether TIA’s rise will be supported by increasing volume and transaction participation.
The fact that taker buys were ahead at around 59% shows that buyer interest has not disappeared entirely; however, the declining volume and transaction count do not yet provide strong price confirmation. The only thing to watch is whether TIA’s rise will be supported by increasing volume and transaction participation.
44
·
--
The pullback in SAHARA is not a low-participation move: while the price fell 3.27%, spot volume surged 478.6% and the number of trades increased 198.5%. This picture shows that the decline occurred alongside clearly expanding market activity.
On the taker flow side, the share of selling reached 57.1%, while buyers appear to have struggled to stabilize the price. For now, the move can be read less as simple profit-taking and more as strengthening sell pressure accompanied by rising trading traffic. The key point to watch is whether the price confirms new lows while elevated volume is sustained.
The pullback in SAHARA is not a low-participation move: while the price fell 3.27%, spot volume surged 478.6% and the number of trades increased 198.5%. This picture shows that the decline occurred alongside clearly expanding market activity.
On the taker flow side, the share of selling reached 57.1%, while buyers appear to have struggled to stabilize the price. For now, the move can be read less as simple profit-taking and more as strengthening sell pressure accompanied by rising trading traffic. The key point to watch is whether the price confirms new lows while elevated volume is sustained.
On the taker flow side, the share of selling reached 57.1%, while buyers appear to have struggled to stabilize the price. For now, the move can be read less as simple profit-taking and more as strengthening sell pressure accompanied by rising trading traffic. The key point to watch is whether the price confirms new lows while elevated volume is sustained.
66
·
--
The rise in XLM comes alongside expanding market participation: the price increased by 2.84% over the last 24 hours, while spot volume rose by 317.6% and transaction count by 213.6%. Buyers also hold the advantage in taker trades at 60.4%.
This picture shows that the move is not driven by just a few large trades and that buyer flow is supporting the price. Still, the sharp jump in activity could increase short-term volatility; the durability of the rally is not yet guaranteed. The key point to watch is whether buyer dominance continues while the increased volume is sustained.
The rise in XLM comes alongside expanding market participation: the price increased by 2.84% over the last 24 hours, while spot volume rose by 317.6% and transaction count by 213.6%. Buyers also hold the advantage in taker trades at 60.4%.
This picture shows that the move is not driven by just a few large trades and that buyer flow is supporting the price. Still, the sharp jump in activity could increase short-term volatility; the durability of the rally is not yet guaranteed. The key point to watch is whether buyer dominance continues while the increased volume is sustained.
This picture shows that the move is not driven by just a few large trades and that buyer flow is supporting the price. Still, the sharp jump in activity could increase short-term volatility; the durability of the rally is not yet guaranteed. The key point to watch is whether buyer dominance continues while the increased volume is sustained.
29
·
--
The decline in HEMI is not a low-participation pullback: while the price fell 21.2% in 24 hours, spot volume surged 749%. The sharp expansion in the number of transactions shows that the move was not driven by just a few large trades and that heavy market participation came in.
The share of sells in taker flow is at 57%; this indicates that the rising activity has not yet been balanced by buyers. Although the oversold picture does not rule out the possibility of a rebound, the data at this stage does not confirm a bottom. The main point to watch is whether HEMI will make new lows while sell volume remains high.
The decline in HEMI is not a low-participation pullback: while the price fell 21.2% in 24 hours, spot volume surged 749%. The sharp expansion in the number of transactions shows that the move was not driven by just a few large trades and that heavy market participation came in.
The share of sells in taker flow is at 57%; this indicates that the rising activity has not yet been balanced by buyers. Although the oversold picture does not rule out the possibility of a rebound, the data at this stage does not confirm a bottom. The main point to watch is whether HEMI will make new lows while sell volume remains high.
The share of sells in taker flow is at 57%; this indicates that the rising activity has not yet been balanced by buyers. Although the oversold picture does not rule out the possibility of a rebound, the data at this stage does not confirm a bottom. The main point to watch is whether HEMI will make new lows while sell volume remains high.
186
·
--
The sharp drop in SCRT appears to be driven more by selling flow than by an ordinary price move: while spot volume rose 286%, the price fell 23.7% in 24 hours.
With 63% of trades occurring on the sell side, the increased activity is not generating buyer confirmation. This suggests that the current weakness is being supported by real selling pressure; however, since futures market data is unavailable, the leverage component of the move cannot be confirmed.
The key point to watch is whether the price can find balance in the next candles as selling volume declines.
The sharp drop in SCRT appears to be driven more by selling flow than by an ordinary price move: while spot volume rose 286%, the price fell 23.7% in 24 hours.
With 63% of trades occurring on the sell side, the increased activity is not generating buyer confirmation. This suggests that the current weakness is being supported by real selling pressure; however, since futures market data is unavailable, the leverage component of the move cannot be confirmed.
The key point to watch is whether the price can find balance in the next candles as selling volume declines.
With 63% of trades occurring on the sell side, the increased activity is not generating buyer confirmation. This suggests that the current weakness is being supported by real selling pressure; however, since futures market data is unavailable, the leverage component of the move cannot be confirmed.
The key point to watch is whether the price can find balance in the next candles as selling volume declines.
·
--
While the price on ARB fell by 8.6%, spot activity accelerated in the opposite direction: despite volume rising by 174.9%, 60.9% of taker trades were on the buy side.
This picture shows that buyers entered the market, but sales met that flow and pushed the price down. Therefore, rising volume alone is not a strong confirmation of demand; buyer flow is not affecting price for now.
The key point to watch here is whether the ARB price will stabilize while taker buy dominance is maintained. If the price continues to fall, the scenario that current buying is being absorbed and selling pressure is outweighing it may strengthen.
While the price on ARB fell by 8.6%, spot activity accelerated in the opposite direction: despite volume rising by 174.9%, 60.9% of taker trades were on the buy side.
This picture shows that buyers entered the market, but sales met that flow and pushed the price down. Therefore, rising volume alone is not a strong confirmation of demand; buyer flow is not affecting price for now.
The key point to watch here is whether the ARB price will stabilize while taker buy dominance is maintained. If the price continues to fall, the scenario that current buying is being absorbed and selling pressure is outweighing it may strengthen.
This picture shows that buyers entered the market, but sales met that flow and pushed the price down. Therefore, rising volume alone is not a strong confirmation of demand; buyer flow is not affecting price for now.
The key point to watch here is whether the ARB price will stabilize while taker buy dominance is maintained. If the price continues to fall, the scenario that current buying is being absorbed and selling pressure is outweighing it may strengthen.
2
·
--
While the price of ARB fell 7.8%, spot volume rose 174.9%; however, the critical detail is that 60.9% of taker transactions were on the buy side.
In other words, even though buyers are clearly active, the price is still falling. This shows that aggressive buying is being absorbed by sell orders on the other side, and the rising activity has not yet produced an upward confirmation.
The main point to watch here is whether ARB can stop its decline while buyer dominance is maintained. If buying flow weakens before the price recovers, selling pressure could become more pronounced.
While the price of ARB fell 7.8%, spot volume rose 174.9%; however, the critical detail is that 60.9% of taker transactions were on the buy side.
In other words, even though buyers are clearly active, the price is still falling. This shows that aggressive buying is being absorbed by sell orders on the other side, and the rising activity has not yet produced an upward confirmation.
The main point to watch here is whether ARB can stop its decline while buyer dominance is maintained. If buying flow weakens before the price recovers, selling pressure could become more pronounced.
In other words, even though buyers are clearly active, the price is still falling. This shows that aggressive buying is being absorbed by sell orders on the other side, and the rising activity has not yet produced an upward confirmation.
The main point to watch here is whether ARB can stop its decline while buyer dominance is maintained. If buying flow weakens before the price recovers, selling pressure could become more pronounced.
1
·
--
Despite the sell-off on ARB, buyer flow remains notable: while price fell 11%, spot volume rose 175%.
60.9% of taker transactions were on the buy side. This suggests the decline was not a low-participation pullback; however, buyers have not yet been able to turn the increased selling pressure into price dominance.
A structure may have formed here in which buying is absorbing selling, but that alone does not confirm a reversal. The key point to watch is whether ARB price can stop the downward momentum while buyer dominance is maintained.
Despite the sell-off on ARB, buyer flow remains notable: while price fell 11%, spot volume rose 175%.
60.9% of taker transactions were on the buy side. This suggests the decline was not a low-participation pullback; however, buyers have not yet been able to turn the increased selling pressure into price dominance.
A structure may have formed here in which buying is absorbing selling, but that alone does not confirm a reversal. The key point to watch is whether ARB price can stop the downward momentum while buyer dominance is maintained.
60.9% of taker transactions were on the buy side. This suggests the decline was not a low-participation pullback; however, buyers have not yet been able to turn the increased selling pressure into price dominance.
A structure may have formed here in which buying is absorbing selling, but that alone does not confirm a reversal. The key point to watch is whether ARB price can stop the downward momentum while buyer dominance is maintained.
76
·
--
While the price on PROM rose by 8.2%, spot volume fell by 39.4%; however, the number of transactions increased by 174.9%.
This divergence suggests that market participation has increased, but trades are being split into smaller volumes. Since sellers are slightly ahead in taker flow, the rally has not yet been clearly confirmed by strong buyer demand.
The key point to watch for the sustainability of the move is whether the rising number of transactions will be supported by volume increasing again and clear buyer dominance.
While the price on PROM rose by 8.2%, spot volume fell by 39.4%; however, the number of transactions increased by 174.9%.
This divergence suggests that market participation has increased, but trades are being split into smaller volumes. Since sellers are slightly ahead in taker flow, the rally has not yet been clearly confirmed by strong buyer demand.
The key point to watch for the sustainability of the move is whether the rising number of transactions will be supported by volume increasing again and clear buyer dominance.
This divergence suggests that market participation has increased, but trades are being split into smaller volumes. Since sellers are slightly ahead in taker flow, the rally has not yet been clearly confirmed by strong buyer demand.
The key point to watch for the sustainability of the move is whether the rising number of transactions will be supported by volume increasing again and clear buyer dominance.
2
·
--
The price on PROM is rising, but the money flowing into the market isn’t growing at the same pace: while spot volume fell by 39.4%, the number of transactions increased by 174.9%.
The price is up 5.2% over the past 24 hours. This suggests that, despite more trades taking place, the average trade size has shrunk because total volume is declining, and the rally is not being confirmed by strong capital inflows.
Moreover, sellers are slightly ahead in taker flow; so the move may be forming more through scattered, low-value trades than through clear buyer dominance. The main point to watch here is whether the price increase will be supported by rising spot volume again.
The price on PROM is rising, but the money flowing into the market isn’t growing at the same pace: while spot volume fell by 39.4%, the number of transactions increased by 174.9%.
The price is up 5.2% over the past 24 hours. This suggests that, despite more trades taking place, the average trade size has shrunk because total volume is declining, and the rally is not being confirmed by strong capital inflows.
Moreover, sellers are slightly ahead in taker flow; so the move may be forming more through scattered, low-value trades than through clear buyer dominance. The main point to watch here is whether the price increase will be supported by rising spot volume again.
The price is up 5.2% over the past 24 hours. This suggests that, despite more trades taking place, the average trade size has shrunk because total volume is declining, and the rally is not being confirmed by strong capital inflows.
Moreover, sellers are slightly ahead in taker flow; so the move may be forming more through scattered, low-value trades than through clear buyer dominance. The main point to watch here is whether the price increase will be supported by rising spot volume again.
3
·
--
A critical divergence emerged in TRUMP: spot volume quadrupled while price fell 4%, and 57.5% of taker trades were on the buy side.
In other words, even though new buyers entered the market, price was unable to lift in response to that demand. The increase in volume and buyer dominance may indicate a structure where selling is meeting buying, or where existing positions are being distributed; the data alone does not confirm the direction.
The key point to watch here is whether price can recover again despite the continued buyer flow. If the buy ratio declines and price pressure persists, the elevated activity could turn into a more pronounced sign of weakness.
A critical divergence emerged in TRUMP: spot volume quadrupled while price fell 4%, and 57.5% of taker trades were on the buy side.
In other words, even though new buyers entered the market, price was unable to lift in response to that demand. The increase in volume and buyer dominance may indicate a structure where selling is meeting buying, or where existing positions are being distributed; the data alone does not confirm the direction.
The key point to watch here is whether price can recover again despite the continued buyer flow. If the buy ratio declines and price pressure persists, the elevated activity could turn into a more pronounced sign of weakness.
In other words, even though new buyers entered the market, price was unable to lift in response to that demand. The increase in volume and buyer dominance may indicate a structure where selling is meeting buying, or where existing positions are being distributed; the data alone does not confirm the direction.
The key point to watch here is whether price can recover again despite the continued buyer flow. If the buy ratio declines and price pressure persists, the elevated activity could turn into a more pronounced sign of weakness.
9
·
--
Despite volume on TRUMP increasing 4x and buyers coming to the fore, the price fell 5.1%: 57.5% of taker transactions took place on the buy side.
Although this marked increase in spot activity, the price decline suggests that buyer flow is not sufficient for now and that selling is meeting incoming demand. Rather than providing a clear bullish confirmation, this structure points to a divergence where buying is being absorbed.
The main point to watch here is whether TRUMP’s price can recover while buyer dominance is maintained; if no recovery follows, the higher volume could strengthen the risk of distribution.
Despite volume on TRUMP increasing 4x and buyers coming to the fore, the price fell 5.1%: 57.5% of taker transactions took place on the buy side.
Although this marked increase in spot activity, the price decline suggests that buyer flow is not sufficient for now and that selling is meeting incoming demand. Rather than providing a clear bullish confirmation, this structure points to a divergence where buying is being absorbed.
The main point to watch here is whether TRUMP’s price can recover while buyer dominance is maintained; if no recovery follows, the higher volume could strengthen the risk of distribution.
Although this marked increase in spot activity, the price decline suggests that buyer flow is not sufficient for now and that selling is meeting incoming demand. Rather than providing a clear bullish confirmation, this structure points to a divergence where buying is being absorbed.
The main point to watch here is whether TRUMP’s price can recover while buyer dominance is maintained; if no recovery follows, the higher volume could strengthen the risk of distribution.
30
·
--
While price on TRUMP fell 5.4%, buyers were ahead in the spot market: despite volume increasing by 409%, 57.5% of taker trades were on the buy side.
This divergence shows that the rising buying flow was not enough to support the price. A structure may have formed in which selling absorbed the buying; therefore, a rise in volume alone does not confirm a rebound.
The main point to watch here is whether the price can find balance again while buyer dominance is maintained. If the price continues to decline, it may indicate that the seemingly strong spot demand is being met in the market.
While price on TRUMP fell 5.4%, buyers were ahead in the spot market: despite volume increasing by 409%, 57.5% of taker trades were on the buy side.
This divergence shows that the rising buying flow was not enough to support the price. A structure may have formed in which selling absorbed the buying; therefore, a rise in volume alone does not confirm a rebound.
The main point to watch here is whether the price can find balance again while buyer dominance is maintained. If the price continues to decline, it may indicate that the seemingly strong spot demand is being met in the market.
This divergence shows that the rising buying flow was not enough to support the price. A structure may have formed in which selling absorbed the buying; therefore, a rise in volume alone does not confirm a rebound.
The main point to watch here is whether the price can find balance again while buyer dominance is maintained. If the price continues to decline, it may indicate that the seemingly strong spot demand is being met in the market.
70
·
--
As transaction activity on PUMP accelerates, the price is not reacting: spot volume rose 125.7%, and the number of transactions increased 139.2%.
However, the flow does not confirm buyers; in taker trades, the sell side leads with 56.7%, and the trend outlook has shifted to a “strong bearish” structure. This picture suggests that the rising activity may be more of a directionless or distribution-leaning setup that puts pressure on price, rather than an upward move driven by new demand.
The key point to watch here is whether seller dominance will continue while high transaction traffic is maintained.
As transaction activity on PUMP accelerates, the price is not reacting: spot volume rose 125.7%, and the number of transactions increased 139.2%.
However, the flow does not confirm buyers; in taker trades, the sell side leads with 56.7%, and the trend outlook has shifted to a “strong bearish” structure. This picture suggests that the rising activity may be more of a directionless or distribution-leaning setup that puts pressure on price, rather than an upward move driven by new demand.
The key point to watch here is whether seller dominance will continue while high transaction traffic is maintained.
However, the flow does not confirm buyers; in taker trades, the sell side leads with 56.7%, and the trend outlook has shifted to a “strong bearish” structure. This picture suggests that the rising activity may be more of a directionless or distribution-leaning setup that puts pressure on price, rather than an upward move driven by new demand.
The key point to watch here is whether seller dominance will continue while high transaction traffic is maintained.
17
·
--
While the price on PROM rose 7.6%, spot volume fell 68.9%; however, the critical detail is that activity did not disappear.
As the number of transactions increased by 107.6%, taker flow also points to the buy side. This suggests that the rise was driven more by a larger number of small trades than by large-volume purchases.
In other words, while the price looks strong, volume confirmation is weak; if new demand does not continue supporting the move, momentum may remain fragile. The main point to watch here is whether the rising number of transactions will come together with spot volume rising again.
While the price on PROM rose 7.6%, spot volume fell 68.9%; however, the critical detail is that activity did not disappear.
As the number of transactions increased by 107.6%, taker flow also points to the buy side. This suggests that the rise was driven more by a larger number of small trades than by large-volume purchases.
In other words, while the price looks strong, volume confirmation is weak; if new demand does not continue supporting the move, momentum may remain fragile. The main point to watch here is whether the rising number of transactions will come together with spot volume rising again.
As the number of transactions increased by 107.6%, taker flow also points to the buy side. This suggests that the rise was driven more by a larger number of small trades than by large-volume purchases.
In other words, while the price looks strong, volume confirmation is weak; if new demand does not continue supporting the move, momentum may remain fragile. The main point to watch here is whether the rising number of transactions will come together with spot volume rising again.
4
·
--
The decline in MARSCOIN is not just about price movement: rising activity is coming with a clear advantage for sellers.
Spot volume rose by 169.6%, while the price fell by 35.9% over 24 hours. The fact that 60.4% of taker trades were on the sell side shows that the increased volume was supported by real selling flow, not strong buyer demand.
This picture suggests that the pullback is not a low-participation move and that distribution pressure is coming to the fore; however, futures market data does not confirm positioning. The main point to watch here is whether the price will make new lows while sell volume remains high.
The decline in MARSCOIN is not just about price movement: rising activity is coming with a clear advantage for sellers.
Spot volume rose by 169.6%, while the price fell by 35.9% over 24 hours. The fact that 60.4% of taker trades were on the sell side shows that the increased volume was supported by real selling flow, not strong buyer demand.
This picture suggests that the pullback is not a low-participation move and that distribution pressure is coming to the fore; however, futures market data does not confirm positioning. The main point to watch here is whether the price will make new lows while sell volume remains high.
Spot volume rose by 169.6%, while the price fell by 35.9% over 24 hours. The fact that 60.4% of taker trades were on the sell side shows that the increased volume was supported by real selling flow, not strong buyer demand.
This picture suggests that the pullback is not a low-participation move and that distribution pressure is coming to the fore; however, futures market data does not confirm positioning. The main point to watch here is whether the price will make new lows while sell volume remains high.
3
·
--
PROM is rising in price, but volume is not supporting the move: while price increased 6.5% in 24 hours, spot volume fell 68.9%.
On the other hand, 74.3% of taker transactions were on the buy side, and the number of transactions has also increased significantly compared with the previous period. In other words, market participation may be increasing while the average trade size has decreased; there is buyer interest, but total liquidity flow is weakening.
This picture does not completely invalidate the rally, but it also does not prove that the move is backed by strong capital inflows. The key point to watch here is whether spot volume will recover as the price rises.
PROM is rising in price, but volume is not supporting the move: while price increased 6.5% in 24 hours, spot volume fell 68.9%.
On the other hand, 74.3% of taker transactions were on the buy side, and the number of transactions has also increased significantly compared with the previous period. In other words, market participation may be increasing while the average trade size has decreased; there is buyer interest, but total liquidity flow is weakening.
This picture does not completely invalidate the rally, but it also does not prove that the move is backed by strong capital inflows. The key point to watch here is whether spot volume will recover as the price rises.
On the other hand, 74.3% of taker transactions were on the buy side, and the number of transactions has also increased significantly compared with the previous period. In other words, market participation may be increasing while the average trade size has decreased; there is buyer interest, but total liquidity flow is weakening.
This picture does not completely invalidate the rally, but it also does not prove that the move is backed by strong capital inflows. The key point to watch here is whether spot volume will recover as the price rises.
37
Log in to explore more content
Join global crypto users on Binance Square
⚡️ Get latest and useful information about crypto.
💬 Trusted by the world’s largest crypto exchange.
👍 Discover real insights from verified creators.
Email / Phone number
Trending Topics
FedRateWatch
523,154 views
2,572 Discussing
Share & Win Traffic Reward in our Trending Hashtag Campaign
✨Topic: FOMC September, What's The Fed's Next Move?
👉How to Join:
Publish a short post or article with hashtag #FedRateWatch
Create content based on the below angles:
- August core CPI rose 0.3% month-over-month, and the odds of a 25bp hike this week are now close to 90%. Do you anticipate a rate hike this week? Is it a one-off, or the start of a longer hiking cycle?
- If the hike lands, how does it play out for BTC, tech stocks, and gold? Bullish or bearish?
- How are you planning to trade next? Share your BTC, stocks or gold trade/holdings with our trade sharing widget.
⏰Campaign Period:
- 2026-09-15 11:00 - 2026-09-17 3:00 UTC
🎁Reward:
- Qualified posts that comply with the above guidelines and contain more than 100 words will be reviewed and may receive a random traffic boost of 500 to 3,000 views. You will receive a notification from your feed secretary if your post is selected.
- Get a chance to have your article featured on Binance Square Official
Need ideas for your post? Visit the topic page #FedRateWatch or the Square Guide on How to Post for Better Reach.
Binance Square Official
·372 Likes
·807.4k views
BitcoinSlidesTo$76000
18,280 views
111 Discussing
BitcoinReboundsTo$79K
60,763 views
399 Discussing