

Koiisyourname
mình đăng bài chỉ để nhắc nhở bản thân khi vào lệnh, không mục đích kêu gọi, tạo nhóm hay bất cứ lý do gì khác…
Frequent Trader
5 Years
1 Following
4.1K+ Followers
29.7K+ Liked
Posts
All
Quotes
Koiisyourname
·
--
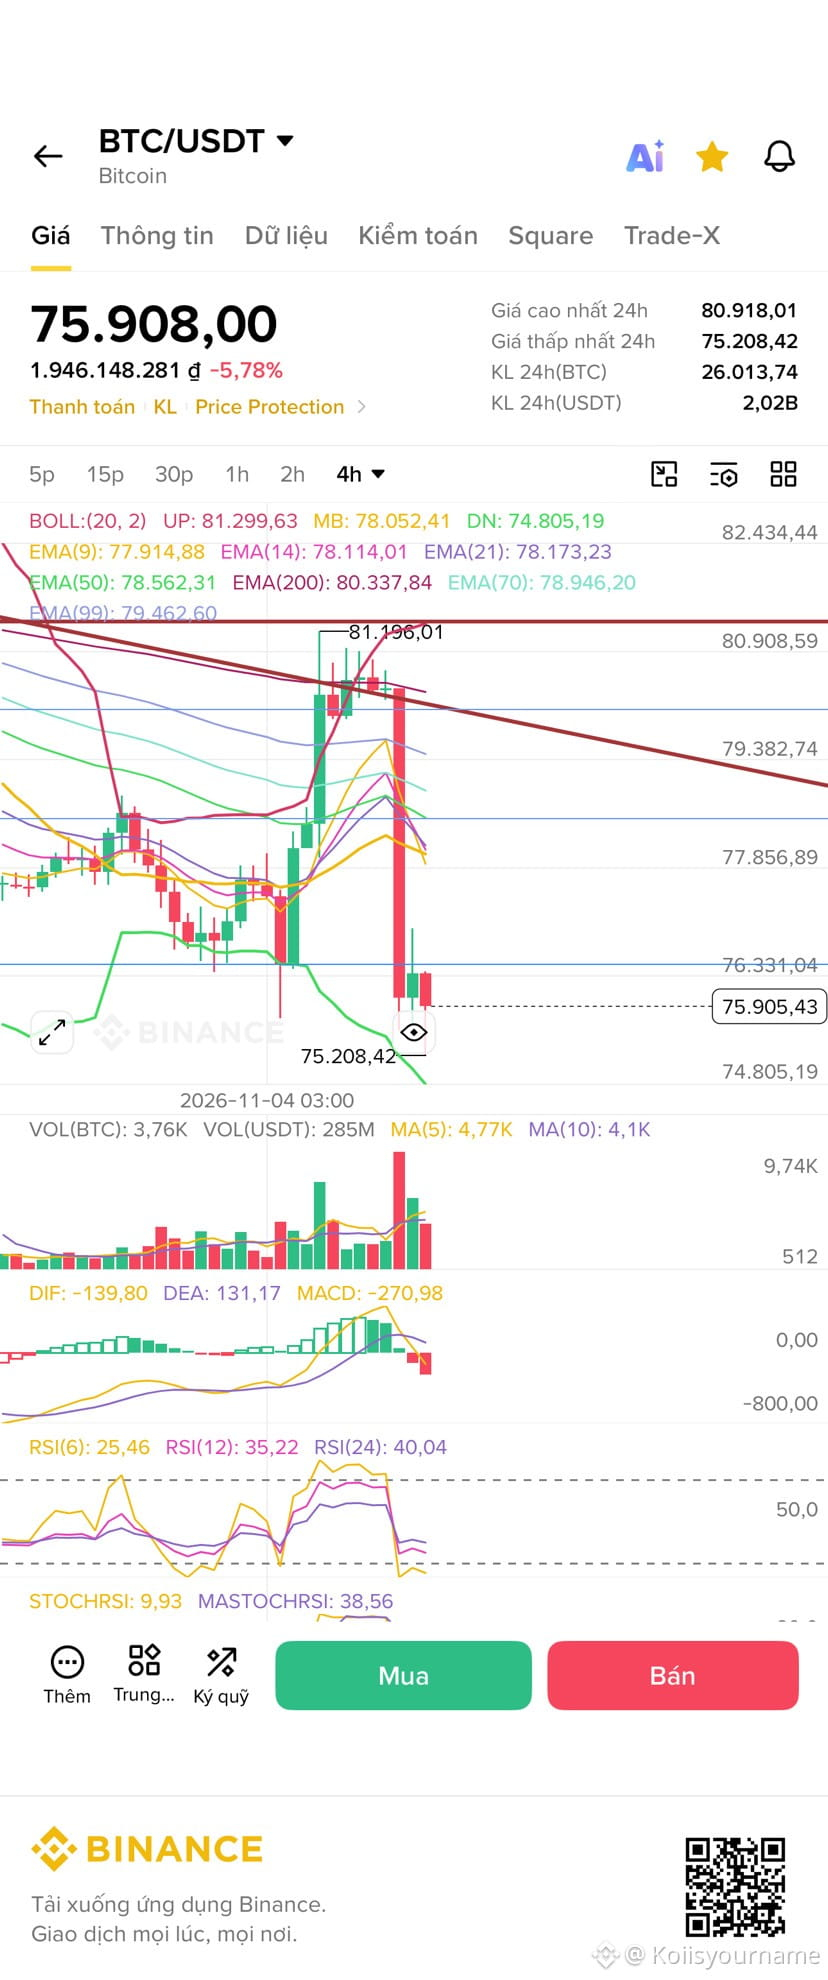
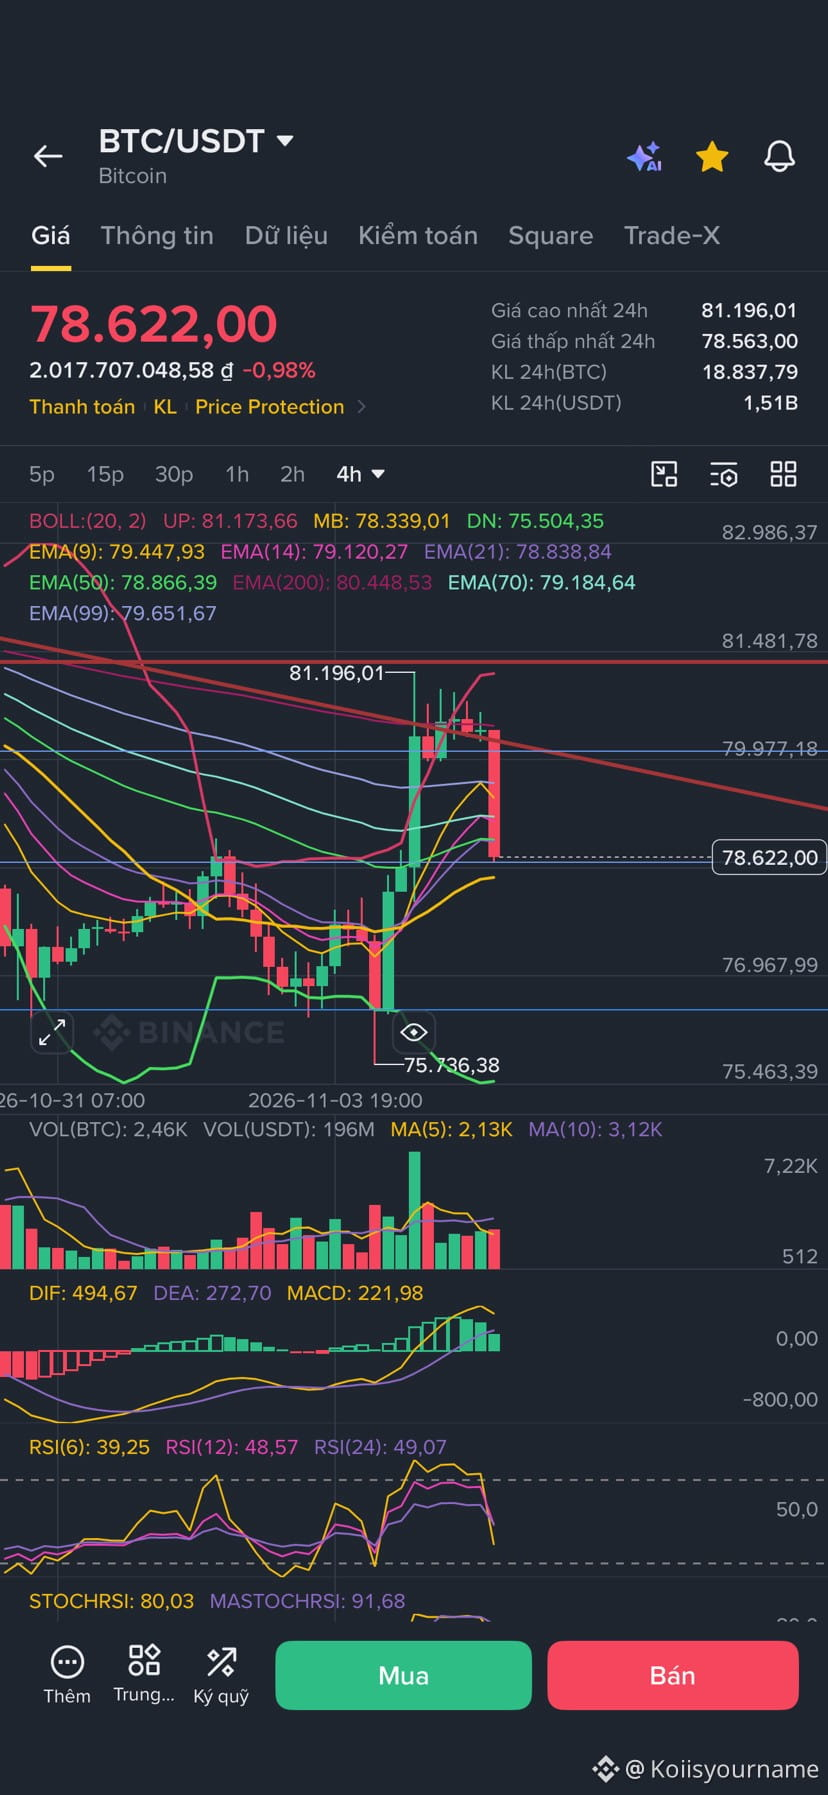
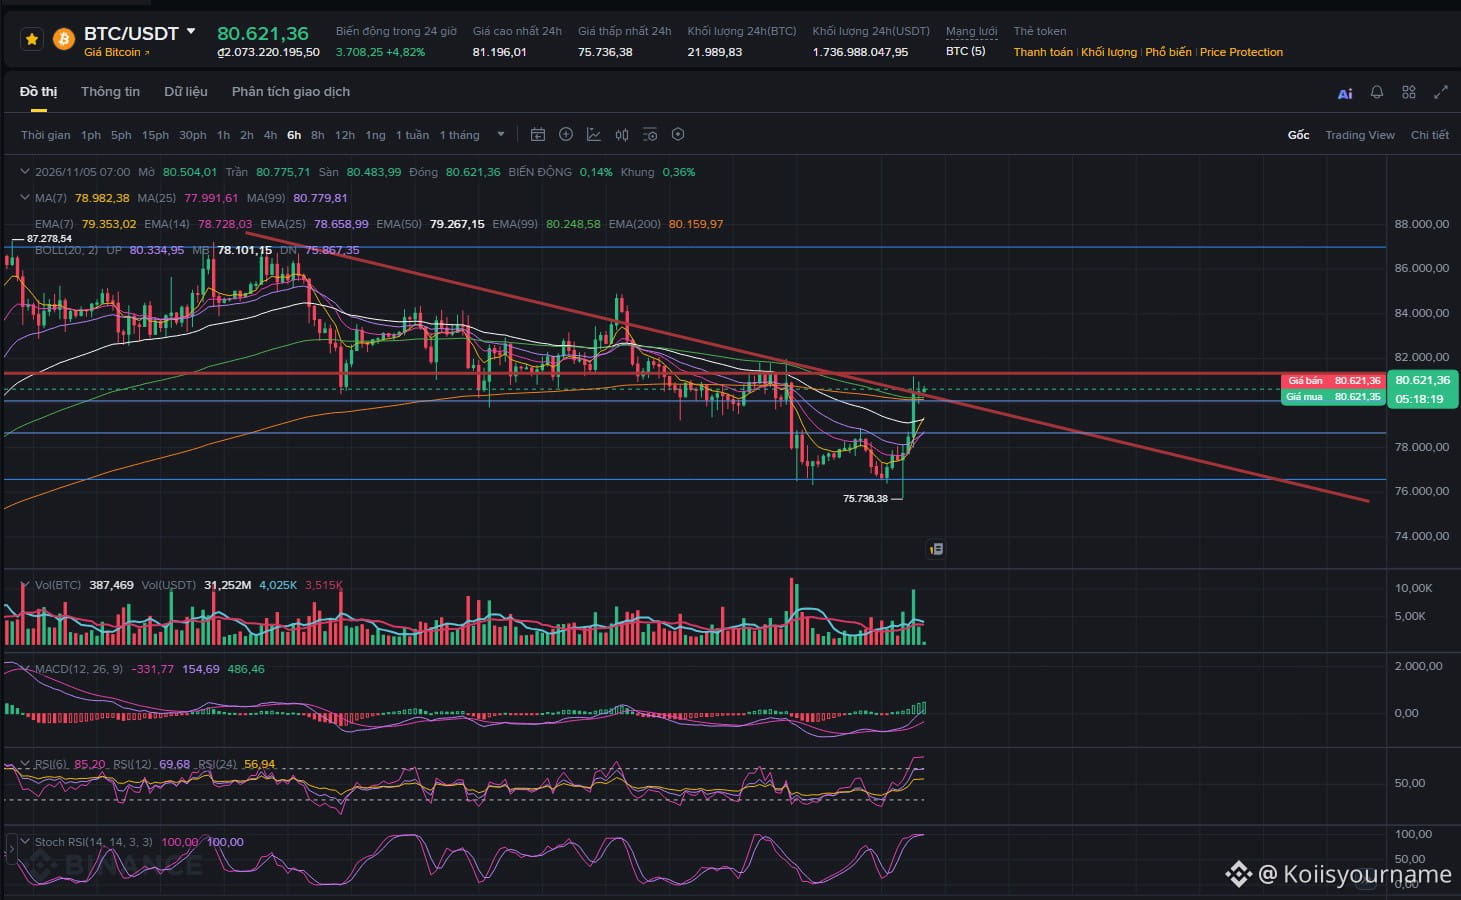
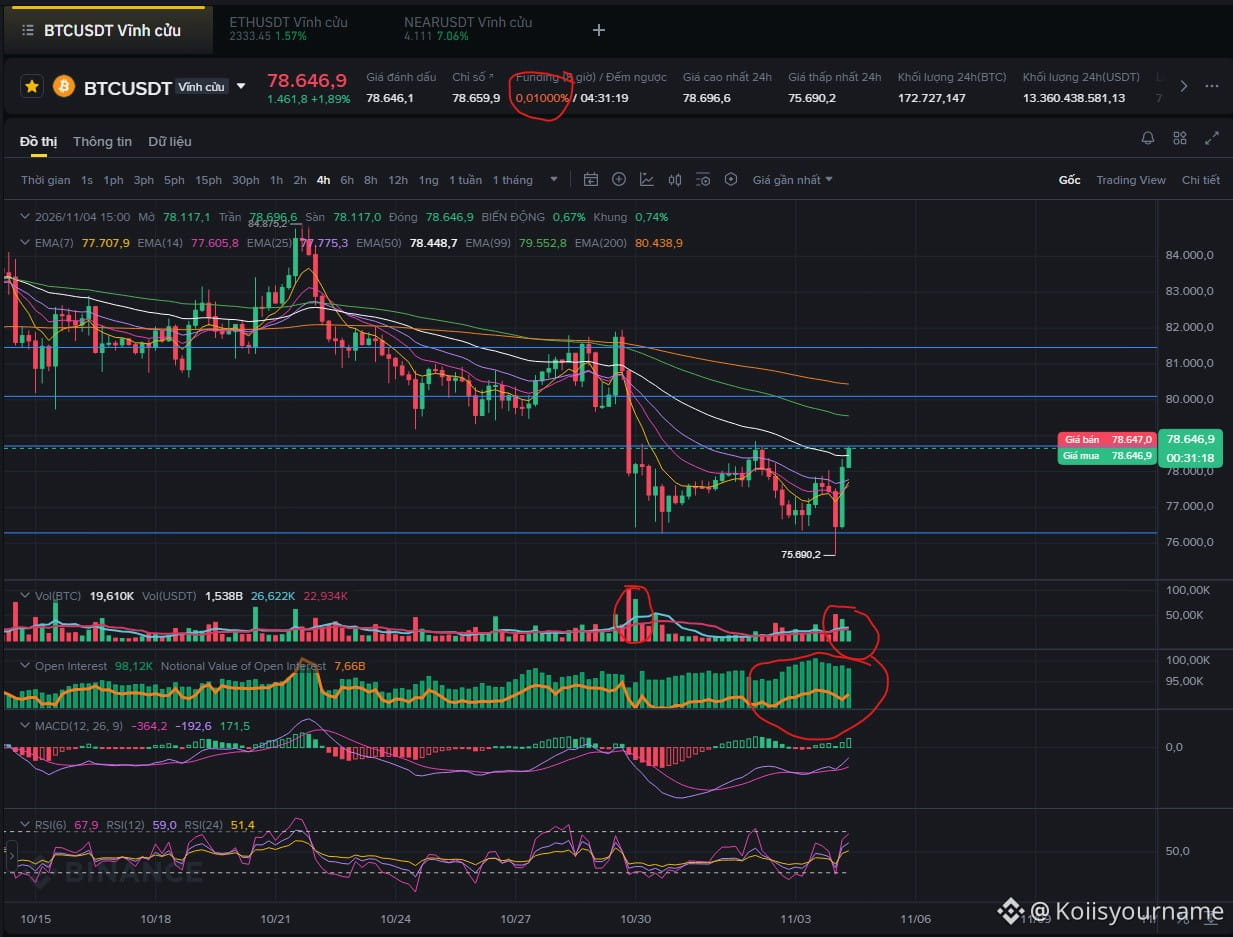
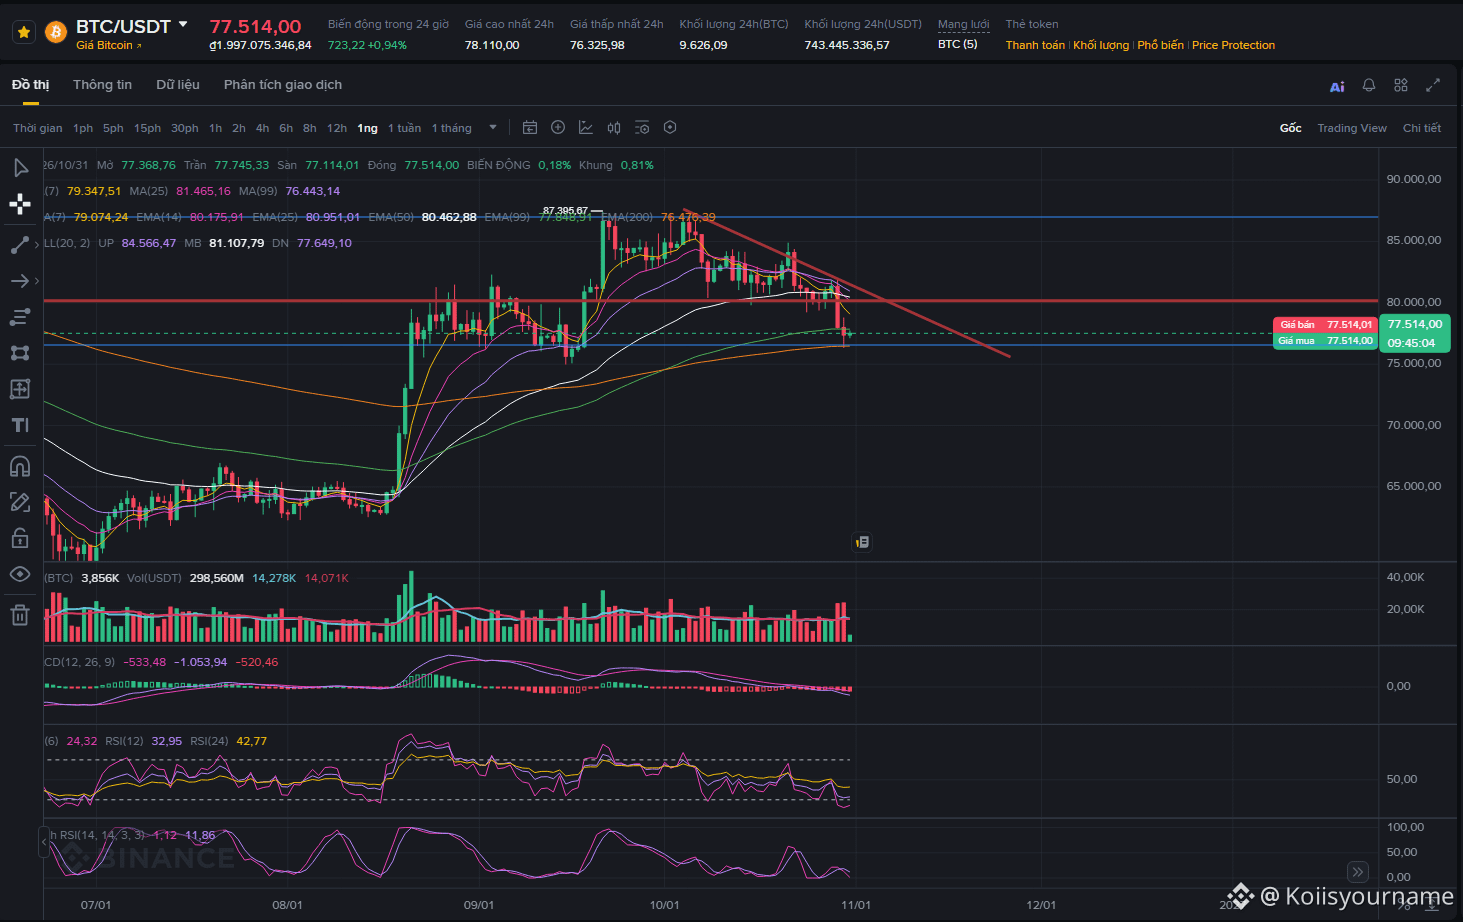
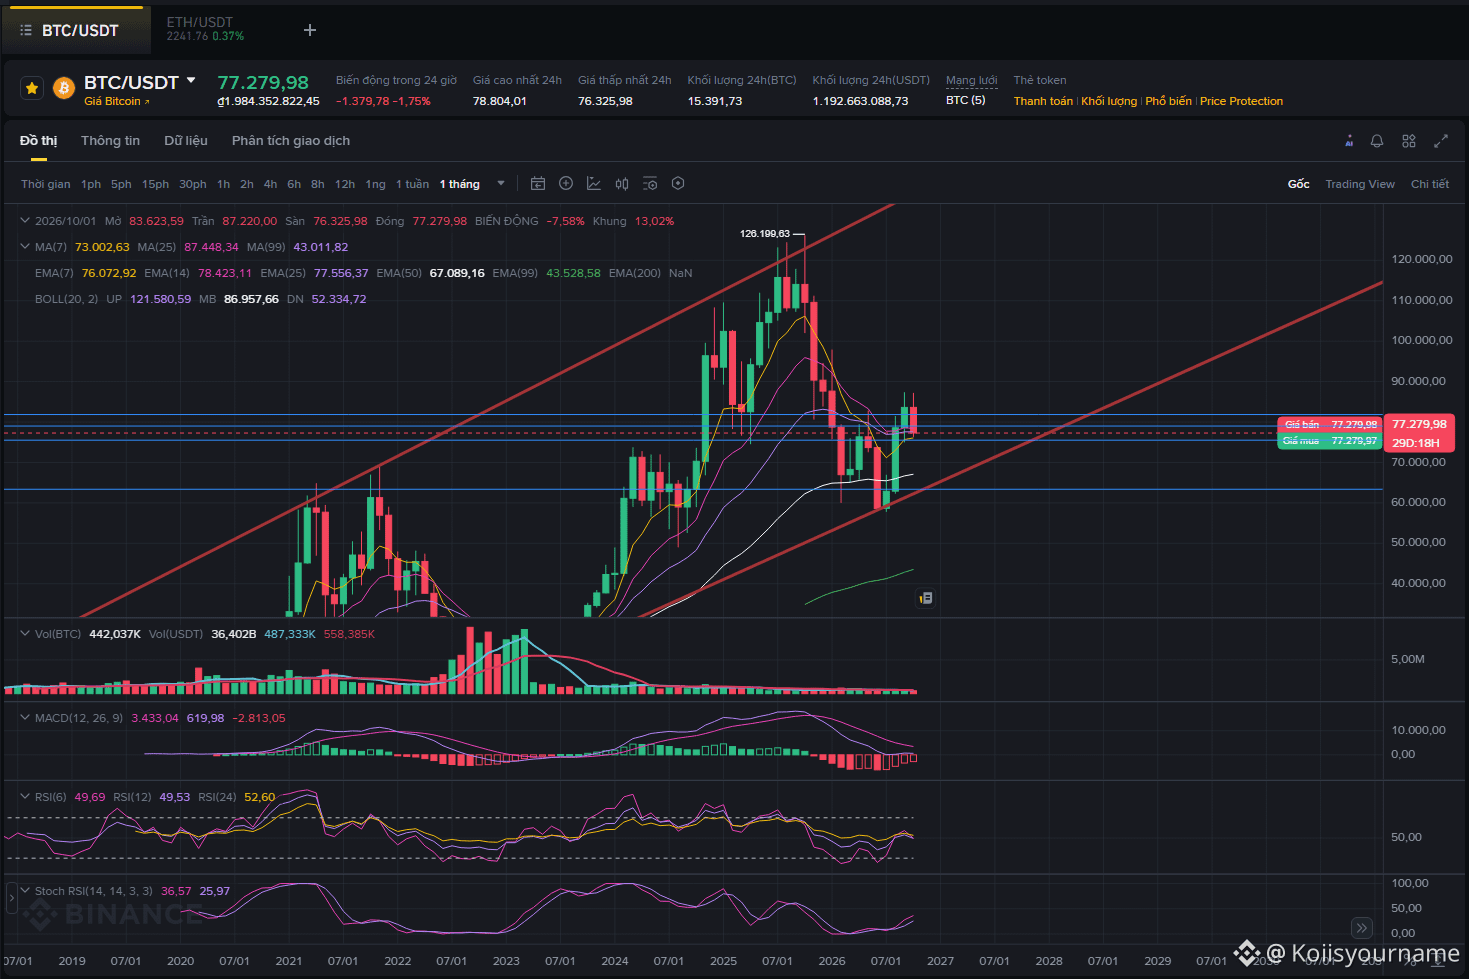
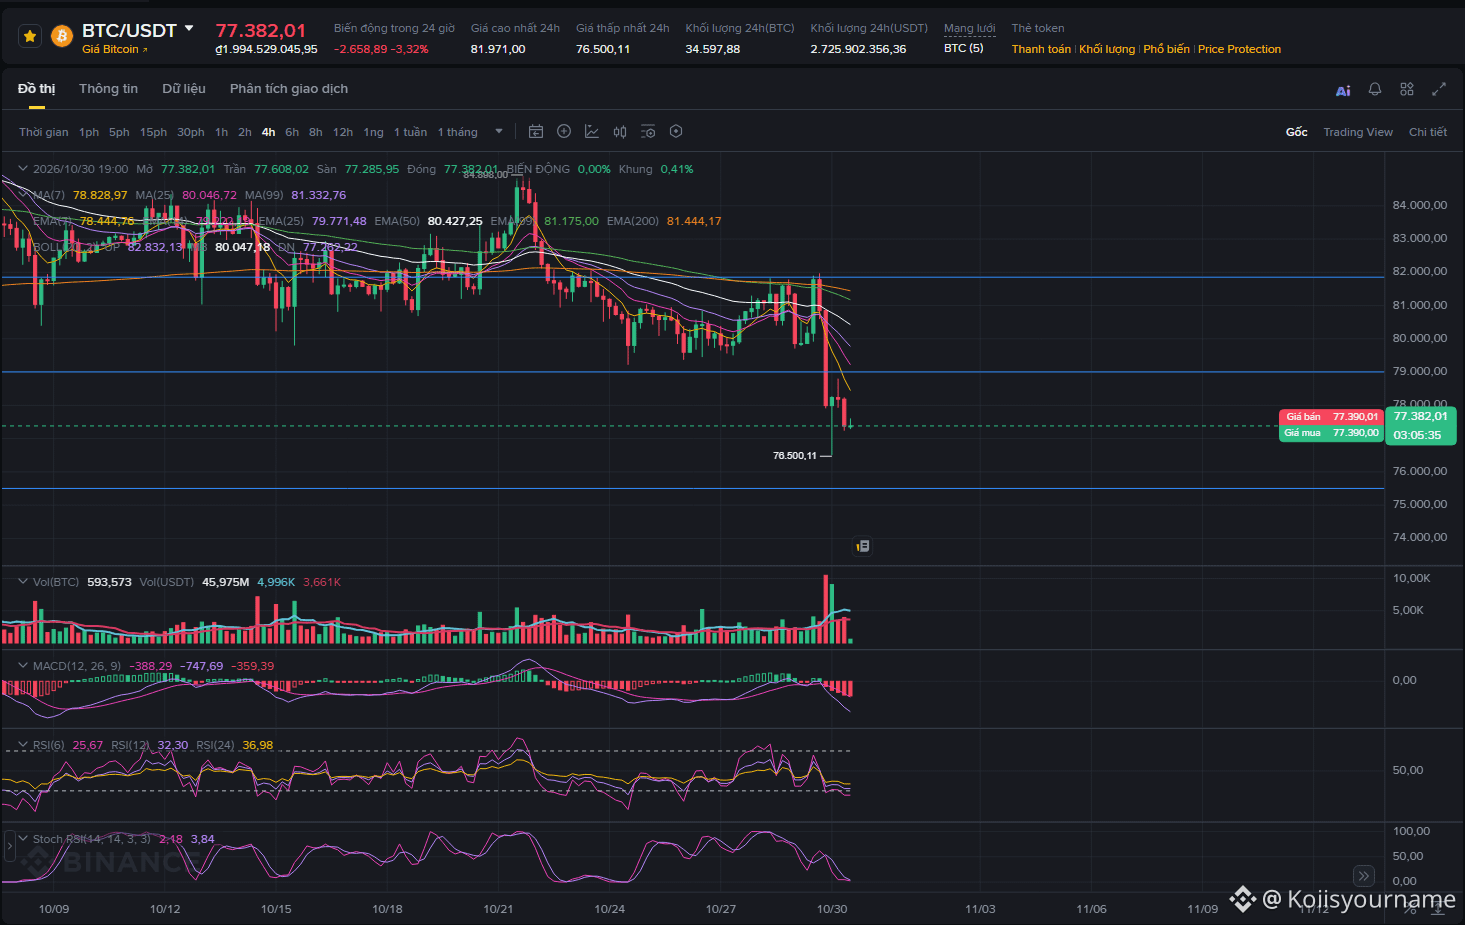
$BTC Technical analysis details for the week:
1. A double bottom formed at 76.5K with high average volume on the 4H candles, rejecting sellers at that level three times!
2. OI rose sharply in the 78K–76.5K zone, with funding at 0.1 (high) — a huge amount of longs in the swing-trading area is providing solid support for the price.
3. MACD is still negative on the smaller timeframes (4H–1D), but the WEEKLY CANDLE is still positive, so the medium-term uptrend has not been completely lost!
4. Strong support at 76.5 because this is where the weekly and monthly candle EMAs intersect.
5. Summary of indicators: Short term (1D and below) — downtrend; Medium term — uptrend; Long term — still in a downtrend.
Brief summary for this week:
- Upper range: 78.6 - 80 - 81.5
- Lower range: 76.5-75
- Good swing-trading price range: 80K-76.5
If the weekly candle closes below 75K, there's a high chance the price will drop another 10K, continuing down to 65K without stopping!
If the daily candle closes firmly above 80K and price swings between 81 and 80 for an extended period, the short-term trend could reverse upward.
- Look for shorts in the 80 - 78.5 zone
- Look for longs around 76.5
- Remember to set a stop-loss and don't go all-in!
In conclusion: The U.S. is holding an election, so there will likely be plenty of news for exchanges to use to manipulate the market. Trade carefully, everyone!
1. A double bottom formed at 76.5K with high average volume on the 4H candles, rejecting sellers at that level three times!
2. OI rose sharply in the 78K–76.5K zone, with funding at 0.1 (high) — a huge amount of longs in the swing-trading area is providing solid support for the price.
3. MACD is still negative on the smaller timeframes (4H–1D), but the WEEKLY CANDLE is still positive, so the medium-term uptrend has not been completely lost!
4. Strong support at 76.5 because this is where the weekly and monthly candle EMAs intersect.
5. Summary of indicators: Short term (1D and below) — downtrend; Medium term — uptrend; Long term — still in a downtrend.
Brief summary for this week:
- Upper range: 78.6 - 80 - 81.5
- Lower range: 76.5-75
- Good swing-trading price range: 80K-76.5
If the weekly candle closes below 75K, there's a high chance the price will drop another 10K, continuing down to 65K without stopping!
If the daily candle closes firmly above 80K and price swings between 81 and 80 for an extended period, the short-term trend could reverse upward.
- Look for shorts in the 80 - 78.5 zone
- Look for longs around 76.5
- Remember to set a stop-loss and don't go all-in!
In conclusion: The U.S. is holding an election, so there will likely be plenty of news for exchanges to use to manipulate the market. Trade carefully, everyone!
Koiisyourname
·
--
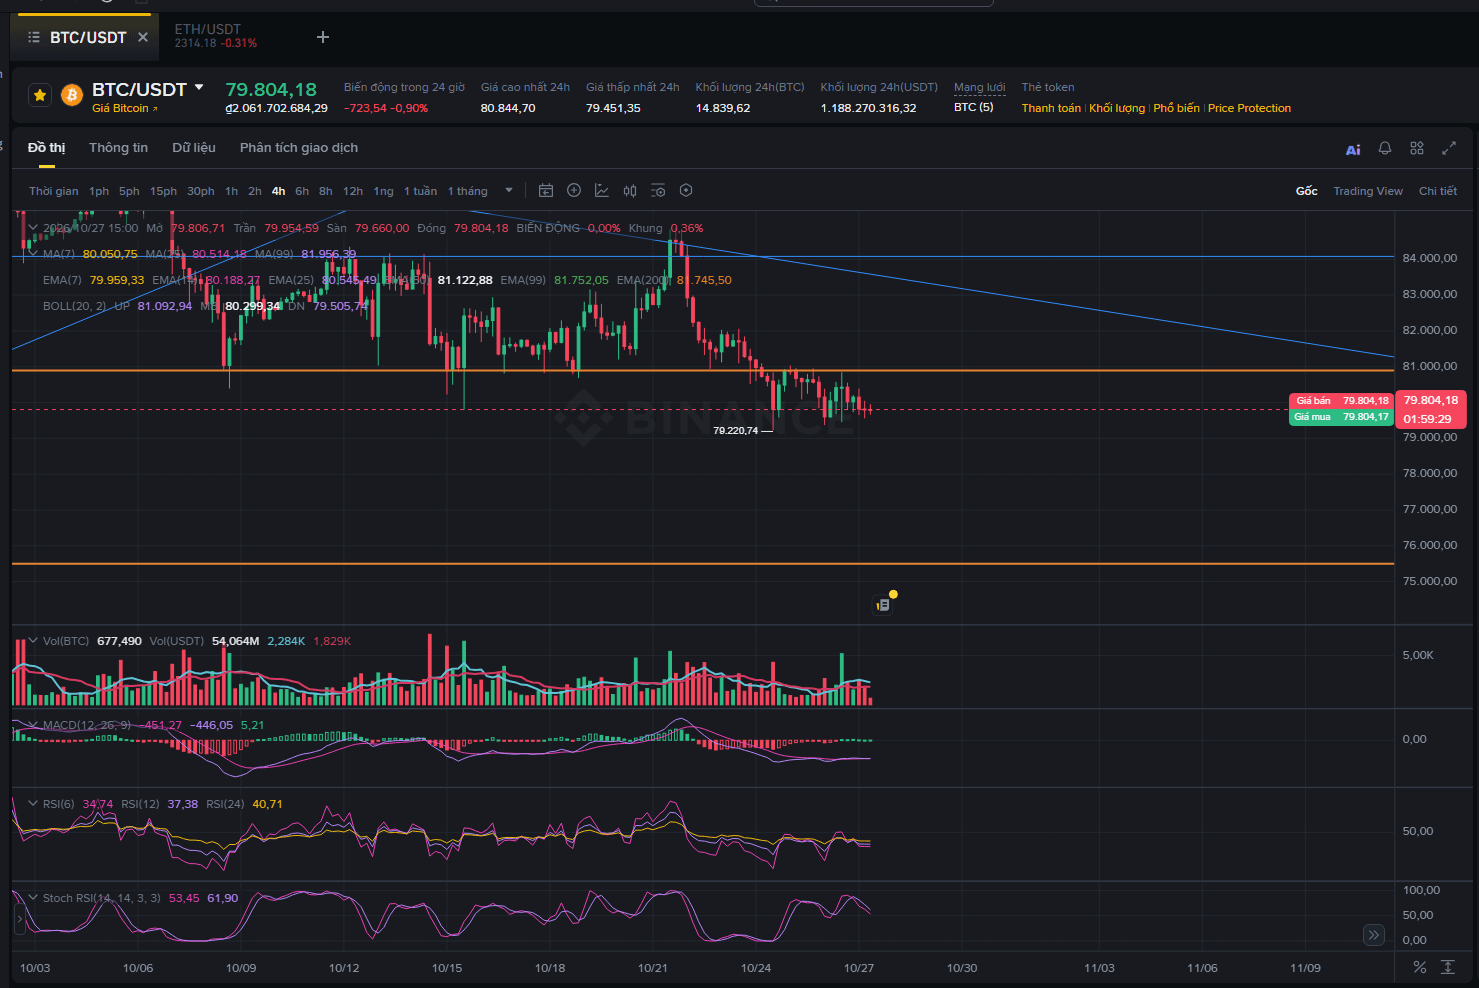
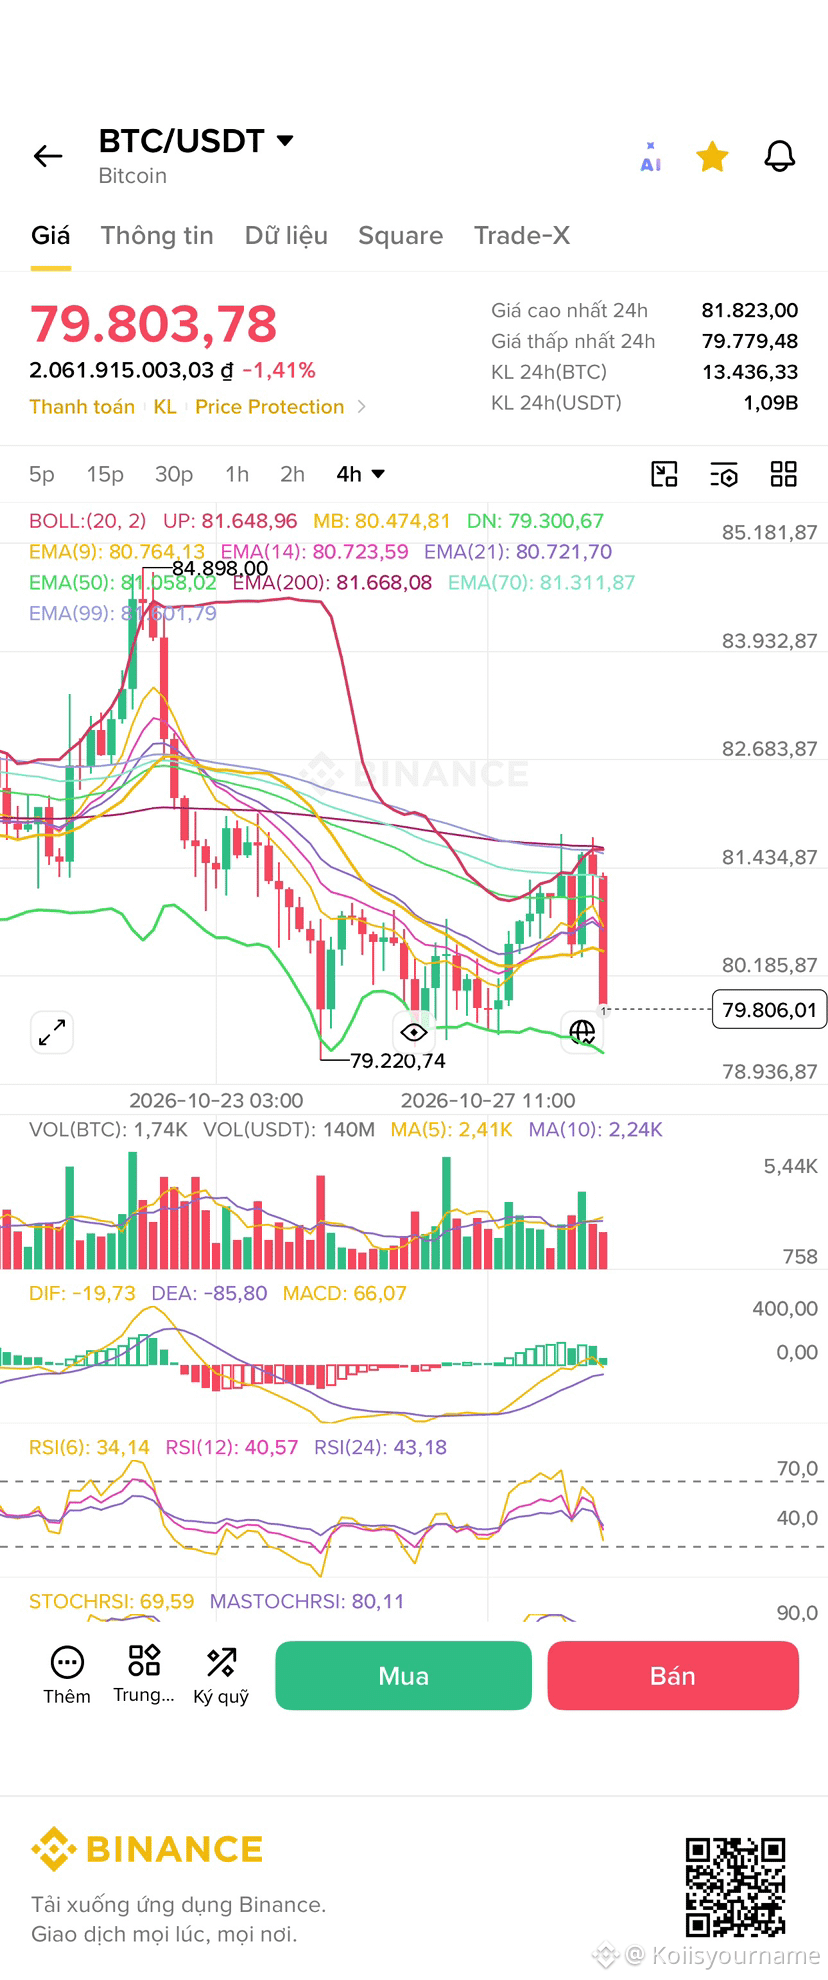
BearishYesterday, we guessed the “dumping” zone was at 81K, but in reality it couldn’t even get up to 81K to dump!
Here are a few things to keep in mind this week:
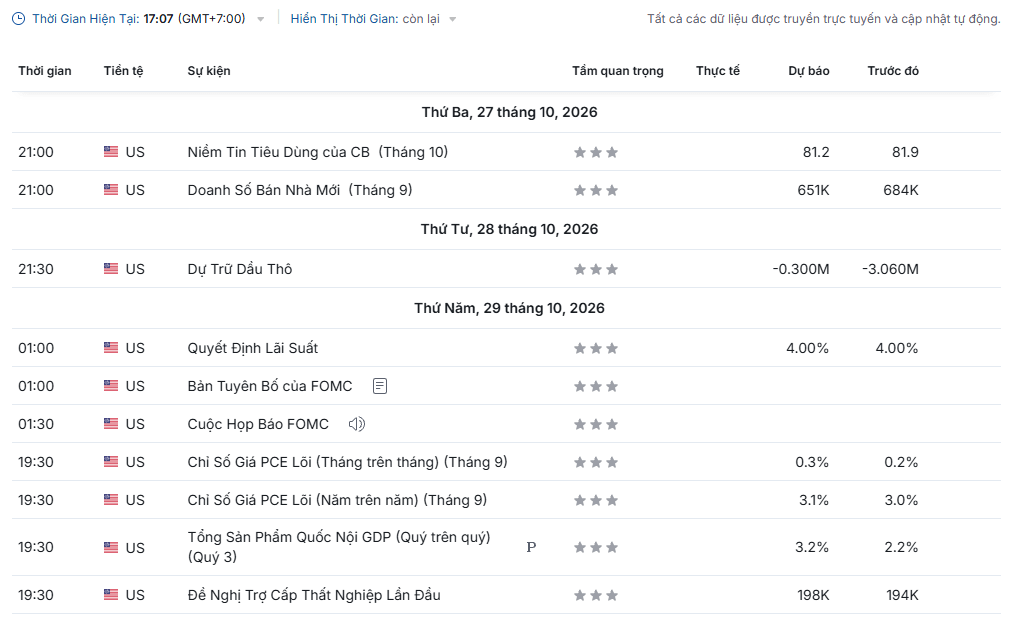
- Thursday’s interest rate decision is important. The FOMC statement and press conference will directly affect the price and short-term trend of $BTC . Of course, news is just an excuse for prices to go up or down—don’t believe what the capitalists say!
- The current zone is neutral, the middle range between 87K and 75K (with a bias toward the 81K–75K range).
- We’ve had two major sell-offs: from 87K to 81K, and from 85K to 79K. I think we’ll see one more sell-off, possibly this week (my guess is from 82K to 76K). That means the price will move around the 79–81 range and rise before or on Thursday, then crash again. THIS IS MY PERSONAL PREDICTION, WITH NO VERIFIED EVIDENCE.
- Another possible scenario is that it crashes straight to 76K today or tomorrow, then rebounds on Thursday or Friday thanks to the FOMC and starts consolidating around the 80–75 range early (sideways).
Of course, there are also a few more optimistic scenarios, but I won’t mention them because, looking at the chart, they’re pretty unlikely—who knows, maybe it’ll shoot straight up from 79K to 87K one more time =))
TO REPEAT: THIS IS MY PERSONAL PREDICTION. I DON’T RECOMMEND YOU GUYS TRADE FUTURES AT THIS POINT BECAUSE THE TREND IS UNCLEAR AND IT’S HARD TO TELL WHETHER IT’LL GO UP OR DOWN.
I wrote this post myself—no damn AI involved! Cheers
Here are a few things to keep in mind this week:
- Thursday’s interest rate decision is important. The FOMC statement and press conference will directly affect the price and short-term trend of $BTC . Of course, news is just an excuse for prices to go up or down—don’t believe what the capitalists say!
- The current zone is neutral, the middle range between 87K and 75K (with a bias toward the 81K–75K range).
- We’ve had two major sell-offs: from 87K to 81K, and from 85K to 79K. I think we’ll see one more sell-off, possibly this week (my guess is from 82K to 76K). That means the price will move around the 79–81 range and rise before or on Thursday, then crash again. THIS IS MY PERSONAL PREDICTION, WITH NO VERIFIED EVIDENCE.
- Another possible scenario is that it crashes straight to 76K today or tomorrow, then rebounds on Thursday or Friday thanks to the FOMC and starts consolidating around the 80–75 range early (sideways).
Of course, there are also a few more optimistic scenarios, but I won’t mention them because, looking at the chart, they’re pretty unlikely—who knows, maybe it’ll shoot straight up from 79K to 87K one more time =))
TO REPEAT: THIS IS MY PERSONAL PREDICTION. I DON’T RECOMMEND YOU GUYS TRADE FUTURES AT THIS POINT BECAUSE THE TREND IS UNCLEAR AND IT’S HARD TO TELL WHETHER IT’LL GO UP OR DOWN.
I wrote this post myself—no damn AI involved! Cheers
Koiisyourname
·
--
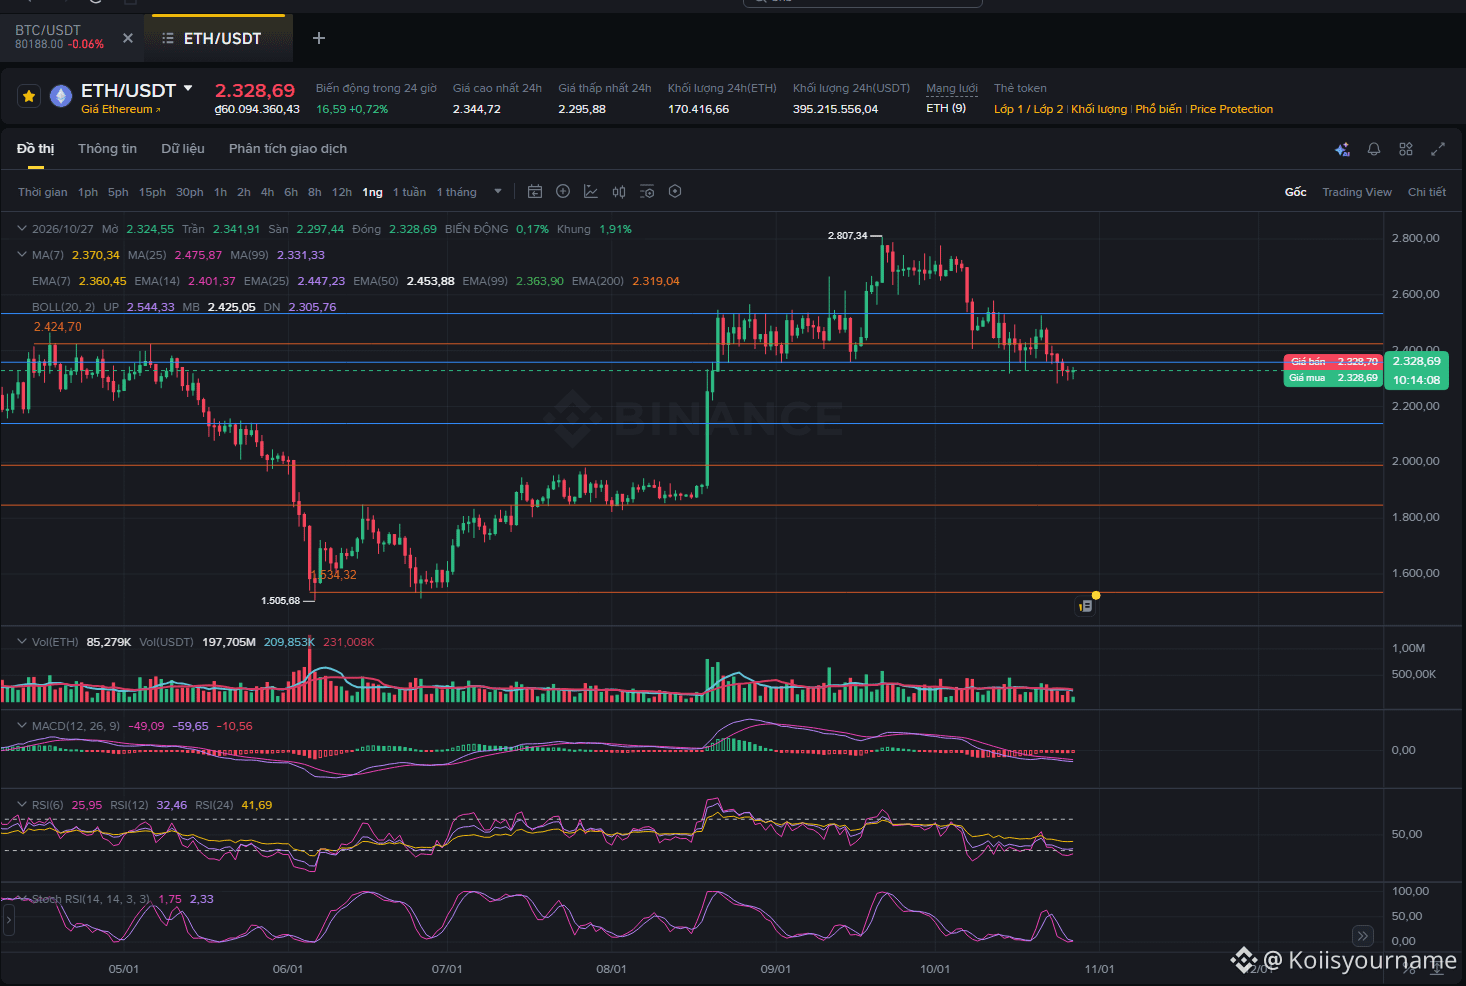
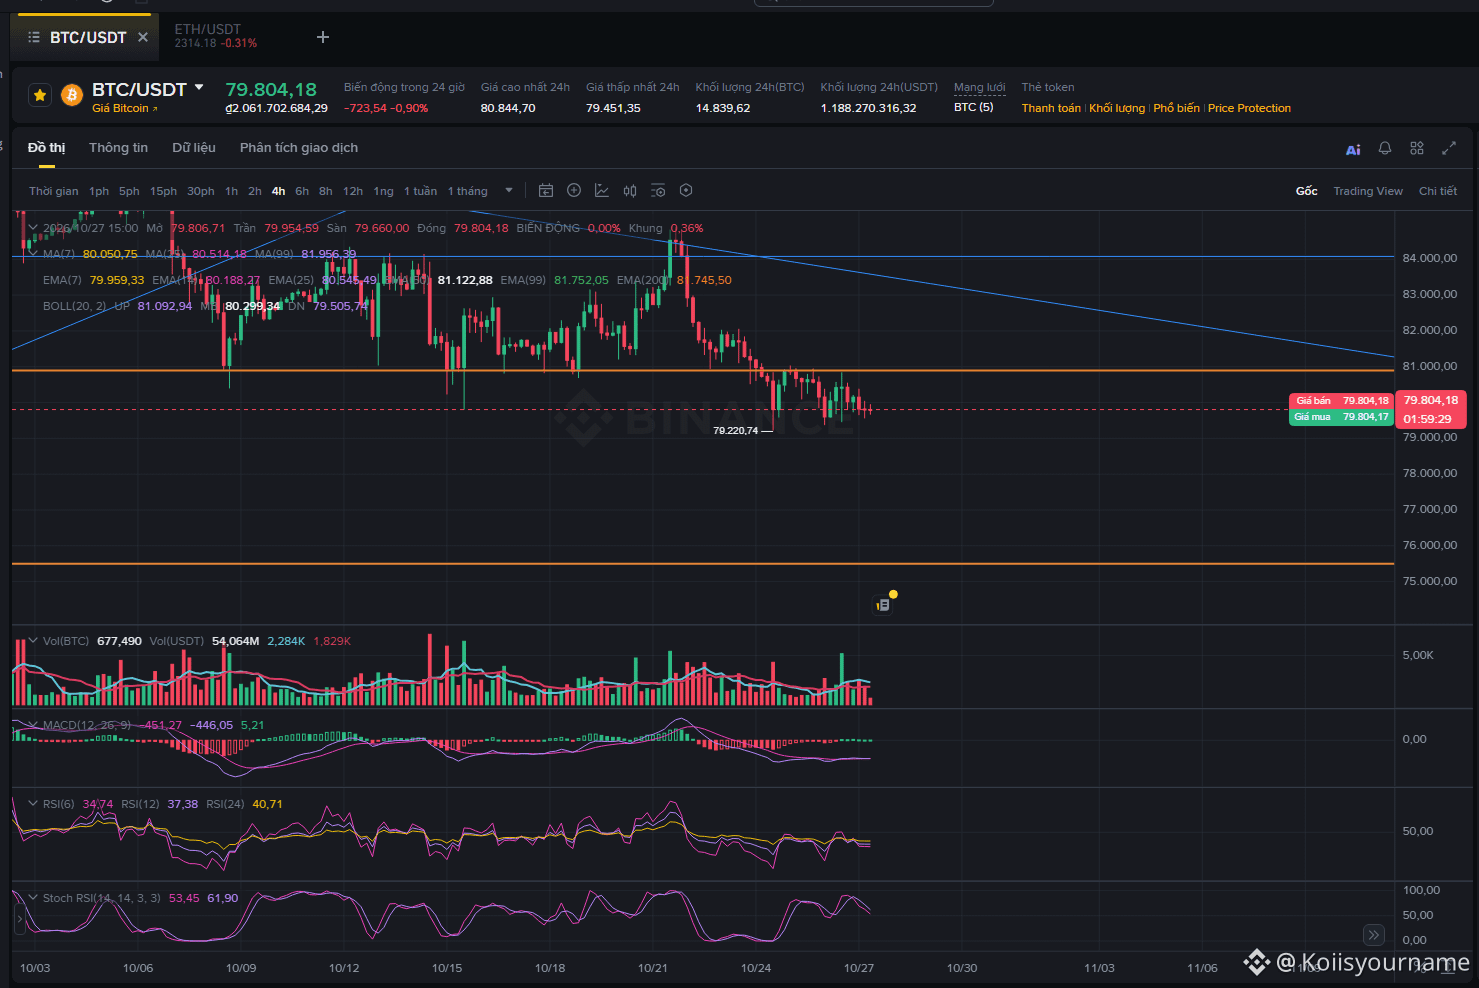
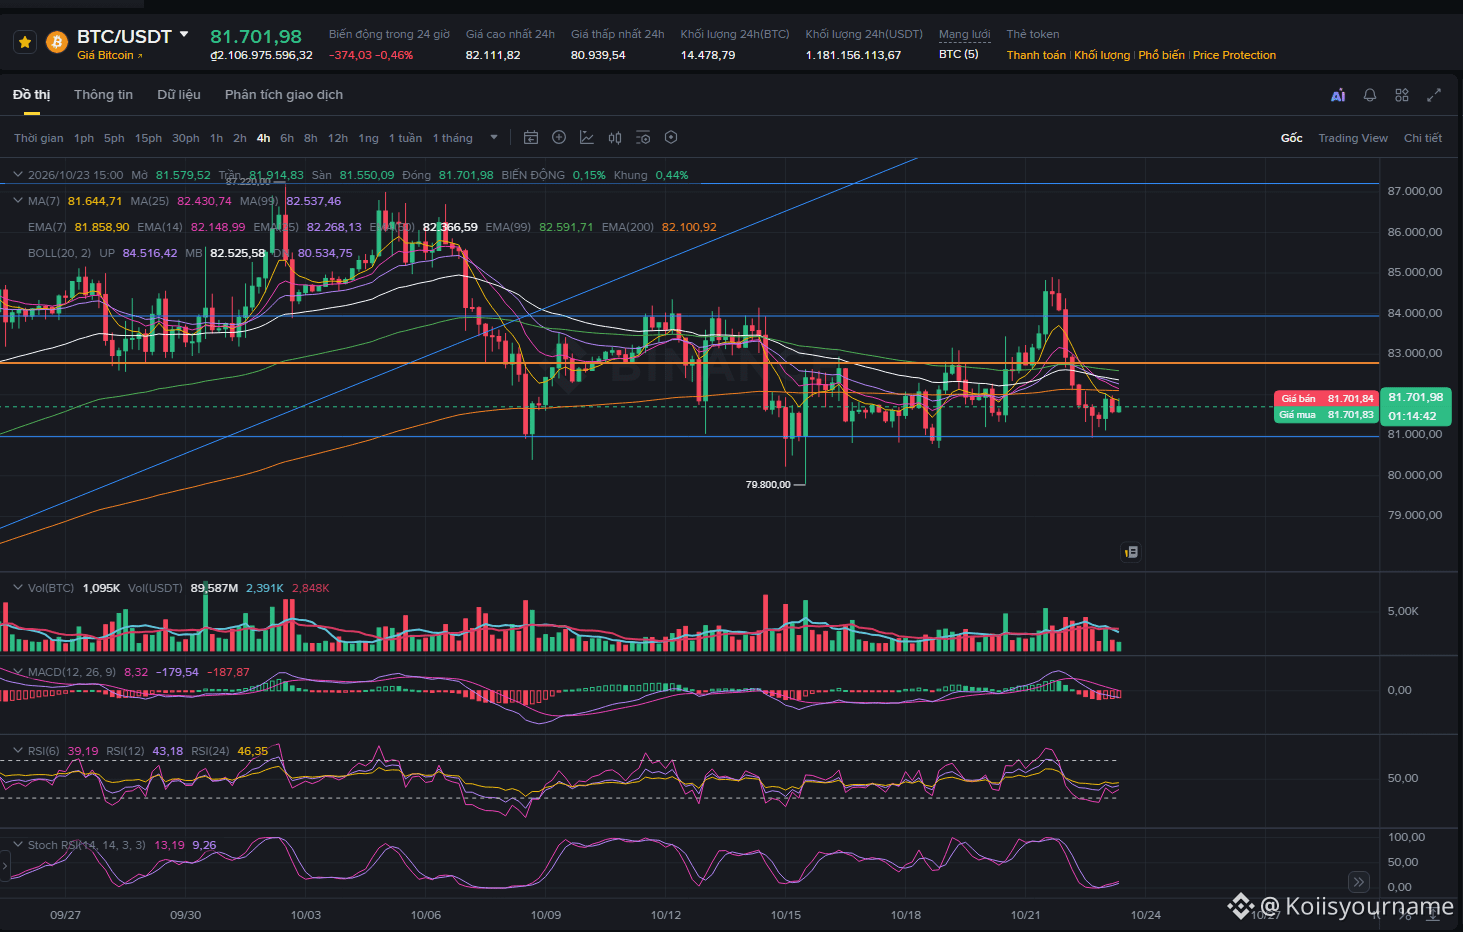
I spent ages drawing this, and then Binance deleted it all 😡 Now there are no trend lines or price lines to make things easier for everyone to see! Oh well, I’ll write it out instead—bear with me and read a little!
We have a few things to keep in mind today:
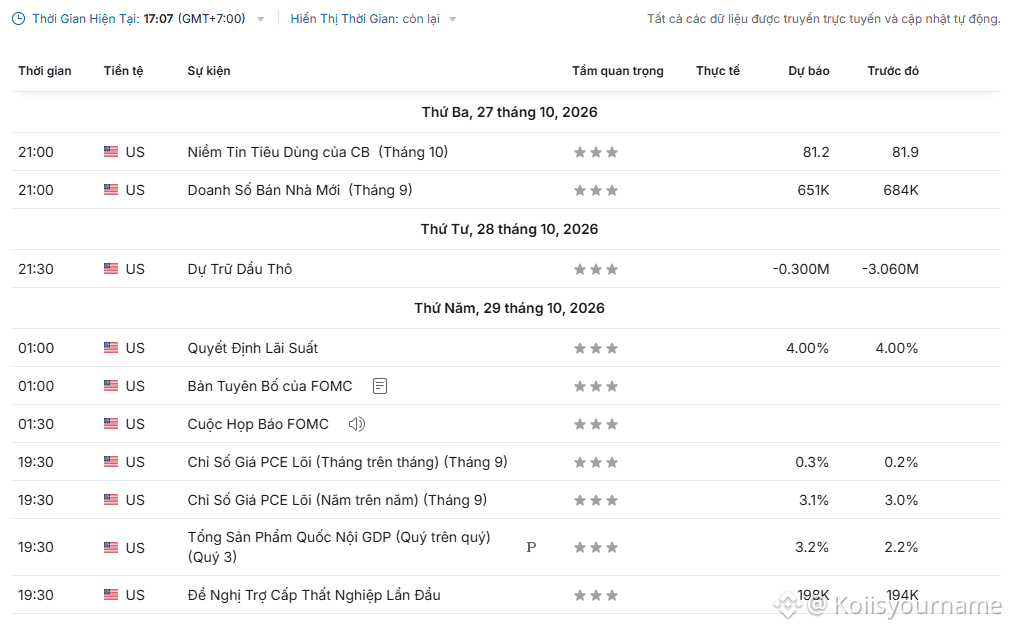
According to the official schedule of the U.S. Federal Reserve (Fed), the FOMC meeting concludes on 28/10/2026.
01:00 on 29/10 (Vietnam time): Policy decision announcement.
01:30: Fed Chair’s press conference.
Volatility after the announcement could push BTC through both support and resistance before reversing.
So, where are resistance and support?
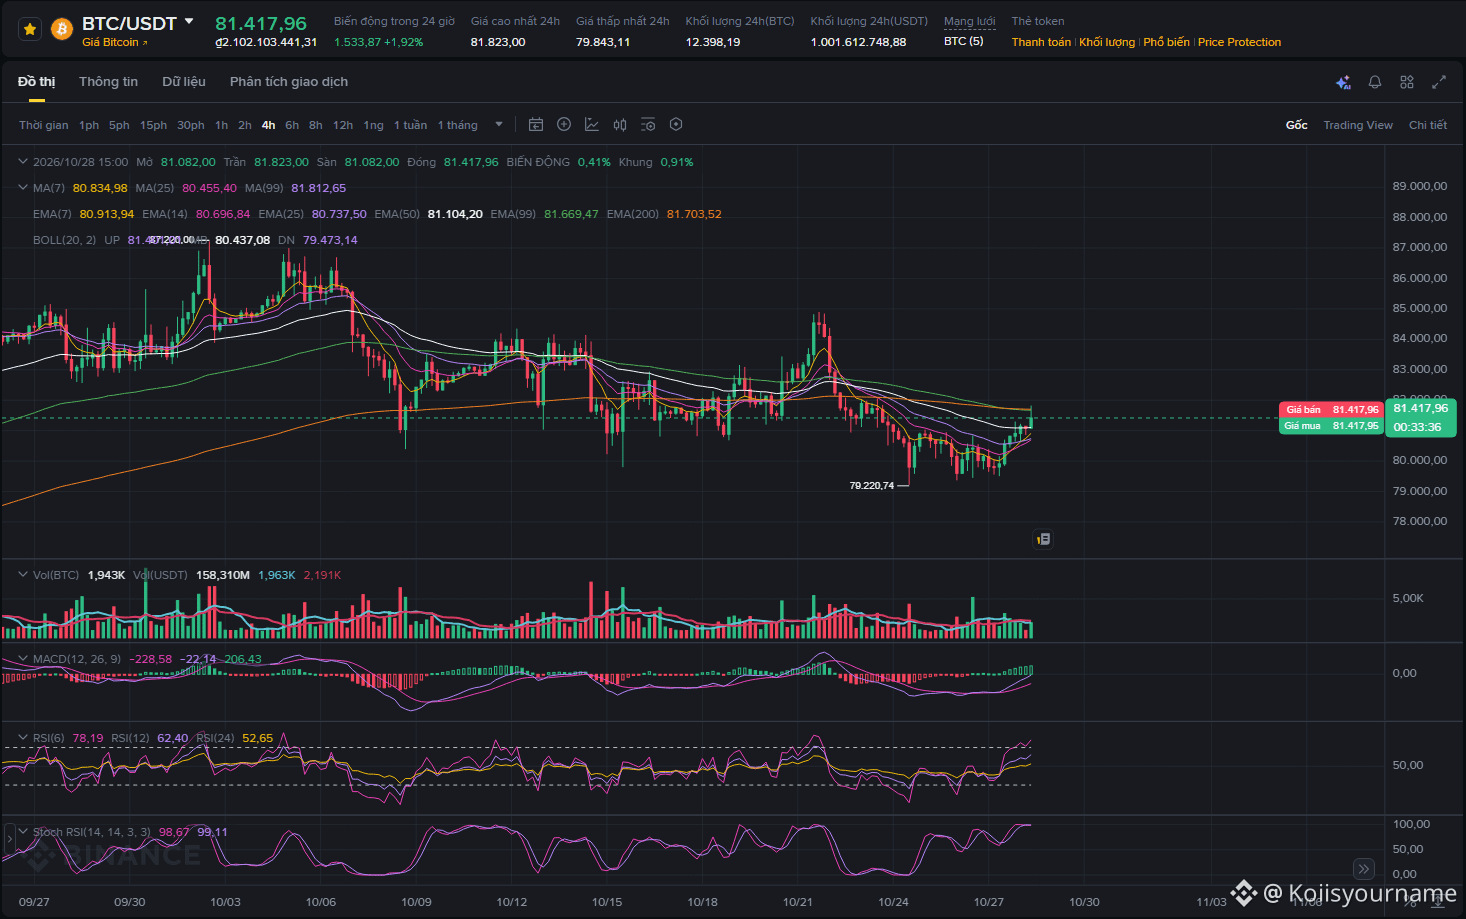
- Nearby resistance: 81.7 - 82.1
- Strong support: 80.5
$BTC has now rebounded to the 81-82K range, just as in the first scenario we settled on yesterday! This is an extremely favorable price zone for market makers, exchanges, and institutions to decide whether to push prices up or down. The price is in a neutral zone, with virtually no trend.
Here are a few things to keep in mind:
- There will be a strong sweep today, so don’t scalp futures—or consider taking a break from futures and wait for a genuine trend to emerge before trading.
- If it closes multiple candles above 82K, it may continue up to test resistance at 84.9K. If this scenario plays out, the downtrend will be over, and the short-term outlook will lean toward neutral-to-bullish!
- If it closes a candle below 80K, we’ll consider another drop to 79K for a retest. It will still be within a short-term downtrend.
Everything is neutral for now. Keep your money on the sidelines and don’t rush!
We have a few things to keep in mind today:
According to the official schedule of the U.S. Federal Reserve (Fed), the FOMC meeting concludes on 28/10/2026.
01:00 on 29/10 (Vietnam time): Policy decision announcement.
01:30: Fed Chair’s press conference.
Volatility after the announcement could push BTC through both support and resistance before reversing.
So, where are resistance and support?
- Nearby resistance: 81.7 - 82.1
- Strong support: 80.5
$BTC has now rebounded to the 81-82K range, just as in the first scenario we settled on yesterday! This is an extremely favorable price zone for market makers, exchanges, and institutions to decide whether to push prices up or down. The price is in a neutral zone, with virtually no trend.
Here are a few things to keep in mind:
- There will be a strong sweep today, so don’t scalp futures—or consider taking a break from futures and wait for a genuine trend to emerge before trading.
- If it closes multiple candles above 82K, it may continue up to test resistance at 84.9K. If this scenario plays out, the downtrend will be over, and the short-term outlook will lean toward neutral-to-bullish!
- If it closes a candle below 80K, we’ll consider another drop to 79K for a retest. It will still be within a short-term downtrend.
Everything is neutral for now. Keep your money on the sidelines and don’t rush!
Koiisyourname
·
--
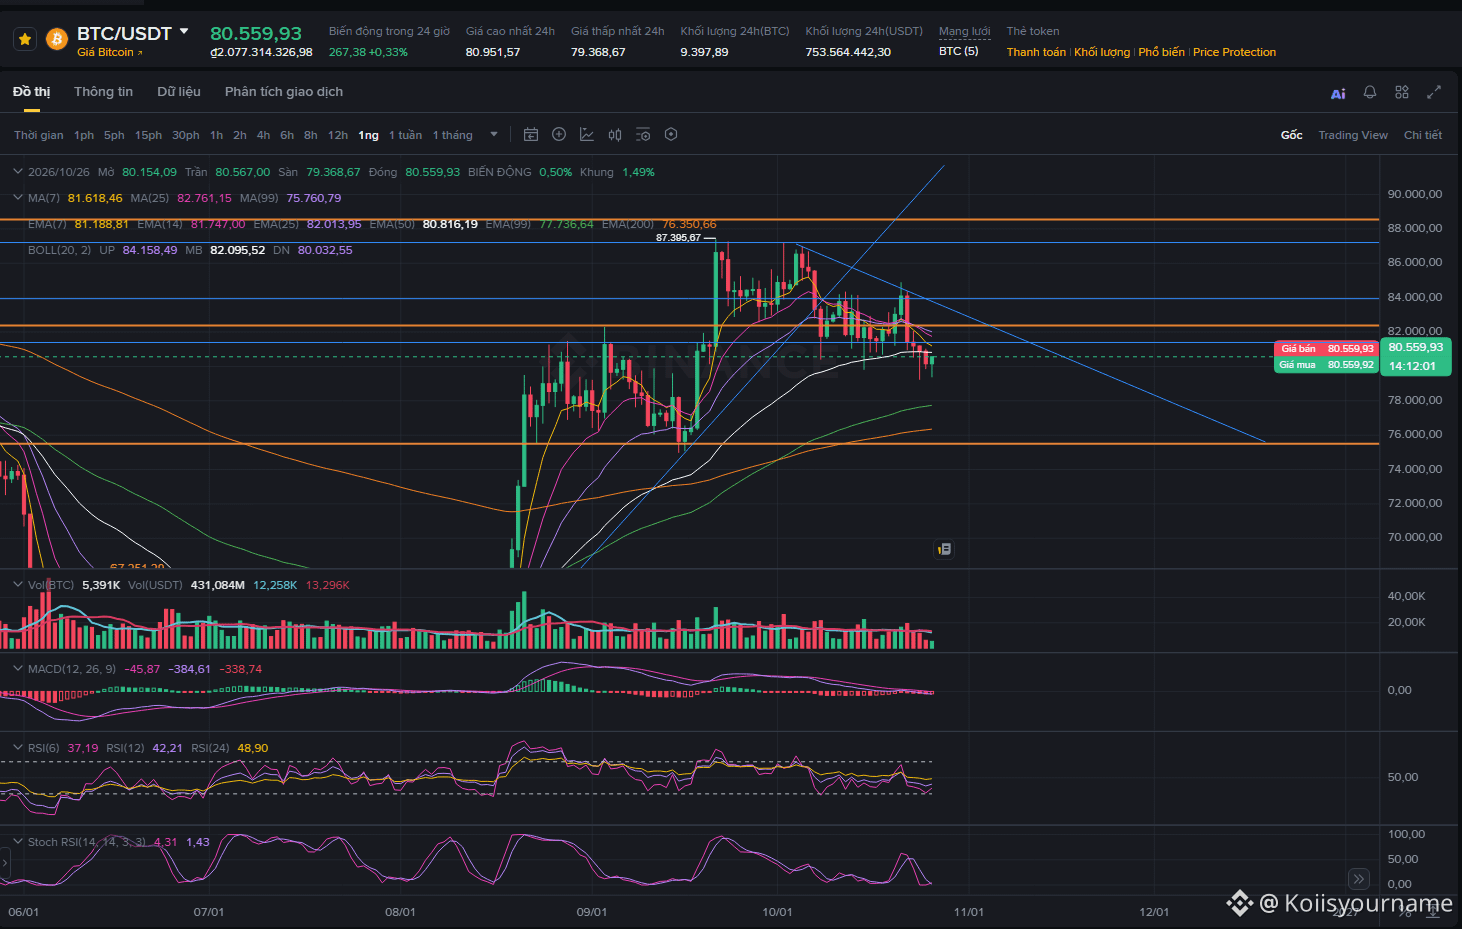
From what I can see, $BTC is already in the 81.2K–75.4K range!
Based on the daily candles, we have:
- Two lower highs — the start of a downtrend
- Lost the 50 EMA, with a candle closing below the 80K zone
- MACD has turned negative
- Volume and upward momentum are still there, but not much in the 80–81K zone anymore!
WILD GUESS: today, the 80–81K range will be a “sell-off” zone, and in the short term, price will consolidate again in the 7x range (just a wild guess; if I’m wrong, so be it. This is just for fun—I don’t recommend you guys believe it and trade futures based on it.)
One thing remains: the weekly chart is still positive, and the weekly candle’s price range is between 87K and 75K! That range is too wide to determine the trend. BTC is currently in the middle, and its next move could go either way!
Based on the daily candles, we have:
- Two lower highs — the start of a downtrend
- Lost the 50 EMA, with a candle closing below the 80K zone
- MACD has turned negative
- Volume and upward momentum are still there, but not much in the 80–81K zone anymore!
WILD GUESS: today, the 80–81K range will be a “sell-off” zone, and in the short term, price will consolidate again in the 7x range (just a wild guess; if I’m wrong, so be it. This is just for fun—I don’t recommend you guys believe it and trade futures based on it.)
One thing remains: the weekly chart is still positive, and the weekly candle’s price range is between 87K and 75K! That range is too wide to determine the trend. BTC is currently in the middle, and its next move could go either way!
Koiisyourname
·
--
I was thinking of taking a break from posting, since I’m currently juggling quite a few AI studio projects and don’t have much time. I’m still trading and keeping an eye on things, though :))
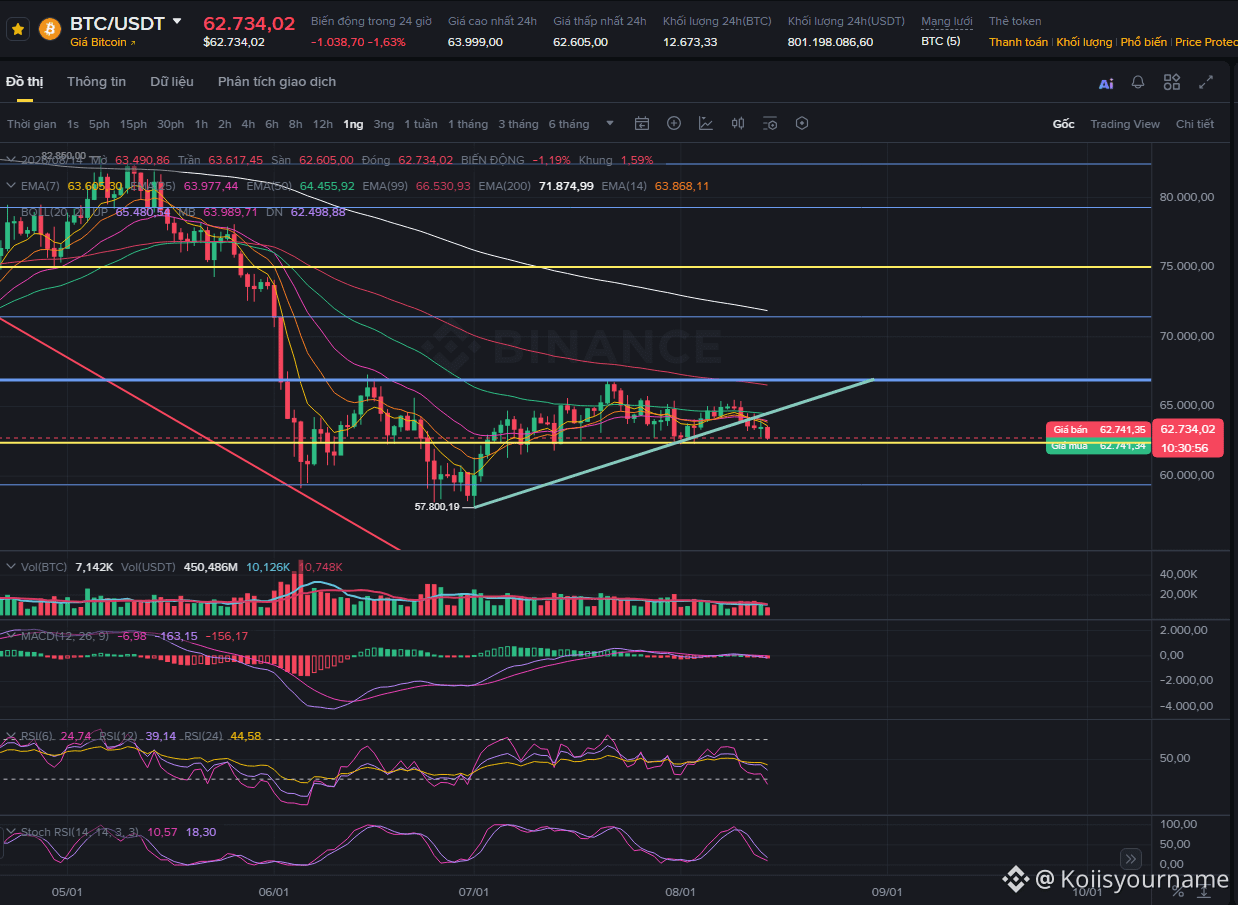
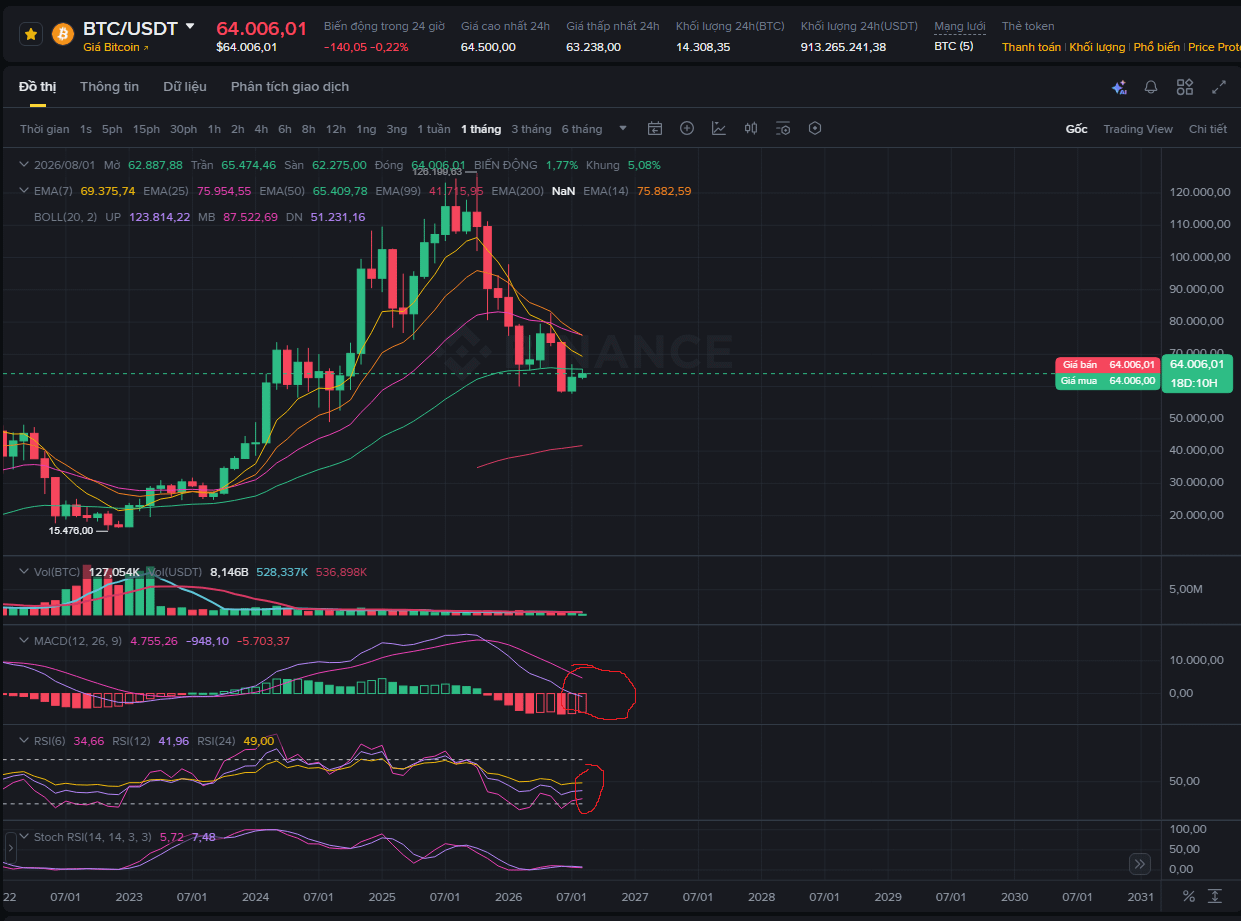
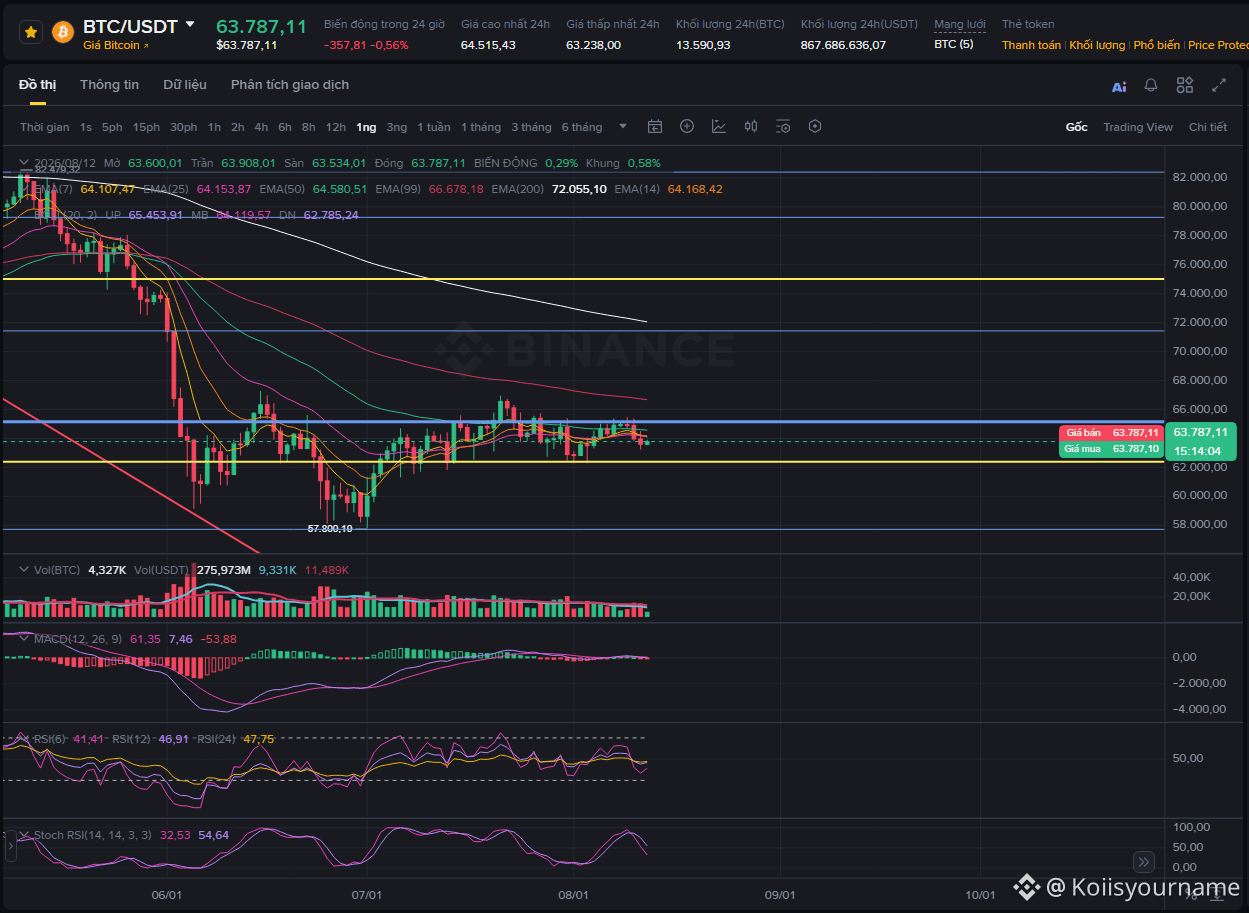
Today, let’s take a quick look back at $BTC !
1. The “signal” I mentioned last month did show up, but it went a bit too far. I really didn’t want to see $BTC surge all the way to 8x, because then it would take a very long time to wait for an entry opportunity!
2. I’m waiting for an entry around 65K–7x, since that’s a pretty good area for deep accumulation.
3. The current medium-term candle is still holding in an uptrend, but it’s gradually weakening due to inflation and poor economic indicators in various countries (just a reason for a correction).
For now, BTC is sitting in the 81K support zone, right at the weekly candle’s EMA50! This is a fairly solid support zone, and also a sensitive area. If a daily candle closes below this zone, there’s a very high chance it’ll drop to the 70K–80K accumulation zone (which is what I’m waiting for).
If you have any questions, just leave a comment and ask! I’ll reply when I have some free time in the next day or two. I promise I’ll be more active :))
Today, let’s take a quick look back at $BTC !
1. The “signal” I mentioned last month did show up, but it went a bit too far. I really didn’t want to see $BTC surge all the way to 8x, because then it would take a very long time to wait for an entry opportunity!
2. I’m waiting for an entry around 65K–7x, since that’s a pretty good area for deep accumulation.
3. The current medium-term candle is still holding in an uptrend, but it’s gradually weakening due to inflation and poor economic indicators in various countries (just a reason for a correction).
For now, BTC is sitting in the 81K support zone, right at the weekly candle’s EMA50! This is a fairly solid support zone, and also a sensitive area. If a daily candle closes below this zone, there’s a very high chance it’ll drop to the 70K–80K accumulation zone (which is what I’m waiting for).
If you have any questions, just leave a comment and ask! I’ll reply when I have some free time in the next day or two. I promise I’ll be more active :))



Log in to explore more content